Embed Size (px)
Citation preview
1
file:chp2-v3.word6, 10/13/97 CHAPTER II THE BASICS OF INTERTEMPORAL GENERAL EQUILIBRIUM II.1 Introduction The purpose of this chapter is to provide the conceptual fundamentals of inter temporal general equilibrium which are necessary for the development and use of the empirical policy based models presented in the following chapters. These models typically contain far more economy-wide and sectoral specific detail than can be considered in an analytical model. Moreover, they attempt to account for the effects of policy interventions embodied in the vary data used to obtain many of the model parameters. It will be seen that while the dynamic analytical model developed in this chapter amounts to a sketch of the more detailed empirical models, an understanding of the fundamentals this sketch provides is critical in guiding the specification, fitting to data and the interpreting of the empirical model results. We focus on fundamentals of consumption and capital accumulation in a neoclassical intertemporal general equilibrium model that was initially developed by Frank Ramsey and extended by Cass (1965) and Koopmans (1965), and has now become a key part of the literature leading to other types of dynamic general equilibrium models as in Grossman and Helpman (1992) and Borro and Sala-I-Martin (1995). In the next section, we begin with a very simple one sector model of a decentralized closed economy and derive the inter temporal conditions of the equilibrium path. We specify the model in discrete time. This choice is based on two reasons: typically, policy based models are fit to annual data which makes the transition from a continuous time analytical model to the specification of a discrete time empirical model rather awkward. Second, the computation method used to solve the empirical model is better understood in terms of a discrete time model. The section concludes with a discussion of the effects on investment and savings when the economy is small and open. This section lays the ground work for the next and key section which extends the single sector model to a multi-sector closed economy, and then to a multi-sector small open economy. With a number of simple “tricks” it will be seen that this extension can be made in a natural and simple way which preserves virtually all of the insights and structure of the single sector model. The chapter concludes with a discussion of a number of implications of the theory to the development of policy models. II.2 The Dynamic General Equilibrium Model of a Closed Economy Frank Ramsey posed the question of how much a nation should save and addressed it by solving a model that is now a prototype for studying the optimal inter temporal allocation of resources. For our purposes, we do not present the standard Ramsey social planner model. Instead, we use the model to study a decentralized (market ) economy. We begin with a simple one sector model of a closed economy with two factors: labor and

2
capital services. The economy is assumed to be perfectly competitive in the sense that there exist many households and producers, each of whom make decisions on the assumption that prices in each time period are given and beyond the individual’s control. There is freedom of entry and exit for firms at each time period, and profit-seeking activities ensure that profits are eliminated in the long-run equilibrium. Individuals are assumed to have an infinite horizon over which they allocate spending to maximize an inter temporal utility function subject to an inter temporal budget constraint. Different form the static model, households can borrow from and lend to each other, i.e., they can allocate their income over time. In making these plans, individual households can be viewed as taking into account the welfare and resources of their current and prospective descendants. The infinite horizon assumption turns out to have strong implications: together with the assumption of competitive markets, constant returns to scale in production, and homogenous agents, the allocation of resources achieved by a decentralized economy will be the same as that chosen by a central planner who maximizes the utility of the representative economic agent. Next, we discuss first the behavior of the households and firms, and then derive the conditions for equilibrium and define the steady state for the economy. II.2.1 The Households II.2.1.1 Setup of the Model There are many identical households. Although each household contains one or more adults with a finite life span, they take account of the welfare and resources of their actual and prospective descendants by providing forward transfers to their children. This extended and immortal household corresponds to finite-lived individuals who are connected via a pattern of inter generational transfers. Hence, as a household, it faces an infinite horizon. The size of the extended family is viewed to grow indefinitely at the exogenous and constant rate n for simplification. If we normalize the number of adults at time 0 to unity, then the household size at time t -- which corresponds to the adult population -- is Lt = (1+ n )t. If Ct is total consumption at time t, then ct = Ct/Lt is consumption per person. A household’s overall (inter temporal) utility, U, is given by
This formulation assumes that the household’s utility at time 0 is a weighted sum of all future flows of utility, u(ct). The function u(ct) -- often called the felicity function -- relates the flows of utility per person to the quantity of consumption per person, ct. The function u(ct) is non-negative, continuous, concave and increasing. The concavity assumption generates an eagerness to smooth consumption over time: households prefer a relatively uniform pattern to one in which ct is very low in some periods and very high in others. We also assume that u(ct) satisfies Inada conditions: u’(ct) → ∞ as ct → 0, and u”(ct) → 0 as ct → ∞.
U0 = 1+ n1+ !!
"#
$
%&
t=0
'
(t
u(ct ).
3
The multiplication of u(ct) in Eq. (2.1) by family size Lt = (1 + n)t, represents the adding up of utile for all family members alive at time t. The other multiplier, (1 +ρ)-t, involves the rate of time preference, and ρ > 0. A positive ρ means that utiles are valued less the later they are received. We assume ρ > n, which implies that U in Eq. (2.1) is bounded if c is constant over time. One reason for ρ to be positive is that utiles far in the future correspond to consumption of later generations. Suppose that, starting from a time period at which the levels of consumption per person in each generation are the same, parents prefer a unit of their own consumption to a unit of their children’s consumption. This parental ‘selfishness” corresponds to ρ > 0 in Eq. (2.1). In a fuller specification, we would also distinguish the rate at which individuals discount their own flow of utility at different time periods (for which ρ = 0 might apply) from the rate that applies over generations. Eq. (2.1) assumes, only for reasons of tractability, that the discount rate within a person’s lifetime is the same as that across generations. Households own labor and capital and earn income by renting the services of these resources to firms. At any time period, they decide the proportion of income to save and consume. They can save by either accumulating capital or lending to other households. Because the two forms of assets, capital and loans, are assumed to be perfect substitutes as stores of value, households are indifferent to the composition of their wealth. Thus, the interest rate on debt must be equal to the rental rate on capital. Households are presumed to have perfect foresight and hence know both current and future values of prices, and take them as given. Since there is only one aggregate good in the economy, the current price for this good is normalized to one. More formally, let {wt, rt}, t = 1, 2, ∞, be the sequence of wages and rental rates. Then, given this sequence, each household maximizes at any time period
where at = kt - bpt. Nonhuman wealth, which is given by at, is equal to the holding of capital, kt, minus family debt, bpt, and hence, the change in at, i.e., Δat = at+1 - at, is household savings. a is measured in real terms, that is, in unit of consumables. As each household is assumed to have 1 unit of labor, the income from labor services is wt. The equation states that assets per person rise with per capita income, w + ra, fall with per capita consumption, c, and fall because of expansion of the population in accordance with na. (We can derive Eq. (2.2) by imposing the budget constraint in terms of the change in the level of total assets, At+1 - At, and then noting that for given A, at+1 = At+1/Lt+1 income falls at rate n due to
(2.1') U0 = 1+ n1+ !!
"#
$
%&
t=s
'
(t)s
u(ct );
subject to the budget constraint:
(2.2) *at = wt+rtat ) ct ) nat+1, for all t, k0 given,
4
population growth.) At any time t, the household supplies both capital and labor services inelastically. The current stock of capital is the result of his/her previous decisions and is given at time t. Thus, as mentioned, the decision the household has to make at each time period is how much to consume and save. However, a constraint needs to be placed on the household’s borrowing decisions. If each household can borrow an unlimited amount at the going interest rate, rt, then it has an incentive to pursue a form of chain letter or Ponzi game. It is optimal for households to borrow sufficiently to maintain a level of consumption such that the marginal utility of consumption equals zero (or an infinite level of consumption if marginal utility is always positive) and to let the dynamic budget constraint determine the dynamic behavior of a, wealth. From the budget constraint it follows that this path of consumption will lead to higher and higher levels of borrowing (negative a), with borrowing being used to meet interest payments on the existing debt. For example, household can borrow, say $1, to finance current consumption and then use future borrowing to roll over the principal and pay all interest charges. In this case, the household’s debt grows forever at the rate of interest, rt. Since the principal never gets repaid, today’s added consumption of $1 is effectively free. Thus, a household that can borrow in this manner would be able to finance an arbitrary high level of consumption in perpetuity. To rule out chain-letter possibilities, we need therefore an additional condition that prevents household from choosing such a path, with an exploding debt relative to the size of the household. At the same time we do not want to impose a condition that rules out temporary indebtedness. A natural condition is to assume that the debt market imposes a constraint on the amount of borrowing. The appropriate restriction turns out to be that the present value of assets must be asymptotically nonnegative, that is,
This condition means that, in the long run, a household’s debt per person (negative value of at) cannot grow as fast as (1+rt)/(1+n) - 1, so that the level of debt cannot grow as fast as rt. This restriction rules out the type of chain-letter finance that we described above. We show later how the credit-market constraint expressed in Eq. (2.3) emerges naturally from the market equilibrium. II.2.1.2 First-Order Conditions The condition characterizing the maximization of Eq. (2.1) subject to Eq. (2.2) and Eq. (2.3), can be derived from the Lagrangean
(2.3) limt=0
(1+ n)t
!s=0
t1+ rs( )
at " 0.
5
where λt is the shadow price of income. Differentiating Eq. (2.4) with respect to ct and ct-1 obtains
Differentiating Eq. (2.4) with respect to at yields
Rearranging Eqs.(2.5)-(2.7) obtains the following necessary and sufficient conditions, the famous Euler Equation:
The Euler equation describes a necessary condition that has to be satisfied along any equilibrium path. It is the standard efficiency condition that the marginal rate of substitution -- the ratio of marginal utility of consumption at time t and t-1, -- is equal to the ratio of the time discount rate over the rate of return to its savings at these two adjacent time periods, i.e., (1+ρ)/(1+rt). Households prefer to consume today rather than tomorrow for two reasons. First, the term (1+ρ) appears because households discount future utility at this rate. Second, suppose ct > ct-1, i.e., consumption is high today relative to yesterday. Since agents like to smooth consumption over time -- because u”(c) < 0 -- they would like to even out the flow by bring some future consumption forward to the present. If agents are optimizing, then Eq.(2.8) says that they have equate the two rates of return and are therefore indifferent at the margin between consuming and saving. If r = ρ, households would select a flat consumption profile. Households are willing to depart from this flat pattern and sacrifice some consumption today for more consumption tomorrow only if they are compensated by an interest rate, r, that “sufficiently” exceeds ρ. The elasticity of marginal utility, which sometime is called the reciprocal of the elasticity of intertemporal substitution, gives the required amount of compensation to forgo a unit of today’s consumption for a unit of future consumption. In other words, it determines the amount by
(2.4) L = 1+ n1+ !!
"#
$
%&
t=0
'
(t
u( tc ) + "t wt + (1+ rt )at ) ct ) (1+ n)at+1[ ];t=0
'
(
(2.5) !L! tc
= 0 " t
( 1+n1+!
) #u ( tc ) = t" ;
(2.6) !L! t$1c
= 0 " t$1
( 1+n1+!
) #u ( t$1c ) = t$1" .
(2.7) !L! ta
= 0 " t! = t-1!1+n1+ tr
.
(2.8) !u ( tc )!u ( t-1c )
= (1+!)(1+ tr )
.
6
which r must exceed ρ. If we follow the common practice of assuming the functional form
Then, the optimal condition from Eq.(2.8) simplifies to
The elasticity of substitution for this utility function is the constant σ = 1/θ. Hence, this form is called the constant intertemporal elasticity of substitution (CIES) utility function. The relation between r and ρ determines whether households choose a pattern of per capita consumption that rises over time, stays constant, or falls over time, while a lower willingness to substitute intertemporally (a higher value of θ and hence a lower value of σ) implies a smaller responsiveness of change in c to the gap of r and ρ. II.2.1.3 The Transversality Condition From Lagragian equation (2.4), the transversality condition is
Eq.(2.11) states that the value of the household’s assets -- which equals the quantity at times the shadow price of income λt -- must approach 0 as time approaches infinity. If we think of infinity loosely as the end of the planning horizon, then the intuition is that optimizing agents do not want to have any valuable assets left unconsumed at the last period. The shadow price of income evolves overtime in accordance with
If we substitute the result for λt into Eq. (2.11) and ignore the term λ0, which is equal to u’(c0) and is positive, then the transversality condition becomes
u(c) = 1-!c - 11 - !
, for ! > 0, ! ! 1,
(2.9) = lnc, for ! = 1.
(2.10) tct-1c
= 1/!
1+ rt
1+ "!
"#
$
%& .
(2.11) t!"lim t! ta = 0.
!t = (1+ n)t
!s=0
t(1+ rs )
!0 .
(2.12) t!"lim1+ n( )t
#s=0
t1+ rs( )
ta = 0.

7
This equation implies that the quantity of assets per person, a, does not grow asymptotically at rate as high as r - n or, equivalently, that the level of assets does not grow at a rate as high as r. It would be suboptimal for households to accumulate positive assets forever at the rate r or higher, because utility would increase if these assets were instead consumed in finite time. In the case of borrowing, where at is negative, infinite-lived households would like to violate Eq.(2.12) by borrowing and never making payments for principal or interest. That is why we needed the constraint in Eq.(2.3) to rule out chain-letter finance, that is, schemes in which a household’s debt grows forever at the rate r or higher. In order to borrow on a perpetual basis, households would have to find willing lenders; that is, other households that are willing to hold positive assets that grow at the rate r or higher. But we already know from the transversality condition that these other households are unwilling to absorb assets asymptotically at this high a rate. Therefore, in equilibrium, each household will be unable to borrow in a chain-letter fashion. In other words, the inequality restriction shown in Eq.(2.3) is not arbitrary and would, in fact, be imposed in equilibrium by the credit market. Faced by this constraint, the best thing that optimizing households can do is to satisfy the condition shown in Eq.(2.12). That is, this equality holds whether at is positive or negative. II.2.1.4 The Role of Expectations and Consumption Function The Euler equation given in Eq.(2.8) or (2.10) gives the rate of change of consumption as a function of variables known at the current moment. It could be interpreted as suggesting that households need not form expectations of future variables in making their consumption/saving decisions and that the assumption of perfect foresight is not necessary. However, if we derive an intertemporal budget constraint from the household’s budget constraint for each time period, then we can see that the household cannot plan without knowing the entire path of both the wage and the interest rate. To derive household intertemporal budget constraint, we first re-write household current budget constraint in the following form:
We iterate Eq.(2.2') forward into time. By successive substitution into the last term on the right-hand side, and start this process from time period 0, we deduce that:
(2.2') ta = ( 1+n )( 1+ tr ) t+1a ! 1
( 1+ tr )( tw ! tc ).

8
Taking the limit as T → ∞, the first term on the right-hand side becomes zero by the transversality condition. Thus we obtain:
Expectations thus are crucial to the allocation of resources in the decentralized economy. In terms of the Euler equation, it only determines the rate of change not the level of consumption. Although it is difficult in general to solve explicitly for the level of consumption, this can be done easily when the utility function is of the form defined in Eq.(2.9). For a given value of initial consumption c0, we can deduce the similar process from Eq.(2.9) as we did for Eq.(2.2') to obtain
Replacing ct in the intertemporal budget constraint equation (2.13') gives the value of c0 consistent with Euler equation and the budget constraint:
a0 = 1+ n( )1+ r0( )
a1 ! 11+ r0( )
w0 ! c0( ),
a1 = 1+ n( )1+ r1( )
a2 ! 11+ r1( )
w1 ! c1( ),
a0 = 1+ n( )2
1+ r0( ) 1+ r1( )a2 ! 1
1+ r0( )w0 ! c0( ) !
1+ n( )1+ r0( ) 1+ r1( )
w1 ! c1( ),
" " "
(2.13) a0 = 1+ n( )T
#s=0
T!11+ rs( )
aT ! t=0
T
$1+ n( )t
#s=0
t1+ rs( )
wt ! ct( ).
(2.13') 1+ n( )t
!s=0
t1+ rs( )t=0
"
# tc = 1+ n( )t
!s=0
t1+ rs( )t=0
"
# tw + 0a
(2.14) tc = !s=0
t1+ rs( )
1+ !( )t
"
#
$$$
%
&
'''
1/!
0c .
9
Combining Eqs. (2.14) and (2.15), it is clear that consumption at each time period is a linear function of human (the first term in the bracket of Eq. (2.15)) and nonhuman wealth, a0. The parameter, β0, is the propensity to consume out of wealth and depends for the most part on the path of interest rates. An increase in the interest rate, given wealth, has two effects. The first is to make later consumption more attractive: this is the substitution effect. The second is to allow for higher consumption now than later: this is the income effect. In general, the net effect on the marginal propensity to consume is ambiguous. For the logarithmic utility function, however 1/θ = 1, the two effects cancel; the propensity to consume is simplified to (ρ - n)/(1 + ρ) and is independent of the path of interest rate, i.e.,
In general, the path of interest rates affect both the marginal propensity to consumer out of wealth and the value of wealth itself, through the term of human wealth. Expectations of wages also affect c0 through this term. Given these expectations, households decide how much to consume and save. This in turn determines capital accumulation and the sequence of factor prices. II.2.2 The Firms There are many identical firms, each with the identical constant returns to scale technology. For simplicity, we assume no physical depreciation of capital. We introduce a positive capital depreciation rate later. Each firm rents the services of capital and labor from households to produce output. The output is a homogeneous good that can be consumed or invested to create new units of physical capital. The constant returns to scale assumption means that the number of firms is of no consequence, provided the firms behave competitively, taking prices (the real wage and rental rate on capital) facing them as given. Firms choose quantities of labor and capital as inputs to maximize their profits of each time period1. Each time period’s profit is defined as the difference between the revenue firms receive
1 That there are many alternative ways to describe the firms’ behavior and they have the same outcome in
(2.15) 0c = 0!1+ n( )t
!s=0
t1+ rs( )
wt + a0t=0
"
#$
%
&&&
'
(
))) ,
where !0!1 =
1+ n( )t
1+ "( )1/#t=0
"
# $s=0
t1+ rs( )1/# ! 1%
&'()* .
0-1! = 1+ n
1+ "!
"#
$
%&
t=0
'
(t
= 1+"" ) n
.
10
and costs they occur. Technology is characterized by
where Yt is the flow of output, Kt is capital input (in units of commodities), and t, chronological time, represents the effects of exogenous technological progress. Y exhibits constant returns to scale in L and K, and each input exhibits positive and diminishing marginal product. The exogenous technological progress is presumed to take the labor-augmenting form, i.e., if we define
as the effective amount of labor input, where At is the level of the technology and grows at the constant rate g ≥ 0. Hence, At = (1 + g)t. Then, the production function can be written as
In per capita terms:
Thus, the firm’s problem can be defined as follows:
From the first order condition for the firm’s problem, it can be readily verified that the marginal products of the factors are given by:
terms of resource allocation under the perfect foresight assumption. For example, firms can own the capital and finance investment by either borrowing or issuing equity. Or, instead of operating with spot factor markets, the economy may operate in the Arrow-Debreu complete market framework in which markets for current and all future commodities are open at the beginning of time; all contracts are made then, and the rest of history merely executes there contracts. In the following chapters, we will present some different model setups for firms’ behavior dending on the purpose of the policy analysis.
tL ! tL " tA ,
tY = F( tL , tK ).
ty = f ( tk ),
where ty ! tY / tL , and tk ! tK / tL .
< tL , tK >Max tL [f ( tk ) ! tw ! tr tk ] ; t = 1, 2,.... .
11
II.2.3 The Equilibrium By combining the behavior of households and firms, we can analyze the structure of a competitive market equilibrium. We assume in this section of the chapter that the economy is closed; there is no international commodity trade and households cannot borrow from or lend to foreigners. Thus in equilibrium (in each time period), aggregate private debt bpt must always be equal to zero. Even though each household presumes it can freely borrow and lend, in equilibrium no household has an incentive to do so. Thus, at = kt, and Δtat = Δkt,, i.e., the only assets (nonhuman wealth) owned by households as a group is the stock of capital. The amount saved by households equals the amount invested on capital creation. Also, assuming for the moment that the rate of exogenous technological progress, g, is zero, using Eq. (2.2) for wt and rt and substituting in Eqs.(2.8), (2.16) and (2.17) gives
Eqs.(2.18) and (2.19) form a system of two difference equations in ct and kt. This system, together with the initial condition, k0, and the transversality condition, determines the time paths of ct and kt, i.e., the dynamic behavior of the economy. We can write the transversality condition in terms of kt by substituting a = k into Eq.(2.12):
II.2.4 The Steady State In the steady state, both the per capita capital stock and the level of consumption per capita are constant. This implies by Eq.(2.19) that the marginal product of capital (interest rate) in the steady state is equal to the rate of time preference, i.e., r = ρ. Corresponding to the steady state capital stock, k*, is the steady state level of per capita consumption implied by Eq (2.18)
(2.16) !f ( tk ) = tr ,
(2.17) [f kt( ) " kt !f kt( )] 1+ g( )t = wt .
(2.18) f ( tk ) = tc + ! tk + n t+1k ,
(2.19) "u ct+1( )"u ct( )
= 1+ !1+ "f kt+1( )
.
(2.12') t!"lim1+ n( )t
#s=0
t1+ $f ks( )( )
tk = 0 .

12
The transitional dynamics of this model are typically shown using a phase diagram drawn in (k, c) space. Since we utilize a discrete rather than a continuous time horizon model, we skip the discussion of transitional dynamics. This task instead constitutes a major focus of the following chapters. II.3 Investment and Saving in an Open Economy II.3.1 Setup of the Model In this section we extend the closed economy model to the open economy. The world now contains many countries. For convenience, we think of one of these countries, country i, as the home country, and the rest as foreign. Households and firms in all countries have identical preferences and technologies which are of the same form as above. Domestic and foreign claims on capital are assumed to be perfect substitutes as stores of values; hence, each must pay the same rate of return, r. Since loans and claims on capital in any country are still assumed to be perfect substitute as stores of value, the variable r is the single world interest rate. For the same reasons as in the closed economy model, borrowing and lending among each country’s households, i.e., the family debt, bpt, is zero. If the home country’s capital per person, ki , exceeds per capita assets ai, then the difference, ki - ai, must correspond to net claims by foreigners on domestic economy. Conversely, if ai exceeds ki, then the difference, ai - ki, must correspond to net claims by domestic residents on foreign economies. We define bi to be the home country’s net debt to foreigners (Foreign claims on the home country net of domestic claims on foreign countries), then
Equivalently, domestic assets equal domestic capital less the foreign debt: ai = ki - bi. The model still contains only a single good, but foreigners can buy domestic output, and home country residents can buy foreign output. The only function of international trade in this model is to allow domestic production to diverge from domestic expenditure on consumption and investment. In other words, we consider the intertemporal aspects of international trade but neglect the implications for patterns of specialization in production of different goods. We continue to assume that labor is immobile; that is, residents of the home country cannot emigrate nor can foreigners immigrate to home country (or immigrate).
*c = f ( *k ) - n *k
(2.20) ib = ik ! ia .
13
The budget constraint for the representative household in country i is the same as that given in Eq. (2.2):
For notational convenience, we drop country subscript i for all variables in Eq. (2.2") and in the following equations. The only new element is that r is the world interest rate. We assume that the form of households’ preferences are as in Eq. (2.9). Therefore, the first-order condition for consumption is identical to the one shown in Eq. (2.10):
The transversality condition again requires at to grow asymptotically at a rate less than r - n, as in Eq. (2.12). The optimization condition for firms, once again, entail equality between the marginal products and the factor prices (Eqs. [2.16] and [2.17]):
If we substitute for wt from Eq. (2.17) into Eq. (2.2") and use Eq. (2.16'), then the change in assets per capita is derived as
Note from Eq. (2.20) that (kt - at) = bt, and foreign debt equals zero for a closed economy. For the purpose of policy applications discussed in the following chapters, it is useful to derive a simply relation among the current account deficit, savings and investment from household’s current budget constraint in Eq. (2.21). Consequently, a brief refresher in national income accounting identities and definitions may be useful at this point. The current account deficit is equal to the change in foreign debt, which in turn equal to interest payments minus net exports of goods, the trade surplus (X):
(2.2") ! ta = tw + r ta " tc " n t+1a , for all t, 0k , 0b given .
(2.10') tct-1c
= 1!( 1+r
1+") .
(2.16') !f ( tk ) = r,
(2.17) f kt( ) " kt !f kt( ) = wt.
(2.21) ! ta = f ( tk ) " r( tk - ta ) " tc " n t+1a , for all t, 0b and 0k given.
! tB = r tB " X.
14
A country’s net export equals its output minus consumption and investment, i.e.,
GDP is equal to its output, F(Lt, Kt), while GNP equals GDP minus interest payments on foreign debt, i.e., F(Lt, Kt) - rBt. Savings is equal to GNP minus consumptions:
If Lt grows at the rate n, then the per capita current account deficit equals Δbt + nbt. It is easy to see that per capita saving is exactly Δa defined in Eq. (2.21), i.e., st = Δat. Then, it is again a Ponzi-like solution. Households should borrow until the marginal utility of consumption is equal to zero, and then borrow further to meet interest payments on their foreign debt. It is unlikely that the lenders are willing to continue lending if the home country’s households’ only means of paying off their debt were to borrow more. That is why the transversality condition in Eq. (2.12) is needed to restrict foreign debt, bt so that it does not grow asymptotically at a rate higher than r - n. The transversality condition can be defined as a restriction on foreign debt:
II.3.2 Behavior of a Small Economy’s Capital Stock and Consumption For a small open economy, we can treat the path of rt as exogenous. Given this path, Eqs. (2.16') and (2.17) determine the paths of kt and wt, without regard to the choice of consumption and saving by the home country households. Given the time path for wt , Eqs. (2.2") and (2.10') and the transversality condition determine the paths of ct and at. Finally, the paths of kt and at prescribe the behavior of the net foreign debt, bt, from Eq. (2.20). For simplicity, we assume that the world interest rate equals a constant r. In effect, the world economy is in a steady state of the nature derived for a single closed economy. If r is constant, then Eq (2.16') implies that kt equals a constant, which satisfied f’(k) = r. In other words, the speed of convergence from any initial value, k0, to k is infinite or instantaneous. An excess of k over k0 causes capital to flow in from the rest of the world so that the gap disappears instantaneously. Similarly, an excess of k0 over k induces a massive outflow of capital. This counterfactual prediction of an infinite speed of convergence for k is one of the problematic implications of the open-economy version of the Ramsey model. Later, we discuss several ways of overcome this short coming.
tX = F Lt,Kt( ) ! tC ! " tK .
tS = F Lt,Kt( ) ! r tB ! tC = " tK + tX ! r tB = " tK ! " tB ,
so that ! tB = current account deficit = ! tK " tS .
(2.22) t!"lim1+ n( )t
#s=0
t1+ rs( )
tb = 0 .
15
If r = ρ, then Eq. (2.10') implies consumption, ct, is constant. Otherwise, ct asymptotically approaches 0 if r < ρ. The home country households borrow to enjoy a high level of consumption early on because they are impatient in the sense that ρ > r. But they have to pay the price later in the form of lowering their consumption. (If ρ < r, the domestic economy would eventually accumulate enough assets to violate the small-country assumption that we made). The result is that c tends to zero, which is another problematic feature of the open-economy Ramsey model. If r = ρ, then at is constant by Eq. (2.2"). Otherwise, at eventually falls to 0, so that bt = k, if a0 > 0. Subsequently, at becomes negative; that is, the home country becomes a debtor not only in the sense of not owning its capital stock but also of borrowing against the present value of its wage income as collateral. In other words, an impatient country asymptotically mortgages all its capital and all of its labor income. This counterfactual behavior of assets is yet another difficulty with the model. The specifications of capital adjustment cost or a constraint on international borrowing has been used to address this problem We also discuss these issues in later chapters. II.4 From the Single Sector Model to the Multi Sector Model An aggregate single sector dynamic general equilibrium model focuses on resource or wealth allocation over time with respect to changes in the price/interest rate over time. In the real economy, resources are also allocated cross sectors in response to a policy which may cause a change in the relative prices of different commodities. Hence, for many purposes, a single sector model is inadequate for policy analysis. For example, a highly aggregated single sector model does not allow us to investigate trade policy effects on a country’s trade pattern. Also, it is impossible to use a single sector model to analyze the different effects of some domestic policies, such as fiscal and industrial policy on different industries, or different groups of households. In this sub-section, we extend the standard single sector dynamic model into a two sector model and derive the major linkages between intra- and inter-temporal equilibrium. The two sector model can be easily extended to a multi-sector model provided it is appropriate to assume that there exists more than two factors of production in the economy. II.4.1 The households As in section II.3.1.1, we assume that there are many identical households, the number of which grow at the constant rate, n, and the initial period’s number is normalized to unity. The two goods produced correspond to the two sectors of the economy. While good 1 can be either consumed by household or used for investment to form new capital, good 2 can only be consumed as a consumption good. The intertemporal utility function is given by
16
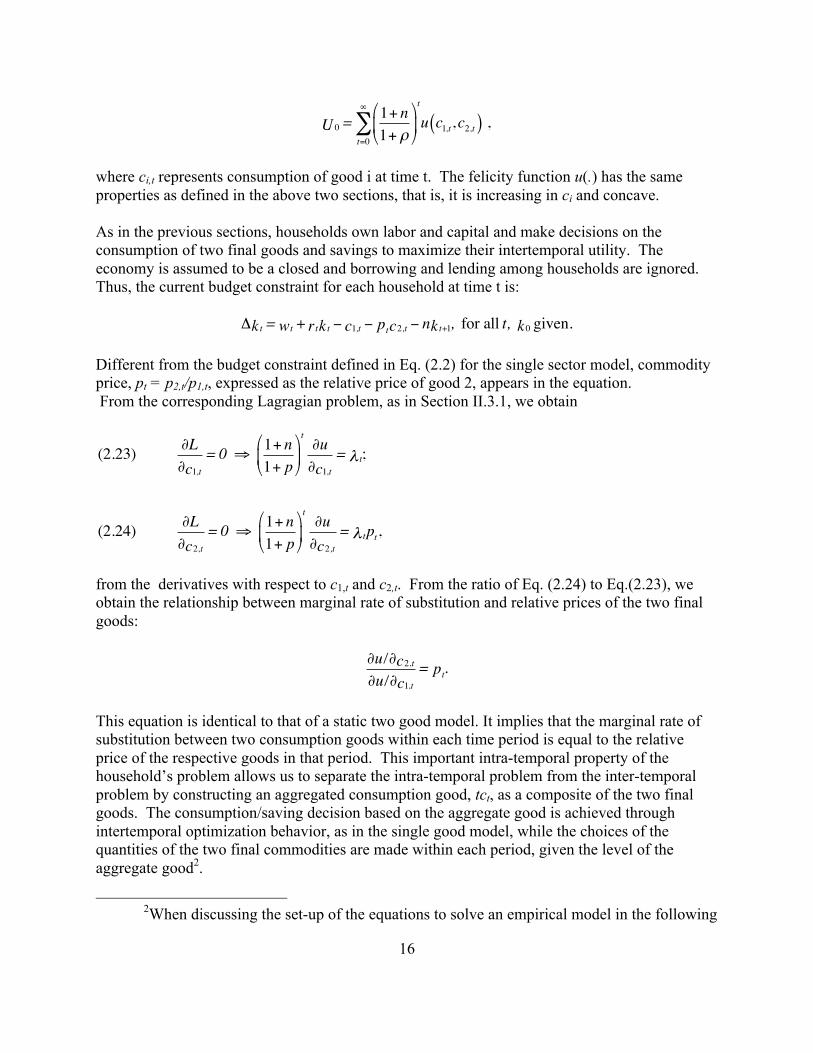
where ci,t represents consumption of good i at time t. The felicity function u(.) has the same properties as defined in the above two sections, that is, it is increasing in ci and concave. As in the previous sections, households own labor and capital and make decisions on the consumption of two final goods and savings to maximize their intertemporal utility. The economy is assumed to be a closed and borrowing and lending among households are ignored. Thus, the current budget constraint for each household at time t is:
Different from the budget constraint defined in Eq. (2.2) for the single sector model, commodity price, pt = p2,t/p1,t, expressed as the relative price of good 2, appears in the equation. From the corresponding Lagragian problem, as in Section II.3.1, we obtain
from the derivatives with respect to c1,t and c2,t. From the ratio of Eq. (2.24) to Eq.(2.23), we obtain the relationship between marginal rate of substitution and relative prices of the two final goods:
This equation is identical to that of a static two good model. It implies that the marginal rate of substitution between two consumption goods within each time period is equal to the relative price of the respective goods in that period. This important intra-temporal property of the household’s problem allows us to separate the intra-temporal problem from the inter-temporal problem by constructing an aggregated consumption good, tct, as a composite of the two final goods. The consumption/saving decision based on the aggregate good is achieved through intertemporal optimization behavior, as in the single good model, while the choices of the quantities of the two final commodities are made within each period, given the level of the aggregate good2.
2When discussing the set-up of the equations to solve an empirical model in the following
0U = 1+ n1+ !!
"#
$
%&
t=0
'
(t
u c1,t,c2,t( ) ,
! tk = tw + tr tk " 1,tc " tp 2,tc " n t+1k , for all t, 0k given.
(2.23) !L! 1,tc
= 0 " 1+ n1+ p#
$%
&
'(
t!u! 1,tc
= t! ;
(2.24) !L! 2,tc
= 0 " 1+ n1+ p#
$%
&
'(
t!u! 2,tc
= t! pt,
!u/! 2,tc!u/! 1,tc
= tp .
17
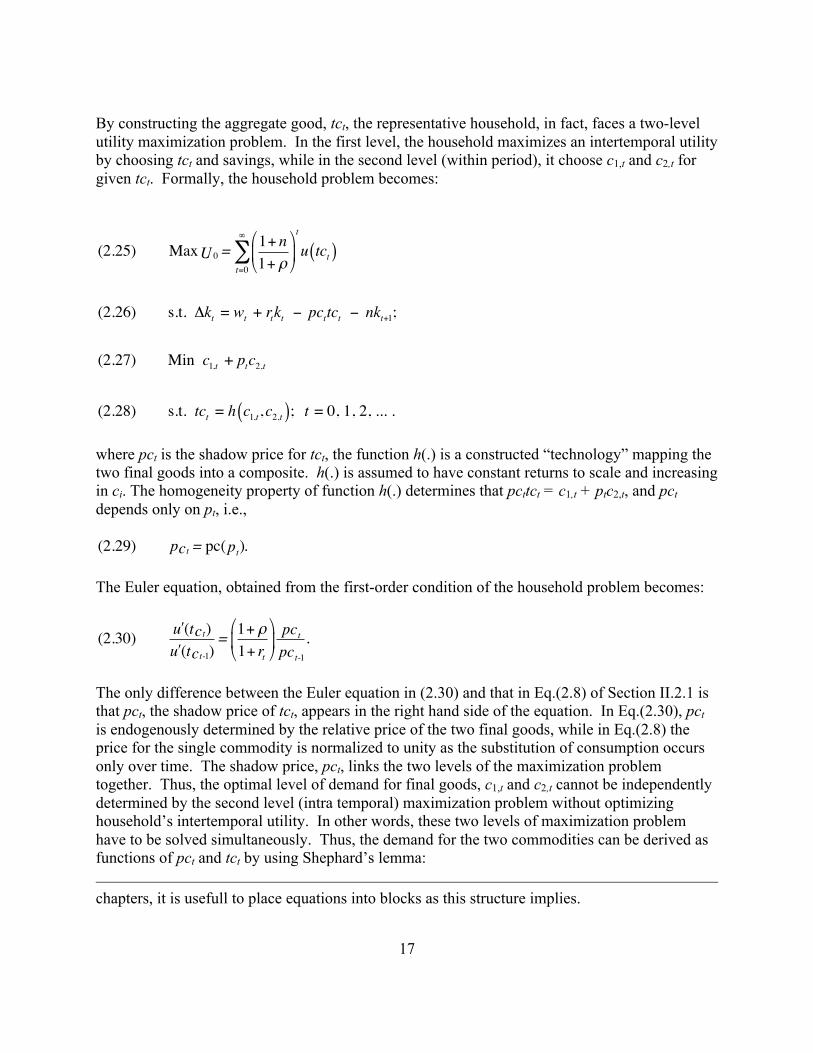
By constructing the aggregate good, tct, the representative household, in fact, faces a two-level utility maximization problem. In the first level, the household maximizes an intertemporal utility by choosing tct and savings, while in the second level (within period), it choose c1,t and c2,t for given tct. Formally, the household problem becomes:
where pct is the shadow price for tct, the function h(.) is a constructed “technology” mapping the two final goods into a composite. h(.) is assumed to have constant returns to scale and increasing in ci. The homogeneity property of function h(.) determines that pcttct = c1,t + ptc2,t, and pct depends only on pt, i.e.,
The Euler equation, obtained from the first-order condition of the household problem becomes:
The only difference between the Euler equation in (2.30) and that in Eq.(2.8) of Section II.2.1 is that pct, the shadow price of tct, appears in the right hand side of the equation. In Eq.(2.30), pct is endogenously determined by the relative price of the two final goods, while in Eq.(2.8) the price for the single commodity is normalized to unity as the substitution of consumption occurs only over time. The shadow price, pct, links the two levels of the maximization problem together. Thus, the optimal level of demand for final goods, c1,t and c2,t cannot be independently determined by the second level (intra temporal) maximization problem without optimizing household’s intertemporal utility. In other words, these two levels of maximization problem have to be solved simultaneously. Thus, the demand for the two commodities can be derived as functions of pct and tct by using Shephard’s lemma: chapters, it is usefull to place equations into blocks as this structure implies.
(2.25) Max 0U = 1+ n1+ !!
"#
$
%&
t=0
'
(t
u tct( )
(2.26) s.t. )kt = wt + rtkt * pcttct * nkt+1;
(2.27) Min c1,t + ptc2,t
(2.28) s.t. tct = h c1,t,c2,t( ); t = 0, 1, 2, ... .
(2.29) p tc = pc( tp ).
(2.30) !u (t tc )!u (t t-1c )
= 1+ !1+ rt
"
#$
%
&' tpc
t-1pc.

18
II.4.2 The Firms The two final good production sectors are characterized by many price taking competitive firms. Firms within each sector produce a single output with the same constant returns to scale technology (while the technologies are different between sectors). Each firm rents the services of labor and capital which are perfectly mobile cross sectors. For simplicity, we assume no physical depreciation of capital and the rate of technological progress is zero. While the output of sector 1 can be consumed or invested to create new units of physical capital, output of sector 2 is only consumed by households. Firms make similar decision as they did in Section II.2.2, i.e., they maximize profits at each time period. Formally, their technologies are
Let li,t = Li,t/L be the share of total labor employed by sector I, i.e., l1,t + l2,t = 1, and yi,t denote per capita output of sector i, i.e., yi,t = Yi,t/Lt. Then in each sector, firm’s technology is characterized by:
where ki,t = Ki,t/Li,t. From the firms’ cost minimization within each time period, we have:
II.4.3 The Equilibrium II.4.3.1 The intra-temporal equilibrium Since firms only face an intra-temporal (within time period) problem, the intra-temporal equilibrium, for a close economy, can be discussed independently given the household’s inter-temporal choices on aggregate consumption and savings. Much of the analysis in the following discussion dealing with firm’s problem in the intra-temporal equilibrium involves the use of duality theory. This approach is convenient as it often
(2.31) 2,tc = p !c ( tp )t tc ;
(2.32) 1,tc = pc( tp )t tc " p !c (pt )tct.
i,tY = iF ( i,tL , i,tK ); i = 1,2.
(2.33) i,ty = i,tl if ( i,tk ); i = 1,2,
(2.34) ig ( tw , tr ) tiy ! " tl , tk #Min i,tl ( tw + tr i,tk )
s.t. li,t f i ki,t( ) = yti; i = 1, 2; t = 1,2, ... .
19
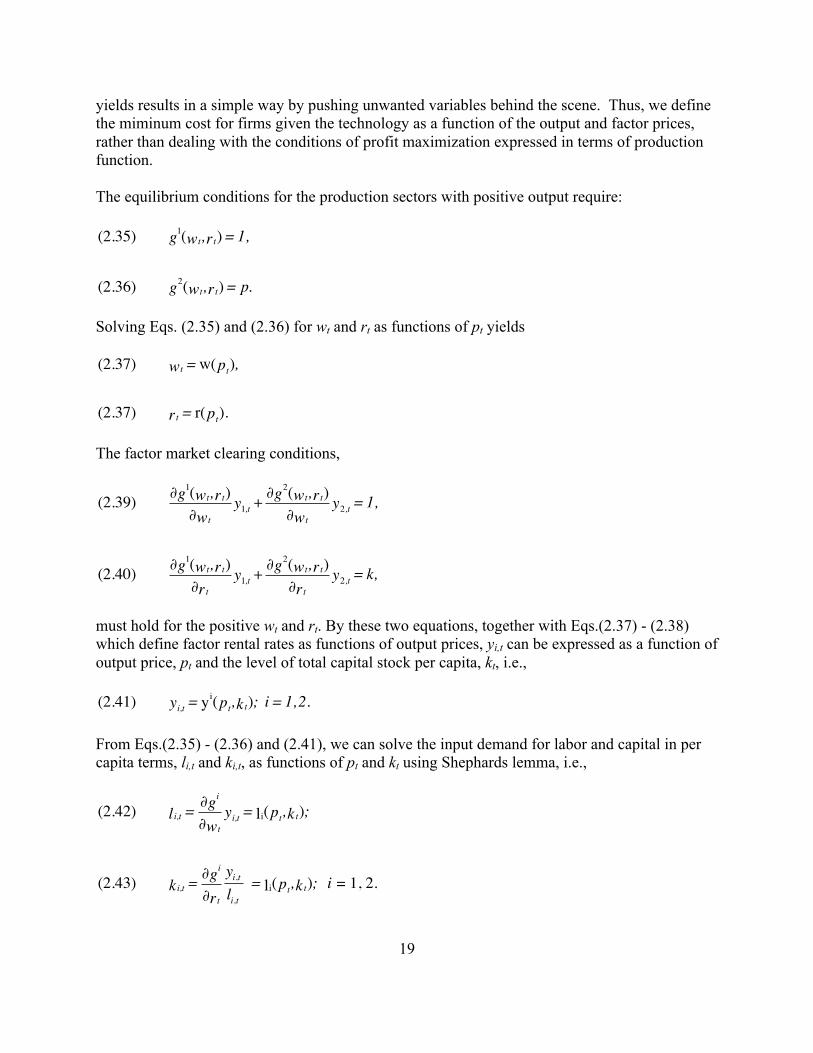
yields results in a simple way by pushing unwanted variables behind the scene. Thus, we define the miminum cost for firms given the technology as a function of the output and factor prices, rather than dealing with the conditions of profit maximization expressed in terms of production function. The equilibrium conditions for the production sectors with positive output require:
Solving Eqs. (2.35) and (2.36) for wt and rt as functions of pt yields
The factor market clearing conditions,
must hold for the positive wt and rt. By these two equations, together with Eqs.(2.37) - (2.38) which define factor rental rates as functions of output prices, yi,t can be expressed as a function of output price, pt and the level of total capital stock per capita, kt, i.e.,
From Eqs.(2.35) - (2.36) and (2.41), we can solve the input demand for labor and capital in per capita terms, li,t and ki,t, as functions of pt and kt using Shephards lemma, i.e.,
(2.35) 1g ( tw , tr ) = 1,
(2.36) 2g ( tw , tr ) = p.
(2.37) tw = w( tp ),
(2.37) tr = r( tp ).
(2.39) !1g ( tw , tr )! tw 1,ty + !
2g ( tw , tr )! tw 2,ty = 1,
(2.40) !1g ( tw , tr )! tr 1,ty + !
2g ( tw , tr )! tr 2,ty = k,
(2.41) i,ty = iy ( tp , tk ); i = 1,2.
(2.42) i,tl = !ig
! tw i,ty = il ( tp , tk );
(2.43) i,tk = !ig
! tr
yi,t
li,t = il ( tp , tk ); i = 1, 2.
20
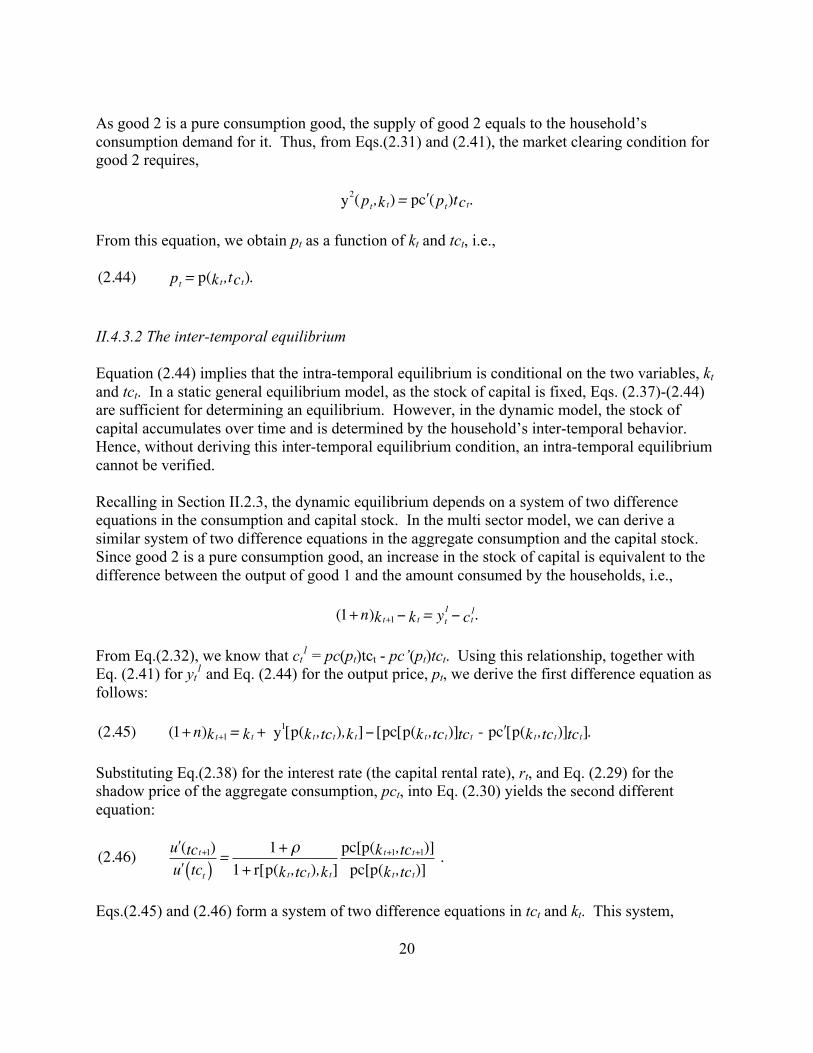
As good 2 is a pure consumption good, the supply of good 2 equals to the household’s consumption demand for it. Thus, from Eqs.(2.31) and (2.41), the market clearing condition for good 2 requires,
From this equation, we obtain pt as a function of kt and tct, i.e.,
II.4.3.2 The inter-temporal equilibrium Equation (2.44) implies that the intra-temporal equilibrium is conditional on the two variables, kt and tct. In a static general equilibrium model, as the stock of capital is fixed, Eqs. (2.37)-(2.44) are sufficient for determining an equilibrium. However, in the dynamic model, the stock of capital accumulates over time and is determined by the household’s inter-temporal behavior. Hence, without deriving this inter-temporal equilibrium condition, an intra-temporal equilibrium cannot be verified. Recalling in Section II.2.3, the dynamic equilibrium depends on a system of two difference equations in the consumption and capital stock. In the multi sector model, we can derive a similar system of two difference equations in the aggregate consumption and the capital stock. Since good 2 is a pure consumption good, an increase in the stock of capital is equivalent to the difference between the output of good 1 and the amount consumed by the households, i.e.,
From Eq.(2.32), we know that ct
1 = pc(pt)tct - pc’(pt)tct. Using this relationship, together with Eq. (2.41) for yt
1 and Eq. (2.44) for the output price, pt, we derive the first difference equation as follows:
Substituting Eq.(2.38) for the interest rate (the capital rental rate), rt, and Eq. (2.29) for the shadow price of the aggregate consumption, pct, into Eq. (2.30) yields the second different equation:
Eqs.(2.45) and (2.46) form a system of two difference equations in tct and kt. This system,
2y ( tp , tk ) = p !c ( tp )t tc .
(2.44) tp = p( tk ,t tc ).
(1+n) t+1k ! tk = t1y ! t
1c .
(2.45) (1+n) t+1k = tk + 1y [p( tk , ttc ), tk ] ! [pc[p( tk , ttc )] ttc - p "c [p( tk , ttc )] ttc ].
(2.46) !u ( t+1tc )!u tct( )
= 1 + !1 + r[p( tk , ttc ), tk ]
pc[p( t+1k , t+1tc )]pc[p( tk , ttc )]
.
21
together with the initial condition, k0, and the transversality condition, determines the time paths of tct and kt, i.e., the dynamic behavior of the economy. Once the dynamic paths of tct and kt are defined, the equilibrium solutions for the other variables derived in Eqs.(2.29), (2.31) - (2.32), (2.37) - (2.38) and (2.41) - (2.44) in each time period are obtained simultaneously. Corresponding to the steady state per capita capital stock, k*, is the steady state level of per capita aggregate consumption, and the steady state levels of other variables in per capita terms, such as sectoral outputs, sectoral input demand for labor and capital, the demand for each final good, the wage and capital rental rates (interest rate), and the relative price implied by Eqs.(2.29), (2.31) - (2.32), (2.37) - (2.38), and (2.41) - (2.45). II.5 The Small Open Economy with Two Production Sectors In the previous section, international trade in commodities was not permitted. In the single commodity model of Section II.3.2, international trade only occurred in terms of borrowing and lending. These flows served to smooth domestic consumption by allowing consumption to diverge from domestic production. We now return to this structure for the case of a two commodity small-open economy to show the consequent implications to out-of-steady state adjustment and the resulting trade patterns. As in Section II.3, we define at as the per person’s assets in the home country, and bt = kt - at as foreign debt, and we assume that labor is immobile internationally. The budget constraint for the representative household in the home country becomes:
and
where r is now the world interest rate. A common r presumes that claims on the foreign assets and domestic capital are perfect substitutes as stores of values. p is the world relative price for good 2. Given an exogenous p, the shadow price for overall consumption, pc, which is dependent only on p, is also exogenously determined. From the household’s utility maximization problem, an Euler equation result similar to Eq (2.10') is obtained:
where pc no longer appears since it is time independent. Consumption is determined by:
! ta = tw + r ta " pct tc " n t+1a ,
pct tc = 1,tc + p 2,tc ,
(2.47) t tct t-1c
= 1!( 1+r
1+") ,
(2.48) 2,tc = p !c (p)tct;
(2.49) 1,tc = pc(p)tct " p !c (p)tct.
22
The transversality condition again requires at to grow asymptotically at a rate less than r - n, as in Eq.(2.12). The firm’s optimization conditions in the open economy are identical to the close economy, i.e., their optimization choices are temporally independent. From Section II.2.3, we know that when r = ρ, the speed of convergence from any initial value of k0 to the steady state k* is infinite. In this section, we will first check whether this property still holds in a multi sector small open economy. Similar to Section II.2.3, if r = ρ, then, Eq.(2.47) implies the aggregate consumption, tc, is constant. Also, from Eqs.(2.48) - (2.49), c1 and c2 are constant. To check whether capital can slowly adjust over time, we consider two situations for the home country economy in the following subsections: (a) the economy produces both goods, and (b) the economy is specialized in the production of a single good. II.5.1 The Small Open Economy without Production Specialization The equilibrium conditions for an economy to produce both goods are defined in Eqs. (2.35) - (2.36) of the previous section. These conditions also imply that w is exogenously given when the economy is a small open economy. To satisfy the first-order conditions for firm’s profit maximization, the following equations are required:
With constant r and w, k1 and k2 have to be constant and, hence, k = k1 + k2 is constant. From the factor market equilibrium conditions, we can derive the following equations for l1 and l2:
(2.50) 1f!( 1k ) = r;
(2.51) 2pf!( 2k ) = r;
(2.52) 1f!( 1k ) " k1 f 1!(k1) = w;
(2.53) 2p[ f!( 2k ) " k2 f 2!(k2 ) = w.

23
Hence, l1 and l2 are also constant. Now, it is clear that we reach a similar result as in the single sector small open economy model (Section II.3.2): an excess of k over initial level of k0 causes capital to flow in from the rest of the world while an excess of k0 over k causes an instantaneous outflow of capital to close the k0 - k gap. II.5.2 The Small Open Economy with Production Specialization To consider specialization, we assume, arbitrarily, that sector 1 is capital intensive and sector 2 is labor intensive, with no factor intensity reversal, i.e., k1,t > k2,t, for all t. Also, we assume that, facing a constant world price, the steady state level of capital stock per capita in the home economy is lower than the capital/labor ratio in sector 2, such that sector 1, the capital intensive sector, is nonprofitable, i.e., the country is specialized in the production of good 2. Satisfying this assumption requires:
Eq. (2.47) implies that as the unit cost for producing good 1 is greater than the good 1's world price (which is normalized to unity), y1 is not produced in the home country. Once the economy is specialized in the production of good 2, household consumption and investment demand for good 1 have to be satisfied through international trade. Thus, the steady state trade pattern for this small economy is to export good 2 and to import good 1, i.e.,
However, if an out-of-steady state path exists, it is possible for the economy to import both goods during early periods of transition. If this were to occur, the economy would need to borrow from the rest of the world, in which case, it would also need to export more of good 2 in the future to cover the interest payment on the debt outstanding. As there is now only one sector to produce the final good, the setup of the model for the firm’s problem becomes the same as we discussed in Section II.3.2. The optimization condition for
(2.54) 1l = 2k ! k2k ! 1k
;
(2.55) 2l = k ! k1
2k ! 1k .
(2.56) g1 w, r( ) > 1, ! y1,t = 0;
(2.57) g2 w, r( ) = p, ! y2,t > 0.
(2.58) 1m ! 1c + nk > 0;
(2.59) 2m ! 2c " y2 < 0.

24
firms becomes:
For the same reason as discussed in Section II.3.2.3, k and w are constant to satisfy Eqs.(2.60)-(2.61) with fixed r and p. Now if we assume that the initial level of capital stock in the home country, k0, is different from the steady state level k, then, we arrive at the same result: the gap between initial level of capital stock, k0, and steady state level k instantaneously disappears through international borrowing or leanding. Likewise, if we assume instead that the economy is specialized in the production of good 1, we will arrive at the same conclusion, namely, the gap of k0 over k disappears instantaneously through international borrowing or lending. It is easy to extend the two sector model to multi-sectors and reach similar conclusions, i.e., if the world capital market is perfect, and the economy is small in the sense it cannot affect world market price and interest rate, instantaneous convergence of k occurs, and hence for the economy as well. To obtain out-of-steady state dynamics, other assumptions must be relaxed. For example, either some form of capital adjustment cost or imperfect capital mobility must be considered (references..). Another possibility, as we show in the empirical model developed in Chapter 3, out-of-steady state dynamics can be the result when imperfect substitutability between the same home and foreign produced goods is assumed.
(2.60) p 2f!(k) = r;
(2.61) p[ 2f (k) " kf 2!(k)]= w.