Embed Size (px)
Citation preview
International Journal of Scientific Engineering and Research (IJSER) www.ijser.in
ISSN (Online): 2347-3878, Impact Factor (2014): 3.05
Volume 3 Issue 10, October 2015 Licensed Under Creative Commons Attribution CC BY
Basics of Land Seismic Data Interpretation
Kulbhushan1*
, Monalisa Mitra2**
1Kurukshetra University, Kurukshetra, Department of Geophysics, Haryana, India, Pin-136119
2Burdwan University, Department of Geology, Durgapur, West Bengal, India, Pin-713214
*Present Address: ALPHAGEO (India) Limited, 6-3-250/2, Road No.1, Banjara Hills, Hyderabad-500034, India
**Present Address: Haryana Space Application Center (HARSAC), Department of science and technology, CCS HAU Campus, Hisar-125004,
Haryana, India
Abstract: 2D and 3D seismic data have been used to delineate a productive zone in Assam oil field of India. The research involves basic
steps required for 2D and 3D land seismic data interpretation both by hand and workstation, and how it can be successfully utilized in
delineating hydrocarbon bearing structural traps and the general geology of the concerned area.
Keywords: Seismic data, Structural Maps, Anticlines, Faults, Horizon
1. Introduction
Some of the common geophysical survey techniques used
in oil and gas exploration to know the subsurface image are
Gravity survey, Airborne gravity survey, Magnetic survey,
Airborne magnetic survey, Electromagnetic survey and
Seismic survey. Details of geophysical techniques are not
emphasized; these are covered in standard texts [1] and
have been summarized in [2].
Among all these methods seismic method is manifested the
most important indirect method for collecting information
about the Earth’s geological structures and rock properties.
It can be used inland, offshore, and in transition zones.
Though details of the seismic method are complex, the
principle is relatively simple. Seismic sources at or just
below the surface generate elastic waves that propagate in
different directions through the subsurface. Variations in
the physical properties of the geological layers cause the
seismic signals to reflect, refract at the boundaries of these
layers. The reflected waves head back towards the surface
where detectors have been placed to record these waves.
The recorded signals are subsequently processed to generate
images of the subsurface, and to estimate physical
properties such as wave velocity.
In marine environment, the seismic signals are either
generated by an impulsive source, known as the air-gun, or
by some controlled vibratory source as a coded signal. The
returning signals are detected by piezoelectric pressure
sensors called hydrophones which are connected in
streamers (measurement cables) towed by a boat.
Alternatively the velocity and acceleration sensors are
placed on the sea floor to detect the returning signals by
ocean bottom cable (OBC) surveys. In the land survey on
the other case seismic signals are generated either by
dynamite sources or by mechanical impulsive sources or by
coded vibratory sources. The returning signals here are
detected by either velocity or acceleration sensors known as
geophones.
With phase of time seismic method has been significantly
improved since its start in the early twentieth century.
Previously Two-dimensional (2-D) seismic data were
primarily used for exploration as well as interpolation
between wells during the production phase. In 1980’s three-
dimensional (3-D) seismic data interpretation was first
introduced. This brought a revolution in exploration
industry. Results revealed that 3-D seismic data provide
significantly better images making detection of small-scale
reservoir features like channels, small faults or fractures
easy. Currently, 3-D seismic data are not only used during
the development phase, but also they are used during the
exploration phase resulting in reduction in acquisition cost.
Significant attention to wide-azimuth marine 3-D data is
given which assist in improving complex subsurface
imaging [3] [4]. Wide-azimuth land 3-D seismic data has
been widely used in improving imaging in areas with
complex near-surface [5]. With the advent of technology we
are now even more advanced and are recently using four-
dimensional (4-D) seismic data or time-lapse data, which
proved to be very useful in monitoring reservoir fluid
movements with time in particular for the marine case. The
use of multi component (i.e. compressional and shear
waves) seismic recording has opened new opportunities for
more accurate estimation of the rock properties. In order to
start a seismic survey we first need to study the detail
geology of that specific area and collect as much
information as possible i.e. determine the rock formations,
traps present in the area and also stratigraphy of the
required area. We can get this information by the previous
surveys or studies that have been performed in this area.
Then we go for the Gravity survey using the instrument
gravity meter. This in turn helps us to determine the
anomaly and mainly the depth of the bed rocks; also we can
determine the strike and dip of the anomaly using the
gravity contours of the interested area. These strike and dip
information helps in plotting the map where to laid the
source and receiver line. After all this information is
acquired we start the process of Seismic Exploration.
Seismic Exploration is basically a technique to map the
subsurface geology. It consist of three main steps namely
data acquisition, data processing and data interpretation.
Data acquisition is the fundamental base of this technique.
To start data acquisition, simulation is done and the field
parameter i.e. we design the survey is set. Then we
artificially shot the design in the software and check the
requirement. Inaccuracy while acquiring data, may lead to
wrong interpretation. Better results can be obtained if data
Paper ID: IJSER15530 95 of 99
International Journal of Scientific Engineering and Research (IJSER) www.ijser.in
ISSN (Online): 2347-3878, Impact Factor (2014): 3.05
Volume 3 Issue 10, October 2015 Licensed Under Creative Commons Attribution CC BY
quality is good enough. Data should be acquired after the
other preliminary surveys, taking all the precaution into
consideration like noise test, proper source and proper
arrangement of all the geophone groups to attenuate the
noise part. If possible, go for the 3-D survey technique as it
provides resolution, depth accuracy and lateral extent of the
reservoir. Marine surveys are easy to perform as noise part
is comparably less and data can be acquired with faster rate,
which make it less expensive. Data is acquired in digital
format and whole work is done through computers, so
results can be obtained in a less span of time.
After collecting the data we process the raw data. As the
noise cannot be removed completely during the acquisition
so to get the pure data and go for various operations as
discussed in processing part. During the processing our
main aim is to enhance the signal to noise ratio using the
mathematical operation. After process the data we go for
the interpretation.
2. Location and General Geology of Study
Area
The study area is situated in Assam, located in the North
Eastern region of India. It has a diversified geological
spectrum. It is located near the hairpin bend of the
Himalayas. Hence the extreme geostatic pressures exerted
on the landmass during the creation of the Himalayas have
resulted in Assam having large areas of sedimentary
deposits. These in turn have resulted in huge amount of
hydrocarbon deposit in places like Digboi, Bongaigaon etc.
Apart from this Cachar district of Assam is a huge
storehouse of limestone. This primary sedimentary rock is
used in construction; interior decoration etc. The famous
Dhubri district has an approximate reserve of more than ten
million tons of Iron Ore. Of the four kinds of Iron ore,
Haematite, Magnetite, Limonite and Siderite, the region is
predominant in Haematite deposits. Karbi, Anglong District
and North Cachar hills have substantial reserves of coal. Of
the four types of coal namely Peat, Lignite, Bituminous and
Anthracite, the third kind is readily available out here.
Karbi, Anglong is also rich in Kaolin (China Clay) deposits.
Another district, Morigaon, contains extensive reserves of
granite. Not to be outdone, Nagaon district has got very
high reserves of Glass Sand. Thus it can be said that the
geology of Assam depicts a rich repository of minerals with
its diversified geographical structure.
3. Methodology
Two types of methodology were followed.
3.1. Mapping and Contouring Manually
Mapping and Contouring of Horizons on paper of Seismic
Sections for interpretation of 2-D seismic data (Manually).
Although the contouring process can be mechanized, many
interpreters prefer to contour by hand in any situation where
these interpretive decisions are critical. The operations of
timing and posting, however, are not interpretive; they can
and should be mechanized. Today contouring is generally
done by machine. But sometimes the machine fall short. It
is then where comes the skill of not only making contour
maps but also correct reading of contour maps made by
others, so that from the two-dimensional contour map the
three-dimensional surface can easily be visualized. Within a
minute or two, the expert interpreter can identify the
structural style, the location of the trap, the location of the
spill point, and the structural risk in the prospect.
A part of seismic data was taken for the 2-D Interpretation
work. The block consisted of 8 parallel in lines and 2 cross
lines each representing a seismic section. Basic rules were
followed to interpret the data.As no well data was present
for given data, so two horizons were taken into
consideration.Firstly one horizon was picked on one line
section and then the same horizon had to be picked forthe
rest of the parallel sectionsthus making it easy to
compare.Also it was made sure that at the intersection
points of Inline and crossline time of same horizon will be
same. Now the horizon can be smoothly marked across all
the sections.Similar steps were followed for the second
horizon.
After thehorizons weremarked on all the sections
contouring of the horizon was done. For this the shot point
interval and corresponding two way time for all the sections
were taken. Now all the time values were transferred on the
base map. Also note that at the intersection points the time
of same horizon will be same.After transferring all the
values if the time was same for all the intersection points,
then we can say that the horizon was same for all
sections.With free hand all the points having same values
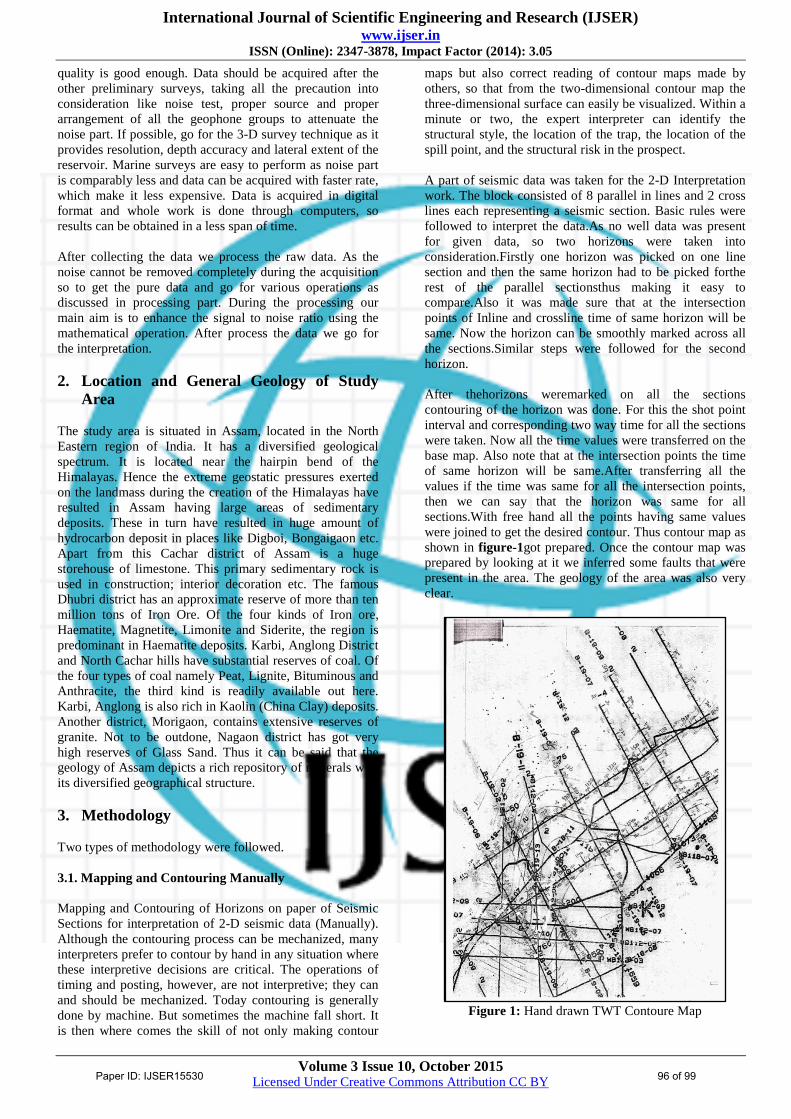
were joined to get the desired contour. Thus contour map as
shown in figure-1got prepared. Once the contour map was
prepared by looking at it we inferred some faults that were
present in the area. The geology of the area was also very
clear.
Figure 1: Hand drawn TWT Contoure Map
Paper ID: IJSER15530 96 of 99
International Journal of Scientific Engineering and Research (IJSER) www.ijser.in
ISSN (Online): 2347-3878, Impact Factor (2014): 3.05
Volume 3 Issue 10, October 2015 Licensed Under Creative Commons Attribution CC BY
3.2. Interpretation on Workstation
The main objective of interpretation on workstation is the
mapping of the two horizons. One near the basement and
the other at the top of the Oligocene layer, then study the
fault pattern of the area.
A block consisting of 24 fold 3-D Data of Assam with a Bin
size 25 x 50 m was processed using ProMAX Software. It
was then interpreted using GeoFrame Software in Work
Station.
Table 1: Details of the data Project location Assam
Area 102 km2
Inline Interval 50(m)
Cross line Interval 25(m)
First Inline 1204
Last Inline 1373
First Cross line 1266
Last Cross line 1749
Inline Increment 1
Crossline Increment 1
3.2.1. Data loading and Writing Devices used:
1. Cartridge Drive also known as SDLT Drive
2. Two types of Tape Drive, DAT Drive (4mm) and
EXABYTE Drive (8mm)
3.2.2. Data Storage Devices used:
a) Cartridge with data storage capacity from 10 GB to 800
GB
b) 4 mm and 8mm Tape
c) CD
d) DVD
e) Floppy
f) USB Storage devices (Like Pen Derive)
3.2.3. Software and Hardware used:
a) Software
GeoFrame 4.3 and Petrel 2007.1.2
Software’s GeoFrame is a Linux and Sun Solaris operating
system based.
Petrel is a Windows operating system based.
b) Hardware
Workstations of HP and SUN with 400 GB hard disk
capacity, 16GB RAM and 64 bytes/s data transfer rate.
3.2.4. Loading of Seismic and Navigation Data
Project Creation- A Project is created for loading the 3-D
Seismic Data in workstation so that it can be Interpreted
using GeoFrame Software.
Navigation Data Loading- In Navigation data all the
Easting and Northing (X, Y) information of CDP and Short
Point are present which are loaded in my project file.
SEG Y Data Loading- The given 3-D Seismic Data (SEG
Y) is loaded from an 8mm EXABYTE Tape.
Merging-Now after loading of Navigation as well as SEG Y
Data it is merged together so that our SEG Y Data has its
Navigation.
With the above available data the following methodology
was followed for horizon picking, fault identification and 3-
D seismic data interpretation.
3.2.5. Mapping Horizons and Contouring on
workstation with software.
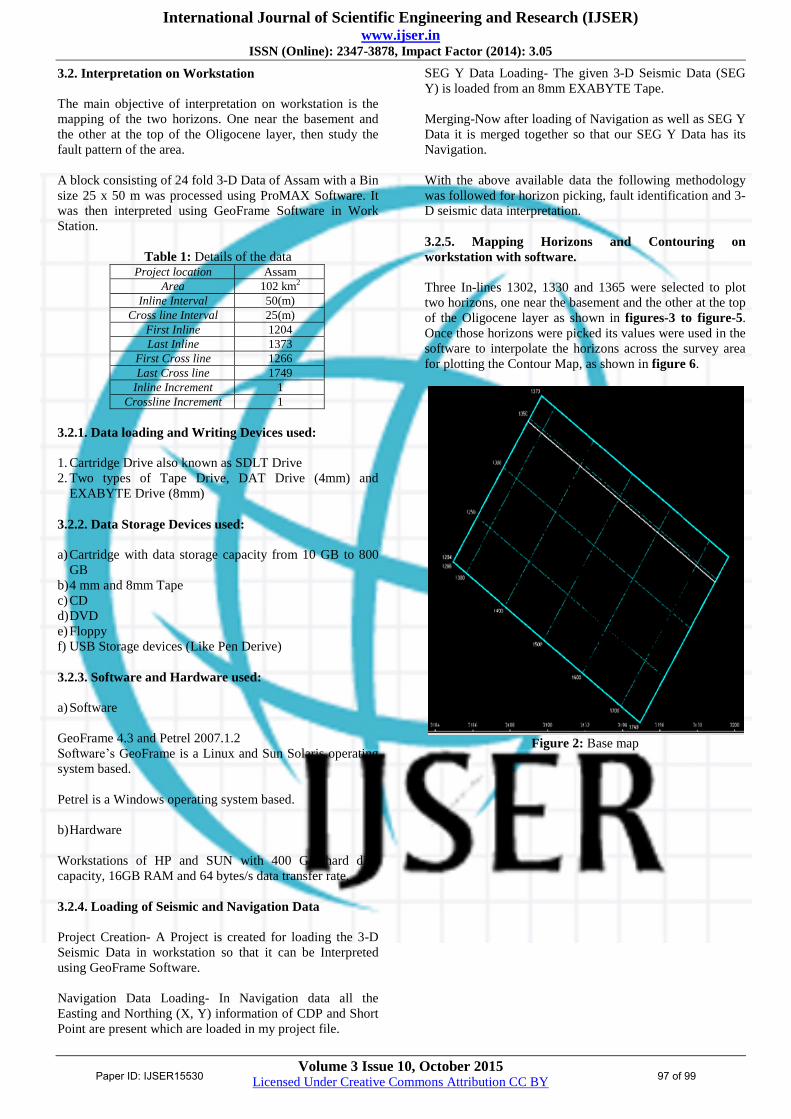
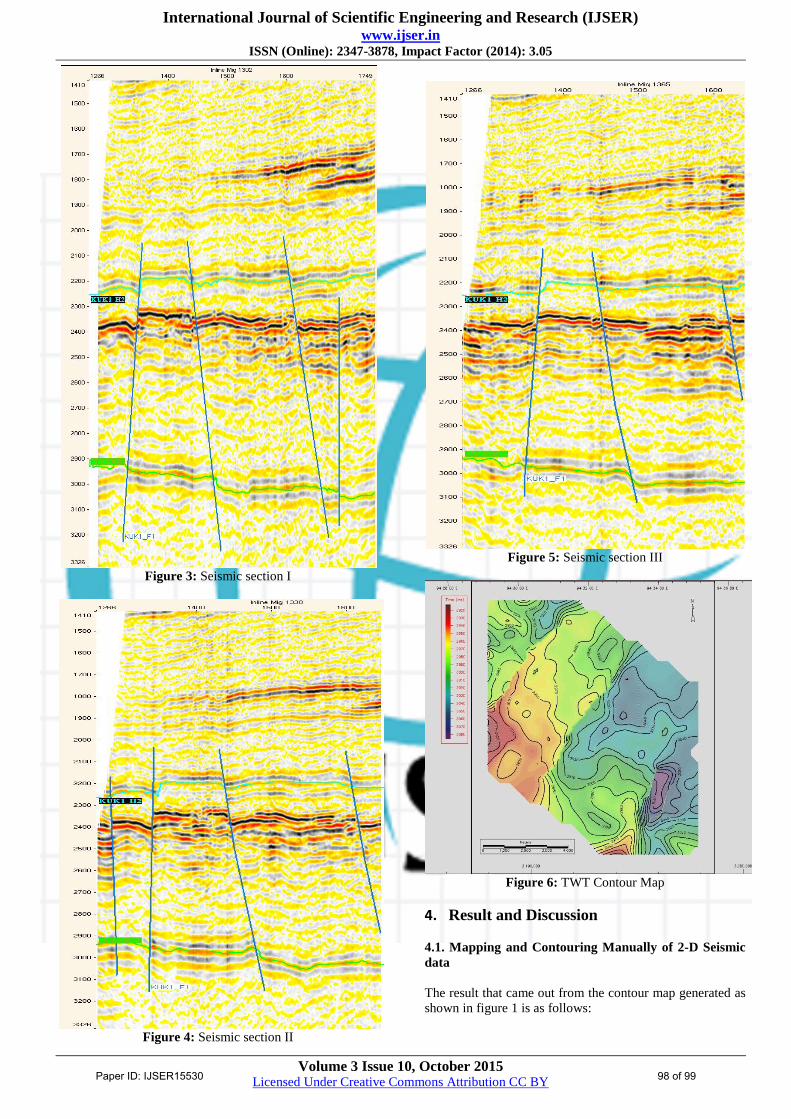
Three In-lines 1302, 1330 and 1365 were selected to plot
two horizons, one near the basement and the other at the top
of the Oligocene layer as shown in figures-3 to figure-5.
Once those horizons were picked its values were used in the
software to interpolate the horizons across the survey area
for plotting the Contour Map, as shown in figure 6.
Figure 2: Base map
Paper ID: IJSER15530 97 of 99
International Journal of Scientific Engineering and Research (IJSER) www.ijser.in
ISSN (Online): 2347-3878, Impact Factor (2014): 3.05
Volume 3 Issue 10, October 2015 Licensed Under Creative Commons Attribution CC BY
Figure 3: Seismic section I
Figure 4: Seismic section II
Figure 5: Seismic section III
Figure 6: TWT Contour Map
4. Result and Discussion
4.1. Mapping and Contouring Manually of 2-D Seismic
data
The result that came out from the contour map generated as
shown in figure 1 is as follows:
Paper ID: IJSER15530 98 of 99
International Journal of Scientific Engineering and Research (IJSER) www.ijser.in
ISSN (Online): 2347-3878, Impact Factor (2014): 3.05
Volume 3 Issue 10, October 2015 Licensed Under Creative Commons Attribution CC BY
a) In the present block area there was one tight anticlinal
closure in SE part of block.
b) The synclinal body corresponding to faulted anticline
present in the block lying in central part of the block.
c) A major fault, trending NE-SW was present. Also there
were two minor faults present in NNW part of block.
4.2. Interpretation of 3-D Seismic Data in Work Station
The result that came out from the contour map generated as
shown in figure 6 is as follows:
a) Interpretation of time structure map: trending NW-SW
b) Two major NE-SW faults have been observed with in the
block.
c) A fold closer has been observed against a fault trending
NE-SW.
d) A horst Feature is observed between the two faults.
e) Two way time of Horizon varies between 2930 to 3080
M.sec. This block shows low trends toward the western
part of the contoure map and also we see another small
low trend patch at the southern part of the map.
Acknowledgement
This study was a part of my dissertation work which was
performed at Director General Of Hydrocarbon (DGH),
Noida, and I am greatly obliged to Mr. B. J. Praveen
Kumar Senior Advisor (Geophysics), DGH Noida and Mr.
Rajedra Gahlawat Trainee Geoscientist, DGH Noida for
helping me complete my study and obtain a degree. I am
also grateful to Dr. S. S. Teotia and Dr. Bhagwan Singh
Chaudhray Professor, Department of geophysics,
Kurukshetra University for guiding me to prepare my
dissertation report work.
References
[1] Society of Exploration Geophysicists, 1966, (1967),
Mining Geophysics, v. 1, Case Histories; v. 2, Theory:
Tulsa, Society of Exploration Geophysicists, 492 p. (v.
1); 708 p., (v. 2). 1990, Geotechnical and
environmental geophysics, v. 1, Review and Tutorial;
v. 2, Environmental and Groundwater, in Ward, S.H.,
ed., Tulsa, Society of Exploration Geophysicists, 389
p., (v. 1); 343 p., (v.2)
[2] Hoover, D.B., Heran, W.D., and Hill, P.L., eds., 1992,
The geophysical expression of selected mineral deposit
models: U.S. Geological Survey Open-file Report 92-
557, 129 p.
[3] Moldoveanu, N., and Egan, M., 2006, From narrow-
azimuth to wide- and rich-azimuth acquisition in the
Gulf of Mexico: First Break, 24, 69-76
[4] Long, A., 2006, How multi-azimuth and wide-azimuth
seismic compare: First Break, 24, 55-61.
[5] Hastings-James, R., Green, P., Al-Saad, R., and Al-Ali,
M., 2000, Wide-azimuth 3-D swath acquisition:
GeoArabia, 5, 103
Author Profile
Kulbhushan received M.Tech degree in
Geophysics form Kurukshetra University, India
in 2008 and is also got a MBA on 2012 from
EIILM University Sikkim, India. Joined Fugro
Geoscience India Pvt. Ltd. as QC Processor
from September 2008 to November 2011.After that joined
ION-GX Technology from December 2011 to December
2014 as Senior Field Geophysicist. Presently working as
Senior Seismologist with AlphaGeo India Limited
Monalisa Mitra received B.Sc and M.Sc
degree in Geology with specialization in
Hydrogeology, Remote sensing GIS from
Burdwan University, India in 2009. Joined as
Project Assistant at Oceanography Department, Jadavpur
University and worked there till December 2010, later
joined West Bengal State Council of Science and
Technology, Department of Science and Technology,
Kolkata, Government of West Bengal as JRF. Presently
working as Project Assistant at Haryana Space Application
Center, India
Paper ID: IJSER15530 99 of 99