Embed Size (px)
Citation preview
BCG vaccination and its possible effects on the acceleration of incidence and mortality
by the new coronavirus: second step.
Carlos Eduardo Duarte* https://orcid.org/0000-0001-6671-0820
Guilherme Gaeski Passuello https://orcid.org/0000-0002-5547-3484
Raquel Almeida Lopes Neves https://orcid.org/0000-0003-2619-0036
Fernanda Cappi Santos Duarte https://orcid.org/0000-0001-6671-0820
Hospital Beneficência Portuguesa – Centro Avançado de Ritmologia e Eletrofisiologia – São
Paulo/SP - Brazil
*Corresponding author: [email protected]
ABSTRACT
Introduction: The pandemic caused by the new coronavirus brought difficulties to global
health and the economy. The race for an effective therapy to control the disease is launched,
and an understanding of the pathophysiology is necessary. The BCG (bacillus Calmette–
Guérin) vaccine activates and modulates innate immunity, and its protective effect against the
new coronavirus should be investigated. Objective: To compare the incidence, mortality, and
lethality rates of COVID-19 according to the vaccination program for BCG of the main
countries affected by the pandemic. Methods: The second of three phases of a data survey
was carried out from official sources on the number of cases and number of deaths by
COVID-19 between April 11 and May 11, 2020, and the incidence, mortality and lethality
rates were calculated and compared among predefined groups according to their BCG
vaccination programs. In the same way, the acceleration rate between the groups in the period
under analysis was performed. Results: Similar to the results found in the first phase in April,
the countries without an active BCG vaccine program had, on average, 3.96, 9.34, and 2.35
(p < 0.001) higher ratios in the incidence, mortality and lethality rates, respectively.
Conclusion: There is a protective connection between the presence of active BCG
vaccination programs and the number of cases and deaths per inhabitant in the countries
studied, showing a possible cross effect of innate immunity against the new coronavirus.
KEYWORDS: COVID-19, Coronavirus, BCG vaccine, Incidence, Lethality.

INTRODUCTION
The first lessons learned, the fruit of epidemiological information, regarding COVID-
19, are that the elderly with systemic atrial hypertension (SAH) and diabetes mellitus (DM) is
the main risk groups for an unfavorable outcome1. Descriptions of severe cases in young
people, adolescents, and adults without comorbidities2 sharpen other hypotheses.
The pandemic progress has been made from East to West, and the different mortality
and lethality rates in border regions need to be clarified3.
The response of the so-called innate immunity composed of macrophages,
lymphocytes (CD4+), and natural killers must be able to eliminate the virus4. The key to the
broad spectrum of different impacts in border countries, as well as among individuals with
similar exposures, should be found in how the immune system reacts to infection by SARS-
CoV-2. To this end, understanding the quality of the individual or collective innate response
is of paramount importance. For this purpose, the authors tried to correlate the epidemic
impact of different countries in three consecutive months with their vaccine status of BCG
(bacillus Calmette–Guérin), which acts mainly by activating or training innate immunity5.
HYPOTHESIS
Countries with expanded and continuous BCG vaccination status will have less
impact on COVID-19 incidence, mortality, and/or lethality rates compared to countries that
have abandoned or never had vaccination programs.
METHODOLOGY
Surveys of case numbers and deaths by COVID-19 were conducted between
December 31, 2019, and April 11, 2020, and between April 11 and May 11, 2020. The
countries selected for this survey were the same as those published in April 20206, this time
divided into eight groups for comparisons according to specific characteristics described
below:
Group 1.1: United States, Spain, and the United Kingdom = Countries chosen because
of their territorial proximity and vaccine situations different from those in group 1.2.
Group 1.2: Mexico, Portugal, and Ireland = Countries chosen because of their
territorial proximity and vaccine situations different from those in group 1.1.

Group 2.1: United States, France, Germany, Spain, Italy, United Kingdom, Belgium,
Iran, Switzerland, and the Netherlands = Countries that have vaccination programs for
specific groups only or have abandoned their programs.
Group 2.2: Mexico, Ireland, Portugal, Chile, Hungary, Poland, Turkey, South Korea,
Japan, Russia, Israel, Brazil, and Austria = Countries with existing BCG vaccination
programs.
Group 3.1: United States, France, Germany, Spain, Italy, United Kingdom, Belgium,
Iran, Switzerland and the Netherlands = Same group 2.1, repeated for comparison with the
countries in group 3.2.
Group 3.2: Mexico, Ireland, Portugal, Chile, Hungary, Poland, Turkey, South Korea,
Japan, Russia, Israel, Brazil, Austria, India, China = Countries from group 2.2 including
China and India.
Group 4.1: United States, Italy, Belgium, Netherlands = Countries from group 2.1 that
never had universal vaccination programs.
Group 4.2: France, Germany, Spain, United Kingdom, Iran, and Switzerland =
Countries from group 2.1 that have had vaccination programs but have discontinued them.
For the description of the profile of each group, the following measures were
presented: incidence (Eq. 1), mortality (Eq. 2), and lethality rates (Eq. 3). For each rate, the
confidence interval was calculated using the confidence interval method for proportions.
The incidents ratio obtained by dividing the incidence rates of the compared groups
was presented for the comparison of the interest groups. The mortality and lethality ratios are

also presented. To test the null hypothesis that the rates are equal between groups of interest,
the Z-test was used to compare proportions.
For analysis of the acceleration/inhabitant variable, the following descriptive
measures are presented: mean, standard deviation, median (q50), and quartiles (q25 and q75).
The groups at this stage were compared using the Mann–Whitney test to compare
independent groups.
The analyses were performed using the software R version 3.6.3, and a significance
level of 5% was considered.
RESULTS
The incidence, mortality, and lethality rates for each group were calculated, as shown
in Table 1. To facilitate the interpretation of results, incidence and mortality numbers are
presented based on 100,000 inhabitants and lethality numbers based on 100 cases.
Table 1. Descriptive table of groups regarding incidence, mortality, and lethality rates.
Group Population Cases Deaths Incidence
(CI 95%)
Mortality (IC
95%)
Lethality
(CI 95%)
1.1 441,473,267 1,807,931 139,182 409.522
(408.927;410.118)
31.527
(31.361;31.693)
7.698
(7.66;7.737)
1.2 141,725,718 85,836 6,076 60.565
(60.161;60.972)
4.287
(4.18;4.397) 7.079 (6.908;7.253)
2.1 771,322,365 2,613,735 227,038 338.864
(338.454;339.275)
29.435
(29.314;29.556) 8.686 (8.652;8.721)
2.2 843,964,174 721,850 26,582 85.531
(85.334;85.728)
3.15
(3.112;3.188) 3.682 (3.639;3.726)
3.1 771,322,365 2,613,735 227,038 338.864
(338.454;339.275)
29.435
(29.314;29.556) 8.686 (8.652;8.721)
3.2 3,582,014,174 876,628 33,513 24.473
(24.422;24.524)
0.936
(0.926;0.946) 3.823 (3.783;3.863)
4.1 417,844,066 1,662,214 125,218 397.807
(397.204;398.411)
29.968
(29.802;30.134) 7.533 (7.493;7.573)
4.2 353,478,299 951,521 101,820 269.188
(268.648;269.729)
28.805
(28.629;28.983)
10.701
(10.639;10.763)
CI: Confidence interval.
*Incidence and mortality calculated based on 100,000 inhabitants.
**Lethality calculated based on 100 cases.
Among the countries analyzed, those with no vaccination program in place had the
highest incidence and mortality rates (group 1.1) and the highest lethality (group 4.2). On the
other hand, the countries that have their programs in place presented lower incidence,
mortality, and lethality rates.

Table 2 presents the incidence, mortality, and lethality ratios for the pairs of groups to
be compared, as well as the p-value resulting from the hypothesis test for comparisons of two
proportions. Such a result indicates that there is a difference between all pairs of groups
compared.
Table 2. Comparative table with incidence, mortality and lethality ratios, and
respective p-values for comparisons of proportion.
Incidence
ratio p-value
Mortality
ratio p-value
Lethality
ratio p-value
Group 1.1 vs 1.2 6.762 < 0.001 7.354 < 0.001 1.088 < 0.001
Group 2.1 vs 2.2 3.962 < 0.001 9.345 < 0.001 2.359 < 0.001
Group 3.1 vs 3.2 13.846 < 0.001 31.461 < 0.001 2.272 < 0.001
Group 4.1 vs 4.2 1.478 < 0.001 1.040 < 0.001 0.704 < 0.001
The main comparisons between countries in the groups 2.1 and 2.2 or 3.1 and 3.2
support the central hypothesis of this work, generating higher incidence, mortality, and
lethality ratios in countries without vaccination programs. When comparing groups 1.1 and
1.2 (Table 3), for example, the incidence ratio indicates that the incidence in group 1.1 is
6.762 times higher than in group 1.2. Also, mortality and lethality are 7.354 and 1.088 times
higher in group 1.1 than in group 1.2, respectively. It can be seen that there was no difference
between acceleration/inhabitants in this comparison.
Table 3. Detailed measurements for accelerations by groups (group 1.1 vs. group 1.2).
Group 1.1 (n = 3) Group 1.2 (n = 3)
Mean SD Q50 Q25 Q75 Mean SD Q50 Q25 Q75 p-value
Last 30 days
Cases 0.25352 0.06546 0.28477 0.23153 0.29114 0.16779 0.16145 0.13180 0.07958 0.23800 0.70
Deaths 0.02949 0.00826 0.02535 0.02473 0.03218 0.01250 0.01279 0.00766 0.00525 0.01732 0.40
Apr 11 (G1) vs May 11 (G2)
Cases 0.03511 0.02564 0.02109 0.02032 0.04290 0.05066 0.04350 0.05489 0.03004 0.07339 1.00
Deaths 0.01176 0.01126 0.00991 0.00573 0.01687 0.00421 0.00362 0.00354 0.00226 0.00583 0.40
Tables 3, 4, and 5 present the descriptive measures for acceleration/inhabitants in the
interest groups, as well as the result of the interest groups comparison test. Table 4 shows the
results of the comparison between groups 2.1 and 2.2. It can be observed that there is
evidence of a statistical difference between accelerations in the last 30 days for both cases (p
= 0.008) and deaths (p = 0.001). Group 2.1 has mean and median acceleration values higher
than group 2.2. On the other hand, when comparing the acceleration up to April 11 in group
2.1 with the acceleration up to May 11 in group 2.2, it is observed that there is no evidence of
a difference between the accelerations of cases (p = 0.284). However, there is evidence of the
difference between the accelerations of deaths (p = 0.001), with the acceleration being higher
in group 2.1.
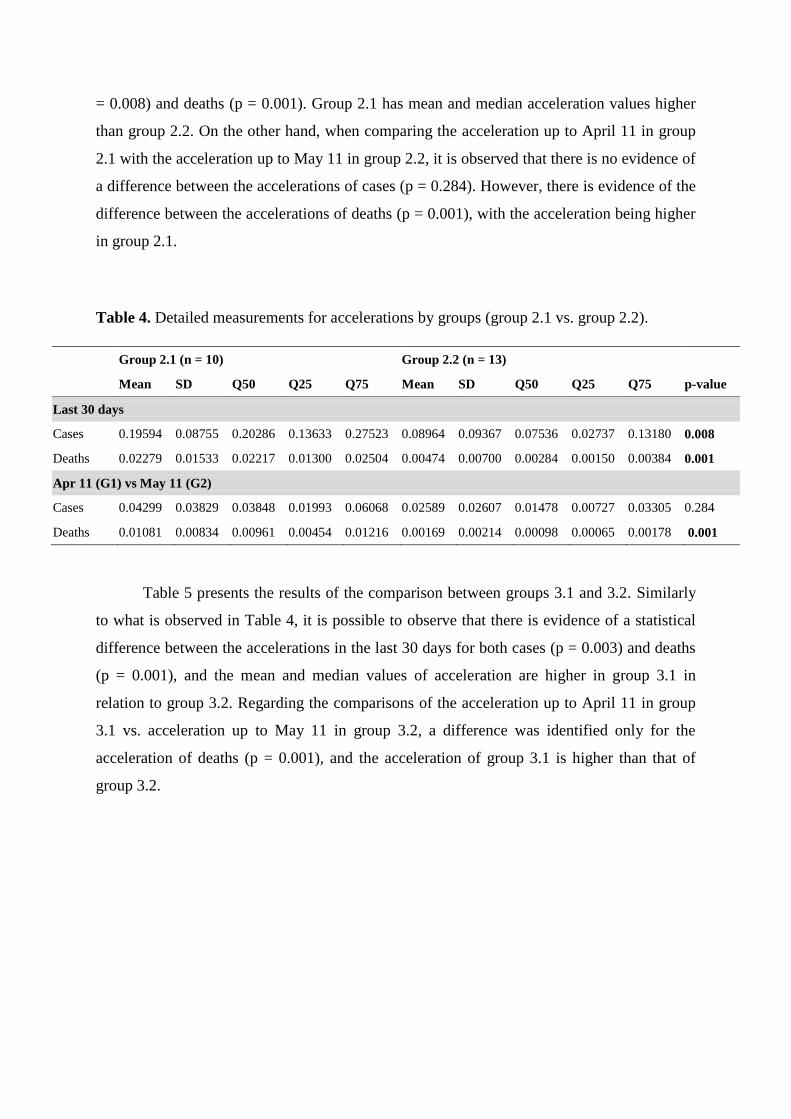
Table 4. Detailed measurements for accelerations by groups (group 2.1 vs. group 2.2).
Group 2.1 (n = 10) Group 2.2 (n = 13)
Mean SD Q50 Q25 Q75 Mean SD Q50 Q25 Q75 p-value
Last 30 days
Cases 0.19594 0.08755 0.20286 0.13633 0.27523 0.08964 0.09367 0.07536 0.02737 0.13180 0.008
Deaths 0.02279 0.01533 0.02217 0.01300 0.02504 0.00474 0.00700 0.00284 0.00150 0.00384 0.001
Apr 11 (G1) vs May 11 (G2)
Cases 0.04299 0.03829 0.03848 0.01993 0.06068 0.02589 0.02607 0.01478 0.00727 0.03305 0.284
Deaths 0.01081 0.00834 0.00961 0.00454 0.01216 0.00169 0.00214 0.00098 0.00065 0.00178 0.001
Table 5 presents the results of the comparison between groups 3.1 and 3.2. Similarly
to what is observed in Table 4, it is possible to observe that there is evidence of a statistical
difference between the accelerations in the last 30 days for both cases (p = 0.003) and deaths
(p = 0.001), and the mean and median values of acceleration are higher in group 3.1 in
relation to group 3.2. Regarding the comparisons of the acceleration up to April 11 in group
3.1 vs. acceleration up to May 11 in group 3.2, a difference was identified only for the
acceleration of deaths (p = 0.001), and the acceleration of group 3.1 is higher than that of
group 3.2.
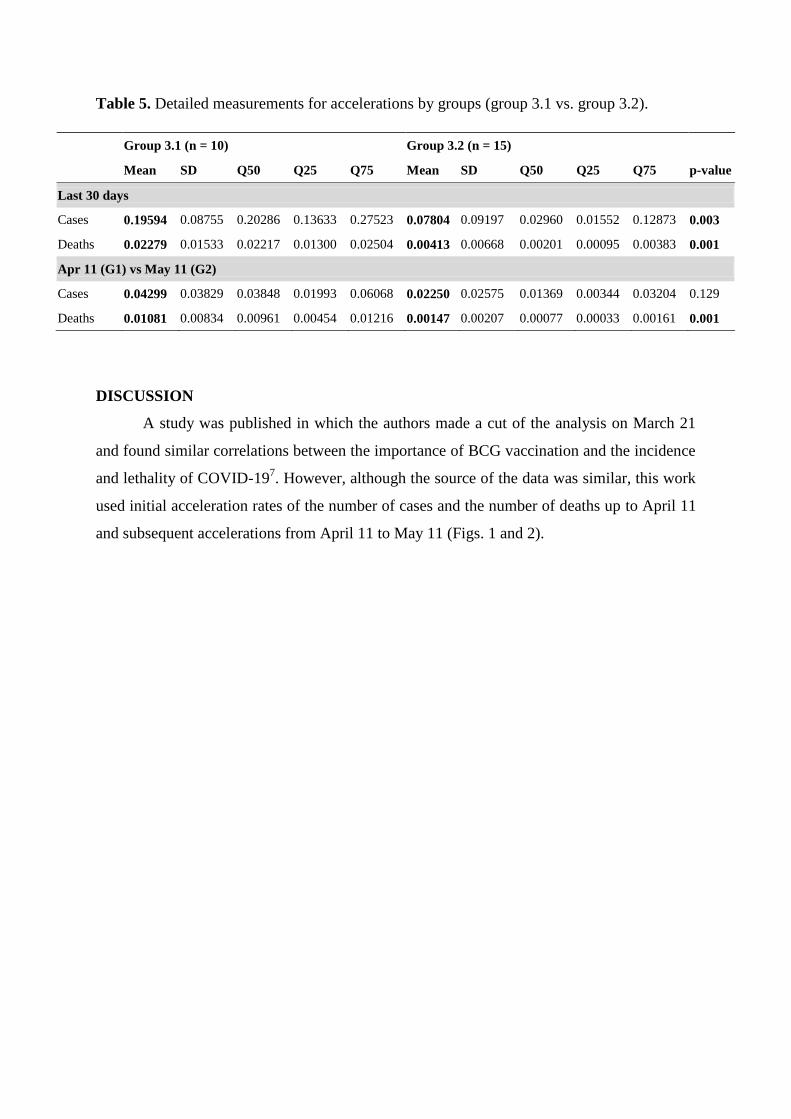
Table 5. Detailed measurements for accelerations by groups (group 3.1 vs. group 3.2).
Group 3.1 (n = 10) Group 3.2 (n = 15)
Mean SD Q50 Q25 Q75 Mean SD Q50 Q25 Q75 p-value
Last 30 days
Cases 0.19594 0.08755 0.20286 0.13633 0.27523 0.07804 0.09197 0.02960 0.01552 0.12873 0.003
Deaths 0.02279 0.01533 0.02217 0.01300 0.02504 0.00413 0.00668 0.00201 0.00095 0.00383 0.001
Apr 11 (G1) vs May 11 (G2)
Cases 0.04299 0.03829 0.03848 0.01993 0.06068 0.02250 0.02575 0.01369 0.00344 0.03204 0.129
Deaths 0.01081 0.00834 0.00961 0.00454 0.01216 0.00147 0.00207 0.00077 0.00033 0.00161 0.001
DISCUSSION
A study was published in which the authors made a cut of the analysis on March 21
and found similar correlations between the importance of BCG vaccination and the incidence
and lethality of COVID-197. However, although the source of the data was similar, this work
used initial acceleration rates of the number of cases and the number of deaths up to April 11
and subsequent accelerations from April 11 to May 11 (Figs. 1 and 2).
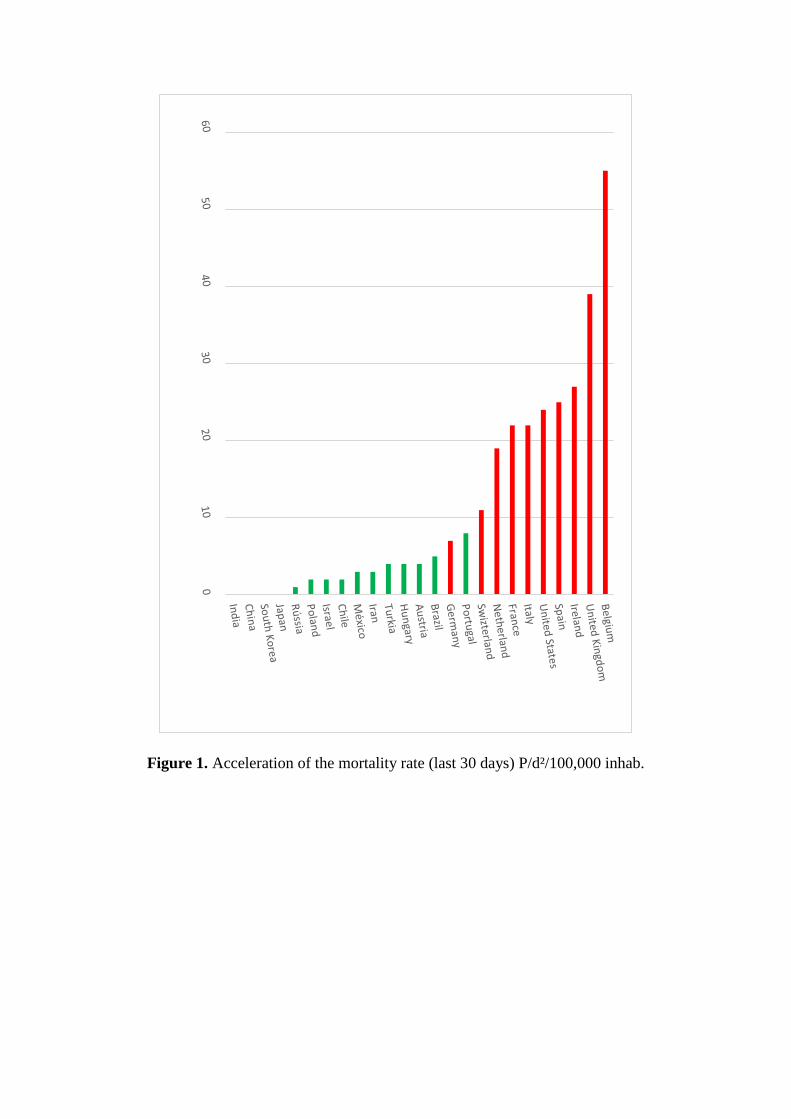
Figure 1. Acceleration of the mortality rate (last 30 days) P/d²/100,000 inhab.

Figure 2. Acceleration of the incidence rate (last 30 days) P/d²/100,000 inhab.
One of the biggest criticisms to the work published by this group regarding the first
phase of this work6 was that, in the analysis of April 11th, the highest incidence, mortality
and lethality rates of the groups of countries without an active program would be because
these countries were on average ten days ahead of the group of countries with an active
program. In this second phase, in order to minimize the time bias, the strategy adopted was to
compare the current data, from April 11 to May 11, of countries with active vaccination with
the data up to April 11 of countries without active vaccination. As a result, the average is now
20 days ahead of the possible bias of the previous work. Thus, Tables 3, 4, and 5 show that,
even though they advance in time, the countries in the active vaccination group remain with
the reasons for the higher rates. Data that refute the idea of temporal correlation and
maintenance of the same behavior of severity of the disease impact.
A randomized controlled Israeli study showed that the incidence was not different
among young people born three years before and three years after the interruption of their
vaccination program. The authors discuss that the results cannot be used to assess the impact
or severity of COVID-19. The conclusion of this study only reaffirms the results found here
because the accelerations of cases were not different in situations where the mortality and
lethality ratios were (Table 2). This fact reinforces the idea that the BCG vaccine does not
prevent the spread of the disease, but probably protects from a severe outcome8.
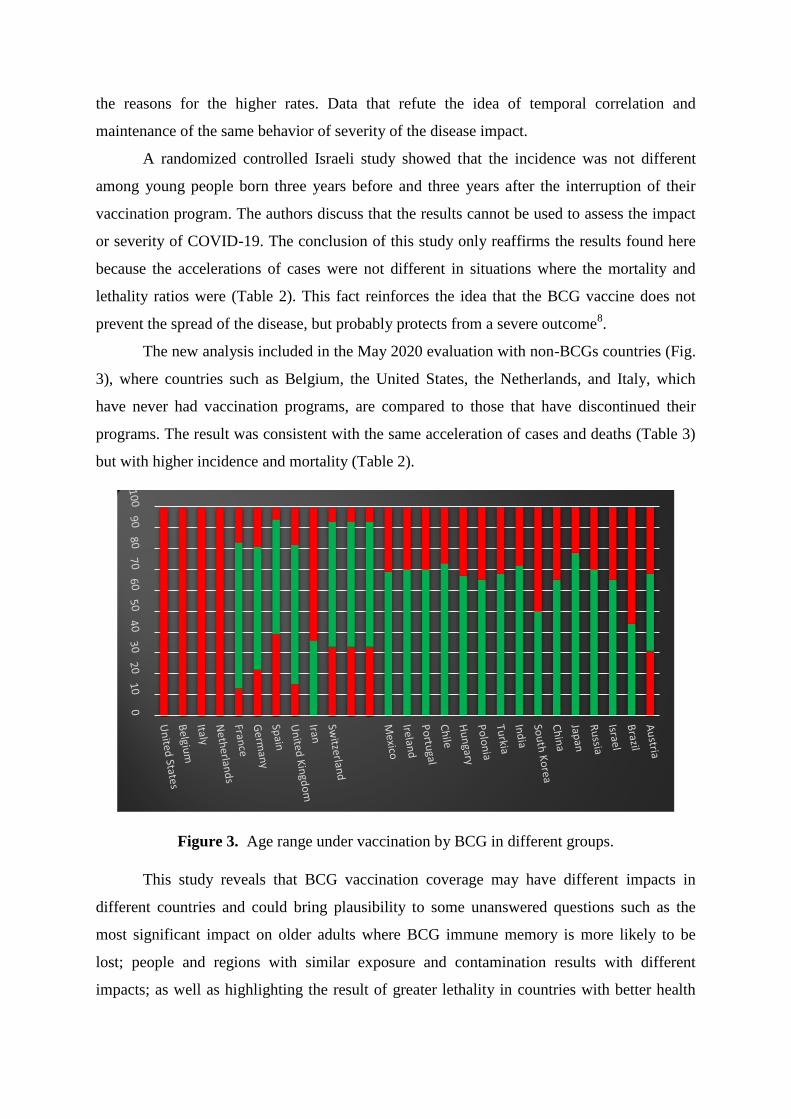
The new analysis included in the May 2020 evaluation with non-BCGs countries (Fig.
3), where countries such as Belgium, the United States, the Netherlands, and Italy, which
have never had vaccination programs, are compared to those that have discontinued their
programs. The result was consistent with the same acceleration of cases and deaths (Table 3)
but with higher incidence and mortality (Table 2).
Figure 3. Age range under vaccination by BCG in different groups.
This study reveals that BCG vaccination coverage may have different impacts in
different countries and could bring plausibility to some unanswered questions such as the
most significant impact on older adults where BCG immune memory is more likely to be
lost; people and regions with similar exposure and contamination results with different
impacts; as well as highlighting the result of greater lethality in countries with better health
system conditions and without vaccination coverage. A double-blind, randomized trial with
tuberculin test (PPD) as a vaccine memory parameter could be proposed for evidence
accumulation.
The central bias of the first paper published in April by this group was minimized
with the temporal correction in the evolution of the pandemic and, even with temporal
correction, a statistically significant difference in favor of countries with active BCG
vaccination coverage was evidenced.
CONCLUSION
The lower numbers of cases and deaths by COVID-19 in countries that have a BCG
vaccination program in place is instigating and biologically plausible. So far, with pandemic
numbers in progress, a correlation has been found between the coverage of such programs
and the number of cases and deaths in the countries studied over the two consecutive months.
Prospective and controlled studies should be stimulated quickly, as BCG may be the main
weapon for severe case prevention until a specific vaccine is developed.
REFERENCES
1. Huang C, Wang Y, Li X, Ren L, Zhao J, Hu Y, et al. Clinical features of patients infected
with 2019 novel coronavirus in Wuhan, China. Lancet. 2020;395(10223):497-506.
https://doi.org/10.1016/S0140-6736(20)30183-5
2. Sinha IP, Harwood R, Semple MG, Hawcutt DB, Thursfield R, Narayan O, et al. COVID-
19 infection in children. Lancet Respir Med. 2020. https://doi.org/10.1016/S2213-
2600(20)30152-1
3. COVID-19 Dashboard by the Center for Systems Science and Engineering (CSSE) at
Johns Hopkins University (JHU). [cited 2020 Apr 18]. Available at:
https://gisanddata.maps.arcgis.com/apps/opsdashboard/index.html#/bda7594740fd402994234
67b48e9ecf6
4. Abbas AK, Lichtman AH. Basic immunology: functions and disorders of the immune
system. Philadelphia: Saunders; 2011.
5. Netea MG, Joosten LAB, Latz E, Mills KHG, Natoli G, Stunnenberg HG, et al. Trained
immunity: A program of innate immune memory in health and disease. Science.
2016;352(6284):aaf1098. https://doi.org/10.1126/science.aaf1098

6. Duarte CE, Neves RAL; Duarte FCS; Passuello GG. BCG vaccination and its possible
effects on the acceleration of incidence and mortality by the new coronavirus: first step.
https://doi.org/10.1590/SciELOPreprints.117
7. Miller A, Reandelar MJ, Fasciglione K, Roumenova V, Li Y, Otazu GH. Correlation
between universal BCG vaccination policy and reduced morbidity and mortality for COVID-
19: an epidemiological study. medRxiv. Forthcoming 2020.
https://doi.org/10.1101/2020.03.24.20042937
8. Hamiel U, Kozer E, Youngster, I .
SARS-CoV-2 Rates in BCG-Vaccinated and
Unvaccinated Young Adults. JAMA. Published online May 13, 2020.
https://doi.org/10.1001/jama.2020.8189
Author's contribution: All authors contributed equally in the work.
Funding - Own funding
Conflict of interest: No conflict of interest.
Image consent - Not applicable
Ethics committee approval - Not applicable