Embed Size (px)
Citation preview

1
BEAUTY IS WEALTH: CEO APPEARANCE AND SHAREHOLDER VALUE
Joseph T. Halford and Hung-Chia Hsu*
This paper examines whether and how the appearance of chief executives officers (CEOs) relates
to shareholder value. We obtain a Facial Attractiveness Index of 667 CEOs based on their facial
geometry. CEOs with a higher Facial Attractiveness Index are associated with better returns
around their job announcements, and higher acquirer returns upon acquisition announcements.
To mitigate endogeneity concerns, we compare stock returns surrounding news dates with CEOs’
images to returns surrounding news dates without CEOs’ images. Facial Attractiveness Index
positively affects returns only around news dates with CEOs’ images. These findings suggest
that CEO appearance matters for shareholder value.
JEL classification: G30, G34
*Halford and Hsu are from University of Wisconsin Milwaukee. Halford’s contact information: [email protected],
Tel: (414)229-4160. Hsu’s contact information: [email protected], Tel: (414)229-4775.
Acknowledgement: We thank Hank Bessembinder, Mike Cooper, Mara Faccio, Elizer Fich, Paolo Fulghieri, Dan
Hamermesh, Karl Lins, Dick Marcus, Ron Masulis, Felix Meschke, Lilian Ng, Kelly Shue, Val Sibilkov, Rohan
Williamson, Jin Xu, and seminar participants at University of Wisconsin Milwaukee, 2014 SFS Finance Cavalcade,
2014 FMA Meetings, and 2015 AFA Meetings for their valuable comments. We also thank the program committee
of 2015 CICF Conference for accepting this paper. We especially thank Mara Faccio, Lilian Ng, and Dick Marcus
for their suggestions of the test using CEOs’ job announcement dates. All remaining errors are our own.

2
This paper examines whether and how chief executive officer (CEO) appearance relates to
shareholder value. Appearance is associated with various types of outcomes. It predicts
candidates’ election results (Todorov et al. (2005)), individuals’ income (Hamermesh and Biddle
(1994)), achievements, peer recognition (Kennedy (1990)), and even military ranks (Mazur et al.
(1984)). In the finance literature, appearance affects managerial compensation (Graham, Harvey,
and Puri (2014)), personal lending (Duarte, Siegel, and Young (2012); Ravina (2012)), and
hedge fund investments (Pareek and Zuckerman (2013)). However, the existing literature
examining the effects of appearance mainly focuses on individual outcomes. It is far less clear
whether and, in particular, through what channels appearance is related to group welfare, such as
shareholder value. In the context of the corporate world, given the importance of the CEO for a
company and the evidence that appearance matters in a variety of outcomes, CEO appearance
may affect shareholder value in some way(s).
To further assess whether and in what channels CEO appearance is associated with
shareholder value, we obtain a Facial Attractiveness Index of 667 CEOs of S&P 500 companies
based on facial geometry. 1 Since the time of ancient Greece, a person’s facial geometry,
including the golden ratio and facial symmetry, has been well documented as an objective
measure of beauty and attractiveness (Atalay (2004)).2 The relation between facial geometry and
attractiveness has thus become a significant research topic in the psychology and biology
1 In this study, we focus on the valuation effects of attractiveness instead of other appearance-based qualities, such
as competence and trustworthiness. 2 For example, an ABC News article titled “Britain’s 'Most Beautiful Face' Reveals Beauty Secrets” states that “The
formula for beauty devised by the ancient Greeks said that the distance from the eyes to the mouth should be one
third of the face.” (http://abcnews.go.com/blogs/lifestyle/2012/04/britains-most-beautiful-face-reveals-beauty-
secrets/)

3
literature. The evidence confirms that attractiveness is associated with facial averageness, 3
symmetry,4 golden ratio, and other geometry-based facial features.5
We obtain each CEO’s Facial Attractiveness Index from Anaface.com, a web-based
photo analysis application that computes a facial beauty score according to a person’s facial
geometry. The construction of this score is based on scientific research, various elements of
neoclassical beauty, and statistical analysis. Elements used to calculate the facial beauty score
include comparing innerocular distance to mouth width, and nose width to face height. For each
CEO we sample the facial beauty scores from Anaface.com six times, and then obtain the
average of these six scores as the measure of the Facial Attractiveness Index. To ensure the
validity of this facial attractiveness measure, we conduct surveys on the attractiveness of the
same sample of CEOs through Amazon’s Mechanical Turk (Mturk) service. 6 The Facial
Attractiveness Index is positively related to attractiveness ratings by survey respondents, even
after controlling for a number of CEO characteristics and facial traits.
Our findings are summarized as follows. First, more attractive CEOs are associated with
better stock returns around their job announcements, after controlling for a number of additional
CEO personality traits and skills, including facial width-to-height ratio (a proxy for facial
masculinity, which is documented to relate to a person’s testosterone levels), gender, age, tenure,
overconfidence, education, as well as CEO photo characteristics, such as whether the CEO wears
3 For studies on the relation between attractiveness and facial averageness, see Langlois and Roggman (1990),
Perrett, May, and Yoshikawa (1994), Rhodes and Tremewan (1996), Perrett et al. (1998), and Rhodes, Sumich and
Byatt, (1999), among others. 4 For the literature on the relation between attractiveness and facial symmetry, see Grammer and Thornhill (1994),
Rhodes, Proffitt, Grady, and Sumich (1998), Perrett, Burt, Penton-Voak, Lee, Rowland, and Edwards (1999),
Rikowski and Grammer (1999), Jones, Little, Penton-Voak, Tiddeman, Burt, and Perrett (2001), among others. 5 For the literature in this vein, see Shi, Samal, and Marx (2006), Schmid, Marx, and Samal (2008), and Pallet, Link,
and Lee (2010), among others. 6 Amazon’s Mturk service has been widely used in survey-based research. For example, Duarte, Siegel and Young
(2012) use surveys from Mturk to measure trustworthiness of potential borrowers in the setting of peer-to-peer
lending.
4
glasses and/or smiles in the photo. This effect appears to be economically significant: A ten
percent increase in a CEO’s Facial Attractiveness Index relates to a 1.18% increase in abnormal
returns within ten days surrounding the job announcement date. This result provides the initial
evidence that CEO appearance enhances shareholder value and that more attractive CEOs seem
to gain a “first impression” advantage in stock prices.
We then propose and test two channels through which CEO attractiveness matters for
shareholder value: negotiating and visibility. With regard to the negotiating channel, existing
evidence suggests that more attractive people receive better treatments when negotiating with
others, and/or are better communicators and negotiators; they thus receive a greater surplus in
negotiation (Chaiken (1979); Rosenblatt (2008)). We examine a key corporate event in which
interpersonal communications and negotiations are considered extremely important—mergers
and acquisitions (M&As). 7 We find a positive and significant relation between CEO
attractiveness and acquirer returns around merger announcement dates. In addition, we separate
the sample firms into high and low CEO attractiveness portfolios, and find that the positive
relation between attractiveness and stock returns persists for a period of even greater than one
year following the merger announcements. These findings support the argument that more
attractive CEOs enhance shareholder value through the negotiating channel.
With regard to the visibility channel, the psychology literature suggests that attractiveness
is likely to affect people’s perceptions (Berger et al. (1972)); further, the marketing literature
shows that more attractive product endorsers promote consumers’ purchase intentions (Kahle
and Homer (1985)). As CEOs are often perceived as the “face” of a firm, more attractive CEOs
are likely to create better images for the firm, thus enhancing shareholder value. To test the
7 The Wall Street Journal, August 21, 2006, “Best acquisitions start with charming CEO.” The article states, “There
is no substitute for establishing good personal rapport with sellers…As they see it, their biggest edge comes not
from what they do in the boardroom, but from getting on the road and wooing possible sellers.”

5
visibility channel, we examine stock price reactions to variations in the visibility of CEOs
surrounding news event dates.8 The test of the visibility channel also provides the empirical
benefits of mitigating potential endogeneity concerns, as the media nature of the sample allows
us to compare stock returns of the treatment group, i.e., news events with CEOs’ images, to those
of a control group, i.e., news events without CEOs’ images.
We test this channel in two different settings. First, we compare the effects of facial
attractiveness on stock returns around television news events with the CEOs’ images to the
effects of facial attractiveness on returns surrounding a matched sample of non-television news
events without the CEOs’ images. Second, we examine the difference in stock price reactions
between earnings announcement news containing CEOs’ photos and a matched sample of
earnings announcement news without the CEOs’ pictures.9 In both settings, CEO attractiveness
has a positive and significant impact on stock returns around news events when CEO images are
visible, but has no significant impact on stock returns around the matched samples of news
events without CEO images. These tests net out additional firm and CEO characteristics that
might confound the positive attractiveness-return relation and therefore help mitigate the
endogeneity concerns.
To further ensure the robustness of these findings, we use an alternative measure of CEO
attractiveness, i.e., the predicted value of survey-based CEO attractiveness based on a CEO’s
facial and photo characteristics.10 This predicted survey-based attractiveness gauges the fraction
8 This test builds on a large literature that documents the influence of media on stock returns. See Merton (1987),
Tetlock (2007), Kim and Meschke (2013), and Lou (2014), among others. 9 The benefits of using earnings announcement news are two-fold. First, comparing print (earnings announcement)
news with and without CEOs’ images alleviates potential concerns that visual correlates of CEO appearance (such
as body language) may otherwise drive the positive CEO attractiveness effects in the television sample. Second,
examining only earnings announcement news enables us to control for the magnitude of the news using measures
that proxy for unexpected earnings. 101010 In other words, we regress the survey-based attractiveness on the following variables: Facial Attractiveness
Index, facial width-to-height ratio, CEO race, whether the CEO smiles, baldness, whether the CEO wears glasses,

6
of survey respondents’ subjective ratings based on observable facial traits of a CEO and excludes
other factors that might affect the respondents’ ratings. We continue to find that more attractive
CEOs relate to better stock returns in all of the aforementioned analyses using this alternative
measure.
Our paper relates to the literature regarding the effects of CEOs on corporate outcomes.
Existing literature finds that manager fixed effects matter (Bertrand and Schoar (2003); Graham,
Li, and Qiu (2012); Coles and Li (2012)). Further, characteristics of CEOs, including gender
(Faccio, Marchica, and Mura (2012)), overconfidence (Malmendier and Tate (2005, 2008);
Malmendier, Tate, and Yan (2011)), psychological traits, attitudes (Graham, Harvey, and Puri
(2013)), affective states (Mayew and Venkatachalam (2012)), and their various abilities and
skills (Kaplan, Klebanov, and Sorensen (2012)) matter for firm investment and success. We
show that CEO attractiveness matters for shareholder value through two channels: negotiating
and visibility.
The present study also relates to the literature on whether and how news on corporate
events, revealed through different types of media, affects stock prices. Studies show that stock
returns can be predicted by the “tone” of news articles (Tetlock (2007), among others) and that
of social media such as Twitter (Chen, Hwang, and Liu (2015)). Focusing on the media effects in
television, Kim and Meschke (2013) find abnormal returns around CEOs’ interviews on CNBC.
In the context of mergers, Giglio and Shue (2014) show that the absence of news and the passage
of time following merger announcements contain information about the probability of merger
completion, which strongly predicts returns. Our findings suggest that, after controlling for news
whether the selected picture is in color, whether the selected picture is a professional photo. We then obtain the
predicted value for each CEO as the predicted survey-based attractiveness.

7
contents, factors unrelated to news themselves, such as the attractiveness of interviewees on
television, matter for stock returns. 11
The rest of the paper is organized as follows. Section I reviews related literature,
develops the hypotheses, and discusses the empirical strategies. Section II describes the data and
the construction of the Facial Attractiveness Index. Section III presents the main results. We
report robustness tests in Section IV. Section V concludes.
I. The Setting
A. Literature Review
The effects of attractiveness are a central issue in the sociology and psychology literature.
Studies along this line aim to address two main issues. First, do more attractive people receive
different perceptions and treatments from others than less attractive people (the perception story)?
Second, do more attractive people exhibit different characteristics (such as personality traits,
skills, and behavioral tendencies) than less attractive people (the characteristics revelation story)?
In answering the first issue, Status Characteristics Theory (Berger et al. (1972)) posits that
perceptions and expectations of other people are based on observable characteristics, which
reflect status in our society—race, age, sex, and attractiveness. Consistent with this theory, more
attractive people are perceived to have better abilities (Webster and Driskell (1978)), possess
greater social influences (Chaiken (1986)), are better recognized by peers (Kennedy (1990)),
receive better treatments in a variety of settings (Hosoda et al. (2003); Langlois et al. (2000)),
and are even viewed as less disturbing when they are maladjusted (Cash et al. (1977)).
In response to the second issue, a plethora of experimental studies suggests that more
attractive people show more socially desirable personalities (Adams (1977); Langlois et al.
11 Dougal, Engelberg, Garcia, and Parsons (2012) find that the style of journalists affect stock returns; Kim and
Meschke (2013) show that stock trading after CEO interviews on CNBC is positively related to attractive
anchorwomen and more male viewership.

8
(2000)), are better able to resist peer pressure (Adams (1977)), are happier (Hamermesh and
Abrevaya (2013)), more confident (Mobius and Rosenblatt (2006)), more optimistic (Chaiken
(1979)), and more intelligent (Kanazawa (2011)).
Based on the summary above, it is not surprising that the literature finds more attractive
people attaining better social and economic achievements, including better academic
performance (Jackson, Hunter, and Hodge (1995)), higher income (Hamermesh and Biddle
(1994)), and more favorable hiring decisions (Gilmore, Beehr, and Love (1986)).
A growing body of literature examines CEO appearance and/or facial features and their
implications for corporate outcomes. Using survey-based measures, Graham, Harvey, and Puri
(2014) find that more competent looking CEOs receive higher compensation, but don’t seem to
improve accounting performance such as return on assets (ROA). Rule and Ambady (2008, 2009)
also use survey-based measures for 50 CEOs from Forbes 500 Companies in 2006; they find that
more powerful-looking CEOs are associated with higher corporate profits.12 Using a different
geometry-based measure, Cook and Mobbs (2014) show that more attractive candidates are more
likely to be appointed as CEOs.
Our paper differs from these studies in the following aspects. First, both Graham, Harvey,
and Puri (2014) and Rule and Ambady (2008, 2009) show dominant effects of competent- and
powerful-looking CEOs on compensation and performance, where the present study documents
the significant effects of CEO attractiveness on shareholder value. Second, our paper
distinguishes two aforementioned mechanisms through which appearance affects individual and
social outcomes: the perception story and the characteristics revelation story. Specifically, the
visibility channel provides evidence of the perception story, while the negotiating channel is
12 Graham, Harvey, and Puri (2014) point out that the results from Rule and Ambady (2008) are hard to interpret
because they do not scale profitability by firm size.
9
consistent with both the perception story and the characteristics revelation story. We discuss
these two channels in more detail in Section I.B.
Recent literature suggests that a person’s facial masculinity, measured by the facial
width-to-height ratio, is indicative of his or her testosterone levels and affects certain behavioral
traits, including aggression, risk seeking, and dominant actions.13 Consistent with this view,
CEOs with a higher facial width-to-height ratio are more likely to deliberately misreport
financial statements (Jia, Lent, and Zeng (2014)), increase firm risks (Kim and Kamiya (2015)),
and are associated with better firm performance (Wong, Ormiston, and Haselhuhn (2011)). This
strand of literature lends further support to the characteristics revelation story, where our paper
presents evidence of the perception story as previously mentioned. Further, we don’t find Facial
Attractiveness Index to be significantly correlated with facial width-to-height ratios in this study;
controlling for the facial width-to-height ratio does not change the positive effects of CEO
attractiveness on shareholder value.
This paper also relates to the literature on the economic effects of individuals’ physical
attributes, such as height and body mass index. For example, Persico, Postlewaite, and Silverman
(2004) find that taller workers receive a wage premium; Addoum, Korniotis, and Kumar (2013)
show that individuals who are tall and of normal weight relative to their peers are more likely to
participate in financial markets and hold riskier portfolios. The existing literature along this line
focuses on the relation between physical attributes and individual outcomes. We examine a
special group of individuals—CEOs—and find evidence that an individual’s physical
attractiveness may also affect group welfare, such as shareholder value.
13 For example, facial width is associated with testosterone levels in men (Lafevre et al. (2013)), dominance
(Valentine et al. (2014)), aggressive behavior (Carré and McCormick (2008); Carré, McCormick, and Mondloch
(2009)), and unethical behavior (Haselhuhn and Wong (2012)), among others.
10
B. Hypothesis Development
The key question in this article is whether and how attractive CEOs enhance shareholder
value. In what follows, we develop several hypotheses that form the basis for the empirical tests.
The first hypothesis relates to the existence of the value enhancing effects of CEO
attractiveness. The study of stock price reactions around a CEO’s job announcement date
provides a natural starting point to gauge this effect for the following reasons. First, a new CEO
creates substantial uncertainty as investors are unsure about his or her ability to change firm
value (Pan, Wang, and Weisbach (2015)). Based on the aforementioned review of literature,
more attractive people may have, or are perceived to have, certain attributes and abilities that
create value. Therefore, investors may infer these attributes and abilities from a new CEO’s
appearance and make investment decisions accordingly. If CEO attractiveness is indeed factored
into investor assessments and thus affects shareholder value, we would expect this CEO
attractiveness effect on stock prices to exist around a new CEO’s job announcement date. More
formally:
Hypothesis 1 More attractive CEOs are associated with better stock returns around their
job announcement dates.
The above hypothesis discusses the existence of the value enhancing effects of CEO
attractiveness, if any. But a natural follow-up question is why CEO attractiveness is associated
with better shareholder value. The following two hypotheses aim to answer this question.
First, more attractive individuals appear to be, or are perceived to be, more effective
communicators (Chaiken (1986)) and negotiators (Rosenblatt (2008)); they receive a greater
surplus in negotiating games (Rosenblatt (2008)) and more fundraising success (Price (2008)),
possibly due to the acquisition of social skills developed through more positive attention from

11
parents, caregivers, teachers, and coworkers (Hatfield and Sprecher (1986); Langlois et al.
(2000)). Therefore, more attractive CEOs may enhance shareholder value through corporate
events in which interpersonal communications and negotiations are extremely important.
Mergers and acquisitions (M&As) provide an ideal setting for testing this negotiating channel for
the following reasons. First, M&As are considered to be important and even milestone corporate
events that significantly affect firm value. Second, large M&As demand CEOs’ considerable
involvement, which is an important factor in deciding the success of these deals. We therefore
hypothesize that more attractive CEOs create value for shareholders in M&As through the
negotiating channel:
Hypothesis 2 (Negotiating Channel): More attractive CEOs are associated with better
acquirer returns around the announcement of M&A transactions.
The second channel is related to the visibility of CEO attractiveness. The aforementioned
Status Characteristics Theory suggests that people are likely to form their perceptions and
expectations of an individual based on his or her attractiveness. Indeed, marketing literature
shows that more attractive celebrity product endorsers are positively associated with consumers’
purchase intentions (Kahle and Homer (1985)) and that buyer satisfaction is positively associated
with the sellers’ attractiveness (Campbell, Graham, Jolibert, and Meissner (1988)). CEOs are
often perceived as the embodiment of the firm and are indeed the principal corporate decision
makers. Therefore, more attractive CEOs may create better images not only for themselves but
also for the firm, thus enhancing shareholder value. A natural testing ground for this visibility
channel is the study of stock price reactions to CEOs’ appearance in the media. If, indeed,
visibility is an important channel for attractive CEOs to create positive images about the firm and

12
thus firm value, we should expect a positive relation between CEO attractiveness and stock
prices on days when the CEO’s image appears in the news. Therefore:
Hypothesis 3 (Visibility Channel): More attractive CEOs are associated with better stock
returns when the CEOs’ images appear in the news.
C. Empirical Strategies
As reviewed in Section I.A, existing findings on the effects of appearance support two
views, i.e., more attractive people receive different perceptions and treatments from others (the
perception story), and more attractive people exhibit different characteristics than less attractive
people (characteristics revelation story). In the context of this study, both views could explain
Hypothesis 1 and 2. For example, in the setting of M&A announcements, it is likely that an
attractive CEO charms negotiators of a target firm. Alternatively, he or she may be a better
negotiator, resulting in higher acquirer returns. In empirical testing, the second view raises
concerns for identification, as other CEO characteristics manifested by appearance, rather than
appearance itself, might drive shareholder value.
We provide two empirical strategies to mitigate the endogeneity issue. First, we control
for variables that proxy for several CEO characteristics that may confound the effects of CEO
attractiveness on stock returns; these variables include gender, age, tenure, overconfidence, race,
education, and facial masculinity. We also control for CEO photo characteristics, including
baldness, whether the CEO wears glasses in the photo, whether the CEO smiles in the photo, and
the type of the photo (i.e., color and/or professional photos). Second, we analyze differential
CEO attractiveness effects on stock returns between a treatment sample, which shows a CEO’s
image, and a control sample without the CEO’s image. The media nature of the sample for the
visibility hypothesis allows us to find a control group to conduct this test. Specifically, we
13
compare the effects of CEO attractiveness on stock returns around news events with the CEO’s
image (the treatment group) to those surrounding a matched sample of news events for the same
CEO, but without his or her image (the control group). This test is based on the assumption that
the unobservable firm and CEO characteristics driving the attractiveness-return relation have the
same effects across the two samples. Comparing these two samples nets out the effects of these
unobservable factors and thus helps mitigate the endogeneity concern.
The above empirical strategies have both strengths and weaknesses. On the plus side, we
are able to build a stronger causal link between CEO appearance and shareholder value through
the visibility channel (Hypothesis 3), which also supports the perception story. On the minus side,
we are limited in what we can establish about a causal relation between CEO appearance and
shareholder value for Hypotheses 1 and 2 due to the difficulty in obtaining valid counterfactuals
in testing these two hypotheses. Therefore, despite our effort to control for observable CEO
characteristics, tests for the first two hypotheses remain open to the possibility that CEO
appearance might be correlated with unobservable CEO and/or firm traits (such as genes) that
drive firm value.
II. Measure of CEO Attractiveness and Sample Description
In this article, we use different samples to test the aforementioned hypotheses on whether
and how CEO appearance relates to shareholder value. In what follows, we discuss how we
measure CEO attractiveness in Subsection A. We describe the sample used in each of the
different tests in Subsection B, including (1) the main sample of CEOs, and samples used to
study the CEO attractiveness effects around (2) job announcements, (3) M&A announcements,
(4) television news events, and (5) earnings announcement news events. We present descriptive
statistics in Subsection C.

14
A. Measuring CEOs’ Facial Attractiveness
The effects of perceived facial attractiveness have been well studied in the psychology
literature (Cunningham (1986); Cunningham, Barbee, and Pike (1990); Cunningham et al.
(1995)). A large body of this literature measures facial attractiveness based on ratings given by
survey respondents. Recently, biostatisticians have started to use facial geometry calculated from
standard images to measure facial attractiveness. For example, using neoclassical canons,
symmetry, and golden ratios, Schmid, Marx, and Samal (2008) take facial measurements from
different landmarks on the face and compute facial attractiveness scores accordingly.14 In this
paper, we calculate the Facial Attractiveness Index (FAI) of CEOs from Anaface.com, which
appears to use similar techniques to those used by Schmid, Marx, and Samal (2008). The
“Frequently Asked Questions” section on the website provides the following information with
respect to how it measures facial geometry:
[Anaface.com’s] specific algorithm is proprietary, but we take into account many factors
from neoclassical beauty, modern research papers, and our own scientific
studies/statistical analysis. Examples include things such as comparing innerocular
distance to mouth width and nose width to face height.
Anaface.com requires the user to upload a photograph to the website and place 17
different markers at different facial landmarks on the photograph (see Figure 1 for an example).
Anaface.com then scores each face based on its proprietary algorithm. As shown in Figure 1,
Anaface.com also provides some guidance on which factors contribute to the overall score:
Horizontal symmetry, the ratio of nose to ear length, the ratio of eye width compared to
innerocular distance, the ratio of nose width to face width, the ratio of face width to face height,
14 We contacted one of the authors in this study for the use of their measure, which was not readily available for
distribution.

15
and the ratio of mouth width to nose width. To ensure the validity and reliability of this measure,
for each CEO we sample the facial beauty scores from Anaface.com six times, and then take the
average of these six scores as our measure of Facial Attractiveness Index. 15
[Figure 1 goes here]
This geometry-based facial attractiveness measure provides the following advantages: (1)
this measure is based on facial geometry and excludes more subjective criteria such as eye color,
skin color, and complexion, and (2) this measure is easy to quantify using geometry and
mathematics.
This geometry-based measure also has limitations. The precision requirements of the
uploaded CEO photos include (1) sufficient resolution, (2) the CEO's face looking directly at the
camera, and (3) visibility of each of the facial landmarks required by Anaface.com.16 We collect
photographs for each of the 821 CEOs in our initial sample by conducting image searches on
Google.com. We are able to carefully select images for 667 of the 821 CEOs that satisfy the
requirement of Anaface.com’s algorithm. Nevertheless, potential measurement errors may still
occur, as certain facial traits and photo characteristic may distort the Facial Attractiveness Index.
For example, companies that have better M&A opportunities may also be those companies that
happen to circulate more professional CEO photos, potentially resulting in a higher Facial
Attractiveness Index due to better photo quality. In this case, the positive relation between Facial
Attractiveness Index and acquirer returns is spurious due to the non-random measurement error,
i.e., the CEO’s photo appears to be more formal and professional. To address these issues, in all
of the regression analyses, we control for several CEO facial traits and photo characteristics,
15 The authors along with four research assistants collected the scores; we conduct inter-rater reliability tests
(described in detail in Section IV.A) to ensure the measure is unaffected by individuals who take the measurements. 16 For example, one of the landmarks required by Anaface.com is the top of the CEO’s ears. This is especially
problematic for female CEOs with long hair styles.

16
including whether the CEO smiles in the picture (Smiling), whether the CEO is bald (Bald),
whether the CEO wears glasses (Glasses), whether the selected CEO picture is considered a
professional photo (Professional), and whether the CEO photo is in color (Color photo). In what
follows, we describe the samples and data sources in detail.
B. Sample
B.1. Main CEO Sample with Facial Attractiveness Index
The selection of our main sample begins with the intersection of the Execucomp Annual
Compensation file (Execucomp) and the Compustat North America Fundamentals Annual file
(Compustat). Both databases are available from Wharton Research Data Services.
Because we rely on Google.com’s image searches to compute the Facial Attractiveness
Index of CEOs, we restrict the sample period to be between 2000 and 2012 and include only
those firms that are in the S&P 500 index in Execucomp. These two screening procedures ensure
that (1) the CEO in question is more likely to be a public figure as he or she is leading a large
public company, and (2) images of the CEO are more likely to be available on the Internet
following 2000 after the Internet gained general popularity. These screens result in 821 unique
firm-CEO combinations. After eliminating observations with missing firm/CEO level data or
without valid CEO photos, the final sample consists of 667 CEOs. We further obtain these CEOs’
characteristics from Execucomp, including their age, tenure, gender, and starting and ending
dates on the job. Finally, companies’ stock price information comes from The Center for
Research in Security Prices (CRSP), and their accounting information comes from Compustat.
Appendix A provides definitions of variables used in this paper and their data sources.
17
B.2. Sample on CEO Job Announcements
To analyze whether more attractive CEOs are associated with better stock returns around
their job announcement dates as predicted in Hypothesis 1, we base our sample on the 667 CEOs
with FAIs (described in Section II.B.1) and hand-collect data on their job announcement dates
from two sources: LexisNexis and Proquest. From both databases we search all online and print
articles about CEO job announcements. In the vast majority of cases we are able to find unique
announcement dates; in cases where we find multiple report dates about a CEO’s job
announcement, we select the earliest report date as the announcement date.17 We further verify
these announcement dates using CEO profiles on Businessweek.com and Forbes.com. In
addition, we exclude interim CEOs, cases in which the CEO’s job announcement date is
confounded by another major corporate event such as divestitures or bankruptcies, and cases in
which the CEO is a founder. The final sample contains 486 job announcements of 485 CEOs
(out of the 667 CEOs with a Facial Attractiveness Index) between 1985 and 2012 from 287
firms.18 This sample is used in Table II.
B.3. Sample on Mergers and Acquisitions
Hypothesis 2 (the Negotiating Hypothesis) posits that more attractive CEOs are
associated with better acquirer returns around M&A announcements. To test this hypothesis, we
rely on acquirer information provided by the Securities Data Company (SDC) Mergers and
Acquisition Database. From this database we identify all acquisition announcements that
occurred during the tenure of the 667 CEOs in our main sample. We further exclude international
17 For each CEO we search Proquest and Lexis Nexis for the earliest announcement of the executive becoming the
CEO. For example, if an executive was being “groomed” to become the CEO, we use the “grooming”
announcement date as our announcement date. This procedure ensures that market was surprised by the
announcement of the successor. 18 We find one CEO who switches firms within the sample. Therefore, we have 485 CEOs with 486 job
announcement dates. Further, our sample contains CEOs who held their positions during 2000 to 2012, but the job
announcements of CEOs date back to as early as 1985. In the analyses we control for a number of CEO
characteristics, including age, tenure, and education, to address potential biases resulting from this backdating issue.
18
acquisitions, acquisitions in which the bidder acquired less than 50% of the target’s shares, and
transactions for which we cannot compute the ratio of transaction value to the bidder’s market
value of equity (the variable Transaction value). Finally, we exclude acquisitions in which the
transaction value is less than $5 million or the ratio of the transaction value to the bidder’s
market value is less than 5% to ensure that we capture M&As that have a material impact on the
firm and that require substantial CEO involvement. The final sample contains 591 M&As from
1985 to 2012 that are associated with 278 CEOs in 217 firms.19 This sample is used in Table III.
B.4. Sample on CEOs’ Television News Dates
Hypothesis 3 (the Visibility Hypothesis) posits that more attractive CEOs enhance
shareholder value through their appearance in the media. To test this hypothesis, we identify
television news events when the CEO or the image of the CEO appears on television by
conducting Internet searches using the video search function from Google.com. We further
restrict the search to only the news from CNBC.com. We search for each CEO by name and
record the headline and air date of each television news event. The availability of CEO television
news events on CNBC.com is limited prior to 2008, so we restrict our sample to appearances that
occurred between 2008 and 2012. We additionally require that each television news event air
during the CEO’s tenure.
To mitigate the endogeneity concerns for analyses on the television news sample, we
form a matched sample of non-television news events as the control group, i.e., news articles that
contain information on the same group of CEOs, but do not include any images of the CEOs. We
further restrict that these non-television news events occur within ten days before or after each
19 Our sample contains CEOs who held their positions during 2000 to 2012, but some CEOs in this sample started
their tenure as early as 1985. Since we trace all M&A transactions that occur during a CEO’s tenure, we include
these transactions from 1985. Again, in the analyses we control for additional CEO characteristics to address
potential biases resulting from this backdating issue.

19
CEO television news event date. To identify the non-television news events that involve the
same group of CEOs, we search Proquest’s ABI/Inform Complete by CEO name and company.20
To ensure that our print news event is not a transcript from television news, we exclude news
articles that have the following keywords: “CNBC,” “Bloomberg,” “CBS,” “Fox News,”
“MSNBC,” “CNN,” “ABC,” “NBC,” “TV,” “tv,” or ”television” in the headline, abstract,
copyright, or publication title. We further hand-check the remaining print news events to make
sure they are not television transcripts. We then carefully review each television and print news
event, remove those that are unrelated to the CEO in question, and exclude print news articles
with CEO images. To ensure that the effects of the visibility of CEOs’ attractiveness are not
contaminated, we exclude those television (print) news events that occur within +/- 1 day of the
print (television) news event. Our final sample of “clean” television (print) news events contains
801 (914) observations. The samples of both television and print news events are used in Panel
A of Table V.
We also control for the effects of news content on stock returns around both the
television and print news events. Specifically, we classify the content of each news event into 12
categories—investment, mergers and acquisitions, earnings, financial policies, personnel, legal,
company, product, political, industry, international, and other—and control for these news
content dummies in the analyses. Finally, using major sports event days as a source of exogenous
variation, we control for potential selection bias that CEOs with higher FAIs are selected into
television or print news events. We further discuss this robustness test in Section IV.D.
20 Proquest’s ABI/Inform Complete is a comprehensive database of news stories including newspapers, magazines,
news wires, annual reports, and scholarly reports. We eliminate annual reports and scholarly reports from our
searches.

20
B.5. Sample on Earnings Announcement News
We further use earnings announcement news with and without CEOs’ photos to ensure
the robustness of the results on the Visibility Hypothesis. We first obtain all quarterly earnings
announcement dates during the CEO’s tenure from I/B/E/S. We then use the image search
function from Google.com to identify whether a CEO’s image appears in the print earnings
announcement news. We are able to identify 122 earnings announcement news dates with CEOs’
images from 2000 to 2012.
We also form a control sample of earnings announcement dates without the CEO’s image
appearing in the news; the control sample is matched based on the same quarter of the prior year
to the treatment sample.21 Both the samples of earnings announcement news are used in Panel B
of Table V.
The advantages of using earnings announcement news are two-fold. First, by examining
the differential effects of CEO appearance using only print news with and without CEOs’ images,
we address potential concerns that visual correlates of CEO appearance might otherwise drive
the positive FAI effects on television. Second, by focusing on earnings announcement news, we
are able to control for the magnitude of the news using measures that proxy for unexpected
earnings.
C. Summary Statistics
Panel A of Table I reports the summary statistics. We present the descriptive statistics of
the main sample (discussed in Section II.B.1) in Panel A1 and descriptive statistics of the
remaining samples (discussed in Sections II.B.2 to II.B.5) in Panel A2. The average Facial
Attractiveness Index (FAI) in the main sample is 7.25 out of a maximum score of 10. The
21 In unreported results we also match to all other quarterly earnings announcements in the same year
unaccompanied by a photo in print news. The results are not materially different.
21
average FAI ranges between 7.17 and 7.29 across samples of CEO job announcements, M&A
announcements, television/print news events, and earnings announcement news events. The
average firm size (proxied by market value of equity) ranges from $16.2 billion to $50.8 billion
across different samples, reflecting our sample selection criteria that focus on large U.S. public
companies.
Certain types of firms or firms in certain industries may tend to select more attractive
CEOs, raising concerns that the effects of FAI on shareholder value are confounded by other firm
characteristics. For example, larger companies or companies with worse performance may have
more resources or incentives to hire more attractive CEOs. To mitigate this concern, Panel B of
Table I presents regression results of the natural logarithm of FAI as the dependent variable on
the firm-specific control variables in each of the aforementioned samples. We do not find FAI to
be consistently correlated with these firm characteristics—firm size, firm value (proxied by the
market-to-book ratio), stock returns, and leverage ratios—across different samples. In unreported
results, we do not find FAIs to be significantly different by industry either. Finally, in all of the
analyses of the effects of FAI on shareholder value, we control for these firm characteristics to
alleviate concerns that differences in size or other firm characteristics may be omitted variables
causing the differences in stock returns.
In Panel B (Table I) we also examine the relation between FAI and a variety of CEO
characteristics, including facial width-to-height ratio, gender, age, tenure, overconfidence, talent,
educational background and race. We measure a CEO’s facial width-to-height ratio (fWHR) as
the distance between the two zygions relative to the distance between the upper lip and the
highest point of the eyelid. We use the ImageJ software (Rasband (2008)) provided by the
22
National Institutes of Health to obtain fWHR for each CEO in our sample.22 In addition, CEO
overconfidence is well documented to affect a variety of corporate outcomes (Malmendier and
Tate (2008); Campbell et al. (2011); Hirshleifer, Low, and Teoh (2012), among others). We thus
follow Hirshleifer, Low, and Teoh (2012) and measure CEO overconfidence using OC67, an
indicator variable that takes the value of one if the CEO has options more than 67% in-the-
money at least two times during his or her tenure, and zero otherwise. Further, we follow Falato,
Li and Milbourn (2011) and Custódio, Ferreira, and Matos (2013) and measure CEO talent using
an Ivy League dummy—an indicator variable that takes the value of one if the CEO attended an
Ivy League school at any academic level. We also include an MBA dummy that takes the value
of one if the CEO earned an MBA degree to measure the CEO’s educational background. Again,
we do not find these CEO characteristics to consistently affect FAI across the samples. Finally,
in Panel B (Table I), to eliminate potential measurement errors pertaining to FAI, we also control
for CEO facial traits and photo characteristics discussed in Section II.A—Smiling, Bald, Glasses,
Professional, and Color photo. Once again, in all later analyses on the effects of FAI on
shareholder value, we control for these CEO characteristics as well as the facial traits and photo
characteristics variables.
[Table I goes here]
III. Empirical Results
In Section I we develop three hypotheses on the impact of CEO attractiveness. Those
hypotheses are tested in this section. We analyze the effects of FAI on shareholder value around
CEO job announcements in Subsection A. We examine the CEO attractiveness effects around
22 The mean fWHR in our sample is 2.18, which is similar in magnitude to what Jia, Lent, and Zeng (2014) report
(2.01).

23
M&As in Subsection B. We investigate how FAI affects stock returns around news events in
Subsection C. We discuss alternative explanations for these results in Subsection D.
A. CEO Attractiveness and Stock Returns around CEO Job Announcements
Hypothesis 1 states that firms with more attractive CEOs receive better stock price
reactions around their job announcement dates. Table II presents regressions of cumulative
abnormal returns surrounding the CEO job announcement dates on the natural logarithm of FAI
(Log(FAI)). To ensure the robustness of the results, we analyze multiple event windows from
event window (-2, 2) to event window (-5, 5). Abnormal returns are calculated using the market-
model estimated over 255 trading days while ending 46 trading days before the event date.
FAI has a positive and significant impact on stock returns surrounding the announcement
dates. Moreover, this effect appears to be economically significant: For the (-5, 5) event window,
a ten percent increase in FAI results in a 1.18% increase in stock returns. These findings suggest
that shareholders perceive more attractive CEOs to be more valuable.23
In Table II we further extend the analysis to longer event windows, starting from five
days before to 60 days after the announcement dates. FAI continues to have a positive and
significant impact on stock returns. Further, the economic significance grows even larger with a
longer event window: A ten percent increase in FAI corresponds to a 1.90% increase in stock
returns for the event window (-5, 60).
In Table II, we control for a number of firm, CEO, and photo characteristics, which we
discuss in Section II.C. The coefficients on FAI remain positive and significant after controlling
for these characteristics.
23 In all of the analyses, the results do not materially change when we replace Log(FAI) with FAI as our main
explanatory variable; the results are also robust to Winsorization at the top and bottom 1% of Log(FAI) and FAI.

24
The effects of FAI could also be confounded by the nature of CEO turnover, such as
whether (1) the new CEO is selected within or outside the company, (2) the company in question
hires a new CEO who used to be an executive from another company (i.e., the new CEO is
raided from another company), (3) the former CEO is forced to leave, and (4) there exists a
period of power vacuum between the former CEO’s departure and the new CEO’s announcement
(called marathon succession). To control for these potential confounding effects related to CEO
turnovers, all models of Table II include four dummy variables, namely, Internal, Raided,
Forced and Marathon. Once again, controlling for these potential confounding variables does not
affect the significance of the FAI effects.
[Table II goes here]
B. CEO Attractiveness and Acquirer Returns
The results reported in Section III.A suggest that more attractive CEOs are associated
with better stock returns around the job announcement dates, but they do not reveal why more
attractive CEOs enhance shareholder value. In this section, we test the Negotiating Hypothesis
by examining the effects of CEO attractiveness on acquirer returns in M&As. We report results
on the short-term price reaction around mergers announcement dates in Section III.B.1. We
further present the long-term stock performance results following the mergers announcements in
Section III.B.2.
B.1. Short-term Price Reaction
Table III shows regression results of abnormal acquirer returns surrounding the M&A
announcements on Facial Attractiveness Index. As in Table II, we also use multiple event
windows to assess the robustness of the results. Consistent with the Negotiating Hypothesis, we
find a positive relation between the acquirers’ stock returns and Log(FAI) surrounding the M&A

25
announcement dates. Specifically, a ten percent increase in FAI creates a 1.27% increase in
acquirer returns for the event window from five days before to five days after the merger
announcement, and a 1.82% increase when we expand the event window from five days before
to 60 days after the announcement.
The positive effects of FAI around M&A announcements could be confounded by other
firm characteristics variables. For example, Betton, Eckbo, and Thorburn (2008) find that firm
size and whether the target firm is publicly listed or not are two important determinants in
explaining acquirer returns in M&As. In Table III we control for these variables. Consistent with
Betton, Eckbo, and Thorburn (2008), acquirers of public targets have lower announcement
returns. More important, controlling for these factors does not affect the significance of the FAI
effects.
The positive effects of FAI could be confounded by the anticipation that an M&A deal
will be announced or not. Specifically, if the probability that the deal will be announced is
somehow correlated with FAI, this correlation may render unreliable estimates of the positive
FAI effects on acquirer returns. We address this concern by including Initial bid, a proxy for the
anticipation of merger announcements (Cai, Song, and Walkling (2011)). Initial bid is a binary
variable that takes the value of 1 if no other bids have occurred in the bidder’s industry over the
prior 365 days. Controlling for initial bids does not alter the positive FAI effects on acquirer
returns.
[Table III goes here]
B.2. Long-term Stock Performance
The results presented in Table III reveal a positive and significant relation between CEO
attractiveness and acquirer returns around M&A announcement, consistent with the Negotiating

26
Hypothesis. These results raise a follow-up question: How persistent are the CEO attractiveness
effects following the merger announcements? If more attractive CEOs indeed negotiate better
M&A deals, we would expect the CEO attractiveness effects to persist for even longer periods,
as existing studies document significant long-term performance impacts of M&As.24 To see this,
we separate the sample firms into two portfolios—high and low FAI portfolios—based on a
median split of CEOs’ FAI. We then compare the post-merger long-run stock performance of
each portfolio.
Table IV reports the results. We calculate two measures of long-run stock returns for
each portfolio: buy-and-hold abnormal returns (relative to size and book-to-market benchmark
portfolios), and monthly (calendar-time) factor-adjusted abnormal returns. These factors include
the three factors introduced by Fama and French (1992) and the momentum factor introduced by
Carhart (1997). We find that, following the M&A announcements, acquiring firms in the high
FAI portfolio outperform those in the low FAI portfolio by 4.7% in buy-and-hold abnormal
returns in the six-month window, and up to 15.5% in the two-year window. This difference is
statistically significant at the 10% level or lower. In terms of calendar-time abnormal returns, the
high FAI portfolio outperforms the low FAI group by 1% in monthly alphas (or 12% in annual
abnormal returns) in the six months following the M&A announcements, and by 0.7% (or 8.4%
in annual abnormal returns) within twelve months. Overall, the findings suggest that more
attractive CEOs create greater long-term values for shareholders through the negotiating channel.
[Table IV goes here]
24 In unreported tests, we do not find significant long-run effects of CEO attractiveness following their job
announcements as well as news events (to be discussed in Section III.C).

27
C. CEO Attractiveness and Stock Returns around News Events
C.1. Television News versus Non-television News
This subsection explores whether more attractive CEOs improve shareholder value
through public appearance (Hypothesis 3: The Visibility Hypothesis). The first test examines
whether CEO attractiveness positively affects the stock returns around television news
broadcasts with his or her presence or images. The nature of the news samples allows us to find a
control group to mitigate potential endogeneity issues. In particular, we form a matched sample
of non-television news events, i.e., news articles that contain information on the same group of
CEOs but without any image of these CEOs. Comparing the effects of CEO attractiveness on
stock returns surrounding the television news events to those around the matched non-television
event dates nets out the effects of unobservable firm and\or CEO characteristics. In addition, if
the visibility of more attractive CEOs enhances shareholder value through the visibility channel,
we would expect FAI to have an insignificant effect on stock returns around the matched non-
television news days.
Panel A of Table V presents the OLS regressions of abnormal stock returns surrounding
the news announcements on Log(FAI) for multiple event windows (Models (1) to (10)). The
relation between stock returns and Log(FAI) is positive and statistically significant on both the
television news day (0,0) and the (-1,1) event window surrounding the television news event
(Models (1) and (2)), while the relation between stock returns and Log(FAI) on the print news
days or on the (-1,1) event window around the print news event is insignificant (Models (6) and
(7)).25 In Panel A (Table V) we also examine the effects of CEO attractiveness on television
news days using longer event windows. We don’t find FAI to significantly affect stock returns on
25 We use a Wald test and find statistical significance of the difference between the marginal effect of Log(FAI) on
television and print news days; however, Wald test fails to show statistical significance of the difference between the
marginal effect of Log(FAI) in Models (2) and (7) of Table V, respectively.

28
these longer event windows. 26 Overall, the evidence suggests that shareholders respond
positively to viewing more attractive CEOs, consistent with more attractive CEOs improving
shareholder value through the visibility channel.
In models (1) to (10) we include the same control variables that proxy for firm and CEO
characteristics as in the previous analyses. In addition, it is well documented that news content is
an important factor determining the effects of media on stock returns. To control for the effects
of news content on stock returns around these selected CEO news events, we carefully review
and classify the content of each news event into 12 categories as mentioned in Section II.B.4.
The effects of FAI on stock returns around CEO television news days remain positive and
significant after controlling for news contents.
Finally, it is likely that the selection of television news against news articles may invite
bias toward certain firm characteristics and/or news content. In Model (11) of Panel A (Table V),
we report the results of a probit regression in which the dependent variable is equal to one if the
CEO news event appears on television and zero if it appears on news articles. We don’t find the
same set of explanatory variables to significantly affect the selection of CEO news into television
as opposed to print articles, thus reducing concerns surrounding this selection bias. We provide
further robustness tests for this selection bias in Section IV.D.
C.2. Earnings Announcement News with and without CEO Images
In Section III.C.1 we find positive and significant effects of CEO attractiveness on stock
returns surrounding the television news events, but insignificant results around a matched sample
of non-television news dates. Two potential concerns arise with these findings. First, the positive
26 To ensure that our facial attractiveness measure does not represent an unobservable, time-invariant factor that may
drive the above result, in an unreported analysis we also investigate the effect of Log(FAI) on the abnormal returns
in the (-1,-1) event window. FAI does not significantly affect the stock returns on the date before both the television
and print news events, thus greatly reducing the possibility that CEO attractiveness might proxy for some
unobservable factor(s).
29
FAI effects could be driven by the visual correlates of CEO appearance on television, such as the
CEO’s body language and the eloquence of his or her speaking. Second, it is likely that the
magnitude of news that appear on television is very different from the magnitude of news that
appears on the print news media, potentially due to the higher marginal costs of producing and
airing news on television. In this case, the positive FAI effects on television could simply reflect
the magnitude of the news instead of CEO appearance. The comparison of the CEO
attractiveness effects between television news and print news could thus be mis-specified.
To address these two concerns, we re-examine the effects of FAI on stock returns based
on the print news on the earnings announcement dates. Specifically, we compare the difference
in stock price reactions between earnings announcement news with CEO image and a control
sample of earnings announcement news without the CEO’s picture, where the control sample is
matched to the treatment sample based on the same quarter in the prior year. By restricting the
samples to print news with and without CEO images, we are able to limit the confounding effects
of visual correlates that may drive the positive FAI effects on stock returns. Further, by focusing
only on the earnings announcement dates, we examine the CEO attractiveness effects based on a
unique news type—earnings announcement, and control for the magnitude of the news using
standard measures of unexpected earnings, thus addressing any concerns that the treatment and
control samples are very different in both the content and the magnitude of the news. We follow
Mayew and Venkatachalam (2012) and calculate unexpected earnings (UE) as the difference
between actual I/B/E/S earnings per share and I/B/E/S analyst summary consensus median
earnings per share scaled by price per share two days before the announcement.
Panel B of Table V reports OLS regressions of abnormal stock returns surrounding the
earnings announcements on Log(FAI) for multiple event windows (Models (1) to (10)). The

30
relation between stock returns and Log(FAI) continues to be positive and statistically significant
in the event windows (-1,1), (-2,2), and (-3,3) surrounding the earnings announcement dates with
CEO image, while the relation between stock returns and Log(FAI) on earnings announcement
dates without CEO pictures remains insignificant across all event windows.27 In Panel B (Table
V) we also include the same control variables as in the previous analyses and unexpected
earnings (UE) to control for the magnitude of the earnings news. Overall, the results in Panel B
(Table V) further support the positive and significant effects of FAI on shareholder value through
the visibility channel.28
Finally, in Model (11) of Panel B (Table V), we also report the results of a probit
regression in which the dependent variable takes the value of one if the news event is earnings
announcement with a CEO image and zero if the news event is earnings announcement without
the CEO’s image. Again, the explanatory variables do not significantly affect the selection of
CEO news into earnings announcement news with and without CEO pictures, reducing concerns
surrounding this selection bias.
[Table V goes here]
D. Alternative Explanations
The results discussed in Section III.B support the negotiating channel, i.e., more
attractive CEOs charm negotiators of the target firms into receiving more favorable terms (the
perception story) and/or possess better negotiating ability (characteristics revelation story), thus
27 As in Panel A of Table V, we use the Wald test and find a statistically significant difference in the marginal effect
of Log(FAI) on earnings announcement news with and without CEO image in the (-1,1), (-2,2) and (-3,3) event
windows. 28 For comparison purposes, in an unreported test we find that a one-standard deviation increase in FAI results in
2.08% increase in stock returns in the (-2,2) event window surrounding the earnings announcement with CEO
photos. The magnitude of the FAI effect in this setting appears economically significant compared to the existing
literature on earnings announcements. For example, Mayew and Venkatachalam (2012) report that a one-standard
derivation increase in the CEO affective states measure relates to 0.40% increase in stock returns using a (0,1) event
window.

31
enhancing acquirer returns around and after mergers announcements. On the other hand, as
discussed in Section I.C, the lack of valid control samples leaves room for alternative
explanations unrelated to the negotiating channel. For example, more attractive CEOs may
possess certain characteristics and abilities to better source the deal, or they are better (worse) at
keeping good (bad) mergers a secret. These alternative explanations point to a CEO’s
intelligence, ability or behavioral traits revealed through his or her attractiveness. Although we
control for various CEO characteristics variables (such as education (Ivy and MBA) and fWHR),
we recognize that these variables might not be perfect measures of the CEO’s specific talents or
abilities in these alternative explanations. We therefore do not claim that the negotiating channel
provides the only explanation for the attractiveness effects on acquirer returns.
For results discussed in Section III.C, tests on the visibility channel are consistent with
the perception story, i.e., the visibility of more attractive CEOs in the news leads to better stock
returns. An alternative explanation consistent with the perception story is that the visibility of
more attractive CEOs may remind investors of CEOs’ characteristics in addition to attractiveness.
For example, investors may perceive more attractive CEOs to be more competent or trustworthy
and therefore buy the stocks. To control for the effects of other perceived qualities of CEOs on
stock returns, in unreported results we include perceived competence, trustworthiness and baby-
facedness of CEOs in the regressions analyses reported in Table V. We measure perceived
competence, trustworthiness and baby-facedness of CEOs through the survey ratings from the
Amazon’s Mechanical Turk (Mturk) service, which we describe in detail in Section IV.A. The
results do not materially change after controlling for these perceived qualities of CEOs. 29
29 We also include perceived competence, trustworthiness, and baby-facedness in Table II and III; the results remain
practically unaffected.
32
IV. Robustness Checks
A. Validity of the Facial Attractiveness Index
One potential concern with the main results reported in Section III is whether the Facial
Attractiveness Index is a valid measure of CEO attractiveness. Two possibilities follow this
concern. First, potential measurement errors in the process of obtaining this measure from
Anaface.com and/or CEO photo characteristics could keep us from obtaining reliable estimates.
As we mention in Section II.A, we address these issues by (1) multi-sampling the facial
geometry scores of each CEO six times and taking the average of the sampled scores as our
measure of Facial Attractiveness Index, and (2) controlling for CEO facial traits and photo
characteristics that might impact Facial Attractiveness Index in a non-random fashion.
Second, even in the absence of measurement errors, there might not be sufficient
evidence that Facial Attractiveness Index is a valid measure of CEO attractiveness. For this issue,
it is worth noting, however, that a large psychology literature finds geometry-based facial
features, including symmetry, averageness, and golden ratios, to be related to attractiveness.
Some of the studies along this line of research obtain these geometry-based facial features using
computerized programs that appear to be very similar to those used by Anaface.com. For
example, both Rhodes and Tremewan (1996) and Schmid, Marx, and Samal (2008) locate 169
and 29 facial landmarks, respectively, to obtain geometry-based facial features; their findings
confirm a positive relation between facial geometry and attractiveness.
To further confirm the validity of Facial Attractiveness Index as a measure of CEO
attractiveness, we analyze the relation between Facial Attractiveness Index and a survey-based
measure of attractiveness. Specifically, we follow Duarte, Siegel, and Young (2012) and conduct
surveys of CEO attractiveness through Amazon’s Mechanical Turk (Mturk) service. Mturk is an

33
online crowdsourcing platform through which qualified individual “workers” provide highly
standardized tasks such as rating image-related subjects. We upload our sample of CEO photos
to Mechanical Turk and ask ten workers (as survey respondents) to rate the attractiveness of each
CEO on a scale of a one (the least attractive) to five (the most attractive). We then take the
average of the ten scores received from these workers as our survey-based measure of
attractiveness. Following Duarte, Siegel, and Young (2012) and Graham, Harvey, and Puri
(2014), we repeat the same procedure and ask workers to rate other appearance-based qualities of
CEO, such as competence, trustworthiness, and baby-facedness. These survey-based measures
are the “perceived” measures as discussed in Section III.D.
To ensure the quality of these survey-based measures, we require workers (1) to reside in
the U.S. and (2) to receive 99 percent or higher customer satisfaction when performing prior
Mturk services. Further, to assess the consistency of the workers’ ratings, we upload pictures of
“trial” subjects unrelated to our CEO sample and ask these workers to rate how attractive these
trial subjects are. Subjects who resemble fashion models and/or movie stars receive higher
ratings of attractiveness than those with average looks, adding to the consistency of these survey-
based measures.
Panel A of Table VI reports the summary statistics of these survey-based measures. On
average, our sample of CEOs receives 2.43 of attractiveness rating (on the scale of 5). In Panel B
(Table VI), Facial Attractiveness Index is positively and significantly correlated with the survey-
based attractiveness measure in the univariate test (Model (1)). The positive and significant
correlation between the two measures remains after we control for factors that may affect Facial
Attractiveness Index, such as firm size, CEO gender, age, tenure, race, as well as their facial

34
traits and picture characteristics (Model (5)). Overall, the results align both measures of
attractiveness and add to the validity of the Facial Attractiveness Index.
One question remains as to the extent to which Facial Attractiveness Index and survey-
based attractiveness measures differ, despite that they show positive correlations in Panel B of
Table VI. One well discussed possibility in the biology and psychology literature is that the
survey-based measure, which gauges perceived attractiveness, could be driven by nature and/or
cultural factors (nurture), whereas facial geometry-based measures, which are based on
biological features, could be primarily driven by nature. In this paper, we take no stance as to
what drives the difference between the two measures, nor do we claim which measure is better.
Instead, in addition to the difference in sample and research design, studies using different
attractiveness measures may yield different findings due to the distinct sources of attractiveness.
We further examine the correlation between Facial Attractiveness Index and other
perceived CEO qualities, including Competence, Trustworthiness, and Baby-facedness. Facial
Attractiveness Index does not appear to be correlated with these three measures in the univariate
test (Models (2) to (4), Panel B of Table VI). After adding the same controls that may affect
Facial Attractiveness Index as we did in Model (5), Competence and Baby-facedness appear to
be positively correlated with Facial Attractiveness Index at the ten percent significance level
(Models (6) and (8), Panel B of Table VI). An unreported test suggests that survey-based
Attractiveness is correlated with Competence (the correlation coefficient is 37%). Therefore, the
positive and (marginally) significant coefficients of Competence on Facial Attractiveness Index
could be driven by this correlation. We thus obtain residualized Competence, Trustworthiness
and Baby-facedness, which are not correlated with Attractiveness. In Models (9) to (11) (Panel B,
Table VI); the residualized measures (Res(Competence), Res(Trustworthiness), and Res(Baby-

35
facedness), respectively) do not significantly explain Facial Attractiveness Index, whereas
Attractiveness continues to have a positive and significant correlation with Facial Attractiveness
Index.
Finally, to ensure that the Facial Attractiveness Index and the survey-based attractiveness
are unaffected by individuals who rate or take the measurements, we follow the existing
literature testing the inter-rater reliability and compute Cronbach’s (1951) Alpha for each
measure. Intuitively, Cronbach’s Alpha measures the consistency among each rater’s rankings of
CEO attractiveness. In an unreported result, we find that the Cronbach’s Alpha is 0.915 for FAI
and 0.791 for Attractiveness, which are above the threshold level of 0.70 and thus are considered
to attain inter-rater reliability.
[Table VI goes here]
B. Survey-based Attractiveness and Shareholder Value
In Section IV.A we show a positive and significant correlation between Facial
Attractiveness Index and the survey-based attractiveness measure of CEOs, providing evidence
of the validity of the Facial Attractiveness Index. In this subsection, we further examine whether
more attractive CEOs are associated with better shareholder value, where attractiveness is
measured based on the survey-based attractiveness. We propose a predicted survey-based
attractiveness (P(Attractiveness)), i.e., the predicted value of the survey-based CEO
attractiveness measure (as described in Section IV.A) based on observable facial traits of the
CEOs appearing on the photos, including FAI, fWHR, Smiling, Bald, Glasses, Professional,
Color Photo, and Nonwhite. This predicted survey-based attractiveness gauges respondents’
subjective ratings based on observable facial traits of a CEO and excludes other factors that
might affect the respondents’ ratings. It is worth noting that, by construction, this measure still

36
originates from the respondents’ ratings and is thus different from the Facial Attractiveness
Index in nature.
Table VII presents the results. For conciseness, we only report the coefficients and t-
statistics of P(Attractiveness). P(Attractiveness) has a positive and significant impact on stock
returns surrounding CEO job announcements (Panel A), mergers announcement (Panel B),
television news events (Panel C), and earnings announcement events with CEO photos (Panel E),
consistent with the previous findings using Facial Attractiveness Index as the measure of CEO
attractiveness. Further, P(Attractiveness) does not significant affect stock returns surrounding
print news events (Panel D) and earnings announcement events without CEO photos (Panel F).
Overall, these results add to the robustness of the findings that more attractive CEOs are
associated with better shareholder value.
[Table VII goes here]
C. Tests for Selection Bias in the Absence of Control Samples
Sections III.A and III.B provide evidence that CEO appearance is positively related to
stock returns in the context of CEO job and M&A announcements. However, these events are
firms’ voluntary choices and lack observable control samples. Therefore, it is likely that these
events are initiated when firms possess information not fully known to markets, and that the
unobservable factors that determine the decisions to replace a CEO and/or undertake an M&A
are also correlated with FAI. Consequently, the OLS model used in the prior analysis to estimate
the relation between announcement returns and FAI may result in a potential selection bias
(Prabhala (1997)). To address this concern, we follow Eckbo, Maksimovic, and Williams (1990)
and estimate the following conditional model using maximum likelihood estimation (MLE) for
both the CEO job announcement and M&A announcement tests we report in Tables II and III:

37
𝐸[𝐶𝐴𝑅𝑖|𝐶𝐴𝑅𝑖 = 𝑥𝑖𝛾𝑖 + 𝜂𝑖 > 0] = 𝑥𝑖𝛾𝑖 + 𝜔
𝜙(𝑥𝑖𝛾𝑖/𝜔)
𝜃(𝑥𝑖𝛾𝑖/𝜔) (1)
where 𝐶𝐴𝑅𝑖 is the cumulative abnormal return; 𝑥𝑖 is the vector of regressors for manager i,
including FAI; 𝛾𝑖 is the vector of coefficients; 𝜂𝑖 is assumed to be normally distributed with
variance 𝜔2 ; and 𝜙 and 𝜃 represent the normal probability density function and cumulative
density function, respectively.
Intuitively, (1) accounts for private information related to the decision to replace a CEO
and the acquisition announcement. In an unreported analysis (available upon request), after
addressing this selection bias in the absence of control events, the coefficients of FAI estimated
from (1) remain positive and significant; further, both the economic and statistical significance
do not materially change. These results further support our main findings.
D. Tests Controlling for Selection Bias in the Television News Events
In Section III.C.1, we compare the difference in the effects of FAI on stock returns
between CEOs’ television news events versus a matched sample of print news events. Doing so
enables us to net out the effects of any unobservable firm and CEO characteristics, assuming that
that these unobservable firm and CEO characteristics have the same effects across the two
samples. 30 The assumption appears to be plausible, given that we carefully select the matched
sample of print news and that all the firm and CEO characteristics do not significantly affect the
selection of news into television as opposed to print articles (Model (11) of Panel A, Table V).
On the other hand, if we relax this assumption, we need to control for the potential selection bias,
in which the effects of FAI on stock returns might be correlated with unobservable factors that
determine whether a CEO is selected into television or print news events.
30 In this test, we also assume that these unobservable firm and CEO characteristics remain time invariant within ten
days surrounding these events.

38
To mitigate this potential selection bias, we re-estimate the effects of FAI on stock
returns during television and print news events using Heckman’s (1979) procedure. We estimate
the outcome and the selection models by maximum likelihood estimation (MLE). 31 In the
selection equation, we consider major sports event days as a source of exogenous variation.32 It
is also unlikely that an individual firm’s stock returns are driven by contemporaneous sports
news events. We hypothesize that (1) the arrival of major sports events affects the chances of
CEOs appearing on both the television and print news, but that (2) CEOs are more likely to
appear on CNBC in the days leading up to major sports events than appear in print news events.
These hypotheses seem plausible, as both newspapers and CNBC cover news on major sports
events; however, for the majority of print news outlets, the business news sections are more
likely to compete for space and prominence with sports news sections during major sports events,
while business television stations such as CNBC mainly focus on business news and may put
less weight on the major sports events. Consistent with these conjectures, in unreported results
we find indeed that the CEO is less likely to be selected into print news events on the major
sports events days.
[Table VIII goes here]
Table VIII reports the results for the estimated outcome equation of abnormal returns on
television and print news days on FAI and other controls. More important, the coefficient on FAI
remains significant and positive at the 1% level on CEO television news days, after controlling
for the selection bias using the major sports events as a source of the exogenous shock. Further,
31 Using the two-step procedure does not affect the results in a meaningful way. 32 We include the following major sports events: National Football League’s (NFL) playoffs, Super Bowl, National
Basketball Association’s (NBA) playoffs and finals, National Hockey League’s (NHL) playoffs and finals,
American League Championship Series (ALCS), National League Championship Series (NLCS), World Series
(WS), the 2008 and 2012 Summer Olympics, and the 2010 Winter Olympics. If an event occurs on a non-trading
day, we assign it to the first trading day prior to the event.

39
the coefficient on FAI remains insignificant on print news days. We also perform a test on the
difference between the coefficients on FAI in the television and in print news events, and find
that the difference is significant at the 1% level. Overall the results further support a positive
effect of FAI on shareholder value through the visibility channel.
V. Conclusion
In this paper, we investigate whether and how CEO appearance matters for shareholder
value. We calculate the Facial Attractiveness Index of CEOs based on their facial geometry. We
first document the existence of the CEO attractiveness effects on shareholder value by showing
that more attractive CEOs are associated with better stock returns around their job announcement
dates.
We further hypothesize and test two channels through which more attractive CEOs
enhance shareholder value: negotiating and visibility. To test the negotiating channel, we
examine the stock price reactions around M&A announcement dates and find a positive and
significant CEO attractiveness effect on acquirer returns. This positive relation persists beyond
one year following the mergers announcement dates. We test the visibility channel by first
investigating the stock price reaction around CEO television news event dates and find that more
attractive CEOs are associated with better stock returns surrounding CEO-related television news
days. However, we find no significant relation between CEO attractiveness and stock returns
around a matched sample of non-television news events. In a second test, we continue to find the
positive and significant CEO attractiveness effects on stock returns surrounding earnings
announcement dates with CEO image, but insignificant effects around earnings announcement
dates without the CEO’s image. These findings mitigate the endogeneity concerns when

40
interpreting our findings. Overall, our results suggest that more attractive CEOs create value for
shareholders through better negotiating prowess and visibility.
The findings of this paper shed light on how the appearance of corporate insiders affects
corporate decisions and outcomes. It is well established in the asset pricing literature that
investors’ decisions are likely based on initial, possibly unconscious, impressions and
perceptions. Along this line, several studies find evidence of how a “first impression effect” of
appearance impacts personal financing. However, less is known about how the first impression
effect of appearance of corporate insiders would affect the perceptions and thus decisions of
corporate stakeholders. More research is called for to further assess these possibilities.

41
References
Adams, G.R., 1977. Physical attractiveness, personality, and social reactions to peer pressure.
The Journal of Psychology 96, 287–296.
Addoum, J., Korniotis, G., Kumar A., 2013. Stature, obesity, and portfolio choice. Unpublished
working paper. University of Miami.
Atalay, B., 2004. Math and the Mona Lisa: The art and science of Leonardo da Vinci.
Smithsonian Institution Press, Washington D.C.
Berger, J., Cohen, B., Zelditch, M., 1972. Status characteristics and social interaction. American
Sociological Review 37 (3) (June 1), 241–255.
Bertrand, M., Schoar, A., 2003. Managing with style: the effect of Managers on Firm Policies.
Quarterly Journal of Economics 118(4) 1169–1208.
Betton, S., Eckbo, B., Thorburn, K., 2008. Corporate takeovers. In: Handbook of corporate
finance: empirical corporate finance. Elsevier/North-Holland Handbook of Finance
Series.
Cai, J., M.H. Song, M., Walkling, R., 2011. Anticipation, acquisitions, and bidder returns:
industry shocks and the transfer of information across rivals. Review of Financial Studies
24, 2242 –2285.
Campbell, C., Gallmeyer, M., Johnson, S., Rutherford, J., Stanley, B., 2011, CEO optimism and
forced turnover. Journal of Financial Economics 101, 695–712.
Campbell, C., Graham, J., Jolibert, A., Meissner, H., 1988. Marketing negotiations in France,
Germany, the United Kingdom, and the United States. Journal of Marketing 52, 49–62.
Carhart, M., 1997. On persistence in mutual fund performance. The Journal of Finance 52, 57–82.
Carré, J., McCormick, C., 2008. In your face: facial metrics predict aggressive behaviour in the
laboratory and in varsity and professional hockey players. Proceedings of the Royal
Society of London B: Biological Sciences 275:2651–56.
Carré, J. M., McCormick, C., Mondloch, C., 2009. Facial structure is a reliable cue of
aggressive behavior. Psychological Science 20:1194–98.
Cash, T., Kehr, J., Polyson, J., Freeman, V., 1977. Role of physical attractiveness in peer
attribution of psychological disturbance. Journal of Consulting and Clinical Psychology
45, 987.
Chaiken, S., 1979. Communicator physical attractiveness and persuasion. Journal of Personality
and Social Psychology 37, 1387.
Chaiken, S., 1986. Physical appearance and social influence. In: Physical Appearance, Stigma,
and Social Behavior. The Ontario Symposium, pp. 143–177.
Chen, H., Hwang, B., Liu, B., 2015. The economic consequences of having 'social' executives.
Unpublished working paper. City University of Hong Kong.
Coles, J., Li, F., 2012, “An empirical assessment of empirical corporate finance.” Unpublished
working paper. Arizona State University
Cook, D., Mobbs, S., 2014, CEO selection and executive appearance, Unpublished working
paper, University of Alabama.
Cronbach L., 1951, Coefficient alpha and the internal structure of tests, Psychometrika, 16 297-
334.
Custódio, C., Ferreira, M., Matos, P. 2013. Generalists versus specialists: Lifetime work
experience and chief executive officer pay. Journal of Financial Economics 108(2), 471–
492.

42
Cunningham, M., 1986. Measuring the physical in physical attractiveness: quasi-experiments on
the sociobiology of female facial beauty. Journal of Personality and Social Psychology 50,
925.
Cunningham, M., Barbee, A., Pike, C., 1990. What do women want? facialmetric assessment of
multiple motives in the perception of male facial physical attractiveness. Journal of
Personality and Social Psychology 59, 61.
Cunningham, M., Roberts, A., Barbee, A., Druen, P., Wu, C., 1995. Their ideas of beauty are, on
the whole, the same as ours: consistency and variability in the cross-cultural perception of
female physical attractiveness. Journal of Personality and Social Psychology 68, 261.
Dougal, C., Engelberg, J., García, D., Parsons, C., 2012. Journalists and the stock market.
Review of Financial Studies 25 (3), 639–679.
Duarte, J., Siegel, S., Young, L., 2012. Trust and credit: the role of appearance in peer-to-peer
lending. Review of Financial Studies 25 (8), 2455–2484.
Eckbo, B., Maksimovic, V., Williams, J., 1990. Consistent estimation of cross-sectional models
in event studies. Review of Financial Studies 3, 343–365.
Faccio, M., Marchica , M., Mura, R., 2012. CEO gender, corporate risk-taking, and the
efficiency of capital allocation. Unpublished working paper. Perdue University.
Falato, A., Li, D., Milbourn, T., 2014. Which skills matter in the market for CEOs? evidence
from pay for CEO credentials. Forthcoming, Management Science.
Fama, E., French, K., 1992. The cross-section of expected stock returns. The Journal of Finance
47, 427–465.
Giglio, S., Shue, K., 2014, No news is news: do markets underreact to nothing? Forthcoming,
Review of Financial Studies.
Gilmore, D., Beehr, T., Love, K., 1986. Effects of applicant sex, applicant physical attractiveness,
type of rater and type of job on interview decisions. Journal of Occupational Psychology
59, 103–109.
Graham, J., Harvey, C., Puri, M., 2014. A corporate beauty contest. Unpublished working paper.
Duke University.
Graham, J., Harvey, C., Puri, M., 2013. Managerial attitudes and corporate actions. Journal of
Financial Economics 109 (1) (July), 103–121.
Graham, J., Li, X. Qiu, J., 2012. Managerial attributes and executive compensation, Review of
Financial Studies, 25(1), 144-186.
Grammer, K., Thornhill, R., 1994. Human (Homo sapiens) facial attractiveness and sexual
selection: the role of symmetry and averageness. Journal of Comparative Psychology,
108(3), 233.
Hamermesh, Daniel S. and Jeff E. Biddle, 1994. “Beauty and the Labor Market.” The American
Economic Review 84 (5), 1174–1194.
Hamermesh, D., Abrevaya, J., 2013. Beauty is the source of happiness? The European Economic
Review 64, 351–368.
Haselhuhn, M., Wong. E., 2012. Bad to the bone: facial structure predicts unethical behaviour.
Proceedings of the Royal Society of London B: Biological Sciences 279:571–76.
Hatfield, E., Sprecher, S., 1986. Mirror, Mirror: The Importance of Looks in Everyday Life.
SUNY Press, Albany, New York.
Heckman, J., 1979. Sample selection bias as a specification error. Econometrica 47, 153–161.
Hirshleifer, D., Low A., Teoh,S., 2012, Are overconfident CEOs better innovators?, The Journal
of Finance 67, 1457–1498.

43
Hosoda, M., Stone-Romero, E., Coats, G., 2003. The effects of physical attractiveness on job-
related outcomes: a meta-analysis of experimental studies. Personnel Psychology 56 (2),
431–462.
Jackson, L., Hunter, J., Hodge, C., 1995. “Physical attractiveness and intellectual competence: a
meta-analytic review.” Social Psychology Quarterly 58, 108–108.
Jia, Y., Lent, L., Zeng. Y., 2014. Masculinity, testosterone, and financial misreporting. Journal
of Accounting Research 52:1195–1246.
Jones, B., Little, A., Penton-Voak, I., Tiddeman, B., Burt, D., Perrett, D., 2001. Facial symmetry
and judgements of apparent health: Support for a “good genes” explanation of the
attractiveness–symmetry relationship. Evolution and Human Behavior, 22(6), 417–429.
Kahle, L., Homer, P., 1985, Physical attractiveness of the celebrity endorser: A social adaption
perspective, Journal of Consumer Research, 11, 954-961
Kim, Y., Kamiya, S., 2015, The testosterone of the CEO and the risk of the firm, Unpublished
working paper. Nangyang Technological University.
Kanazawa, S., 2011. Intelligence and physical attractiveness. Intelligence 39, 7–14.
Kaplan, S., Klebanov, M., Sorensen, M., 2012. Which CEO characteristics and abilities matter?
Journal of Finance 67 (3) (June), 973–1007.
Kennedy, J., 1990. Determinants of peer social status: contributions of physical appearance,
reputation, and behavior. Journal of Youth and Adolescence 19 (3) (June 1), 233–244.
Kim, Y., Meschke, F., 2013. CEO interviews on CNBC. Unpublished working paper.
SungKyunKwan University.
Langlois, J., Kalakanis, L., Rubenstein, A., Larson, A., Hallam, M., Smoot, M., 2000. Maxims
of myths of beauty? a meta-analytic and theoretical review. Psychological Bulletin 126(3),
390–423.
Langlois, J., Roggman, L., 1990. Attractive faces are only average. Psychological Science, 1(2),
115–121.
Lefevre, C., Lewis, G., Perrett, D., Penke, L., 2013. Telling facial metrics: facial width is
associated with testosterone levels in men. Evolution and Human Behavior 34:273–79.
Lou, Dong, 2014, Attracting Investor Attention through Advertising, Review of Financial
Studies 27, 1797–1829.
Malmendier, U., Tate, G., 2005. CEO overconfidence and corporate investment. Journal of
Finance 60 (6) (December), 2661–2700.
Malmendier, U., Tate, G., 2008. Who makes acquisitions? CEO overconfidence and the market’s
reaction. Journal of Financial Economics 89 (1), 20–43.
Malmendier, U., Tate, G., Yan, J., 2011. Overconfidence and early-life experiences: the effect of
managerial traits on corporate financial policies. Journal of Finance 66 (5), 1687–1733.
Mayew, W., Venkatachalam, M., 2012, The power of voice managerial affective states and
future firm performance. The Journal of Finance, 67, 1–43
Mazur, A., Mazur, J., Keating, C., 1984. Military rank attainment of a west point class: effects of
cadets’ physical features. American Journal of Sociology, 125–150.
Merton, R., 1987. A simple model of capital market equilibrium with incomplete information.
The Journal of Finance 42 (3), 483–510.
Mobius, M,. Rosenblat, T., 2006. Why beauty matters. The American Economic Review 222–
235.
Naumann, L., Vazire, S., Rentfrow, P., Gosling, S., 2009. Personality judgments based on
physical appearance. Personality and Social Psychology Bulletin 35 (12), 1661–1671.

44
Pallett, P., Link, S., Lee, K. (2010). New “golden” ratios for facial beauty. Vision Research,
50(2), 149–154.
Pan, Y., Wang, T., Weisbach, M., 2015. Learning about CEO ability and stock return volatility.
Forthcoming, Review of Financial Studies.
Pareek, A., Zuckerman, R., 2013. Trust and investment management: the effects of manager
trustworthiness on hedge fund investments. Unpublished working paper. Rutgers
University.
Perrett, D., Burt, D., Penton-Voak, I., Lee, K., Rowland, D., Edwards, R., 1999. Symmetry and
human facial attractiveness. Evolution and Human Behavior, 20(5), 295–307.
Perrett, D. , Lee, K., Penton-Voak, I., Rowland, D., Yoshikawa, S., Burt, D., Akamatsu, S., 1998.
Effects of sexual dimorphism on facial attractiveness. Nature, 394(6696), 884–887.
Perrett, D., May, K., Yoshikawa, S., 1994. Facial shape and judgements of female attractiveness.
Nature, 368(6468), 239–242.
Persico, N., Postlewaite, A., Silverman, D., 2004. The effect of adolescent experience on labor
market outcomes: the case of height. Journal of Political Economy 112, 1019–1053.
Prabhala, N., 1997. Conditional methods in event studies and an equilibrium justification for
standard event-study procedures. Review of Financial Studies 10, 1–38.
Price, M., 2008. Fund-raising success and a solicitor’s beauty capital: do blondes raise more
funds? Economics Letters 100, 351–354.
Rasband, W., 2012. ImageJ. [Computer software] retrieved from
http://imagej.nih.gov/ij/index.html.
Ravina, E., 2012. Love & loans: the effect of beauty and personal characteristics in credit
markets. Unpublished working paper. Columbia University.
Rhodes, G., Tremewan, T., 1996, Averageness, exaggeration, and facial attractiveness.
Psychological Science, 105–110.
Rhodes, G., Proffitt, F., Grady, J., Sumich, A., 1998. Facial symmetry and the perception of
beauty. Psychonomic Bulletin & Review 5, 659–669.
Rhodes, G., Sumich, A., Byatt, G., 1999. Are average facial configurations attractive only
because of their symmetry? Psychological Science 10, 52–58.
Rikowski, A., Grammer, K., 1999. Human body odour, symmetry and attractiveness.
Proceedings of the Royal Society of London. Series B: Biological Sciences, 266(1422),
869–874.
Rosenblatt, T., 2008. The beauty premium: physical attractiveness and gender in dictator games.
Negotiation Journal 24 (4), 465–481.
Rule, N., Ambady, N., 2008. The face of success: inferences from chief executive officers’
appearance predict company profits. Psychological Science 19 (2), 109–111.
Rule, N., Ambady, N., 2009. She’s Got the Look: Inferences from Female Chief Executive
Officers’ Faces Predict Their Success. Sex Roles 61:644–52.
Schmid, K., Marx, D., Samal, A., 2008. Computation of a face attractiveness index based on
neoclassical canons, symmetry, and golden ratios. Pattern Recognition 41 (8), 2710–2717.
Shi, J., Samal, A., Marx, D., 2006. How effective are landmarks and their geometry for face
recognition? Computer Vision and Image Understanding, 102(2), 117–133.
Tetlock, P., 2007. Giving content to investor sentiment: the role of media in the stock market.
The Journal of Finance 62 (3), 1139–1168.
Todorov, A., Mandisodza, A., Goren, A., Hall, C., 2005. Inferences of competence from faces
predict election outcomes. Science 308 (5728), 1623–1626.

45
Valentine, K., Li, N., Penke, L., Perrett, D., 2014. Judging a man by the width of his face the role
of facial ratios and dominance in mate choice at speed-dating events. Psychological
Science 25:806–11.
Webster, M., Driskell, J., 1978. Status generalization: a review and some new data. American
Sociological Review, 220–236.
Wong, E., Ormiston, M., Haselhuhn. M., 2011. A face only an investor could love CEOs’ facial
structure predicts their firms’ financial performance. Psychological Science 22:1478–83.

46
Figure 1
This figure presents a screen shot of Anaface.com. The photograph is the default image provided by the
website.

Appendix: Variable Definitions
In this appendix we report the main variables used in the paper. The first column presents the variable name.The second column provides a brief description of the variable, along with any Compustat, Execucomp, orCRSP data items used to construct the variable. The final column reports the data source(s) used to computethe variable. SDC in the final column represents the Securities Data Corporation.
Variable Description Source
FAI Facial attractiveness index; the measure of a CEO’s facial geome-try.
Anaface.com
fWHR Facial width-to-height ratio; the distance between the two zygionsrelative to the distance between the upper lip and the highest pointof the eyelid.
ImageJ
P(Attractiveness) Predicted survey-based attractiveness; we regress the survey-basedattractiveness measure on the following variables: FAI, fWHR,CEO race, whether the CEO smiles, baldness, whether the CEOwears glasses, whether the selected picture is in color, whether theselected picture is a professional photo. We then obtain the pre-dicted value for each CEO.
AmazonMturk; GoogleImage search
Size Market value of equity (in millions; CRSP Variable:ABS(PRC*SHROUT)/1000).
CRSP
Leverage The ratio of total liabilities (Compustat Variable: LT) to total assets(Compustat Variable: AT).
Compustat
MTB Market value of equity to book value of equity (Compustat Vari-able: CSHO*PRCC F/(AT-LT)).
Compustat
Stock Return The firm’s annual stock return measured over the previous year. CRSPFemale A binary variable equal to one if the CEO is female (Execucomp
Variable: GENDER).Execucomp
Age The age of the CEO in years (Execucomp Variable: AGE). ExecucompTenure The CEO’s tenure at a given company, measured in months. ExecucompOC67 CEO overconfidence measure by Hirshleifer, Low, and Teoh
(2012); a dummy variable =1 if the CEO has options more than67% in-the-money at least two times during his or her tenure, andzero otherwise.
Execucomp
Ivy An indicator variable =1 if the CEO attended Ivy league schools,i.e., Brown University, Columbia University, Cornell Univer-sity, Dartmouth College, Harvard University, Princeton University,University of Pennsylvania, or Yale University.
Proquest
MBA An indicator variable if the CEO earned a Masters of BusinessAdministration degree.
Proquest
Attractiveness Perceived attractiveness, measured as the average ranking of 10survey respondents.
Amazon Mturk
Competence Perceived competence, measured as the average ranking of 10 sur-vey respondents.
Amazon Mturk
Trustworthiness Perceived trustworthiness, measured as the average ranking of 10survey respondents.
Amazon Mturk
Continued on next page.
47

Appendix – Continued
Variable Description Source
Baby-facedness Perceived baby-facedness, measured as the average ranking of 10survey respondents.
Amazon Mturk
Smiling An indicator variable =1 if the CEO smiles in the photo. Google Imagesearch
Bald Perceived baldness of the CEO measured from the average rankingof 10 survey respondents.
Amazon Mturk
Glasses An indicator variable =1 if the CEO is wearing glasses in the photo. Google Imagesearch
Professional An indicator variable =1 if the photo appears to be of professionalquality.
Google Imagesearch
Color photo An indicator variable =1 if the photo is in color. Google Imagesearch
Nonwhite An indicator variable =1 if the CEO’s race is not Caucasian. Google Imagesearch
UE Unexpected earnings; the absolute value of (median EPS estimate- actual EPS)/stock price two days before the EPS announcementdate.
I/B/E/S
Volatility Annual stock return volatility. CRSPForced Indicator variable =1 if the CEO’s predecessor was forced out (e.g.,
the news article states that the CEO was forced out or the CEO wasunder 60 years old and did not take another position either insideor outside the company).
Proquest
Internal Indicator variable =1 if the CEO was an employee of the companyfor at least one year prior to the appointment as CEO.
Proquest
Raided Indicator variable =1 if the CEO was an employee of another pub-lic company within one year of appointment as CEO.
Proquest
Marathon Indicator variable =1 if the CEO’s predecessor’s retirement datewas announced before the current CEO’s job announcement dateor the CEO’s predecessor was an interim CEO.
Proquest
Transaction value The ratio of the M&A transaction value to the bidder’s marketvalue of equity.
SDC
Public An indicator variable =1 if the target has a ticker on SDC or thetarget is in the Compustat file in the year prior to acquisition.
SDC
Initial bid An indicator variable =1 if there have been no other bids in thebidder’s industry for the past year.
SDC
News type dummies Indicator variables that account for the type of news story for eachtelevision and print news event. We classify the type of news intothe following categories: Investment news, M&A news, earningsnews, financial policy news, personnel news, legal news, companynews, product news, political news, industry news, internationalnews, and other news.
Proquest
48

Table I. Summary statistics
Table I presents summary statistics for each sample used in the paper. Panel A provides summary statistics ofthe main sample of the 667 CEO observations (Panel A1) as well as samples we use in testing each hypothesis(Panel A2). Panel B presents OLS regressions of Log(FAI) on all firm, CEO, and event-specific characteristicsfor each sample. t-statistics are reported in the parentheses; ***, **, and * signify statistical significance at the1%, 5%, and 10% levels, respectively. The control variables are described in the Appendix.
Panel A. Descriptive StatisticsPanel A1. Descriptive Statistics of the Main Sample
(1) (2) (3) (4) (5) (6) (7) (8)
Sample Period 2000 to 2012
N Mean SD Min Q1 Median Q3 Max
FAI 667 7.251 0.692 4.452 6.825 7.355 7.730 8.630Log(FAI) 667 1.976 0.100 1.493 1.921 1.995 2.045 2.155fWHR 667 2.182 0.171 1.696 2.071 2.182 2.303 2.743P(Attractiveness) 667 2.433 0.305 1.454 2.221 2.488 2.679 2.937Size ($ Mil) 667 26,854 57,431 231 4,409 8,491 21,025 626,550MTB 667 4.651 10.808 -56.953 1.969 3.239 5.300 231.438Stock return 667 0.198 0.602 -0.972 -0.117 0.104 0.402 7.952Leverage 667 0.554 0.203 0.043 0.427 0.561 0.674 1.581Female 667 0.025 0.158 0 0 0 0 1Age 667 53 7 36 49 53 58 77Tenure (Months) 667 108 80 1 55 89 138 621OC67 667 0.046 0.211 0 0 0 0 1Ivy 667 0.225 0.418 0 0 0 0 1MBA 667 0.355 0.479 0 0 0 1 1Smiling 667 0.717 0.451 0 0 1 1 1Bald 667 2.328 1.077 1 1 2 3 5Glasses 667 0.261 0.439 0 0 0 1 1Professional 667 0.922 0.268 0 1 1 1 1Color photo 667 0.930 0.256 0 1 1 1 1Nonwhite 667 0.040 0.197 0 0 0 0 1
N(Firms) 359N(CEOs) 667
49
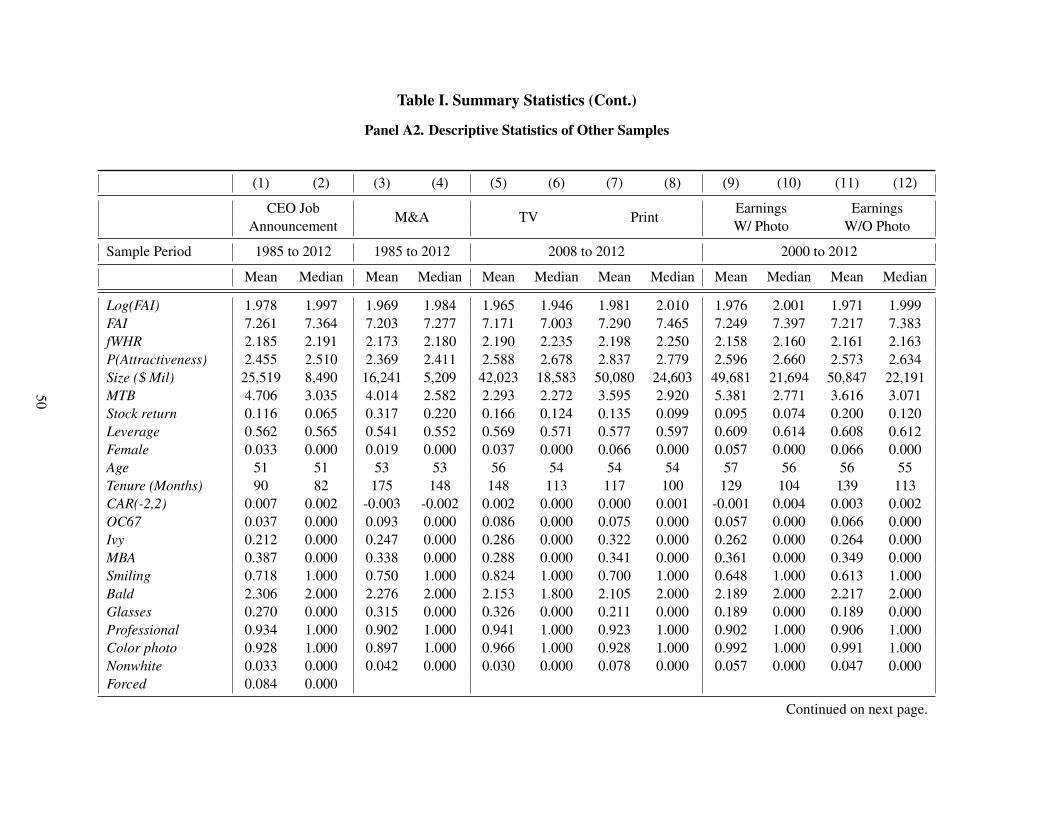
Table I. Summary Statistics (Cont.)
Panel A2. Descriptive Statistics of Other Samples
(1) (2) (3) (4) (5) (6) (7) (8) (9) (10) (11) (12)
CEO JobAnnouncement
M&A TV PrintEarningsW/ Photo
EarningsW/O Photo
Sample Period 1985 to 2012 1985 to 2012 2008 to 2012 2000 to 2012
Mean Median Mean Median Mean Median Mean Median Mean Median Mean Median
Log(FAI) 1.978 1.997 1.969 1.984 1.965 1.946 1.981 2.010 1.976 2.001 1.971 1.999FAI 7.261 7.364 7.203 7.277 7.171 7.003 7.290 7.465 7.249 7.397 7.217 7.383fWHR 2.185 2.191 2.173 2.180 2.190 2.235 2.198 2.250 2.158 2.160 2.161 2.163P(Attractiveness) 2.455 2.510 2.369 2.411 2.588 2.678 2.837 2.779 2.596 2.660 2.573 2.634Size ($ Mil) 25,519 8,490 16,241 5,209 42,023 18,583 50,080 24,603 49,681 21,694 50,847 22,191MTB 4.706 3.035 4.014 2.582 2.293 2.272 3.595 2.920 5.381 2.771 3.616 3.071Stock return 0.116 0.065 0.317 0.220 0.166 0.124 0.135 0.099 0.095 0.074 0.200 0.120Leverage 0.562 0.565 0.541 0.552 0.569 0.571 0.577 0.597 0.609 0.614 0.608 0.612Female 0.033 0.000 0.019 0.000 0.037 0.000 0.066 0.000 0.057 0.000 0.066 0.000Age 51 51 53 53 56 54 54 54 57 56 56 55Tenure (Months) 90 82 175 148 148 113 117 100 129 104 139 113CAR(-2,2) 0.007 0.002 -0.003 -0.002 0.002 0.000 0.000 0.001 -0.001 0.004 0.003 0.002OC67 0.037 0.000 0.093 0.000 0.086 0.000 0.075 0.000 0.057 0.000 0.066 0.000Ivy 0.212 0.000 0.247 0.000 0.286 0.000 0.322 0.000 0.262 0.000 0.264 0.000MBA 0.387 0.000 0.338 0.000 0.288 0.000 0.341 0.000 0.361 0.000 0.349 0.000Smiling 0.718 1.000 0.750 1.000 0.824 1.000 0.700 1.000 0.648 1.000 0.613 1.000Bald 2.306 2.000 2.276 2.000 2.153 1.800 2.105 2.000 2.189 2.000 2.217 2.000Glasses 0.270 0.000 0.315 0.000 0.326 0.000 0.211 0.000 0.189 0.000 0.189 0.000Professional 0.934 1.000 0.902 1.000 0.941 1.000 0.923 1.000 0.902 1.000 0.906 1.000Color photo 0.928 1.000 0.897 1.000 0.966 1.000 0.928 1.000 0.992 1.000 0.991 1.000Nonwhite 0.033 0.000 0.042 0.000 0.030 0.000 0.078 0.000 0.057 0.000 0.047 0.000Forced 0.084 0.000
Continued on next page.
50

Panel A2 – Continued
(1) (2) (3) (4) (5) (6) (7) (8) (9) (10) (11) (12)
CEO JobAnnouncement
M&A TV PrintEarningsw/ Photo
Earningsw/o Photo
Sample Period 1985 to 2012 1985 to 2012 2008 to 2012 2000 to 2012
Mean Median Mean Median Mean Median Mean Median Mean Median Mean Median
Internal 0.770 1.000Raided 0.212 0.000Marathon 0.117 0.000Transaction Value 0.331 0.126Public 0.501 1.000Initial bid 0.832 1.000News type dummiesInvestment 0.019 0.000 0.049 0.000M&A 0.030 0.000 0.074 0.000Earnings 0.177 0.000 0.173 0.000Financial policy 0.010 0.000 0.021 0.000Personnel 0.034 0.000 0.088 0.000Legal 0.021 0.000 0.020 0.000Company news 0.181 0.000 0.159 0.000Product 0.055 0.000 0.117 0.000Political 0.080 0.000 0.034 0.000Industry 0.222 0.000 0.024 0.000International 0.057 0.000 0.030 0.000Other 0.105 0.000 0.211 0.000UE 0.003 0.001 0.002 0.001Volatility 0.303 0.264 0.323 0.299
N 486 591 801 914 122 106N(Firms) 278 217 168 121 77 72N(CEOs) 485 278 177 124 79 72
51
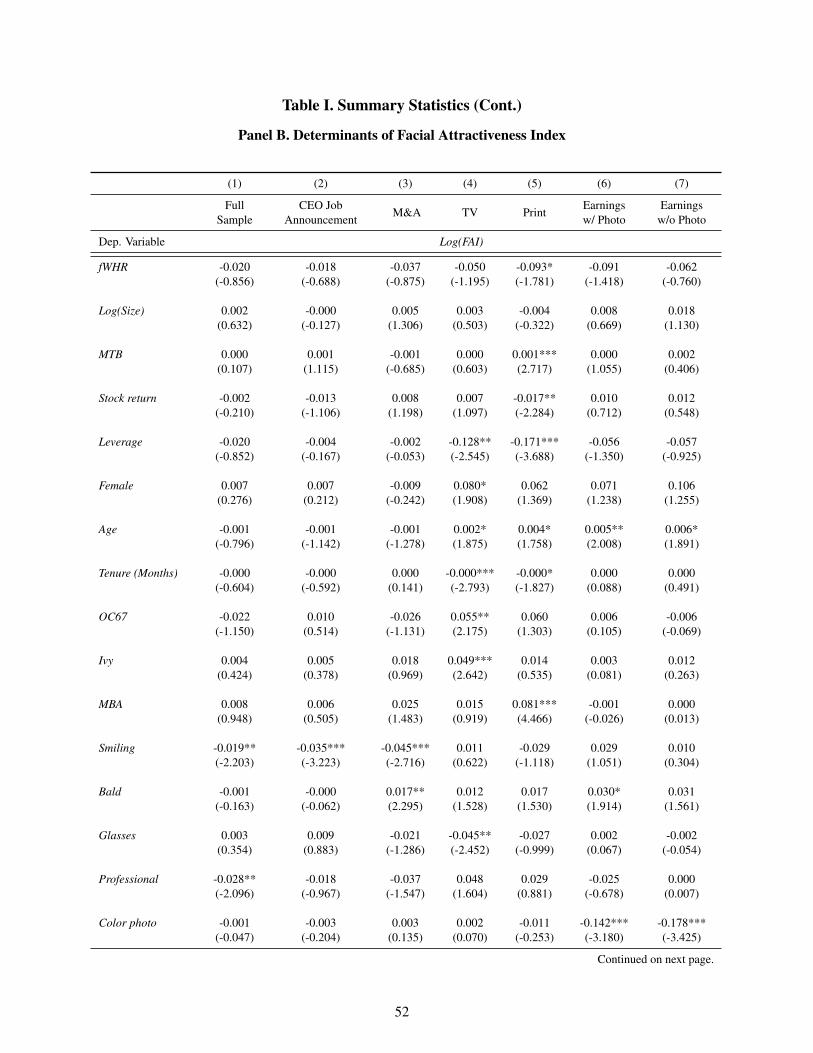
Table I. Summary Statistics (Cont.)
Panel B. Determinants of Facial Attractiveness Index
(1) (2) (3) (4) (5) (6) (7)
FullSample
CEO JobAnnouncement
M&A TV PrintEarningsw/ Photo
Earningsw/o Photo
Dep. Variable Log(FAI)
fWHR -0.020 -0.018 -0.037 -0.050 -0.093* -0.091 -0.062(-0.856) (-0.688) (-0.875) (-1.195) (-1.781) (-1.418) (-0.760)
Log(Size) 0.002 -0.000 0.005 0.003 -0.004 0.008 0.018(0.632) (-0.127) (1.306) (0.503) (-0.322) (0.669) (1.130)
MTB 0.000 0.001 -0.001 0.000 0.001*** 0.000 0.002(0.107) (1.115) (-0.685) (0.603) (2.717) (1.055) (0.406)
Stock return -0.002 -0.013 0.008 0.007 -0.017** 0.010 0.012(-0.210) (-1.106) (1.198) (1.097) (-2.284) (0.712) (0.548)
Leverage -0.020 -0.004 -0.002 -0.128** -0.171*** -0.056 -0.057(-0.852) (-0.167) (-0.053) (-2.545) (-3.688) (-1.350) (-0.925)
Female 0.007 0.007 -0.009 0.080* 0.062 0.071 0.106(0.276) (0.212) (-0.242) (1.908) (1.369) (1.238) (1.255)
Age -0.001 -0.001 -0.001 0.002* 0.004* 0.005** 0.006*(-0.796) (-1.142) (-1.278) (1.875) (1.758) (2.008) (1.891)
Tenure (Months) -0.000 -0.000 0.000 -0.000*** -0.000* 0.000 0.000(-0.604) (-0.592) (0.141) (-2.793) (-1.827) (0.088) (0.491)
OC67 -0.022 0.010 -0.026 0.055** 0.060 0.006 -0.006(-1.150) (0.514) (-1.131) (2.175) (1.303) (0.105) (-0.069)
Ivy 0.004 0.005 0.018 0.049*** 0.014 0.003 0.012(0.424) (0.378) (0.969) (2.642) (0.535) (0.081) (0.263)
MBA 0.008 0.006 0.025 0.015 0.081*** -0.001 0.000(0.948) (0.505) (1.483) (0.919) (4.466) (-0.026) (0.013)
Smiling -0.019** -0.035*** -0.045*** 0.011 -0.029 0.029 0.010(-2.203) (-3.223) (-2.716) (0.622) (-1.118) (1.051) (0.304)
Bald -0.001 -0.000 0.017** 0.012 0.017 0.030* 0.031(-0.163) (-0.062) (2.295) (1.528) (1.530) (1.914) (1.561)
Glasses 0.003 0.009 -0.021 -0.045** -0.027 0.002 -0.002(0.354) (0.883) (-1.286) (-2.452) (-0.999) (0.067) (-0.054)
Professional -0.028** -0.018 -0.037 0.048 0.029 -0.025 0.000(-2.096) (-0.967) (-1.547) (1.604) (0.881) (-0.678) (0.007)
Color photo -0.001 -0.003 0.003 0.002 -0.011 -0.142*** -0.178***(-0.047) (-0.204) (0.135) (0.070) (-0.253) (-3.180) (-3.425)
Continued on next page.
52

Panel B – Continued
(1) (2) (3) (4) (5) (6) (7)
FullSample
CEO JobAnnouncement
M&A TV PrintEarningsw/ Photo
Earningsw/o Photo
Dep. Variable Log(FAI)
Nonwhite -0.061*** -0.089** -0.075* -0.113*** -0.137*** -0.010 -0.026(-2.787) (-2.521) (-1.924) (-2.939) (-4.211) (-0.225) (-0.324)
Internal 0.049(1.162)
Raided 0.042(1.009)
Forced -0.009(-0.447)
Marathon -0.013(-0.933)
Transaction Value -0.000(-0.077)
Public 0.019*(1.820)
Initial bid 0.006(0.311)
News type dummies Yes Yes
UE -0.992 2.224(-1.034) (0.976)
Volatility 0.022 0.068(0.299) (0.827)
Intercept 2.086*** 2.083*** 2.085*** 1.917*** 2.131*** 1.884*** 1.655***(30.222) (21.267) (18.500) (13.779) (12.740) (9.265) (5.280)
Industry controls Yes Yes Yes Yes Yes Yes YesSE clustered (Firm) Yes Yes No No No No NoSE clustered (CEO) No No Yes Yes Yes Yes YesN 667 486 591 801 914 122 106R-squared 0.144 0.213 0.360 0.621 0.713 0.725 0.730
53

Table II. CEO Attractiveness and Stock Returns around Job Announcements
Table II presents regression analysis of cumulative abnormal returns (relative to the market-model) surround-ing CEO job announcements on the natural logarithm of FAI (Log (FAI)). Various event windows (−day(s),+day(s)) are reported. Industry is defined as 2-digit SIC codes. Standard errors are robust to heteroskedasticityand within firm correlation (clustered standard errors); t-statistics are reported in the parentheses; ***, **, and *signify statistical significance at the 1%, 5%, and 10% levels, respectively. The control variables are describedin the Appendix.
(1) (2) (3) (4) (5)
Event Window (Days)
Dep. Variable: CAR (-2,2) (-3,3) (-5,5) (-5,30) (-5,60)
Log(FAI) 0.071* 0.091** 0.118*** 0.134** 0.190**(1.920) (2.324) (2.721) (2.060) (2.286)
fWHR 0.012 0.022 0.024 -0.046 -0.063(0.614) (1.022) (1.050) (-1.078) (-1.054)
Log(Size) 0.000 0.000 -0.003 -0.009 -0.018**(0.048) (0.027) (-0.779) (-1.494) (-2.407)
MTB -0.000 -0.000 -0.000 -0.001** -0.001(-0.314) (-1.440) (-1.298) (-2.007) (-1.191)
Stock return -0.020** -0.023** -0.031** -0.098*** -0.146***(-1.975) (-1.985) (-2.314) (-3.878) (-4.781)
Leverage -0.011 -0.008 0.002 0.033 0.118*(-0.721) (-0.452) (0.085) (0.905) (1.809)
Female -0.002 -0.005 -0.002 0.036 0.005(-0.101) (-0.284) (-0.095) (1.292) (0.107)
Age 0.000 0.000 0.000 -0.001 -0.002(0.229) (0.561) (0.454) (-0.711) (-1.388)
Tenure (Months) 0.000 0.000 0.000 -0.000 -0.000(1.356) (1.098) (0.654) (-0.034) (-0.690)
OC67 -0.007 -0.008 -0.013 0.067*** 0.109***(-0.401) (-0.488) (-0.680) (2.627) (2.960)
Ivy 0.001 0.001 0.007 -0.020 -0.015(0.175) (0.121) (0.710) (-1.314) (-0.659)
Continued on next page.
54
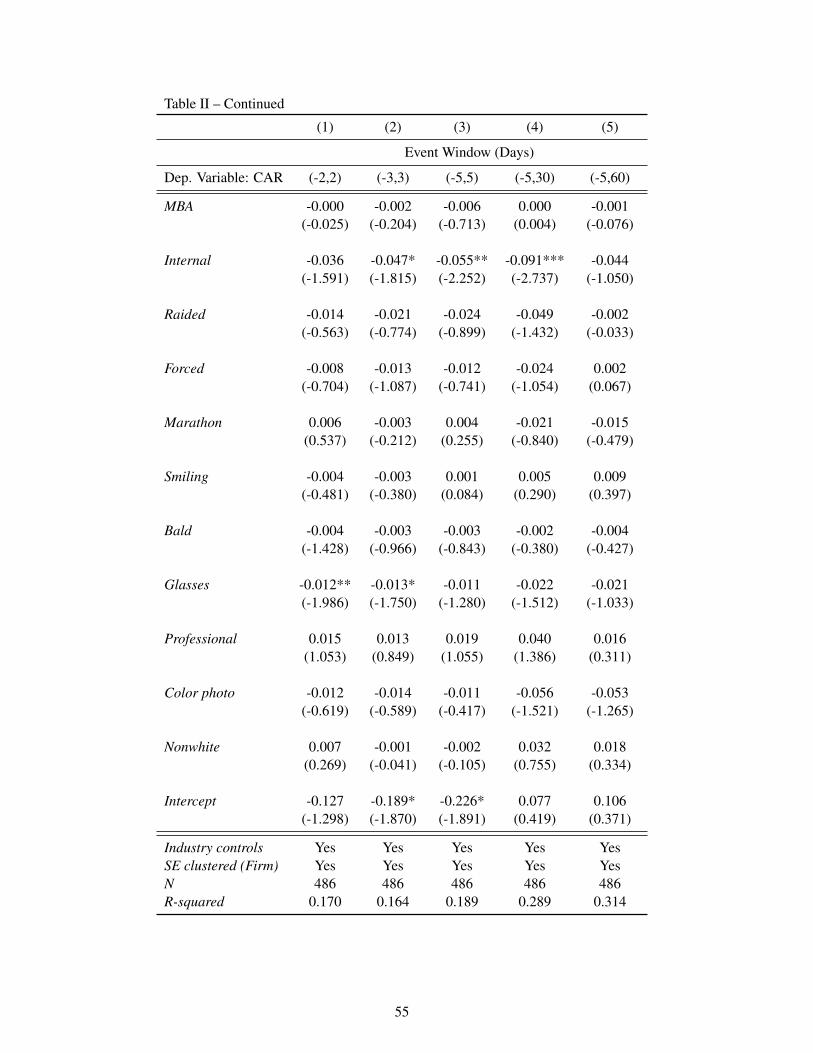
Table II – Continued
(1) (2) (3) (4) (5)
Event Window (Days)
Dep. Variable: CAR (-2,2) (-3,3) (-5,5) (-5,30) (-5,60)
MBA -0.000 -0.002 -0.006 0.000 -0.001(-0.025) (-0.204) (-0.713) (0.004) (-0.076)
Internal -0.036 -0.047* -0.055** -0.091*** -0.044(-1.591) (-1.815) (-2.252) (-2.737) (-1.050)
Raided -0.014 -0.021 -0.024 -0.049 -0.002(-0.563) (-0.774) (-0.899) (-1.432) (-0.033)
Forced -0.008 -0.013 -0.012 -0.024 0.002(-0.704) (-1.087) (-0.741) (-1.054) (0.067)
Marathon 0.006 -0.003 0.004 -0.021 -0.015(0.537) (-0.212) (0.255) (-0.840) (-0.479)
Smiling -0.004 -0.003 0.001 0.005 0.009(-0.481) (-0.380) (0.084) (0.290) (0.397)
Bald -0.004 -0.003 -0.003 -0.002 -0.004(-1.428) (-0.966) (-0.843) (-0.380) (-0.427)
Glasses -0.012** -0.013* -0.011 -0.022 -0.021(-1.986) (-1.750) (-1.280) (-1.512) (-1.033)
Professional 0.015 0.013 0.019 0.040 0.016(1.053) (0.849) (1.055) (1.386) (0.311)
Color photo -0.012 -0.014 -0.011 -0.056 -0.053(-0.619) (-0.589) (-0.417) (-1.521) (-1.265)
Nonwhite 0.007 -0.001 -0.002 0.032 0.018(0.269) (-0.041) (-0.105) (0.755) (0.334)
Intercept -0.127 -0.189* -0.226* 0.077 0.106(-1.298) (-1.870) (-1.891) (0.419) (0.371)
Industry controls Yes Yes Yes Yes YesSE clustered (Firm) Yes Yes Yes Yes YesN 486 486 486 486 486R-squared 0.170 0.164 0.189 0.289 0.314
55
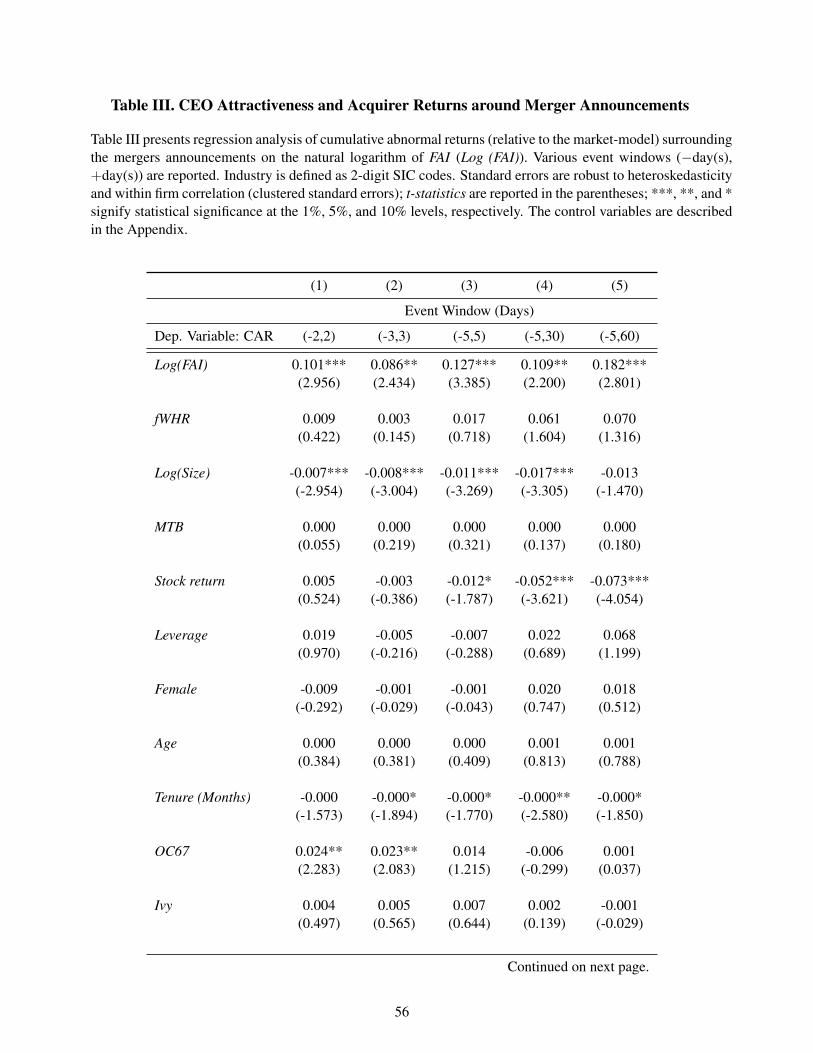
Table III. CEO Attractiveness and Acquirer Returns around Merger Announcements
Table III presents regression analysis of cumulative abnormal returns (relative to the market-model) surroundingthe mergers announcements on the natural logarithm of FAI (Log (FAI)). Various event windows (−day(s),+day(s)) are reported. Industry is defined as 2-digit SIC codes. Standard errors are robust to heteroskedasticityand within firm correlation (clustered standard errors); t-statistics are reported in the parentheses; ***, **, and *signify statistical significance at the 1%, 5%, and 10% levels, respectively. The control variables are describedin the Appendix.
(1) (2) (3) (4) (5)
Event Window (Days)
Dep. Variable: CAR (-2,2) (-3,3) (-5,5) (-5,30) (-5,60)
Log(FAI) 0.101*** 0.086** 0.127*** 0.109** 0.182***(2.956) (2.434) (3.385) (2.200) (2.801)
fWHR 0.009 0.003 0.017 0.061 0.070(0.422) (0.145) (0.718) (1.604) (1.316)
Log(Size) -0.007*** -0.008*** -0.011*** -0.017*** -0.013(-2.954) (-3.004) (-3.269) (-3.305) (-1.470)
MTB 0.000 0.000 0.000 0.000 0.000(0.055) (0.219) (0.321) (0.137) (0.180)
Stock return 0.005 -0.003 -0.012* -0.052*** -0.073***(0.524) (-0.386) (-1.787) (-3.621) (-4.054)
Leverage 0.019 -0.005 -0.007 0.022 0.068(0.970) (-0.216) (-0.288) (0.689) (1.199)
Female -0.009 -0.001 -0.001 0.020 0.018(-0.292) (-0.029) (-0.043) (0.747) (0.512)
Age 0.000 0.000 0.000 0.001 0.001(0.384) (0.381) (0.409) (0.813) (0.788)
Tenure (Months) -0.000 -0.000* -0.000* -0.000** -0.000*(-1.573) (-1.894) (-1.770) (-2.580) (-1.850)
OC67 0.024** 0.023** 0.014 -0.006 0.001(2.283) (2.083) (1.215) (-0.299) (0.037)
Ivy 0.004 0.005 0.007 0.002 -0.001(0.497) (0.565) (0.644) (0.139) (-0.029)
Continued on next page.
56

Table III – Continued
(1) (2) (3) (4) (5)
Event Window (Days)
Dep. Variable: CAR (-2,2) (-3,3) (-5,5) (-5,30) (-5,60)
MBA 0.005 0.008 0.010 0.025* 0.019(0.646) (0.991) (1.052) (1.894) (1.148)
Transaction value -0.000 -0.000 -0.001 -0.004 0.000(-0.085) (-0.177) (-0.339) (-1.196) (0.059)
Public -0.034*** -0.035*** -0.035*** -0.040*** -0.039**(-4.359) (-4.194) (-3.942) (-2.836) (-2.087)
Initial bid -0.011 -0.011 -0.018 -0.043* -0.082**(-1.107) (-0.979) (-1.567) (-1.666) (-2.127)
Smiling -0.004 -0.010 -0.011 -0.031** -0.054***(-0.538) (-1.138) (-1.136) (-2.208) (-2.983)
Bald -0.001 -0.004 -0.001 0.003 0.006(-0.354) (-0.961) (-0.374) (0.648) (0.809)
Glasses -0.004 -0.002 -0.006 -0.020 -0.015(-0.534) (-0.271) (-0.731) (-1.608) (-0.989)
Professional 0.013 0.003 0.007 0.011 0.016(1.107) (0.256) (0.644) (0.521) (0.485)
Color photo -0.003 -0.007 0.007 0.004 -0.010(-0.303) (-0.713) (0.476) (0.207) (-0.418)
Nonwhite -0.021 -0.040** -0.031** -0.039* -0.020(-1.076) (-2.512) (-2.101) (-1.805) (-0.564)
Intercept -0.148* -0.060 -0.161 -0.158 -0.354(-1.665) (-0.623) (-1.562) (-1.073) (-1.592)
Indusrty controls Yes Yes Yes Yes YesSE clustered (CEO) Yes Yes Yes Yes YesN 591 591 591 591 591R-squared 0.170 0.167 0.191 0.259 0.224
57

Table IV. CEO Attractiveness and Long-run Acquirer Returns
Table IV reports the relation between FAI and long-run acquirer returns following M&A announcements. Wereport the average long-run buy-and-hold abnormal returns and calendar-time portfolio returns for various eventwindows following M&A announcements. Events are sorted into high and low FAI based on the median split;***, **, and * signify statistical significance at the 1%, 5%, and 10% levels, respectively.
(1) (2) (3) (4) (5)
Buy-and-Hold Portfolios Calendar-Time Portfolios
Months FAI N BAHR Alpha
6 High 284 0.039 0.0096 Low 290 -0.008 -0.001
p(High - Low) 0.098* 0.036**12 High 284 0.119 0.00812 Low 290 0.033 0.001
p(High - Low) 0.079* 0.047**18 High 284 0.199 0.00618 Low 290 0.032 0.004
p(High - Low) 0.012** 0.49424 High 284 0.194 0.00524 Low 290 0.039 0.004
p(High - Low) 0.055* 0.754
58

Table V. CEO Attractiveness and Stock Price Reactions Around News events
Panel A of Table V reports regression analysis of cumulative abnormal returns (CARs) (relative to the market-model) surrounding television newsevents and print news events on the natural logarithm of FAI (Log(FAI)). In Models (1) to (5), we report CARs around the television news events forevent windows (0,0) to (-5,5). In Models (6) to (10), we report CARs around the print news events for event windows (0,0) to (-5,5). In Model (11), thedependent variable is a dummy variable equal to 1 if the event appears on television and zero if the event appears on print news. We search televisionnews stories through Google.com’s video search function. We further restrict the news results to appear only on CNBC.com. We search print newsusing the Proquest Complete database; the matched sample of print news stories is restricted to +/− 10 days surrounding television news events.Television (print) news events that are within +/− 1 day of print (television) news events are removed. Print news stories that contain photographsare also removed. Finally, the sample is restricted to news events between 2008 and 2012. Standard errors are robust to heteroskedasticity and withinCEO correlation (clustered standard errors); t-statistics are reported in the parentheses; ***, **, and * signify statistical significance at the 1%, 5%,and 10% levels, respectively. The control variables are described in the Appendix.
Panel A. Television News Dates and Non-television News Dates
(1) (2) (3) (4) (5) (6) (7) (8) (9) (10) (11)
TV Print
Event Window (Days) Event Window (Days)
Dep. Variable: CAR (0,0) (-1,1) (-2,2) (-3,3) (-5,5) (0,0) (-1,1) (-2,2) (-3,3) (-5,5) TV = 1
Log(FAI) 0.044*** 0.039** 0.035 0.034 0.029 0.004 -0.006 -0.013 0.000 0.037 -1.401(3.196) (2.171) (1.602) (1.487) (1.075) (0.359) (-0.169) (-0.316) (0.012) (0.739) (-0.800)
fWHR -0.006 0.000 0.003 0.002 0.011 0.003 -0.008 -0.007 -0.007 -0.018 -0.262(-1.113) (0.006) (0.262) (0.117) (0.761) (0.389) (-0.524) (-0.384) (-0.312) (-0.677) (-0.233)
Log(Size) -0.002* -0.003 -0.006** -0.008*** -0.011*** -0.003** -0.009*** -0.013*** -0.015*** -0.013* -0.117(-1.856) (-1.487) (-2.543) (-2.759) (-3.038) (-2.180) (-2.838) (-2.942) (-2.758) (-1.910) (-0.768)
MTB 0.000* 0.000 0.000*** 0.000*** 0.000*** 0.000* -0.000 -0.000 -0.000 -0.001 -0.001(1.842) (0.659) (4.164) (3.866) (3.342) (1.666) (-0.407) (-0.622) (-0.441) (-0.677) (-0.328)
Stock return -0.001 -0.005* -0.016*** -0.017*** -0.030*** 0.001 -0.002 -0.004 -0.003 -0.014 0.130(-0.830) (-1.739) (-5.529) (-2.741) (-3.972) (0.670) (-0.483) (-0.658) (-0.324) (-1.115) (0.845)
Leverage 0.018** 0.013 0.014 0.002 -0.012 0.004 0.030 0.036* 0.036* 0.036 -0.546(2.470) (1.008) (1.380) (0.134) (-0.764) (0.512) (1.497) (1.777) (1.725) (0.940) (-0.488)
Continued on next page.
59
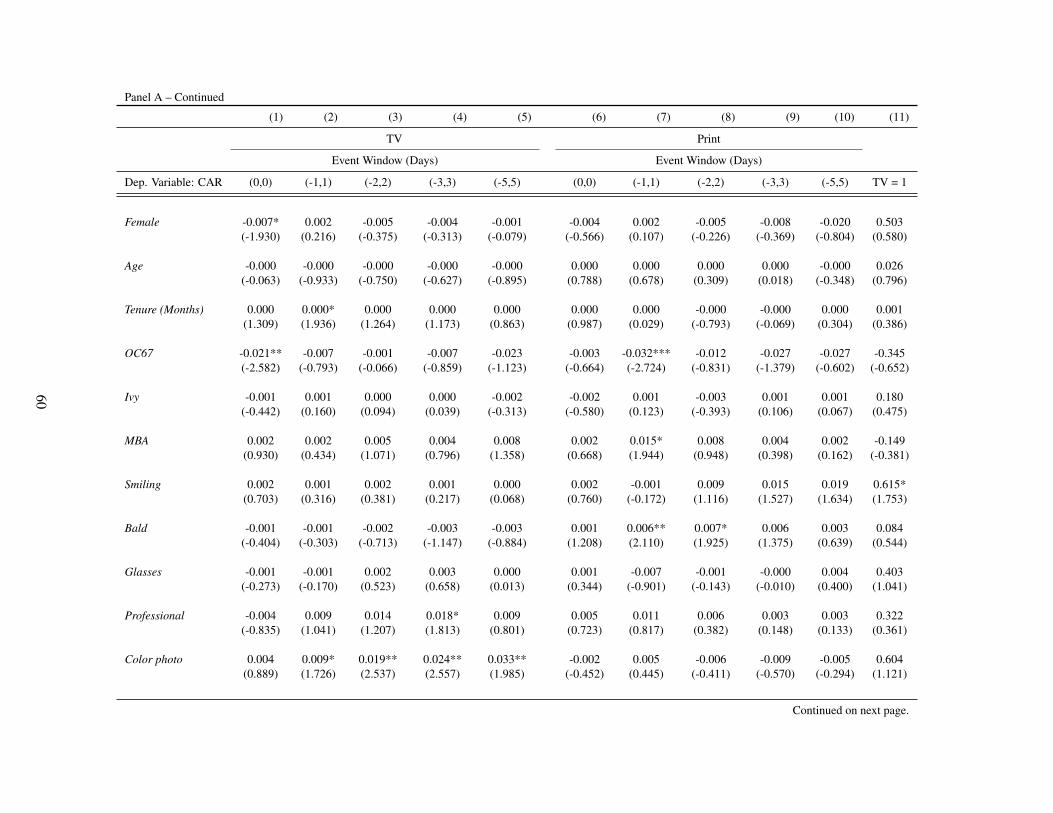
Panel A – Continued
(1) (2) (3) (4) (5) (6) (7) (8) (9) (10) (11)
TV Print
Event Window (Days) Event Window (Days)
Dep. Variable: CAR (0,0) (-1,1) (-2,2) (-3,3) (-5,5) (0,0) (-1,1) (-2,2) (-3,3) (-5,5) TV = 1
Female -0.007* 0.002 -0.005 -0.004 -0.001 -0.004 0.002 -0.005 -0.008 -0.020 0.503(-1.930) (0.216) (-0.375) (-0.313) (-0.079) (-0.566) (0.107) (-0.226) (-0.369) (-0.804) (0.580)
Age -0.000 -0.000 -0.000 -0.000 -0.000 0.000 0.000 0.000 0.000 -0.000 0.026(-0.063) (-0.933) (-0.750) (-0.627) (-0.895) (0.788) (0.678) (0.309) (0.018) (-0.348) (0.796)
Tenure (Months) 0.000 0.000* 0.000 0.000 0.000 0.000 0.000 -0.000 -0.000 0.000 0.001(1.309) (1.936) (1.264) (1.173) (0.863) (0.987) (0.029) (-0.793) (-0.069) (0.304) (0.386)
OC67 -0.021** -0.007 -0.001 -0.007 -0.023 -0.003 -0.032*** -0.012 -0.027 -0.027 -0.345(-2.582) (-0.793) (-0.066) (-0.859) (-1.123) (-0.664) (-2.724) (-0.831) (-1.379) (-0.602) (-0.652)
Ivy -0.001 0.001 0.000 0.000 -0.002 -0.002 0.001 -0.003 0.001 0.001 0.180(-0.442) (0.160) (0.094) (0.039) (-0.313) (-0.580) (0.123) (-0.393) (0.106) (0.067) (0.475)
MBA 0.002 0.002 0.005 0.004 0.008 0.002 0.015* 0.008 0.004 0.002 -0.149(0.930) (0.434) (1.071) (0.796) (1.358) (0.668) (1.944) (0.948) (0.398) (0.162) (-0.381)
Smiling 0.002 0.001 0.002 0.001 0.000 0.002 -0.001 0.009 0.015 0.019 0.615*(0.703) (0.316) (0.381) (0.217) (0.068) (0.760) (-0.172) (1.116) (1.527) (1.634) (1.753)
Bald -0.001 -0.001 -0.002 -0.003 -0.003 0.001 0.006** 0.007* 0.006 0.003 0.084(-0.404) (-0.303) (-0.713) (-1.147) (-0.884) (1.208) (2.110) (1.925) (1.375) (0.639) (0.544)
Glasses -0.001 -0.001 0.002 0.003 0.000 0.001 -0.007 -0.001 -0.000 0.004 0.403(-0.273) (-0.170) (0.523) (0.658) (0.013) (0.344) (-0.901) (-0.143) (-0.010) (0.400) (1.041)
Professional -0.004 0.009 0.014 0.018* 0.009 0.005 0.011 0.006 0.003 0.003 0.322(-0.835) (1.041) (1.207) (1.813) (0.801) (0.723) (0.817) (0.382) (0.148) (0.133) (0.361)
Color photo 0.004 0.009* 0.019** 0.024** 0.033** -0.002 0.005 -0.006 -0.009 -0.005 0.604(0.889) (1.726) (2.537) (2.557) (1.985) (-0.452) (0.445) (-0.411) (-0.570) (-0.294) (1.121)
Continued on next page.
60

Panel A – Continued
(1) (2) (3) (4) (5) (6) (7) (8) (9) (10) (11)
TV Print
Event Window (Days) Event Window (Days)
Dep. Variable: CAR (0,0) (-1,1) (-2,2) (-3,3) (-5,5) (0,0) (-1,1) (-2,2) (-3,3) (-5,5) TV = 1
Nonwhite 0.003 0.003 -0.002 0.014 0.009 0.007 -0.008 -0.003 -0.003 0.009 -1.104(0.535) (0.328) (-0.176) (1.323) (0.836) (1.335) (-0.428) (-0.156) (-0.209) (0.506) (-1.459)
News type dummies Yes Yes Yes Yes Yes Yes Yes Yes Yes Yes Yes
Intercept -0.063** -0.071 -0.050 -0.025 0.006 -0.006 0.055 0.111 0.117 0.058 3.689(-2.199) (-1.420) (-0.881) (-0.405) (0.079) (-0.199) (0.638) (1.223) (1.224) (0.425) (0.653)
Industry controls Yes Yes Yes Yes Yes Yes Yes Yes Yes Yes YesSE clustered(CEO) Yes Yes Yes Yes Yes Yes Yes Yes Yes Yes YesN 801 801 801 801 801 914 914 914 914 914 1715R-squared 0.123 0.109 0.157 0.147 0.136 0.068 0.124 0.141 0.142 0.152 0.183
61

Table V. CEO Attractiveness and Stock Price Reactions Around News events (Cont.)
Panel B of Table V reports regression analysis of cumulative abnormal returns (CARs) (relative to the market-model) surrounding earnings announce-ment news (with and without CEO images) on the natural logarithm of FAI (Log(FAI)). In Models (1) to (5), we report CARs around the earningsannouncement news with CEO images for event windows (0,0) to (-5,5). In Models (6) to (10), we report CARs around earnings announcement newswithout the CEO’s image for event windows (0,0) to (-5,5). In Model (11), the dependent variable is a dummy variable equal to 1 if the event is theearnings announcement news with CEO image and zero if the event is the earnings announcement news without the CEO’s image. We search CEOimage through Google.com’s image search function. The control sample of earnings announcement dates without the CEO’s image is matched basedon the same quarter of the prior year to the treatment sample. Standard errors are robust to heteroskedasticity and within CEO correlation (clusteredstandard errors); t-statistics are reported in the parentheses; ***, **, and * signify statistical significance at the 1%, 5%, and 10% levels, respectively.The control variables are described in the Appendix.
Panel B. Earnings News with and without CEO Photos
(1) (2) (3) (4) (5) (6) (7) (8) (9) (10) (11)
Earnings News with Photos Earnings News without Photos
Event Window (Days) Event Window (Days)
Dep. Variable: CAR (0,0) (-1,1) (-2,2) (-3,3) (-5,5) (0,0) (-1,1) (-2,2) (-3,3) (-5,5) Photo = 1
Log(FAI) 0.040 0.194* 0.220* 0.225** 0.208* -0.002 0.006 -0.014 0.027 0.033 1.128(0.448) (1.935) (1.861) (2.097) (1.790) (-0.030) (0.076) (-0.149) (0.293) (0.277) (0.733)
fWHR -0.025 -0.015 -0.014 -0.006 0.033 -0.015 0.016 0.050 0.100* 0.105* 0.560(-0.592) (-0.274) (-0.240) (-0.097) (0.539) (-0.282) (0.319) (0.976) (1.956) (1.753) (0.638)
Log(Size) 0.003 0.001 -0.002 -0.004 -0.001 -0.000 -0.005 -0.008 -0.008 -0.005 -0.004(0.385) (0.054) (-0.136) (-0.297) (-0.066) (-0.027) (-0.695) (-0.951) (-0.916) (-0.610) (-0.031)
MTB 0.000 -0.000 -0.000 0.000 0.000 0.004 0.006 0.002 -0.000 -0.003 0.032*(0.703) (-0.009) (-0.148) (0.019) (0.114) (1.118) (1.379) (0.357) (-0.005) (-0.532) (1.676)
Stock return 0.009 -0.001 -0.011 -0.011 -0.009 -0.002 -0.012 -0.025 -0.025 -0.033* -0.623(0.948) (-0.090) (-0.603) (-0.664) (-0.454) (-0.224) (-0.724) (-1.457) (-1.344) (-1.758) (-1.160)
Continued on next page.
62
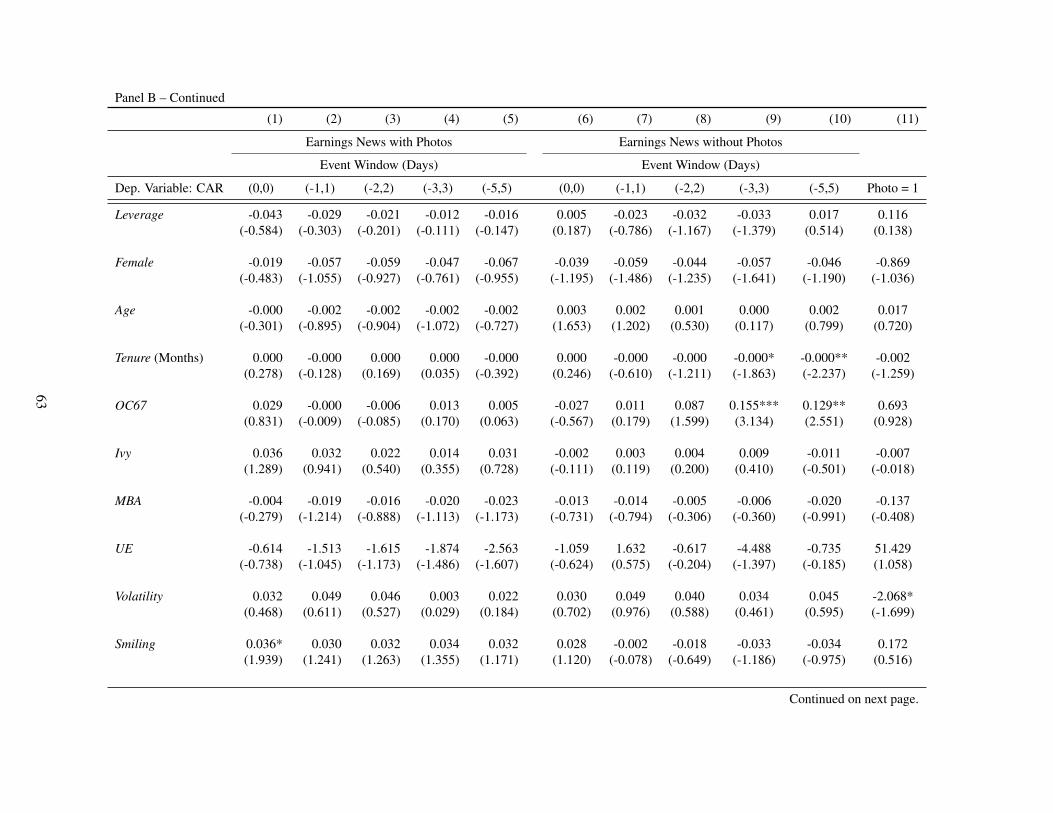
Panel B – Continued
(1) (2) (3) (4) (5) (6) (7) (8) (9) (10) (11)
Earnings News with Photos Earnings News without Photos
Event Window (Days) Event Window (Days)
Dep. Variable: CAR (0,0) (-1,1) (-2,2) (-3,3) (-5,5) (0,0) (-1,1) (-2,2) (-3,3) (-5,5) Photo = 1
Leverage -0.043 -0.029 -0.021 -0.012 -0.016 0.005 -0.023 -0.032 -0.033 0.017 0.116(-0.584) (-0.303) (-0.201) (-0.111) (-0.147) (0.187) (-0.786) (-1.167) (-1.379) (0.514) (0.138)
Female -0.019 -0.057 -0.059 -0.047 -0.067 -0.039 -0.059 -0.044 -0.057 -0.046 -0.869(-0.483) (-1.055) (-0.927) (-0.761) (-0.955) (-1.195) (-1.486) (-1.235) (-1.641) (-1.190) (-1.036)
Age -0.000 -0.002 -0.002 -0.002 -0.002 0.003 0.002 0.001 0.000 0.002 0.017(-0.301) (-0.895) (-0.904) (-1.072) (-0.727) (1.653) (1.202) (0.530) (0.117) (0.799) (0.720)
Tenure (Months) 0.000 -0.000 0.000 0.000 -0.000 0.000 -0.000 -0.000 -0.000* -0.000** -0.002(0.278) (-0.128) (0.169) (0.035) (-0.392) (0.246) (-0.610) (-1.211) (-1.863) (-2.237) (-1.259)
OC67 0.029 -0.000 -0.006 0.013 0.005 -0.027 0.011 0.087 0.155*** 0.129** 0.693(0.831) (-0.009) (-0.085) (0.170) (0.063) (-0.567) (0.179) (1.599) (3.134) (2.551) (0.928)
Ivy 0.036 0.032 0.022 0.014 0.031 -0.002 0.003 0.004 0.009 -0.011 -0.007(1.289) (0.941) (0.540) (0.355) (0.728) (-0.111) (0.119) (0.200) (0.410) (-0.501) (-0.018)
MBA -0.004 -0.019 -0.016 -0.020 -0.023 -0.013 -0.014 -0.005 -0.006 -0.020 -0.137(-0.279) (-1.214) (-0.888) (-1.113) (-1.173) (-0.731) (-0.794) (-0.306) (-0.360) (-0.991) (-0.408)
UE -0.614 -1.513 -1.615 -1.874 -2.563 -1.059 1.632 -0.617 -4.488 -0.735 51.429(-0.738) (-1.045) (-1.173) (-1.486) (-1.607) (-0.624) (0.575) (-0.204) (-1.397) (-0.185) (1.058)
Volatility 0.032 0.049 0.046 0.003 0.022 0.030 0.049 0.040 0.034 0.045 -2.068*(0.468) (0.611) (0.527) (0.029) (0.184) (0.702) (0.976) (0.588) (0.461) (0.595) (-1.699)
Smiling 0.036* 0.030 0.032 0.034 0.032 0.028 -0.002 -0.018 -0.033 -0.034 0.172(1.939) (1.241) (1.263) (1.355) (1.171) (1.120) (-0.078) (-0.649) (-1.186) (-0.975) (0.516)
Continued on next page.
63

Panel B – Continued
(1) (2) (3) (4) (5) (6) (7) (8) (9) (10) (11)
Earnings News with Photos Earnings News without Photos
Event Window (Days) Event Window (Days)
Dep. Variable: CAR (0,0) (-1,1) (-2,2) (-3,3) (-5,5) (0,0) (-1,1) (-2,2) (-3,3) (-5,5) Photo = 1
Bald -0.001 -0.009 -0.016 -0.010 -0.014 -0.012 -0.017* -0.014 -0.019** -0.006 -0.094(-0.140) (-0.904) (-1.312) (-0.840) (-1.116) (-1.471) (-1.903) (-1.523) (-2.120) (-0.541) (-0.587)
Glasses 0.018 0.016 0.024 0.015 0.010 -0.022 -0.018 -0.005 0.007 0.002 -0.039(1.332) (0.872) (1.114) (0.732) (0.489) (-1.118) (-0.992) (-0.316) (0.484) (0.112) (-0.108)
Professional 0.050** 0.005 0.011 0.000 0.016 0.008 -0.003 0.018 0.037 -0.003 -0.119(2.438) (0.151) (0.271) (0.007) (0.357) (0.291) (-0.080) (0.490) (1.058) (-0.100) (-0.225)
Color photo 0.029 0.074 0.106** 0.089* 0.116** 0.013 0.010 -0.018 -0.114*** -0.130*** 0.488(0.835) (1.632) (2.053) (1.859) (2.254) (0.505) (0.285) (-0.552) (-3.421) (-3.754) (0.348)
Nonwhite 0.001 0.030 0.037 0.042 0.036 -0.023 -0.022 -0.048 -0.048 -0.011 0.450(0.046) (0.712) (0.715) (0.805) (0.619) (-0.847) (-0.699) (-1.500) (-1.401) (-0.311) (0.605)
Intercept -0.127 -0.331 -0.371 -0.345 -0.480 -0.142 -0.078 0.015 -0.019 -0.133 -3.683(-0.511) (-1.095) (-1.047) (-1.026) (-1.344) (-0.685) (-0.332) (0.061) (-0.077) (-0.432) (-0.813)
Industry controls Yes Yes Yes Yes Yes Yes Yes Yes Yes Yes YesSE clustered(CEO) Yes Yes Yes Yes Yes Yes Yes Yes Yes Yes YesN 122 122 122 122 122 106 106 106 106 106 228R-squared 0.453 0.315 0.330 0.310 0.306 0.503 0.475 0.424 0.503 0.556 0.040
64
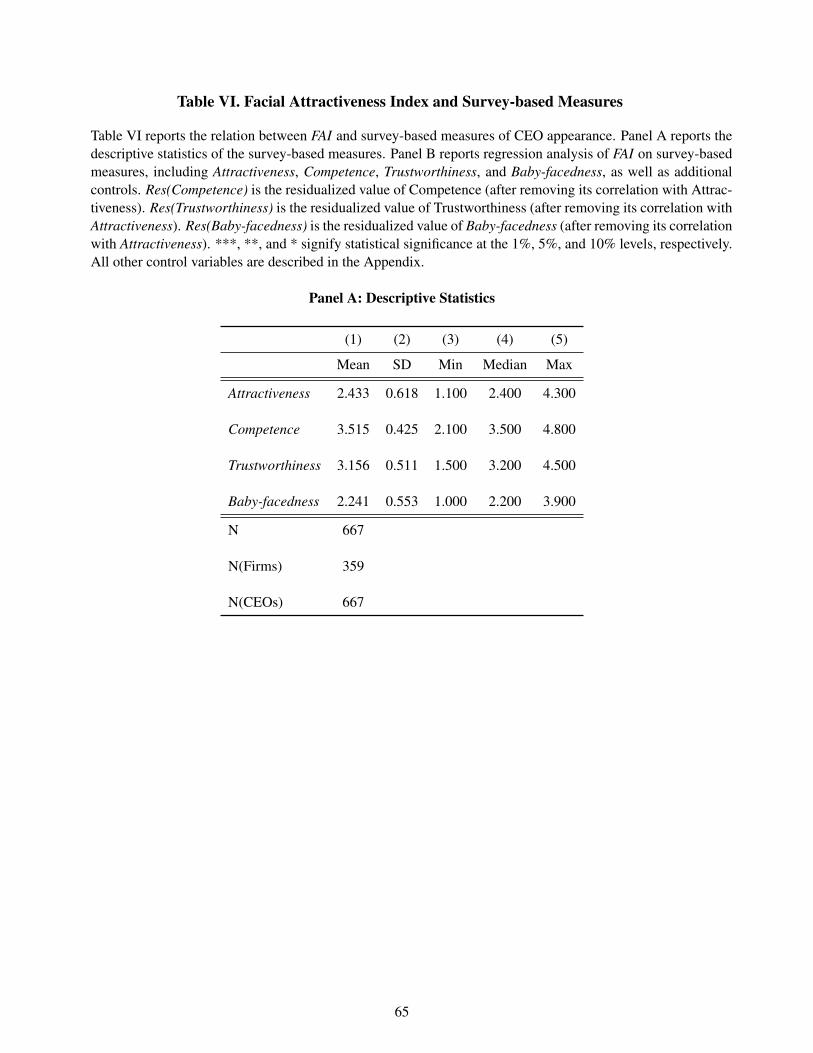
Table VI. Facial Attractiveness Index and Survey-based Measures
Table VI reports the relation between FAI and survey-based measures of CEO appearance. Panel A reports thedescriptive statistics of the survey-based measures. Panel B reports regression analysis of FAI on survey-basedmeasures, including Attractiveness, Competence, Trustworthiness, and Baby-facedness, as well as additionalcontrols. Res(Competence) is the residualized value of Competence (after removing its correlation with Attrac-tiveness). Res(Trustworthiness) is the residualized value of Trustworthiness (after removing its correlation withAttractiveness). Res(Baby-facedness) is the residualized value of Baby-facedness (after removing its correlationwith Attractiveness). ***, **, and * signify statistical significance at the 1%, 5%, and 10% levels, respectively.All other control variables are described in the Appendix.
Panel A: Descriptive Statistics
(1) (2) (3) (4) (5)
Mean SD Min Median Max
Attractiveness 2.433 0.618 1.100 2.400 4.300
Competence 3.515 0.425 2.100 3.500 4.800
Trustworthiness 3.156 0.511 1.500 3.200 4.500
Baby-facedness 2.241 0.553 1.000 2.200 3.900
N 667
N(Firms) 359
N(CEOs) 667
65
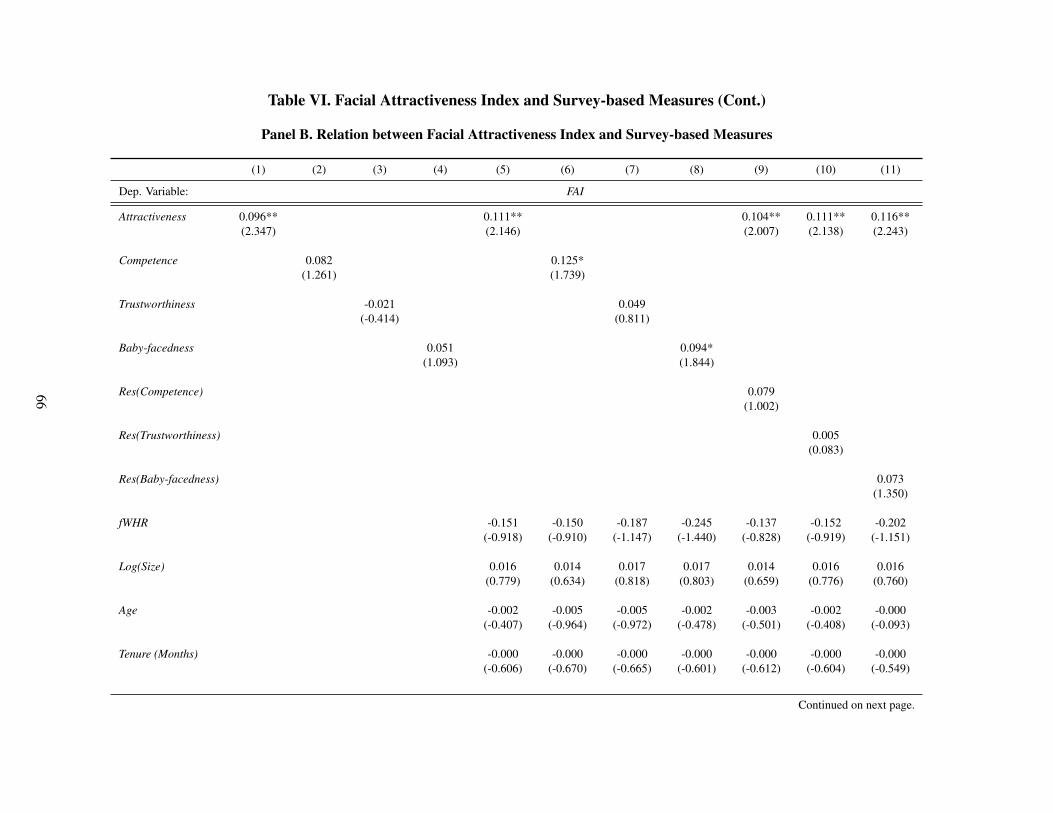
Table VI. Facial Attractiveness Index and Survey-based Measures (Cont.)
Panel B. Relation between Facial Attractiveness Index and Survey-based Measures
(1) (2) (3) (4) (5) (6) (7) (8) (9) (10) (11)
Dep. Variable: FAI
Attractiveness 0.096** 0.111** 0.104** 0.111** 0.116**(2.347) (2.146) (2.007) (2.138) (2.243)
Competence 0.082 0.125*(1.261) (1.739)
Trustworthiness -0.021 0.049(-0.414) (0.811)
Baby-facedness 0.051 0.094*(1.093) (1.844)
Res(Competence) 0.079(1.002)
Res(Trustworthiness) 0.005(0.083)
Res(Baby-facedness) 0.073(1.350)
fWHR -0.151 -0.150 -0.187 -0.245 -0.137 -0.152 -0.202(-0.918) (-0.910) (-1.147) (-1.440) (-0.828) (-0.919) (-1.151)
Log(Size) 0.016 0.014 0.017 0.017 0.014 0.016 0.016(0.779) (0.634) (0.818) (0.803) (0.659) (0.776) (0.760)
Age -0.002 -0.005 -0.005 -0.002 -0.003 -0.002 -0.000(-0.407) (-0.964) (-0.972) (-0.478) (-0.501) (-0.408) (-0.093)
Tenure (Months) -0.000 -0.000 -0.000 -0.000 -0.000 -0.000 -0.000(-0.606) (-0.670) (-0.665) (-0.601) (-0.612) (-0.604) (-0.549)
Continued on next page.
66
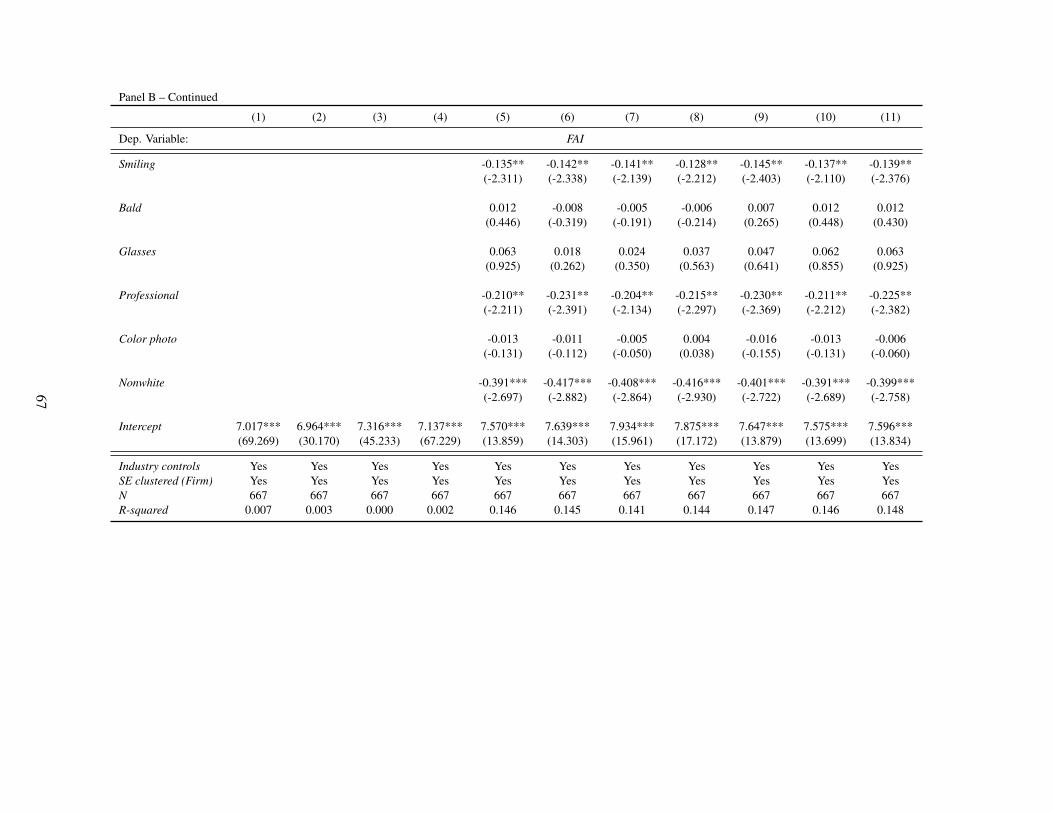
Panel B – Continued
(1) (2) (3) (4) (5) (6) (7) (8) (9) (10) (11)
Dep. Variable: FAI
Smiling -0.135** -0.142** -0.141** -0.128** -0.145** -0.137** -0.139**(-2.311) (-2.338) (-2.139) (-2.212) (-2.403) (-2.110) (-2.376)
Bald 0.012 -0.008 -0.005 -0.006 0.007 0.012 0.012(0.446) (-0.319) (-0.191) (-0.214) (0.265) (0.448) (0.430)
Glasses 0.063 0.018 0.024 0.037 0.047 0.062 0.063(0.925) (0.262) (0.350) (0.563) (0.641) (0.855) (0.925)
Professional -0.210** -0.231** -0.204** -0.215** -0.230** -0.211** -0.225**(-2.211) (-2.391) (-2.134) (-2.297) (-2.369) (-2.212) (-2.382)
Color photo -0.013 -0.011 -0.005 0.004 -0.016 -0.013 -0.006(-0.131) (-0.112) (-0.050) (0.038) (-0.155) (-0.131) (-0.060)
Nonwhite -0.391*** -0.417*** -0.408*** -0.416*** -0.401*** -0.391*** -0.399***(-2.697) (-2.882) (-2.864) (-2.930) (-2.722) (-2.689) (-2.758)
Intercept 7.017*** 6.964*** 7.316*** 7.137*** 7.570*** 7.639*** 7.934*** 7.875*** 7.647*** 7.575*** 7.596***(69.269) (30.170) (45.233) (67.229) (13.859) (14.303) (15.961) (17.172) (13.879) (13.699) (13.834)
Industry controls Yes Yes Yes Yes Yes Yes Yes Yes Yes Yes YesSE clustered (Firm) Yes Yes Yes Yes Yes Yes Yes Yes Yes Yes YesN 667 667 667 667 667 667 667 667 667 667 667R-squared 0.007 0.003 0.000 0.002 0.146 0.145 0.141 0.144 0.147 0.146 0.148
67
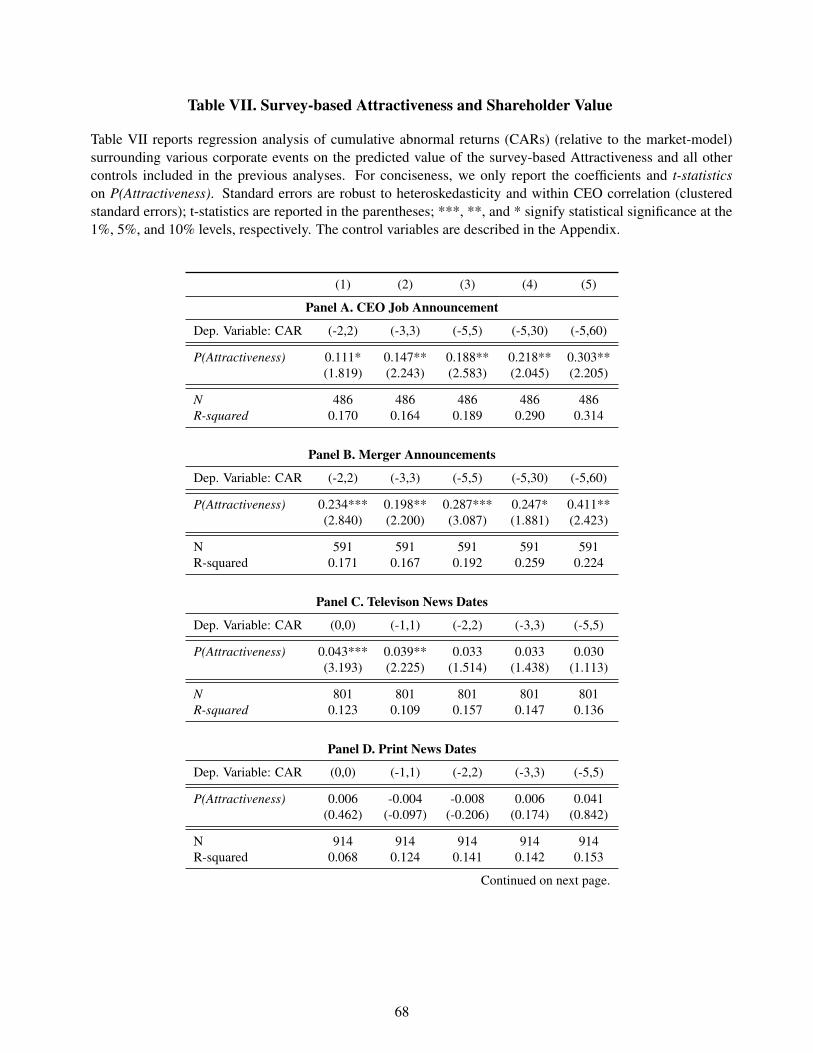
Table VII. Survey-based Attractiveness and Shareholder Value
Table VII reports regression analysis of cumulative abnormal returns (CARs) (relative to the market-model)surrounding various corporate events on the predicted value of the survey-based Attractiveness and all othercontrols included in the previous analyses. For conciseness, we only report the coefficients and t-statisticson P(Attractiveness). Standard errors are robust to heteroskedasticity and within CEO correlation (clusteredstandard errors); t-statistics are reported in the parentheses; ***, **, and * signify statistical significance at the1%, 5%, and 10% levels, respectively. The control variables are described in the Appendix.
(1) (2) (3) (4) (5)
Panel A. CEO Job Announcement
Dep. Variable: CAR (-2,2) (-3,3) (-5,5) (-5,30) (-5,60)
P(Attractiveness) 0.111* 0.147** 0.188** 0.218** 0.303**(1.819) (2.243) (2.583) (2.045) (2.205)
N 486 486 486 486 486R-squared 0.170 0.164 0.189 0.290 0.314
Panel B. Merger Announcements
Dep. Variable: CAR (-2,2) (-3,3) (-5,5) (-5,30) (-5,60)
P(Attractiveness) 0.234*** 0.198** 0.287*** 0.247* 0.411**(2.840) (2.200) (3.087) (1.881) (2.423)
N 591 591 591 591 591R-squared 0.171 0.167 0.192 0.259 0.224
Panel C. Televison News Dates
Dep. Variable: CAR (0,0) (-1,1) (-2,2) (-3,3) (-5,5)
P(Attractiveness) 0.043*** 0.039** 0.033 0.033 0.030(3.193) (2.225) (1.514) (1.438) (1.113)
N 801 801 801 801 801R-squared 0.123 0.109 0.157 0.147 0.136
Panel D. Print News Dates
Dep. Variable: CAR (0,0) (-1,1) (-2,2) (-3,3) (-5,5)
P(Attractiveness) 0.006 -0.004 -0.008 0.006 0.041(0.462) (-0.097) (-0.206) (0.174) (0.842)
N 914 914 914 914 914R-squared 0.068 0.124 0.141 0.142 0.153
Continued on next page.
68
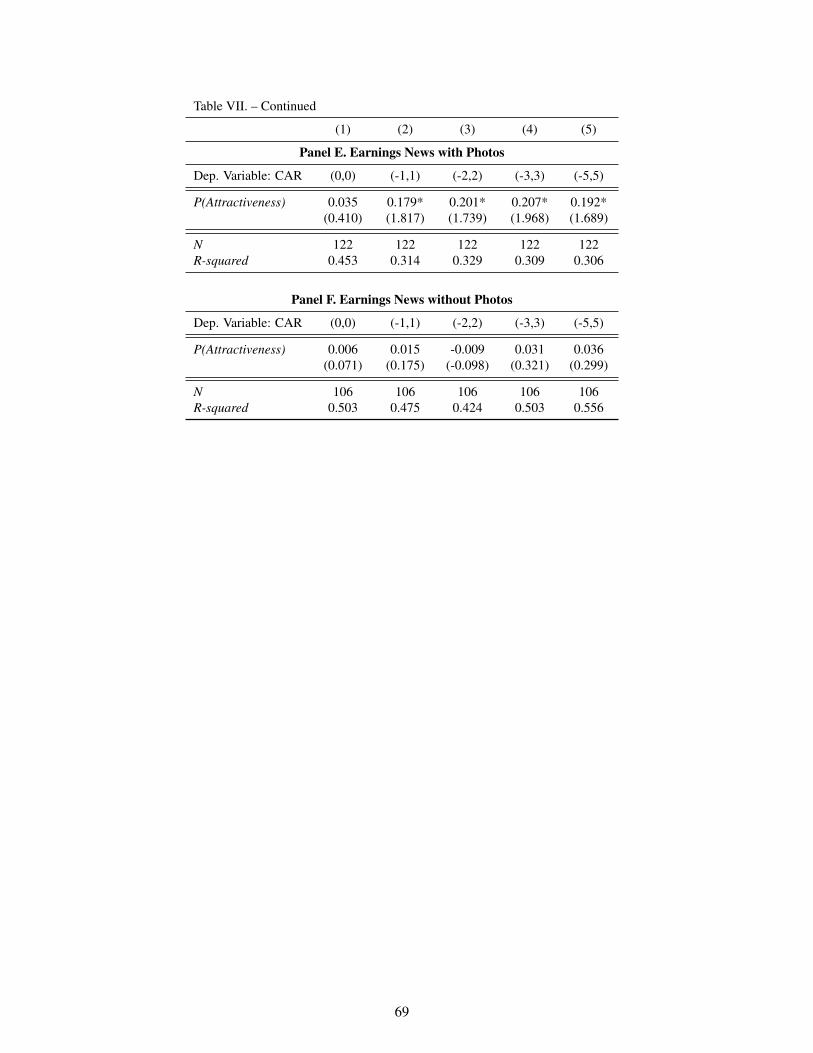
Table VII. – Continued
(1) (2) (3) (4) (5)
Panel E. Earnings News with Photos
Dep. Variable: CAR (0,0) (-1,1) (-2,2) (-3,3) (-5,5)
P(Attractiveness) 0.035 0.179* 0.201* 0.207* 0.192*(0.410) (1.817) (1.739) (1.968) (1.689)
N 122 122 122 122 122R-squared 0.453 0.314 0.329 0.309 0.306
Panel F. Earnings News without Photos
Dep. Variable: CAR (0,0) (-1,1) (-2,2) (-3,3) (-5,5)
P(Attractiveness) 0.006 0.015 -0.009 0.031 0.036(0.071) (0.175) (-0.098) (0.321) (0.299)
N 106 106 106 106 106R-squared 0.503 0.475 0.424 0.503 0.556
69
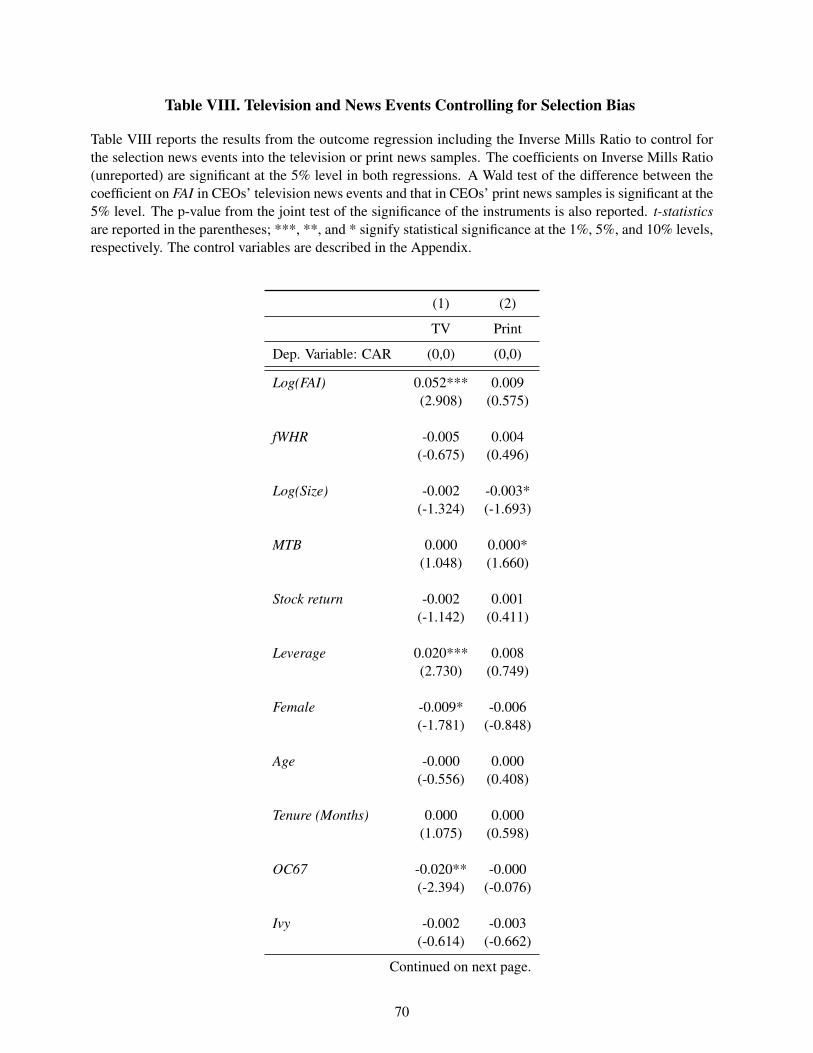
Table VIII. Television and News Events Controlling for Selection Bias
Table VIII reports the results from the outcome regression including the Inverse Mills Ratio to control forthe selection news events into the television or print news samples. The coefficients on Inverse Mills Ratio(unreported) are significant at the 5% level in both regressions. A Wald test of the difference between thecoefficient on FAI in CEOs’ television news events and that in CEOs’ print news samples is significant at the5% level. The p-value from the joint test of the significance of the instruments is also reported. t-statisticsare reported in the parentheses; ***, **, and * signify statistical significance at the 1%, 5%, and 10% levels,respectively. The control variables are described in the Appendix.
(1) (2)
TV Print
Dep. Variable: CAR (0,0) (0,0)
Log(FAI) 0.052*** 0.009(2.908) (0.575)
fWHR -0.005 0.004(-0.675) (0.496)
Log(Size) -0.002 -0.003*(-1.324) (-1.693)
MTB 0.000 0.000*(1.048) (1.660)
Stock return -0.002 0.001(-1.142) (0.411)
Leverage 0.020*** 0.008(2.730) (0.749)
Female -0.009* -0.006(-1.781) (-0.848)
Age -0.000 0.000(-0.556) (0.408)
Tenure (Months) 0.000 0.000(1.075) (0.598)
OC67 -0.020** -0.000(-2.394) (-0.076)
Ivy -0.002 -0.003(-0.614) (-0.662)
Continued on next page.
70
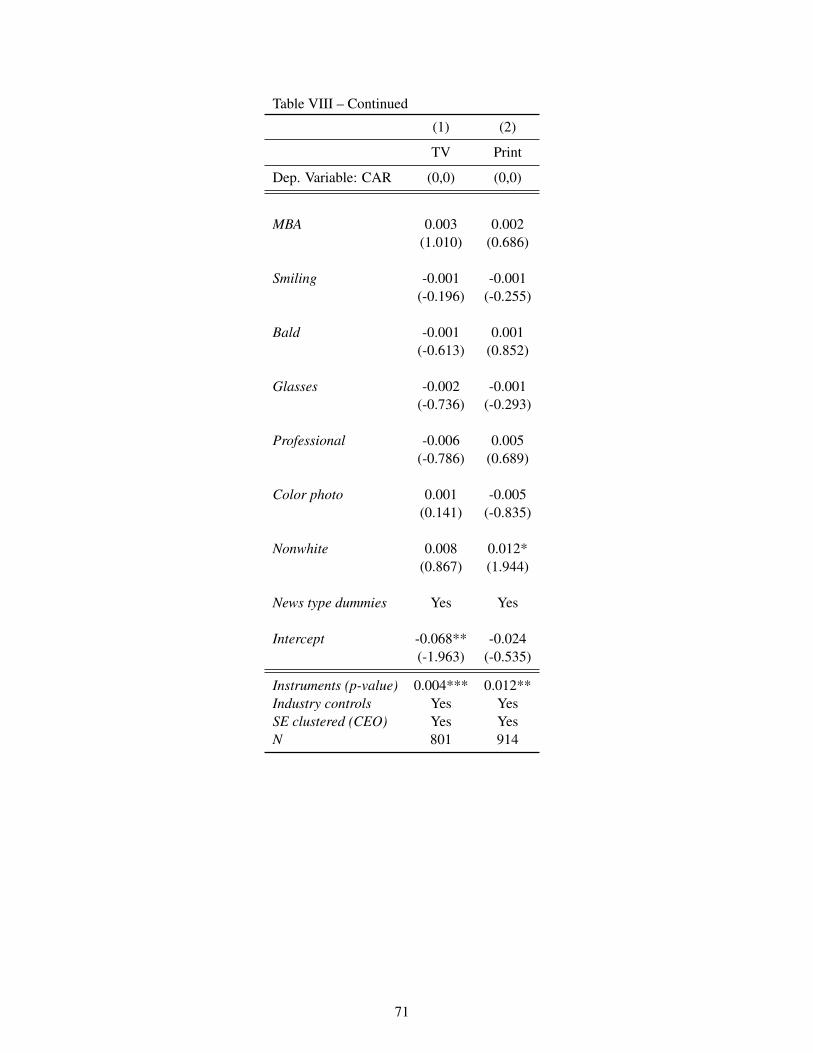
Table VIII – Continued
(1) (2)
TV Print
Dep. Variable: CAR (0,0) (0,0)
MBA 0.003 0.002(1.010) (0.686)
Smiling -0.001 -0.001(-0.196) (-0.255)
Bald -0.001 0.001(-0.613) (0.852)
Glasses -0.002 -0.001(-0.736) (-0.293)
Professional -0.006 0.005(-0.786) (0.689)
Color photo 0.001 -0.005(0.141) (-0.835)
Nonwhite 0.008 0.012*(0.867) (1.944)
News type dummies Yes Yes
Intercept -0.068** -0.024(-1.963) (-0.535)
Instruments (p-value) 0.004*** 0.012**Industry controls Yes YesSE clustered (CEO) Yes YesN 801 914
71