Embed Size (px)
Citation preview
Marginal Costing & CVP AnalysisMarginal Costing & CVP AnalysisCourtesy: Dr Gagan PareekCourtesy: Dr Gagan Pareek
www.gaganpareek.comwww.gaganpareek.com
www.gaganpareek.com24/09/2009

Dr Gagan Pareek alias Dr Harish Pareek M.Com, A.I.C.W.A, PhD
Area of Expertise : Accounting & Finance, Credit Risk Management Strategic Management
Corporate Trainer & Key Resource Person : In the area of Finance and Strategy, Leadership, Team Building and Motivation
Email: [email protected] ; Mobile:+919831865258
Research: Awarded PhD degree on “Operation of NBFCs in India- a changing profile “ in the Dept of Commerce, Calcutta University. Industry Exp: Having 12 years of experience in the area of accounting and finance, credit and risk analysis. Worked for companies like Kesoram Industries Ltd (B.K. Birla Group of Companies), UTI-ISL, Magma Fincorp Ltd. He has also been associated with academic research for the last 9 years.
24/09/2009 www.gaganpareek.com
Marginal Costing
It is a technique of segregating fixed and variable costs and therefore arriving at the cost which would vary in proportion to the volume of production or sales.
The most practical method of identifying marginal cost is to isolate the cost that can be saved when one less unit is produced under a given level.
24/09/2009 www.gaganpareek.com
Contribution
Contribution is the difference between sales value and the variable cost.
It represents the amount contributed towards fixed cost and profit.
Profit is arrived at after deducting fixed cost from contribution.
C = S – V
P = C – F or S – V = C – F
S represents Sales, V represents Variable cost
P represents Profit, C represents Contribution,
F represents Fixed Cost
24/09/2009 www.gaganpareek.com
How profit can be calculated in a multi product situation under marginal costing
• Products do not earn profits.
• Products offer only contribution.
• Fixed costs are period costs and are not related to products. They are related to business as such.
• The total fixed cost of the business should be deducted from the total contribution earned by all the products and the result will be the total profit/loss of the business.
• Fixed costs are considered separately is arriving at the profits under marginal costing.
24/09/2009 www.gaganpareek.com
Underlying message under marginal costing
Every rupee of additional contribution generated by the profitable company will straightaway augment its profit level , since being a profit making company the total fixed cost of the business as a whole stands already recovered.
Therefore, as the saying goes
“ Take care of contribution and profit will take care of itself.”
24/09/2009 www.gaganpareek.com
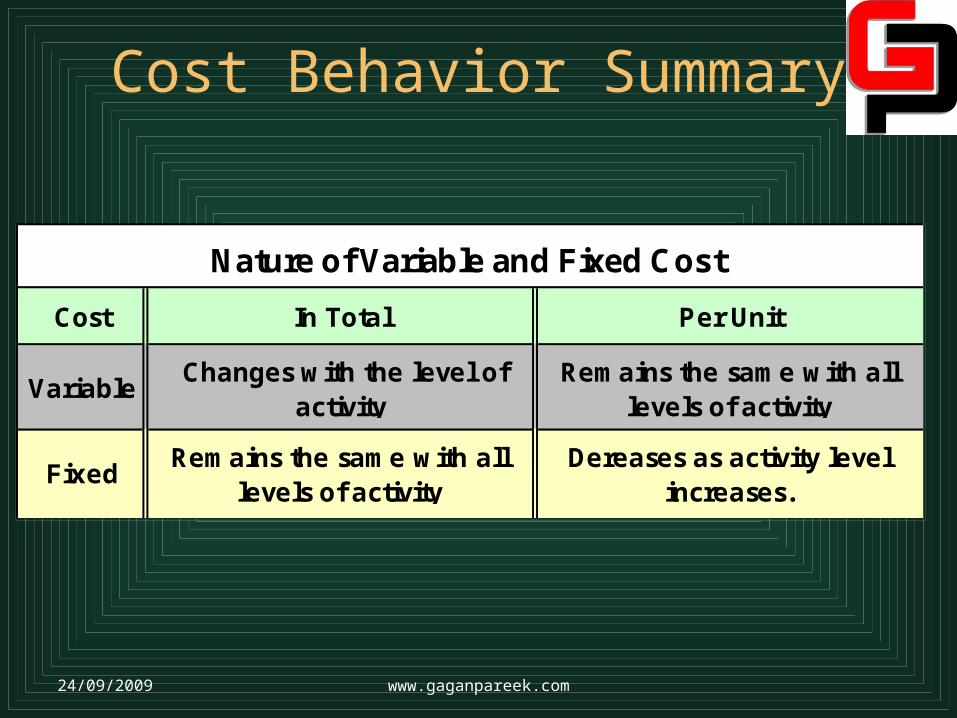
Nature of Variable and Fixed Cost
Cost In Total Per Unit
Variable Changes with the level of
activityRemains the same with all
levels of activity
FixedRemains the same with all
levels of activityDereases as activity level
increases.
Cost Behavior Summary
24/09/2009 www.gaganpareek.com
A No – Profit – No - Loss Situation is called Break Even Point.
At this point the total contribution earned is equal to the total fixed cost of the business.
Once the break even point is reached , all subsequent contributions earned will actual be the profits earned.
Break-Even Point
24/09/2009 www.gaganpareek.com
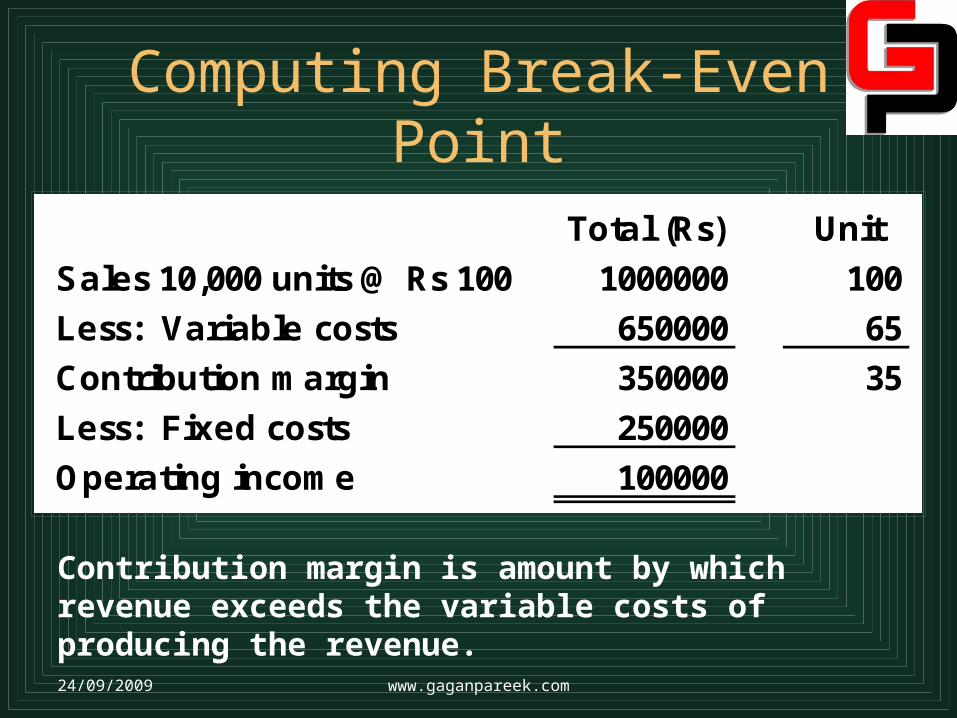
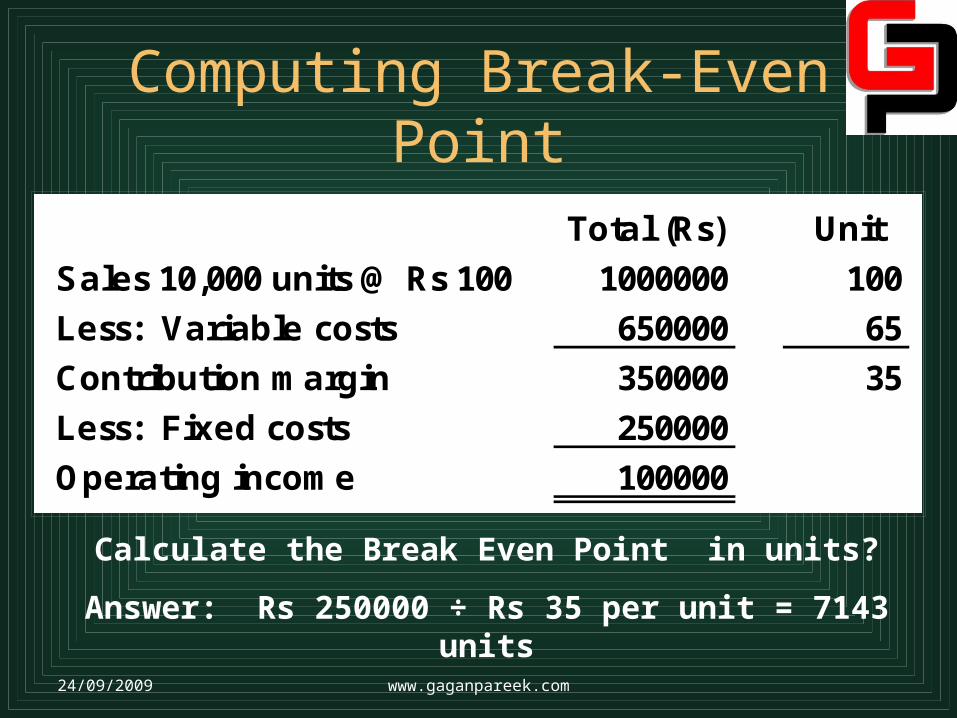
Contribution margin is amount by which revenue exceeds the variable costs of producing the revenue.
Total (Rs) Unit
Sales 10,000 units @ Rs 100 1000000 100
Less: Variable costs 650000 65
Contribution margin 350000 35
Less: Fixed costs 250000
Operating income 100000
Computing Break-Even Point
24/09/2009 www.gaganpareek.com
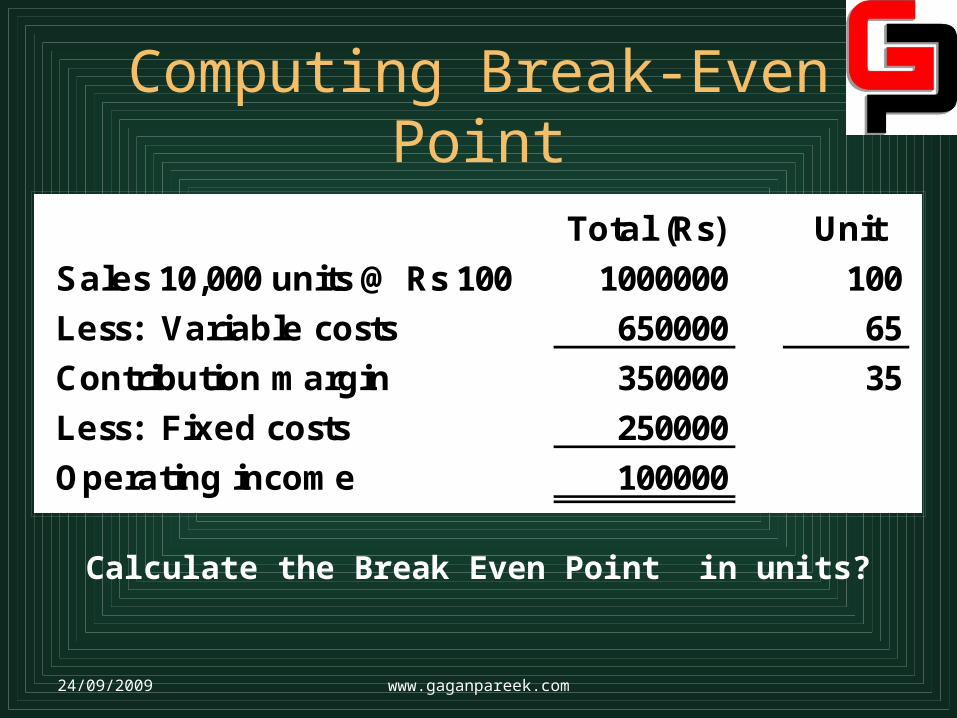
Total (Rs) Unit
Sales 10,000 units @ Rs 100 1000000 100
Less: Variable costs 650000 65
Contribution margin 350000 35
Less: Fixed costs 250000
Operating income 100000
Computing Break-Even Point
24/09/2009 www.gaganpareek.com
Calculate the Break Even Point in units?
Total (Rs) Unit
Sales 10,000 units @ Rs 100 1000000 100
Less: Variable costs 650000 65
Contribution margin 350000 35
Less: Fixed costs 250000
Operating income 100000
Computing Break-Even Point
24/09/2009 www.gaganpareek.com
Calculate the Break Even Point in units?
Answer: Rs 250000 ÷ Rs 35 per unit = 7143 units
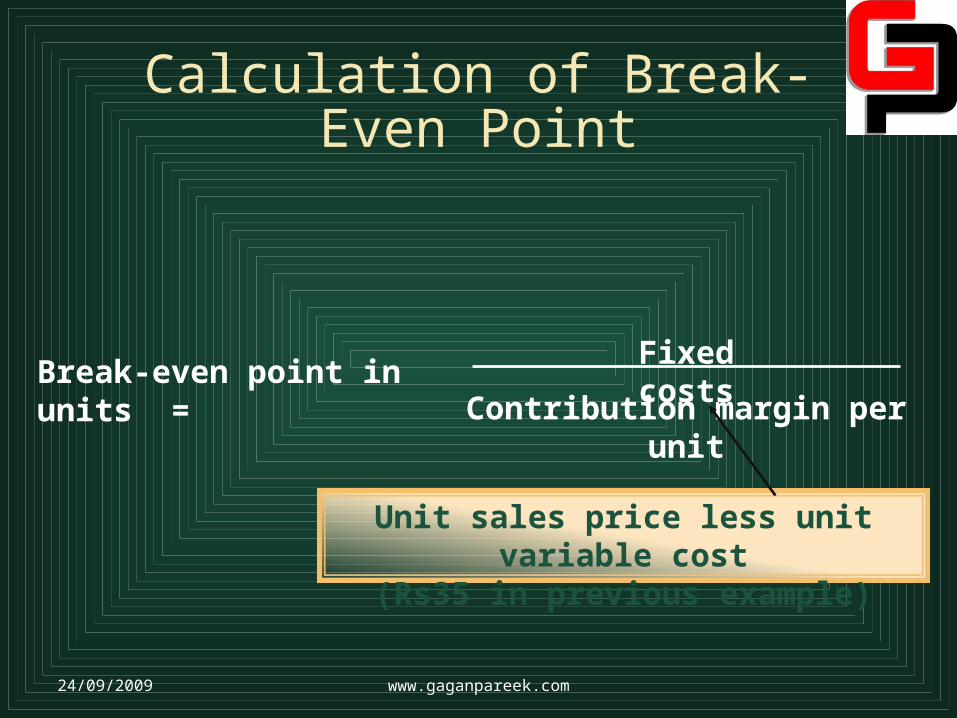
Break-even point in units = Fixed costs
Contribution margin per unit
Calculation of Break-Even Point
Unit sales price less unit variable cost(Rs35 in previous example)
24/09/2009 www.gaganpareek.com
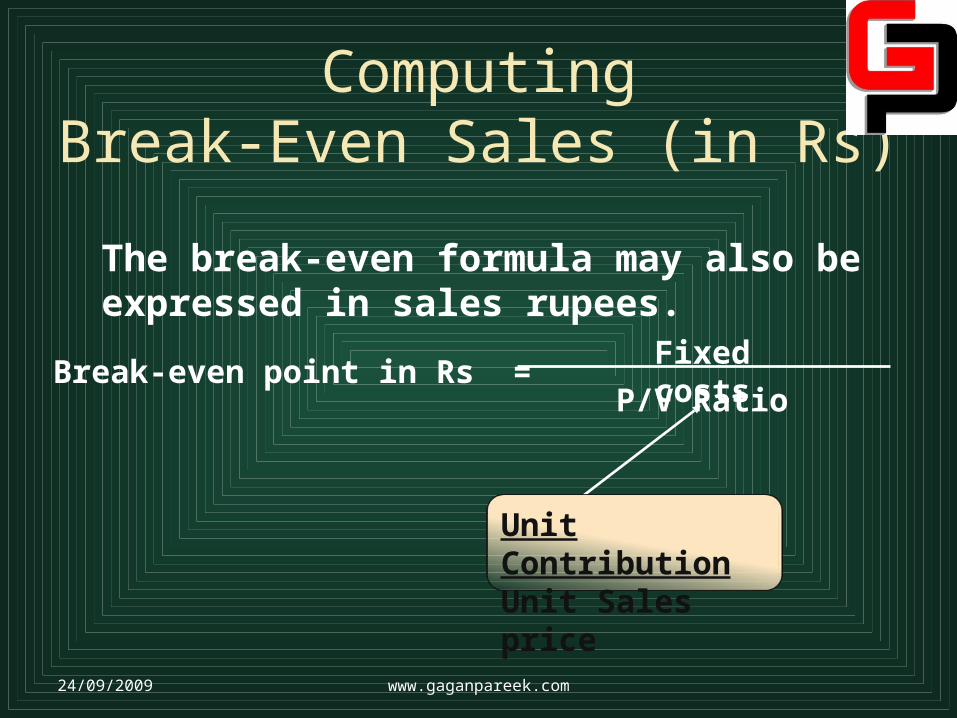
The break-even formula may also be expressed in sales rupees.
Break-even point in Rs = Fixed costs
P/V Ratio
ComputingBreak-Even Sales (in Rs)
24/09/2009 www.gaganpareek.com
Unit ContributionUnit Sales price
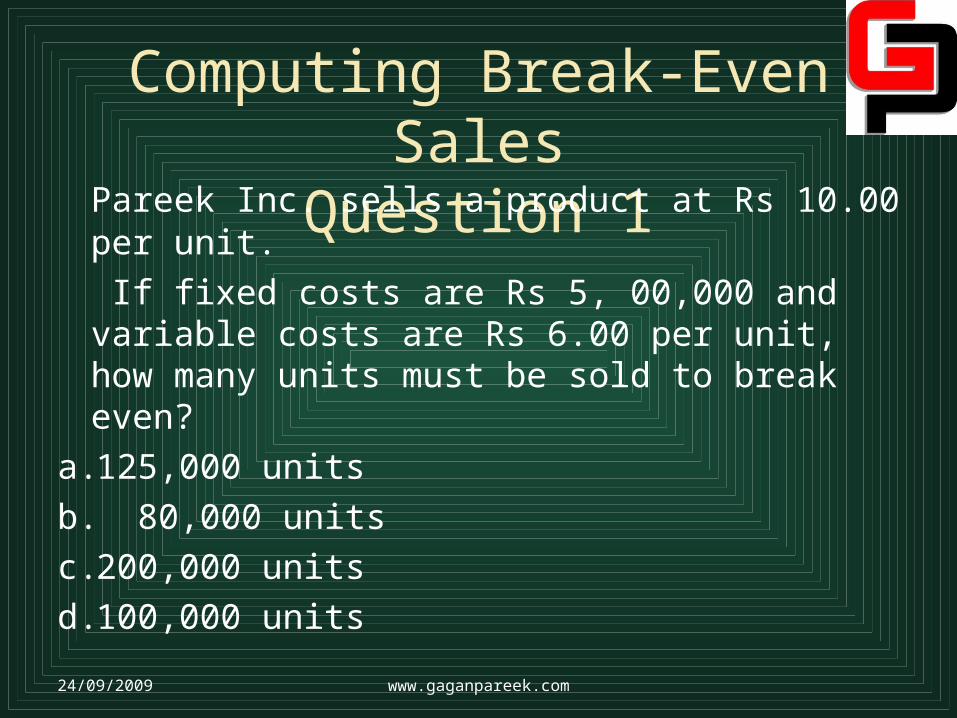
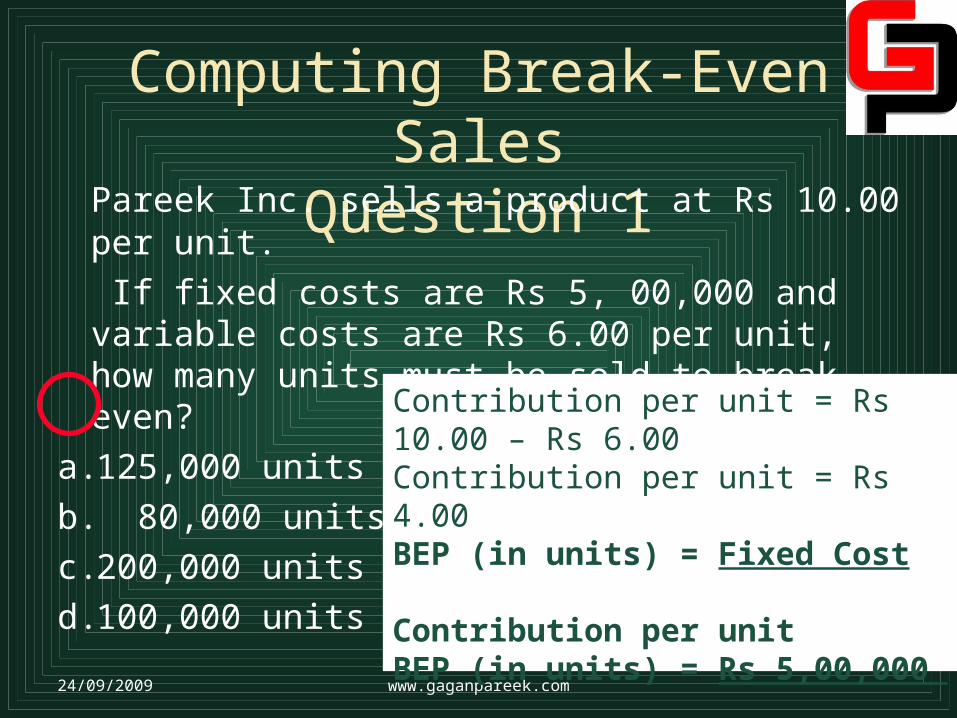
Computing Break-Even SalesQuestion 1
Pareek Inc. sells a product at Rs 10.00 per unit.
If fixed costs are Rs 5, 00,000 and variable costs are Rs 6.00 per unit, how many units must be sold to break even?
a.125,000 units
b. 80,000 units
c. 200,000 units
d.100,000 units
24/09/2009 www.gaganpareek.com
Computing Break-Even SalesQuestion 1
Pareek Inc. sells a product at Rs 10.00 per unit.
If fixed costs are Rs 5, 00,000 and variable costs are Rs 6.00 per unit, how many units must be sold to break even?
a.125,000 units
b. 80,000 units
c. 200,000 units
d.100,000 units
24/09/2009 www.gaganpareek.com
Contribution per unit = Rs 10.00 – Rs 6.00Contribution per unit = Rs 4.00BEP (in units) = Fixed Cost
Contribution per unitBEP (in units) = Rs 5,00,000 Rs 4.00BEP ( in units ) = 1,25,000
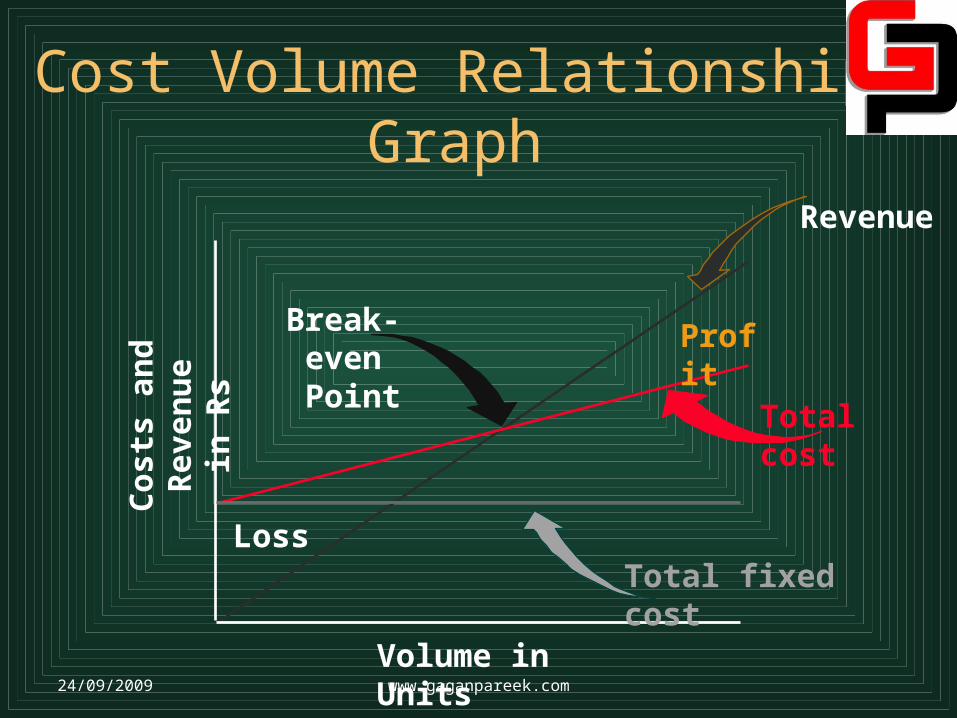
Total cost
Volume in Units
Co
sts
and
Rev
enu
ein
Rs
Total fixed cost
Break-even Point
Profit
Loss
Revenue
Cost Volume Relationship Graph
24/09/2009 www.gaganpareek.com
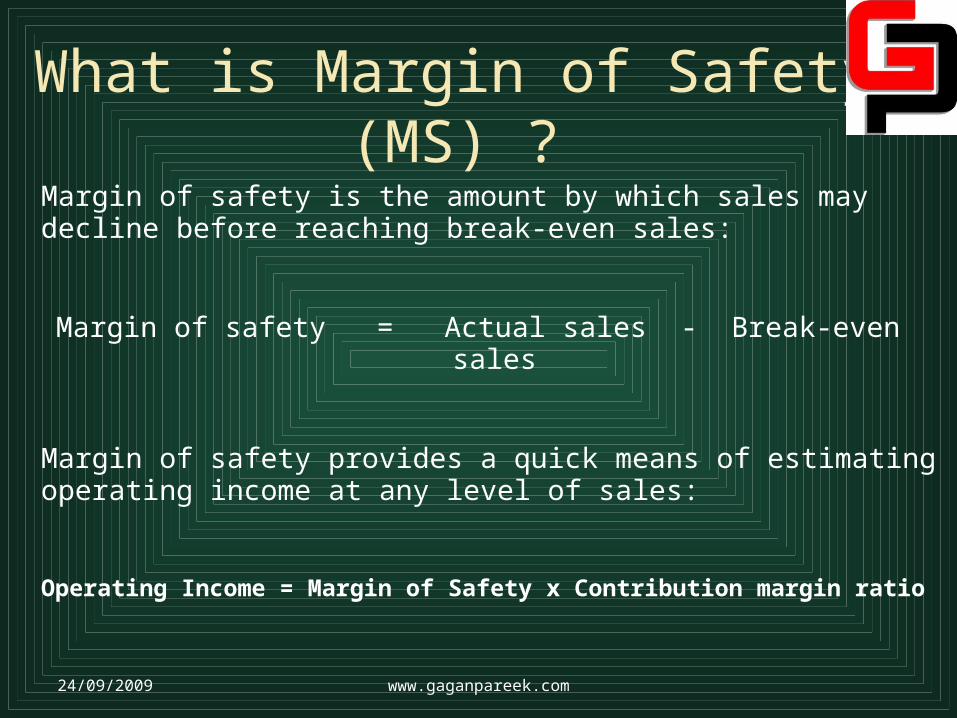
Margin of safety is the amount by which sales may decline before reaching break-even sales:
Margin of safety = Actual sales - Break-even sales
Margin of safety provides a quick means of estimating operating income at any level of sales:
Operating Income = Margin of Safety x Contribution margin ratio
What is Margin of Safety (MS) ?
24/09/2009 www.gaganpareek.com

Practical Applications of CVP Analysis
24/09/2009 www.gaganpareek.com
Practical Applications of CVP Analysis
Fixation of Selling Price: The cost of the product and the desired profitability are two important factors which govern the fixation of selling price.
Maintaining a desired level of profit: In the face of price cuts, in case the demand for the company’s product is elastic, the minimum level of profit can be maintained by pushing up the sales. The volume of such sales can be found out by the marginal costing technique.
24/09/2009 www.gaganpareek.com
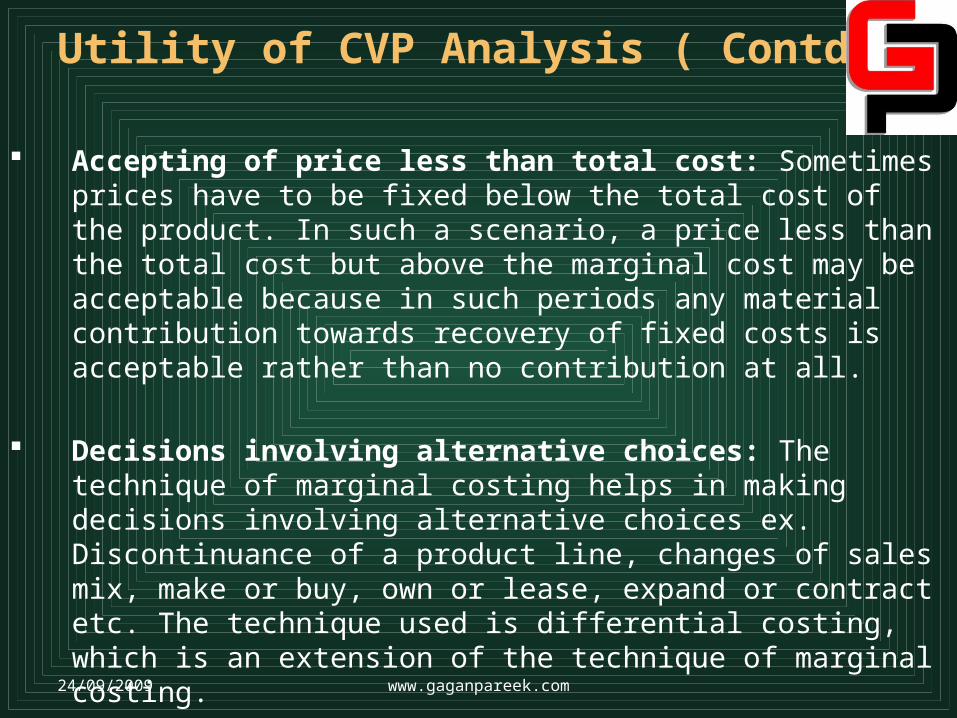
Utility of CVP Analysis ( Contd )
Accepting of price less than total cost: Sometimes prices have to be fixed below the total cost of the product. In such a scenario, a price less than the total cost but above the marginal cost may be acceptable because in such periods any material contribution towards recovery of fixed costs is acceptable rather than no contribution at all.
Decisions involving alternative choices: The technique of marginal costing helps in making decisions involving alternative choices ex. Discontinuance of a product line, changes of sales mix, make or buy, own or lease, expand or contract etc. The technique used is differential costing, which is an extension of the technique of marginal costing.
24/09/2009 www.gaganpareek.com
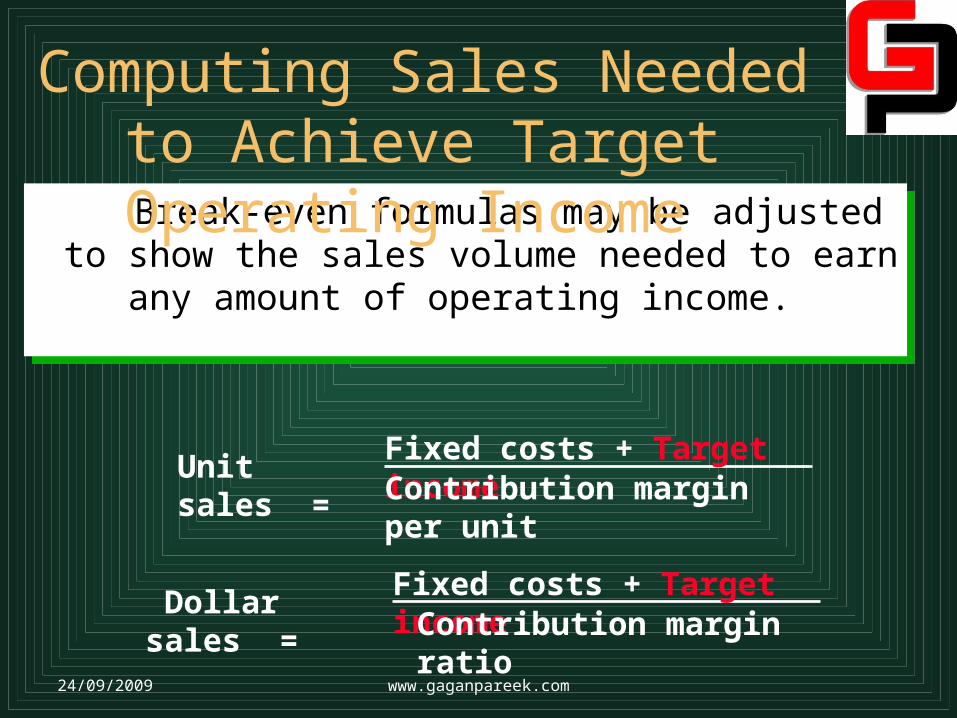
Break-even formulas may be adjusted to show the sales volume needed to earn
any amount of operating income.
Break-even formulas may be adjusted to show the sales volume needed to earn
any amount of operating income.
Unit sales = Fixed costs + Target incomeContribution margin per unit
Dollar sales = Fixed costs + Target income
Contribution margin ratio
Computing Sales Needed to Achieve Target Operating Income
24/09/2009 www.gaganpareek.com
Practical Applications of CVP
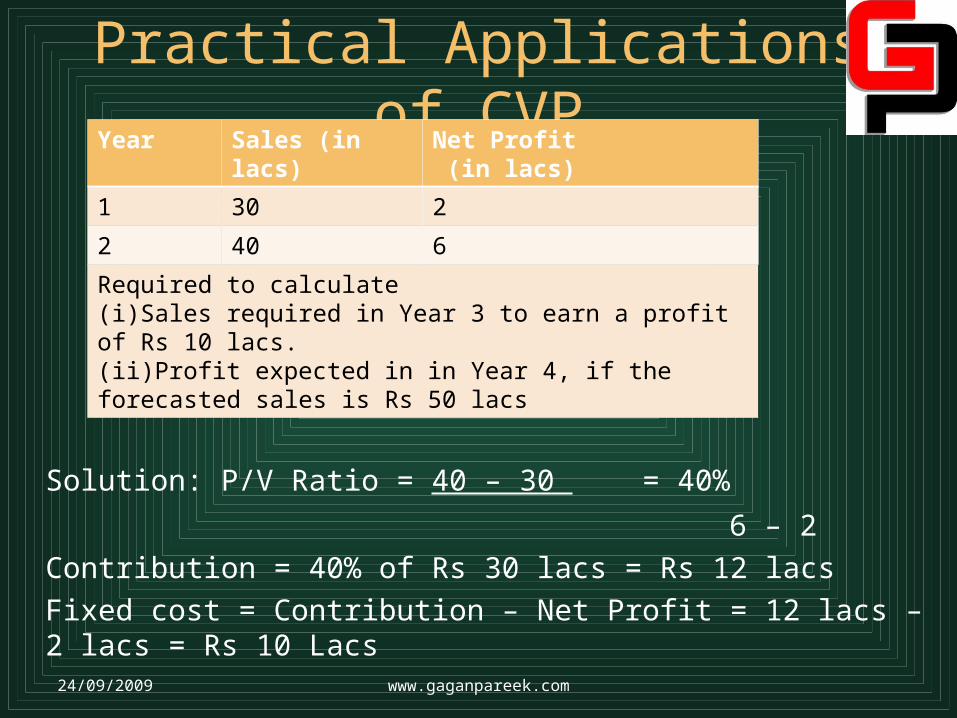
Solution: P/V Ratio = 40 – 30 = 40%
6 – 2
Contribution = 40% of Rs 30 lacs = Rs 12 lacs
Fixed cost = Contribution – Net Profit = 12 lacs – 2 lacs = Rs 10 Lacs
24/09/2009 www.gaganpareek.com
Year Sales (in lacs) Net Profit (in lacs)
1 30 2
2 40 6
Required to calculate (i)Sales required in Year 3 to earn a profit of Rs 10 lacs.(ii)Profit expected in in Year 4, if the forecasted sales is Rs 50 lacs
Practical Applications of CVP
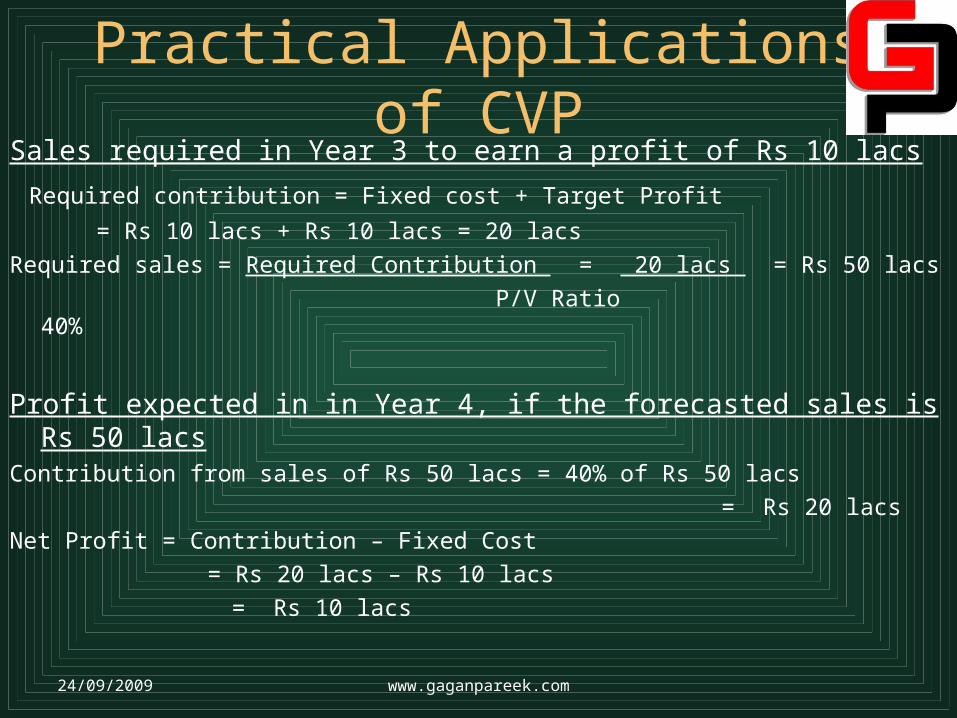
Sales required in Year 3 to earn a profit of Rs 10 lacs
Required contribution = Fixed cost + Target Profit
= Rs 10 lacs + Rs 10 lacs = 20 lacs
Required sales = Required Contribution = 20 lacs = Rs 50 lacs
P/V Ratio 40%
Profit expected in in Year 4, if the forecasted sales is Rs 50 lacsContribution from sales of Rs 50 lacs = 40% of Rs 50 lacs
= Rs 20 lacs
Net Profit = Contribution – Fixed Cost
= Rs 20 lacs – Rs 10 lacs
= Rs 10 lacs
24/09/2009 www.gaganpareek.com
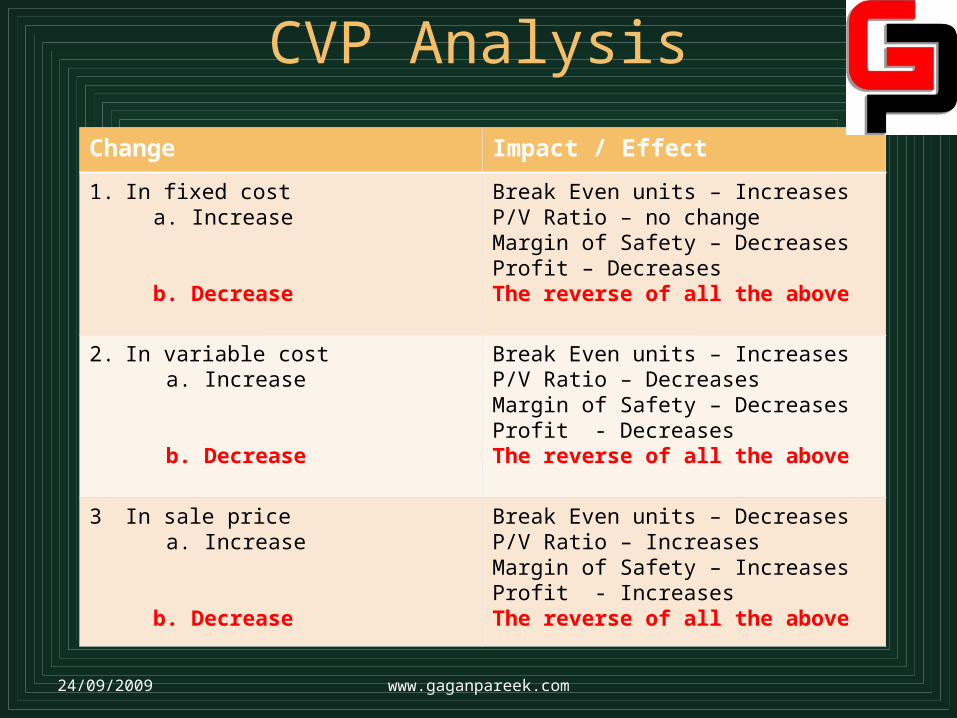
CVP Analysis
Change Impact / Effect
1. In fixed cost a. Increase
b. Decrease
Break Even units – IncreasesP/V Ratio – no changeMargin of Safety – DecreasesProfit – DecreasesThe reverse of all the above
2. In variable cost a. Increase
b. Decrease
Break Even units – IncreasesP/V Ratio – DecreasesMargin of Safety – DecreasesProfit - DecreasesThe reverse of all the above
3 In sale price a. Increase
b. Decrease
Break Even units – DecreasesP/V Ratio – IncreasesMargin of Safety – IncreasesProfit - IncreasesThe reverse of all the above
24/09/2009 www.gaganpareek.com
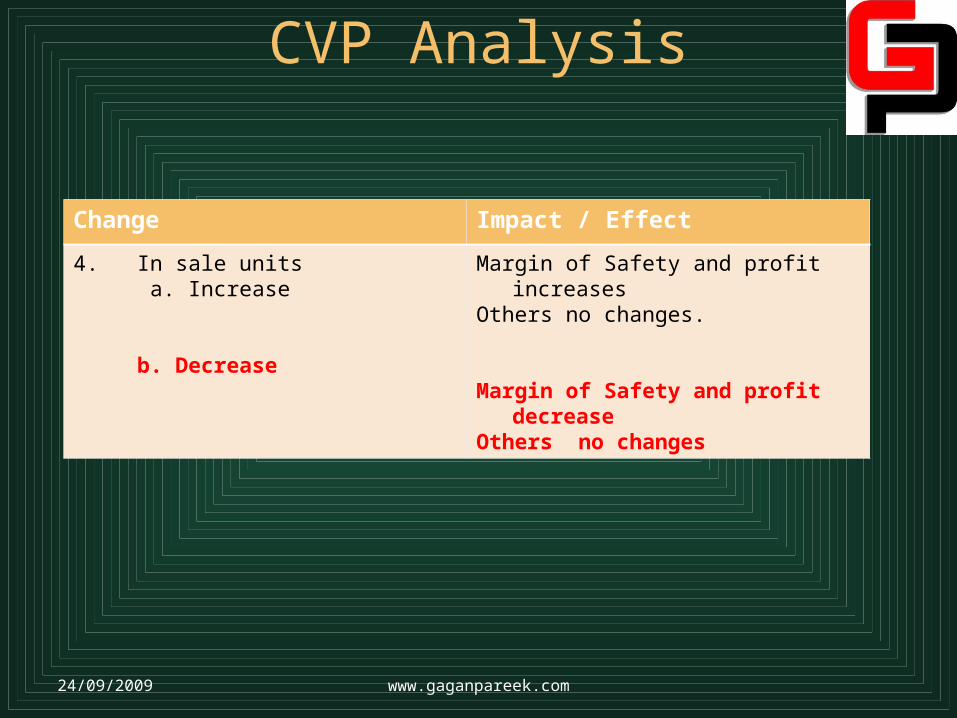
CVP Analysis
Change Impact / Effect
4. In sale units a. Increase
b. Decrease
Margin of Safety and profit increasesOthers no changes.
Margin of Safety and profit decreaseOthers no changes
24/09/2009 www.gaganpareek.com
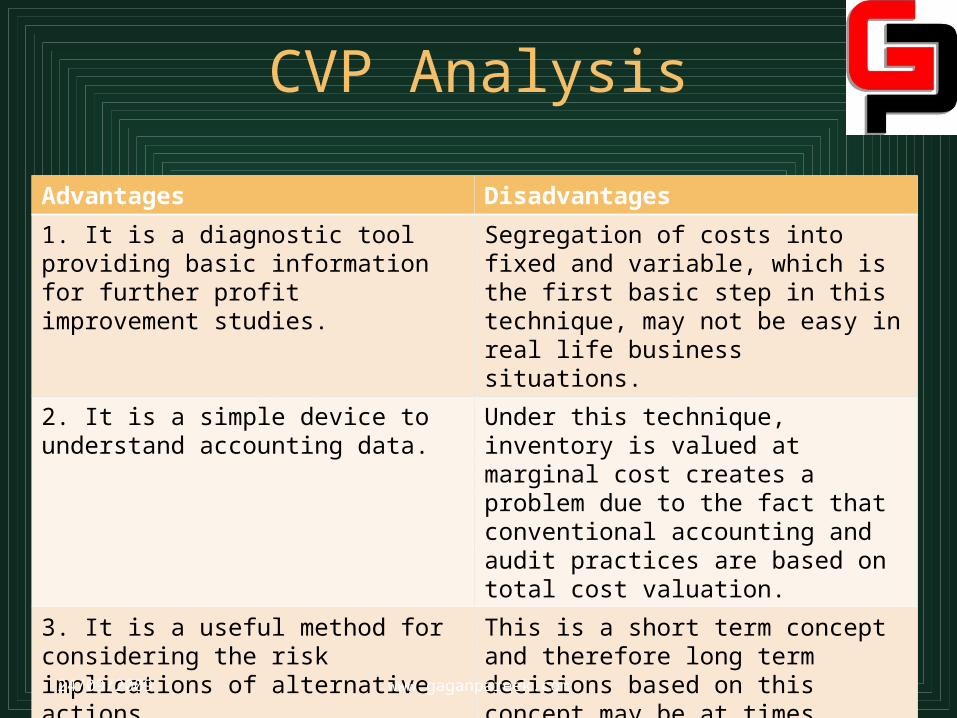
CVP Analysis
Advantages Disadvantages
1. It is a diagnostic tool providing basic information for further profit improvement studies.
Segregation of costs into fixed and variable, which is the first basic step in this technique, may not be easy in real life business situations.
2. It is a simple device to understand accounting data.
Under this technique, inventory is valued at marginal cost creates a problem due to the fact that conventional accounting and audit practices are based on total cost valuation.
3. It is a useful method for considering the risk implications of alternative actions
This is a short term concept and therefore long term decisions based on this concept may be at times erroneous.
24/09/2009 www.gaganpareek.com
References:
® Berk Jonathan & DeMarzo Peter ,Financial Management, Pearson Education, 2008
® Maheshwari .S.N. & Maheshwari S.K., Accounting for Management, Vikas Publication, 2008.
® Srivastava Rajiv & Mishra Anil, Financial Management, Oxford Higher Education, 2008
® Cunningham David Hey , Financial Statements Demystified, Allen & Unwin ,2007
® B.Banerjee, Financial Policy and Management Accounting, 7th Edition, Prentice Hall of India
www.gaganpareek.com