Embed Size (px)
Citation preview
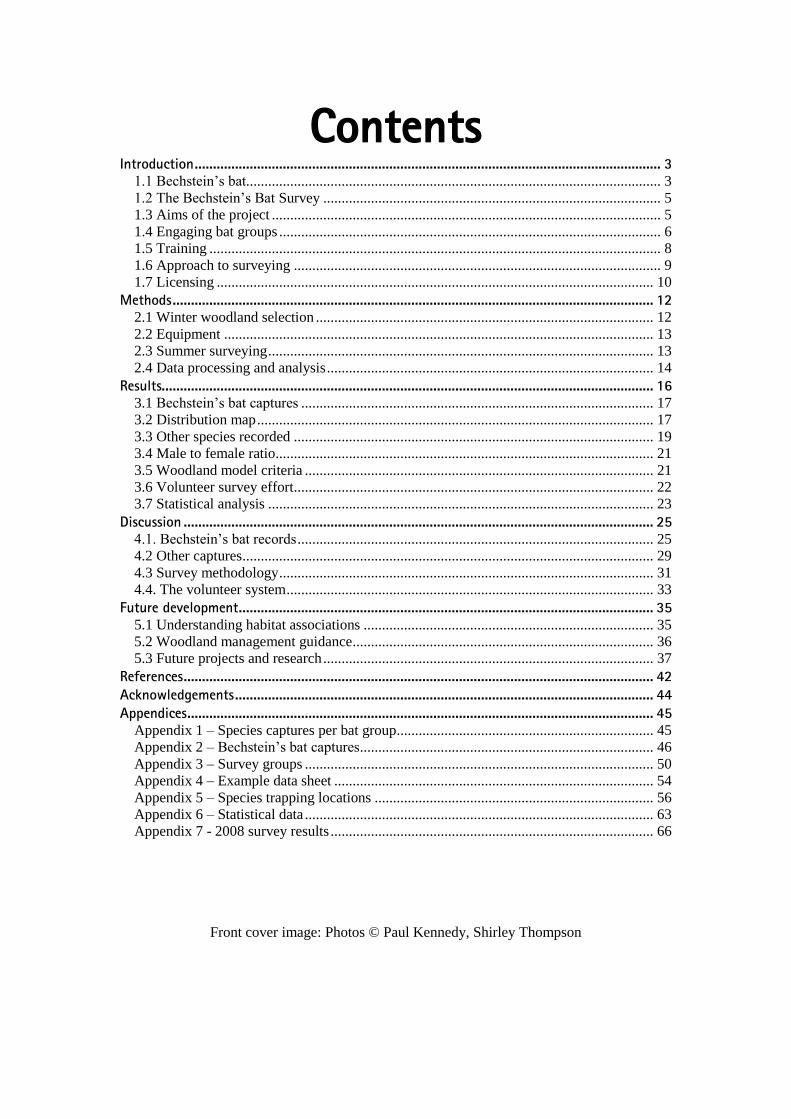
Bechstein’s Bat SurveyFinal report
September 2007 – September 2011
Report prepared by Helen MillerBechstein’s Bat Survey Officer
Contents Introduction ............................................................................................................................... 3
1.1 Bechstein’s bat................................................................................................................. 3 1.2 The Bechstein’s Bat Survey ............................................................................................ 5 1.3 Aims of the project .......................................................................................................... 5 1.4 Engaging bat groups ........................................................................................................ 6 1.5 Training ........................................................................................................................... 8 1.6 Approach to surveying .................................................................................................... 9 1.7 Licensing ....................................................................................................................... 10
Methods ................................................................................................................................... 12 2.1 Winter woodland selection ............................................................................................ 12 2.2 Equipment ..................................................................................................................... 13 2.3 Summer surveying ......................................................................................................... 13 2.4 Data processing and analysis ......................................................................................... 14
Results...................................................................................................................................... 16 3.1 Bechstein’s bat captures ................................................................................................ 17 3.2 Distribution map ............................................................................................................ 17 3.3 Other species recorded .................................................................................................. 19 3.4 Male to female ratio ....................................................................................................... 21 3.5 Woodland model criteria ............................................................................................... 21 3.6 Volunteer survey effort .................................................................................................. 22 3.7 Statistical analysis ......................................................................................................... 23
Discussion ................................................................................................................................ 25 4.1. Bechstein’s bat records ................................................................................................. 25 4.2 Other captures ................................................................................................................ 29 4.3 Survey methodology ...................................................................................................... 31 4.4. The volunteer system .................................................................................................... 33
Future development ................................................................................................................. 35 5.1 Understanding habitat associations ............................................................................... 35 5.2 Woodland management guidance .................................................................................. 36 5.3 Future projects and research .......................................................................................... 37
References ................................................................................................................................ 42 Acknowledgements .................................................................................................................. 44 Appendices ............................................................................................................................... 45
Appendix 1 – Species captures per bat group ...................................................................... 45 Appendix 2 – Bechstein’s bat captures ................................................................................ 46 Appendix 3 – Survey groups ............................................................................................... 50 Appendix 4 – Example data sheet ....................................................................................... 54 Appendix 5 – Species trapping locations ............................................................................ 56 Appendix 6 – Statistical data ............................................................................................... 63 Appendix 7 - 2008 survey results ........................................................................................ 66
Front cover image: Photos © Paul Kennedy, Shirley Thompson
2
Project summary
The Bechstein’s Bat Survey was a four year funded project which aimed to map the UK
distribution of the elusive Bechstein’s bat. Based on pilot work in south-east England (by Dr
David Hill and Frank Greenaway), selected woodlands in southern England and south Wales
were surveyed to gather more information about the species’ range and habitat associations,
and to identify conservation hotspots.
Ten local bat groups took part in the project; North Buckinghamshire, Cornwall, Devon,
Dorset, Gloucestershire, Kent, Oxfordshire, Somerset, Surrey and Worcestershire. Between
2009 and 2011, 199 target woodlands were surveyed in which 838 bats of 12 species were
caught, identified and released. This included 57 Bechstein’s bats (29 female and 28 males) at
37 sites.
In addition 47 woodlands were surveyed by individuals from Carmarthenshire, Cornwall,
Dyfed, Oxfordshire and Surrey Bat Groups in 2008. However, adverse weather conditions
had a major effect on capture rates, and so the results of these surveys were not included in
the final analysis.
New records of Bechstein’s bats were obtained for sites in Buckinghamshire, Dorset,
Gloucestershire, Kent, Somerset, Surrey and Worcestershire. When combined with the results
of the pilot study, the data indicate hotspots in the distribution of breeding colonies of
Bechstein’s bat in Dorset/Somerset, southwest Hampshire/IOW and Sussex. Furthermore this
work extends the known range of this species within the UK. The records collected in
Buckinghamshire and Worcestershire are now the most northern UK records for breeding
females of this species. Smaller populations on the edge of the species distribution such as
Buckinghamshire and Worcestershire may differ in their habitat requirements and are likely to
be more vulnerable to environmental change and management practices.
This work has demonstrated that the selection of woodlands for survey that most closely
match the habitat characteristics of sites known to support maternity colonies, has been an
effective method for extending our knowledge of the distribution of Bechstein’s bat.
The results of the Bechstein’s Bat Survey will feed directly into specific woodland
management guidance that the Bat Conservation Trust is now producing for Bechstein’s bat.
Further survey work is now underway to build on these results, with local projects
undertaking more intensive survey work and radio-tracking to identify roosting sites and
better understand Bechstein’s bat use of newly identified woodland sites and the surrounding
habitat.
3
Introduction
This is the final project report for the Bat Conservation Trust’s (BCT) Bechstein’s Bat
Survey. The report is aimed at funders and bat group volunteers.
1.1 Bechstein’s bat
As one of the UK’s rarest mammals Bechstein’s bat (Myotis bechsteinii) is listed on Annex II
of the EC Habitats and Species Directive (JNCC, 2007) and is a Biodiversity Action Plan
priority species. It is also listed as near threatened on the IUCN red list (IUCN, 2011).
In the UK Bechstein’s bat is restricted to parts of southern England and south Wales, which
comprise the northwestern edge of its European range. In Europe this species is found from
England to Caucasus, and south to the Mediterranean (Harris et al., 2008).
Bechstein’s bat is predominantly associated with ancient broadleaf woodlands (Greenaway &
Hill, 2004); and previous studies have shown a strong association with oak and ash woodland
(Hill & Greenaway, 2006). In the UK this species is thought to use woodlands all year round,
favouring old woodpecker holes for both summer and winter roosting, although winter
records for this species are rare. During the summer female Bechstein’s bats form maternity
colonies. These colonies use multiple roosts throughout the season, frequently splitting into
subgroups (Kerth & Koenig, 1999) and switching roost sites regularly. Bechstein’s bat is a
gleaning bat with a preference for moths, with most foraging occurring in closed canopy
(Harris & Yalden, 2008). Studies have shown that foraging occurs close to the roosting site,
with bats rarely flying more than 1.5km between roost and feeding site (Schofield & Morris,
2000).
This species is notoriously difficult to survey for using standard monitoring techniques. It
rarely leaves the cover of its roosting site until after dark, tending to forage high up in the
canopy, where its low intensity echolocation calls make it difficult to detect using standard
ultrasonic detectors (Hill & Greenaway, 2006). Any echolocation calls that are recorded are
difficult to identify accurately to species, as call structure for many of the Myotis species
overlaps (e.g. Parsons & Jones, 2000). Additionally Bechstein’s bat avoids both harp traps
and mist nets making capture for identification in the hand very challenging.
The great difficulty involved in detecting and surveying for Bechstein’s bat using traditional
methods resulted in a lack of basic knowledge of the species' distribution and population size.
Until the late 1990s there were very few records for this species, mostly of isolated
individuals rather than confirmed roosting sites, providing very little information on the
habitat requirements of Bechstein’s bat, its conservation status or the threats it faced. In 1999
the first maternity colony at Ebernoe Common, in West Sussex was found (F. Greenway per
comm., 2011). This is one of the earliest confirmed maternity colonies in the UK for
Bechstein’s bat and is now a well-studied site for this species. Following this discovery and
additional roosts recorded in the surrounding area work began on a new technique to
effectively survey for this species in UK woodlands.
Frank Greenaway developed and trialed the first synthesizer and was later joined by Dr David
Hill and the University of Sussex who together developed an ultrasound synthesizer (the
Sussex Autobat) that acts as an acoustic lure, greatly enhancing the ability to catch
4
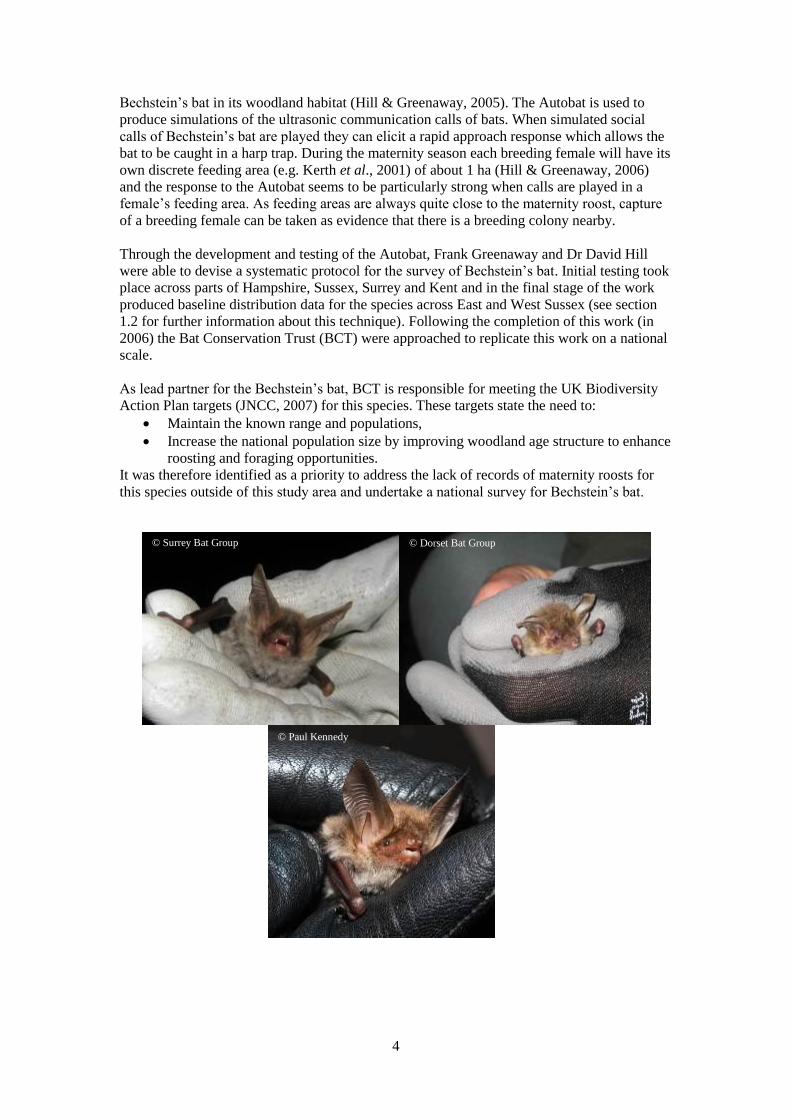
Bechstein’s bat in its woodland habitat (Hill & Greenaway, 2005). The Autobat is used to
produce simulations of the ultrasonic communication calls of bats. When simulated social
calls of Bechstein’s bat are played they can elicit a rapid approach response which allows the
bat to be caught in a harp trap. During the maternity season each breeding female will have its
own discrete feeding area (e.g. Kerth et al., 2001) of about 1 ha (Hill & Greenaway, 2006)
and the response to the Autobat seems to be particularly strong when calls are played in a
female’s feeding area. As feeding areas are always quite close to the maternity roost, capture
of a breeding female can be taken as evidence that there is a breeding colony nearby.
Through the development and testing of the Autobat, Frank Greenaway and Dr David Hill
were able to devise a systematic protocol for the survey of Bechstein’s bat. Initial testing took
place across parts of Hampshire, Sussex, Surrey and Kent and in the final stage of the work
produced baseline distribution data for the species across East and West Sussex (see section
1.2 for further information about this technique). Following the completion of this work (in
2006) the Bat Conservation Trust (BCT) were approached to replicate this work on a national
scale.
As lead partner for the Bechstein’s bat, BCT is responsible for meeting the UK Biodiversity
Action Plan targets (JNCC, 2007) for this species. These targets state the need to:
Maintain the known range and populations,
Increase the national population size by improving woodland age structure to enhance
roosting and foraging opportunities.
It was therefore identified as a priority to address the lack of records of maternity roosts for
this species outside of this study area and undertake a national survey for Bechstein’s bat.
© Paul Kennedy
© Dorset Bat Group © Surrey Bat Group

5
1.2 The Bechstein’s Bat Survey
The BCT Bechstein’s Bat Survey was a 4-year funded project that aimed to produce a more
comprehensive distribution map for this species based on systematically collected survey
data. The project is based and builds on the pilot surveys carried out in the south east of
England in 2005 and 2006 (Hill & Greenaway, 2006), and was fortunate to have both Dr
David Hill and Frank Greenaway acting as advisors throughout the duration of the project.
The survey method comprised an initial phase of site selection within the species' known
range in which target woods were chosen that most closely match habitats where breeding
colonies of the species have been recorded. The selected woodlands were then surveyed using
the Sussex Autobat to attract the bats into harp traps in which they were caught. The
successful capture of a female Bechstein’s bat between May and September indicates that
there is a maternity colony nearby. By completing surveys in selected woodlands across the
likely range of the species using a standardized and repeatable method, we can gain a large-
scale understanding of the distribution of the species and provide a baseline for future
assessment of change.
A key feature and success of the project was the involvement and engagement of local bat
groups who were given special training in the required techniques and provided with the
necessary equipment. These groups then organised the surveys within their county, which
allowed the survey of woodlands over a large area within the project time frame. A total of 12
bat groups took part over the four years of the project (see section 1.4). This approach also
allowed us to share knowledge and develop skills across the bat group network.
1.3 Aims of the project
The overall aims of the project were to:
Deliver systematically acquired baseline distribution data for Bechstein’s bat across
its entire range in England and Wales.
Delineate the species’ range and hotspots for conservation action.
Understand the habitat associations of the species across its range in the UK.
Provide a baseline against which ongoing presence of the species in 10km squares can
be monitored for future Biodiversity Action Plan reporting and conservation status
assessments. (Note that the survey was about mapping the distribution of core
breeding maternity colonies, male only presence and inference of likely absence of a
breeding maternity colony during the survey event - a much more detailed result than
just a snapshot of presence/absence).
In addition, the project aim for wider woodland bat communities was to:
Provide preliminary data on the distribution of other woodland bat species in relation
to woodland quality by recording all other species caught during the surveys. This
would provide a valuable foundation for a comprehensive study of the relationship
between woodland quality and the structure and diversity of bat communities.
6
1.4 Engaging bat groups
A key element of the project was to involve local bat groups so that they could develop new
skills and take on the responsibility for organising the surveys in their own areas. To this end,
individuals from local bat groups were provided with the skills, knowledge and equipment
necessary to survey their county following a standard method.
1.4.1 Survey area The overall aim of the project was to survey the known range of the Bechstein’s bat (based on
what was currently known about female records) and the counties that neighbour this area,
thereby giving the best opportunity to achieve an accurate picture of Bechstein’s bat’s UK
distribution. Sussex had already been comprehensively surveyed during a pilot study (Hill &
Greenaway, 2006), as had the Isle of Wight (Davidson-Watts, 2008). The original study area
was therefore selected to be southern England and South Wales with the following counties
specified as priorities; Dorset, Hampshire, Gloucestershire, Somerset and Wiltshire.
Each group was asked to commit to surveying one woodland in each 10km square in their
county. Some of the groups initially approached (Hampshire and Wiltshire) were unable to
take part due to time and resource limitations. This meant that there were some gaps in the
survey effort in the core areas, but did allow the inclusion of some additional counties that
were not initially a priority.
1.4.2 Bat groups Three to four local bat groups were approached for each year of the project. Each group
selected two individuals to act as co-ordinators for the duration of their involvement in the
project. These co-ordinators attended relevant training and were responsible for organising the
survey effort in the county.
Bat groups involved in 2008 surveys:
Carmarthenshire/Dyfed (individuals from these two bat groups surveyed woodlands
across Carmarthenshire, Ceredigion and Glamorgan)
Cornwall
Oxfordshire
Surrey
In the first year of the project (September 2007 – September 2008) 47 target woodlands
were surveyed, in which 139 bats of 11 species were captured. This included three
Bechstein's bats, all of which (two males and one female) were recorded in Surrey.
Long-term monitoring of Bechstein’s bat populations in the south-east of England suggested
that there had been a reduction in the breeding success of this species over the summer of
2008 (F Greenaway, pers. comm., 2008). This was thought to be in response to the
unfavourable weather conditions of the summers of 2007 and 2008. The Autobat acoustic lure
appears to be most effective when played in the feeding areas of breeding females (see 2.3.2
below), thus the reduced breeding success also directly affected the data collected for the
project in 2008 (Bat Conservation Trust, 2009). A decision was taken to re-survey three of the
2008 areas (Cornwall, Oxfordshire and Surrey), between May and September 2009, to ensure
that data collected for the project would provide the best representation of Bechstein’s bat
distribution in these counties.
As a result, survey data collected during the 2008 survey period was not included in the main
data analysis. 2008 results are given in Appendix 7.
7
Figure 1 – County map with groups that took part
Bat groups involved in 2009 surveys
Cornwall (re-survey)
Devon
Dorset
Kent
Oxfordshire (re-survey)
Surrey (re-survey)
Bat groups involved in 2009 surveys
Cornwall (re-survey)
Devon
Dorset
Kent
Surrey (re-survey)
Oxfordshire (re-survey)
Bat groups involved in 2010 surveys
Buckinghamshire
Devon (completing surveys)
Dorset (completing surveys)
Gloucestershire
Kent (completing surveys)
Somerset
Worcestershire
11
1
2
3
4
5
6
7 8
9 10
12
13
Key
1 Cornwall
2 Devon
3 Somerset
4 Dorset
5 Gloucestershire
6 Worcestershire
7 Oxfordshire
8 Buckinghamshire
9 Surrey
10 Kent
11 Glamorgan
12 Carmarthenshire
13 Ceredigion
8
Bat groups involved in 2011 surveys
Buckinghamshire (completing surveys)
Gloucestershire (completing surveys)
Somerset (completing surveys)
Worcestershire (completing surveys)
These counties are shown in Figure 1 to illustrate geographical location.
1.5 Training
The selected co-ordinators from each bat group were asked to attend a one-day woodland
selection course and a four-day practical training session.
1.5.1 Woodland selection training course The woodland selection training aimed to provide attendees with the skills they required to
assess and select woodlands according to the habitat model used in this project (See section
2.1). These courses were held in the winter months as woodland selection is easier to
complete when trees are not in leaf. It also gave groups time to do some of the necessary
selection work prior to the summer survey season each year. The course was tutored by Frank
Greenaway and consisted of a number of visits to woodlands in the Sussex area to highlight
different characteristics of the woodland selection model. Following the course, attendees
were able to use the specified criteria to select woodlands that exhibited the most potential for
Bechstein’s bats in their respective counties.
These courses took place on:
23 February 2008
13 December 2008
16 January 2009
1.5.2 Practical training course A four day intensive training course was held at Juniper Hall Field Studies Centre in Surrey.
9-12 May 2008
1-4 May 2009
7-10 May 2010
The course was tutored by the project’s expert advisors, Frank Greenaway and Dr David Hill,
and covered all aspects of the project and the skills required by the co-ordinators to complete
their surveys in a mixture of classroom sessions and practical evening site visits.
All of the co-ordinators who participated in the courses agreed that the training had been
extremely worthwhile and had provided them with all of the skills that they required to
undertake surveying on behalf of the project in their respective counties. Some examples of
feedback are given in Box 1.
9
Box 1- Examples of feedback from the main training course for survey co-ordinators
Coordinators were also asked for their feedback on the training they received as part of a
questionnaire. 100% of coordinators responded that the main training course was excellent or
good. The main comments regarding potential improvements to the training related to the cold
temperatures on some nights of the course which resulted in a small number of bats being
caught and hence less opportunity for handling practice.
Devon Bat Group attendee: “A thousand thanks to you, Frank and David for
such an enjoyable and fascinating few days.”
Dorset Bat Group attendee: “Just a quick note to say thank you so very much for
a fantastic weekend course, I learnt so much in the three days that I cannot
believe it, it was simply great fun and very helpful.”
Kent Bat Group attendee: “Many thanks for a superb weekend.”
© BCT, Gloucestershire Bat Group, Shirley Thompson, Sue Searle, Worcestershire Bat Group, Surrey Bat Group, Paul Kennedy, Cornwall Bat group, Dorset Bat
Group, North Bucks Bat Group
10
1.6 Approach to surveying
The Project Officer worked closely with each group taking part, to consider any relevant
issues that could affect survey effort in their particular area. Where possible, options were
suggested to give groups the best possible chance of fully completing their surveys without
compromising the project’s protocol and outputs. Following feedback from the groups that
took part in the first field season some amendments were made to the protocol for subsequent
years. The main issues related to the time and availability of volunteers who had to fit in their
commitment to the project around busy lives, work and other commitments. Amendments
were made to try to better balance the needs of the project and the volunteers involved who
were generously dedicating their time to the project, and are set out below:
1.6.1 Extended survey period To maximise the time available to bat groups to complete their surveys, new groups (unable
to start surveying until they had completed training in mid-May) were given an additional two
months (May and June the following year) in which to complete surveying. It was agreed that
the 2008 re-survey groups, having already attended training, would not require this additional
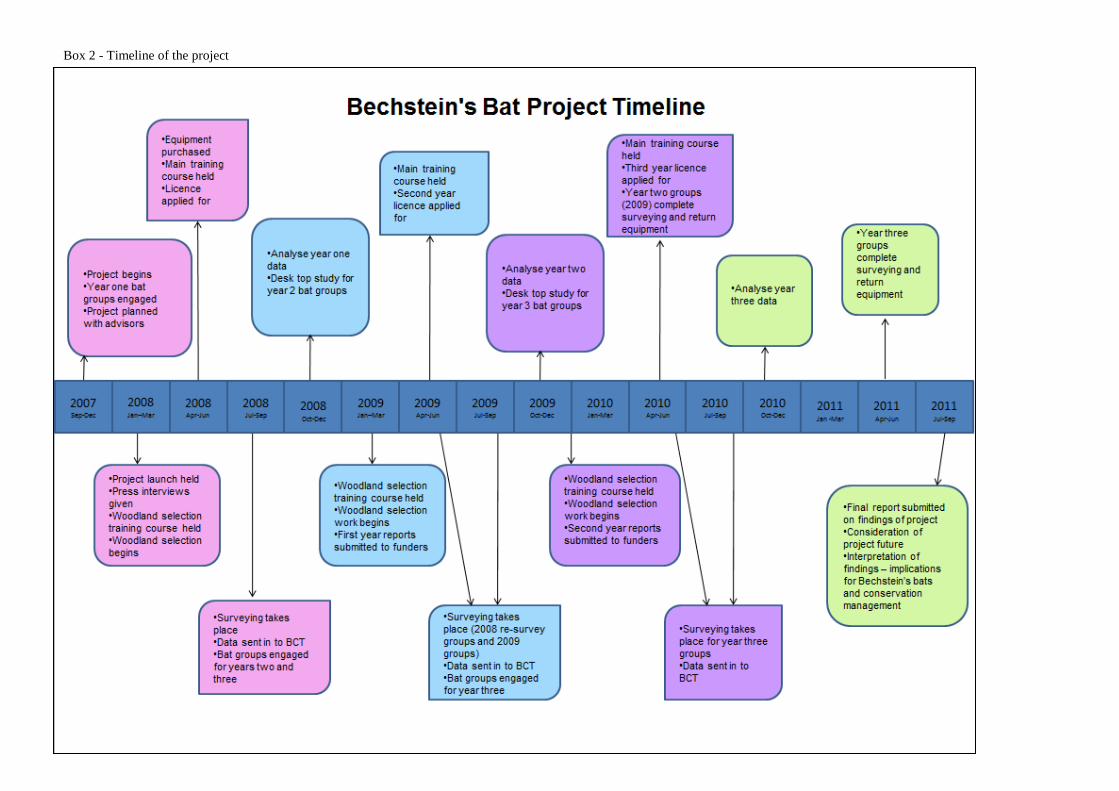
survey time in 2009 (see Box 2 for more detail on the project timetable).
1.6.2 Concentrated survey area Devon and Cornwall are large counties comprising approximately 90 and 50 10km squares
respectively. Surveying one woodland in each of these 10km squares was considered to be too
much to achieve in the time period available. It was therefore decided to reduce the survey
area for these groups and to concentrate on the southern half of Devon and the eastern part of
Cornwall. These areas were selected to encourage full coverage of a more manageable area,
provide survey connectivity across the south-west of England and still meet the project’s
overall aim to survey across the known distribution range.
1.6.3 Additional coordinators/equipment BCT agreed to allow the addition of a third coordinator for some groups (Kent and
Worcestershire). This was to allow survey effort to be better shared between individuals. As
the largest county involved, the Devon group were also given an additional coordinator, along
with a further set of equipment, to aid their effort.
1.7 Licensing
The survey techniques used in the Bechstein’s Bat Survey (the Sussex Autobat and a harp
trap) are potentially very intrusive as they involve luring and live-trapping and handling of
bats in the field. It was essential therefore to ensure that all necessary measures were taken to
ensure the responsible use of the equipment at all times and by all participants.
BCT applied to Natural England for a project licence to undertake the work. The licence was
held by Frank Greenaway, with the trained coordinators from each survey group listed as
accredited agents. The licence allowed each group to undertake surveying between May and
September, and specified the county or area in which individuals would be licensed to survey.
The project licence was renewed on an annual basis ensuring that appropriate groups for each
survey year were included.
11
Box 2 - Timeline of the project
12
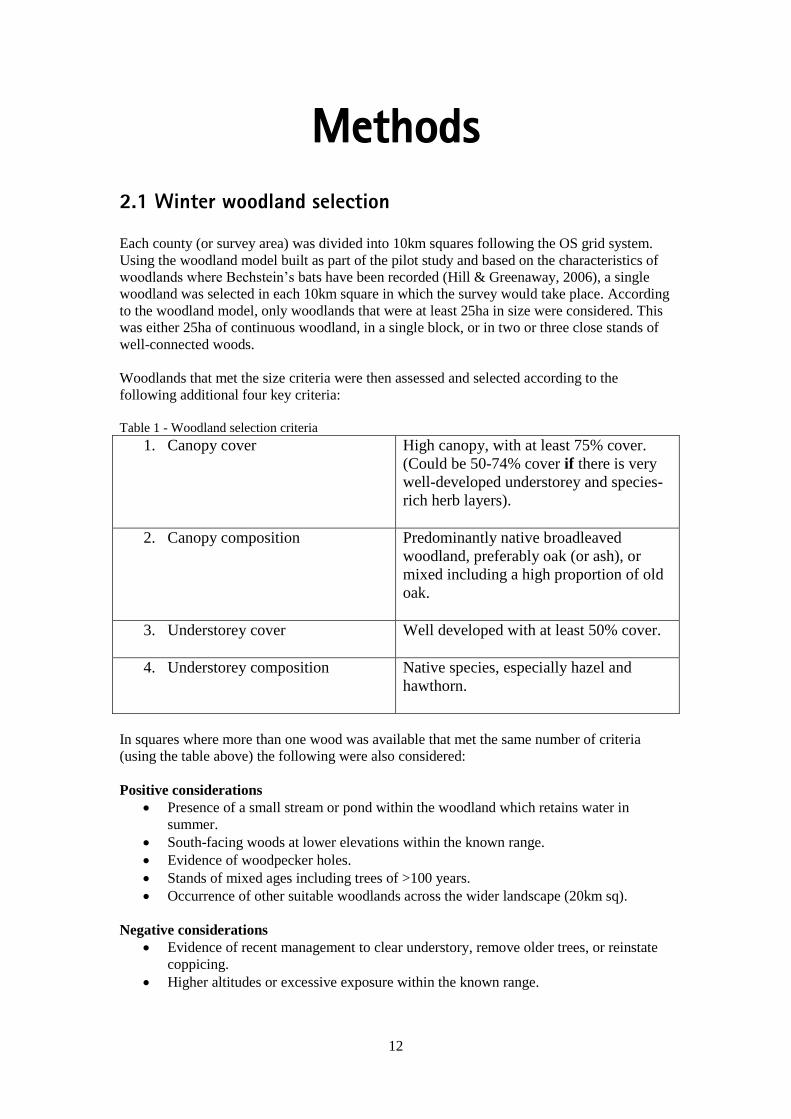
Methods
2.1 Winter woodland selection
Each county (or survey area) was divided into 10km squares following the OS grid system.
Using the woodland model built as part of the pilot study and based on the characteristics of
woodlands where Bechstein’s bats have been recorded (Hill & Greenaway, 2006), a single
woodland was selected in each 10km square in which the survey would take place. According
to the woodland model, only woodlands that were at least 25ha in size were considered. This
was either 25ha of continuous woodland, in a single block, or in two or three close stands of
well-connected woods.
Woodlands that met the size criteria were then assessed and selected according to the
following additional four key criteria:
Table 1 - Woodland selection criteria
1. Canopy cover High canopy, with at least 75% cover.
(Could be 50-74% cover if there is very
well-developed understorey and species-
rich herb layers).
2. Canopy composition Predominantly native broadleaved
woodland, preferably oak (or ash), or
mixed including a high proportion of old
oak.
3. Understorey cover Well developed with at least 50% cover.
4. Understorey composition Native species, especially hazel and
hawthorn.
In squares where more than one wood was available that met the same number of criteria
(using the table above) the following were also considered:
Positive considerations
Presence of a small stream or pond within the woodland which retains water in
summer.
South-facing woods at lower elevations within the known range.
Evidence of woodpecker holes.
Stands of mixed ages including trees of >100 years.
Occurrence of other suitable woodlands across the wider landscape (20km sq).
Negative considerations
Evidence of recent management to clear understory, remove older trees, or reinstate
coppicing.
Higher altitudes or excessive exposure within the known range.
13
Where possible, woodland selection took place in winter/early spring during daylight hours.
Landowner permission was obtained for all selected woodlands prior to the start of surveys.
Where no suitable woodland was present (i.e. where a woodland did not meet at least two
criteria) a square was not considered to be a priority and only surveyed after higher priority
squares were completed.
Where a previous record existed of a female Bechstein’s bat in a 10km square (caught
between May and September), a further survey was not necessary and these squares were
excluded from this study.
2.2 Equipment
Each group taking part was provided with a set of equipment.
A set of equipment included:
• 2x Sussex Autobats (acoustic lure)*
• 2x harp traps (to catch the bats)*
• 2x 2-way radios (for communication and health and safety)*
• 1x county set of OS maps, scale 1:50 000 (for the selection of woodlands)
*Devon Bat Group was provided with an additional Autobat, harp trap and radio to assist with
their surveys.
2.3 Summer surveying
2.3.1 Site selection Following initial woodland selection, each target woodland was re-visited during daylight
hours prior to the evening survey, to confirm selection of trapping sites, consider health and
safety, and to ensure woods were still suitable for surveying. Site selection was based on the
most likely location for Bechstein’s bat foraging; traps were placed in dense canopy cover
away from rides. Areas close to known roosts, flyways for other species, and the woodland
edge were avoided.
On the night of the survey, project equipment was set up at the two selected sites in each
wood. Sites were located at least 200m apart to maximise the chances of being in different
foraging areas, if female Bechstein’s bats were present. A recording station was also set up
where the survey team was based for the evening – sited away from the traps, where captured
bats could be identified and processed prior to release.
2.3.2 The Sussex Autobat The Sussex Autobats used during the surveys were set to play a standardised series of
ultrasonic bat social calls. These calls were predominantly simulated from Bechstein’s bat
social calls, but also included other species to increase the opportunity of catching multiple
species. Call sequences were fixed to ensure standardisation of surveys between sites and
between areas. Each Autobat was linked to a pair of speakers mounted to face each other,
with a rotating metal vane between them that distributed the emitted sounds around the trap
location. The mounted speakers were placed next to the harp trap, at the centre of the trap’s
frame
14
2.3.3 Evening survey A survey team was made up of a maximum of eight individuals (usually divided into two
groups manning a set of equipment each). A volunteer coordinator was present to oversee the
survey at each site. Surveys began at least 1 hour after civil twilight. Each trapping site was
surveyed for 1.5 hours. In some cases both sites within a wood were surveyed simultaneously
by two teams, while in others they were surveyed one after the other by one team who moved
the trap from the first site to the next. The benefit of the former being that survey nights were
shorter with coordinators sharing responsibility and supporting each other. The advantage of
the latter was the opportunity to survey two different woodlands on the same night, thereby
maximising the number of surveys that could be undertaken.
The start and end survey temperatures, diurnal weather, cloud cover and rainfall were
recorded for each survey. In addition the characteristics used to select the woodlands surveyed
(according to the habitat model) were noted on the recording sheet – for the overall woodland
and each site (at which equipment was set up) the percentage of canopy cover, percentage of
understorey cover, dominant canopy species, dominant understory species, distance to water,
nearest edge and woodland management were recorded. Groups were also asked to note the
altitude and aspect of the woodland.
Throughout the 1.5 hour period, the harp traps were checked regularly and any bats found
were transferred to holding bags (by appropriately licensed individuals) and taken to the
recording station. This ensured that no bats remained in the trap and in close proximity to the
Autobat for any length of time. If any problems arose, for example a bat caught within the
strings of the trap, the Autobat was turned off.
Each bat caught was identified to species level, sexed, aged, and assessed for breeding
condition (Hutson & Racey, 2004). Where a Bechstein’s bat was caught, groups were asked
to take a photograph and record forearm length.
At the end of the 1.5 hour period, the Autobat was turned off and the equipment packed away.
Caught bats were released at this point, unless immediate releases after capture had been
appropriate (e.g. a very stressed bat). Release calls were also recorded for some species on
some surveys.
The method was repeated for each 10km square of the county/survey area, in which a suitable
woodland had been selected. All surveys were completed between May and September.
All surveying was temporarily halted for a short period during the summer (between mid-June
and early July) to avoid the highly sensitive time when females were giving birth. This was
assessed locally to take into account regional variation. Local knowledge of young bats being
born and observations in the field during trapping were used to identify this period.
2.4 Data processing and analysis
For each evening survey undertaken groups were asked to record the data onto an Excel
spread sheet. Information was recorded about the overall woodland (in relation to the habitat
model), each site at which a harp trap and Autobat were placed (in relation to the habitat
model), environmental factors (such as cloud cover, rainfall and diurnal weather) and the
individual bat captures. An example of the survey sheet used and the data collected is
provided in Appendix 3.

15
Groups were asked to submit data sheets electronically to the project officer after each survey.
Survey sheets were downloaded into a bespoke access database.
Some statistical analysis was carried out on the complete Bechstein’s bat dataset. However,
the analysis that can be done to investigate habitat associations in woodlands where capture
was successful is limited due to the design of the project. Woodlands were selected for
surveying based on a number of criteria to maximise the likelihood of capturing this species,
and not on a random basis. The range of variation in woodlands in the study is therefore
limited and hence any analysis on the results is also limited.
A Generalized Linear Mixed Model was used to investigate the effects of the main criteria of
the woodland model on Bechstein’s bat captures. In order to account for the uneven
geographical distribution of captures of this species, an additional factor was added to the
model dividing the entire survey region into 40km squares. In this way the model examines
how differences in woodlands within each large-scale square influence the probability of
catching Bechstein’s bat.
16
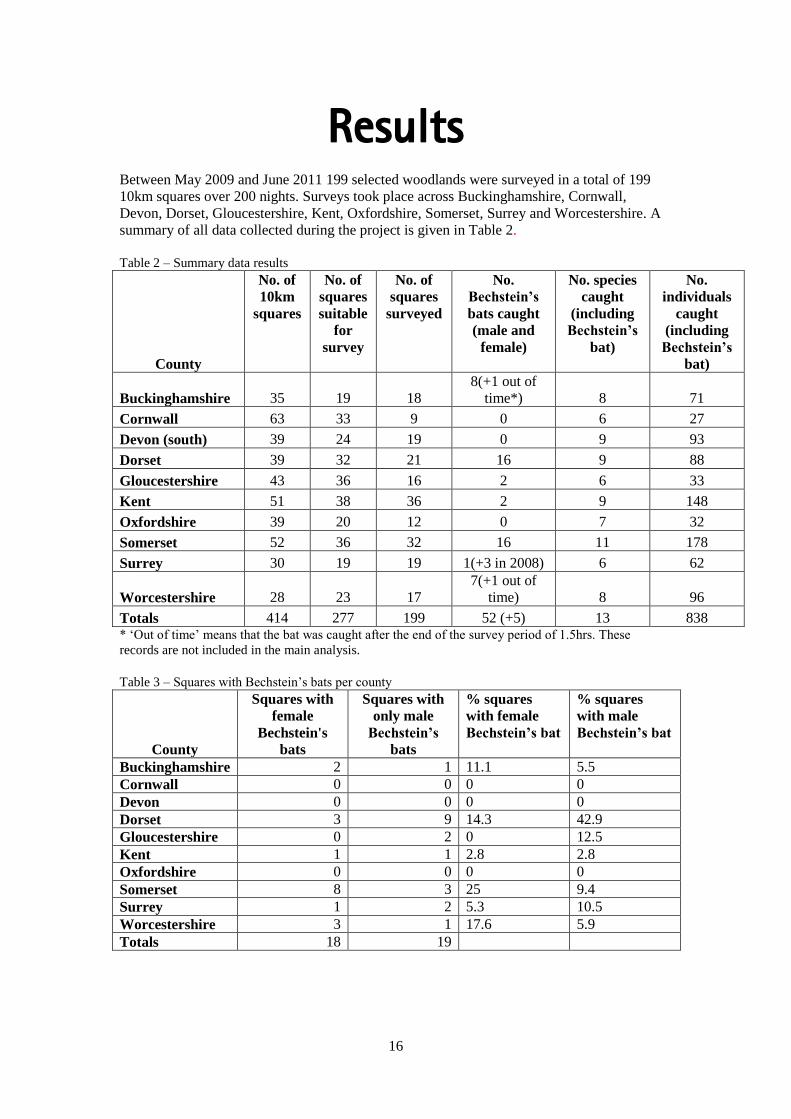
Results
Between May 2009 and June 2011 199 selected woodlands were surveyed in a total of 199
10km squares over 200 nights. Surveys took place across Buckinghamshire, Cornwall,
Devon, Dorset, Gloucestershire, Kent, Oxfordshire, Somerset, Surrey and Worcestershire. A
summary of all data collected during the project is given in Table 2.
Table 2 – Summary data results
County
No. of
10km
squares
No. of
squares
suitable
for
survey
No. of
squares
surveyed
No.
Bechstein’s
bats caught
(male and
female)
No. species
caught
(including
Bechstein’s
bat)
No.
individuals
caught
(including
Bechstein’s
bat)
Buckinghamshire 35 19 18
8(+1 out of
time*) 8 71
Cornwall 63 33 9 0 6 27
Devon (south) 39 24 19 0 9 93
Dorset 39 32 21 16 9 88
Gloucestershire 43 36 16 2 6 33
Kent 51 38 36 2 9 148
Oxfordshire 39 20 12 0 7 32
Somerset 52 36 32 16 11 178
Surrey 30 19 19 1(+3 in 2008) 6 62
Worcestershire 28 23 17
7(+1 out of
time) 8 96
Totals 414 277 199 52 (+5) 13 838 * ‘Out of time’ means that the bat was caught after the end of the survey period of 1.5hrs. These
records are not included in the main analysis.
Table 3 – Squares with Bechstein’s bats per county
County
Squares with
female
Bechstein's
bats
Squares with
only male
Bechstein’s
bats
% squares
with female
Bechstein’s bat
% squares
with male
Bechstein’s bat
Buckinghamshire 2 1 11.1 5.5
Cornwall 0 0 0 0
Devon 0 0 0 0
Dorset 3 9 14.3 42.9
Gloucestershire 0 2 0 12.5
Kent 1 1 2.8 2.8
Oxfordshire 0 0 0 0
Somerset 8 3 25 9.4
Surrey 1 2 5.3 10.5
Worcestershire 3 1 17.6 5.9
Totals 18 19
17
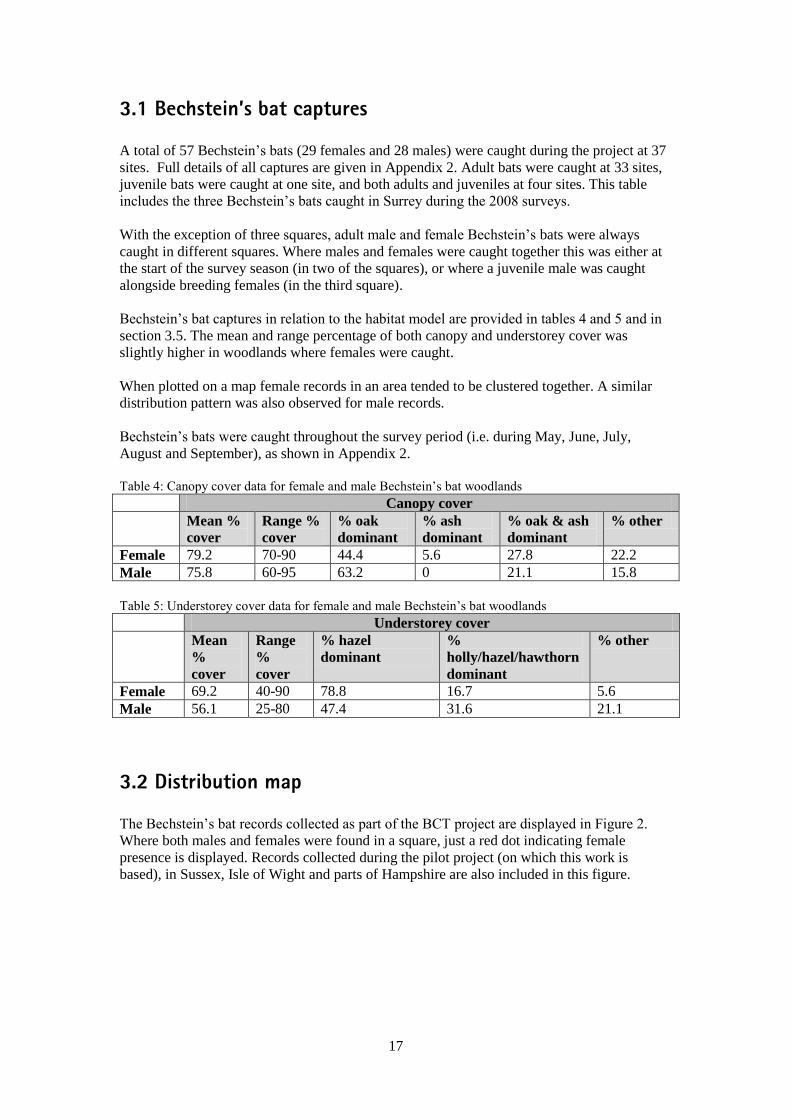
3.1 Bechstein’s bat captures
A total of 57 Bechstein’s bats (29 females and 28 males) were caught during the project at 37
sites. Full details of all captures are given in Appendix 2. Adult bats were caught at 33 sites,
juvenile bats were caught at one site, and both adults and juveniles at four sites. This table
includes the three Bechstein’s bats caught in Surrey during the 2008 surveys.
With the exception of three squares, adult male and female Bechstein’s bats were always
caught in different squares. Where males and females were caught together this was either at
the start of the survey season (in two of the squares), or where a juvenile male was caught
alongside breeding females (in the third square).
Bechstein’s bat captures in relation to the habitat model are provided in tables 4 and 5 and in
section 3.5. The mean and range percentage of both canopy and understorey cover was
slightly higher in woodlands where females were caught.
When plotted on a map female records in an area tended to be clustered together. A similar
distribution pattern was also observed for male records.
Bechstein’s bats were caught throughout the survey period (i.e. during May, June, July,
August and September), as shown in Appendix 2.
Table 4: Canopy cover data for female and male Bechstein’s bat woodlands
Canopy cover
Mean %
cover
Range %
cover
% oak
dominant
% ash
dominant
% oak & ash
dominant
% other
Female 79.2 70-90 44.4 5.6 27.8 22.2
Male 75.8 60-95 63.2 0 21.1 15.8
Table 5: Understorey cover data for female and male Bechstein’s bat woodlands
Understorey cover
Mean
%
cover
Range
%
cover
% hazel
dominant
%
holly/hazel/hawthorn
dominant
% other
Female 69.2 40-90 78.8 16.7 5.6
Male 56.1 25-80 47.4 31.6 21.1
3.2 Distribution map
The Bechstein’s bat records collected as part of the BCT project are displayed in Figure 2.
Where both males and females were found in a square, just a red dot indicating female
presence is displayed. Records collected during the pilot project (on which this work is
based), in Sussex, Isle of Wight and parts of Hampshire are also included in this figure.
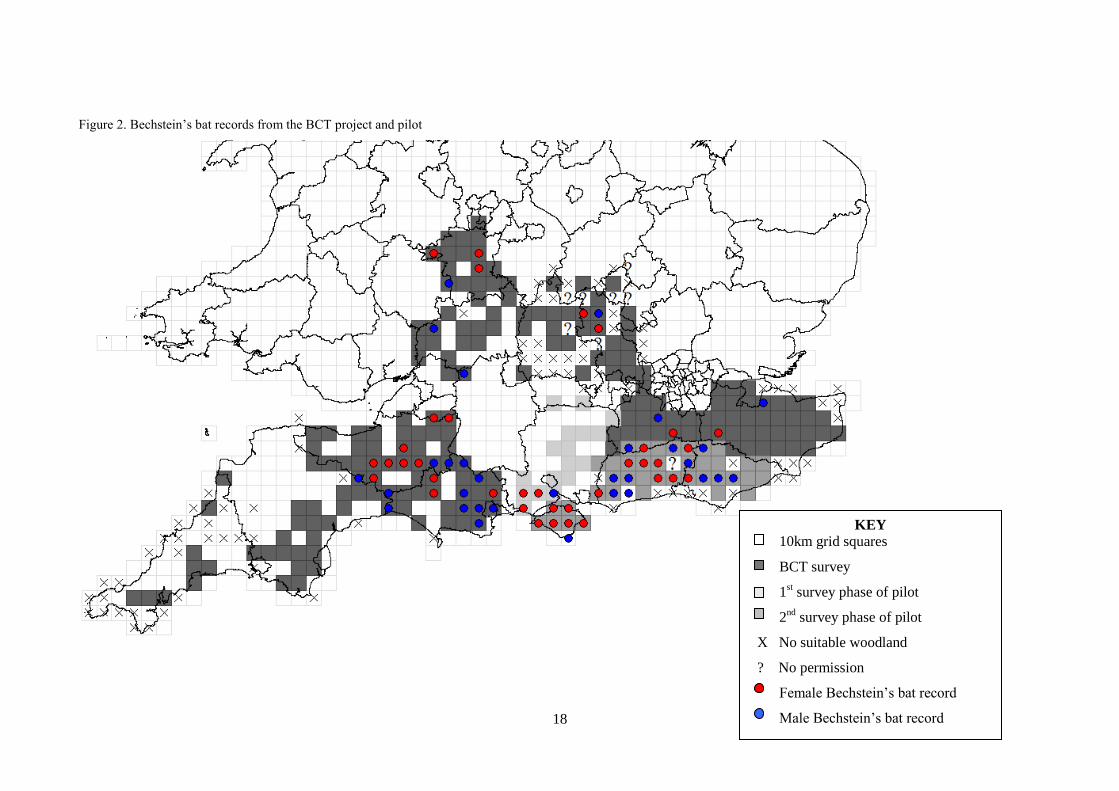
18
Figure 2. Bechstein’s bat records from the BCT project and pilot
KEY
10km grid squares
BCT survey
1st survey phase of pilot
2nd
survey phase of pilot
X No suitable woodland
? No permission
Female Bechstein’s bat record
Male Bechstein’s bat record
19
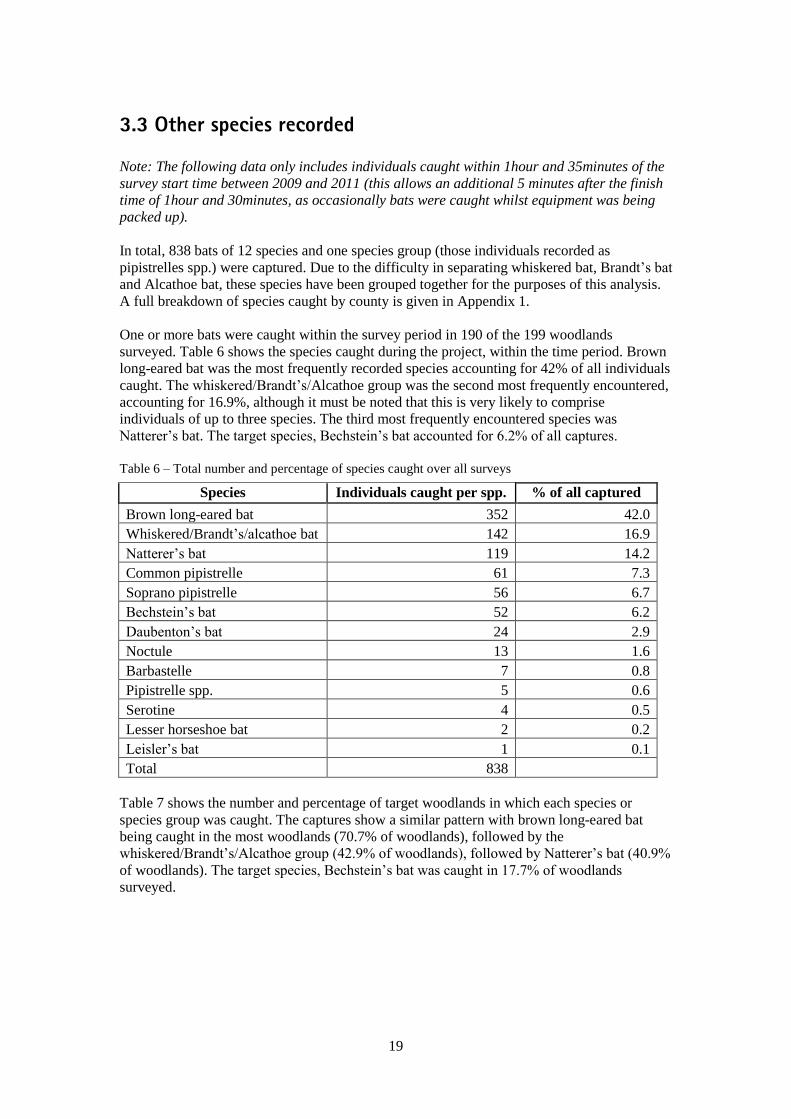
3.3 Other species recorded
Note: The following data only includes individuals caught within 1hour and 35minutes of the
survey start time between 2009 and 2011 (this allows an additional 5 minutes after the finish
time of 1hour and 30minutes, as occasionally bats were caught whilst equipment was being
packed up).
In total, 838 bats of 12 species and one species group (those individuals recorded as
pipistrelles spp.) were captured. Due to the difficulty in separating whiskered bat, Brandt’s bat
and Alcathoe bat, these species have been grouped together for the purposes of this analysis.
A full breakdown of species caught by county is given in Appendix 1.
One or more bats were caught within the survey period in 190 of the 199 woodlands
surveyed. Table 6 shows the species caught during the project, within the time period. Brown
long-eared bat was the most frequently recorded species accounting for 42% of all individuals
caught. The whiskered/Brandt’s/Alcathoe group was the second most frequently encountered,
accounting for 16.9%, although it must be noted that this is very likely to comprise
individuals of up to three species. The third most frequently encountered species was
Natterer’s bat. The target species, Bechstein’s bat accounted for 6.2% of all captures.
Table 6 – Total number and percentage of species caught over all surveys
Species Individuals caught per spp. % of all captured
Brown long-eared bat 352 42.0
Whiskered/Brandt’s/alcathoe bat 142 16.9
Natterer’s bat 119 14.2
Common pipistrelle 61 7.3
Soprano pipistrelle 56 6.7
Bechstein’s bat 52 6.2
Daubenton’s bat 24 2.9
Noctule 13 1.6
Barbastelle 7 0.8
Pipistrelle spp. 5 0.6
Serotine 4 0.5
Lesser horseshoe bat 2 0.2
Leisler’s bat 1 0.1
Total 838
Table 7 shows the number and percentage of target woodlands in which each species or
species group was caught. The captures show a similar pattern with brown long-eared bat
being caught in the most woodlands (70.7% of woodlands), followed by the
whiskered/Brandt’s/Alcathoe group (42.9% of woodlands), followed by Natterer’s bat (40.9%
of woodlands). The target species, Bechstein’s bat was caught in 17.7% of woodlands
surveyed.
20
Table 7 – Target woods in which species were found
Species No. woods found in % of target woods
Brown long-eared 140 70.7
Whiskered/Brandt’s/alcathoe bat 85 42.9
Natterer’s bat 81 40.9
Common pipistrelle 43 21.7
Soprano pipistrelle 41 20.7
Bechstein’s bat 35 17.7
Daubenton’s bat 19 9.6
Noctule 12 6.1
Barbastelle 7 3.5
Pipistrelle spp. 4 2.0
Serotine 4 2.0
Lesser horseshoe 2 1.0
Leisler’s bat 1 0.5
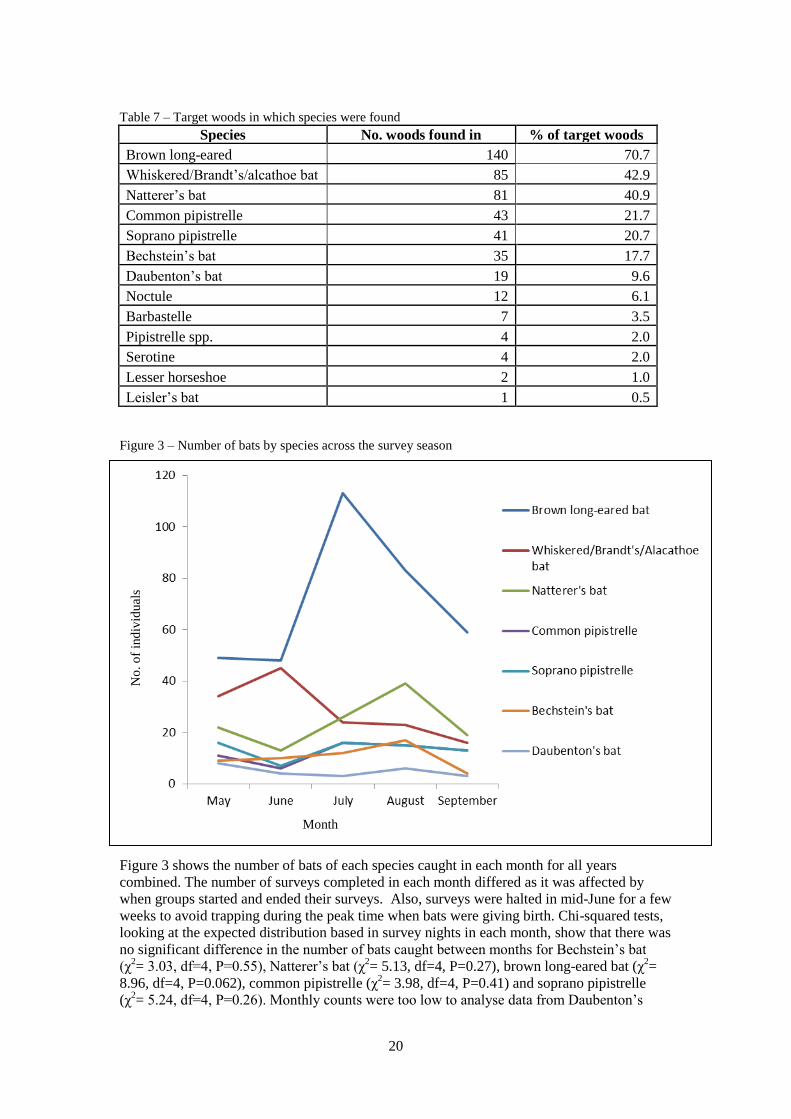
Figure 3 – Number of bats by species across the survey season
Figure 3 shows the number of bats of each species caught in each month for all years
combined. The number of surveys completed in each month differed as it was affected by
when groups started and ended their surveys. Also, surveys were halted in mid-June for a few
weeks to avoid trapping during the peak time when bats were giving birth. Chi-squared tests,
looking at the expected distribution based in survey nights in each month, show that there was
no significant difference in the number of bats caught between months for Bechstein’s bat
(χ2= 3.03, df=4, P=0.55), Natterer’s bat (χ
2= 5.13, df=4, P=0.27), brown long-eared bat (χ
2=
8.96, df=4, P=0.062), common pipistrelle (χ2= 3.98, df=4, P=0.41) and soprano pipistrelle
(χ2= 5.24, df=4, P=0.26). Monthly counts were too low to analyse data from Daubenton’s
Month
No
. o
f in
div
idu
als
21
bats. There was significant variation between months for the whiskered group, however (χ2=
42.2, df=4, P<0.001), and Figure 3 suggests relatively fewer bats were caught in the second
part of the summer from July onwards than would be expected from the number of surveys
carried out.
3.4 Male to female ratio
For all bat captures, males were caught more frequently than females with a 1:3:1
(male:female:not recorded) ratio (in 14 individuals caught the sex was not recorded). This
total includes all individuals caught across the 13 species/species groups (which include
“pipistrelle species”) between 2009 and 2011.
This was also true for the majority of species when analysed individually. Males equalled or
outnumbered females caught in 12 of the 13 species categories, as outlined in Table 8. Only
common pipistrelle and lesser horseshoe bat had equal numbers of captures of males and
females. For the target species, Bechstein’s bat, more females were caught than males but the
difference here was just two bats.
Table 8 - Male to female ratio of species caught
Species Male Female Unrecorded
Brown long-eared bat 189 157 6
Whiskered/Brandt’s/alcathoe bat 82 59 1
Natterer’s bat 70 46 3
Soprano pipistrelle 36 18 2
Common pipistrelle 30 30 1
Bechstein’s bat 25 27 0
Daubenton’s bat 16 8 0
Noctule 7 6 0
Barbastelle 5 2 0
Pipistrelle species 4 0 1
Serotine 2 2 0
Lesser horseshoe 1 1 0
Leisler’s bat 1 0 0
463 351 14
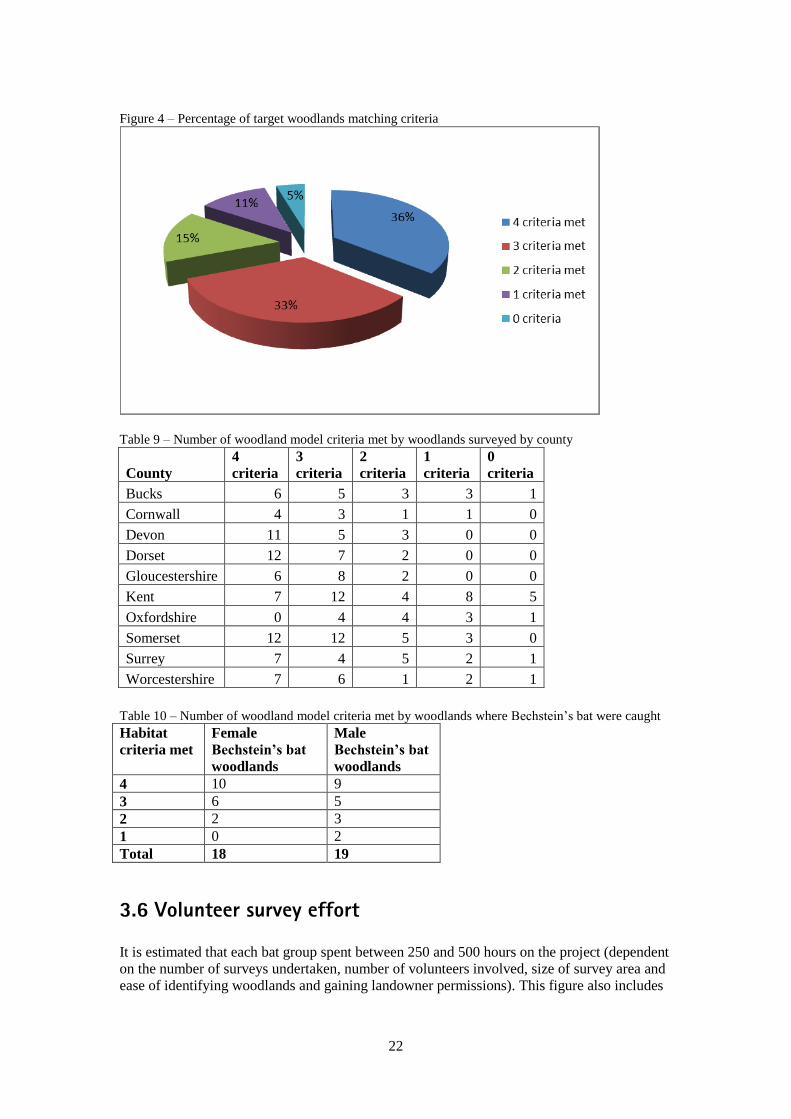
3.5 Woodland model criteria
3.5.1 Habitat model All woodlands selected were the best fit woodland to the woodland model in each 10km
square (assuming landowner permission was granted). Of the 199 woodlands surveyed, 69%
matched either three or four of the woodland model criteria as shown in Figure 4. The
breakdown of these woodlands by county is shown in Table 9. Of the 37 woodlands in which
Bechstein’s bats were caught, 19 of these matched all four criteria, 11 matched three criteria,
five matched just two and two matched just one as shown in Table 10.
22
Figure 4 – Percentage of target woodlands matching criteria
Table 9 – Number of woodland model criteria met by woodlands surveyed by county
County
4
criteria
3
criteria
2
criteria
1
criteria
0
criteria
Bucks 6 5 3 3 1
Cornwall 4 3 1 1 0
Devon 11 5 3 0 0
Dorset 12 7 2 0 0
Gloucestershire 6 8 2 0 0
Kent 7 12 4 8 5
Oxfordshire 0 4 4 3 1
Somerset 12 12 5 3 0
Surrey 7 4 5 2 1
Worcestershire 7 6 1 2 1
Table 10 – Number of woodland model criteria met by woodlands where Bechstein’s bat were caught
Habitat
criteria met
Female
Bechstein’s bat
woodlands
Male
Bechstein’s bat
woodlands
4 10 9
3 6 5
2 2 3
1 0 2
Total 18 19
3.6 Volunteer survey effort
It is estimated that each bat group spent between 250 and 500 hours on the project (dependent
on the number of surveys undertaken, number of volunteers involved, size of survey area and
ease of identifying woodlands and gaining landowner permissions). This figure also includes
23
attendance at the relevant training days. The number of volunteers that took part for each
group is given in table 11.
Table 11 – Number of volunteers in each county/survey group
County No. of volunteers
Buckinghamshire 33
Cornwall 25
Devon 24
Dorset 33
Gloucestershire 34
Kent 70
Oxfordshire 17
Somerset 56
Surrey 19
Worcestershire 32
3.7 Statistical analysis
In this section the results of the statistical analyses of the dataset are presented. The results
should be interpreted with some caution due to the non-random design of the survey method.
The pilot survey showed that the association between woods that matched the model and the
presence of females was a highly significant one; the woods for the BCT survey were
therefore chosen, as far as possible, using the model, meaning that the significance of any
analysis should be viewed with care. However, the analysis can provide some useful
information on which factors within the woodland model were found to be important in
affecting Bechstein’s bat captures during the BCT surveys.
3.7.1 Bechstein’s bat captures Table 12 shows the results of the logistic Generalized Linear Mixed Model to investigate the
relationship between Bechstein’s bat captures and woodland model characteristics used to
select woodlands, taking into account regional variation with the inclusion of a 40km square
area as a random effect. A full table of variables is given in Appendix 6.
Table 12 - Test statistics for the key criteria of the woodland model, before and after fitting 40km
square as a random effect.
Without fitting 40km square After fitting 40km square
Term F df1 df2 P F df1 df2 P
Canopy cover 0.81 1 161.3 0.371 0.44 1 61.8 0.509
Understory cover 7.74 1 185.9 0.006 4.98 1 85.4 0.028
Hazel in
understory 1.59 1 226.1 0.208 0.69 1 91.5 0.409
Hawthorn in
understory 3.31 1 175.2 0.071 2.16 1 69.2 0.146
Oak dominant in
canopy 0.31 1 165.5 0.576 0.09 1 49.0 0.763
Ash dominant in
canopy 1.07 1 162.3 0.303 2.36 1 65.0 0.129
The model shows that only understory cover has a significant effect (at the 5% level) on the
Bechstein’s bat captures both with and without the random effect of geographical variation.
These results are surprising as we would expect all of these factors to be important in
affecting Bechstein’s bat captures. However, it is likely that because sites were selected for
24
these criteria, there is relatively little variation in these variables and few distinctly unsuitable
sites in the dataset, making it less likely for significant results to be found.
The variance explained by each of the factors in the model (R2) was also low (Table 13). The
40km square factor allowing for geographical location explained most of the variance
(19.5%), with the other factors combined only explaining an additional 15.1% of the variation
in captures of Bechstein’s bat. Of the key criteria, understory cover is the only one that
explains any significant amount of variation (2.7%).
Table 13 - Variance explained by key criteria of woodland model, with and without accounting for
geographic variation using the 40km square factor.
% variance explained (R2)
Term Before 40km
square factor fitter
After 40km square
factor fitted
40 km square 19.5%
canopy cover 0.0% 0.1%
understory cover 5.2% 2.7%
HAZEL in understory 1.7% 0.2%
HAWTHORN in understory 0.8% 0.5%
Oak in canopy 0.7% 0.0%
Ash in canopy 0.6% 0.8%
The inclusion of each of the possible explanatory variables into the model was then tried one
at a time, with and without 40km square fitted. The full list of variables and test statistics for
each is provided in Appendix 6. Despite the large number of variables, few had a significant
effect on the presence of Bechstein’s bat in woodlands. Only one variable remained
significant after fitting the factor for geographical variation. The distance to nearest water is
highly significant (F=8.99, df=1,309, P=0.003), and remains significant at the 5% level even
after fitting 40km square factor (F=6.3, df=1,153, P=0.013). Table 14 illustrates that this is
probably due to the fact that Bechstein’s bat was never caught more than 1km from water.
Table 14- Relationship between presence of Bechstein’s bat and distance to nearest water. Figures
exclude Devon and Cornwall since no Bechstein’s bats were found in this area.
Distance to water n sites prop with Bechstein’s s.e.
<100m 124 0.137 0.031
<500m 135 0.148 0.031
<1km 30 0.100 0.056
1km or more 24 0.000 0.000
3.7.2 Sex ratios: Bechstein’s bat For sites where Bechstein’s bats were captured a logistic Generalised Linear Mixed Model
was fitted to the proportion of males to see if it showed any relationship with any of the
possible explanatory variables, to investigate the possibility that males are using suboptimal
habitats. Values from the previous model were also fitted as a measure of how suitable the
site is for the species and tried fitting this in the model for the sex ratio.
Unfortunately, whilst there is some indication of non-randomness in the distribution of the
sexes (χ2 = 66.47, df=41, P=0.007), the tests were not able to show that any of the variables
are significantly associated with this variation. It is likely that differences in habitat used by
males and females are too subtle to be shown by the data collected in this survey.
25
Discussion
4.1. Bechstein’s bat records
The survey results are discussed against the project’s main aims as set out in section 1.3.
Deliver systematically acquired baseline distribution data for Bechstein’s bat
During the four years of the project, surveys were completed across ten counties within
southern England. From the 199 squares surveyed, 37 new woodland sites for Bechstein’s bat
were identified.
The surveys undertaken as part of the project (and the pilot work) comprise the first national
survey for Bechstein’s bat in the UK, producing baseline distribution data for this species.
Delineate the species range and hotspots
As part of the project a request was sent to local bat groups to ask for any additional (non-
project) Bechstein’s bat records. This was essential to ensure that as comprehensive a map as
possible could be produced of Bechstein’s bat UK distribution.
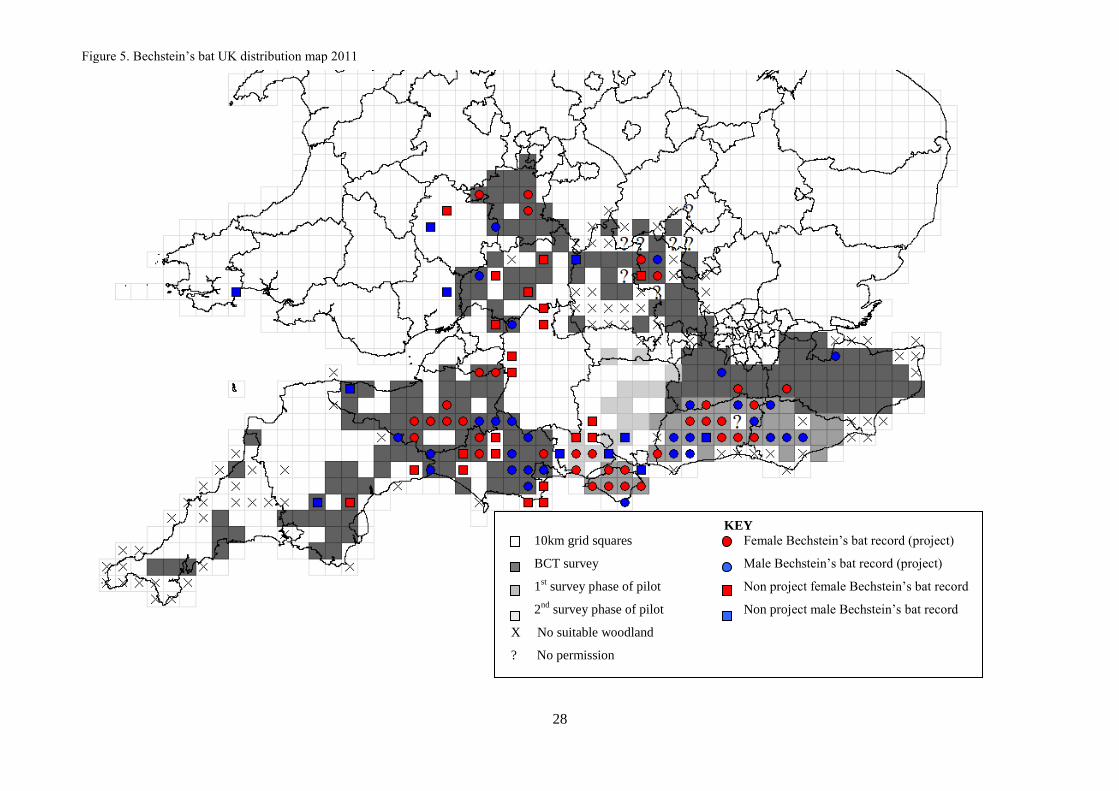
These additional records, alongside the BCT and pilot work are displayed in Figure 5 to show
the overall known summer distribution of Bechstein’s bats in the UK. This shows that the
female records in North Buckinghamshire and Worcestershire from the Bechstein’s Bat
Survey are the most northern records for breeding females in the UK, extending the known
range of this species.
Figure 5 also illustrates “hotspot” areas in Dorset/Somerset, Hampshire/Isle of Wight and
Sussex (and the borders of Surrey and Kent) where multiple squares containing breeding
females were found. We consider that these hotspot areas, identified from the overall results
of the Bechstein’s Bat Survey are core areas for the population of this species which are likely
to be significant in terms of the long-term viability of Bechstein’s bat in the UK. It is worth
noting that almost all records shown here have been collected using the Sussex Autobat,
although not necessarily under the same protocol, confirming the success of this method as
suitable for the identification of the presence of Bechstein’s bat in woodlands in the UK.
It should be emphasised that where surveys undertaken have not shown the presence of
Bechstein’s bat, we cannot conclude absence of the species. Challenges encountered during
the survey (e.g. environmental conditions and landowner permissions) may have reduced the
likelihood of catching Bechstein’s bat in some 10km squares. Additionally, some counties and
10km squares shown within the range of the species have not been systematically surveyed.
For example, key areas such as Hampshire and Wiltshire were not surveyed as part of the
Bechstein’s Bat Survey, due to limited availability and resources in these bat groups. Some
individuals have been kind enough to submit their records for Bechstein’s bat in their areas
(e.g. Hampshire bat group have been undertaking their own woodland project in part of the
county), but the records provided here are not complete across the UK, particularly for
example in Wiltshire, and the data shown may not accurately represent Bechstein’s bat
distribution in those counties.
26
The overall distribution map shown in Figure 5 should therefore not be used to illustrate
absence; rather it should be used to give a better understanding of range and to highlight areas
that appear to be important for the species on a wide scale to focus future conservation action.
Understand the habitat associations of the species across its range in the UK
The woodland habitat model devised by Hill and Greenaway (2006) is based on studied sites
in Sussex where Bechstein’s bat maternity colonies have been recorded. As this was the best
model available at the time of the start of the Bechstein’s Bat Survey, it was used in this
project. Co-ordinators from each bat group were therefore trained and instructed to find the
best-fit woodlands according to this model within their counties for survey in each 10km
square. 72 of the 199 squares surveyed fitted all four of the habitat model criteria. This task
was found to be easier in some counties than others (as seen in Table 9). In some counties
such as Oxfordshire there were few woodlands of sufficient size that matched all four of the
key criteria. High altitude (e.g. Devon), lack of large woodland blocks (e.g. Dorset), and
dominance by non-model species such as sweet chestnut (e.g. Kent) were the most common
issues encountered by groups trying to select ‘ideal’ woodlands.
The majority of Bechstein’s bats caught were found in woodlands that matched three or four
of the habitat model criteria: 16 of 18 woodlands with female (or male and female)
Bechstein’s bats and 14 of the 19 woodlands with just males.
A summary of the habitat model characteristics of woodlands in which Bechstein’s bat was
caught are provided in Tables 4 and 5. There is a subtle difference between male and female
woodlands, with those in which females were found having a slightly higher mean and range
for both canopy and understorey cover. Previous work (F Greenaway pers. comm., 2008) has
shown that females are found in optimal woodlands, so the project’s findings although not
significant do support this previous study. In addition, although not statistically significant, an
observational comparison of understorey cover does suggest an association with hazel
specifically for both male and female woodlands.
The presence of Bechstein’s bat in some of the woodlands that did not match all four of the
model criteria may be explained by looking at the breeding status of those individuals. Of the
eight sites at which female Bechstein’s bat were caught in woodlands that did not match all
four model criteria, non-breeding females were caught at four of these sites (non-breeding
females will not have the same resource demands and therefore may roost or forage away
from the main roost site (Altringham, 2011)). Of the remaining four the breeding status was
not recorded at two sites due to the timing of the survey (i.e. too early or late in the season to
confirm). Therefore finding female Bechstein’s bats in those woodlands that deviate from the
‘ideal’ model woodland does not necessarily refute our understanding that as a general rule
core maternity colonies do require the four main criteria in a woodland site.
The statistical analysis of Bechstein’s bat captures revealed that the only criteria from the
model that was significant was understorey, both with and without inclusion of a factor for
geographical variation. Given the way in which woodlands have been positively selected for
particular criteria in this project, any analysis is likely to produce limited results as there is
limited variation in the dataset. Therefore these results do not suggest that any of the criteria
used are not significant for this species, but they do illustrate the particular importance of
understorey cover. Within the dataset the greatest amount of variation (between woodlands
surveyed) seems to be with regards to the percentage of understorey cover (as shown in tables
4 and 5), allowing us to highlight the importance of understorey through statistical testing.
Hill and Greenaway (2008) have shown a clear association between a well-developed
understorey and the number and diversity of woodland bat species (brown long-eared bat,
Natterer’s bat, whiskered bat, Bechstein’s bat, and Brandt’s bat). They suggest that
understorey could be significant to protect from aerial predators, to provide key habitat for
27
prey species and to provide a more stable microclimate. The significance of understorey in
our results therefore fits with previous findings for woodland bats.
Previous work has also suggested a difference in the woodland quality of male and female
Bechstein’s bat sites, with males often found in sub optimal habitats (Hill & Greenaway,
2006). The analysis of sex ratios of Bechstein’s bats showed some non-randomness, but no
significant relationship with any particular criteria from the woodland model. The survey was
designed to find maternity colonies of Bechstein’s bat with the best fit woodland selected in
each square. Because of this, we cannot reliably test for differences between sites where male
and female bats were captured. It is however clear that with a few exceptions (that normally
occur at the very start or end of the breeding season); woodlands are typically used by either
adult males or adult females but not both. Therefore subtle differences in sites, not recorded in
this survey, appear to be playing a role in the suitability of sites. This is also likely to be true
for those sites in which only non-breeding female Bechstein’s bats were recorded (five sites).
In addition to the main criteria, there were also observed differences in the woodlands used by
Bechstein’s bat across its range that are important to consider in terms of woodland
management advice and the conservation of the core areas identified for the species. Sites in
Dorset (and parts of Somerset) in which Bechstein’s bat was found were much smaller blocks
of woodland that on their own did not meet the 25ha size requirement, but were well
connected to other small woodland blocks that together were of sufficient size (at least 25ha).
This situation contrasts with the single larger woodland blocks found in areas such as
Buckinghamshire, Surrey and Kent. It is therefore important to ensure that the surrounding
area including connected woodlands are taken into account in any management decisions as
well as the woodland block itself where bats are found. Groups of small woodland blocks are
likely to be more vulnerable to change, and therefore in Dorset and Somerset any woodland
management plans should consider all of the connected woodland blocks within an area used
by Bechstein’s bat.
In Worcestershire, which is on the edge of the range for this species, the type of woodland
blocks used seemed to be variable, although this is only based on a very small sample of
Bechstein’s bat woodlands. Of the three woodlands in which females were found, one
consisted of small woodlands blocks as described above, a second was a large (more than
25ha) single block and the third was smaller than the required size and appeared to be
relatively isolated in its location. This woodland in particular is likely to be extremely
vulnerable to any changes in management or disturbance and would benefit from additional
survey work.
In the east of the survey area the catch rate of Bechstein’s bat reflects the woodland types
found in these counties. For example in Kent the single female record was located on the
Surrey/Kent border in a small patch of woodland that provided the best fit to the woodland
model for the county (all of the four main criteria were met here). Woodland in the rest of the
county is largely sweet chestnut dominated with a history of coppicing, suggesting that the
Bechstein’s bat may be limited in its ability to expand its range (for maternity colonies) in this
area due to a lack of availability of suitable habitat.
Finally in Buckinghamshire, available woodland that best fits the model appears to be in the
northern part of the county where Bechstein’s bat was captured. Further south and in parts of
Oxfordshire, the woodlands did not fit the model as well; for example there were no
woodlands in Oxfordshire where all four of the main criteria were met.
28
Figure 5. Bechstein’s bat UK distribution map 2011
KEY
10km grid squares Female Bechstein’s bat record (project)
BCT survey Male Bechstein’s bat record (project)
1st survey phase of pilot Non project female Bechstein’s bat record
2nd
survey phase of pilot Non project male Bechstein’s bat record
X No suitable woodland
? No permission
29
It is worth noting that where the project has recorded breeding female Bechstein’s bats within
a woodland, we cannot make any estimates on the size of the colony from these results. It is
likely that some of the woodlands on the edge of the range, although able to support small
numbers of females may not be suitable to support larger colonies, raising questions about
their long-term sustainability. Only further survey work can confirm the extent of the
populations in woodlands identified.
Additional woodland data collected
As outlined in section 2.1, in addition to the main habitat model groups were provided with
positive and negative variables that should also be considered during the selection process.
This included presence of water nearby, south facing aspects and low elevation, woodpecker
holes evident and availability of suitable woodland within the surrounding landscape.
From statistical testing of these additional variables in relation to capture rate of Bechstein’s
bat, distance to nearest water appears to be highly significant for this species, with all
individuals caught within 1km of water. This is likely to be a threshold effect rather than one
which increases gradually with distance, and a maximum distance from water of 1km should
therefore be considered when assessing the suitability of a woodland for this species. Other
variables were not easily assessed during statistical analysis but will be important.
Negative considerations (which were tested in the earlier surveys and resulted in the current
model) included recent management and high altitudes or excessive exposure. As explained
above understorey was shown to be significant for Bechstein’s bat captures, thus reinforcing
the need for sensitive woodland management, especially understorey clearance at Bechstein’s
bat sites. Neither altitude nor exposure significantly affected Bechstein’s bat capture rate in
this study, but it is possible that this is a regional issue and one which may not be highlighted
in this type of study where positive site selection was used. From the observed results,
however, it appears likely to be a consideration in counties such as Devon, where high
altitude in parts and the effect of large areas of open habitat such as Dartmoor probably limit
the spread of Bechstein’s bat across the county and further west into Cornwall. This
hypothesis is explored further is section 5.
Provide a baseline against which ongoing presence of the species in 10km squares
can be monitored for future Biodiversity Action Plan reporting and conservation
status assessments.
The project has provided a baseline dataset and distribution map that can be used for future
monitoring of this species within the UK. Follow on and future work is discussed in section 5.
4.2 Other captures
Provide preliminary data on the distribution of other woodland bat species in relation
to woodland quality by recording all other species caught during the surveys.
The survey method for this project was designed to maximise female Bechstein’s bat catches
with both the trap placement and series of calls targeted towards catching this species. There
were however additional calls added to the Autobat’s call sequence to make the lure attractive
to other bat species as well, thereby enhancing the catching opportunities during each survey
to allow us to sample wider woodland bat species presence. The project was therefore a great
opportunity for bat groups to understand the use of their woodlands by bats and to increase
knowledge of woodland bat species within the UK.
30
Species from the Myotis genus are particularly difficult to distinguish from each other by
using a bat detector (e.g. Russ, 1999), and some of the species that produce quiet echolocation
calls, which often are found in woodland, can go undetected in bat detector surveys. In-hand
confirmation of species presence in woodlands has therefore been an important aspect of this
project, allowing bat groups to improve their knowledge about a local area, confirming
previous suspected bat detector records for example. Local involvement from volunteers has
also facilitated liaison with local landowners about species found.
In total 12 species and one species group were recorded during the project surveys, including
some of the UK’s rarer bat species (e.g. barbastelle), as well as those that are often under-
recorded or hard to identify to species level. Project data distribution maps for each species
are provided in Appendix 5. Alcathoe bat (Myotis alcathoe) was discovered as a resident UK
species in 2010 (Jan et al, 2010). Due to this discovery and our subsequent decision to group
all whiskered/Brandt’s/Alcathoe bat captures together (due to the problems of identification
without using genetic techniques which were not available to us in this project), we have not
investigated differences in the distribution of these species.
For some species such as the brown long-eared bat, which was recorded in 70.2% of target
woodlands, these data may allow us to expand upon what is already known about this species’
local distribution. It is however worth being cautious when interpreting the data. Surveys are
designed predominantly to collect information about Bechstein’s bat, and our trap placement
was focused on this species. The other species’ data collected during surveys are unlikely to
give a complete picture of the use of the woodland by non-target bats. Those species with a
similar feeding strategy to Bechstein’s bat are more likely to be attracted to the Autobat (Hill
& Greenaway, 2008). Those species that have a different foraging strategy and tend to feed on
woodland edges or rides for example (e.g. barbastelle) are less likely to be caught in similar
numbers. To understand fully how a woodland is used by bats, additional surveys would be
required such as detector surveys to support the trapping, more variation in trapping locations,
or the use of a wider range of calls on the Autobat to increase the species likely to be attracted
to it, which was outside the scope of the project.
4.2.1 Brown long-eared bats The brown long-eared bat was the most frequently recorded species, both in terms of the
number of individuals caught and the number of target woodlands it was found in. Brown
long-eared bats are one of our more common UK species. Harris et al. (1995) estimated a
population size of approximately 200,000 individuals in the UK, although this is likely to be
an underestimate. The brown long-eared bat records collected are comparable with results
from the pilot work (Hill & Greenaway, 2006). There are however, additional behavioural and
ecological reasons for this species’ frequency of capture. The brown long-eared bat is a
woodland specialist with a preference for deciduous woodland. It is a gleaning bat, with a
manoeuvrable flight pattern that allows it to feed in cluttered environments (Entwistle et al.,
1996). It has also been shown that this species (particularly the females) favour foraging areas
close to roosting sites: Entwistle et al. (1996) found that this species concentrated its foraging
within 0.5km of the roosting site. Lastly this species also defends its territory in a similar way
to Bechstein’s bat. These characteristics are similar to those of the Bechstein’s bat (Schofield
& Morris, 2000). By placing traps in cluttered areas so that territorial, foraging Bechstein’s
bats will encounter the Autobat, the chances of trapping a brown long-eared bat are also likely
to be increased.
4.2.2 Other species captures Of the 12 species and one species group caught during surveys, capture frequency showed
wide variation with some species such as the lesser horseshoe bat, Leisler’s bat and serotine
only being encountered on a handful of occasions, whereas other species, particularly Myotis
31
species and the pipistrelles were caught more frequently. These differences can be explained
by a combination of factors. The species caught on a regular basis tended to be woodland
specialists (Myotis) and the commonest species (pipistrelles). Those caught infrequently
tended to be the bigger bats which do not usually forage in dense canopy cover where traps
were situated (e.g. serotine, Catto et al., 1999).
4.3 Survey methodology
4.3.1 Assessing the effectiveness of the protocol - to catch
Bechstein’s bat The success of the survey method, which involved the use of a harp trap and acoustic lure at
two selected sites within each woodland, is illustrated by the rate of capture (across surveys)
of Bechstein’s bat and the subsequent distribution map that we have been able to produce
(Figures 2 and 5).
Through this method we have been able to show the significance of Dorset and Somerset for
this species, as is illustrated by Table 3 which looks at the proportion of woodlands with
Bechstein’s bat in each county. Bechstein’s bat was found in 57.2% of Dorset squares
surveyed (predominantly males) and 34.4% of Somerset squares (mainly females). In
addition, the discovery of breeding females in Worcestershire, Buckinghamshire and Kent,
three counties that had no previous records of this kind, demonstrates the success of the
method used.
However, the performance of the Autobat (and survey protocol) in certain counties in which
Bechstein’s bat captures were expected but [rarely] found (specifically Gloucestershire)
requires further consideration.
Why didn’t the Gloucestershire surveys yield the expected results in terms of presence of
Bechstein’s bats in woodlands (and overall catch rates)? From other work (Palmer et al.,
2007) we know that maternity colonies of Bechstein’s bats do occur in Gloucestershire,
however the Bechstein's Bat Survey results do not reflect this. Both Autobats used in
Gloucestershire were tested to confirm they were working effectively, and were not found to
have any faults. Towards the end of the group’s involvement in the project, the survey period
was extended by up to an hour for some surveys (although any additional captures are not
included in the main data set), but this did not yield additional Bechstein’s bat catches. It is
possible that in large, heavily-wooded areas such as the sites surveyed in Gloucestershire,
capture success increases in the later part of the evening/early morning (this occurred in
previous work in the county, E Palmer, pers comm., 2008). This was also found in parts of
Hampshire during the earlier stages of the pilot work. A suggested theory being that
normally bats are reacting to the autobat as an intruder to their patch (when feeding and
defending their individual area). Unless lactating, females will spend all of their time in their
individual patch. It is suggested that in good woodlands or very good weather, individuals can
feed more effectively, return to the roost site for longer periods and therefore have more time
to socialise. The reaction to the autobat is then not aggressive but social, which normally
occurs later in the night than the BCT survey period (F Greenaway, pers comm., 2011).
Other hypotheses that may explain the low numbers of Bechstein’s bat caught in
Gloucestershire include the possibility that in very large woodland areas it is more difficult to
select a site and successfully lure a Bechstein’s bat. The bats may be more spread out and
therefore the chances of placing the trap within the bat’s territory are lowered, or perhaps the
colony are only using a small area during that particular season so identifying the right area in
32
the woodland to survey is difficult. In addition a larger wooded area available does not
necessarily result in a larger number of individuals using that site. This is because there are
other factors that will restrict the upper size limit of a colony, regardless of the foraging area
available, e.g. available roosting sites, disease, competition, etc. Thus the chance of capturing
a female when undertaking just one three hour survey in these large heavily wooded sites is
reduced.
4.3.2 Assessing the effectiveness of the protocol – for non-
Bechstein’s bat captures The secondary aim of the project was to provide data on other bat species using the woodland.
The call sequence played by the Autobat consisted of both Bechstein’s bat and non
Bechstein’s bat calls to try and attract other species to the trap. Previous experience suggests
a three hour survey of this kind may yield a capture rate of approximately six individuals (F
Greenaway pers comm., 2008); the average capture rate for each group is given in Appendix
1.
The number of individuals (of all species) caught per survey varied among woodlands (as
would be expected) but also between counties, with some groups having a lower overall catch
rate than others, for example both Worcestershire and Somerset had the highest catch rates
with an average of 5.6 and 5.9 individuals per survey respectively. Groups such as
Gloucestershire and Oxfordshire (2.7 and 2.7 respectively) had the lowest catch rates and also
lacked the diversity of species caught. For individual woodland surveys, low catch rate and/or
species diversity could be a result of the suitability of the woodland or environmental
conditions on the night of the survey. Where catch rate was consistently low (e.g. across a
number of surveys undertaken by a group) the success of trap placement should also be
considered as well as weaknesses in the training provided and the nature of the management
of the wider landscape (e.g. intensive forestry, farming, etc.).
Survey problems in Gloucestershire have been discussed in section 4.3.1 in relation to
Bechstein’s bat captures but issues encountered are likely to have affected the low catch rate
observed here as well. Without further work, it is difficult to address this issue any further,
but it is likely that the size of the woodland area surveyed is a factor. A more concentrated
survey effort may be required in heavily-wooded areas such as those seen in this county.
Oxfordshire was not expected to generate many Bechstein’s bat records due to its northerly
location (although this thought was prior to the records found in neighbouring
Buckinghamshire) but it is useful to address the low overall catch rate here as well.
Oxfordshire was the only county to choose the option of surveying their two sites in each
woodland consecutively rather than simultaneously. The consecutive survey method was used
successfully in the pilot study and is not considered to yield differing results to surveying the
two sites simultaneously as was done by all other bat groups (Hill & Greenaway, 2006).
Of the 39 10km squares within or partially within Oxfordshire, just 20 had suitable woodlands
(and of the 12 squares that were surveyed, none supported woodlands that matched all four of
the woodland model criteria). It could therefore be possible that this county does not have
enough suitable woodland to support a Bechstein’s bat population (as a result of the
woodlands themselves and the management of the surrounding landscape). This may also
limit the use of these woodlands by other woodland specialists.
Interestingly, the catch rate for Buckinghamshire (with the exception of the Bechstein’s bats
caught) was also quite low (3.1). The group have reported that suitable woodland (according
to the habitat model) is mainly located in the northern part of the county. It may therefore be
that the low average catch rate is as a result of the survey of woodlands in the southern part of
the county, bringing the overall catch rate down.
33
4.3.3 Are there any changes we would make to the protocol? The project had very clear objectives, one of these being to test the protocol devised during
the pilot study across the UK range to see whether a systematic monitoring survey can be
deployed by volunteers and be effective in providing baseline information on Bechstein’s bat
distribution. To ensure that data from each county or area were comparable, it was necessary
to retain standardisation of the survey method across all areas and throughout the project.
There was no capacity available to test deviations from the protocol or amendments to it, for
example to trial different approaches in areas where we observed reduced success in capturing
Bechstein’s bat.
It is clear however, that the protocol was more effective in some areas than others (although
we would suggest that this was predominantly a problem in just one county –
Gloucestershire). If the protocol is to be used in future surveys small amendments to the
survey method may be tested. For example, in heavily wooded counties such as
Gloucestershire or Hampshire, a more intensive level of survey effort may be required to
produce positive results. Additionally, starting later in the evening in these areas should be
tested.
4.4. The volunteer system
Following on from the pilot study, Frank Greenaway and Dr David Hill approached BCT to
deliver this project across the UK range because it required the involvement of bat group
volunteers to be successful at such a large scale. Contracting one individual to undertake this
work in each county of the Bechstein’s bat range would be both prohibitively costly and time-
consuming.
The volunteer element of this project has been key to its success both in terms of the project
data generated (it allowed BCT to deliver this project across 10 counties within four years),
and in the opportunity provided to BCT to support bat groups in developing their own skill
and knowledge base. The progress of each survey group is discussed in appendix 3.
4.4.1. Lessons learnt - survey coverage Surveying every relevant 10km square within a county is a substantial challenge, particularly
for larger counties such as Devon and Cornwall. Attempts were made to reduce survey areas
for the larger counties involved. However we had to acknowledge that the level of work
required (which included a daytime ground survey of potential woodlands and evening
surveys of the best fit woodlands, in addition to organising the involvement of other
volunteers within the bat group) was too big an expectation for most groups. Asking
volunteers who are donating their spare time and working around other commitments such as
family and full-time jobs, to replicate the work of a paid contractor was extremely optimistic
and in most cases not achievable.
We had to acknowledge at an early stage that it would not be possible to survey every square
of the survey area. Rather it was imperative to provide support to groups, offer guidance in
how to prioritise surveys and achieve as much as possible in a focused area.
4.4.2. Lessons learnt - standardisation As this was a systematic survey it was important to ensure that as far as possible all groups
taking part carried out the survey in a consistent manner. Co-ordinators were asked to attend
34
training sessions to be taught the methods to be used. In addition the Autobats were fixed to
play a set sequence of calls, and the data was recorded onto a standard recording form.
It is however inevitable when using more than one individual or group to carry out field
surveys, that there will be deviation from and different interpretation of the standard methods.
For example recording the percentage of canopy cover in a woodland is subject to observer
variation, and likely to yield different results depending on the individual assessing it. This
has been taken into account when interpreting the suitability of woodlands surveyed.
There was also some deviation in how rigidly groups stuck to the standard timing of the
surveys, which was set at 1.5hrs. Some groups surveyed for exactly 1.5 hours at each trap site
following the method precisely. Others tended to run over slightly on each survey, and some
actively chose to survey for longer than the required period. Records gained as part of these
extended survey periods were considered useful at a local level but have had to be excluded
from the main project data analysis to ensure that the results are comparable across the entire
survey area.
4.4.3. Lessons learnt - volunteer expectations One of the main appeals of being involved in the project for individuals was the new skills
that the surveys required, and therefore the opportunity to develop new skills and gain
experience using equipment such as harp traps and Autobats. We have however learnt that it
is essential when planning a project such as this to consider the opportunities open to
volunteers following the project. Equipment availability and licensing issues have limited the
aspirations of some groups who would like to set up their own follow-on projects using the
skills they have gained from the Bechstein’s Bat Survey. BCT is now working to develop
follow-up projects and support for the bat groups who have been involved in this project to
help to overcome some of these issues.
35
Future development
5.1 Understanding habitat associations
Through the work of the Bechstein’s Bat Survey we have been able to test whether a habitat
model, devised and tested in Sussex, can be successful in identifying the presence of
Bechstein’s bat maternity colonies in woodlands across the species’ UK range. We have
shown that this model can be used as an overall selection tool to identify sites where
Bechstein’s bats are present. However, it is clear that there are differences in woodlands used
by the species across its range and that the importance of particular variables (including
higher level variables such as annual temperature and rainfall) may change across the range.
There is therefore scope for further surveying and analysis to be undertaken in areas identified
from this project to support populations of Bechstein’s bats to look in more detail at the
importance of particular variables in determining presence.
By combining the Bechstein’s bat records from this project with other records that we have
collated from bat groups and individuals, we can start to investigate relationships between
species presence and some of the additional higher level factors such as annual temperature in
a region, which were outside the scope of the project, but may also contribute to the overall
distribution and range of this species within the UK. It is possible, from populations studied in
Sussex, that Bechstein’s bat fails to breed successfully in some summers (as was seen in
2008), which would support a link to temperature (F, Greenaway per comm., 2010).
We have completed some basic mapping work using Geographic Information System (GIS)
MapInfo to look at patterns of Bechstein’s bat presence and factors such as temperature and
woodland cover. The aim of this mapping task is to identify potential questions that we would
like to investigate in more detail, to focus the direction of future habitat modelling work, as
outlined in section 5.3.
First, we overlaid the male and female Bechstein’s bat records with annual growing days (a
temperature data set available from the Met Office website: http://www.metoffice.gov.uk/)
(Figure 6). This allows us to look at whether temperature might be correlated with
Bechstein’s bat distribution. At a visual level we can see that the hotspot areas identified
(Dorset/Somerset, Hampshire and Isle of Wight, and Sussex) are mainly in relatively warm
areas (as shown by the warmer orange and red colours on the map).In particular, the south-
west part of Hampshire and Isle of Wight, where there is a concentration of records, is shown
to be very warm. Additionally in the Dorset/Somerset hotspot, the majority of female records
were found in Somerset which is where the slightly warmer temperatures appear to be from
visual inspection of the map.
If annual temperature does play a factor in Bechstein’s bat presence as suggested by this map,
we may be able to begin to understand one of the barriers to range extension of core maternity
colonies, for example into western Devon and Cornwall (where cooler annual temperatures
are seen), or into parts of South Wales. However, the warmer areas do extend into parts of
Gloucestershire where Bechstein’s bats were not found where they were expected. If
distribution is influenced by annual temperature, the warmer temperatures seen in
Gloucestershire may provide support for the theory that the survey method was less
successful in this area due to the large size of the woodlands, rather than any lack of
suitability of these woodlands to support Bechstein’s bats.
36
If broadleaf woodland patches of 25ha or larger are added to the map (Figure 7 – the red
patches illustrate this), we can build on the picture of distribution in relation to temperature. It
is possible to see that some woodland areas in Gloucestershire appear cooler in their annual
temperature which may also affect the suitability of parts of this county for Bechstein’s bat.
The map also highlights that the area of Worcestershire in which female records were
collected is quite sparse in terms of woodland cover. This suggests that these populations
could be quite vulnerable if not managed sensitively, and would benefit from additional
survey work to better understand the area and its use by Bechstein’s bat.
Lastly, by illustrating where colonies are present, we can start to suggest areas, originally
outside the survey area in which suitable habitat may be present and therefore where further
surveys could be undertaken.
5.2 Woodland management guidance
It is vital that work continues in areas where new Bechstein’s bat records have been
discovered as part of this project. For example, working with landowners and local bat groups
to ensure that individuals responsible for the Bechstein’s bat sites are aware of what has been
found and what this means in terms of future woodland management and conservation needs.
It is also important to ensure that, where hotspots have been identified e.g. Dorset and
Somerset that any work across the region takes into account the possible presence of
Bechstein’s bat and the significance of appropriate conservation and management at a
regional scale to ensure the long term viability of the species here.
As part of the work of BCT’s new Bats and Woodland Officer, we will be producing
woodland management guidance specific to this species in 2012. The aim of the guidance will
be to ensure that appropriate advice is given to ensure woodlands where Bechstein’s bats are
found are managed appropriately to provide the best habitat for this species, but also to allow
landowners to understand when and how work can be undertaken. It will also provide
information on funding and grant schemes which landowners may be able to access to
promote the conservation of Bechstein’s bat on their site.
The key information on Bechstein’s bats and woodlands that has emerged from this project is
summarised below:
Breeding female Bechstein’s bats are predominantly found in woodlands that meet
three or four of the following criteria:
- Broadleaf woodland particularly that dominated by oak and/or ash
- At least 75% canopy cover
- Native understorey present, particularly hazel and hawthorn
- At least 50% understorey cover
Core maternity areas need a woodland size of at least 25ha
This woodland may be made up of one woodland block or may consist of two to three
smaller, connected blocks. This is particularly true for woodland sites in Somerset
and Dorset where maintaining woodland connectivity is vital.
Understorey cover is particularly important and should be retained where possible
Bechstein’s bat maternity roosts are usually found within 1km of a water body
37
Males, non-breeding females and smaller breeding colonies may be found in
woodlands that do not meet the above criteria. These individuals are important to the
long-term success of a colony and therefore woodlands where there presence has been
identified should also be sensitively managed.
Our current understanding of the UK range of the Bechstein’s bat is that the species is
present from Devon in the west of England to Kent in the east, extending north to
Worcestershire and Buckinghamshire, with additional outlying male records in south
Wales.
Core areas for this species are Somerset, Dorset, Wiltshire, Hampshire, Isle of Wight
and West Sussex. The long-term viability of this species in the UK requires
significant conservation effort in these areas to safeguard populations and sensitively
manage and maintain key woodland sites.
Significant edge of range populations are also present in Worcestershire and
Buckinghamshire. These populations are likely to be extremely vulnerable to any
changes in woodland management practices or land use change for example resulting
from large-scale development.
5.3 Future projects and research
The Bechstein’s Bat Survey has met its original aims in terms of collecting baseline
distribution data, identifying hotspots and defining the species range. There are however
many further questions that this work has provoked and aspects that subsequent
survey/research work could focus on.
5.3.1 Female Bechstein’s bat records Where female Bechstein’s bats were caught, further survey work should be considered to
locate maternity roost sites, develop an understanding of the size of the colony and how it
uses the surrounding area. This information can identify key areas of woodlands used by the
bats, and be used as a baseline for conservation management of that site. It will also add to
our understanding of the importance of particular areas for the species.
In the final season of the project, some additional survey work was undertaken in
Buckinghamshire, Dorset, Kent and Worcestershire as described below.
Buckinghamshire
The work carried out in this county has formed part of the Bernwood Forest Bechstein’s Bat
Project which began in 2011 (with additional work planned for 2012). This project involves
those individuals who acted as co-ordinators for the BCT project and has been supported by
BCT through the on-going loan of equipment.
In its first summer (2011) the work has involved surveying further woodlands within the area
in which Bechstein’s bat was recorded using the BCT Bechstein’s Bat Survey protocol.
Where females were caught the group have radio-tracked a proportion of these captures to
identify roosting sites, estimate colony size and determine the foraging range of the bat
colony. A summary report of this work has been produced which further emphasises the
importance of the Bernwood area for the species (Damant et al, 2011). A count of over 60
individuals from one of the tree roosts identified confirms that this is a significant core
38
population. Further survey work will be carried out in the summer of 2012 with the support of
BCT.
Dorset
Volunteers from the Dorset Bechstein’s bat team surveyed a further 8 woodlands within
squares 3611 and 3610 (in which females were found in 2009 surveys). These squares support
a typical example of the small woodland block system that is present in much of Dorset. This
further survey work has found an additional three sites used by female Bechstein’s bats, two
of which are connected/very close to the initial woodland identified. This is likely to mean
that the same colony uses these new woodlands as an extension of their territory. However,
the group have reported that the third new woodland identified is situated further away (from
other female woodlands identified in the square) which could suggest that this woodland is
used by a separate colony. This additional survey work illustrates how important it is,
particularly in this county where the woodland is found in small, connected patches, to ensure
that woodland management plans take into account the network of connected woodlands in
any given area that could be used by Bechstein’s bats, rather than focusing on individual
blocks. Additional work at a more detailed level to identify roosting locations, colony size and
foraging areas in this county would be beneficial to gain a better understanding of the
populations using these woodlands.
Kent
Additional surveys carried out in Kent have centred on the area in which the single female
Bechstein’s bat was captured during the main surveys. Four additional woodlands were
surveyed during the summer of 2011 (using the BCT protocol) but no further Bechstein’s bats
were captured. Although these woodlands matched some of the model criteria (particularly
canopy cover and dominant species) they were lacking in the percentage of understorey cover,
only one of the four woodlands met the percentage understorey cover criteria (at 50% cover).
This is therefore likely to have affected suitability.
The group reported that all of these additional sites had an obvious lack of herb layer and a
deer browse line. Given that the results of this project have highlighted the importance of a
well-developed understorey, it is very likely that deer browsing could also affect the
suitability of these sites for Bechstein’s bat. The possible effects of deer browsing should be
considered for all sites where Bechstein’s bat is present.
Worcestershire
Surveys focused on adjoining squares 3826, 3925 and 3926 (female Bechstein’s bats were
caught in squares 3925 and 3926). Five new woodlands were surveyed in the latter part of the
2011 survey season using the BCT protocol. Two new Bechstein’s bat sites were identified
from this work (a male and female Bechstein’s bat found at each of these new sites – squares
3925 and 3926). The bat group are now working with major landowners in the area to try to
set up a radio-tracking project to gather more information on the use of this area by the
Bechstein’s bat population.
5.3.2 Habitat modelling work In conjunction with Professor Gareth Jones from the Bat Ecology and Bioacoustic Lab at
Bristol University, BCT will be using the Bechstein’s bat data to look in more detail at
distribution modelling. Maximum Entropy presence-only modelling (Maxent), which
combines known locations of the species with environmental variables to give an overall
predicted distribution, will be used to improve our understanding of the likely extent of where
this species may occur. This work will identify where further survey work should be targeted
to confirm the full extent of the species’ range in the UK, and also consider the potential
future effects of climate change on the distribution of the Bechstein’s bat and available
habitat.
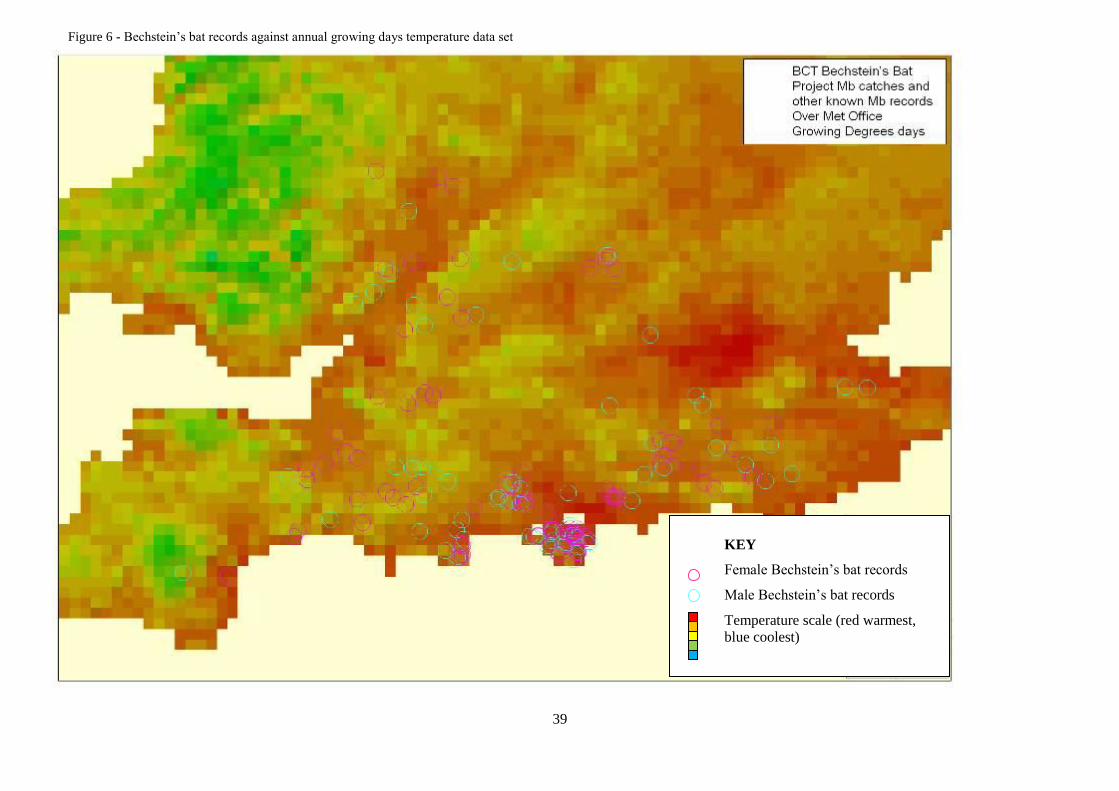
39
[Type a quote from the document or the summary of an
interesting point. You can position the text box anywhere
in the document. Use the Drawing Tools tab to change the
formatting of the pull quote text box.]
Figure 6 - Bechstein’s bat records against annual growing days temperature data set
KEY
Female Bechstein’s bat records
Male Bechstein’s bat records
Temperature scale (red warmest,
blue coolest)
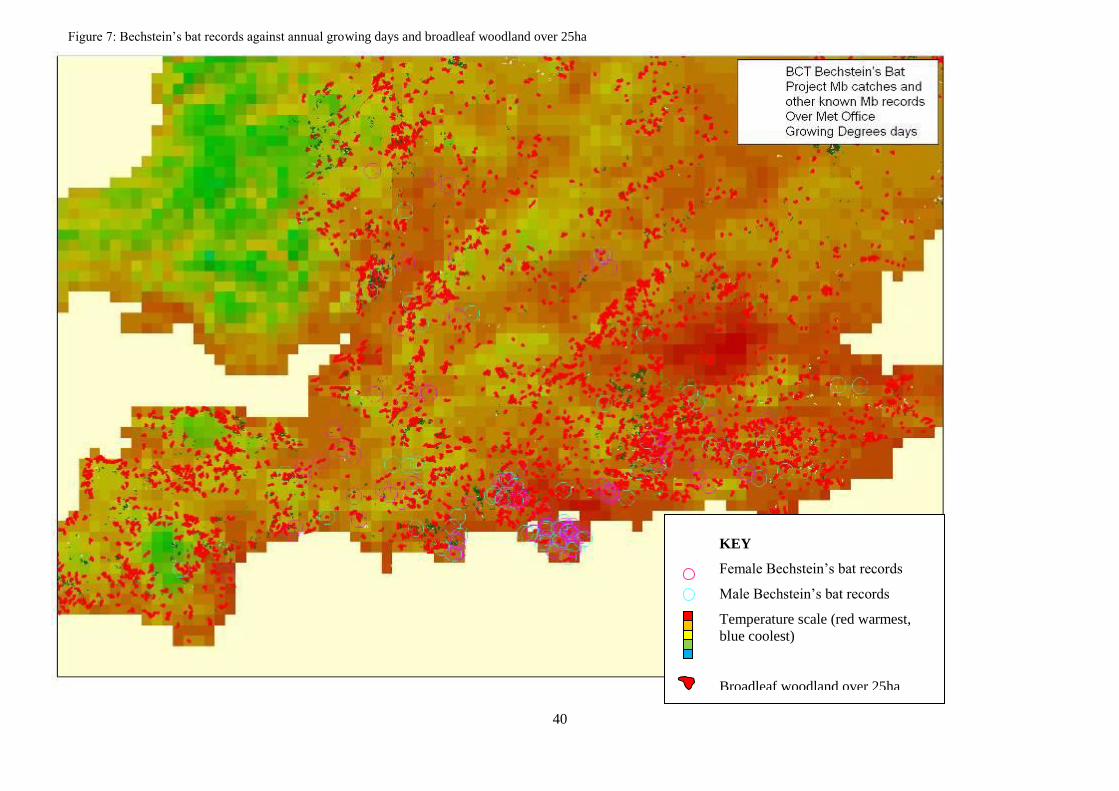
40
Figure 7: Bechstein’s bat records against annual growing days and broadleaf woodland over 25ha
KEY
Female Bechstein’s bat records
Male Bechstein’s bat records
Temperature scale (red warmest,
blue coolest)
Broadleaf woodland over 25ha

41
5.3.3 Future use of the data The important new distribution data on Bechstein’s bats in the UK delivered by this project
can be used in the future in a number of ways:
Future reporting under Article 17 of the Habitats Directive on the status of this
species
Informing the work of the Barbastelle and Bechstein’s Technical Advisory Group
(BBTAG) which was set up to facilitate collaboration, sharing of findings,
development of new research techniques, and conservation management advice
between experts working on these two species.
Contributing towards BAP targets for the species
Providing baseline information on which further project work on Bechstein’s bats in
the UK can be built, as already is happening in some counties
Providing baseline distribution data which has been added to the National
Biodiversity Network Gateway at an appropriate scale to help inform local
conservation and communities of the bats in their area. The Bechstein’s Bat Survey
dataset can be accessed at
http://data.nbn.org.uk/datasetInfo/taxonDataset.jsp?dsKey=GA000570
Distribution modelling based on the improved information on distribution that is now
available for this species
Further analysis of the data on species other than Bechstein’s bat
42
References
Altringham J. 2011. Bats. From Evolution to Conservation. 2nd
edn. Oxford University Press,
Oxford
Bat Conservation Trust. 2009. Bechstein’s bat project annual report.
Catto, C.M.C., Hutson, A.M., Racey, P.A. & Stephenson, P.J. 1996. Foraging behaviour and
habitat use of the serotine bat (Eptesicus serotinus) in southern England. Journal of Zoology
238(4): 623-633.
Entwistle, A.C, Racey, P.A, & Speakman, J.R. 1996. Habitat exploitation by a gleaning bat,
Plecotus auritus. Philosophical Transactions 351: 921-931.
Damant, C., Hodgkins, J. & Thorne, T. 2011. Bernwood Forest Bechstein’s Project – First
year results summary.
Davidson-Watts, I. 2008. The Isle of Wight Woodland Bat Project Final Report. Report to
People‘s Trust For Endangered Species.
Greenaway, F. & Hill, D.A. 2004. Woodland management advice for Bechstein’s bat and
barbastelle bat. English Nature Research Report R658. English Nature.
Harris, S, Morris, P, Wray, S. & Yalden, D. 1995. A review of British mammals: population
estimates and conservation status of British mammals other than cetaceans. Joint Nature
Conservation Committee, Peterborough.
Harris, S. & Yalden, D. 2008. Mammals of the British Isles: Handbook, 4th edition. The
Mammal Society. 328-331
Hill, D. A, & Greenaway, F. 2005. Effectiveness of an acoustic lure for surveying bats in
British woodlands. Mammal Review 35(1): 116-122.
Hill, D A, & Greenaway, F. 2006. Putting Bechstein’s bat on the map. Final Report to
Mammals Trust UK. London.
Hill, D. A, & Greenaway, F. 2008. Conservation of bats in British woodlands. British
Wildlife 19(3): 161-169.
Hutson A.M. & Racey P.A. 2004. Examining bats. In: Bat Workers’ Manual. 3rd
Edn. Joint
Nature Conservation Committee, Peterborough.
IUCN 2011. IUCN Red List of Threatened Species. Version 2011.2.
<http://www.iucnredlist.org>. Downloaded on 10 November 2011.
Jan, C.M. I., Frith K., Glover, A.M., Butlin R.K., Scott, C.D., Greenaway F., Ruedi, M.,
Frantz A.C., Dawson D.A. & Altringham A.D. 2010. Myotis alcathoe confirmed in the UK
from mitochondrial and microsatellite DNA. Acta Chiropterologica 12: 471-483.
Joint Nature Conservation Committee. 2007. Second Report by the UK under Article 17 on
the implementation of the Habitats Directive from January 2001 to December 2006.
Peterborough: JNCC. Available from: www.jncc.gov.uk/article17
43
Kerth, G. & Koenig, B. 1999. Fission, fusion and non-random associations in Female
Bechstein’s bats (Myotis bechsteinii). Behaviour 136: 1187-1202
Kerth, G., Wagner, M. & Koenig, B. 2001. Roosting together, foraging apart: information
transfer about food is unlikely to explain sociality in female Bechstein’s bats (Myotis
bechsteinii). Behavioral Ecology and Sociobiology 50: 283–291.
Palmer, E, Bonfield, C, Downs, N. 2007. Bechstein’s bats and barbastelle bats in
Gloucestershire: a survey report for 2006-2007. Gloucestershire bat group report.
Parsons S. & Jones G. 2000. Acoustic identification of twelve species of echolocation bat by
discriminant function analysis and artificial neural networks. Journal of Experimental Biology
203: 2641-2656.
Russ, J. 1999. The bats of Britain and Ireland. Echolocation Calls, Sound Analysis and
Species Identification.
Schofield, H. & Morris, C. 2000. Ranging behaviour and habitat preferences of female
Bechstein’s bat, Myotis bechsteinii in summer. Vincent Wildlife Trust.

44
Acknowledgements
BCT are extremely grateful to project advisors Dr David Hill and Frank Greenaway for their
expertise, input and support at all stages during this project. We would also like to thank them
for approaching and working with BCT to replicate their work during the pilot study on a
national scale.
We would also like to thank Peter Reed from the University of Sussex who supplied and fixed
the Sussex Autobats used, Daniel Whitby for his help during the training courses, James
Mason for his help with the GIS mapping work, Steve Langton who completed the statistical
analysis and Kate Barlow for her input on the content of this report.
We are very grateful to the survey volunteers from North Buckinghamshire, Carmarthenshire,
Cornwall, Devon, Dorset, Dyfed, Gloucestershire, Kent, Oxfordshire, Somerset, Surrey and
Worcestershire Bat Groups who took part. In particular those individuals who agreed to act as
volunteer coordinators for each team; Ross Baker, Pete Banfield, Martyn Cooke, Nick
Bentham-Green, Fergus Henderson, Jo Hodgkins, Dave Hunter, Paul Kennedy, Steve Lucas,
Steve Marshall, James Mason, Tom McOwatt, David Priddis, John Puckett, Sue Searle, Jane
Sedgeley, Tony Serjeant, Shirley Thompson, Toby Thorne, Reg Tipping, Nick Tomlinson,
Kathy Warden, Stephen West, Trish Wilczak and Al Wrigley. BCT would also like to
acknowledge the landowners who allowed survey teams access to survey their woodlands for
the purposes of the project.
Lastly we would like to thank our funders for supporting the Bechstein’s Bat Survey:
BBC Wildlife Fund
Countryside Council for Wales (Species Challenge Fund)
Forestry Commission England
Forestry Commission GB
Forestry Commission Wales
Landfill Communities Fund of Waste Recycling (WRG) administered by the
Environmental Body WREN
People’s Trust for Endangered Species/Mammals
Thames Valley Environmental Records Centre
The Scottish Forestry Trust
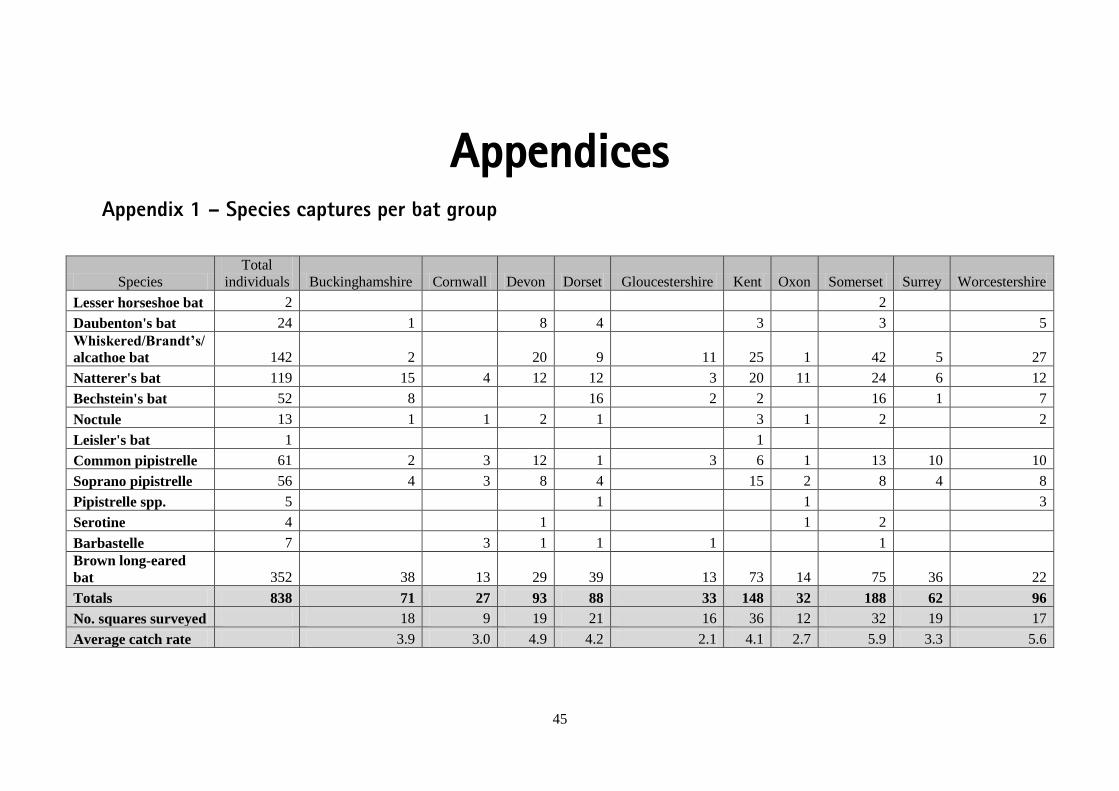
45
Appendices Appendix 1 – Species captures per bat group
Species
Total
individuals Buckinghamshire Cornwall Devon Dorset Gloucestershire Kent Oxon Somerset Surrey Worcestershire
Lesser horseshoe bat 2 2
Daubenton's bat 24 1 8 4 3 3 5
Whiskered/Brandt’s/
alcathoe bat 142 2 20 9 11 25 1 42 5 27
Natterer's bat 119 15 4 12 12 3 20 11 24 6 12
Bechstein's bat 52 8 16 2 2 16 1 7
Noctule 13 1 1 2 1 3 1 2 2
Leisler's bat 1 1
Common pipistrelle 61 2 3 12 1 3 6 1 13 10 10
Soprano pipistrelle 56 4 3 8 4 15 2 8 4 8
Pipistrelle spp. 5 1 1 3
Serotine 4 1 1 2
Barbastelle 7 3 1 1 1 1
Brown long-eared
bat 352 38 13 29 39 13 73 14 75 36 22
Totals 838 71 27 93 88 33 148 32 188 62 96
No. squares surveyed 18 9 19 21 16 36 12 32 19 17
Average catch rate 3.9 3.0 4.9 4.2 2.1 4.1 2.7 5.9 3.3 5.6
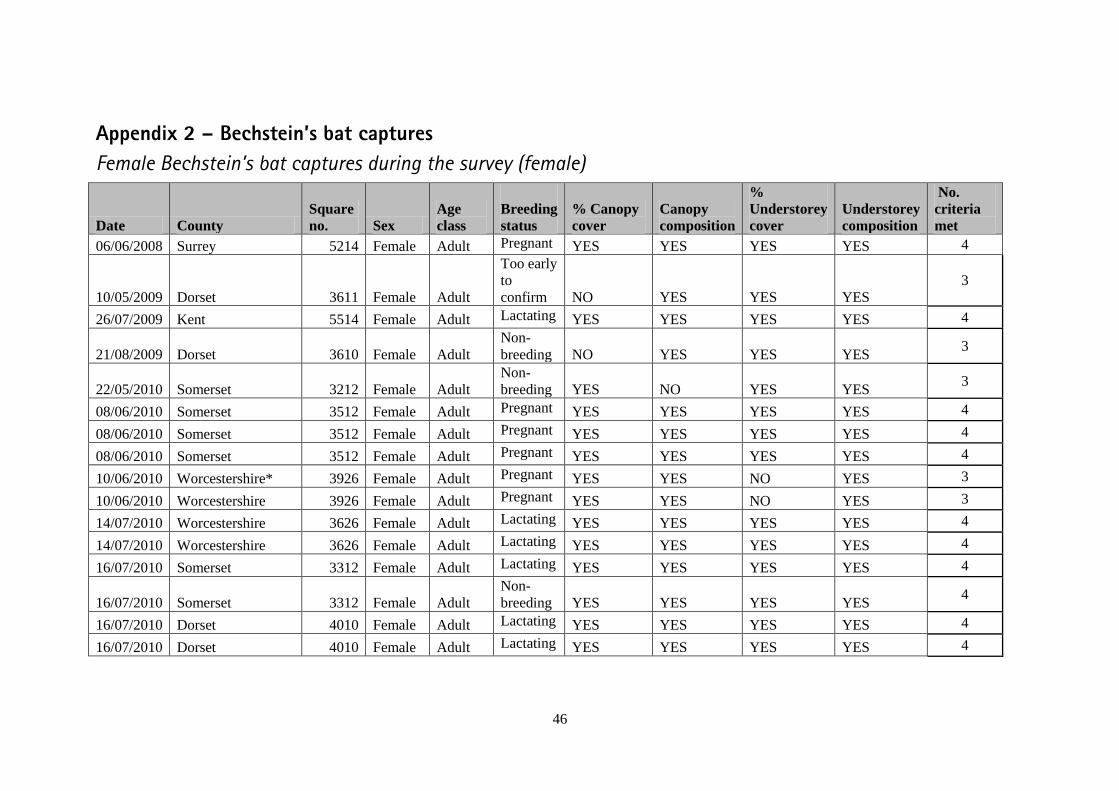
46
Appendix 2 – Bechstein’s bat captures
Female Bechstein’s bat captures during the survey (female)
Date County
Square
no. Sex
Age
class
Breeding
status
% Canopy
cover
Canopy
composition
%
Understorey
cover
Understorey
composition
No.
criteria
met
06/06/2008 Surrey 5214 Female Adult Pregnant YES YES YES YES 4
10/05/2009 Dorset 3611 Female Adult
Too early
to
confirm NO YES YES YES
3
26/07/2009 Kent 5514 Female Adult Lactating YES YES YES YES 4
21/08/2009 Dorset 3610 Female Adult
Non-
breeding NO YES YES YES 3
22/05/2010 Somerset 3212 Female Adult
Non-
breeding YES NO YES YES 3
08/06/2010 Somerset 3512 Female Adult Pregnant YES YES YES YES 4
08/06/2010 Somerset 3512 Female Adult Pregnant YES YES YES YES 4
08/06/2010 Somerset 3512 Female Adult Pregnant YES YES YES YES 4
10/06/2010 Worcestershire* 3926 Female Adult Pregnant YES YES NO YES 3
10/06/2010 Worcestershire 3926 Female Adult Pregnant YES YES NO YES 3
14/07/2010 Worcestershire 3626 Female Adult Lactating YES YES YES YES 4
14/07/2010 Worcestershire 3626 Female Adult Lactating YES YES YES YES 4
16/07/2010 Somerset 3312 Female Adult Lactating YES YES YES YES 4
16/07/2010 Somerset 3312 Female Adult
Non-
breeding YES YES YES YES 4
16/07/2010 Dorset 4010 Female Adult Lactating YES YES YES YES 4
16/07/2010 Dorset 4010 Female Adult Lactating YES YES YES YES 4
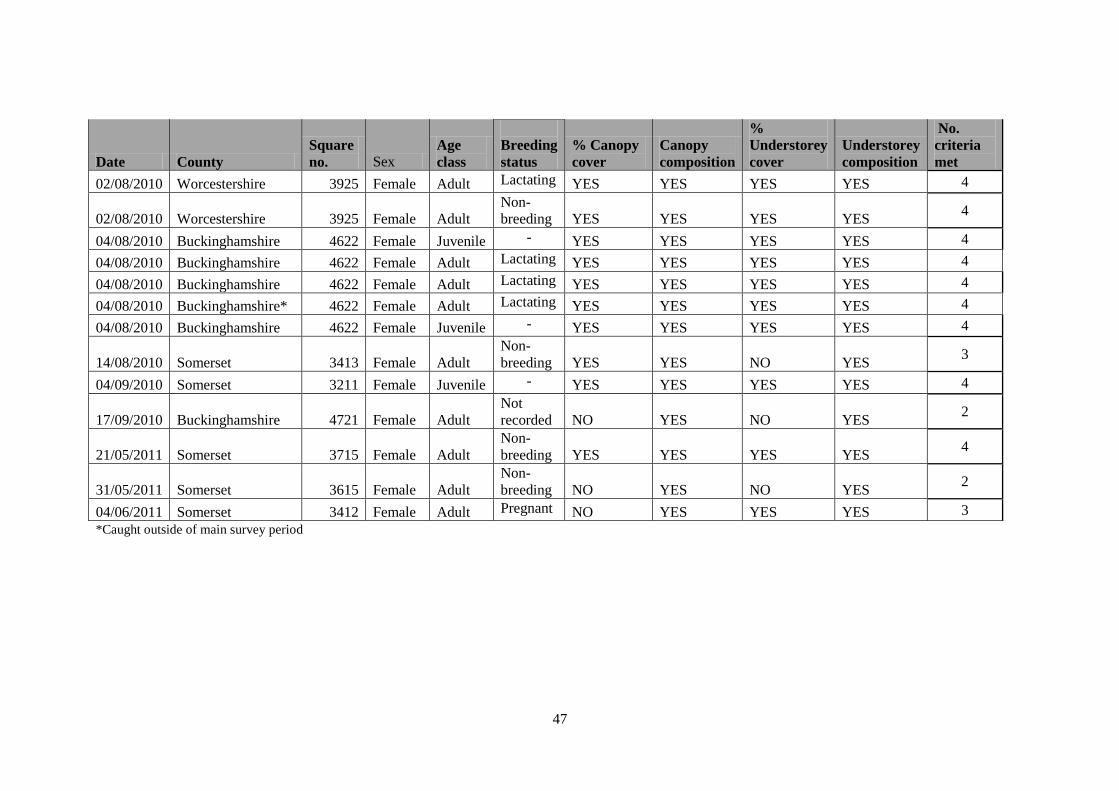
47
*Caught outside of main survey period
Date County
Square
no. Sex Age
class
Breeding
status
% Canopy
cover
Canopy
composition
%
Understorey
cover
Understorey
composition
No.
criteria
met
02/08/2010 Worcestershire 3925 Female Adult Lactating YES YES YES YES 4
02/08/2010 Worcestershire 3925 Female Adult
Non-
breeding YES YES YES YES 4
04/08/2010 Buckinghamshire 4622 Female Juvenile - YES YES YES YES 4
04/08/2010 Buckinghamshire 4622 Female Adult Lactating YES YES YES YES 4
04/08/2010 Buckinghamshire 4622 Female Adult Lactating YES YES YES YES 4
04/08/2010 Buckinghamshire* 4622 Female Adult Lactating YES YES YES YES 4
04/08/2010 Buckinghamshire 4622 Female Juvenile - YES YES YES YES 4
14/08/2010 Somerset 3413 Female Adult
Non-
breeding YES YES NO YES 3
04/09/2010 Somerset 3211 Female Juvenile - YES YES YES YES 4
17/09/2010 Buckinghamshire 4721 Female Adult
Not
recorded NO YES NO YES 2
21/05/2011 Somerset 3715 Female Adult
Non-
breeding YES YES YES YES 4
31/05/2011 Somerset 3615 Female Adult
Non-
breeding NO YES NO YES 2
04/06/2011 Somerset 3412 Female Adult Pregnant NO YES YES YES 3
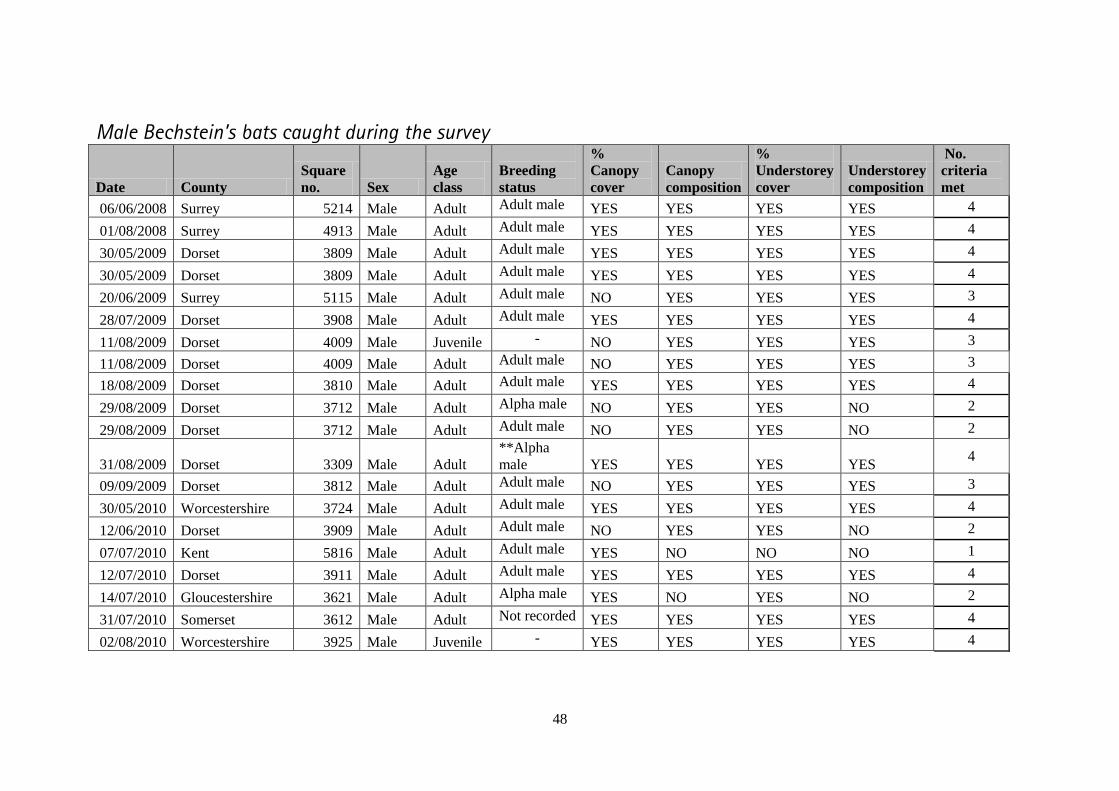
48
Male Bechstein’s bats caught during the survey
Date County
Square
no. Sex
Age
class
Breeding
status
%
Canopy
cover
Canopy
composition
%
Understorey
cover
Understorey
composition
No.
criteria
met
06/06/2008 Surrey 5214 Male Adult Adult male YES YES YES YES 4
01/08/2008 Surrey 4913 Male Adult Adult male YES YES YES YES 4
30/05/2009 Dorset 3809 Male Adult Adult male YES YES YES YES 4
30/05/2009 Dorset 3809 Male Adult Adult male YES YES YES YES 4
20/06/2009 Surrey 5115 Male Adult Adult male NO YES YES YES 3
28/07/2009 Dorset 3908 Male Adult Adult male YES YES YES YES 4
11/08/2009 Dorset 4009 Male Juvenile - NO YES YES YES 3
11/08/2009 Dorset 4009 Male Adult Adult male NO YES YES YES 3
18/08/2009 Dorset 3810 Male Adult Adult male YES YES YES YES 4
29/08/2009 Dorset 3712 Male Adult Alpha male NO YES YES NO 2
29/08/2009 Dorset 3712 Male Adult Adult male NO YES YES NO 2
31/08/2009 Dorset 3309 Male Adult
**Alpha
male YES YES YES YES 4
09/09/2009 Dorset 3812 Male Adult Adult male NO YES YES YES 3
30/05/2010 Worcestershire 3724 Male Adult Adult male YES YES YES YES 4
12/06/2010 Dorset 3909 Male Adult Adult male NO YES YES NO 2
07/07/2010 Kent 5816 Male Adult Adult male YES NO NO NO 1
12/07/2010 Dorset 3911 Male Adult Adult male YES YES YES YES 4
14/07/2010 Gloucestershire 3621 Male Adult Alpha male YES NO YES NO 2
31/07/2010 Somerset 3612 Male Adult Not recorded YES YES YES YES 4
02/08/2010 Worcestershire 3925 Male Juvenile - YES YES YES YES 4
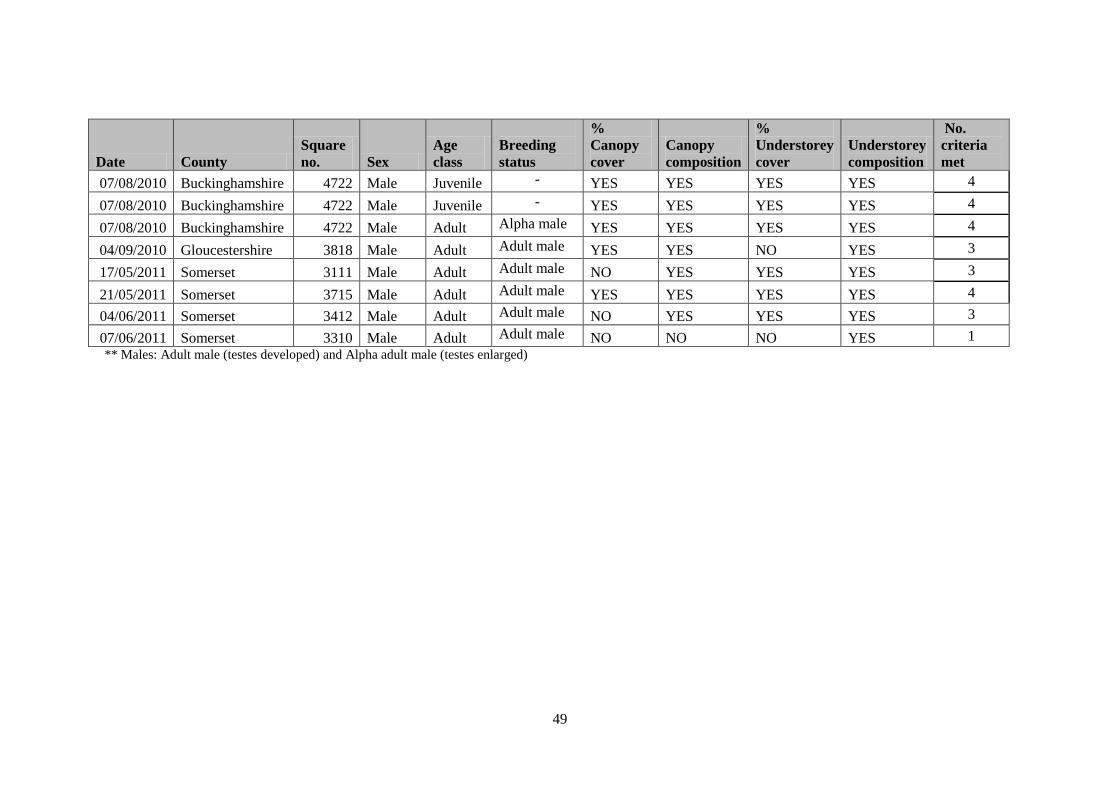
49
Date County
Square
no. Sex
Age
class
Breeding
status
%
Canopy
cover
Canopy
composition
%
Understorey
cover
Understorey
composition
No.
criteria
met
07/08/2010 Buckinghamshire 4722 Male Juvenile - YES YES YES YES 4
07/08/2010 Buckinghamshire 4722 Male Juvenile - YES YES YES YES 4
07/08/2010 Buckinghamshire 4722 Male Adult Alpha male YES YES YES YES 4
04/09/2010 Gloucestershire 3818 Male Adult Adult male YES YES NO YES 3
17/05/2011 Somerset 3111 Male Adult Adult male NO YES YES YES 3
21/05/2011 Somerset 3715 Male Adult Adult male YES YES YES YES 4
04/06/2011 Somerset 3412 Male Adult Adult male NO YES YES YES 3
07/06/2011 Somerset 3310 Male Adult Adult male NO NO NO YES 1
** Males: Adult male (testes developed) and Alpha adult male (testes enlarged)
50
Appendix 3 – Survey groups
In this section, the findings of the surveys from each county are discussed in more detail.
Buckinghamshire
The Buckinghamshire group surveyed 18 squares during 2010 and 2011 (this county had 19
squares with potential woodland out of 34 squares in total). Buckinghamshire was not part of
the original survey area but due to the Hampshire and Wiltshire groups not being able to take
part in the project, and the discovery of a male Bechstein’s bat at a swarming site in
Buckinghamshire in 2009 (C. Damant pers comm. 2009), the group were asked to take part.
Most of the potentially suitable woodland is situated in the northern part of the county known
as the Bernwood forest area. In this part of the county there are broadleaf (predominantly oak)
woodlands of 25 hectares or more with good canopy and understorey cover. The Bernwood
forest area is also where all three Bechstein’s bat sites were identified. This is the first time
that breeding female Bechstein’s bats have been recorded in Buckinghamshire. As
information is currently very limited, there is uncertainty about the stability and size of the
population present in this area. This is discussed further in section 5.
Aside from the Bechstein’s bats found in Buckinghamshire, both the number of bats captured
and the range of species caught is quite low compared to some other groups. This may be at
least partly explained by the lower suitability of woodlands in the southern part of the county
which supported a less diverse range of species.
Cornwall
This group identified 33 squares with woodlands that matched or partially matched the habitat
model criteria. In the remaining 30 squares in the county (many of which were partially
coastal) no suitable woodland was selected.
During 2008 volunteers surveyed 13 sites spread across the county. After consultation with
the project officer it was decided that a focus on a smaller part of the county would be
sensible so that full coverage of an area could be achieved.
In 2009, the Cornwall group focused on the eastern part of the county, surveying nine
squares; three of which were woodlands also surveyed during 2008. Records from these
surveys included three barbastelles caught at three sites where there was no previous record of
this species. It is hoped that the local group can work with the landowners of these sites to
ensure that this species (along with the other species caught) are considered in any future
management of the site.
No Bechstein’s bats were caught during the surveys in either 2008 or 2009 in Cornwall.
Bechstein’s bat has not been recorded here in recent history; the nearest records to Cornwall
are located in east Devon. Coastal conditions may affect the suitability of woodlands here
(e.g. wind and temperature); alternatively there may not be sufficient connectivity or there
may be other barriers (e.g. high altitude in parts of Devon) that limit the expansion of this
species into Cornwall.
Devon
Due to the large size of the county it was originally decided to focus surveys in southern
Devon. It was also agreed that four co-ordinators (rather than two) would be trained and the
group given two full sets of equipment (comprising four harp traps and four Autobats) to
51
efficiently cover the still large survey area. Unfortunately one of the coordinators had to step
down, which left three co-ordinators (and three Autobats and harp traps) to complete the same
area (with two co-ordinators ideally working together at any one time).
The Devon group were limited in their survey coverage by poor weather and low
temperatures. In addition two of the three co-ordinators were also largely restricted to a single
survey night each week (due to other commitments). The group completed 19 surveys with
the number of bats and the variety of species caught here complementing what is already
known about bat diversity in this county. As in Cornwall, no Bechstein’s bats were caught
during the surveys in Devon. Existing records are concentrated in the eastern part of this
county, near to the Devon/Dorset border. Access issues in some of the woodlands in 10km
squares adjacent to those with existing records meant that the area most likely to produce
additional Bechstein’s bat records was not able to be surveyed in this project. At the end of
the survey, the group also noted that if given the opportunity to re-survey, following their
experience and that of other neighbouring groups, they may have chosen to select smaller
blocks of connected woodland (that still met the criteria) above some of the large woodlands
that were surveyed over these because of their size.
Dorset
This group selected set dates on which to survey each week, so volunteers were given lots of
opportunities to attend surveys. Bechstein’s bats were caught in 52% of woodlands surveyed
here, emphasising the importance of this county as a stronghold for the species, as discussed
in section 4.1. A total of 21 squares were surveyed and records of other species included a
male barbastelle at a site where that species had not been previously recorded.
This county has existing records for female Bechstein’s bat in the north-west and south-east
of the county. The females caught as part of the BCT project were identified in adjoining
squares to these existing records.
Interestingly most of the male records identified in Dorset were found in squares that lie
between these two hotspots. This would suggest that these woodlands are less suitable in
some way than those in which females were identified. In terms of the habitat model, five
male woodlands fitted all four criteria, two fitted three and one fitted just two criteria. In the
three woodlands with females, two fitted all four criteria and one fitted three. So there doesn’t
appear to be a big difference here between male and female woodlands; however there is not
enough data to discriminate fully at this scale. These results should also be viewed with
caution; the group did report that access to first choice woodlands was refused in some of
these squares in which males were caught. Additional work is planned to look in more details
at the local population dynamics here.
Gloucestershire
Male Bechstein’s bats were recorded in two woodlands in Gloucestershire, but no female
records were found during the surveys. This county does have existing records of female
Bechstein’s bats and is heavily covered with potentially suitable woodland. It was therefore
expected that surveys would confirm Gloucestershire as an important area for Bechstein’s bat.
As well as the lack of female Bechstein’s bats caught, the number of individuals of other
species and the number of species recorded was low (33 bats of 6 species were caught during
16 surveys). With disappointing results for both Bechstein’s bat and general species catches,
it is possible that the protocol has not been effective in this county, as discussed in the main
report.
Although the lack of individuals caught was disappointing for the group, the project was
successful in terms of the involvement and development of the local bat group. The
52
Gloucestershire co-ordinators have mentioned that the project was an excellent opportunity to
involve the wider members of the group and encourage members to take on new projects to
keep the group active.
Kent
The Kent survey group completed the highest number of surveys during their involvement in
the project with 36 squares surveyed. (Kent has 51 10km squares of which 39 had at least one
potential woodland). Because of this high sampling rate, the number of bats caught was high.
Species diversity was also high. Overall, however, the average catch rate was lower than
some of the other groups (such as Somerset and Worcestershire). Kent’s woodlands have been
heavily managed which has affected their suitability for a wide range of bat species. The
group also reported difficulties in finding sites fitting the habitat model across the county.
This is extremely useful information and provides an insight into available habitat in this
county. It is also worth highlighting that one or more bats was trapped in 34 of the woodlands
surveyed, illustrating the importance of a variety of woodland types for different bat species
and the importance of considering bat species in all woodland types.
As was the case with all groups, brown long-eared bat was the most frequently caught species
in Kent. It is interesting to note that the fourth most commonly encountered species in Kent
(after brown long-eared bat, Natterer’s bat and soprano pipistrelle) was the
whiskered/Brandt’s/Alcathoe bat group. Prior to Kent’s involvement in this project, very few
records of these species were held and they were thought to be some of the county’s rarer
bats. The results collected during these surveys have given the group a better understanding of
the occurrence of these species.
Oxfordshire
The decision to involve Oxfordshire in the project followed the discovery of a male
Bechstein’s bat in a bat box on a woodland site in north-west Oxfordshire in 2005 (L. R
Tipping pers comm., 2007). This record suggested potential for the species to be present in
the Thames and Chiltern area, and identified the need for further investigation.
Oxfordshire had 39 squares to work with in the county, but the group reported that 19 of these
squares had no suitable woodland, with the majority not fulfilling the size criteria of 25ha or
above. Following the success of the survey approach used in 2008 in this county, this group
divided the remaining squares between two teams (a north and a south Oxfordshire team).
This had the advantage of increasing the number of sites able to be surveyed during the
season; although it did result in longer survey nights. Dividing up the available equipment
between the two sub-groups meant that only one harp trap and Autobat could be used per
woodland and therefore the two sites within a woodland were surveyed consecutively on the
same night rather than simultaneously.
Unfortunately, the surveys did not result in any new Bechstein’s bat records for Oxfordshire.
This does not mean that the species is not present in the county; rather that Oxfordshire is not
likely to be a stronghold. It is possible that some of the woodlands here are used by a small
number of male Bechstein’s bats at certain times during the year.
Oxfordshire followed a similar pattern to other groups trapping predominantly brown long-
eared bats and Natterer’s bats. This group also trapped a male serotine at one of their southern
sites. This was a rare species for the project and a new record for that woodland.
53
Somerset
The Somerset bat group surveyed woodlands in 32 squares of their county, and recorded the
highest number of individuals (178) and species (11) for any of the groups taking part. In
addition this group caught 16 Bechstein’s bats (the same as Dorset bat group) at 11 sites, 8 of
which were new female Bechstein’s bat sites. These results confirm that this county’s
woodlands are rich in bat species diversity with the group also catching other rare species
such as lesser horseshoe bat and serotine.
The majority of Bechstein’s bat records were located in the southern half of the county near to
the Dorset border. When combined with the records collected in Dorset these surveys provide
an important picture of this area and its importance as a hotspot for Bechstein’s bat.
Surrey
This group caught three males and one female Bechstein’s bat during their 2008 and 2009
surveys. During the 2009 re-survey, 19 squares were surveyed (all squares with a possible
woodland for survey in the county), and seven species were recorded in total. Common
pipistrelle was the second most frequently encountered bat (after brown long-eared bats) with
a higher number of common pipistrelles caught compared to soprano pipistrelles (2:1 ratio).
Records of female Bechstein’s bats already existed in four of Surrey’s squares (as shown in
Figure 5). As Surrey is a relatively small county the group were confident that they could
survey all the remaining squares and still have some time available. It was therefore agreed
that the group could also undertake surveys of new woodlands within squares which already
had female Bechstein’s bat records. The woodlands selected were the next best fit woodland
according to the model. The Bechstein’s bats found as part of this survey are not therefore the
first record of the species in these particular squares. They are however new records for the
woodlands that they were discovered in. Hence these records provide important additional
information about the local distribution of this species.
In terms of the organisation of surveys this group used a small selection of experienced
members. Having the same individuals present on each survey provided consistency and
ensured that the setup of equipment and the running of the survey were very efficient.
Worcestershire
Prior to the start of the Bechstein’s Bat Survey, there were no records of breeding female
Bechstein’s bats in Worcestershire. The nearest records were located in Herefordshire where a
colony is known to use a bat box scheme. It was originally suggested that surveys take place
across Herefordshire and Worcestershire, but due to available time and volunteers it was
decided to focus efforts in Worcestershire. Additionally this group had three co-ordinators, so
that the workload could be shared.
The group surveyed 17 squares in which 96 bats of 8 species were recorded. The average
catch rate for Worcestershire was 5.6 which is one of the highest catch rates seen across the
groups that took part. Of the 96 bats caught, 8 Bechstein’s bats were discovered at 4 sites,
providing new information about the species in this area, which the group and landowners are
now keen to follow up. In addition a further woodland was surveyed in square 3626 (not
included in the main project analysis) in which a male and female barbastelle were caught.

54
Appendix 4 – Example data sheet
55

56
57
Appendix 5 – Species trapping locations
Female record
Male records
Natterer’s bat distribution map
Female record
Male records
Brown long-eared bat
Female record
Male records
Natterer’s bat
58
Female record
Male records
Daubenton’s bat
Female record
Male records
Whiskered/Brandt’s/Alcathoe bat
59
Female record
Male records
Soprano pipistrelle
Common pipistrelle
Female record
Male records
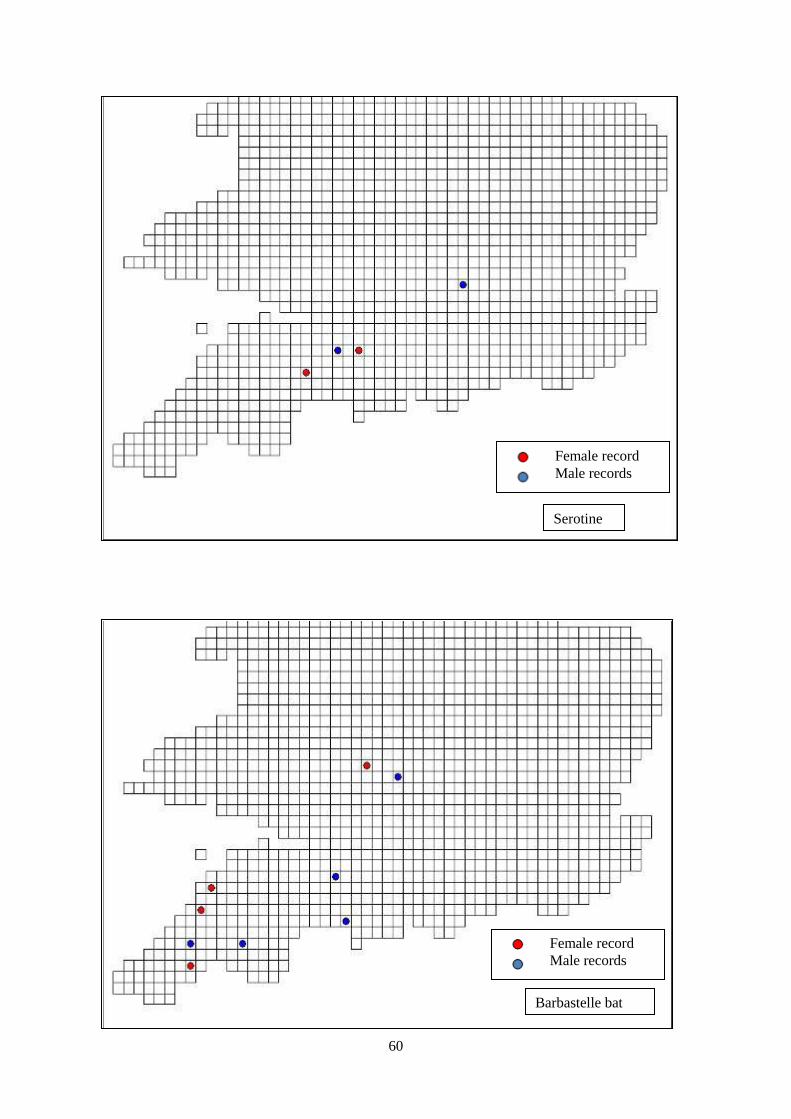
60
Female record
Male records
Serotine
Female record
Male records
Barbastelle bat
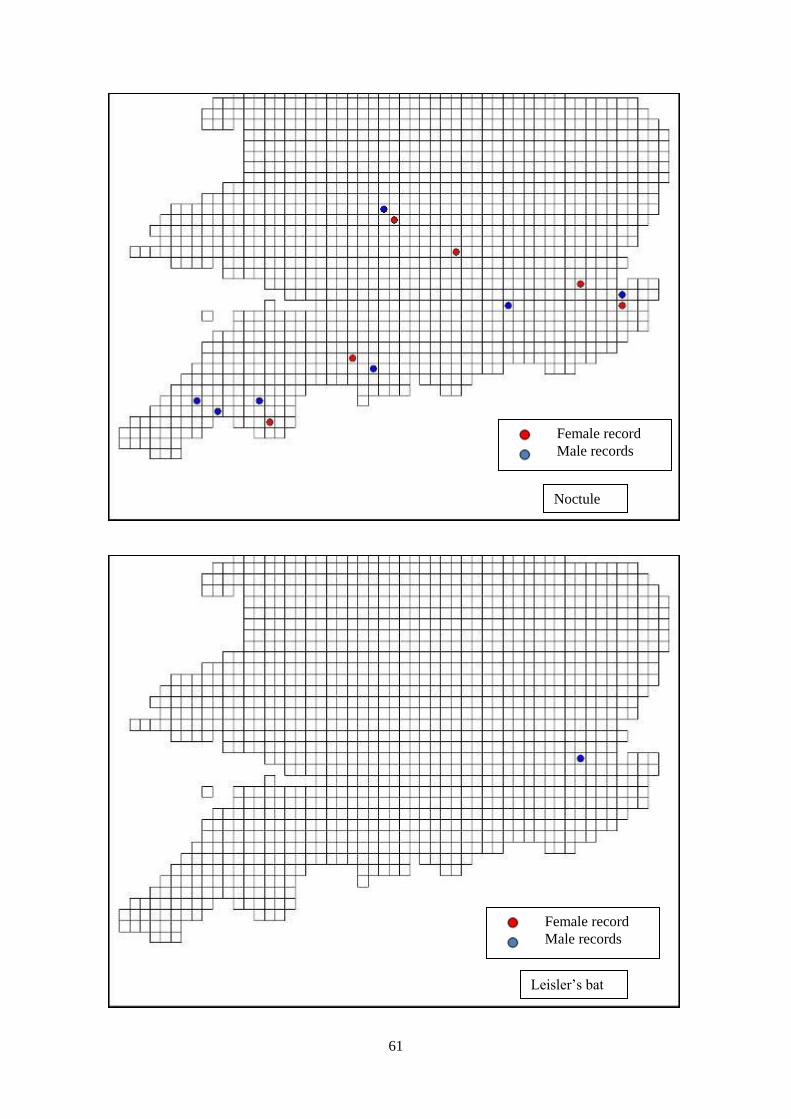
61
Female record
Male records
Noctule
Female record
Male records
Leisler’s bat
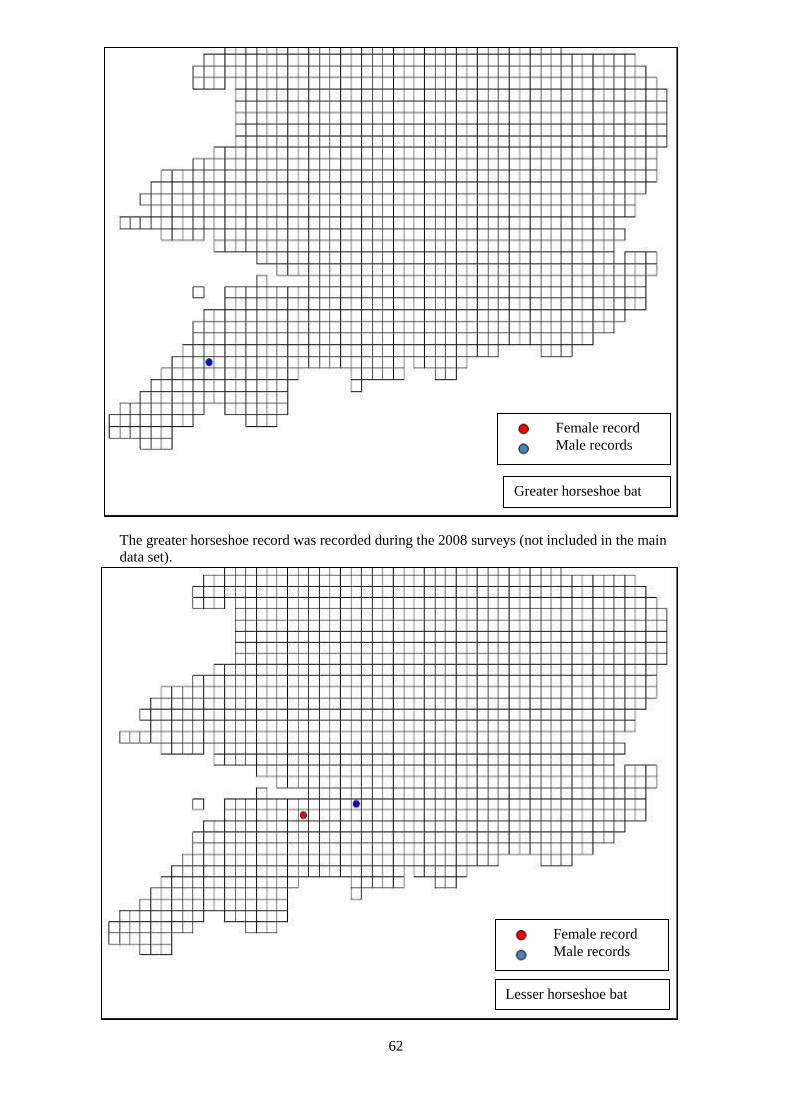
62
The greater horseshoe record was recorded during the 2008 surveys (not included in the main
data set).
Female record
Male records
Greater horseshoe bat
Lesser horseshoe bat
Female record
Male records
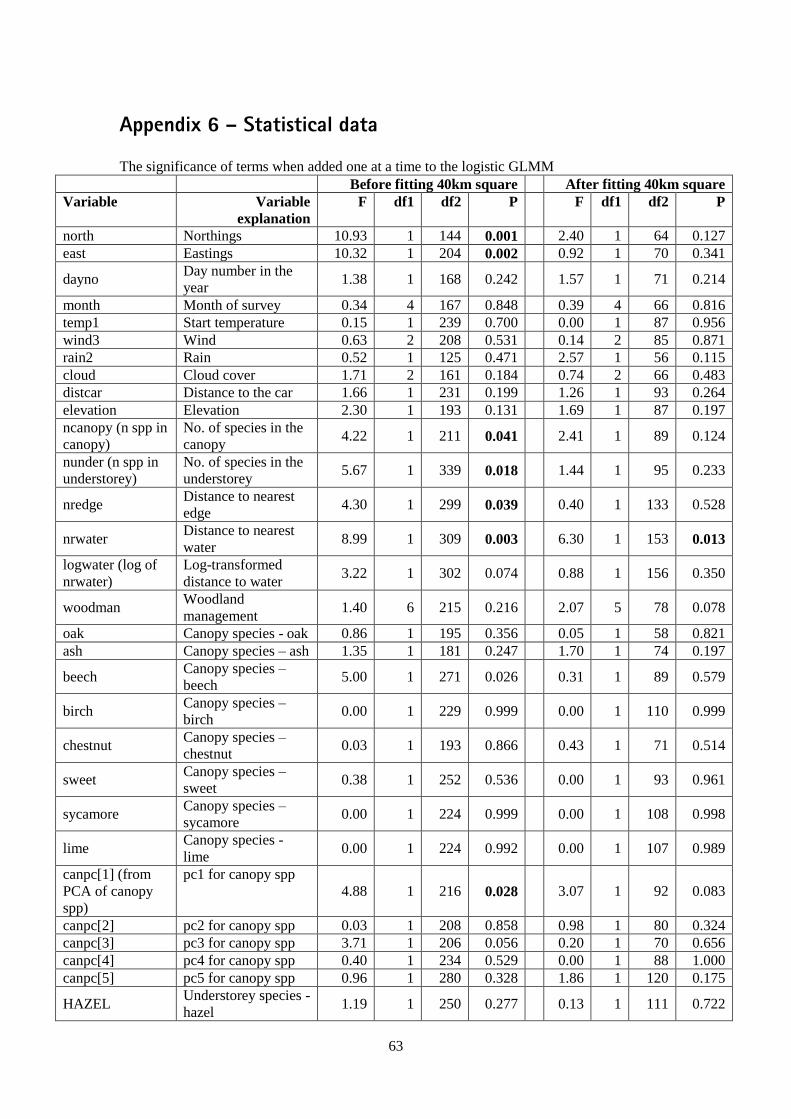
63
Appendix 6 – Statistical data
The significance of terms when added one at a time to the logistic GLMM
Before fitting 40km square After fitting 40km square
Variable Variable
explanation
F df1 df2 P F df1 df2 P
north Northings 10.93 1 144 0.001 2.40 1 64 0.127
east Eastings 10.32 1 204 0.002 0.92 1 70 0.341
dayno Day number in the
year 1.38 1 168 0.242
1.57 1 71 0.214
month Month of survey 0.34 4 167 0.848 0.39 4 66 0.816
temp1 Start temperature 0.15 1 239 0.700 0.00 1 87 0.956
wind3 Wind 0.63 2 208 0.531 0.14 2 85 0.871
rain2 Rain 0.52 1 125 0.471 2.57 1 56 0.115
cloud Cloud cover 1.71 2 161 0.184 0.74 2 66 0.483
distcar Distance to the car 1.66 1 231 0.199 1.26 1 93 0.264
elevation Elevation 2.30 1 193 0.131 1.69 1 87 0.197
ncanopy (n spp in
canopy)
No. of species in the
canopy 4.22 1 211 0.041
2.41 1 89 0.124
nunder (n spp in
understorey)
No. of species in the
understorey 5.67 1 339 0.018
1.44 1 95 0.233
nredge Distance to nearest
edge 4.30 1 299 0.039
0.40 1 133 0.528
nrwater Distance to nearest
water 8.99 1 309 0.003
6.30 1 153 0.013
logwater (log of
nrwater)
Log-transformed
distance to water 3.22 1 302 0.074
0.88 1 156 0.350
woodman Woodland
management 1.40 6 215 0.216
2.07 5 78 0.078
oak Canopy species - oak 0.86 1 195 0.356 0.05 1 58 0.821
ash Canopy species – ash 1.35 1 181 0.247 1.70 1 74 0.197
beech Canopy species –
beech 5.00 1 271 0.026
0.31 1 89 0.579
birch Canopy species –
birch 0.00 1 229 0.999
0.00 1 110 0.999
chestnut Canopy species –
chestnut 0.03 1 193 0.866
0.43 1 71 0.514
sweet Canopy species –
sweet 0.38 1 252 0.536
0.00 1 93 0.961
sycamore Canopy species –
sycamore 0.00 1 224 0.999
0.00 1 108 0.998
lime Canopy species -
lime 0.00 1 224 0.992
0.00 1 107 0.989
canpc[1] (from
PCA of canopy
spp)
pc1 for canopy spp
4.88 1 216 0.028
3.07 1 92 0.083
canpc[2] pc2 for canopy spp 0.03 1 208 0.858 0.98 1 80 0.324
canpc[3] pc3 for canopy spp 3.71 1 206 0.056 0.20 1 70 0.656
canpc[4] pc4 for canopy spp 0.40 1 234 0.529 0.00 1 88 1.000
canpc[5] pc5 for canopy spp 0.96 1 280 0.328 1.86 1 120 0.175
HAZEL Understorey species -
hazel 1.19 1 250 0.277
0.13 1 111 0.722
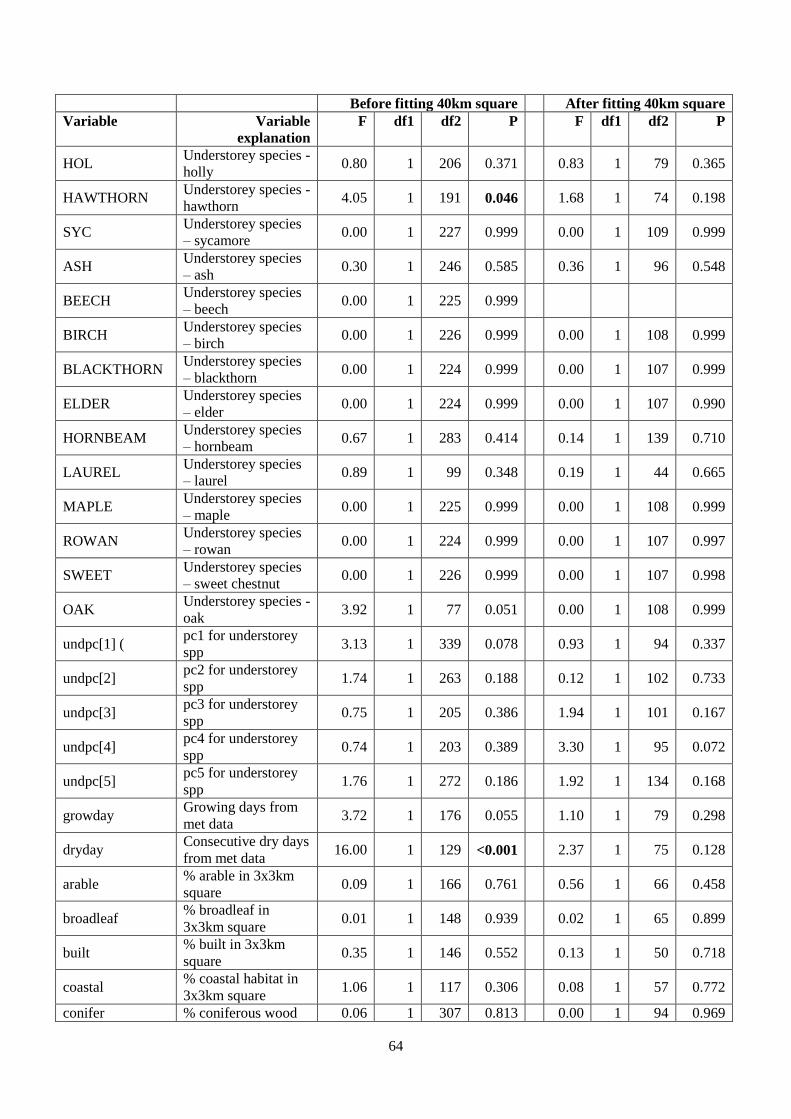
64
Before fitting 40km square After fitting 40km square
Variable Variable
explanation
F df1 df2 P F df1 df2 P
HOL Understorey species -
holly 0.80 1 206 0.371
0.83 1 79 0.365
HAWTHORN Understorey species -
hawthorn 4.05 1 191 0.046
1.68 1 74 0.198
SYC Understorey species
– sycamore 0.00 1 227 0.999
0.00 1 109 0.999
ASH Understorey species
– ash 0.30 1 246 0.585
0.36 1 96 0.548
BEECH Understorey species
– beech 0.00 1 225 0.999
BIRCH Understorey species
– birch 0.00 1 226 0.999
0.00 1 108 0.999
BLACKTHORN Understorey species
– blackthorn 0.00 1 224 0.999
0.00 1 107 0.999
ELDER Understorey species
– elder 0.00 1 224 0.999
0.00 1 107 0.990
HORNBEAM Understorey species
– hornbeam 0.67 1 283 0.414
0.14 1 139 0.710
LAUREL Understorey species
– laurel 0.89 1 99 0.348
0.19 1 44 0.665
MAPLE Understorey species
– maple 0.00 1 225 0.999
0.00 1 108 0.999
ROWAN Understorey species
– rowan 0.00 1 224 0.999
0.00 1 107 0.997
SWEET Understorey species
– sweet chestnut 0.00 1 226 0.999
0.00 1 107 0.998
OAK Understorey species -
oak 3.92 1 77 0.051
0.00 1 108 0.999
undpc[1] ( pc1 for understorey
spp 3.13 1 339 0.078
0.93 1 94 0.337
undpc[2] pc2 for understorey
spp 1.74 1 263 0.188
0.12 1 102 0.733
undpc[3] pc3 for understorey
spp 0.75 1 205 0.386
1.94 1 101 0.167
undpc[4] pc4 for understorey
spp 0.74 1 203 0.389
3.30 1 95 0.072
undpc[5] pc5 for understorey
spp 1.76 1 272 0.186
1.92 1 134 0.168
growday Growing days from
met data 3.72 1 176 0.055
1.10 1 79 0.298
dryday Consecutive dry days
from met data 16.00 1 129 <0.001
2.37 1 75 0.128
arable % arable in 3x3km
square 0.09 1 166 0.761
0.56 1 66 0.458
broadleaf % broadleaf in
3x3km square 0.01 1 148 0.939
0.02 1 65 0.899
built % built in 3x3km
square 0.35 1 146 0.552
0.13 1 50 0.718
coastal % coastal habitat in
3x3km square 1.06 1 117 0.306
0.08 1 57 0.772
conifer % coniferous wood 0.06 1 307 0.813 0.00 1 94 0.969
65
Before fitting 40km square After fitting 40km square
Variable Variable
explanation
F df1 df2 P F df1 df2 P
in 3x3km square
impgrass % improved grass in
3x3km square 0.01 1 151 0.911
0.41 1 52 0.524
openwater % open water in
3x3km square 0.00 1 178 0.992
0.33 1 70 0.566
seaunclass % sea or unclassified
in 3x3km square 0.00 1 159 0.956
0.96 1 77 0.331
seminatural % seminatural grass
in 3x3km square 1.73 1 240 0.190
0.19 1 71 0.664
upland
% bog, heath and
mountain in 3x3km
square
0.61 1 186 0.438
0.27 1 66 0.606
Notes: arable-upland is the average proportion of the habitat in a 3km square block centred on
the wood. Based on 1km resolution data from CS2000.
All models contain understory cover for the wood.
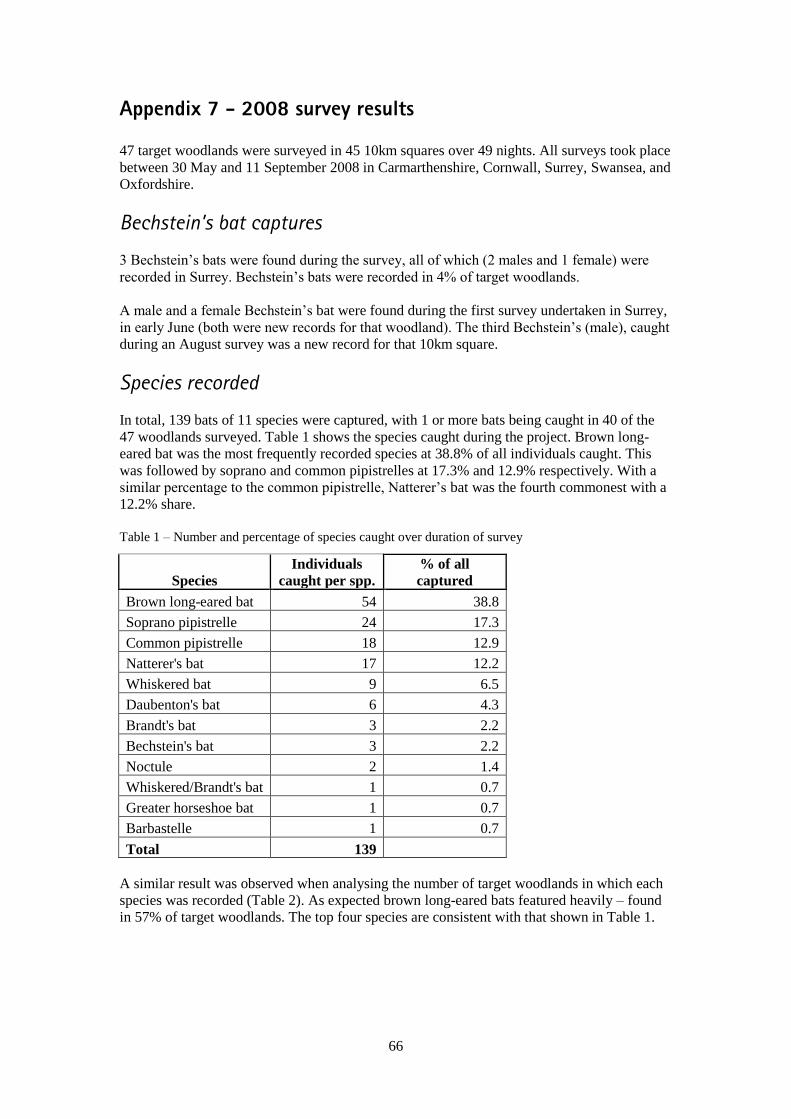
66
Appendix 7 - 2008 survey results
47 target woodlands were surveyed in 45 10km squares over 49 nights. All surveys took place
between 30 May and 11 September 2008 in Carmarthenshire, Cornwall, Surrey, Swansea, and
Oxfordshire.
Bechstein’s bat captures
3 Bechstein’s bats were found during the survey, all of which (2 males and 1 female) were
recorded in Surrey. Bechstein’s bats were recorded in 4% of target woodlands.
A male and a female Bechstein’s bat were found during the first survey undertaken in Surrey,
in early June (both were new records for that woodland). The third Bechstein’s (male), caught
during an August survey was a new record for that 10km square.
Species recorded
In total, 139 bats of 11 species were captured, with 1 or more bats being caught in 40 of the
47 woodlands surveyed. Table 1 shows the species caught during the project. Brown long-
eared bat was the most frequently recorded species at 38.8% of all individuals caught. This
was followed by soprano and common pipistrelles at 17.3% and 12.9% respectively. With a
similar percentage to the common pipistrelle, Natterer’s bat was the fourth commonest with a
12.2% share.
Table 1 – Number and percentage of species caught over duration of survey
Species
Individuals
caught per spp.
% of all
captured
Brown long-eared bat 54 38.8
Soprano pipistrelle 24 17.3
Common pipistrelle 18 12.9
Natterer's bat 17 12.2
Whiskered bat 9 6.5
Daubenton's bat 6 4.3
Brandt's bat 3 2.2
Bechstein's bat 3 2.2
Noctule 2 1.4
Whiskered/Brandt's bat 1 0.7
Greater horseshoe bat 1 0.7
Barbastelle 1 0.7
Total 139
A similar result was observed when analysing the number of target woodlands in which each
species was recorded (Table 2). As expected brown long-eared bats featured heavily – found
in 57% of target woodlands. The top four species are consistent with that shown in Table 1.
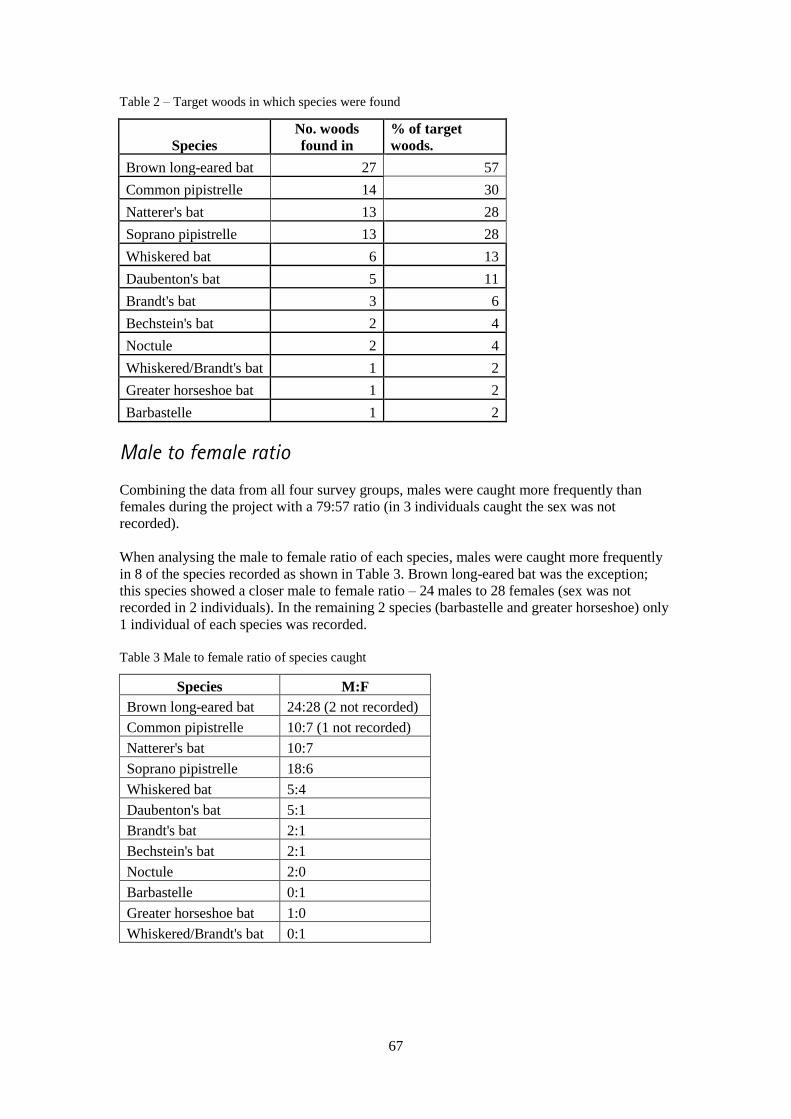
67
Table 2 – Target woods in which species were found
Species
No. woods
found in
% of target
woods.
Brown long-eared bat 27 57
Common pipistrelle 14 30
Natterer's bat 13 28
Soprano pipistrelle 13 28
Whiskered bat 6 13
Daubenton's bat 5 11
Brandt's bat 3 6
Bechstein's bat 2 4
Noctule 2 4
Whiskered/Brandt's bat 1 2
Greater horseshoe bat 1 2
Barbastelle 1 2
Male to female ratio
Combining the data from all four survey groups, males were caught more frequently than
females during the project with a 79:57 ratio (in 3 individuals caught the sex was not
recorded).
When analysing the male to female ratio of each species, males were caught more frequently
in 8 of the species recorded as shown in Table 3. Brown long-eared bat was the exception;
this species showed a closer male to female ratio – 24 males to 28 females (sex was not
recorded in 2 individuals). In the remaining 2 species (barbastelle and greater horseshoe) only
1 individual of each species was recorded.
Table 3 Male to female ratio of species caught
Species M:F
Brown long-eared bat 24:28 (2 not recorded)
Common pipistrelle 10:7 (1 not recorded)
Natterer's bat 10:7
Soprano pipistrelle 18:6
Whiskered bat 5:4
Daubenton's bat 5:1
Brandt's bat 2:1
Bechstein's bat 2:1
Noctule 2:0
Barbastelle 0:1
Greater horseshoe bat 1:0
Whiskered/Brandt's bat 0:1
68
Woodland selection
68% of woodlands surveyed matched either 3 or 4 of the criteria (as seen in figure 1). All
woodlands selected were the “best fit” woodland in a 10km square (assuming landowner
permission was granted). Data was also collected on other aspects of the woodlands such as
the proximity to water, the level of management, and environmental conditions on the survey
night, all of which may affect the results obtained to some degree.
Figure 1 – Percentage of target woodlands matching criteria
Volunteer survey effort
Table 4 provides an overview of the results obtained by each group.
Table 4 – Summary data results for 2008 groups
Area
No. squares
surveyed
Squares with
female Bechstein's No. spp. caught
No. individuals
caught
Cornwall 13 0 10 51
Oxfordshire 12 0 6 29
Surrey 14 1 7 49
S. Wales 6 0 5 10
Bat Conservation TrustThe Bat Conservation Trust is a registered charity, number Englandand Wales 1012361, Scotland SC040116. Company limited byguarantee number 2712823.
The Bat Conservation Trust
Bat Helpline: 0845 1300 228 www.bats.org.ukQuadrant House, 250 Kennington Lane, London SE11 5RD.