Embed Size (px)
Citation preview

BEFORE THE PUBLIC UTILITIES COMMISSION
OF THE STATE OF CALIFORNIA
Application of Southern California Edison Company (U 338 E) for Approval of Demand Response Programs, Goals and Budgets for 2009-2011
Application 08-06-001 (Filed June 2, 2008)
Application of San Diego Gas & Electric Company (U 902 M) for Approval of Demand Response Programs and Budgets for Years 2009 through 2011
Application 08-06-002 (Filed June 2, 2008)
Application of Pacific Gas and Electric Company For Approval of 2009-2011 Demand Response Programs and Budgets (U39E)
Application 08-06-003 (Filed June 2, 2008)
REPORT OF SAN DIEGO GAS & ELECTRIC COMPANY (U 902 M) ON INTERRUPTIBLE LOAD AND DEMAND RESPONSE PROGRAMS FOR
JANUARY 2010
STEVEN D. PATRICK Attorney for:
SAN DIEGO GAS & ELECTRIC COMPANY 555 W. Fifth Street, Suite 1400 Los Angeles, CA 90013-1011 Telephone: (213) 244-2954 Facsimile: (213) 629-9620
E-mail: [email protected] Dated: February 22, 2010

1
BEFORE THE PUBLIC UTILITIES COMMISSION
OF THE STATE OF CALIFORNIA
Application of Southern California Edison Company (U 338 E) for Approval of Demand Response Programs, Goals and Budgets for 2009-2011
Application 08-06-001 (Filed June 2, 2008)
Application of San Diego Gas & Electric Company (U 902 M) for Approval of Demand Response Programs and Budgets for Years 2009 through 2011
Application 08-06-002 (Filed June 2, 2008)
Application of Pacific Gas and Electric Company For Approval of 2009-2011 Demand Response Programs and Budgets (U39E)
Application 08-06-003 (Filed June 2, 2008)
REPORT OF SAN DIEGO GAS & ELECTRIC COMPANY (U 902 M) ON INTERRUPTIBLE LOAD AND DEMAND RESPONSE PROGRAMS FOR
JANUARY 2010
SDG&E is submitting their demand response data for December 2009 and January 2010
in accordance with the Energy Division-approved monthly templates.1 An extension to submit
the monthly reports was granted by Mr. Paul Clanon, Executive Director, on January 20, 2010 in
which to comply with Decision 09-08-027, Ordering Paragraph 39. Per the decision, the
monthly report is being provided to Energy Division and sent to parties of service list in A.08-
06-001 et al. Additionally, SDG&E is posting their monthly report on a publicly available web
site. The URL for the website is: http://www.sdge.com/regulatory/A08-06-002.shtml
1 Ms. Dorris Lam sent an email note with the approved monthly templates on February 17, 2010. These reports are prepared expressly under the direction of the Energy Division and may not be consistent with DR information provided to the CAISO.

2
Respectfully submitted By: /s/ Steven D. Patrick
Steven D. Patrick Attorney for:
SAN DIEGO GAS & ELECTRIC COMPANY 555 W. Fifth Street, Suite 1400 Los Angeles, CA 90013-1011 Telephone: (213) 244-2954 Facsimile: (213) 629-9620 E-mail: [email protected] Dated: February 22, 2010

ATTACHMENT

SDGE Interruptible and Price Responsive Programs Subscription Statistics - Enrolled MW
2009
ProgramsService
AccountsEnrolled
MWsEstimated
MWsService
AccountsEnrolled
MWsEstimated
MWsService
AccountsEnrolled
MWs Estimated MWsService
AccountsEnrolled
MWsEstimated
MWsService
AccountsEnrolled
MWsEstimated
MWsService
AccountsEnrolled
MWsEstimated
MWsEligible Accounts as of
Jan 1, 2010Interruptible ReliabilityBIP - 3 hour optionBIP - 30 minute optionCPP-EOBMCSLRP Sub-Total Interruptible 0 0.0 0 0.0 0Price ResponsiveCPP-DSummer Saver ResidentialSummer Saver CommercialCBP - Day-Ahead CBP - Day-Of PLPDR Contracts Sub-Total Price Response 0 0.0 0 0.0 0Total All Programs 0 0.0 0 0.0 0
ProgramsService
AccountsEnrolled
MWsEstimated
MWsService
AccountsEnrolled
MWsEstimated
MWsService
AccountsEnrolled
MWs Enrolled MWsService
AccountsEnrolled
MWsEstimated
MWsService
AccountsEnrolled
MWsEstimated
MWsService
AccountsEnrolled
MWsEstimated
MWsEligible Accounts as of
Jan 1, 2010Interruptible/ReliabilityBIP - 3 hour option 1 0 0.6BIP - 30 minute option 18 6 10.3CPP-E 10 2 2.3OBMC 0 0 0.0SLRP 0 0 0.0Subtotal Interruptible 29 9 13.2Price ResponsiveCPP-D 1,583 35 35Summer Saver Residential 35,286 13 0Summer Saver Commercial 5,677 10 0CBP - Day-Ahead 103 11 0CBP - Day-Of 278 18 0PLP 15 1 1DR Contracts 0 25 0Sub-Total Price Responsive 42,936 113 35.8Sub-Total All Programs 42,965 121 49.0
April May JuneJanuary February March
November DecemberJuly August September October
Dec2009 PUC Rpt NEW.xls 2/22/2010

SDGEAverage Load Impact kW / Customer
2009Program Eligibility and Average Load Impacts
Program January February March April May June July August September October November December Eligibility CriteriaBIP - 3 hour option 571 4,514 All C & I customers > 100kWBIP - 30 minute option 571 4,514 All C & I customers > 100kWCPP-E 230 2,232 All non-residential customers with interval meterOBMC n/a 32,439 All C&I customersSLRP n/a 4,514 All C & I customers > 100kWCPP-D 22 2,232 All non-residential customers with interval meterSummer Saver Residential 50% 0.3 428,747 Residential customers with ACSummer Saver Residential 100% 0.8 428,747 Residential customers with ACSummer Saver Commercial 30% 0.7 139,478 Commercial Customers < 100kwSummer Saver Commercial 50% 2.6 139,478 Commercial Customers < 100kwCBP - Day-Ahead 88 24,336 Non-residential customers > 20kwCBP - Day-Of 42 24,336 Non-residential customers > 20kwPLP 76 24,336 Non-residential customers > 20kwDR Contracts n/a 24,336 Non-residential customers > 20kw
Average Load Impact kW / CustomerEligible
Accounts as of Jan 1, 2010
Dec2009 PUC Rpt NEW.xls 2/22/2010

SDGE Program Subscription Statistics 2009
2009
Price ResponsiveEnrolled TA
MWsEnrolled Auto
DR MWsEnrolled TI
MWs
Total Enrolled
Technology MWs
Enrolled TA MWs
Enrolled Auto DR
MWsEnrolled TI
MWs
Total Enrolled
Technology MWs
Enrolled TA MWs
Enrolled Auto DR
MWsEnrolled TI
MWs
Total Enrolled
Technology MWs
Enrolled TA MWs
Enrolled Auto DR
MWsEnrolled TI
MWs
Total Enrolled
Technology MWs
Enrolled TA MWs
Enrolled Auto DR
MWsEnrolled TI
MWs
Total Enrolled
Technology MWs
Enrolled TA MWs
Enrolled Auto DR
MWsEnrolled TI
MWs
Sub-TotalInterruptible/Reliability
Sub-TotalGeneral Program
Sub-TotalTotal of all Programs
Price ResponsiveEnrolled TA
MWsEnrolled Auto
DR MWsEnrolled TI
MWs
Total Enrolled
Technology MWs
Enrolled TA MWs
Enrolled Auto DR
MWsEnrolled TI
MWs
Total Enrolled
Technology MWs
Enrolled TA MWs
Enrolled Auto DR
MWsEnrolled TI
MWs
Total Enrolled
Technology MWs
Enrolled TA MWs
Enrolled Auto DR
MWsEnrolled TI
MWs
Total Enrolled
Technology MWs
Enrolled TA MWs
Enrolled Auto DR
MWsEnrolled TI
MWs
Total Enrolled
Technology MWs
Enrolled TA MWs
Enrolled Auto DR
MWsEnrolled TI
MWsCPP-D 44.4 Summer Saver ResidentialSummer Saver CommercialCBP - Day-Ahead 1.5 CBP - Day-Of PLP 4.3 DR ContractsSub-Total 0 50 0.00
Interruptible/ReliabilityBIP - 3 hour optionBIP - 30 minute optionCPP-EOBMCSLRPSub-Total - - -
General ProgramTA (Not enrolled) 167.29
Sub-Total 167.29 0.00 0.00Total of all Programs 167.29 50.19 0
Directions:Program Categories Should be redefined to be "Price responsive" and "interruptible/Reliability"General Program Categories Represents participate who is in the TA stage, but has not select a DR programEnrolled MWs Represents the sum of MWs associated with the service accounts in the TA/TI programs.Enrolled TA MWs Represents the subset of identified MWs from completed TA.Enrolled Auto DR MWs Represents the subset of verified MWs that participated in Auto DR.Enrolled TI MWs Represents the subset of enrolled program MWs that participated in TI but not Auto-DR.
DecemberJuly August September October November
May JuneJanuary February March April
Dec2009 PUC Rpt NEW.xls

SDGE Demand Response Programs and ActivitiesIncremental Cost
2009 Funding
Year-to-Date Program Expenditures
Cost Item January February March April May June July August September October November December
Year-to Date 2009
Expenditures
Program-to-Date Total
Expenditures 2009
3-Year Funding
Fundshift Adjustments (a)
Percent Funding
Category 1: Emergency ProgramsBase Interruptible Program (BIP) $39,612 $43,688 $106,074 $47,367 $45,623 $51,471 $49,930 $56,126 $52,383 $53,614 $49,744 $49,292 $644,924 $644,924 $1,475,423 43.7%Emergency Critical Peak Pricing (CPP-E) $4,475 $10,837 $12,470 $11,117 $10,827 $10,529 $10,986 $10,815 $7,097 $9,727 $5,563 $7,927 $112,370 $112,370 $328,541 34.2%Summer Saver Program $0 $0 $0 $0 $0 $0 $0 $0 $0 $0 $0 $0 $0 $0 $0 0.0%Optional Binding Mandatory Curtailment (OBMC) $0 $0 $0 $0 $0 $0 $0 $0 $0 $0 $0 $0 $0 $0 $0 0.0%Scheduled Load Reduction Program (SLRP) $0 $0 $0 $0 $0 $0 $0 $0 $0 $0 $0 $0 $0 $0 $0 0.0%
Budget Category 1 Total $0 $44,087 $54,525 $118,544 $58,484 $56,450 $62,000 $60,916 $66,941 $59,480 $63,341 $55,307 $57,219 $757,294 $757,294 $1,803,964 42.0%
Category 2: Price Responsive ProgramsDefault Critical Peak Pricing (CPP-D) $0 $0 $0 $0 $0 $0 $0 $0 $0 $0 $0 $0 $0 $0 $0 0.0%Capacity Bidding Program (CBP) $8,999 $10,365 $35,914 $34,502 $74,085 $158,216 $159,968 $110,115 $88,177 $364,585 $67,666 $248,406 $1,360,998 $1,360,998 $6,426,173 21.2%Peak Day Credit $20,525 $20,096 $16,294 $10,118 $11,795 $12,010 $13,020 $15,865 $11,896 $15,065 $12,294 $7,385 $166,363 $166,363 $328,000 50.7%Demand Bidding Program $13,606 $16,733 $14,480 $10,244 $8,557 $6,909 $8,226 $8,043 $6,374 $13,434 $3,514 $3,926 $114,046 $114,046 $492,000 23.2%
Budget Category 2 Total $0 $43,130 $47,194 $66,688 $54,864 $94,437 $177,135 $181,214 $134,023 $106,447 $393,084 $83,474 $259,717 $1,641,407 $1,641,407 $7,246,173 22.7%
Category 3: DR Aggregator Managed Programs$0 $0 $0 $0 $0 $0 $0 $0 $0 $0 $0 $0 $0 $0 $0 0.0%
Budget Category 3 Total $0 $0 $0 $0 $0 $0 $0 $0 $0 $0 $0 $0 $0 $0 $0 $0 0.0%
Category 4: DR Enabled ProgramsTechnical Assistance (TA) ($706,772) $132,511 $339,039 $108,943 $159,025 $183,288 $183,819 $144,812 $167,720 $131,678 $201,655 $91,793 $1,137,511 $1,137,511 $10,011,326 11.4%Technical Incentives (TI) $93,384 $38,996 $79,994 $48,210 $81,914 $131,969 $64,094 $204,962 $117,267 $50,465 $109,780 $797,638 $1,818,673 $1,818,673 $12,662,841 14.4%Emerging Technologies (ET) ($59,612) $15,968 $17,430 $61,792 $16,447 $19,222 $44,600 $23,782 $12,473 $7,108 $12,250 ($22,734) $148,726 $148,726 $2,142,495 6.9%Permanent Load Shifting $0 $0 $0 $0 $0 $0 $0 $0 $29,156 $6,608 $3,255 $231,460 $270,479 $270,479 $308,371 87.7%
Budget Category 4 Total $0 ($673,000) $187,475 $436,463 $218,945 $257,386 $334,479 $292,513 $373,556 $326,616 $195,859 $326,940 $1,098,157 $3,375,389 $3,375,389 $25,125,033 13.4%
Category 5: Pilots & SmartConnect Enabled ProgramsParticipating Load Pilot $0 $0 $0 $0 $0 $0 $0 $30,349 $5,751 $5,302 $4,713 $626,620 $672,735 $672,735 $3,756,000 17.9%Residential Automated Controls Technology Program $0 $0 $0 $0 $0 $0 $0 $0 $1,127 $6,550 $16,259 ($2,355) $21,581 $21,581 $1,689,671 1.3%
Budget Category 5 Total $0 $0 $0 $0 $0 $0 $0 $0 $30,349 $6,878 $11,852 $20,972 $624,265 $694,316 $694,316 $5,445,671 12.7%
Category 6: Statewide Marketing ProgramFlex Alert Network (FAN) $84,454 $0 $9,963 $29,444 $0 $0 $0 $0 $0 $0 $0 $0 $123,861 $123,861 $1,253,886 $0
Budget Category 6 Total $0 $84,454 $0 $9,963 $29,444 $0 $0 $0 $0 $0 $0 $0 $0 $123,861 $123,861 $1,253,886 $0
Category 7: Measurement & EvaluationMeasurement & Evaluation (M&E) $70,453 $50,724 $145,140 $441,817 $90,268 $274,326 $31,505 ($281,494) $92,832 $37,930 $68,500 $35,419 $1,057,420 $1,057,420 $4,105,832 25.8%
Budget Category 7 Total $0 $70,453 $50,724 $145,140 $441,817 $90,268 $274,326 $31,505 ($281,494) $92,832 $37,930 $68,500 $35,419 $1,057,420 $1,057,420 $4,105,832 25.8%
Category 8: System Support Activities$0 $0 $0 $0 $0 $0 $0 $0 $0 $0 $0 $0 $0 $0 $0 $0 0.0%
Budget Category 8 Total $0 $0 $0 $0 $0 $0 $0 $0 $0 $0 $0 $0 $0 $0 $0 $0 0.0%
Category 9: Marketing Education & OutreachCustomer Education, Awareness & Outreach $67,954 $78,985 $50,993 $77,194 $86,228 $100,596 $77,215 $81,032 $214,157 $102,949 $110,020 $44,341 $1,091,664 $1,091,664 $6,029,209 18.1%
Budget Category 9 Total $0 $67,954 $78,985 $50,993 $77,194 $86,228 $100,596 $77,215 $81,032 $214,157 $102,949 $110,020 $44,341 $1,091,664 $1,091,664 $6,029,209 18.1%
Category 10: Integrated Programs$0 $0 $0 $0 $0 $0 $0 $0 $0 $0 $0 $0 $0 $0 $0 $0 0.0%
Budget Category 10 Total $0 $0 $0 $0 $0 $0 $0 $0 $0 $0 $0 $0 $0 $0 $0 $0 0.0%
Other Programs
Other Costs Total $0 $0 $0 $0 $0 $0 $0 $0 $0 $0 $0 $0 $0 $0 $0 $0 0.0%
Total Incremental Cost $0 ($362,922) $418,903 $827,791 $880,748 $584,769 $948,536 $643,363 $404,407 $806,410 $805,015 $665,213 $2,119,118 $8,741,351 $8,741,351 $51,009,768 17.1%
(a) See "Fund Shift Log" for explanations.
2009 Expenditures
Dec2009 PUC Rpt NEW.xls 2/22/2010

SDGEFUND SHIFTING
2009
FUND SHIFTING DOCUMENTATION PER DECISION 09-08-027 ORDERING PARAGRAPH 35
OP 35: The utilities may shift up to 50% of a program funds to another program's funds to another program within the same budget category.The utilities shall document the amount of and reason for each shift in their monthly demand response reports.
Program Category Fund Shift Programs Impacted Date Rationale for Fundshift
Total $0
Notes: Provide concise rationale for the fund shift in colum "Rationale for Fund Shift"

SDGE Interruptible and Price Responsive Programs 2009 Event Summary
Year-to-Date Event Summary
Program Category Event No. Date Event Trigger(1)Load Reduction
kW (2) (3) Event Beginning:End
Program Tolled Hours (Annual)
(4)Category 1: Emergency Programs
Category 2: Price Responsive Programs
Category 3: DR Aggregator Managed Programs
Category 5: Pilots & SmartConnect Enabled Programs
Participating Load Pilot 20 12/02/10APX test event triggered from APX Operations Center (no CAISO TBD 2:00 36:40
21 12/03/10CAISO Scheduled Event (Exceptional Dispatch) TBD 2:00 38:40
22 12/07/10 CAISO Event (Contingency Dispatch) TBD 2:00 40:40
23 12/11/10APX test event triggered from APX Operations Center (no CAISO TBD 2:00 42:40
24 12/15/10APX test event triggered from APX Operations Center (no CAISO TBD 2:00 44:40
Dec2009 PUC Rpt NEW.xls 2/22/2010

San Diego Gas ElectricDemand Response Programs
Total Cost and AMDRMA Accounts BalanceDecember 2009
$000
Annual Total Cost January February March April May June July August September October November DecemberYear-to-Date
Cost 2009 Budget % of Budget
Administrative (O&M)Demand Bidding Program $13.6 $16.7 $14.5 $10.2 $8.6 $6.9 $8.2 $8.0 $6.4 $13.4 $3.5 $3.9 $114.0 $0.0 n/aCapacity Bidding Program $13.8 $10.4 $35.9 $34.5 $74.1 $116.7 $57.4 $81.6 $9.9 $8.2 $67.7 $53.6 $563.7 $0.0 n/aPeak Day Credit (20/20) Program $20.5 $20.2 $16.3 $10.1 $11.8 $12.0 $13.0 $15.9 $11.9 $15.1 $12.3 $7.4 $166.5 $0.0 n/aVoluntary Critical Peak Pricing $21.8 $27.4 $25.5 $14.2 $16.7 $16.1 $16.7 ($63.4) $0.3 $0.0 $0.2 $0.0 $75.3 $0.0 n/aBase Interruptible Program $5.2 $5.7 $10.1 $12.6 $9.1 $12.7 $10.5 $11.8 $7.4 $9.3 $7.5 $7.8 $109.7 $0.0 n/aCPP-Emergency $4.5 $10.8 $12.5 $11.1 $10.8 $10.5 $11.0 $10.8 $7.1 $9.7 $5.6 $7.9 $112.4 $0.0 n/aRes Smart Thermostat ($24.2) $0.0 $0.0 $0.0 $0.0 $0.0 $0.0 $0.0 $0.0 $0.0 $0.0 $0.0 ($24.2) $0.0 n/aIn-Home Display ($21.1) $0.0 $0.6 $0.0 $0.2 $0.0 $0.0 $0.0 $0.0 $0.0 $0.0 $0.0 ($20.3) $0.0 n/aTechnology Incentives $20.5 $30.6 $39.1 $12.2 $23.4 $19.5 $19.5 $23.2 $15.9 $22.3 $16.4 $7.4 $250.0 $0.0 n/aTechnology Assistance (1) ($88.2) $42.7 $151.1 $21.5 $33.8 $28.2 $28.2 $28.1 $19.1 $26.5 $23.2 $12.1 $326.4 $0.0 n/aFlex Your Power Now! $84.5 $0.0 $10.0 $29.4 $0.0 $0.0 $0.0 $0.0 $0.0 $0.0 $0.0 $0.0 $123.9 $0.0 n/aCustomer Education, Awareness & Outreach (1) $86.2 $124.1 $70.4 $99.2 $121.7 $260.0 $240.2 $113.0 $218.3 $103.6 $110.8 $42.8 $1,590.3 $0.0 n/aEmerging Markets/Technologies ($59.6) $16.0 $17.4 $61.8 $16.4 $19.2 $44.6 $20.7 $15.6 $7.1 $12.3 ($22.7) $148.7 $0.0 n/aCommunity Outreach $9.4 $10.2 $14.2 $14.9 $12.2 $15.9 $13.2 $12.5 $5.5 $5.6 $7.0 ($7.7) $112.8 $0.0 n/aCircuit Savers $1.7 $2.1 ($23.8) $3.1 ($4.4) ($0.5) $0.7 $2.2 ($2.9) $0.0 $0.0 $0.0 ($21.9) $0.0 n/aCelerity ** $1.8 $0.6 $1.4 $1.4 ($0.2) $1.6 $1.4 ($7.4) $0.1 $0.0 $0.1 $0.1 $0.9 $0.0 n/aSummer Saver ** $57.9 $32.5 $783.6 $30.0 $28.7 $1,147.2 $23.2 $24.3 $1,235.9 $28.6 $20.1 $16.3 $3,428.5 $0.0 n/aPermanent Load Shifting (1) ($81.3) $171.8 $33.3 ($22.0) $4.4 $2.8 $4.1 $680.9 $29.2 $6.6 $3.3 $231.5 $1,064.4 $0.0 n/aPLP $0.0 $0.0 $0.0 $0.0 $0.0 $0.0 $0.0 $30.3 $5.8 $5.3 $4.7 $626.6 $672.7 $0.0 n/aRACT $0.0 $0.0 $0.0 $0.0 $0.0 $0.0 $0.0 $0.0 $1.1 $6.6 $16.3 ($2.4) $21.6 $0.0 n/aInformation Technology ($12.7) $37.3 $373.9 $46.2 $174.8 $279.7 $70.4 $224.7 $206.6 $127.7 $166.5 $466.7 $2,161.8 $0.0 n/aGeneral Administration $67.9 $76.3 $120.5 $58.2 $50.6 $54.4 $57.5 $53.3 $0.0 $0.0 $0.0 $0.0 $538.7 $0.0 n/a Total Administrative (O&M) $122.1 $635.5 $1,706.4 $448.8 $592.8 $2,003.1 $619.7 $1,270.4 $1,793.1 $395.6 $477.3 $1,451.4 $11,516.1 $0.0 n/a
Capital Demand Bidding Program $0.0 $0.0 $0.0 $0.0 $0.0 $0.0 $0.0 $0.0 $0.0 $0.0 $0.0 $0.0 $0.0 $0.0 n/aRACT $0.0 $0.0 $0.0 $0.0 $0.0 $0.0 $0.0 $0.0 $0.0 $0.0 $0.0 $0.0 $0.0 $0.0 n/aC&I Peak Day Credit (20/20 ) $0.0 $0.0 $0.0 $0.0 $0.0 $0.0 $0.0 $0.0 $0.0 $0.0 $0.0 $0.0 $0.0 $0.0 n/aBase Interruptible Program $0.0 $0.0 $0.0 $0.0 $0.0 $0.0 $0.0 $0.0 $0.0 $0.0 $0.0 $0.0 $0.0 $0.0 n/aCPP-Emergency $0.0 $0.0 $0.0 $0.0 $0.0 $0.0 $0.0 $0.0 $0.0 $0.0 $0.0 $0.0 $0.0 $0.0 n/aEmerging Markets $0.0 $0.0 $0.0 $0.0 $0.0 $0.0 $0.0 $3.1 ($3.1) $0.0 $0.0 $0.0 $0.0 $0.0 n/a Total Capital $0.0 $0.0 $0.0 $0.0 $0.0 $0.0 $0.0 $3.1 ($3.1) $0.0 $0.0 $0.0 $0.0 $0.0 n/a
Measurement and Evaluation Summer Saver $9.5 $0.2 $0.1 $0.0 $0.0 $0.0 $0.0 $0.0 $0.0 $0.0 $0.0 $0.0 $9.8 $0.0 n/aGeneral Administration (1) $70.5 $50.7 $145.1 $441.8 $90.3 $274.3 $31.5 ($281.5) $92.8 $37.9 $68.5 $35.4 $1,057.4 $0.0 n/a
Total M&E $80.0 $50.9 $145.3 $441.8 $90.3 $274.3 $31.5 ($281.5) $92.8 $37.9 $68.5 $35.4 $1,067.2 $0.0 n/a
Customer IncentivesDemand Bidding Program (1) $0.0 $0.0 $0.0 $0.0 $0.0 $0.0 $0.0 $0.0 $0.0 $0.0 $0.0 $0.0 $0.0 $0.0 n/aC&I Peak Day Credit (20/20) Program (1) $0.0 ($0.1) $0.0 $0.0 $0.0 $0.0 $0.0 $0.0 $0.0 $0.0 $0.0 $0.0 ($0.1) $0.0 n/aCapacity Bidding Program ($4.8) $0.0 $0.0 $0.0 $0.0 $41.5 $102.6 $28.5 $78.3 $356.4 $0.0 $194.8 $797.3 $0.0 n/aBase Interruptible Program $34.4 $38.0 $95.9 $34.7 $36.5 $38.8 $39.5 $44.3 $44.9 $44.3 $42.3 $41.5 $535.2 $0.0 n/aIn-Home Display $0.0 $0.0 $0.0 $0.0 $0.0 $0.0 $0.0 $0.0 $0.0 $0.0 $0.0 $0.0 $0.0 $0.0 n/aRes Smart Thermostat $0.0 ($0.1) $0.0 $0.0 $0.0 $0.0 $0.0 $0.0 $0.0 $0.0 $0.0 $0.0 ($0.1) $0.0 n/aTechnology Incentives $72.9 $8.4 $40.9 $36.0 $58.5 $112.4 $44.6 $181.9 $101.8 $29.2 $93.4 $790.2 $1,570.2 $0.0 n/aTechnology Assistance (1) ($618.6) $89.8 $187.9 $87.5 $125.2 $155.1 $155.6 $116.7 $148.2 $104.2 $178.5 $79.7 $809.6 $0.0 n/aCelerity $0.0 $0.0 $0.0 $0.0 $0.0 $0.0 $0.0 $0.0 $0.0 $0.0 $0.0 $0.0 $0.0 $0.0 n/aSummer Saver $1.4 $10.8 $0.1 $0.0 $1.7 $0.0 $0.0 $0.2 $0.0 $0.1 $3,558.7 ($112.3) $3,460.7 $0.0 n/a
Total Customer Incentives ($514.7) $146.8 $324.9 $158.2 $221.9 $347.8 $342.3 $371.6 $373.3 $534.2 $3,872.9 $993.9 $7,172.8 $0.0 n/a
Total ($312.6) $833.2 $2,176.6 $1,048.8 $904.9 $2,625.2 $993.4 $1,363.6 $2,256.0 $967.7 $4,418.6 $2,480.7 $19,756.2 $0.0 n/a
AMDRMA Account End of Month Balance for WG2 (2) ($679.0) 806 2,147 1,023 877 2,598 963 1,343 2,271 979 4,526 2,493 $19,348.0** Budgeted under a different proceeding(1) Totals adjusted for overaccruals in December 2008 ($354.4).(2) February and March were corrected from prior reports. YTD total was used instead of the Monthly total.
Dec2009 PUC Rpt NEW.xls 2/22/2010

SDGE Interruptible Programs and Rotating Outage ActivitiesTotal Cost and Memorandum Account December 2009
$000
Annual Total Cost January February March April May June July August September October November DecemberYear-to-Date Total Cost
Programs in General Rate CaseAdministrative (O&M)
AL-TOU-CP $0.0 $0.0 $0.0 $0.0 $0.0 $0.0 $0.0 $0.0 $0.0 $0.0 $0.0 $0.0 $0.0BIP $0.0 $0.0 $0.0 $0.0 $0.0 $0.0 $0.0 $0.0 $0.0 $0.0 $0.0 $0.0 $0.0SLRP $0.0 $0.0 $0.0 $0.0 $0.0 $0.0 $0.0 $0.0 $0.0 $0.0 $0.0 $0.0 $0.0Peak Generation (RBRP) $4.9 $3.0 $4.1 $4.2 $1.6 $4.3 $4.1 ($9.7) $1.7 $1.8 $1.8 $1.6 $23.5OBMC $0.0 $0.0 $0.0 $0.0 $0.0 $0.0 $0.0 $0.0 $0.0 $0.0 $0.0 $0.0 $0.0 Total Administrative (O&M) $4.9 $3.0 $4.1 $4.2 $1.6 $4.3 $4.1 ($9.7) $1.7 $1.8 $1.8 $1.6 $23.5
CapitalPeak Generation (RBRP) (1) $0.0 $0.0 $0.0 $0.0 $0.0 $0.0 $0.0 $0.0 $0.0 $0.0 $0.0 $0.0 $0.0 Total Capital $0.0 $0.0 $0.0 $0.0 $0.0 $0.0 $0.0 $0.0 $0.0 $0.0 $0.0 $0.0 $0.0
Measurement and Evaluation Peak Generation (RBRP) $0.0 $0.0 $0.0 $0.0 $0.0 $0.0 $0.0 $0.0 $0.0 $0.0 $0.0 $0.0 $0.0
Total M&E $0.0 $0.0 $0.0 $0.0 $0.0 $0.0 $0.0 $0.0 $0.0 $0.0 $0.0 $0.0 $0.0
Customer IncentivesAL-TOU-CP (2) $0.0 $0.0 $0.0 $0.0 $0.0 $0.0 $0.0 $0.0 $0.0 $0.0 $0.0 $0.0 $0.0BIP $0.0 $0.0 $0.0 $0.0 $0.0 $0.0 $0.0 $0.0 $0.0 $0.0 $0.0 $0.0 $0.0SLRP $0.0 $0.0 $0.0 $0.0 $0.0 $0.0 $0.0 $0.0 $0.0 $0.0 $0.0 $0.0 $0.0Peak Generation (RBRP) $0.0 $0.0 $0.0 $0.0 $0.0 $0.0 $0.0 $0.0 $0.0 $0.0 $0.0 $0.0 $0.0
Total Customer Incentives $0.0 $0.0 $0.0 $0.0 $0.0 $0.0 $0.0 $0.0 $0.0 $0.0 $0.0 $0.0 $0.0
Revenue from Penalties $0.0 $0.0 $0.0 $0.0 $0.0 $0.0 $0.0 $0.0 $0.0 $0.0 $0.0 $0.0 $0.0
Total GRC Program Costs $4.9 $3.0 $4.1 $4.2 $1.6 $4.3 $4.1 ($9.7) $1.7 $1.8 $1.8 $1.6 $23.5
(1) Capital costs for meters provided free to customers and charged to the programs
Dec2009 PUC Rpt NEW.xls 2/22/2010

SDGE Interruptible and Price Responsive Programs Subscription Statistics - Enrolled MW
2010
ProgramsService
AccountsEnrolled
MWsEstimated
MWsService
AccountsEnrolled
MWsEstimated
MWsService
AccountsEnrolled
MWs Estimated MWsService
AccountsEnrolled
MWsEstimated
MWsService
AccountsEnrolled
MWsEstimated
MWsService
AccountsEnrolled
MWsEstimated
MWsEligible Accounts as of
Jan 1, 2010Interruptible ReliabilityBIP - 3 hour option 1 0 1BIP - 30 minute option 18 6 10CPP-E 10 2 2OBMC 0 0 0SLRP 0 0 0 Sub-Total Interruptible 29 9 13 0Price ResponsiveCPP-D 1577 35 35Summer Saver Residential 35286 13 0Summer Saver Commercial 5677 10 0CBP - Day-Ahead 103 11 0CBP - Day-Of 278 18 0PLP 15 1 1DR Contracts 0 25 0 Sub-Total Price Response 42936 113 36 0Total All Programs 42965 121 49 0
ProgramsService
AccountsEnrolled
MWsEstimated
MWsService
AccountsEnrolled
MWsEstimated
MWsService
AccountsEnrolled
MWs Enrolled MWsService
AccountsEnrolled
MWsEstimated
MWsService
AccountsEnrolled
MWsEstimated
MWsService
AccountsEnrolled
MWsEstimated
MWsEligible Accounts as of
Jan 1, 2010Interruptible/ReliabilityBIP - 3 hour option 1 0 0.6BIP - 30 minute option 18 6 10.3CPP-E 10 2 2.3OBMC 0 0 0.0SLRP 0 0 0.0
CPP-D 1,583 35 35Summer Saver Residential 35,286 13 13Summer Saver Commercial 5,677 10 10CBP - Day-Ahead 103 11 9CBP - Day-Of 278 18 12PLP 15 1 1DR Contracts 0 25 0 Sub-Total Price Response 0 0 0 0Total All Programs 0 0 0 0
April May JuneJanuary February March
November DecemberJuly August September October
2010 January.xls 2/22/2010

SDGEAverage Load Impact kW / Customer
2010Program Eligibility and Average Load Impacts
Program January February March April May June July August September October November December Eligibility CriteriaBIP - 3 hour option 571 4,514 All C & I customers > 100kWBIP - 30 minute option 571 4,514 All C & I customers > 100kWCPP-E 230 2,232 All non-residential customers with interval meterOBMC 230 32,439 All C&I customersSLRP n/a 4,514 All C & I customers > 100kWCPP-D n/a 2,232 All non-residential customers with interval meterSummer Saver Residential 50% 0 428,747 Residential customers with ACSummer Saver Residential 100% 1 428,747 Residential customers with ACSummer Saver Commercial 30% 1 139,478 Commercial Customers < 100kwSummer Saver Commercial 50% 3 139,478 Commercial Customers < 100kwCBP - Day-Ahead 88 24,336 Non-residential customers > 20kwCBP - Day-Of 42 24,336 Non-residential customers > 20kwPLP 76 24,336 Non-residential customers > 20kwDR Contracts n/a 24,336 Non-residential customers > 20kw
Average Load Impact kW / CustomerEligible
Accounts as of Jan 1, 2010
2010 January.xls 2/22/2010
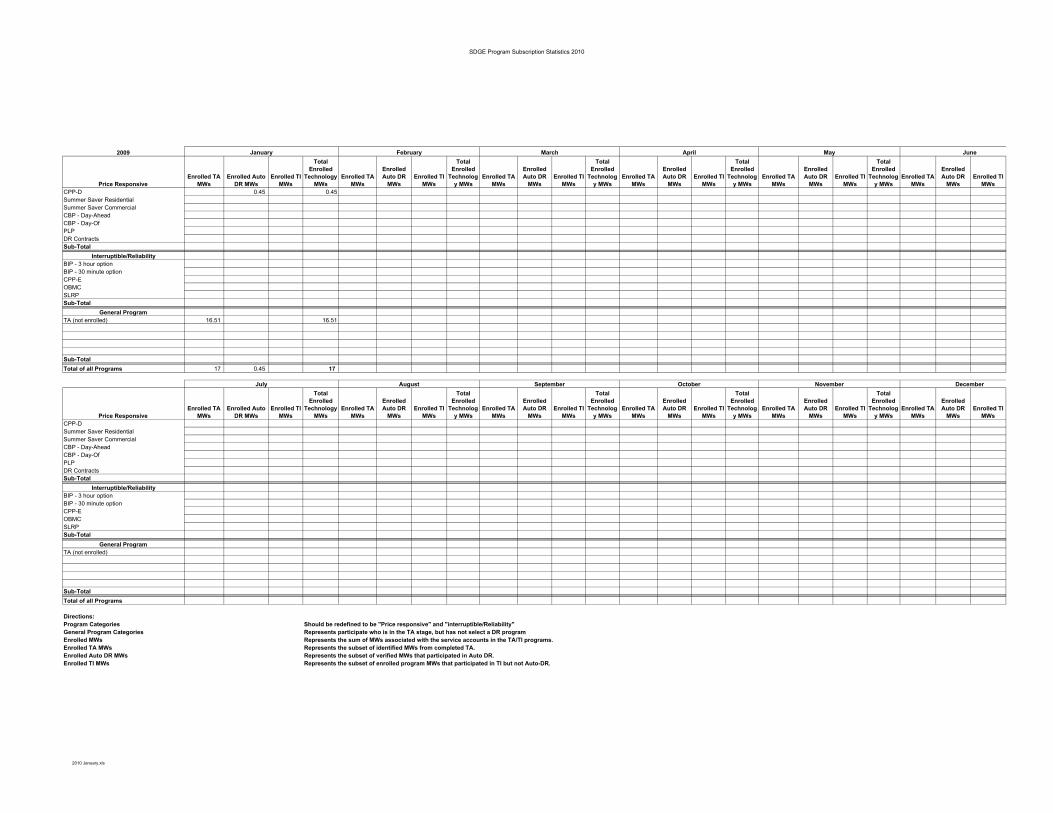
SDGE Program Subscription Statistics 2010
2009
Price ResponsiveEnrolled TA
MWsEnrolled Auto
DR MWsEnrolled TI
MWs
Total Enrolled
Technology MWs
Enrolled TA MWs
Enrolled Auto DR
MWsEnrolled TI
MWs
Total Enrolled
Technology MWs
Enrolled TA MWs
Enrolled Auto DR
MWsEnrolled TI
MWs
Total Enrolled
Technology MWs
Enrolled TA MWs
Enrolled Auto DR
MWsEnrolled TI
MWs
Total Enrolled
Technology MWs
Enrolled TA MWs
Enrolled Auto DR
MWsEnrolled TI
MWs
Total Enrolled
Technology MWs
Enrolled TA MWs
Enrolled Auto DR
MWsEnrolled TI
MWsCPP-D 0.45 0.45Summer Saver ResidentialSummer Saver CommercialCBP - Day-Ahead CBP - Day-Of PLPDR ContractsSub-Total
Interruptible/ReliabilityBIP - 3 hour optionBIP - 30 minute optionCPP-EOBMCSLRPSub-Total
General ProgramTA (not enrolled) 16.51 16.51
Sub-TotalTotal of all Programs 17 0.45 17
Price ResponsiveEnrolled TA
MWsEnrolled Auto
DR MWsEnrolled TI
MWs
Total Enrolled
Technology MWs
Enrolled TA MWs
Enrolled Auto DR
MWsEnrolled TI
MWs
Total Enrolled
Technology MWs
Enrolled TA MWs
Enrolled Auto DR
MWsEnrolled TI
MWs
Total Enrolled
Technology MWs
Enrolled TA MWs
Enrolled Auto DR
MWsEnrolled TI
MWs
Total Enrolled
Technology MWs
Enrolled TA MWs
Enrolled Auto DR
MWsEnrolled TI
MWs
Total Enrolled
Technology MWs
Enrolled TA MWs
Enrolled Auto DR
MWsEnrolled TI
MWsCPP-DSummer Saver ResidentialSummer Saver CommercialCBP - Day-Ahead CBP - Day-Of PLPDR ContractsSub-Total
Interruptible/ReliabilityBIP - 3 hour optionBIP - 30 minute optionCPP-EOBMCSLRPSub-Total
General ProgramTA (not enrolled)
Sub-TotalTotal of all Programs
Directions:Program Categories Should be redefined to be "Price responsive" and "interruptible/Reliability"General Program Categories Represents participate who is in the TA stage, but has not select a DR programEnrolled MWs Represents the sum of MWs associated with the service accounts in the TA/TI programs.Enrolled TA MWs Represents the subset of identified MWs from completed TA.Enrolled Auto DR MWs Represents the subset of verified MWs that participated in Auto DR.Enrolled TI MWs Represents the subset of enrolled program MWs that participated in TI but not Auto-DR.
DecemberJuly August September October November
May JuneJanuary February March April
2010 January.xls
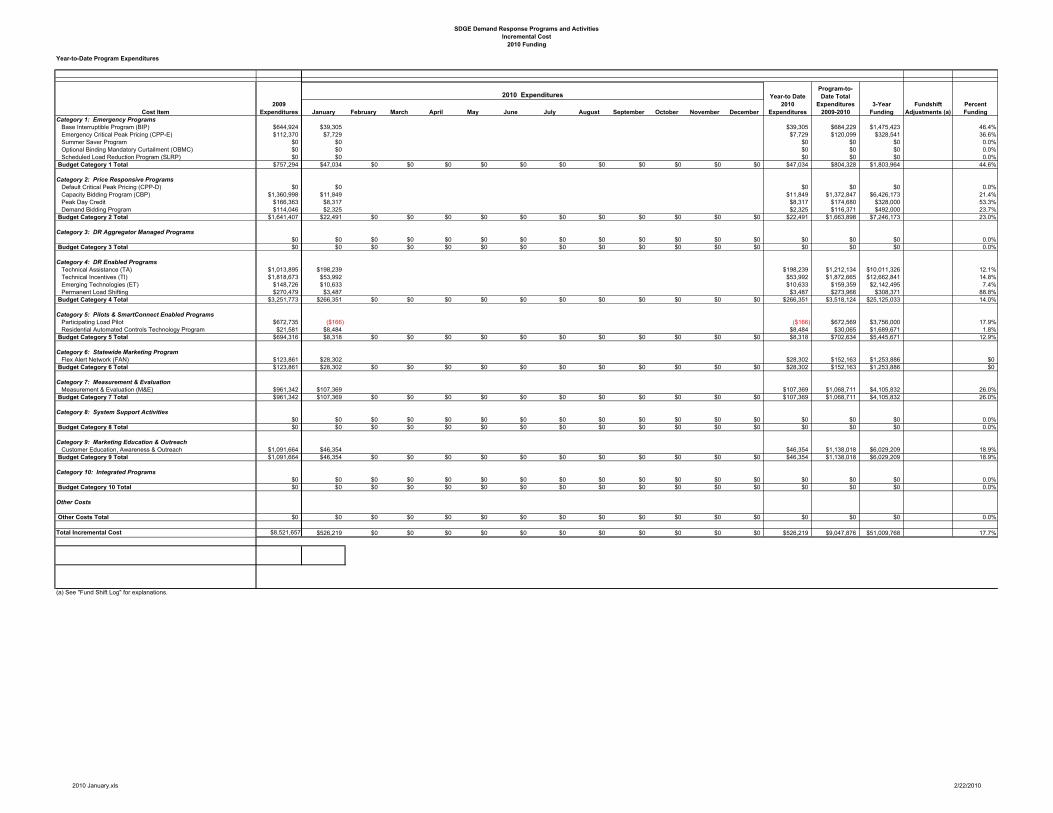
SDGE Demand Response Programs and ActivitiesIncremental Cost
2010 Funding
Year-to-Date Program Expenditures
Cost Item2009
Expenditures January February March April May June July August September October November December
Year-to Date 2010
Expenditures
Program-to-Date Total
Expenditures 2009-2010
3-Year Funding
Fundshift Adjustments (a)
Percent Funding
Category 1: Emergency ProgramsBase Interruptible Program (BIP) $644,924 $39,305 $39,305 $684,229 $1,475,423 46.4%Emergency Critical Peak Pricing (CPP-E) $112,370 $7,729 $7,729 $120,099 $328,541 36.6%Summer Saver Program $0 $0 $0 $0 $0 0.0%Optional Binding Mandatory Curtailment (OBMC) $0 $0 $0 $0 $0 0.0%Scheduled Load Reduction Program (SLRP) $0 $0 $0 $0 $0 0.0%
Budget Category 1 Total $757,294 $47,034 $0 $0 $0 $0 $0 $0 $0 $0 $0 $0 $0 $47,034 $804,328 $1,803,964 44.6%
Category 2: Price Responsive ProgramsDefault Critical Peak Pricing (CPP-D) $0 $0 $0 $0 $0 0.0%Capacity Bidding Program (CBP) $1,360,998 $11,849 $11,849 $1,372,847 $6,426,173 21.4%Peak Day Credit $166,363 $8,317 $8,317 $174,680 $328,000 53.3%Demand Bidding Program $114,046 $2,325 $2,325 $116,371 $492,000 23.7%
Budget Category 2 Total $1,641,407 $22,491 $0 $0 $0 $0 $0 $0 $0 $0 $0 $0 $0 $22,491 $1,663,898 $7,246,173 23.0%
Category 3: DR Aggregator Managed Programs$0 $0 $0 $0 $0 $0 $0 $0 $0 $0 $0 $0 $0 $0 $0 $0 0.0%
Budget Category 3 Total $0 $0 $0 $0 $0 $0 $0 $0 $0 $0 $0 $0 $0 $0 $0 $0 0.0%
Category 4: DR Enabled ProgramsTechnical Assistance (TA) $1,013,895 $198,239 $198,239 $1,212,134 $10,011,326 12.1%Technical Incentives (TI) $1,818,673 $53,992 $53,992 $1,872,665 $12,662,841 14.8%Emerging Technologies (ET) $148,726 $10,633 $10,633 $159,359 $2,142,495 7.4%Permanent Load Shifting $270,479 $3,487 $3,487 $273,966 $308,371 88.8%
Budget Category 4 Total $3,251,773 $266,351 $0 $0 $0 $0 $0 $0 $0 $0 $0 $0 $0 $266,351 $3,518,124 $25,125,033 14.0%
Category 5: Pilots & SmartConnect Enabled ProgramsParticipating Load Pilot $672,735 ($166) ($166) $672,569 $3,756,000 17.9%Residential Automated Controls Technology Program $21,581 $8,484 $8,484 $30,065 $1,689,671 1.8%
Budget Category 5 Total $694,316 $8,318 $0 $0 $0 $0 $0 $0 $0 $0 $0 $0 $0 $8,318 $702,634 $5,445,671 12.9%
Category 6: Statewide Marketing ProgramFlex Alert Network (FAN) $123,861 $28,302 $28,302 $152,163 $1,253,886 $0
Budget Category 6 Total $123,861 $28,302 $0 $0 $0 $0 $0 $0 $0 $0 $0 $0 $0 $28,302 $152,163 $1,253,886 $0
Category 7: Measurement & EvaluationMeasurement & Evaluation (M&E) $961,342 $107,369 $107,369 $1,068,711 $4,105,832 26.0%
Budget Category 7 Total $961,342 $107,369 $0 $0 $0 $0 $0 $0 $0 $0 $0 $0 $0 $107,369 $1,068,711 $4,105,832 26.0%
Category 8: System Support Activities$0 $0 $0 $0 $0 $0 $0 $0 $0 $0 $0 $0 $0 $0 $0 $0 0.0%
Budget Category 8 Total $0 $0 $0 $0 $0 $0 $0 $0 $0 $0 $0 $0 $0 $0 $0 $0 0.0%
Category 9: Marketing Education & OutreachCustomer Education, Awareness & Outreach $1,091,664 $46,354 $46,354 $1,138,018 $6,029,209 18.9%
Budget Category 9 Total $1,091,664 $46,354 $0 $0 $0 $0 $0 $0 $0 $0 $0 $0 $0 $46,354 $1,138,018 $6,029,209 18.9%
Category 10: Integrated Programs$0 $0 $0 $0 $0 $0 $0 $0 $0 $0 $0 $0 $0 $0 $0 $0 0.0%
Budget Category 10 Total $0 $0 $0 $0 $0 $0 $0 $0 $0 $0 $0 $0 $0 $0 $0 $0 0.0%
Other Costs
Other Costs Total $0 $0 $0 $0 $0 $0 $0 $0 $0 $0 $0 $0 $0 $0 $0 $0 0.0%
Total Incremental Cost $8,521,657 $526,219 $0 $0 $0 $0 $0 $0 $0 $0 $0 $0 $0 $526,219 $9,047,876 $51,009,768 17.7%
(a) See "Fund Shift Log" for explanations.
2010 Expenditures
2010 January.xls 2/22/2010

SDGEFUND SHIFTING
2010
FUND SHIFTING DOCUMENTATION PER DECISION 09-08-027 ORDERING PARAGRAPH 35
OP 35: The utilities may shift up to 50% of a program funds to another program's funds to another program within the same budget category.The utilities shall document the amount of and reason for each shift in their monthly demand response reports.
Program Category Fund Shift Programs Impacted Date Rationale for Fundshift
Total $0
Notes: Provide concise rationale for the fund shift in colum "Rationale for Fund Shift"
SDGE Interruptible and Price Responsive Programs 2010 Event Summary
Year-to-Date Event Summary
Program Category Event No. Date Event Trigger(1)Load Reduction
kW (2) (3) Event Beginning:End
Program Tolled Hours (Annual)
(4)
2010 January.xls 2/22/2010

SDGEDemand Response Programs
Total Cost and AMDRMA Accounts BalanceJanuary 2010
$000
Annual Total Cost January February March April May June July August September October November DecemberYear-to-Date
Cost 2009 Budget % of Budget
Administrative (O&M)Demand Bidding Program $2.3 $2.3 $0.0 n/aCapacity Bidding Program $11.8 $11.8 $0.0 n/aPeak Day Credit (20/20) Program $8.3 $8.3 $0.0 n/aBase Interruptible Program $6.8 $6.8 $0.0 n/aCPP-Emergency $7.7 $7.7 $0.0 n/aTechnology Incentives $17.3 $17.3 $0.0 n/aTechnology Assistance $30.0 $30.0 $0.0 n/aFlex Alert Network $28.3 $28.3 $0.0 n/aCustomer Education, Awareness & Outreach $46.4 $46.4 $0.0 n/akWickview $1.9 $1.9Emerging Markets/Technologies $10.6 $10.6 $0.0 n/aCommunity Outreach $2.5 $2.5 $0.0 n/aCelerity ** $0.1 $0.1 $0.0 n/aSummer Saver ** $1,026.7 $1,026.7 $0.0 n/aPermanent Load Shifting $3.5 $3.5 $0.0 n/aPLP ($0.2) ($0.2) $0.0 n/aRACT $8.5 $8.5 $0.0 n/aInformation Technology ($63.6) ($63.6) $0.0 n/a Total Administrative (O&M) $1,149.1 $0.0 $0.0 $0.0 $0.0 $0.0 $0.0 $0.0 $0.0 $0.0 $0.0 $0.0 $1,149.1 $0.0 n/a
Capital Demand Bidding Program $0.0 $0.0 $0.0 n/aRACT $0.0 $0.0 $0.0 n/aC&I Peak Day Credit (20/20 ) $0.0 $0.0 $0.0 n/aBase Interruptible Program $0.0 $0.0 $0.0 n/aCPP-Emergency $0.0 $0.0 $0.0 n/aEmerging Markets $0.0 $0.0 $0.0 n/a Total Capital $0.0 $0.0 $0.0 $0.0 $0.0 $0.0 $0.0 $0.0 $0.0 $0.0 $0.0 $0.0 $0.0 $0.0 n/a
Measurement and Evaluation Summer Saver $0.0 $0.0 n/aGeneral Administration $107.4 $107.4 $0.0 n/a
Total M&E $107.4 $0.0 $0.0 $0.0 $0.0 $0.0 $0.0 $0.0 $0.0 $0.0 $0.0 $0.0 $107.4 $0.0 n/a
Customer IncentivesCapacity Bidding Program $0.0 $0.0 n/aBase Interruptible Program $39.3 $39.3 $0.0 n/aTechnology Incentives $36.7 $36.7 $0.0 n/aTechnology Assistance $168.2 $168.2 $0.0 n/aCelerity $0.0 $0.0 n/aSummer Saver $0.4 $0.4 $0.0 n/a
Total Customer Incentives $244.6 $0.0 $0.0 $0.0 $0.0 $0.0 $0.0 $0.0 $0.0 $0.0 $0.0 $0.0 $244.6 $0.0 n/a
Total $1,501.0 $0.0 $0.0 $0.0 $0.0 $0.0 $0.0 $0.0 $0.0 $0.0 $0.0 $0.0 $1,501.0 $0.0 n/a
AMDRMA Account End of Month Balance for WG2 $1,510.7 $1,510.7** Budgeted under a different proceeding
2010 January.xls 2/22/2010

SDGE GRC ProgramsJanuary 2010
$000
Annual Total Cost January February March April May June July August September October November DecemberYear-to-Date Total Cost
Programs in General Rate CaseAdministrative (O&M)
AL-TOU-CP $0.0 $0.0 $0.0 $0.0 $0.0 $0.0 $0.0 $0.0 $0.0 $0.0 $0.0 $0.0 $0.0CPP-D $7.9 $0.0 $0.0 $0.0 $0.0 $0.0 $0.0 $0.0 $0.0 $0.0 $0.0 $0.0 $7.9SLRP $0.0 $0.0 $0.0 $0.0 $0.0 $0.0 $0.0 $0.0 $0.0 $0.0 $0.0 $0.0 $0.0Peak Generation (RBRP) $1.7 $0.0 $0.0 $0.0 $0.0 $0.0 $0.0 $0.0 $0.0 $0.0 $0.0 $0.0 $1.7OBMC $0.0 $0.0 $0.0 $0.0 $0.0 $0.0 $0.0 $0.0 $0.0 $0.0 $0.0 $0.0 $0.0 Total Administrative (O&M) $9.6 $0.0 $0.0 $0.0 $0.0 $0.0 $0.0 $0.0 $0.0 $0.0 $0.0 $0.0 $9.6
CapitalPeak Generation (RBRP) (1) $0.0 $0.0 $0.0 $0.0 $0.0 $0.0 $0.0 $0.0 $0.0 $0.0 $0.0 $0.0 $0.0 Total Capital $0.0 $0.0 $0.0 $0.0 $0.0 $0.0 $0.0 $0.0 $0.0 $0.0 $0.0 $0.0 $0.0
Measurement and Evaluation Peak Generation (RBRP) $0.0 $0.0 $0.0 $0.0 $0.0 $0.0 $0.0 $0.0 $0.0 $0.0 $0.0 $0.0 $0.0
Total M&E $0.0 $0.0 $0.0 $0.0 $0.0 $0.0 $0.0 $0.0 $0.0 $0.0 $0.0 $0.0 $0.0
Customer IncentivesAL-TOU-CP (2) $0.0 $0.0 $0.0 $0.0 $0.0 $0.0 $0.0 $0.0 $0.0 $0.0 $0.0 $0.0 $0.0BIP $0.0 $0.0 $0.0 $0.0 $0.0 $0.0 $0.0 $0.0 $0.0 $0.0 $0.0 $0.0 $0.0SLRP $0.0 $0.0 $0.0 $0.0 $0.0 $0.0 $0.0 $0.0 $0.0 $0.0 $0.0 $0.0 $0.0Peak Generation (RBRP) $0.0 $0.0 $0.0 $0.0 $0.0 $0.0 $0.0 $0.0 $0.0 $0.0 $0.0 $0.0 $0.0
Total Customer Incentives $0.0 $0.0 $0.0 $0.0 $0.0 $0.0 $0.0 $0.0 $0.0 $0.0 $0.0 $0.0 $0.0
Revenue from Penalties $0.0 $0.0 $0.0 $0.0 $0.0 $0.0 $0.0 $0.0 $0.0 $0.0 $0.0 $0.0 $0.0
Total GRC Program Costs $9.6 $0.0 $0.0 $0.0 $0.0 $0.0 $0.0 $0.0 $0.0 $0.0 $0.0 $0.0 $9.6
(1) Capital costs for meters provided free to customers and charged to the programs
2010 January.xls 2/22/2010

4
CERTIFICATE OF SERVICE
I hereby certify that I have this day served a copy of the foregoing REPORT OF SAN
DIEGO GAS & ELECTRIC COMPANY (U 902 M) ON INTERRUPTIBLE LOAD AND
DEMAND RESPONSE PROGRAMS FOR JANUARY 2010 by electronic mail to each party
of record in A.08-06-001, A.08-06-002 and A.08-06-003. Any party on the service list who has
not provided an electronic mail address was served by placing copies in properly addressed and
sealed envelopes and by depositing such envelopes in the United States mail with first-class
postage prepaid.
Copies were also sent via Federal Express to Administrative Law Judge Jessica T. Hecht
and Commissioner Dian Grueneich.
Dated at Los Angeles, California this 22nd day of February 2010.
/s/ Marivel Munoz Marivel Munoz

5
CALIFORNIA PUBLIC UTILITIES COMMISSION Proceeding: A.08-06-001, 002, 003 – Last Updated: February 8, 2010
[email protected]; [email protected]; [email protected]; [email protected]; [email protected]; [email protected]; [email protected]; [email protected]; [email protected]; [email protected]; [email protected]; [email protected]; [email protected]; [email protected]; [email protected]; [email protected]; [email protected]; [email protected]; [email protected]; [email protected]; [email protected]; [email protected]; [email protected]; [email protected]; [email protected]; [email protected]; [email protected]; [email protected]; [email protected]; [email protected]; [email protected]; [email protected]; [email protected]; [email protected]; [email protected]; [email protected]; [email protected]; [email protected]; [email protected]; [email protected]; [email protected]; [email protected]; [email protected]; [email protected]; [email protected]; [email protected]; [email protected]; [email protected]; [email protected]; [email protected]; [email protected]; [email protected]; [email protected]; [email protected]; [email protected]; [email protected]; [email protected]; [email protected]; [email protected]; [email protected]; [email protected]; [email protected]; [email protected]; [email protected]; [email protected]; [email protected]; [email protected]; [email protected]; [email protected]; [email protected]; [email protected]; [email protected]; [email protected]; [email protected]; [email protected]; [email protected]; [email protected]; [email protected]; [email protected]; [email protected]; [email protected]; [email protected]; [email protected]; [email protected]; [email protected]; [email protected]; [email protected]; [email protected]; [email protected]; [email protected] Marie Pieniazek CPOWER, Inc. 17 State Street New York, NY 10004
Pam Melton ENERGY CONNECT, Inc. 4141 N. Henderson Road, No. 211 Arlington, VA 22203