Embed Size (px)
Citation preview
%HIRUH�<RX�%HJLQ
9LVLRQDU\�7XWRULDO 3DJH��
Before You Begin
The Visionary Tutorial consists of one exercise of step-by-step tasks that illustrate the fundamentals of how to create and publish a Visionary world. Review this first page before you attempt the tasks in the following list, because you need to install a sample database before you begin.
1. Creating a Storyboard
2. Connecting to a Database
3. Building a Data Source
4. Inserting a Scene
5. Inserting a Layout
6. Inserting a Scene Parameter
7. Refining Text Objects
8. Creating Wormholes
9. Creating a Parameterized Query
10. Adding Scene Parameters
11. Inserting a Global Parameter
12. Inserting an Event Action
13. Publishing a World
This exercise will take approximately one hour to complete.
Installing the Sample Database
Before you can begin the tutorial exercise, you need to ask your database administrator (DBA) to install the stores7 sample database. The stores7 database is included with the Informix server. For installation details, direct your DBA to the Informix Developer Network (IDN) at http://www.informix.com/idn-secure/Visionary/WebPages/doclib.htm or to the Informix Visionary User’s Guide.
Accessing Commands
You can access commands from the main menu bar or with a right-click to display a popup menu. All the tasks in the tutorial access commands with a right-click when this is available.
Tips
A drop-down list of all tasks is available at the beginning of each task. There are also buttons at the beginning and end of each task for going to the InfoShelf home page, to this page, and to print this tutorial. You can use an overall view of the Visionary Studio Environment as a guide to its editors and windows.
Related Reading
For more information about Informix Visionary, refer to the on-line help in Visionary and the Informix Visionary User’s Guide available on the Visionary InfoShelf.
&UHDWLQJ�D�6WRU\ERDUG
9LVLRQDU\�7XWRULDO 3DJH��
Tutorial Task #1
Creating a Storyboard
Before you start to create a Visionary world, use a storyboard to plan and illustrate your ideas. For example, suppose you are a business analyst. The executives of a large sporting goods clearinghouse that distributes through the World Wide Web want you to answer the following questions:
Which manufacturers’ products are selling and which are not selling?
Which manufacturers could not deliver their products on time and have large backlogs?
When do the backlogs occur?
What are the selling trends for each manufacturer?
All the data to answer these questions is available in the stores7 database. To effectively present the data, you decide to create a Visionary world. After you think about it for a while, you design a storyboard as a guide to help you visualize what to put in your Visionary world.
To create the storyboard, you design scenes, layouts, and ways to navigate between the scenes. For the storyboard, you use pencil and paper or computer-based tools, such as Microsoft PowerPoint or a Web authoring tool.
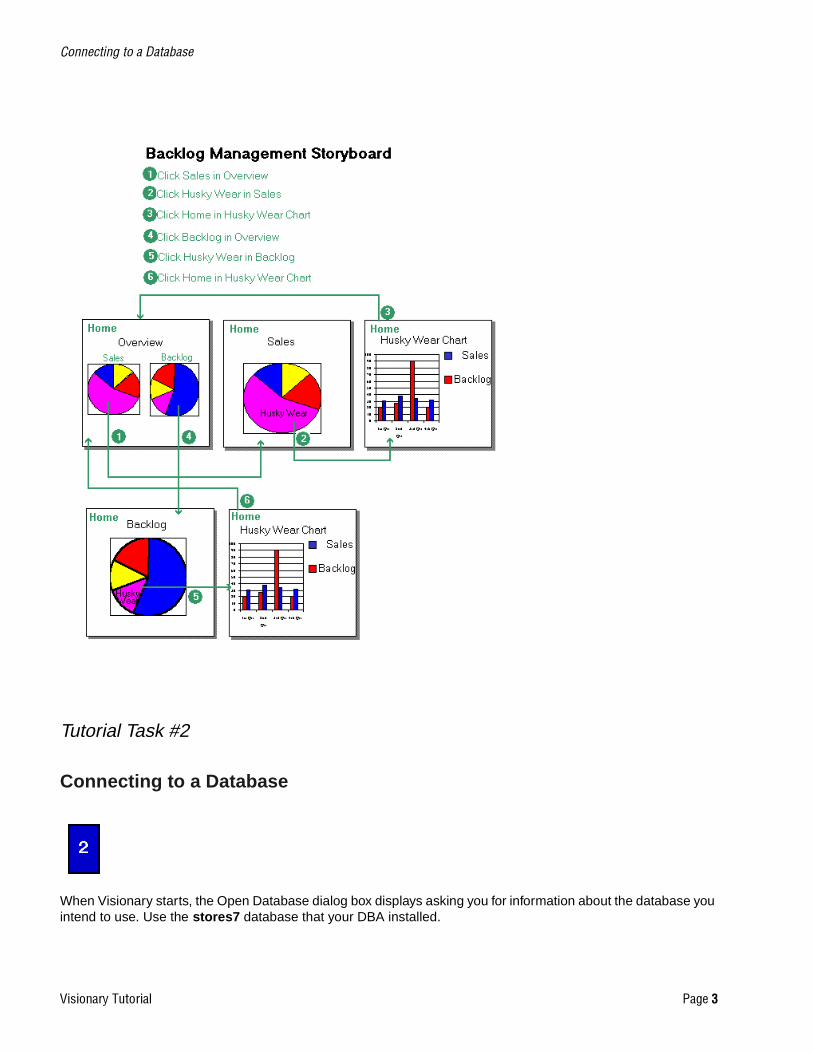
Here is a sample storyboard for the world you build with this tutorial. This storyboard was created in Microsoft PowerPoint as a single slide and saved as a GIF file.
As a way to show you what’s implied by a storyboard, links were added to this storyboard. By clicking a link, you can navigate to four different graphics in the finished Visionary world. The graphics include Overview, Sales, the Husky Wear chart, and Backlog.
&RQQHFWLQJ�WR�D�'DWDEDVH
9LVLRQDU\�7XWRULDO 3DJH��
Tutorial Task #2
Connecting to a Database
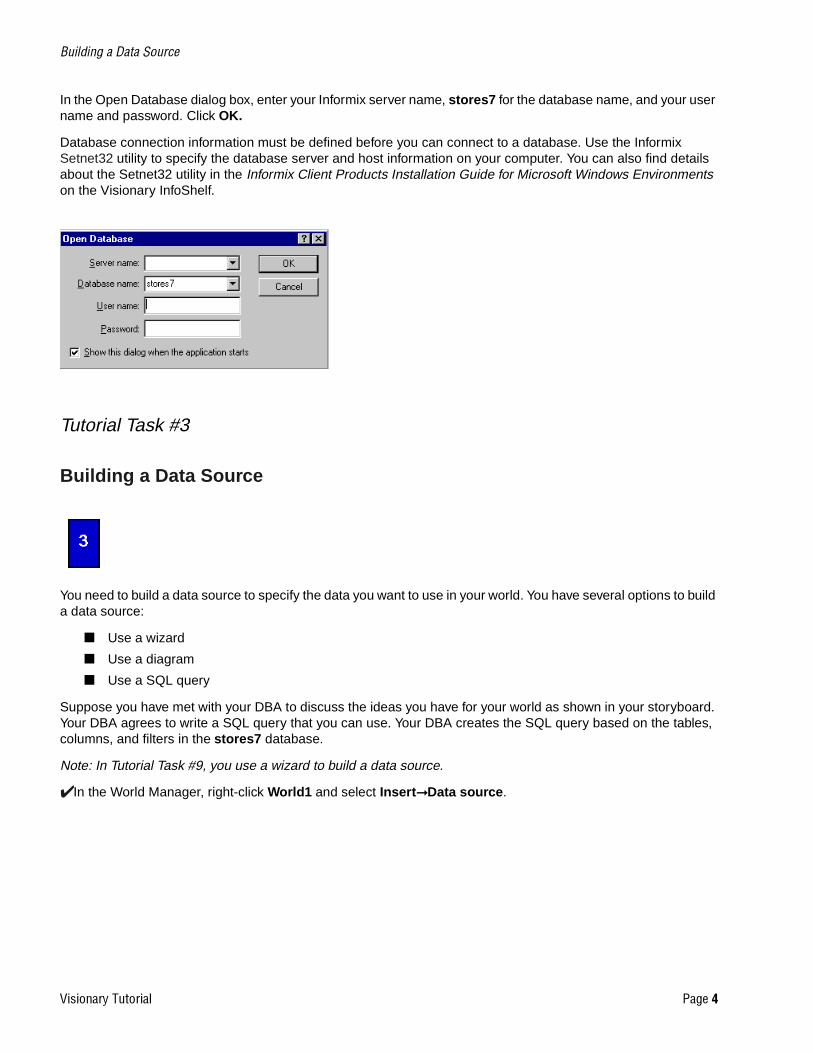
When Visionary starts, the Open Database dialog box displays asking you for information about the database you intend to use. Use the stores7 database that your DBA installed.
%XLOGLQJ�D�'DWD�6RXUFH
9LVLRQDU\�7XWRULDO 3DJH��
In the Open Database dialog box, enter your Informix server name, stores7 for the database name, and your user name and password. Click OK.
Database connection information must be defined before you can connect to a database. Use the Informix Setnet32 utility to specify the database server and host information on your computer. You can also find details about the Setnet32 utility in the Informix Client Products Installation Guide for Microsoft Windows Environments on the Visionary InfoShelf.
Tutorial Task #3
Building a Data Source
You need to build a data source to specify the data you want to use in your world. You have several options to build a data source:
■ Use a wizard
■ Use a diagram
■ Use a SQL query
Suppose you have met with your DBA to discuss the ideas you have for your world as shown in your storyboard. Your DBA agrees to write a SQL query that you can use. Your DBA creates the SQL query based on the tables, columns, and filters in the stores7 database.
Note: In Tutorial Task #9, you use a wizard to build a data source.
✔In the World Manager, right-click World1 and select Insert➞Data source.
%XLOGLQJ�D�'DWD�6RXUFH
9LVLRQDU\�7XWRULDO 3DJH��
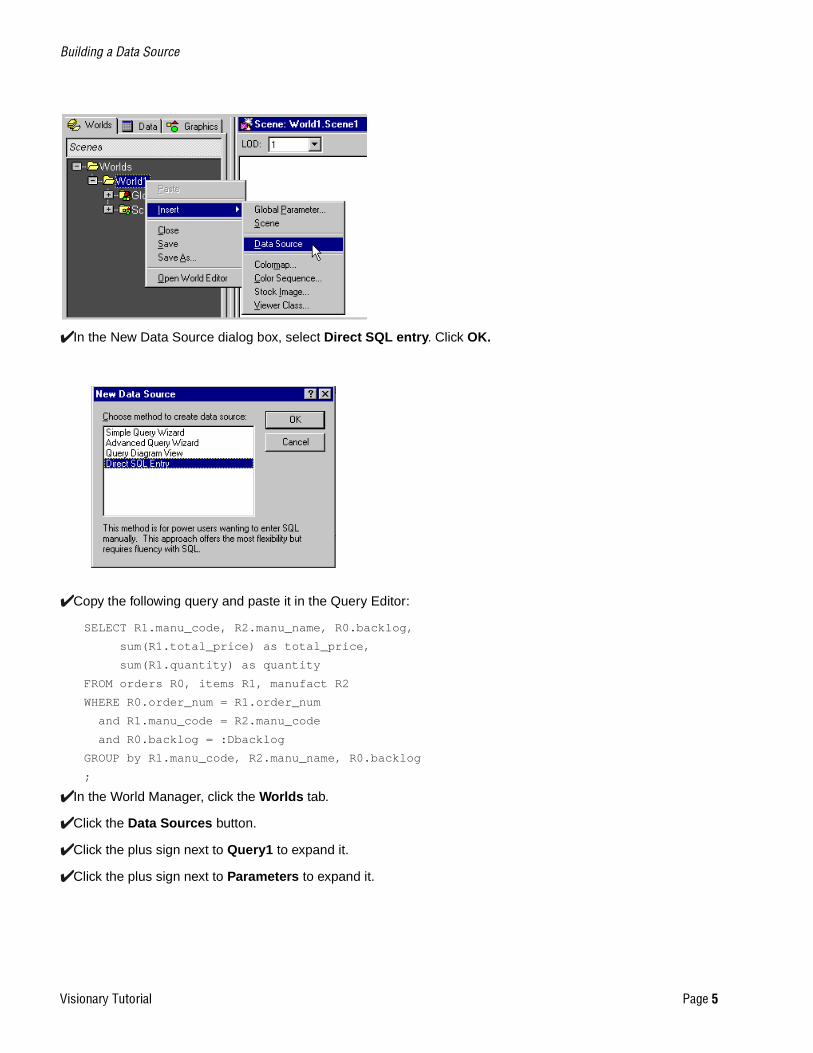
✔In the New Data Source dialog box, select Direct SQL entry. Click OK.
✔Copy the following query and paste it in the Query Editor:
SELECT R1.manu_code, R2.manu_name, R0.backlog,
sum(R1.total_price) as total_price,
sum(R1.quantity) as quantity
FROM orders R0, items R1, manufact R2
WHERE R0.order_num = R1.order_num
and R1.manu_code = R2.manu_code
and R0.backlog = :Dbacklog
GROUP by R1.manu_code, R2.manu_name, R0.backlog
;
✔In the World Manager, click the Worlds tab.
✔Click the Data Sources button.
✔Click the plus sign next to Query1 to expand it.
✔Click the plus sign next to Parameters to expand it.
%XLOGLQJ�D�'DWD�6RXUFH
9LVLRQDU\�7XWRULDO 3DJH��
.
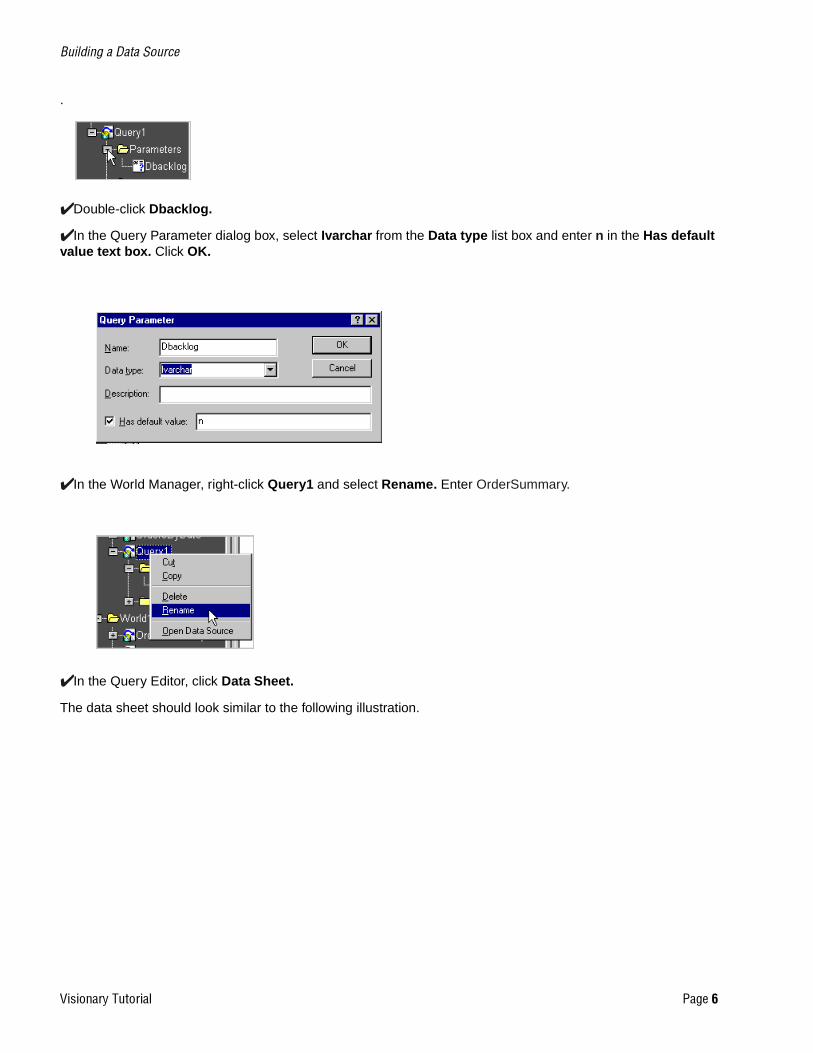
✔Double-click Dbacklog.
✔In the Query Parameter dialog box, select Ivarchar from the Data type list box and enter n in the Has default value text box. Click OK.
✔In the World Manager, right-click Query1 and select Rename. Enter OrderSummary.
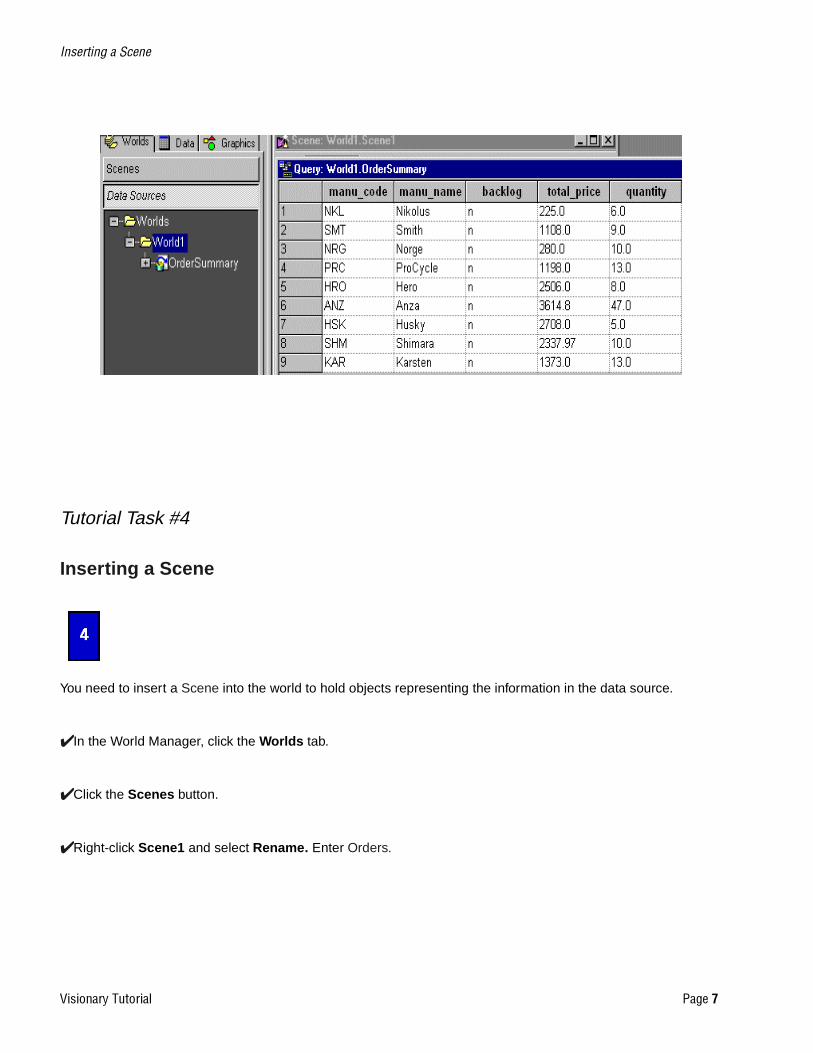
✔In the Query Editor, click Data Sheet.
The data sheet should look similar to the following illustration.
,QVHUWLQJ�D�6FHQH
9LVLRQDU\�7XWRULDO 3DJH��
Tutorial Task #4
Inserting a Scene
You need to insert a Scene into the world to hold objects representing the information in the data source.
✔In the World Manager, click the Worlds tab.
✔Click the Scenes button.
✔Right-click Scene1 and select Rename. Enter Orders.
,QVHUWLQJ�D�/D\RXW
9LVLRQDU\�7XWRULDO 3DJH��
.
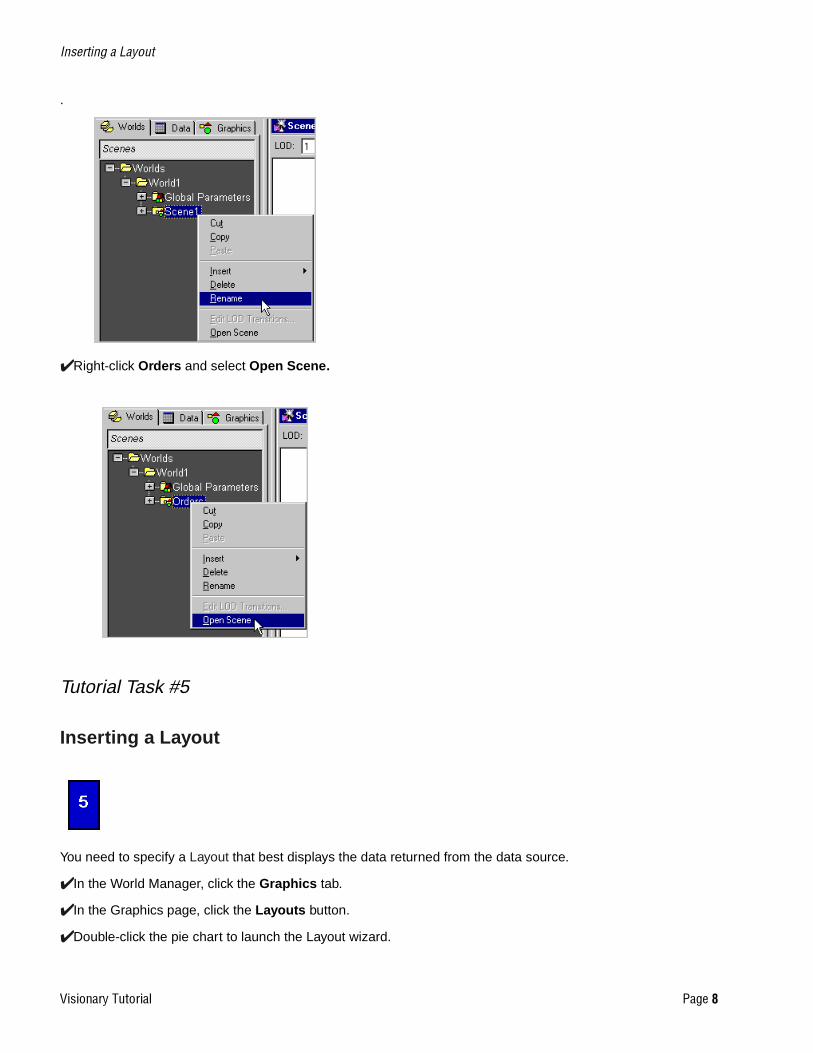
✔Right-click Orders and select Open Scene.
Tutorial Task #5
Inserting a Layout
You need to specify a Layout that best displays the data returned from the data source.
✔In the World Manager, click the Graphics tab.
✔In the Graphics page, click the Layouts button.
✔Double-click the pie chart to launch the Layout wizard.
,QVHUWLQJ�D�/D\RXW
9LVLRQDU\�7XWRULDO 3DJH��
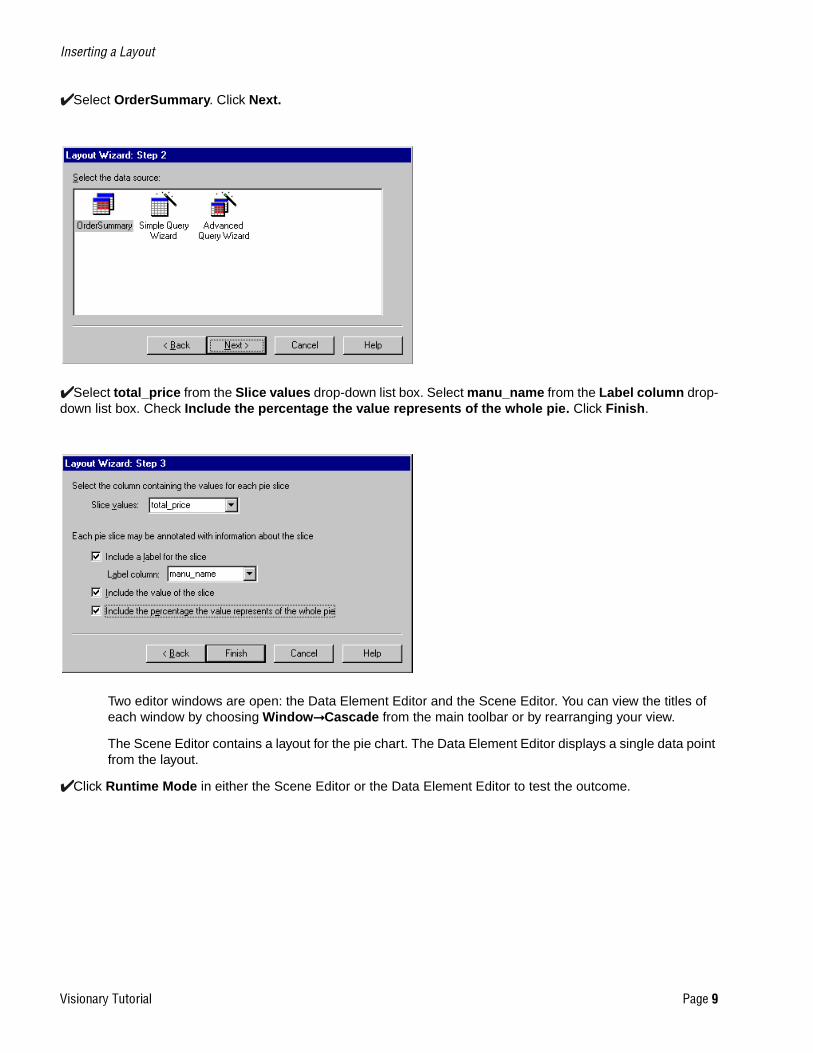
✔Select OrderSummary. Click Next.
✔Select total_price from the Slice values drop-down list box. Select manu_name from the Label column drop-down list box. Check Include the percentage the value represents of the whole pie. Click Finish.
Two editor windows are open: the Data Element Editor and the Scene Editor. You can view the titles of each window by choosing Window➞Cascade from the main toolbar or by rearranging your view.
The Scene Editor contains a layout for the pie chart. The Data Element Editor displays a single data point from the layout.
✔Click Runtime Mode in either the Scene Editor or the Data Element Editor to test the outcome.
,QVHUWLQJ�D�6FHQH�3DUDPHWHU
9LVLRQDU\�7XWRULDO 3DJH���
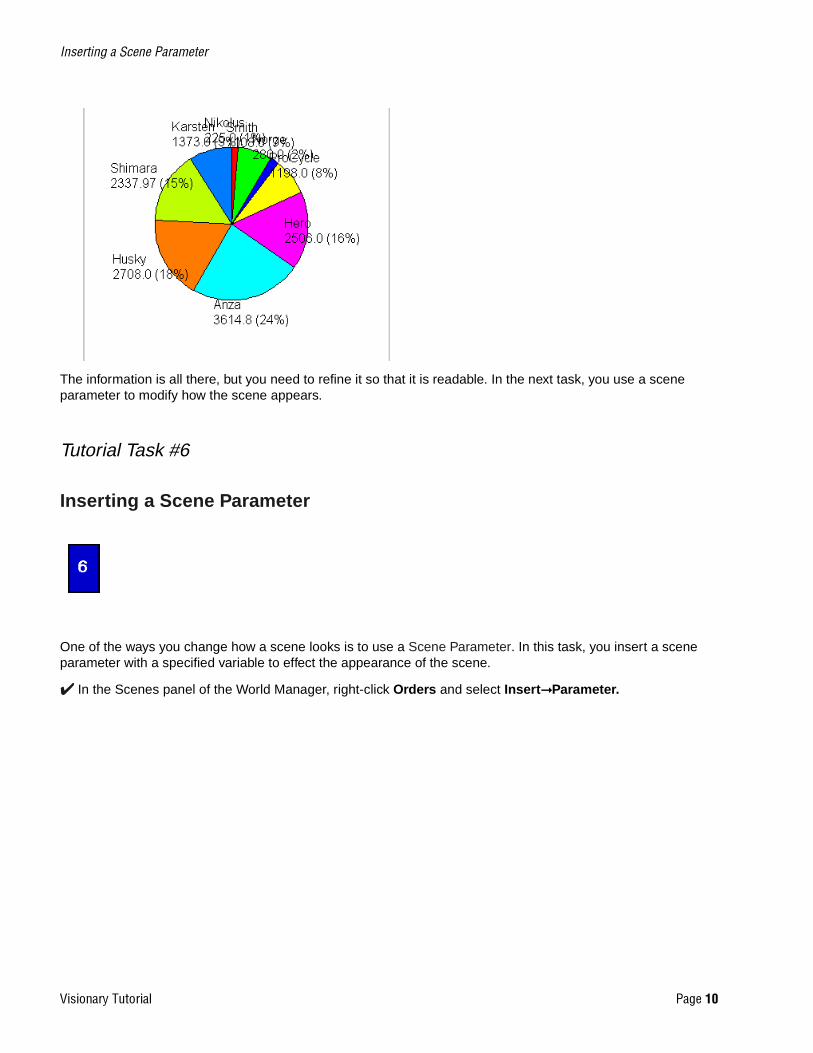
The information is all there, but you need to refine it so that it is readable. In the next task, you use a scene parameter to modify how the scene appears.
Tutorial Task #6
Inserting a Scene Parameter
One of the ways you change how a scene looks is to use a Scene Parameter. In this task, you insert a scene parameter with a specified variable to effect the appearance of the scene.
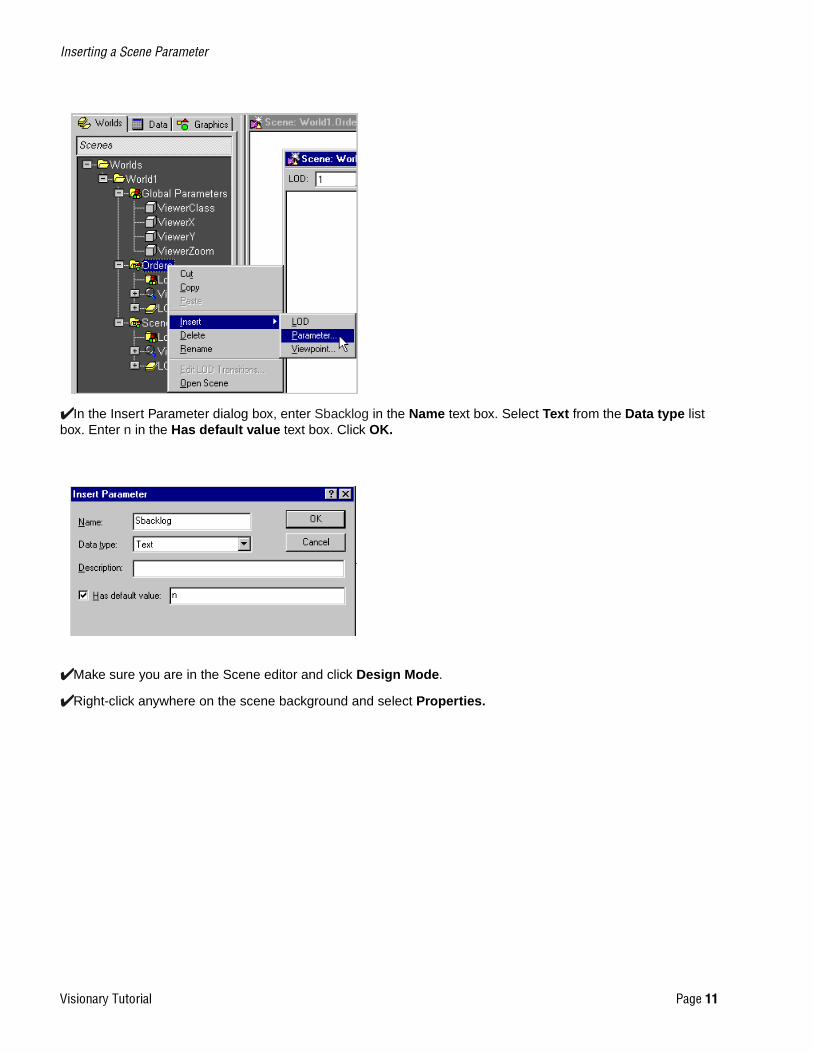
✔ In the Scenes panel of the World Manager, right-click Orders and select Insert➞Parameter.
,QVHUWLQJ�D�6FHQH�3DUDPHWHU
9LVLRQDU\�7XWRULDO 3DJH���
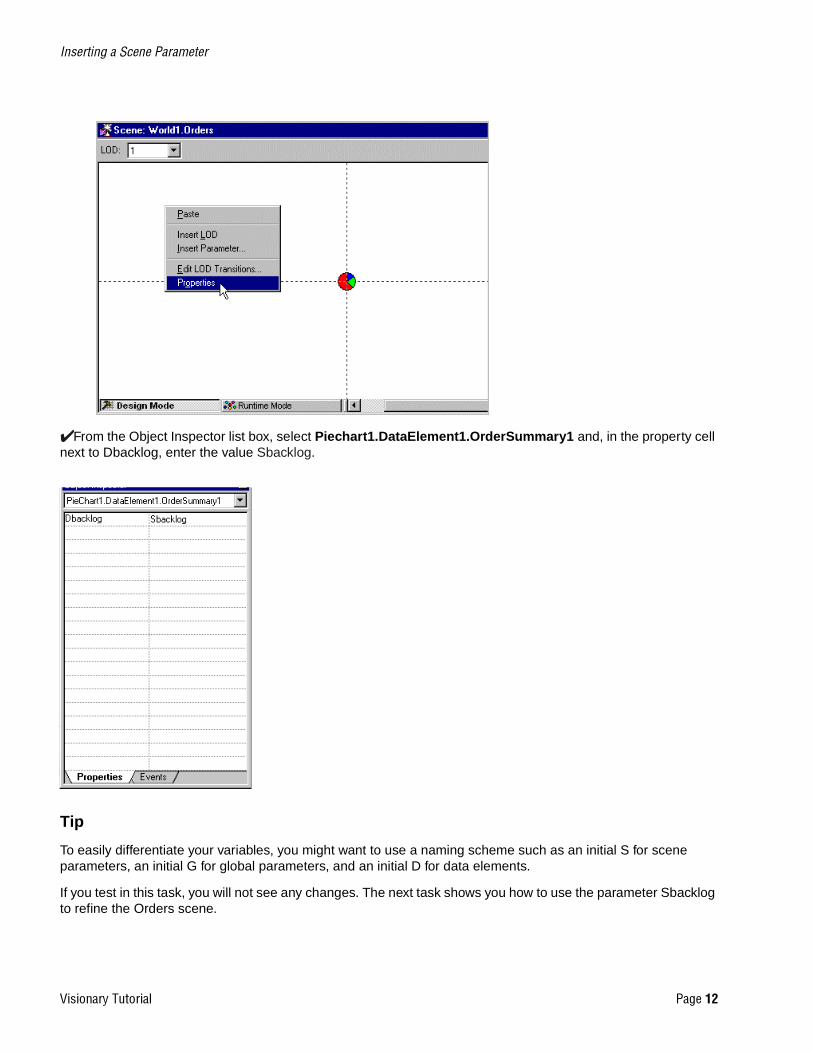
✔In the Insert Parameter dialog box, enter Sbacklog in the Name text box. Select Text from the Data type list box. Enter n in the Has default value text box. Click OK.
✔Make sure you are in the Scene editor and click Design Mode.
✔Right-click anywhere on the scene background and select Properties.
,QVHUWLQJ�D�6FHQH�3DUDPHWHU
9LVLRQDU\�7XWRULDO 3DJH���
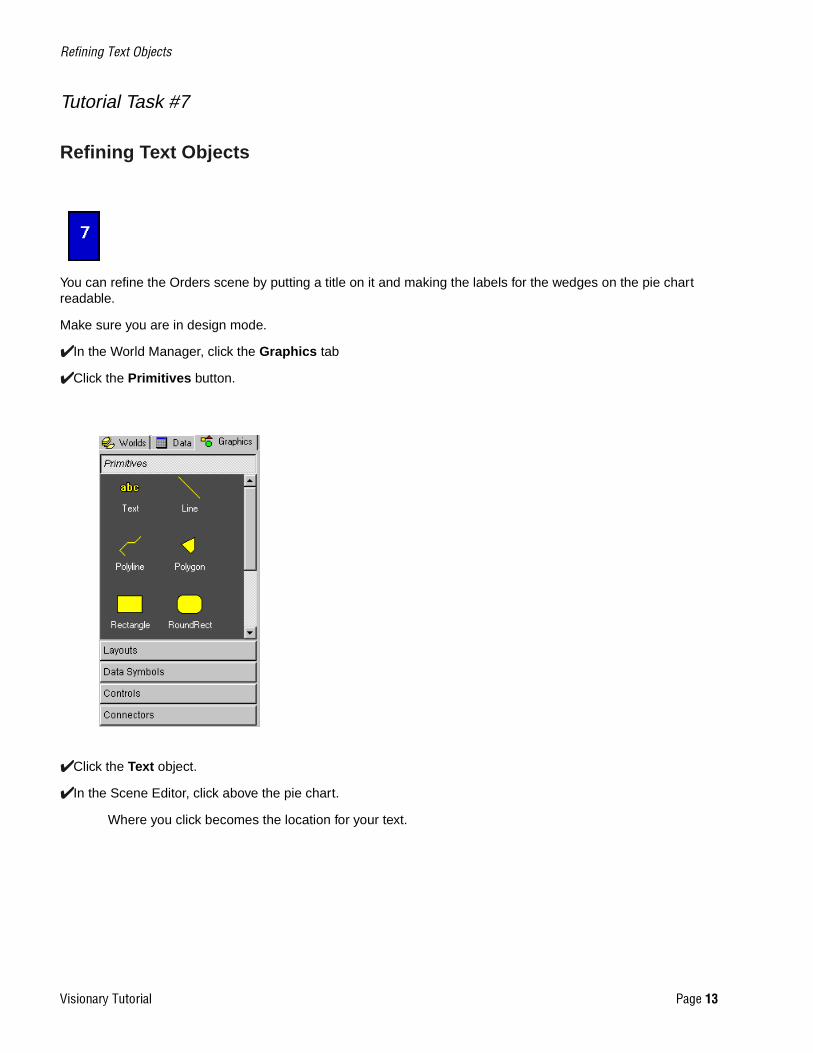
✔From the Object Inspector list box, select Piechart1.DataElement1.OrderSummary1 and, in the property cell next to Dbacklog, enter the value Sbacklog.
Tip
To easily differentiate your variables, you might want to use a naming scheme such as an initial S for scene parameters, an initial G for global parameters, and an initial D for data elements.
If you test in this task, you will not see any changes. The next task shows you how to use the parameter Sbacklog to refine the Orders scene.
5HILQLQJ�7H[W�2EMHFWV
9LVLRQDU\�7XWRULDO 3DJH���
Tutorial Task #7
Refining Text Objects
You can refine the Orders scene by putting a title on it and making the labels for the wedges on the pie chart readable.
Make sure you are in design mode.
✔In the World Manager, click the Graphics tab
✔Click the Primitives button.
✔Click the Text object.
✔In the Scene Editor, click above the pie chart.
Where you click becomes the location for your text.
5HILQLQJ�7H[W�2EMHFWV
9LVLRQDU\�7XWRULDO 3DJH���
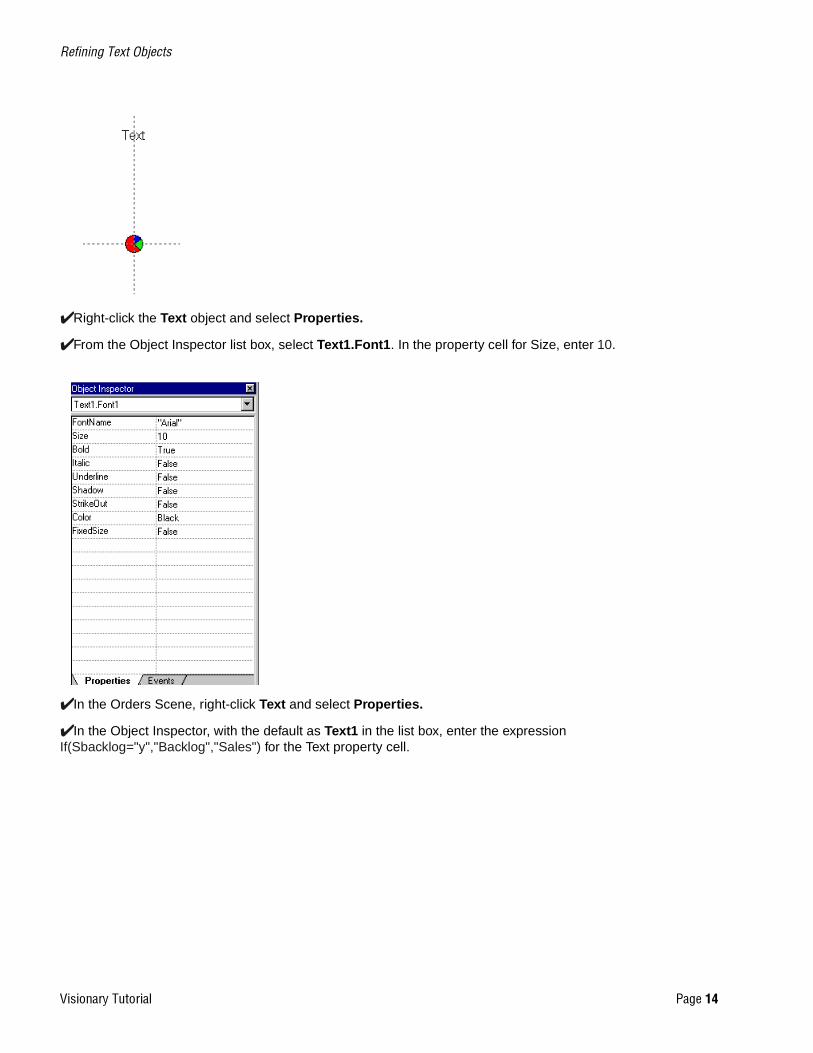
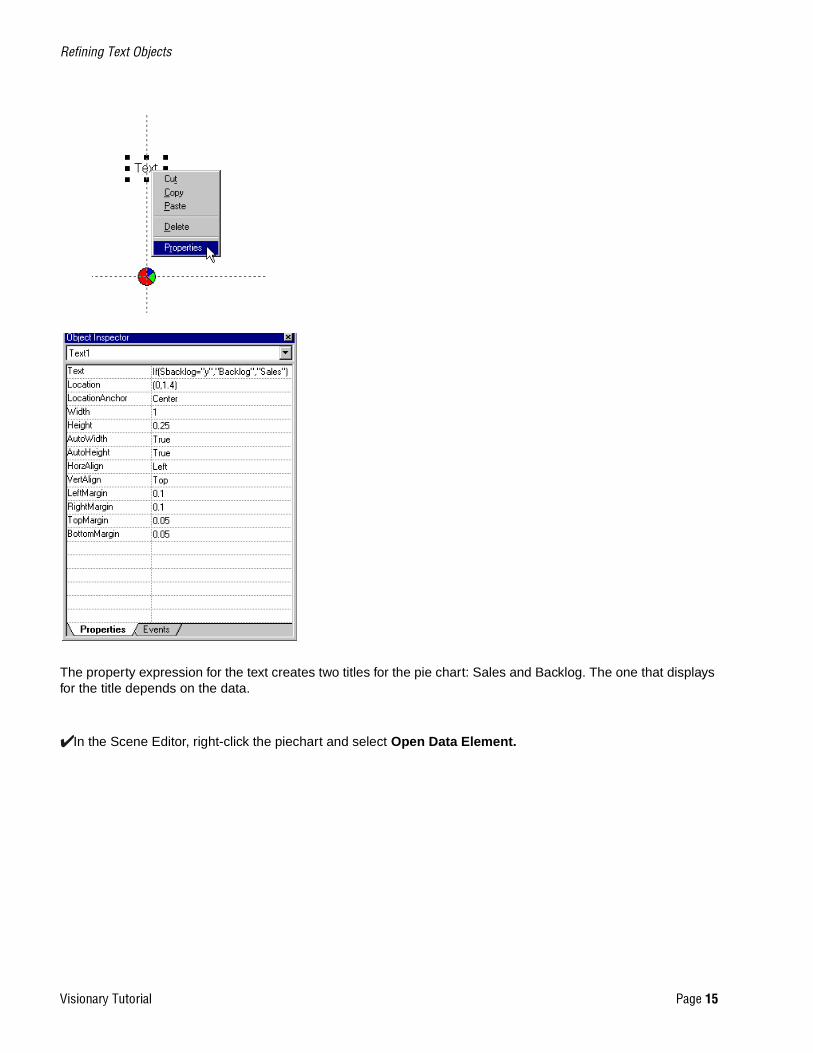
✔Right-click the Text object and select Properties.
✔From the Object Inspector list box, select Text1.Font1. In the property cell for Size, enter 10.
✔In the Orders Scene, right-click Text and select Properties.
✔In the Object Inspector, with the default as Text1 in the list box, enter the expression If(Sbacklog="y","Backlog","Sales") for the Text property cell.
5HILQLQJ�7H[W�2EMHFWV
9LVLRQDU\�7XWRULDO 3DJH���
The property expression for the text creates two titles for the pie chart: Sales and Backlog. The one that displays for the title depends on the data.
✔In the Scene Editor, right-click the piechart and select Open Data Element.
5HILQLQJ�7H[W�2EMHFWV
9LVLRQDU\�7XWRULDO 3DJH���
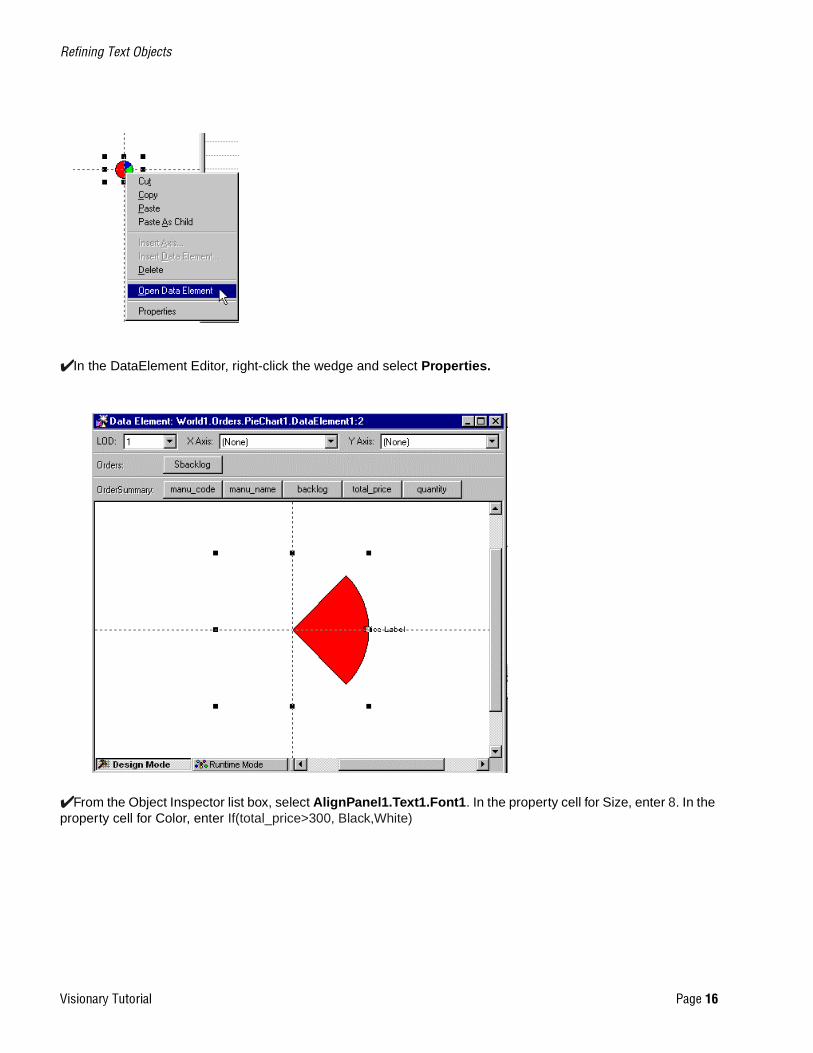
✔In the DataElement Editor, right-click the wedge and select Properties.
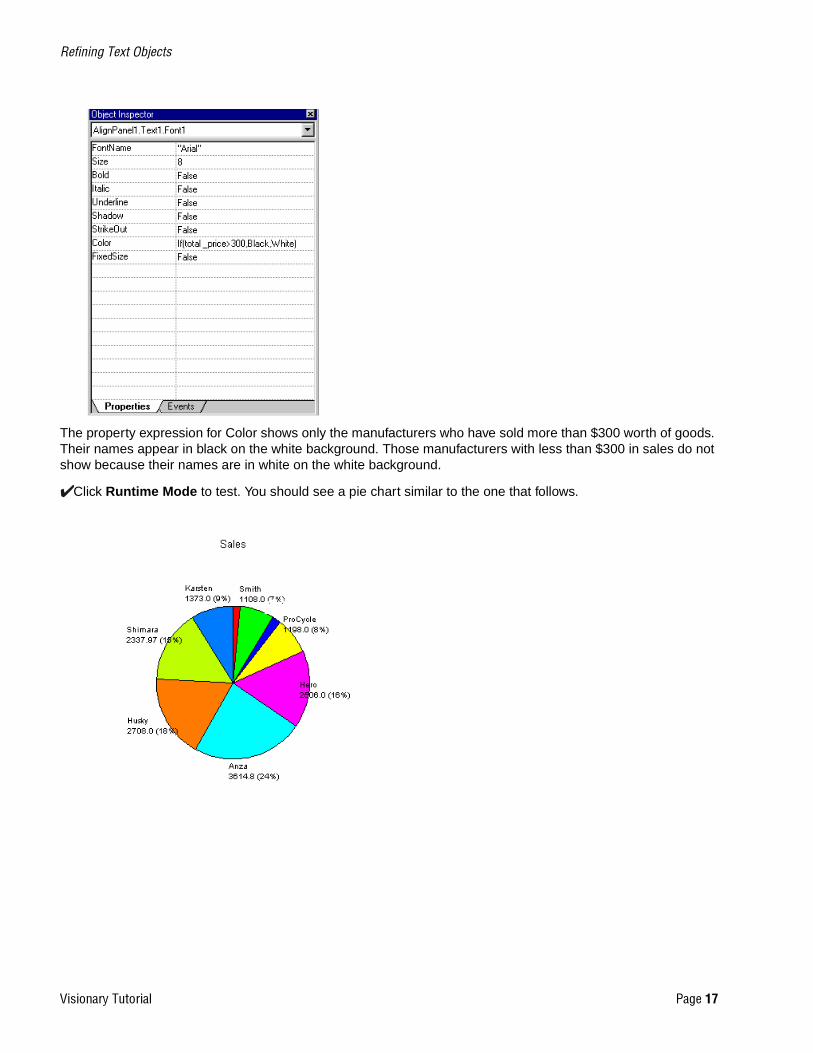
✔From the Object Inspector list box, select AlignPanel1.Text1.Font1. In the property cell for Size, enter 8. In the property cell for Color, enter If(total_price>300, Black,White)
5HILQLQJ�7H[W�2EMHFWV
9LVLRQDU\�7XWRULDO 3DJH���
The property expression for Color shows only the manufacturers who have sold more than $300 worth of goods. Their names appear in black on the white background. Those manufacturers with less than $300 in sales do not show because their names are in white on the white background.
✔Click Runtime Mode to test. You should see a pie chart similar to the one that follows.
&UHDWLQJ�:RUPKROHV
9LVLRQDU\�7XWRULDO 3DJH���
Tutorial Task #8
Creating Wormholes
You link one scene in a Visionary world to another with a Wormhole. Wormholes also allow you to show a portion of the target scene while still in the originating scene. In this task, you create two wormholes to view two different scenes: Sales and Backlog.
✔Insert a new scene and rename it Overview. See task #4 for details.
✔In the World Manager, click the Graphics tab to display the Primitives button.
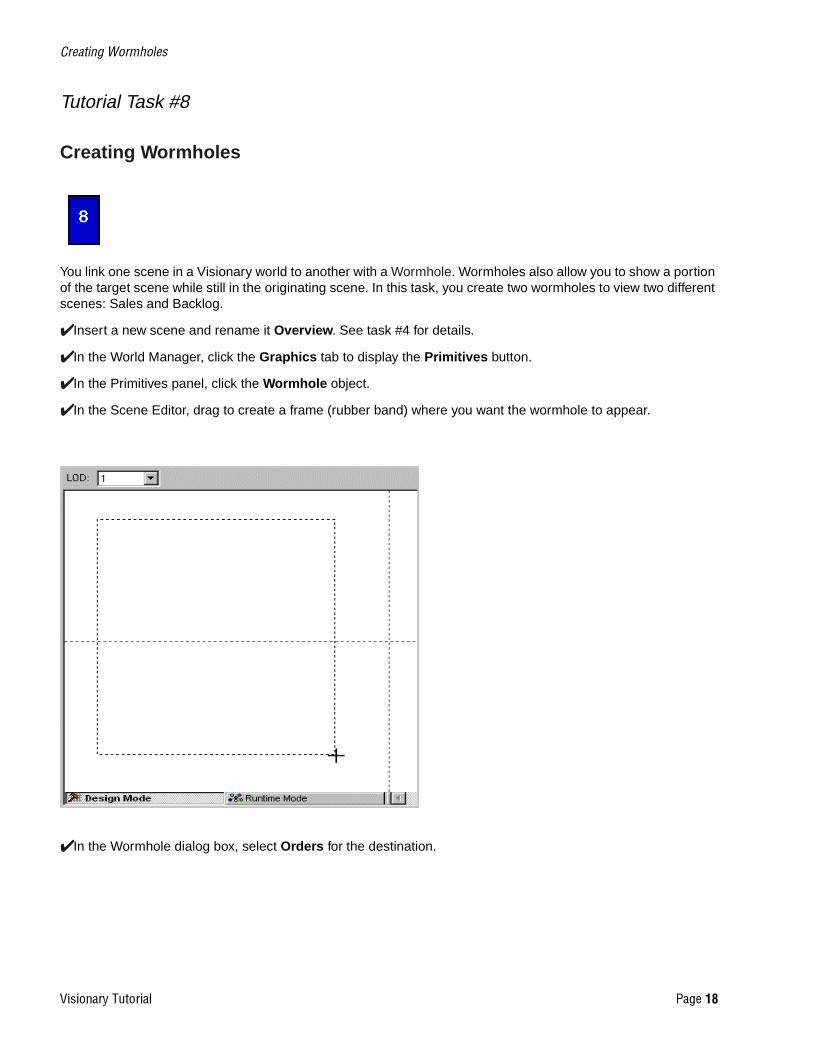
✔In the Primitives panel, click the Wormhole object.
✔In the Scene Editor, drag to create a frame (rubber band) where you want the wormhole to appear.
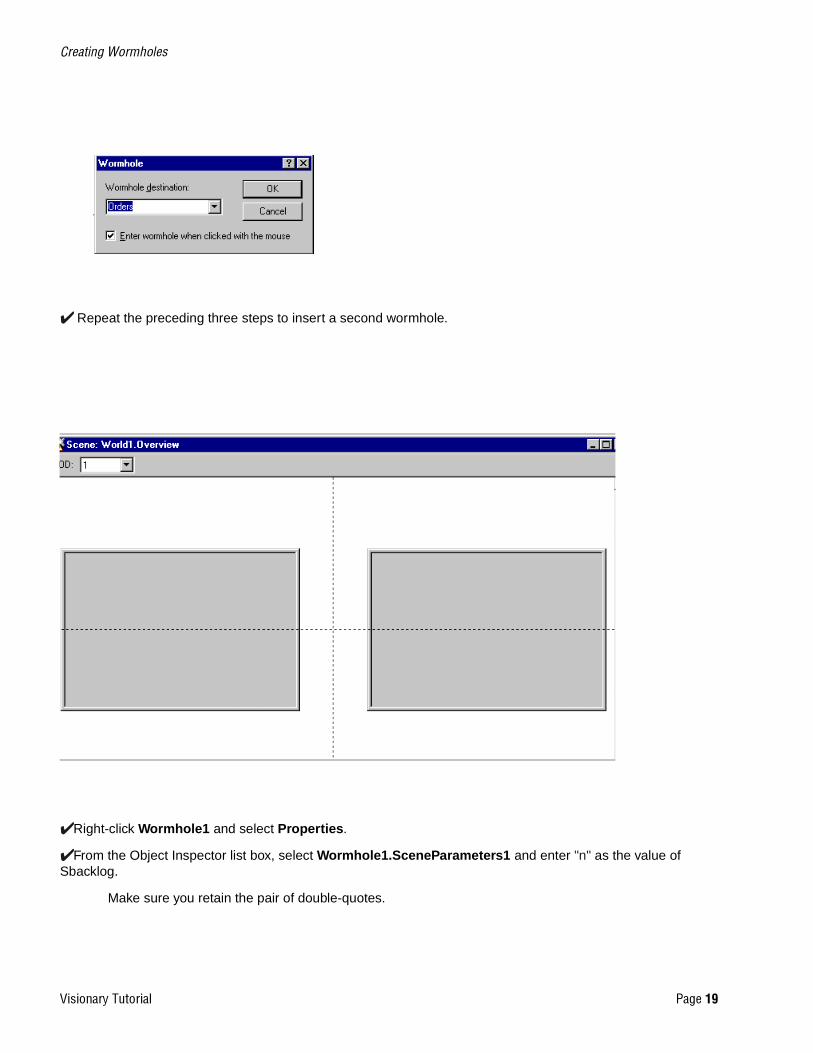
✔In the Wormhole dialog box, select Orders for the destination.
&UHDWLQJ�:RUPKROHV
9LVLRQDU\�7XWRULDO 3DJH���
✔ Repeat the preceding three steps to insert a second wormhole.
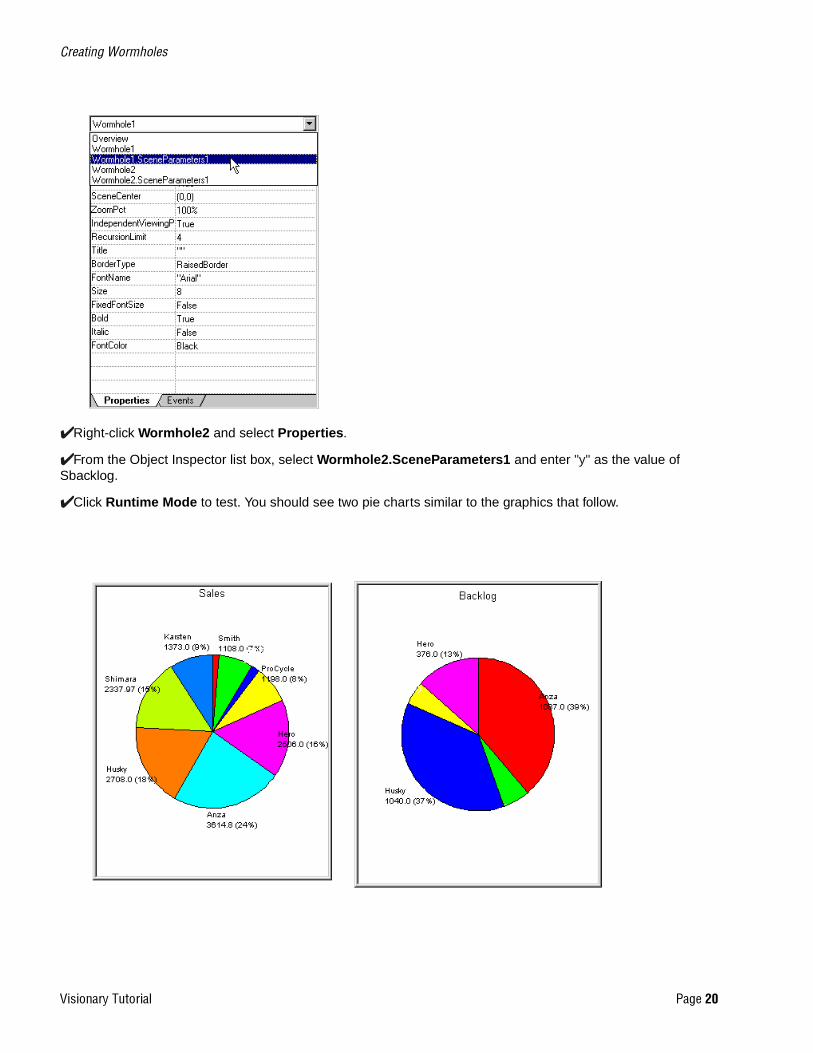
✔Right-click Wormhole1 and select Properties.
✔From the Object Inspector list box, select Wormhole1.SceneParameters1 and enter "n" as the value of Sbacklog.
Make sure you retain the pair of double-quotes.
&UHDWLQJ�:RUPKROHV
9LVLRQDU\�7XWRULDO 3DJH���
✔Right-click Wormhole2 and select Properties.
✔From the Object Inspector list box, select Wormhole2.SceneParameters1 and enter "y" as the value of Sbacklog.
✔Click Runtime Mode to test. You should see two pie charts similar to the graphics that follow.
&UHDWLQJ�D�3DUDPHWHUL]HG�4XHU\
9LVLRQDU\�7XWRULDO 3DJH���
Tutorial Task #9
Creating a Parameterized Query
In this task, you use the Query wizard to guide you in creating a parameterized query. You join tables and filter output to create a more advanced query than in tutorial task #3.
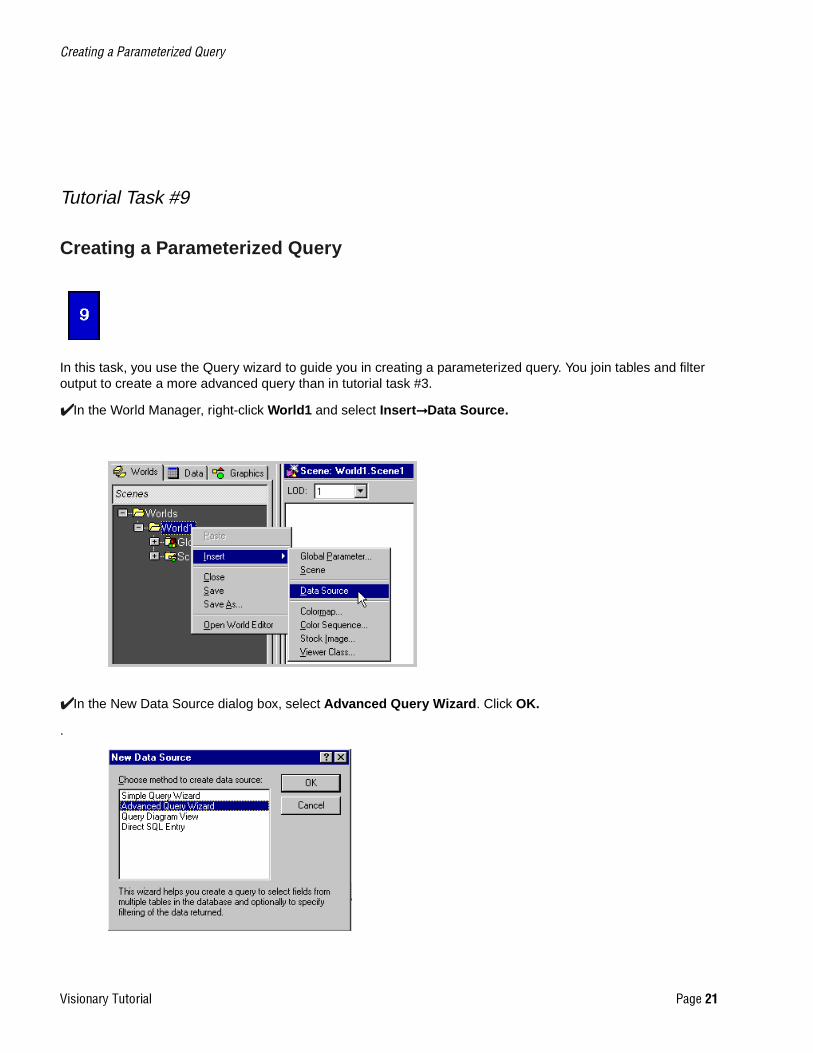
✔In the World Manager, right-click World1 and select Insert➞Data Source.
✔In the New Data Source dialog box, select Advanced Query Wizard. Click OK.
.
&UHDWLQJ�D�3DUDPHWHUL]HG�4XHU\
9LVLRQDU\�7XWRULDO 3DJH���
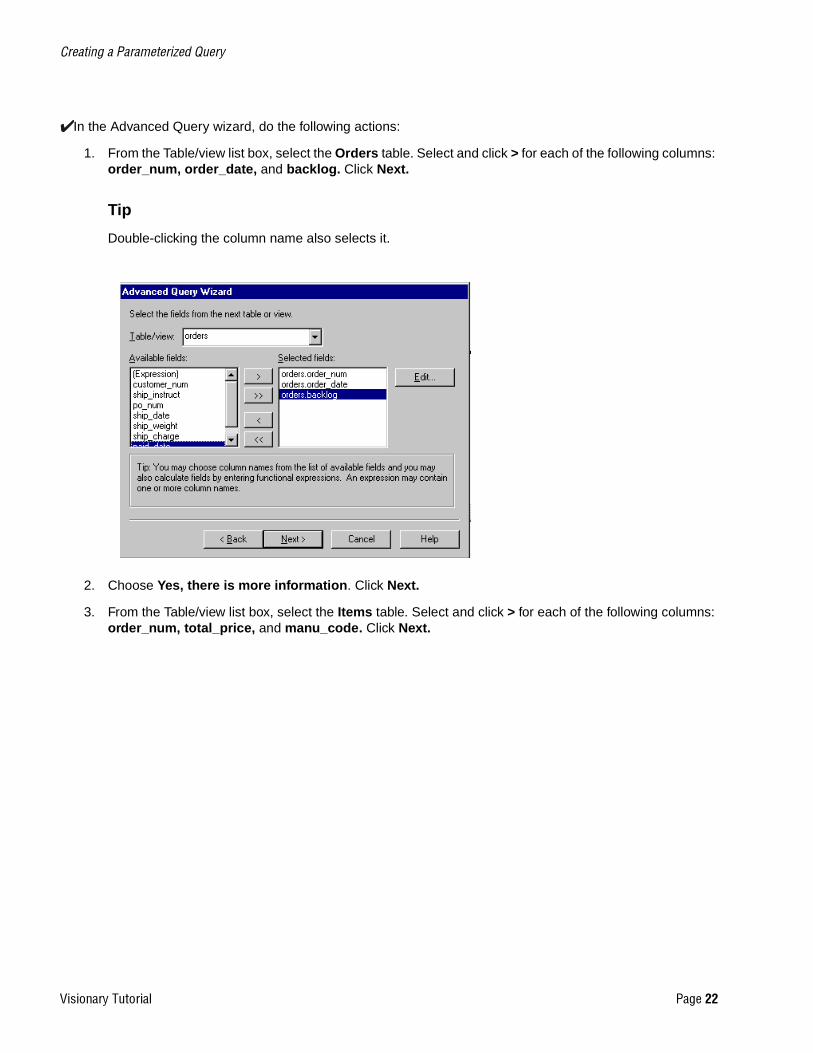
✔In the Advanced Query wizard, do the following actions:
1. From the Table/view list box, select the Orders table. Select and click > for each of the following columns: order_num, order_date, and backlog. Click Next.
Tip
Double-clicking the column name also selects it.
2. Choose Yes, there is more information. Click Next.
3. From the Table/view list box, select the Items table. Select and click > for each of the following columns: order_num, total_price, and manu_code. Click Next.
&UHDWLQJ�D�3DUDPHWHUL]HG�4XHU\
9LVLRQDU\�7XWRULDO 3DJH���
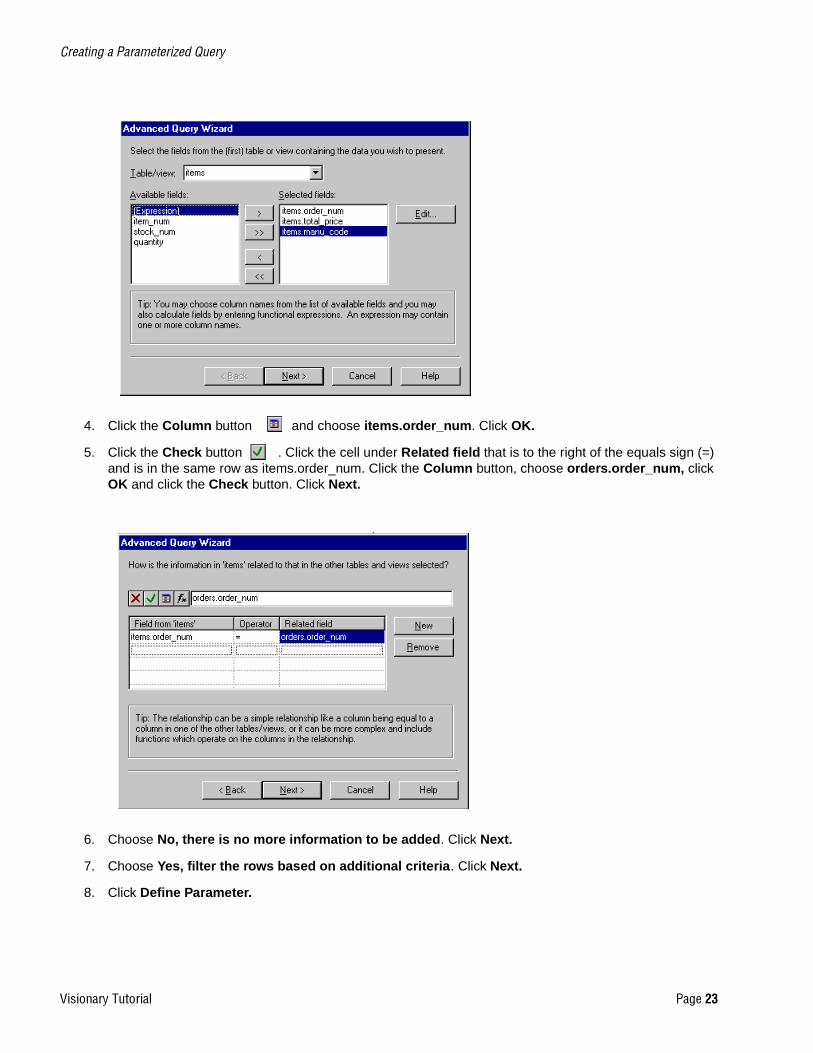
4. Click the Column button and choose items.order_num. Click OK.
5. Click the Check button . Click the cell under Related field that is to the right of the equals sign (=) and is in the same row as items.order_num. Click the Column button, choose orders.order_num, click OK and click the Check button. Click Next.
6. Choose No, there is no more information to be added. Click Next.
7. Choose Yes, filter the rows based on additional criteria. Click Next.
8. Click Define Parameter.
&UHDWLQJ�D�3DUDPHWHUL]HG�4XHU\
9LVLRQDU\�7XWRULDO 3DJH���
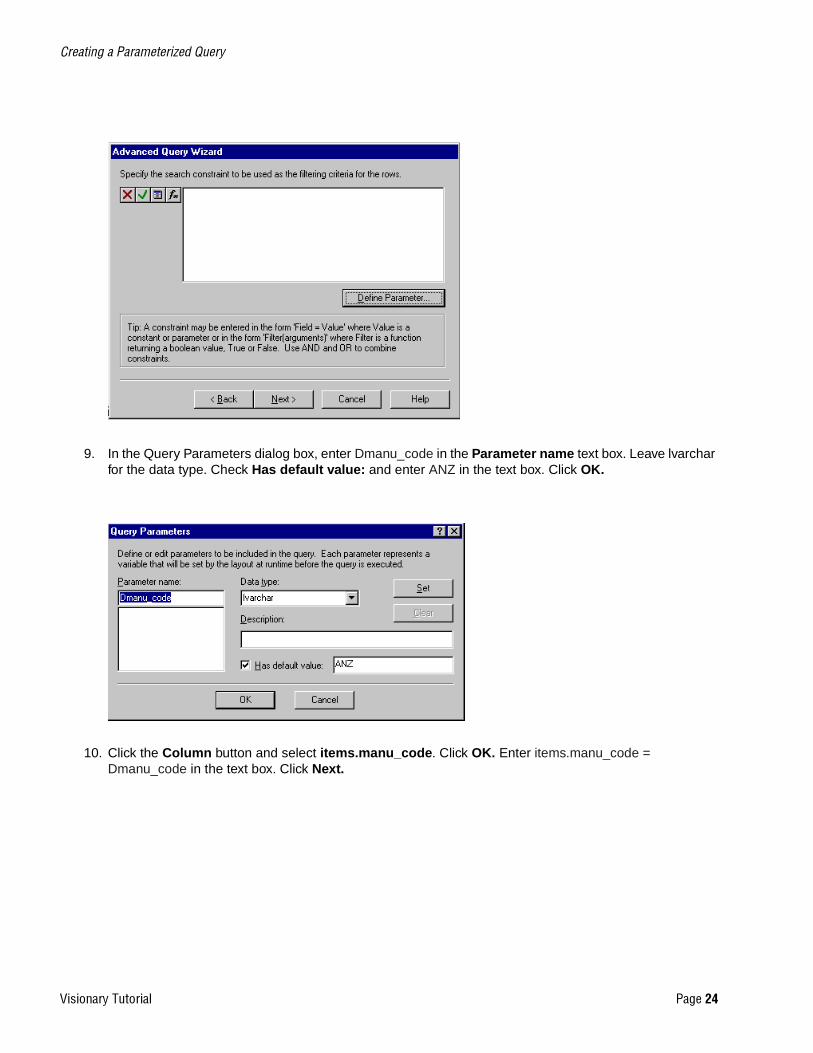
9. In the Query Parameters dialog box, enter Dmanu_code in the Parameter name text box. Leave lvarchar for the data type. Check Has default value: and enter ANZ in the text box. Click OK.
10. Click the Column button and select items.manu_code. Click OK. Enter items.manu_code = Dmanu_code in the text box. Click Next.
&UHDWLQJ�D�3DUDPHWHUL]HG�4XHU\
9LVLRQDU\�7XWRULDO 3DJH���
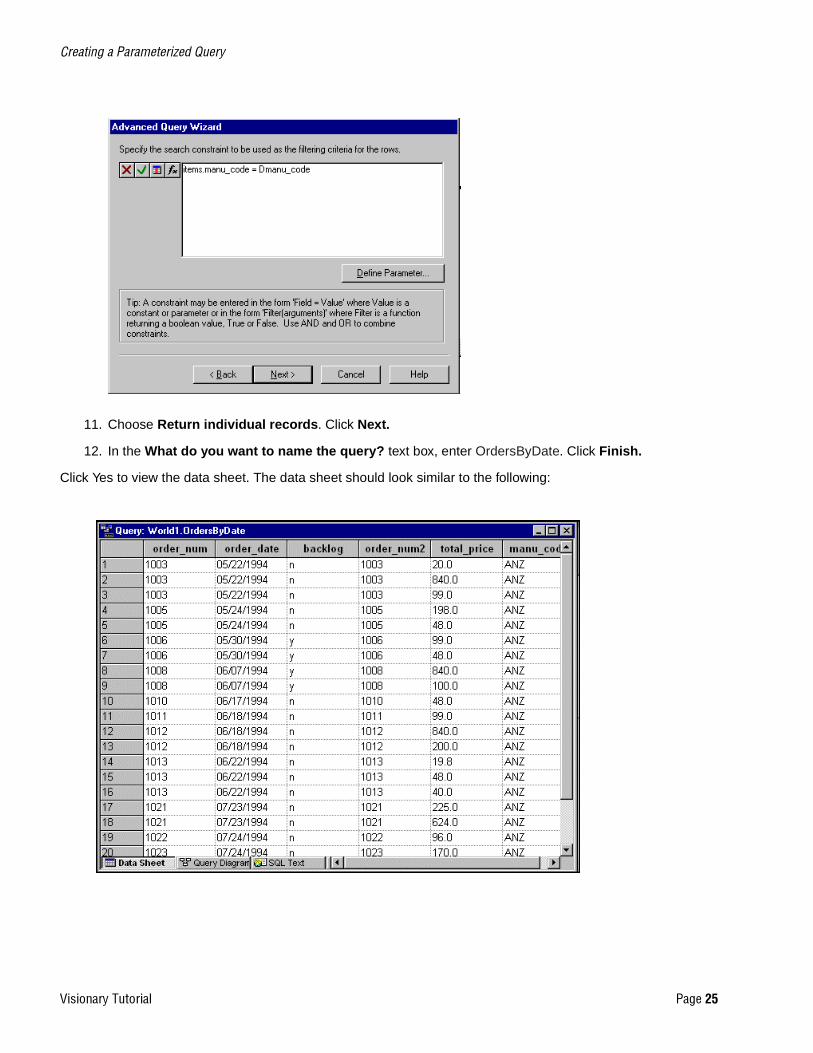
11. Choose Return individual records. Click Next.
12. In the What do you want to name the query? text box, enter OrdersByDate. Click Finish.
Click Yes to view the data sheet. The data sheet should look similar to the following:
$GGLQJ�6FHQH�3DUDPHWHUV
9LVLRQDU\�7XWRULDO 3DJH���
Tutorial Task #10
Adding Scene Parameters
You create a parameterized scene by mapping the scene to the data source that you created in Tutorial Task #9. You add scene parameters to show an individual manufacturer’s sales and backlog.
✔Insert a new scene and rename it OrdersByDate. See task #4 for details.
✔Click Graphics➞Layouts. Double-click Timeline Chart.
✔In the Layout wizard, select the OrdersByDate data source. Click Next.
✔Leave blank the list boxes that are displayed. Click Finish.
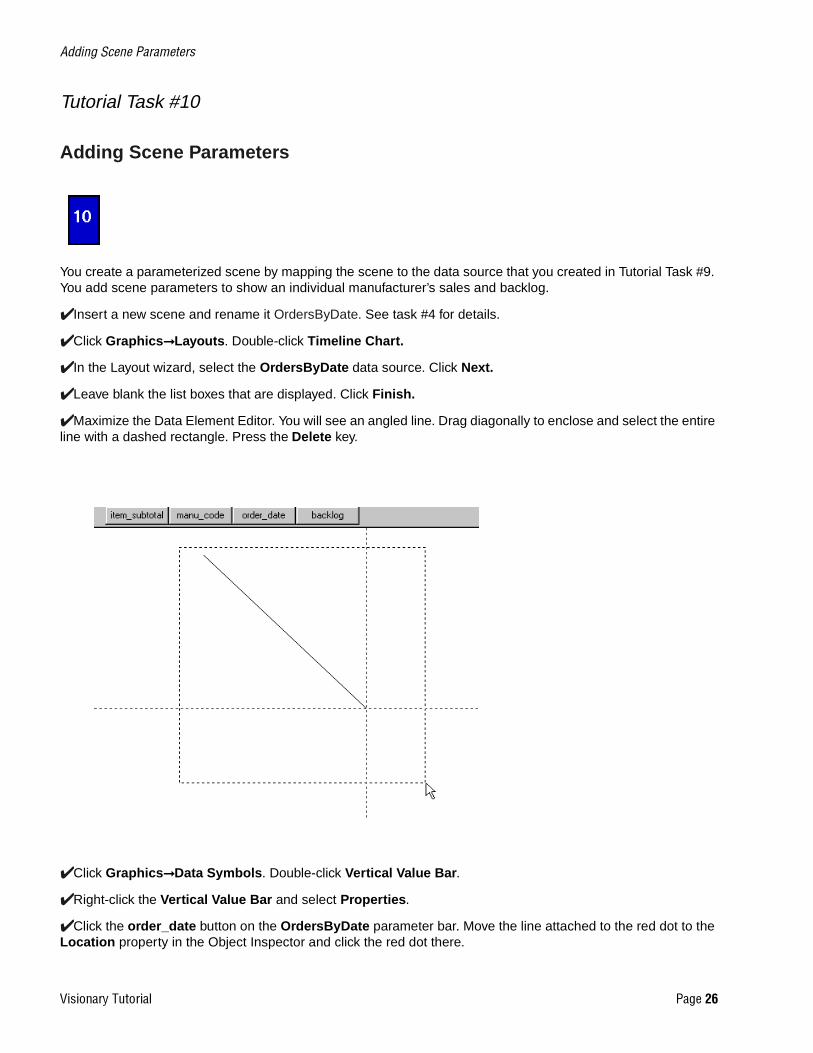
✔Maximize the Data Element Editor. You will see an angled line. Drag diagonally to enclose and select the entire line with a dashed rectangle. Press the Delete key.
✔Click Graphics➞Data Symbols. Double-click Vertical Value Bar.
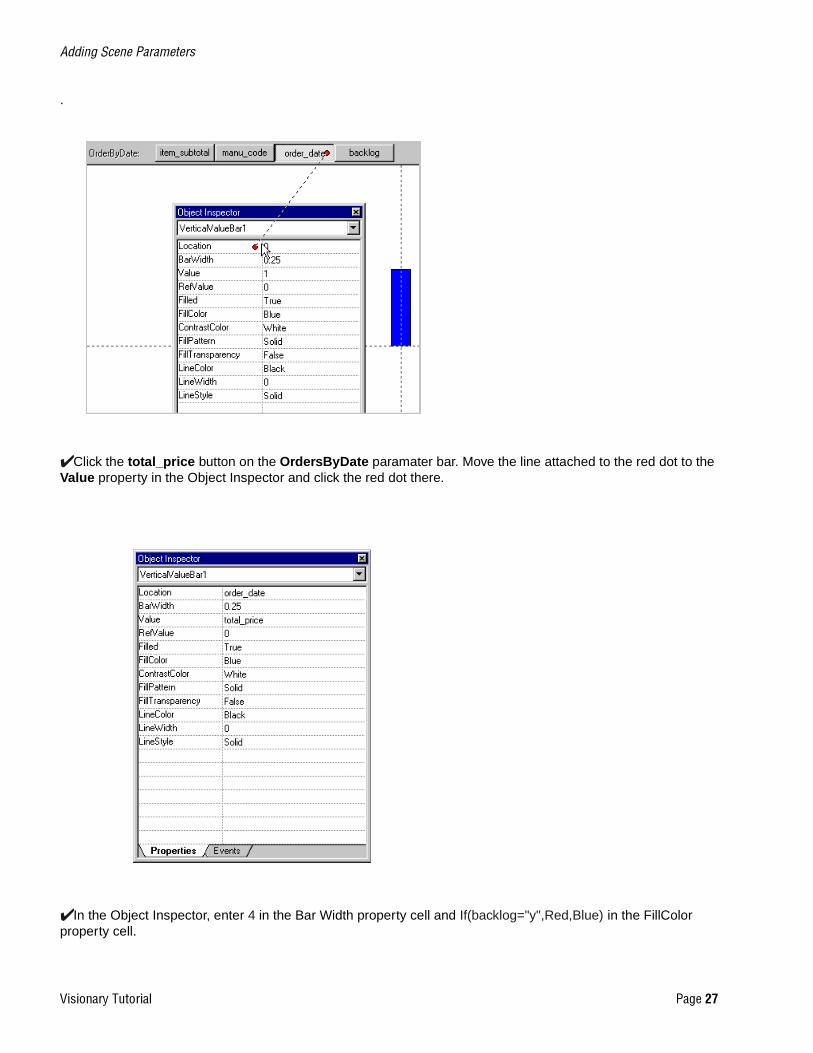
✔Right-click the Vertical Value Bar and select Properties.
✔Click the order_date button on the OrdersByDate parameter bar. Move the line attached to the red dot to the Location property in the Object Inspector and click the red dot there.
$GGLQJ�6FHQH�3DUDPHWHUV
9LVLRQDU\�7XWRULDO 3DJH���
.
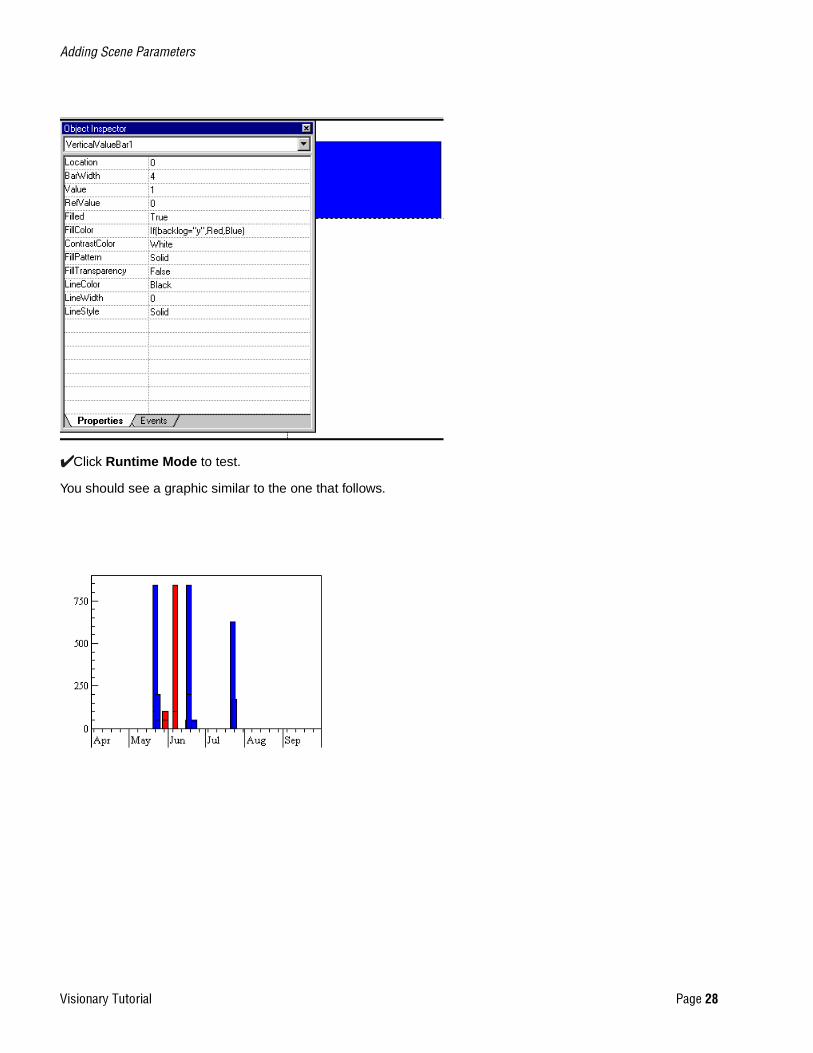
✔Click the total_price button on the OrdersByDate paramater bar. Move the line attached to the red dot to the Value property in the Object Inspector and click the red dot there.
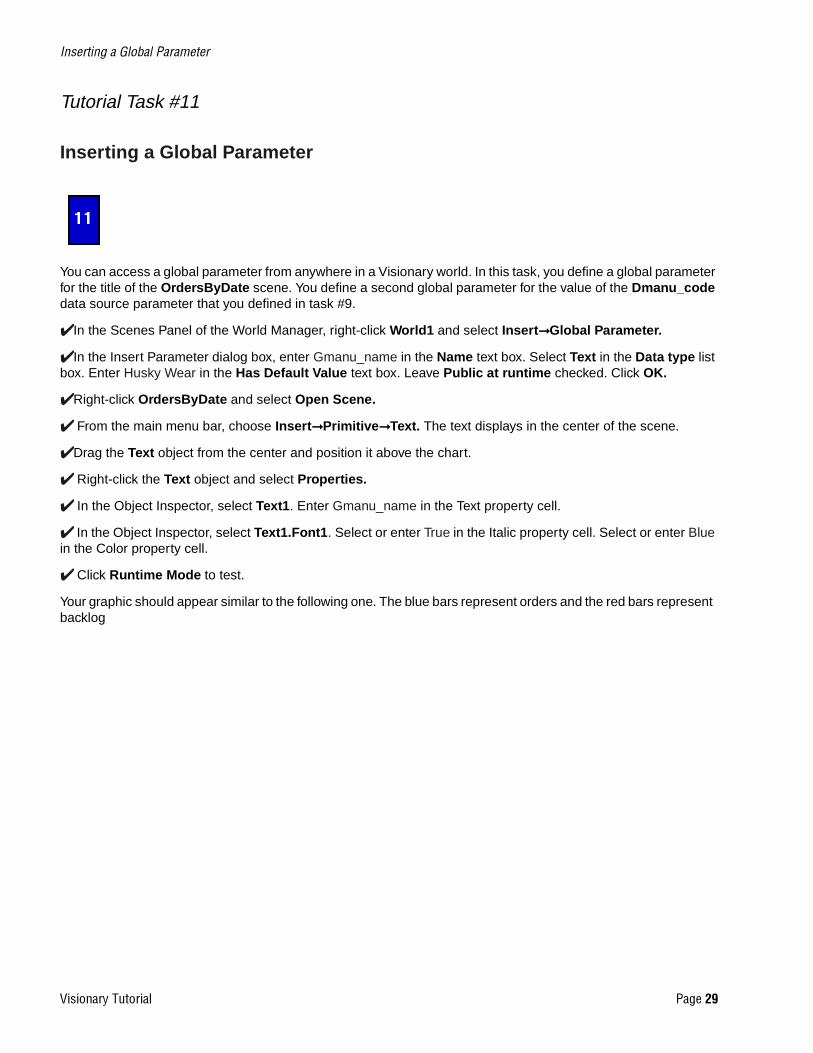
✔In the Object Inspector, enter 4 in the Bar Width property cell and If(backlog="y",Red,Blue) in the FillColor property cell.
$GGLQJ�6FHQH�3DUDPHWHUV
9LVLRQDU\�7XWRULDO 3DJH���
✔Click Runtime Mode to test.
You should see a graphic similar to the one that follows.
,QVHUWLQJ�D�*OREDO�3DUDPHWHU
9LVLRQDU\�7XWRULDO 3DJH���
Tutorial Task #11
Inserting a Global Parameter
You can access a global parameter from anywhere in a Visionary world. In this task, you define a global parameter for the title of the OrdersByDate scene. You define a second global parameter for the value of the Dmanu_code data source parameter that you defined in task #9.
✔In the Scenes Panel of the World Manager, right-click World1 and select Insert➞Global Parameter.
✔In the Insert Parameter dialog box, enter Gmanu_name in the Name text box. Select Text in the Data type list box. Enter Husky Wear in the Has Default Value text box. Leave Public at runtime checked. Click OK.
✔Right-click OrdersByDate and select Open Scene.
✔ From the main menu bar, choose Insert➞Primitive➞Text. The text displays in the center of the scene.
✔Drag the Text object from the center and position it above the chart.
✔ Right-click the Text object and select Properties.
✔ In the Object Inspector, select Text1. Enter Gmanu_name in the Text property cell.
✔ In the Object Inspector, select Text1.Font1. Select or enter True in the Italic property cell. Select or enter Blue in the Color property cell.
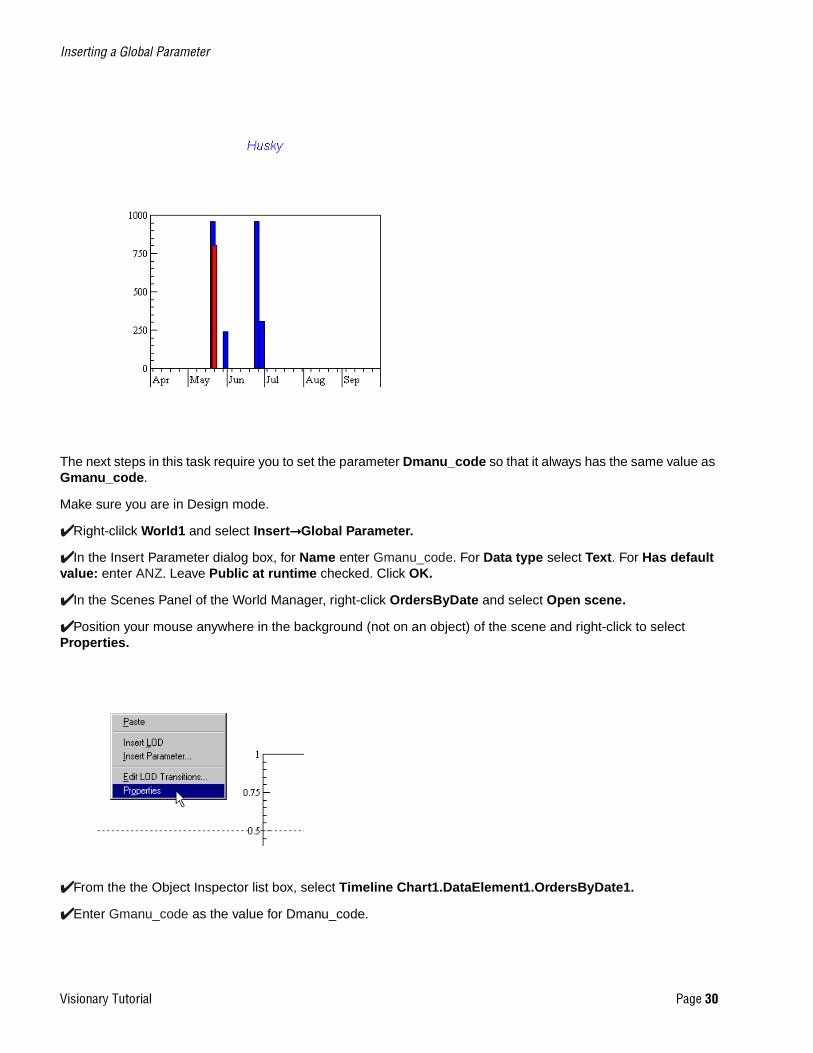
✔ Click Runtime Mode to test.
Your graphic should appear similar to the following one. The blue bars represent orders and the red bars represent backlog
,QVHUWLQJ�D�*OREDO�3DUDPHWHU
9LVLRQDU\�7XWRULDO 3DJH���
The next steps in this task require you to set the parameter Dmanu_code so that it always has the same value as Gmanu_code.
Make sure you are in Design mode.
✔Right-clilck World1 and select Insert➞Global Parameter.
✔In the Insert Parameter dialog box, for Name enter Gmanu_code. For Data type select Text. For Has default value: enter ANZ. Leave Public at runtime checked. Click OK.
✔In the Scenes Panel of the World Manager, right-click OrdersByDate and select Open scene.
✔Position your mouse anywhere in the background (not on an object) of the scene and right-click to select Properties.
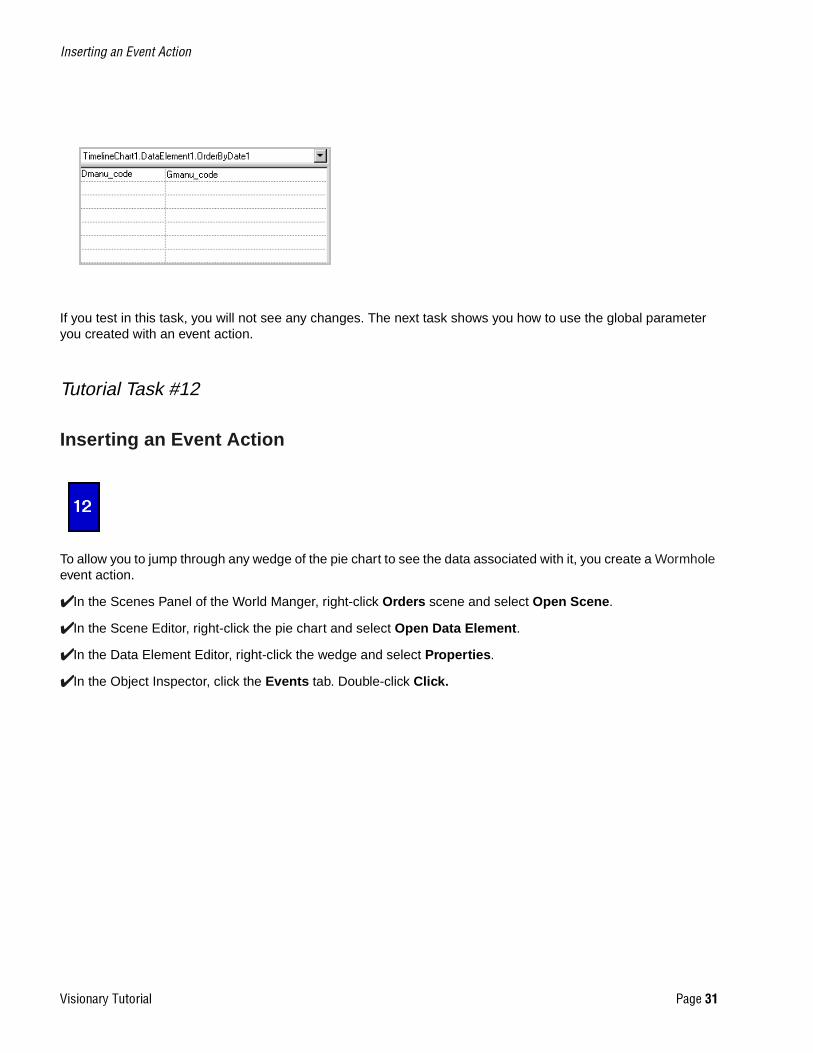
✔From the the Object Inspector list box, select Timeline Chart1.DataElement1.OrdersByDate1.
✔Enter Gmanu_code as the value for Dmanu_code.
,QVHUWLQJ�DQ�(YHQW�$FWLRQ
9LVLRQDU\�7XWRULDO 3DJH���
If you test in this task, you will not see any changes. The next task shows you how to use the global parameter you created with an event action.
Tutorial Task #12
Inserting an Event Action
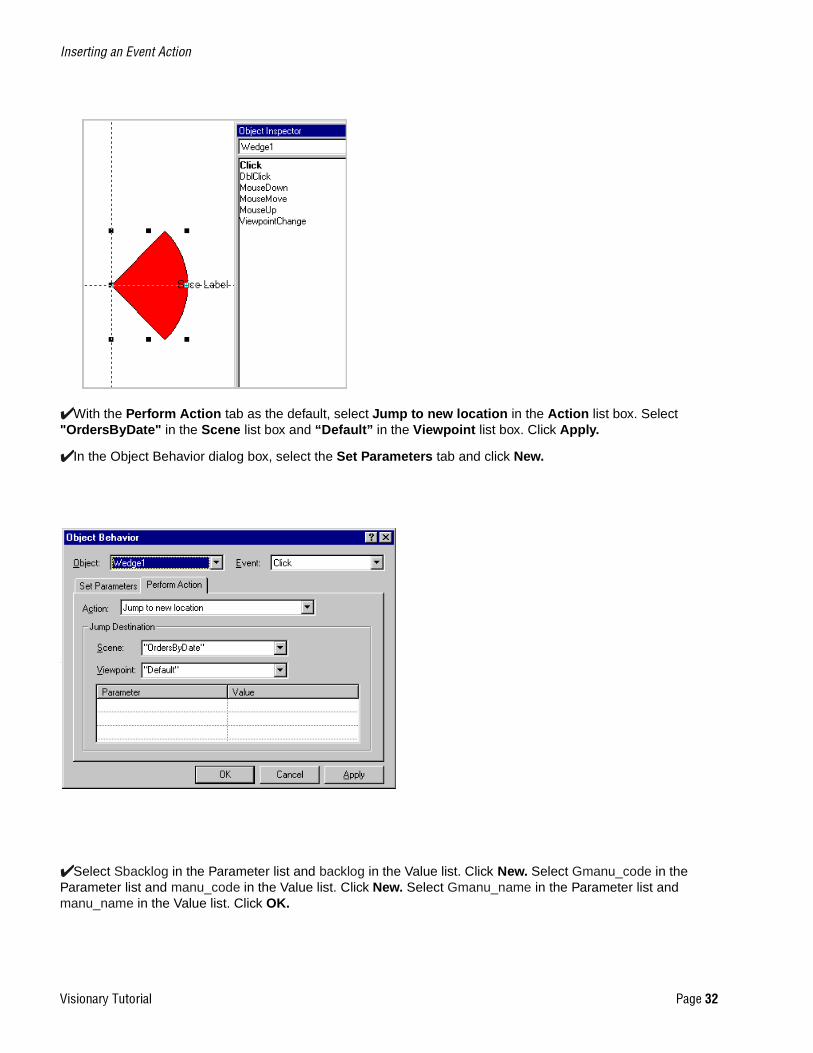
To allow you to jump through any wedge of the pie chart to see the data associated with it, you create a Wormhole event action.
✔In the Scenes Panel of the World Manger, right-click Orders scene and select Open Scene.
✔In the Scene Editor, right-click the pie chart and select Open Data Element.
✔In the Data Element Editor, right-click the wedge and select Properties.
✔In the Object Inspector, click the Events tab. Double-click Click.
,QVHUWLQJ�DQ�(YHQW�$FWLRQ
9LVLRQDU\�7XWRULDO 3DJH���
✔With the Perform Action tab as the default, select Jump to new location in the Action list box. Select "OrdersByDate" in the Scene list box and “Default” in the Viewpoint list box. Click Apply.
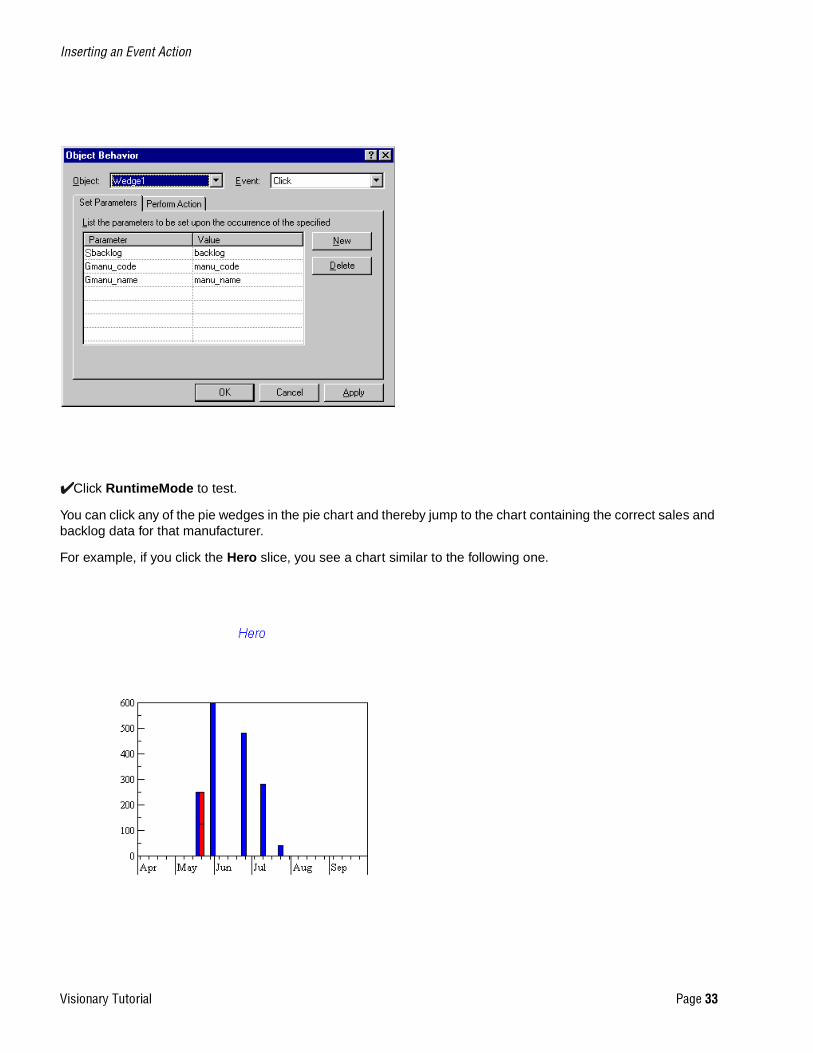
✔In the Object Behavior dialog box, select the Set Parameters tab and click New.
✔Select Sbacklog in the Parameter list and backlog in the Value list. Click New. Select Gmanu_code in the Parameter list and manu_code in the Value list. Click New. Select Gmanu_name in the Parameter list and manu_name in the Value list. Click OK.
,QVHUWLQJ�DQ�(YHQW�$FWLRQ
9LVLRQDU\�7XWRULDO 3DJH���
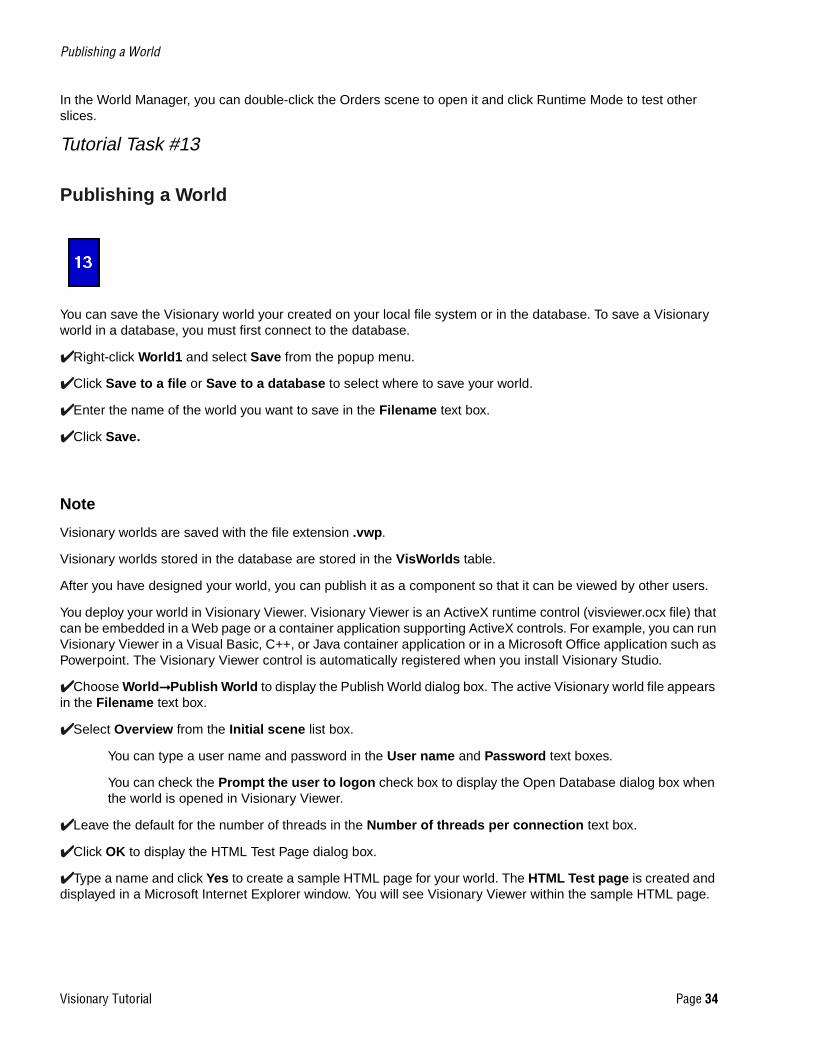
✔Click RuntimeMode to test.
You can click any of the pie wedges in the pie chart and thereby jump to the chart containing the correct sales and backlog data for that manufacturer.
For example, if you click the Hero slice, you see a chart similar to the following one.
3XEOLVKLQJ�D�:RUOG
9LVLRQDU\�7XWRULDO 3DJH���
In the World Manager, you can double-click the Orders scene to open it and click Runtime Mode to test other slices.
Tutorial Task #13
Publishing a World
You can save the Visionary world your created on your local file system or in the database. To save a Visionary world in a database, you must first connect to the database.
✔Right-click World1 and select Save from the popup menu.
✔Click Save to a file or Save to a database to select where to save your world.
✔Enter the name of the world you want to save in the Filename text box.
✔Click Save.
Note
Visionary worlds are saved with the file extension .vwp.
Visionary worlds stored in the database are stored in the VisWorlds table.
After you have designed your world, you can publish it as a component so that it can be viewed by other users.
You deploy your world in Visionary Viewer. Visionary Viewer is an ActiveX runtime control (visviewer.ocx file) that can be embedded in a Web page or a container application supporting ActiveX controls. For example, you can run Visionary Viewer in a Visual Basic, C++, or Java container application or in a Microsoft Office application such as Powerpoint. The Visionary Viewer control is automatically registered when you install Visionary Studio.
✔Choose World➞Publish World to display the Publish World dialog box. The active Visionary world file appears in the Filename text box.
✔Select Overview from the Initial scene list box.
You can type a user name and password in the User name and Password text boxes.
You can check the Prompt the user to logon check box to display the Open Database dialog box when the world is opened in Visionary Viewer.
✔Leave the default for the number of threads in the Number of threads per connection text box.
✔Click OK to display the HTML Test Page dialog box.
✔Type a name and click Yes to create a sample HTML page for your world. The HTML Test page is created and displayed in a Microsoft Internet Explorer window. You will see Visionary Viewer within the sample HTML page.