Embed Size (px)
Citation preview

FY 2019 Quarter 3 Report
Behind-the-Meter Storage
Behind-the-Meter Storage
Anthony Burrell National Renewable Energy Laboratory 15013 Denver West Parkway Golden, CO 80401 Phone: (303) 384-6666 E-mail: [email protected]
Samuel Gillard, DOE-EERE-VTO Technology Manager, Battery R&D Phone: (202) 287-5849 E-mail: [email protected] Start Date: 1 October 2018 End Date: 30 September 2022 Project Funding (FY18): $2,200K DOE share: $2,200K Non-DOE share: $0
Project Introduction This initiative, referred to as Behind-the-Meter-Storage (BTMS), will focus on novel critical-materials-free battery technologies to facilitate the integration of electric vehicle (EV) charging, solar power generation technologies, and energy-efficient buildings while minimizing both costs and grid impacts. For extreme fast-charging at levels of 350 kW or higher, novel approaches are required to avoid significant negative cost and resiliency impacts. However, it is reasonable to assume that BTMS solutions would be applicable to other intermittent renewable energy generation sources or short-duration, high power-demand electric loads. BTMS research is targeted at developing innovative energy-storage technology specifically optimized for stationary applications below 10 MWh that will minimize the need for significant grid upgrades. Additionally, avoiding excessive high-power draws will eliminate excess demand charges that would be incurred during 350-kW fast-charging using current technologies. The key to achieving this is to leverage battery storage solutions that can discharge at high power but be recharged at standard lower power rates, acting as a power reservoir to bridge to the grid and other on-site energy generation technologies such as solar photovoltaics (PV), thereby minimizing costs and grid impacts. To be successful, new and innovative integration treatments must be developed for seamless interaction between stationary storage, PV generation, building systems, and the electric grid.
Key components of BTMS will address early-stage research into new energy-generation and building-integration concepts, critical-materials-free battery energy-storage chemistries, and energy-storage designs with a focus on new stationary energy-storage strategies that will balance performance and costs for expanded fast-charging networks while minimizing the need for grid improvements.
2 Behind-the-Meter Storage
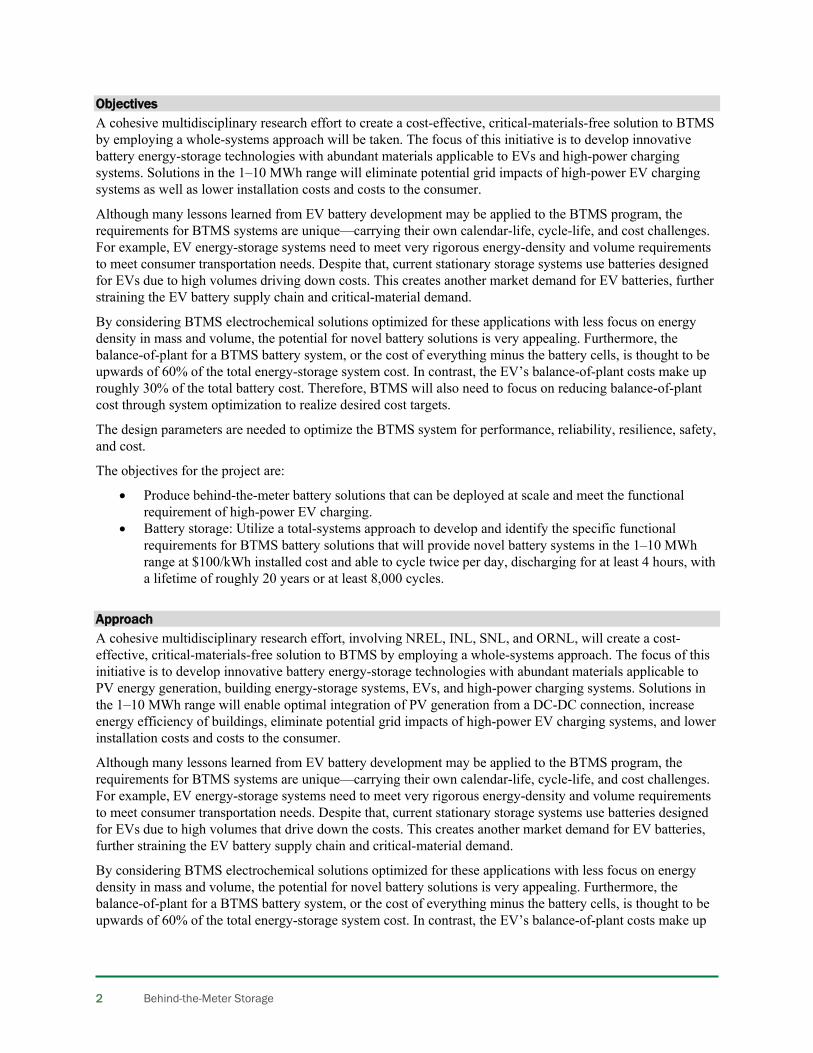
Objectives A cohesive multidisciplinary research effort to create a cost-effective, critical-materials-free solution to BTMS by employing a whole-systems approach will be taken. The focus of this initiative is to develop innovative battery energy-storage technologies with abundant materials applicable to EVs and high-power charging systems. Solutions in the 1‒10 MWh range will eliminate potential grid impacts of high-power EV charging systems as well as lower installation costs and costs to the consumer.
Although many lessons learned from EV battery development may be applied to the BTMS program, the requirements for BTMS systems are unique—carrying their own calendar-life, cycle-life, and cost challenges. For example, EV energy-storage systems need to meet very rigorous energy-density and volume requirements to meet consumer transportation needs. Despite that, current stationary storage systems use batteries designed for EVs due to high volumes driving down costs. This creates another market demand for EV batteries, further straining the EV battery supply chain and critical-material demand.
By considering BTMS electrochemical solutions optimized for these applications with less focus on energy density in mass and volume, the potential for novel battery solutions is very appealing. Furthermore, the balance-of-plant for a BTMS battery system, or the cost of everything minus the battery cells, is thought to be upwards of 60% of the total energy-storage system cost. In contrast, the EV’s balance-of-plant costs make up roughly 30% of the total battery cost. Therefore, BTMS will also need to focus on reducing balance-of-plant cost through system optimization to realize desired cost targets.
The design parameters are needed to optimize the BTMS system for performance, reliability, resilience, safety, and cost.
The objectives for the project are:
• Produce behind-the-meter battery solutions that can be deployed at scale and meet the functional requirement of high-power EV charging.
• Battery storage: Utilize a total-systems approach to develop and identify the specific functional requirements for BTMS battery solutions that will provide novel battery systems in the 1‒10 MWh range at $100/kWh installed cost and able to cycle twice per day, discharging for at least 4 hours, with a lifetime of roughly 20 years or at least 8,000 cycles.
Approach A cohesive multidisciplinary research effort, involving NREL, INL, SNL, and ORNL, will create a cost-effective, critical-materials-free solution to BTMS by employing a whole-systems approach. The focus of this initiative is to develop innovative battery energy-storage technologies with abundant materials applicable to PV energy generation, building energy-storage systems, EVs, and high-power charging systems. Solutions in the 1‒10 MWh range will enable optimal integration of PV generation from a DC-DC connection, increase energy efficiency of buildings, eliminate potential grid impacts of high-power EV charging systems, and lower installation costs and costs to the consumer.
Although many lessons learned from EV battery development may be applied to the BTMS program, the requirements for BTMS systems are unique—carrying their own calendar-life, cycle-life, and cost challenges. For example, EV energy-storage systems need to meet very rigorous energy-density and volume requirements to meet consumer transportation needs. Despite that, current stationary storage systems use batteries designed for EVs due to high volumes that drive down the costs. This creates another market demand for EV batteries, further straining the EV battery supply chain and critical-material demand.
By considering BTMS electrochemical solutions optimized for these applications with less focus on energy density in mass and volume, the potential for novel battery solutions is very appealing. Furthermore, the balance-of-plant for a BTMS battery system, or the cost of everything minus the battery cells, is thought to be upwards of 60% of the total energy-storage system cost. In contrast, the EV’s balance-of-plant costs make up
FY 2019 Quarter 3 Report
Behind-the-Meter Storage
roughly 30% of the total battery cost. Therefore, BTMS will also need to focus on reducing balance-of-plant cost through system optimization to realize desired cost targets.
Integration of battery storage with PV generation, energy-efficient buildings, charging stations, and the electric grid will enable new and innovative control strategies. The design parameters are needed to optimize the BTMS system for performance, reliability, resilience, safety, and cost.
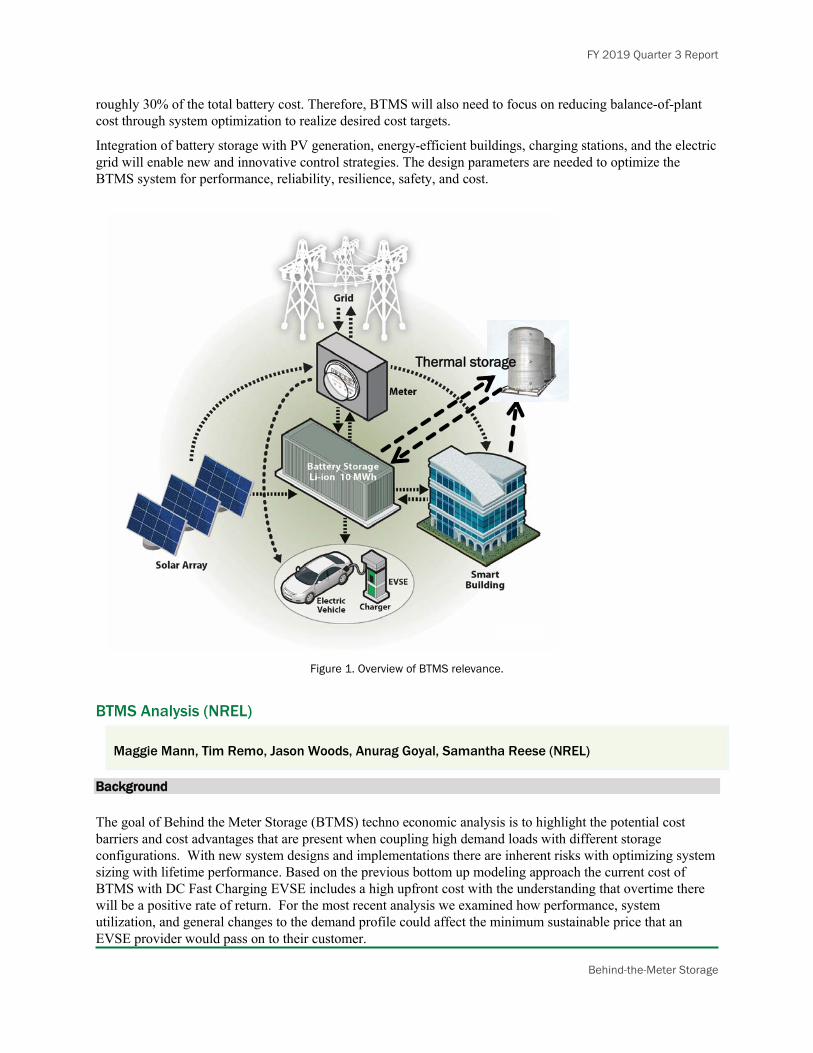
Figure 1. Overview of BTMS relevance.
BTMS Analysis (NREL)
Maggie Mann, Tim Remo, Jason Woods, Anurag Goyal, Samantha Reese (NREL)
Background The goal of Behind the Meter Storage (BTMS) techno economic analysis is to highlight the potential cost barriers and cost advantages that are present when coupling high demand loads with different storage configurations. With new system designs and implementations there are inherent risks with optimizing system sizing with lifetime performance. Based on the previous bottom up modeling approach the current cost of BTMS with DC Fast Charging EVSE includes a high upfront cost with the understanding that overtime there will be a positive rate of return. For the most recent analysis we examined how performance, system utilization, and general changes to the demand profile could affect the minimum sustainable price that an EVSE provider would pass on to their customer.
Thermal storage
4 Behind-the-Meter Storage
Results Discussion Points • Seasonal • Capacity • Changes in demand profile overtime • Lifetime • Differed interconnect charges
For this analysis the general benchmark configuration of a DC fast charging station was used. The targeted technology milestones and general model assumptions are listed in below.
– System • 20-year operating lifetime • 90% Round Trip Efficiency • Benchmark demand profile
– EVSE Charger Configuration • 6 Individual Charging Stalls • Rated at 350 KW Power
– Behind the Meter Storage • Li Ion Battery pack • 5MWh Capacity • 90% Depth of discharge • 1 charge and discharge cycle per day • $209 /kWh Battery Pack Costs
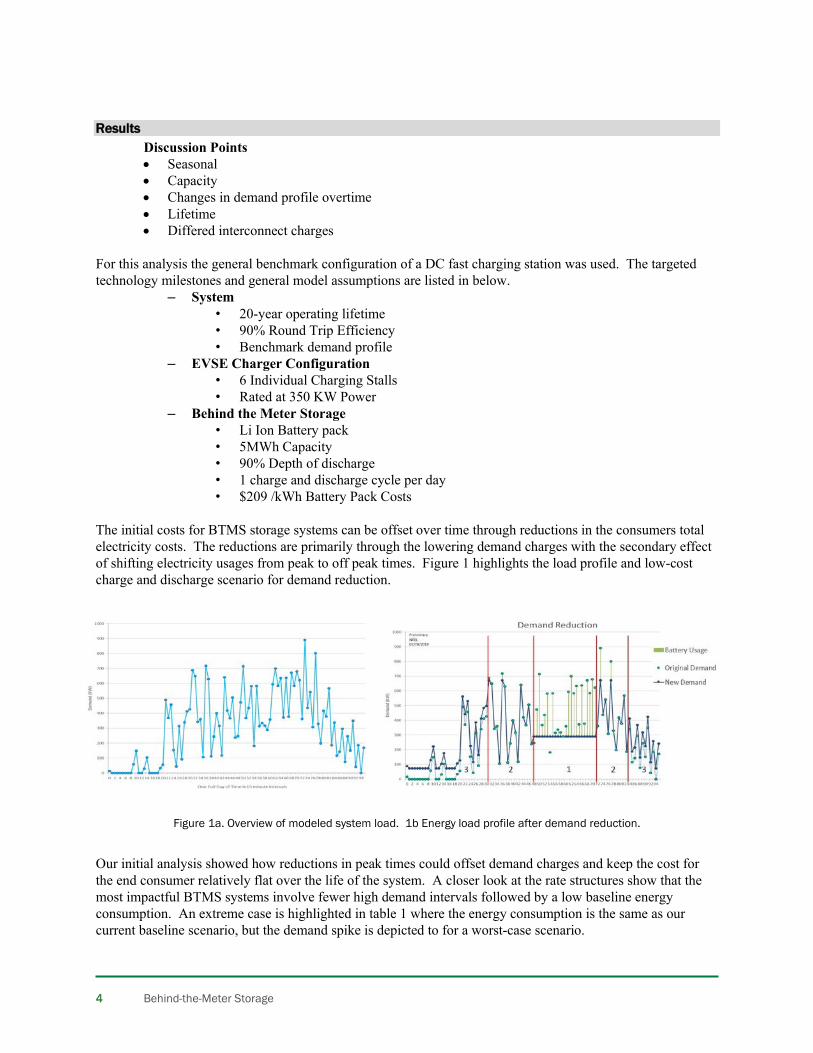
The initial costs for BTMS storage systems can be offset over time through reductions in the consumers total electricity costs. The reductions are primarily through the lowering demand charges with the secondary effect of shifting electricity usages from peak to off peak times. Figure 1 highlights the load profile and low-cost charge and discharge scenario for demand reduction.
Figure 1a. Overview of modeled system load. 1b Energy load profile after demand reduction.
Our initial analysis showed how reductions in peak times could offset demand charges and keep the cost for the end consumer relatively flat over the life of the system. A closer look at the rate structures show that the most impactful BTMS systems involve fewer high demand intervals followed by a low baseline energy consumption. An extreme case is highlighted in table 1 where the energy consumption is the same as our current baseline scenario, but the demand spike is depicted to for a worst-case scenario.

FY 2019 Quarter 3 Report
Behind-the-Meter Storage
Summer
Standard Scenario (Monthly Values) EVSE Only EVSE+BTMS
Fixed Charge (Total) $ 1,499 1% $ 1,499 5%
Energy Charge (Total) $ 25,112 9% $ 23,131 78% Demand Charge (Period 1) $ 246,986 90% $ 3,815 13% Demand Charge (Period 2) $ 1,008 0% $ 1,008 3% Demand Charge (Period 3) $ 24 0% $ 59 0% Demand Charge (Total) $ 248,019 90% $ 4,882 17%
Total Monthly Charge $ 274,629 100% $ 29,511 100% Cost of Electricity from Grid ($/kwh) $ 1.2221 $ 0.1245
MSP $ 1.5911 $ 0.2779
Table 1. Cost data for extreme demand scenario Systems that operator under highly variable demand loads scattered throughout a daily operation with a high average energy baseline loads require larger battery systems to impactfully reduce the total MSP. While these systems can still be economically viable over the life of the system, the high cost of the battery pack will cause the payback period to extend. This leads to concerns of longer system reliability requirements Seasonal charges will also contribute to how the battery will operate. In some cases, stand by or as a backup system may extend the life of the system. This is due in part to demand charges that only exist during the four to six-month summer periods. Listed in table 2 is one example displaying the large potential price difference in seasonal operations. As these systems become more standardized there is even the possibility that containerized systems could be considered mobile assets and moved from one location of value to higher location of value once or multiple times during its lifetime based on system economics. This would allow for more shorter positive payback periods over the assets usable life. Under the current design changing the operation usage for charging and discharging may extend the operating life.
6 Behind-the-Meter Storage
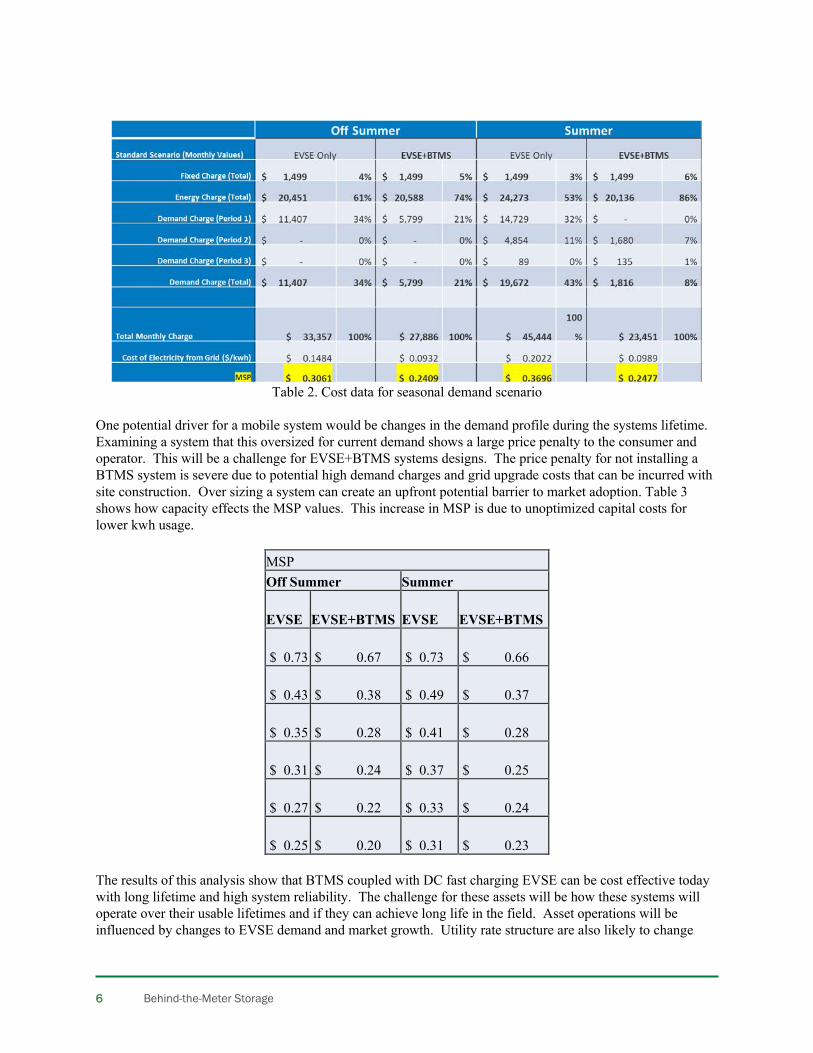
Table 2. Cost data for seasonal demand scenario One potential driver for a mobile system would be changes in the demand profile during the systems lifetime. Examining a system that this oversized for current demand shows a large price penalty to the consumer and operator. This will be a challenge for EVSE+BTMS systems designs. The price penalty for not installing a BTMS system is severe due to potential high demand charges and grid upgrade costs that can be incurred with site construction. Over sizing a system can create an upfront potential barrier to market adoption. Table 3 shows how capacity effects the MSP values. This increase in MSP is due to unoptimized capital costs for lower kwh usage.
MSP Off Summer Summer
EVSE EVSE+BTMS EVSE EVSE+BTMS
$ 0.73 $ 0.67 $ 0.73 $ 0.66
$ 0.43 $ 0.38 $ 0.49 $ 0.37
$ 0.35 $ 0.28 $ 0.41 $ 0.28
$ 0.31 $ 0.24 $ 0.37 $ 0.25
$ 0.27 $ 0.22 $ 0.33 $ 0.24
$ 0.25 $ 0.20 $ 0.31 $ 0.23 The results of this analysis show that BTMS coupled with DC fast charging EVSE can be cost effective today with long lifetime and high system reliability. The challenge for these assets will be how these systems will operate over their usable lifetimes and if they can achieve long life in the field. Asset operations will be influenced by changes to EVSE demand and market growth. Utility rate structure are also likely to change

FY 2019 Quarter 3 Report
Behind-the-Meter Storage
over time which will also impact this marketplace. Designing systems that are easily scalable, portable, and upgradeable have the potential to provide long term profitability for these assets.
Conclusions The rate structure, load profile, and system operating capacity are three of the most significant drivers to optimizing the BTMS system configuration and therefore planning for the lowest MSP value. While DC fast charging without storage has the potential to significantly increase the customers average MSP for electricity by an order of magnitude simply adding storage will not reduce the cost back into 0.10-0.20 $/kwh range. This is because the capital cost for these storage systems is significant between 300-500 $/kwh. Research advancements to reduce battery cell and BOS costs can reduce the upfront costs for BTMS with EVSE. Results-to-date indicate that BTMS by itself can significantly impact demand charges but in general will have only a small impact on shifting the energy charges. Adding distributed generation with renewables could future reduce long term energy costs for the consumer by not only shifting electricity rates from peak to off peak timeframes but reducing the total amount of energy pulled from the grid.
8 Behind-the-Meter Storage
Behind The Meter System (Oak Ridge National Lab)
Contributors (Oak Ridge National Lab) [Madhu Chinthavali, Pankaj Bhowmik, Ilias Belharouak]
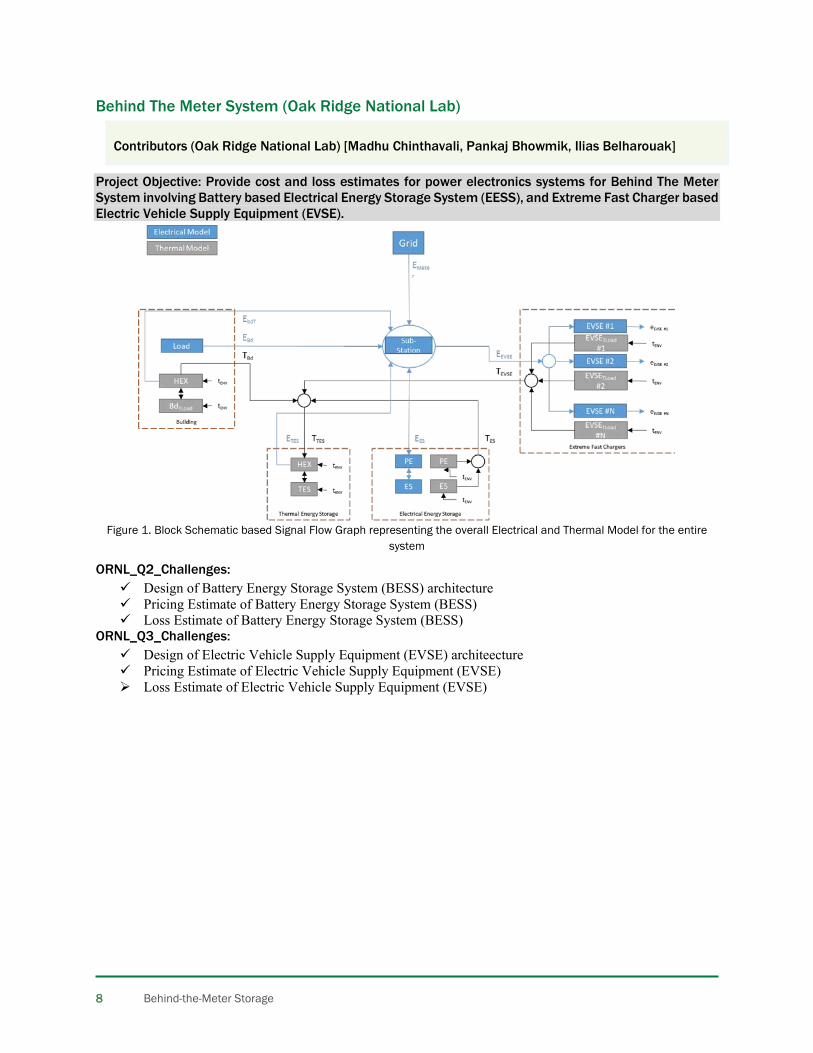
Project Objective: Provide cost and loss estimates for power electronics systems for Behind The Meter System involving Battery based Electrical Energy Storage System (EESS), and Extreme Fast Charger based Electric Vehicle Supply Equipment (EVSE).
Figure 1. Block Schematic based Signal Flow Graph representing the overall Electrical and Thermal Model for the entire
system
ORNL_Q2_Challenges: Design of Battery Energy Storage System (BESS) architecture Pricing Estimate of Battery Energy Storage System (BESS) Loss Estimate of Battery Energy Storage System (BESS)
ORNL_Q3_Challenges: Design of Electric Vehicle Supply Equipment (EVSE) architeecture Pricing Estimate of Electric Vehicle Supply Equipment (EVSE) Loss Estimate of Electric Vehicle Supply Equipment (EVSE)
FY 2019 Quarter 3 Report
Behind-the-Meter Storage
ORNL_Q3_Task_Background: An installation-oriented Design of an Electric Vehicle Supply Equipment (EVSE) may be subdivided into two major design items, which are as follows:
1. Electric Vehicle (EV) Load 2. Power Electronics (PE)
The design of the Power Electronics (PE) that has to be installed to supply power to an EV load from the grid is discussed in this report. It may be seen that the design of PE has certain aspects that has to be performed alongside the determination of the nature of EV Load. Here, we are considering EV Extra Fast Charging stations. These installation design aspects are also reviewed in this chapter. This chapter also presents an estimate of the costs and losses associated with the design of an EVSE.
EVBMS
EVBMS
EVBMS
EV Load
Grounding Setup
( as desired)
External Fuses
(as designed)
Low Voltage Contactor
Power Conversion Stage
Low Voltage Breaker Inverter
Inverter Local Controller
Inverter Cooling
Inverter Sensing
Inverter Communications
Remote Monitoring
SCADA HMI
Remote Monitor and Control
EMS
Grounding Setup
( as desired)
External Fuses
(as designed)
Circuit Breaker
EVSE Grid N
etwork
Distribution Sub-Panel
Circuit Breaker
FusedDisconnect
Point Of Sale System
DC/DC Converter
Converter Local Controller
DC/DC Converter Cooling
Converter Sensing
Converter Communications
Step-Up Transformer
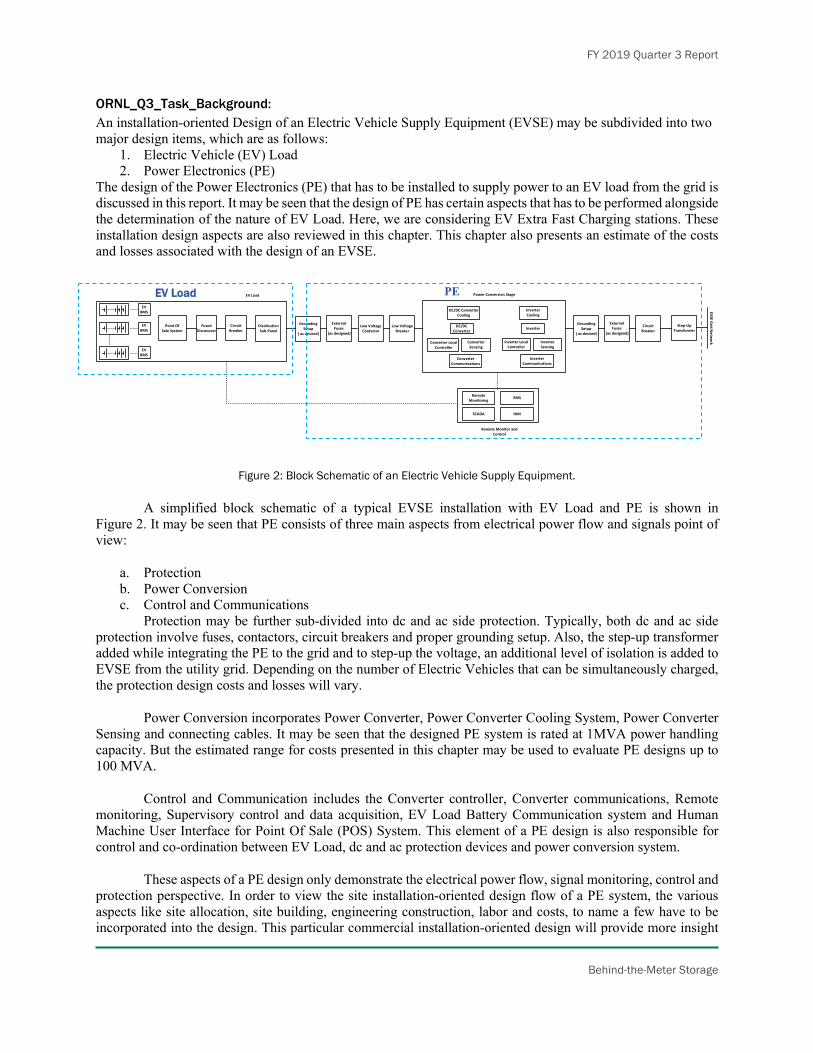
Figure 2: Block Schematic of an Electric Vehicle Supply Equipment.
A simplified block schematic of a typical EVSE installation with EV Load and PE is shown in Figure 2. It may be seen that PE consists of three main aspects from electrical power flow and signals point of view:
a. Protection b. Power Conversion c. Control and Communications
Protection may be further sub-divided into dc and ac side protection. Typically, both dc and ac side protection involve fuses, contactors, circuit breakers and proper grounding setup. Also, the step-up transformer added while integrating the PE to the grid and to step-up the voltage, an additional level of isolation is added to EVSE from the utility grid. Depending on the number of Electric Vehicles that can be simultaneously charged, the protection design costs and losses will vary.
Power Conversion incorporates Power Converter, Power Converter Cooling System, Power Converter Sensing and connecting cables. It may be seen that the designed PE system is rated at 1MVA power handling capacity. But the estimated range for costs presented in this chapter may be used to evaluate PE designs up to 100 MVA.
Control and Communication includes the Converter controller, Converter communications, Remote monitoring, Supervisory control and data acquisition, EV Load Battery Communication system and Human Machine User Interface for Point Of Sale (POS) System. This element of a PE design is also responsible for control and co-ordination between EV Load, dc and ac protection devices and power conversion system.
These aspects of a PE design only demonstrate the electrical power flow, signal monitoring, control and protection perspective. In order to view the site installation-oriented design flow of a PE system, the various aspects like site allocation, site building, engineering construction, labor and costs, to name a few have to be incorporated into the design. This particular commercial installation-oriented design will provide more insight
EV Load
PE

10 Behind-the-Meter Storage
into cost estimate and loss estimate for any proposed EVSE. The next section discusses this design flow for an EVSE system. The design considerations that will be used to estimate the costs and losses for an EVSE are presented in Table 1.
Table-1: Design Considerations for Cost and Thermal model of an EVSE Parameters Values Units
DC Bus Voltage 1500 V
DC Bus Current 1000 A
DC Bus Power 1.5 MW
AC Bus Line Voltage 480 V
AC Bus Current 1200 A
AC Bus Active Power 1 MW
Grid Line Voltage 13.8 kV
Installation Oriented Design of Electric Vehicle Supply Equipment (EVSE):
Figure 3. Block Tree Type Categorization of the Various Aspects of Installation Oriented Design of EVSE [1-5].
FY 2019 Quarter 3 Report
Behind-the-Meter Storage
The installation-oriented design for an EVSE is sub-categorized into five main elements:
1. Power Conversion System (PCS) 2. Structural Balance Of System (SBOS) 3. Electrical Balance Of System (EBOS) 4. Engineering Procurement & Construction (EPC) 5. Soft Cost Power Conversion System (PCS) involves the procurement of Converter, Converter Local Controller,
Electrical Sensing equipment like Current Transformer (CT), Potential Transformer (PT) and Relays, and also EMI/EMC Filter. This category has been named so because it involves conversion of the ac power obtained from the grid to dc power that is being supplied to the EV load.
Structural Balance of System (SBOS) involves procurement of all the components that provide structural integrity and housing to install the PCS as well as EBOS. It involves racking cabinets for Point Of Sale (POS) system, Converter, Converter Controller, EMC/EMI Filter. It also incorporates container for housing the PCS and conduit boxes to house the cable terminal connections.
Electrical Balance of System (EBOS) involves procurement of all the components that monitors electrical power flow and signals and under fault conditions, protects the PCS, EV load and the grid. It also provides added functionality of fire suppression and management of the thermal energy dissipated from the PCS through HVAC or other cooling technologies. It involves ac and dc components like fuses, breakers, meters and disconnect switches. It also includes distribution transformer for isolation as well as voltage step-up purposes. In the case where no grounding is available in the PCS, a grounding setup on the dc or ac side may be considered to provide a return path to fault current or neutral current under fault or unbalanced system conditions.
Engineering Procurement and Construction (EPC) is a multi-faceted and human resource intensive activity which is very crucial to the installation of an EVSE PE. It involves preparing and constructing a site for the installation of PCS, SBOS AND EBOS. It also involves the acquisition or renting of installation equipment for installation of PCS, SBOS AND EBOS. To perform all these activities in EPC, Installation labor has to be hired with wages whose minimal value might vary from state to state. Most importantly, all the taxes levied on this overall EVSE Installation process is clubbed under Sales Tax, which may again vary state-wise.
Lastly, Soft Cost entails the acquisition of site for EVSE installation, permitting fee for permission of installation of EVSE, Inter-connection fee for EVSE inter-connection with the utility grid, Project Management Cost for planning and execution of the project for Installation of EVSE, and the overall developer net profit generated by undertaking the Installation of EVSE.
Pricing Estimate of Electric Vehicle Supply Equipment (EVSE)
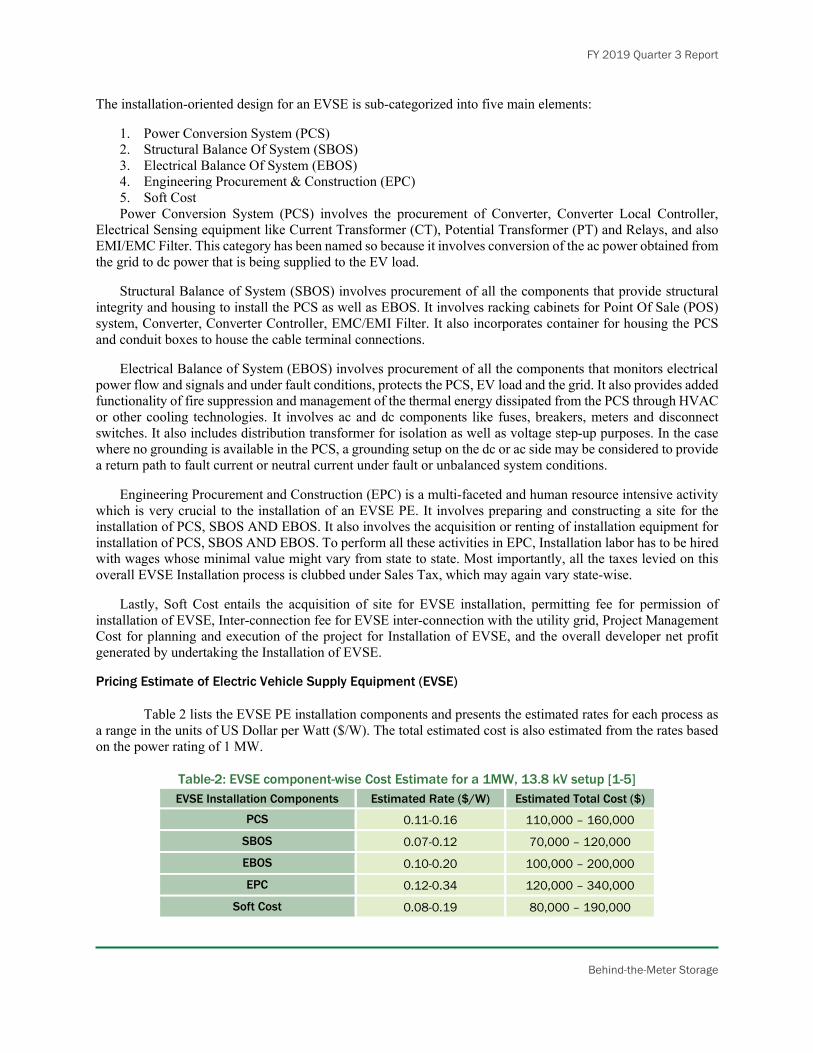
Table 2 lists the EVSE PE installation components and presents the estimated rates for each process as a range in the units of US Dollar per Watt ($/W). The total estimated cost is also estimated from the rates based on the power rating of 1 MW.
Table-2: EVSE component-wise Cost Estimate for a 1MW, 13.8 kV setup [1-5] EVSE Installation Components Estimated Rate ($/W) Estimated Total Cost ($)
PCS 0.11-0.16 110,000 – 160,000
SBOS 0.07-0.12 70,000 – 120,000
EBOS 0.10-0.20 100,000 – 200,000
EPC 0.12-0.34 120,000 – 340,000
Soft Cost 0.08-0.19 80,000 – 190,000
12 Behind-the-Meter Storage
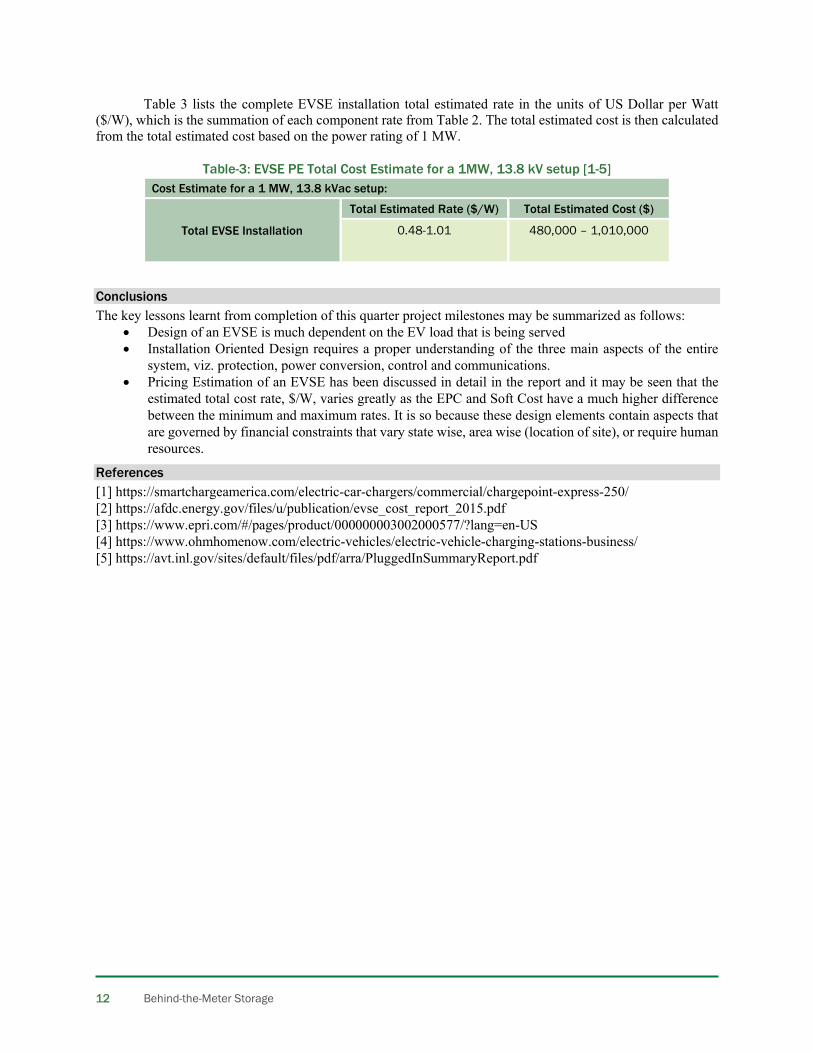
Table 3 lists the complete EVSE installation total estimated rate in the units of US Dollar per Watt ($/W), which is the summation of each component rate from Table 2. The total estimated cost is then calculated from the total estimated cost based on the power rating of 1 MW.
Table-3: EVSE PE Total Cost Estimate for a 1MW, 13.8 kV setup [1-5] Cost Estimate for a 1 MW, 13.8 kVac setup:
Total EVSE Installation
Total Estimated Rate ($/W) Total Estimated Cost ($)
0.48-1.01 480,000 – 1,010,000
Conclusions The key lessons learnt from completion of this quarter project milestones may be summarized as follows:
• Design of an EVSE is much dependent on the EV load that is being served • Installation Oriented Design requires a proper understanding of the three main aspects of the entire
system, viz. protection, power conversion, control and communications. • Pricing Estimation of an EVSE has been discussed in detail in the report and it may be seen that the
estimated total cost rate, $/W, varies greatly as the EPC and Soft Cost have a much higher difference between the minimum and maximum rates. It is so because these design elements contain aspects that are governed by financial constraints that vary state wise, area wise (location of site), or require human resources.
References [1] https://smartchargeamerica.com/electric-car-chargers/commercial/chargepoint-express-250/ [2] https://afdc.energy.gov/files/u/publication/evse_cost_report_2015.pdf [3] https://www.epri.com/#/pages/product/000000003002000577/?lang=en-US [4] https://www.ohmhomenow.com/electric-vehicles/electric-vehicle-charging-stations-business/ [5] https://avt.inl.gov/sites/default/files/pdf/arra/PluggedInSummaryReport.pdf
FY 2019 Quarter 3 Report
Behind-the-Meter Storage
BTMS Testing Section Background Cell testing is an important part of understanding the performance and life capabilities of state-of-the art energy storage technologies, particularly with respect to the distinct technical and functional requirements posed by the BTMS program. In order to test energy storage components and systems against these requirements, test procedures must be created. System usage scenarios are concurrently being developed with testing of baseline cells intended to illustrate their capabilities relative to a broad set of initial system assumptions. The results from these early performance tests and aging procedures, though only loosely framed by a baseline 1 MWh BTMS system supporting six 350kW DCFC units, will produce both slow and accelerated cycle-life aging information through a mix of empirical observations and modeling.
Results Testing commenced on three commercially available cell types including NMC/LTO, NMC/Graphite, and LFP/Graphite. Three parameters including temperature, rate, and SOC window, were varied to accelerate cycle-aging and to provide early data to support future test design of experiment to improve modeling capabilities. Calendar aging at 55 degrees C was also added as an accelerated calendar aging condition, compared to the expected system operating conditions closer to room temperature.
The 2-hr discharge capacity of each cell was measured at beginning-of-life, and monthly in a reference performance tests. A set of 20-hr charge and discharge cycles, which can be analyzed to understand differences in aging mechanisms among test conditions, was also performed at each RPT.
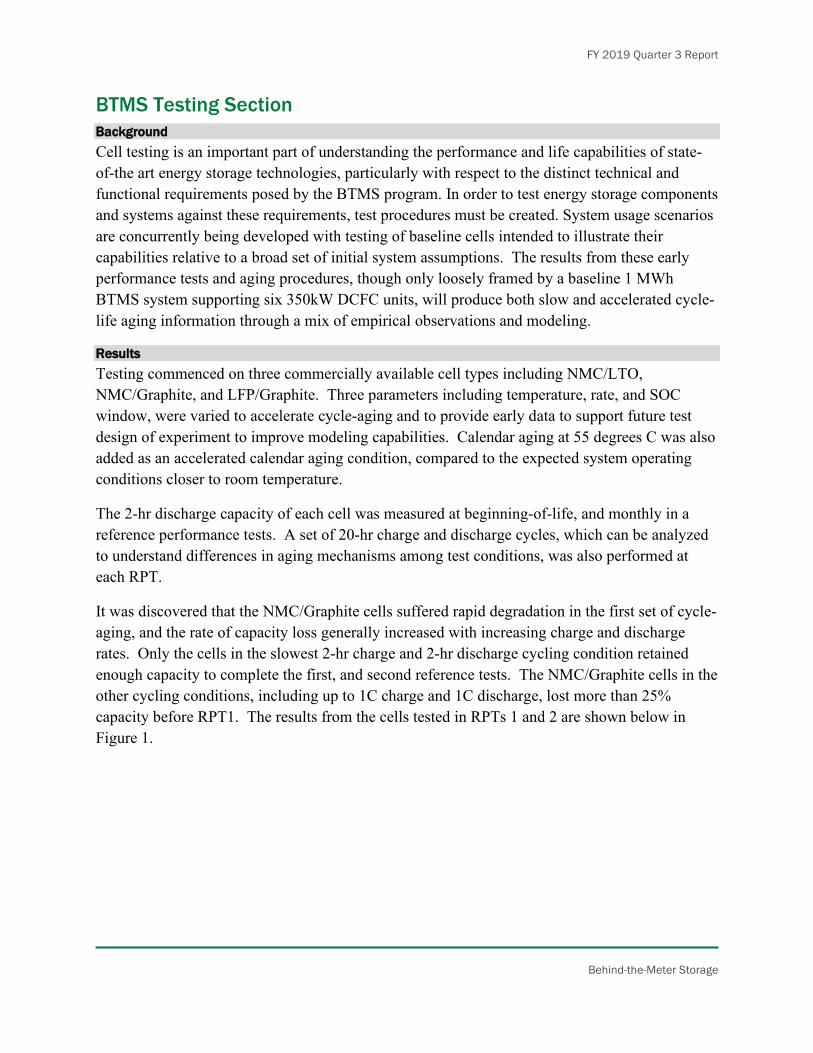
It was discovered that the NMC/Graphite cells suffered rapid degradation in the first set of cycle-aging, and the rate of capacity loss generally increased with increasing charge and discharge rates. Only the cells in the slowest 2-hr charge and 2-hr discharge cycling condition retained enough capacity to complete the first, and second reference tests. The NMC/Graphite cells in the other cycling conditions, including up to 1C charge and 1C discharge, lost more than 25% capacity before RPT1. The results from the cells tested in RPTs 1 and 2 are shown below in Figure 1.
14 Behind-the-Meter Storage
Figure 1. Capacity retention through full charge cycling for NMC/Graphite cells.
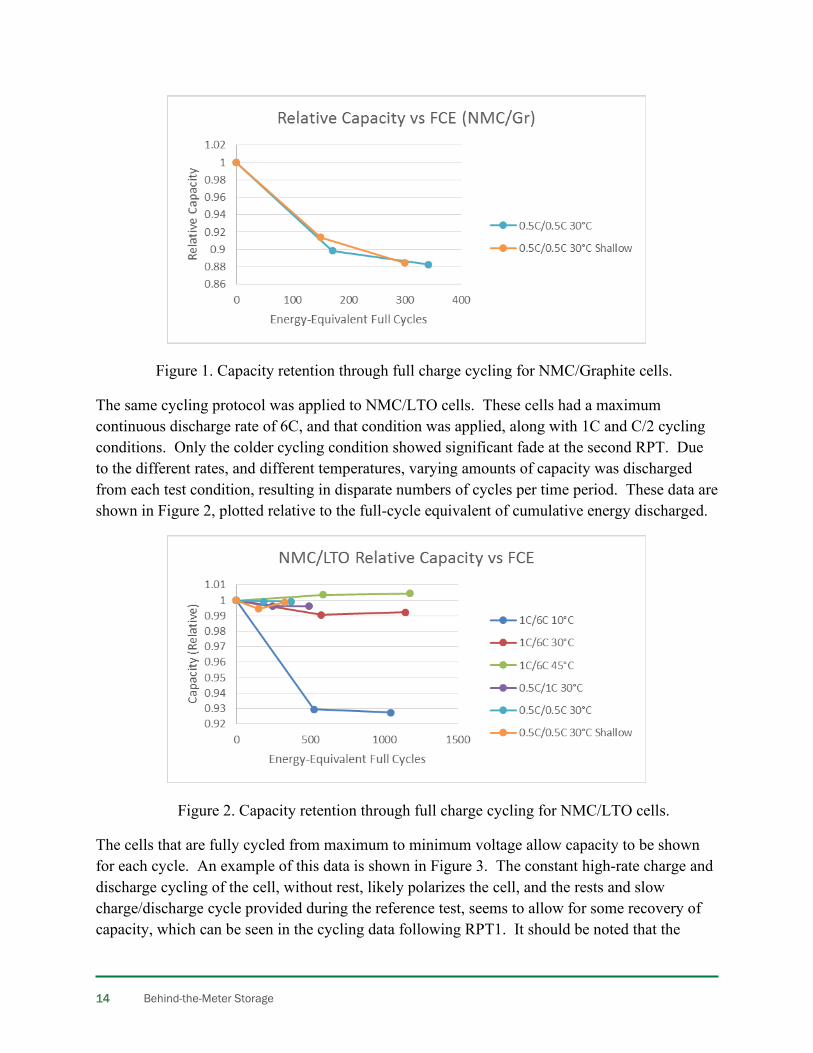
The same cycling protocol was applied to NMC/LTO cells. These cells had a maximum continuous discharge rate of 6C, and that condition was applied, along with 1C and C/2 cycling conditions. Only the colder cycling condition showed significant fade at the second RPT. Due to the different rates, and different temperatures, varying amounts of capacity was discharged from each test condition, resulting in disparate numbers of cycles per time period. These data are shown in Figure 2, plotted relative to the full-cycle equivalent of cumulative energy discharged.
Figure 2. Capacity retention through full charge cycling for NMC/LTO cells.
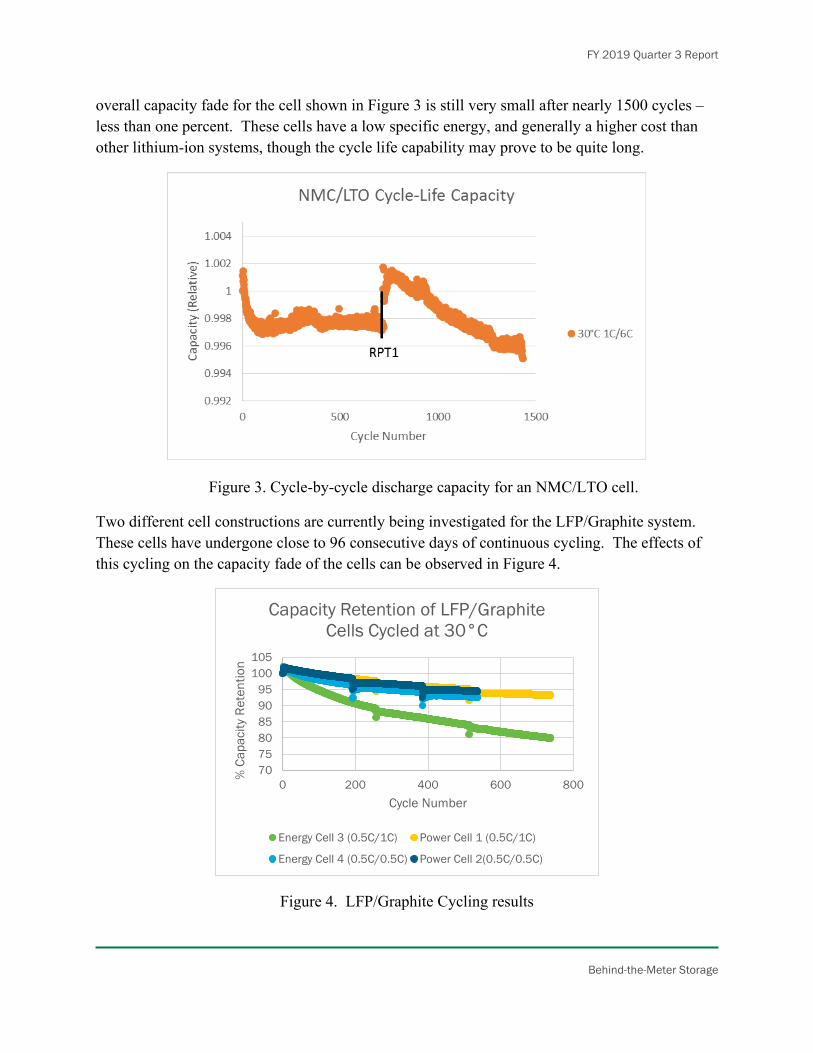
The cells that are fully cycled from maximum to minimum voltage allow capacity to be shown for each cycle. An example of this data is shown in Figure 3. The constant high-rate charge and discharge cycling of the cell, without rest, likely polarizes the cell, and the rests and slow charge/discharge cycle provided during the reference test, seems to allow for some recovery of capacity, which can be seen in the cycling data following RPT1. It should be noted that the
FY 2019 Quarter 3 Report
Behind-the-Meter Storage
overall capacity fade for the cell shown in Figure 3 is still very small after nearly 1500 cycles – less than one percent. These cells have a low specific energy, and generally a higher cost than other lithium-ion systems, though the cycle life capability may prove to be quite long.
Figure 3. Cycle-by-cycle discharge capacity for an NMC/LTO cell.
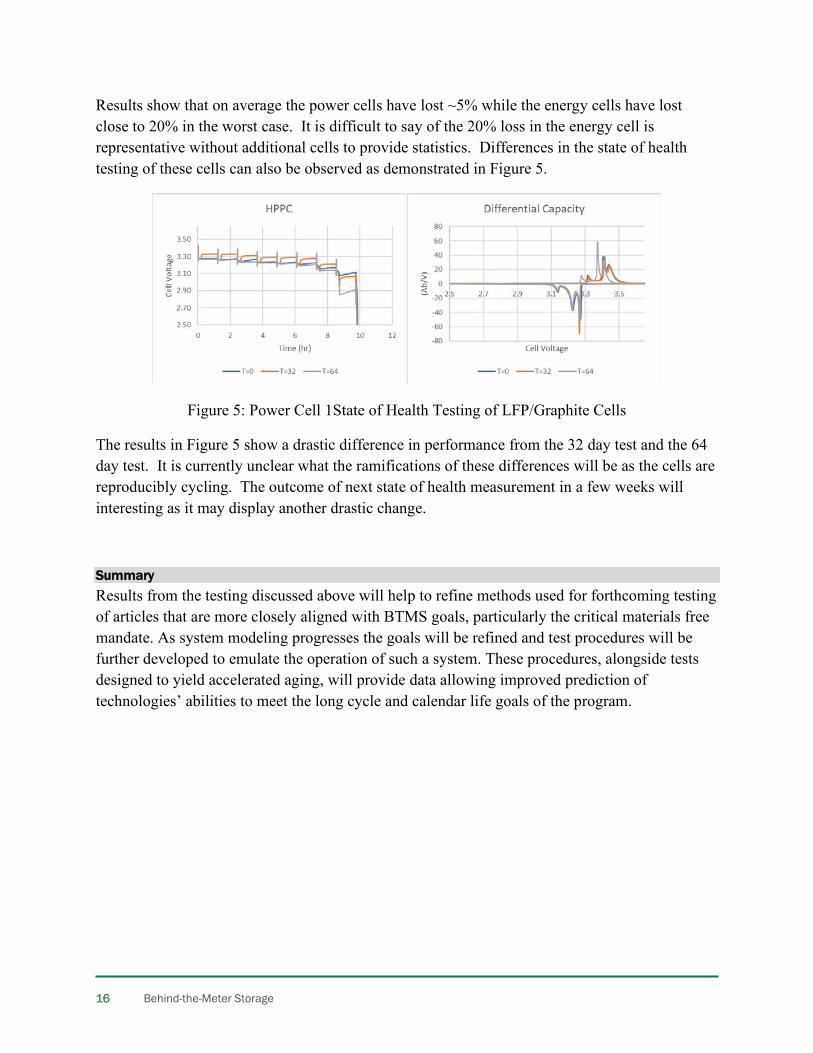
Two different cell constructions are currently being investigated for the LFP/Graphite system. These cells have undergone close to 96 consecutive days of continuous cycling. The effects of this cycling on the capacity fade of the cells can be observed in Figure 4.
Figure 4. LFP/Graphite Cycling results
707580859095
100105
0 200 400 600 800
% C
apac
ity R
eten
tion
Cycle Number
Capacity Retention of LFP/Graphite Cells Cycled at 30°C
Energy Cell 3 (0.5C/1C) Power Cell 1 (0.5C/1C)
Energy Cell 4 (0.5C/0.5C) Power Cell 2(0.5C/0.5C)
16 Behind-the-Meter Storage
Results show that on average the power cells have lost ~5% while the energy cells have lost close to 20% in the worst case. It is difficult to say of the 20% loss in the energy cell is representative without additional cells to provide statistics. Differences in the state of health testing of these cells can also be observed as demonstrated in Figure 5.
Figure 5: Power Cell 1State of Health Testing of LFP/Graphite Cells
The results in Figure 5 show a drastic difference in performance from the 32 day test and the 64 day test. It is currently unclear what the ramifications of these differences will be as the cells are reproducibly cycling. The outcome of next state of health measurement in a few weeks will interesting as it may display another drastic change.
Summary Results from the testing discussed above will help to refine methods used for forthcoming testing of articles that are more closely aligned with BTMS goals, particularly the critical materials free mandate. As system modeling progresses the goals will be refined and test procedures will be further developed to emulate the operation of such a system. These procedures, alongside tests designed to yield accelerated aging, will provide data allowing improved prediction of technologies’ abilities to meet the long cycle and calendar life goals of the program.

FY 2019 Quarter 3 Report
Behind-the-Meter Storage
Physics-based Machine Learning for Behind the Meter Storage
Idaho National Laboratory and National Renewable Energy Laboratory
Background Understanding battery life and identification of failure mechanisms is critical as new technologies are implanted for different scenarios. Currently testing of batteries can take upwards of a year to make reasonable estimations of life and to clearly identify failure modes and rates. The need to shorten the design and testing cycle if critical to bringing new battery chemistries and cell designs into new and emerging areas such as in stationary energy storage support electric vehicle charging stations capable of extreme fast charging. Connection of physics-based life models and machine learning (ML) provides the opportunity to enable more robust assessment of battery aging, failure mechanism identification and understanding as new use case scenarios are proposed. The current project is focused on means to apply ML to enhance the estimation of life while also identifying key failure pathways. During the first portion of the project existing data sets will be used for both training and validation of ML approaches to better characterize expected battery life. The work also looks to link ML with existing physics-based life models at INL and NREL.
Results Accurate prediction of battery lifetime is a bottleneck to the commercialization of new battery technologies and securing financing for large-scale battery installations. Furthermore, most battery lifetime models are empirical, limiting their usefulness to optimize battery design and usage. Building on their experience in testing and physics-based modeling, INL and NREL initiated an effort to accelerate the model-based prediction of battery lifetime using test data. In Q3, the teams identified and exchanged existing datasets and began work to standardize future data collection and life model formulations. In Q4, the teams will outline procedures for identification of physics-based models from test data using ML and initiate activities to identify current and future needs for data sharing and storage. The team has established a set meeting schedule to actively discuss progress in addition to sharing data and starting to link the physics-based models with the test data and ML methods.
Conclusions The initiation of the project started during Q3 and progress is being made to fully align the INL and NREL teams.
References