Embed Size (px)
Citation preview
Behind the Exporters’ Success: Analysisof Successful Hungarian Exporter CompaniesFrom a Strategic PerspectiveAnnamaria Kazai OnodiCorvinus University of Budapest, [email protected]
Krisztina PeczeCorvinus University of Budapest, [email protected]
The purpose of the study is to provide an overview of export success froma strategic management perspective. The paper empirically tested the rela-tionships between the firm’s export performance, strategic thinking, adap-tation to the changing environment and companies’ capabilities. The re-search is based on the Hungarian Competitiveness Research database of2013 that consists of 300 firms. Cluster analysis differentiated successfulexport-oriented and stagnant companies. Both of them had high exportintensity (higher than 75), but significant differences could be observedin export volume and profitability. More than 90 of total export rev-enue belonged to the successful export-oriented cluster. Successful export-oriented companies proved to bemore proactive and innovative than stag-nant, thus they were capable of adapting to the changing environment bet-ter. The study highlighted that appropriate strategic thinking could play asignificant role in improving export success. The implication of the studyis that stagnant companies need to develop their forecast abilities, flexibil-ity to adapt to the changing environment and operational efficiency. Stag-nant companies lagged behind successful exporters concerning industryforecast, production level, number of innovations, competitive prices andemployee qualifications.Key Words: internationalisation, export, performance,Hungarian Competitiveness Research Survey, strategy
jel Classification: c38, l21, m16
IntroductionOver the past few decades, exporting has been one of the economic topicsto be explored. It is a common view amongst researchers that exportingfirms’ competitiveness has a strong effect on national export competitive-ness (Porter 1990). In addition, there is an increasing attention to global
Managing Global Transitions 12 (4): 325–346
326 Annamaria Kazai Onodi and Krisztina Pecze
competition in the foreign markets by researchers as well as practition-ers particularly with respect to determinants of export success. Exportingcan be an engine for the individual firm’s growth and profitability, and forthe growth of national economies (Hatemi and Irandoust 2001;Wolff andPett 2000).The analysis of export performance is a very important issue in case of
Hungary as well. Studying the Hungarian firms’ export performance ina small open economy better contributes to the improvement of exportcompetitiveness on a national level. Several researches were concludedon a macroeconomic level in Hungary (Munkácsi 2009) in terms of howexport competitiveness can be improved. The analysis from a microeco-nomic perspective revealing exporter firms’ characteristics can serve sig-nificant information to export development implications (to economicpolicy makers in the government as well as academic researchers too). Inthis paper, we analyse the export success from a strategic managementpoint of view and intend to reveal factors behind the success.The main idea of this analysis is that export performance can be an in-
dicator of firms’ international competitiveness and that export success isboosted by the growth of internationalmarkets and diminished by factorsdominating in the years of the economic recession. However, competitiveand non-competitive firms are not equally influenced by the economicsituation: less competitive firms’ export activity will be much more in-fluenced by negative effects, measurable on export volume, export pricesand/or profitability.Much of the research in export performance analysis has categorized
firms into stages of export development, distinguishing exporters fromnon-exporters, analysing variables of how exporters perceive various as-pects of their organization, market, environment, resources, strategy, etc.(Dean, Mengüc, andMyers 2000; Kor andMesko 2013). We also used themethod of distinguishing firms based on different characteristics. In ourstudy, one of themain questions is what the difference between successfuland non-successful exporter companies is. This study focuses on strategiccapabilities of successful exporters and intends to reveal in depth what isbehind their success.
A Review of Relevant Literature and HypothesesThe export performance of firms has been studied in a wide range of lit-erature. Due to this, our research focus was to identify the relationshipbetween firms’ strategy and export performance. In this paper, we presentthe literature related to strategicmanagement approach.We present three
Managing Global Transitions
Behind the Exporters’ Success 327
strategic theories, the industrial organization-based theory, the resource-based view of firms, especially the dynamic capabilities-based theory, andcontingency theory.
firm’s strategy and performanceA fundamental axiom of strategic management and industrial organiza-tional economics is the relationships between strategy and performance.Industrial organization theory views that economic competitiveness isbased on its enterprises. A considerable amount of literature has focusedon the relationship between strategy and performance and emphasizedthe importance of a distinctive strategy in determining the firm’s eco-nomic performance (Porter 1980; 1990).There is no consensus in the literature on the importance of the many
variables that have been identified as determinants of export success.The literature reports on the correlations of export performance thatare both internal and external to firms. The most analysed internal fac-tors are managerial experience, marketing strategy, organizational struc-ture, product andmarket diversification and resources. Industry compet-itiveness, business environment or product characteristics are linked toexport performance as external variables (Barney 1991; Barney, Wright,and David 2001; Leonidou, Katsikeas, and Samiee 2002). Calantone et al.(2006) concluded that export performance is positively linked with thelevel of product adaptation strategy and organizations’ openness to in-novation. This may imply that the costs to adapt products are recoupedthrough improved export performance.Case studymethod is also used as a qualitative survey in understanding
the determinants of export success. Ábel and Czakó (2013) emphasisedthe importance of management/owner role, organisational resources andcapabilities and learning process based on analysing ten case studies ofexporter companies.The relevant literature suggests that export development and interna-
tionalization are complex phenomena. Instead of focusing on a particu-lar aspect of export activity, this researchmeasures several organizationaldimensions including firm characteristics, firm competency, perceptionsand strategy. A complete view on the relationship between export perfor-mance and firms’ strategic characteristics is likely to be given.The main idea behind this analysis is that export performance can be
an indicator of firms’ international competitiveness and that export suc-cess is boosted by the growth of international markets and diminishedby factors dominating in the years of the economic recession. However,
Volume 12 · Number 4 · Winter 2014
328 Annamaria Kazai Onodi and Krisztina Pecze
competitive and non-competitive firms are not equally influenced by theinward and outward economic situation. Competitive firm operationsare characterised by strong strategic thinking that shows itself in con-scious goal orientation, valuable and dynamic capabilities and good/deepknowledge of the external environment. Less competitive firms are char-acterised by the lack of these abilities so their export activity will bemuchmore influenced by negative effects,measurable on export volume, exportprices and/or profitability. It is therefore hypothesized that:h1 There is significant connection between strategic thinking and export
performance.Based on previous research we assume that behind the export perfor-
mance there is a more conscious strategic thinking such as strategic plan-ning and implementation. In a strategic management approach, it meansthe realisation of the long-termobjectives, improving the firm’s value thusincreasing shareholder value.
the firm’s strategy and its context/environmentOne of the theories used in strategic management literature is the contin-gency-based approach. It posits that the firm’s export performance is de-pendent on the context in which the firm operates. Robertson and Chetty(2000) adopted a conceptual model of export performance in their re-search, based on contingency theory. They analysed the relationship be-tween export performance and strategic orientation in a different externalenvironment. The study emphasised that exporting is a dynamic processbecause the context of a firm changes continually throughout its export-ing ventures. Export strategy research usually places its starting point atthe analysis of the relationships between the firm and its environment.As it is suggested by Knudsen and Madsen (2002) the theoretical back-ground of export strategy researches has to be completed with dynamiccapabilities approach.h2 There is a significant connection between the firms’ ability to adapt
to the changing environment and export success.
firm’s strategy and capabilitiesThe researches examining export performance from capabilities aregrounded in the resource-based view (rbv) of the firm (Wernerfelt 1984)and its extensions as knowledge-based (Grant 1996) view. The rbv em-phasises unique resources and capabilities of a firm for sustained com-petitive advantage.We contend that knowledge is a key strategic resource
Managing Global Transitions
Behind the Exporters’ Success 329
and a firm’s capability in integrating and exploiting knowledge in export-ing is a source of competitive advantage (Dhanaraj and Beamish 2003).A conceptual model presented by Haahti et al. (2005) proposes that ex-port market knowledge accumulated from various sources constitutes avaluable ‘entrepreneurial resource’ and that both domestic and foreigncooperative strategies directly influence export performance. The syner-gistic effect of export on performance will also be multiplied when theexport activity is well utilized under a proper selection of organizationalstrategy in the case of firm, product, market and technology (Lee andHabte-Giorgis 2004).According to Reid (1981) we emphasise that exporting must be con-
sidered as a dynamic process, because the context of a firm changescontinually throughout its exporting ventures. This idea is connectedto the dynamic capabilities perspective (dcp). The most important issueof dcp is to explore the way the firm comes to terms with the contin-uous emergence of novel circumstances caused by rapid technologicalchanges (Teece, Pisano, and Shuen 1997). Thus, the firm’s central strate-gic problem is to create new productive knowledge and to coordinate thecumulative process of knowledge development and creation. The frame-work developed by Teece (2014) explains how strategy and dynamic ca-pabilities together determine firm-level sustained competitive advantagein a global environment. The internalization models complemented byexport performance analysis seek to understand why some firms’ exportactivities are successful while others’ fail. Hence, we advance the follow-ing hypothesis:
h3 There is a significant connection between the firms’ resources andcapabilities and export success.
Numerous authors of export performance studies compare the ex-porters’ characteristics in an attempt to reveal the factors that make adifference between success and failure in foreign market activities. Inthis paper we intend to identify the distinctive factors of export successand based on these findings develop better practice-related suggestionsfor firms with low performance.
Method of Research
The phrased three hypotheses were tested on the Hungarian Compet-itiveness Research database of 2013. The connection between exportperformance and the selected influencing factors (strategic thinking, re-
Volume 12 · Number 4 · Winter 2014
330 Annamaria Kazai Onodi and Krisztina Pecze
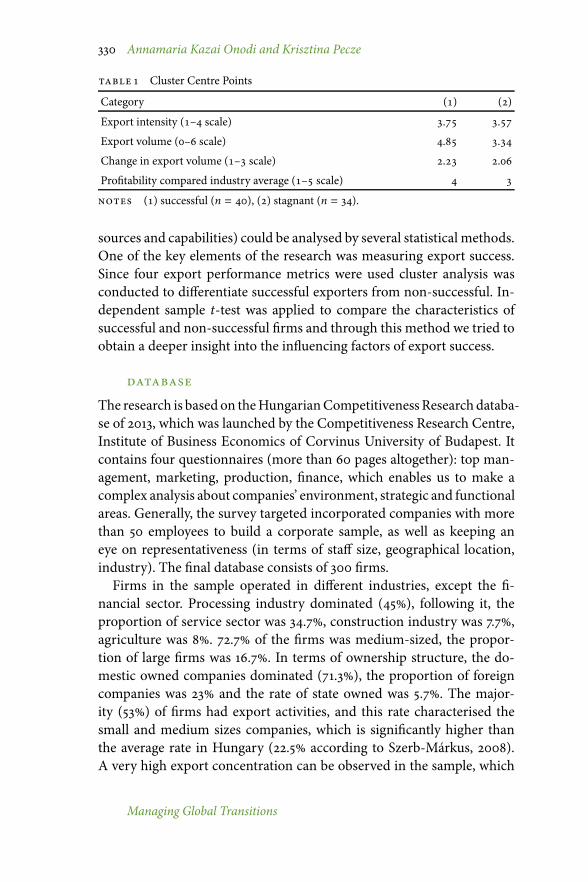
table 1 Cluster Centre Points
Category () ()
Export intensity (– scale) . .
Export volume (– scale) . .
Change in export volume (– scale) . .
Profitability compared industry average (– scale)
notes () successful (n = 40), () stagnant (n = 34).
sources and capabilities) could be analysed by several statistical methods.One of the key elements of the research was measuring export success.Since four export performance metrics were used cluster analysis wasconducted to differentiate successful exporters from non-successful. In-dependent sample t-test was applied to compare the characteristics ofsuccessful and non-successful firms and through this method we tried toobtain a deeper insight into the influencing factors of export success.
database
The research is based on theHungarianCompetitivenessResearch databa-se of 2013, which was launched by the Competitiveness Research Centre,Institute of Business Economics of Corvinus University of Budapest. Itcontains four questionnaires (more than 60 pages altogether): top man-agement, marketing, production, finance, which enables us to make acomplex analysis about companies’ environment, strategic and functionalareas. Generally, the survey targeted incorporated companies with morethan 50 employees to build a corporate sample, as well as keeping aneye on representativeness (in terms of staff size, geographical location,industry). The final database consists of 300 firms.Firms in the sample operated in different industries, except the fi-
nancial sector. Processing industry dominated (45), following it, theproportion of service sector was 34.7, construction industry was 7.7,agriculture was 8. 72.7 of the firms was medium-sized, the propor-tion of large firms was 16.7. In terms of ownership structure, the do-mestic owned companies dominated (71.3), the proportion of foreigncompanies was 23 and the rate of state owned was 5.7. The major-ity (53) of firms had export activities, and this rate characterised thesmall and medium sizes companies, which is significantly higher thanthe average rate in Hungary (22.5 according to Szerb-Márkus, 2008).A very high export concentration can be observed in the sample, which
Managing Global Transitions
Behind the Exporters’ Success 331
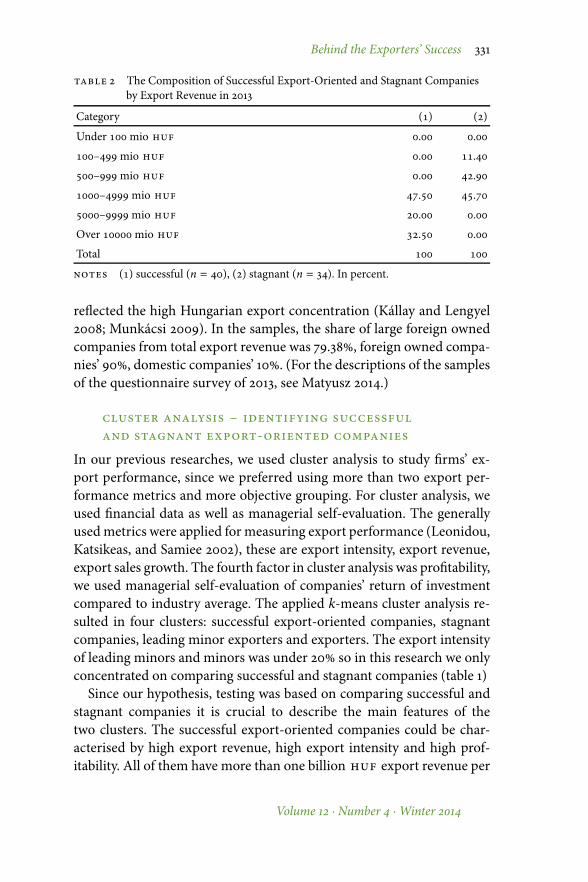
table 2 The Composition of Successful Export-Oriented and Stagnant Companiesby Export Revenue in 2013
Category () ()
Under mio huf . .
– mio huf . .
– mio huf . .
– mio huf . .
– mio huf . .
Over mio huf . .
Total
notes () successful (n = 40), () stagnant (n = 34). In percent.
reflected the high Hungarian export concentration (Kállay and Lengyel2008; Munkácsi 2009). In the samples, the share of large foreign ownedcompanies from total export revenue was 79.38, foreign owned compa-nies’ 90, domestic companies’ 10. (For the descriptions of the samplesof the questionnaire survey of 2013, see Matyusz 2014.)
cluster analysis – identifying successfuland stagnant export-oriented companies
In our previous researches, we used cluster analysis to study firms’ ex-port performance, since we preferred using more than two export per-formance metrics and more objective grouping. For cluster analysis, weused financial data as well as managerial self-evaluation. The generallyusedmetrics were applied for measuring export performance (Leonidou,Katsikeas, and Samiee 2002), these are export intensity, export revenue,export sales growth. The fourth factor in cluster analysis was profitability,we used managerial self-evaluation of companies’ return of investmentcompared to industry average. The applied k-means cluster analysis re-sulted in four clusters: successful export-oriented companies, stagnantcompanies, leading minor exporters and exporters. The export intensityof leading minors and minors was under 20 so in this research we onlyconcentrated on comparing successful and stagnant companies (table 1)Since our hypothesis, testing was based on comparing successful and
stagnant companies it is crucial to describe the main features of thetwo clusters. The successful export-oriented companies could be char-acterised by high export revenue, high export intensity and high prof-itability. All of them have more than one billion huf export revenue per
Volume 12 · Number 4 · Winter 2014
332 Annamaria Kazai Onodi and Krisztina Pecze
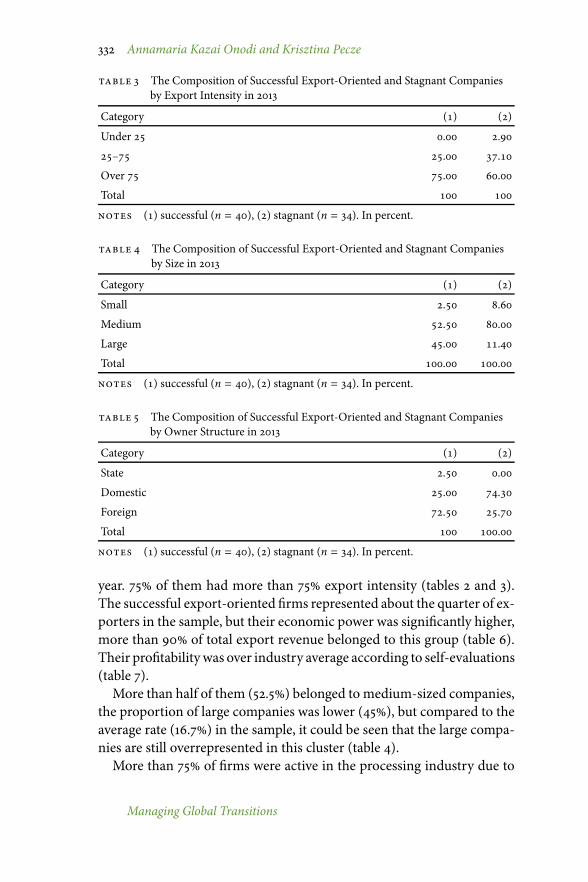
table 3 The Composition of Successful Export-Oriented and Stagnant Companiesby Export Intensity in 2013
Category () ()
Under . .
– . .
Over . .
Total
notes () successful (n = 40), () stagnant (n = 34). In percent.
table 4 The Composition of Successful Export-Oriented and Stagnant Companiesby Size in 2013
Category () ()
Small . .
Medium . .
Large . .
Total . .
notes () successful (n = 40), () stagnant (n = 34). In percent.
table 5 The Composition of Successful Export-Oriented and Stagnant Companiesby Owner Structure in 2013
Category () ()
State . .
Domestic . .
Foreign . .
Total .
notes () successful (n = 40), () stagnant (n = 34). In percent.
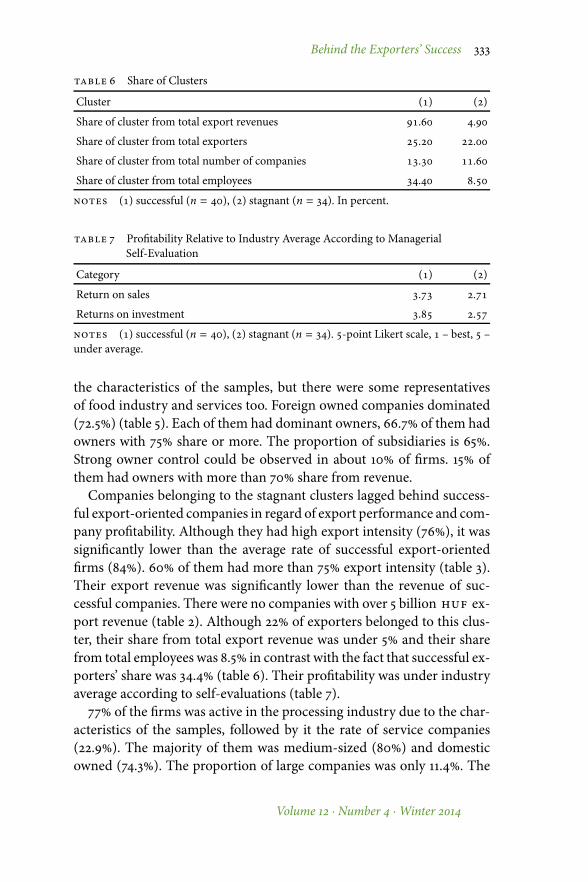
year. 75 of them had more than 75 export intensity (tables 2 and 3).The successful export-oriented firms represented about the quarter of ex-porters in the sample, but their economic power was significantly higher,more than 90 of total export revenue belonged to this group (table 6).Their profitabilitywas over industry average according to self-evaluations(table 7).More than half of them (52.5) belonged to medium-sized companies,
the proportion of large companies was lower (45), but compared to theaverage rate (16.7) in the sample, it could be seen that the large compa-nies are still overrepresented in this cluster (table 4).More than 75 of firms were active in the processing industry due to
Managing Global Transitions
Behind the Exporters’ Success 333
table 6 Share of Clusters
Cluster () ()
Share of cluster from total export revenues . .
Share of cluster from total exporters . .
Share of cluster from total number of companies . .
Share of cluster from total employees . .
notes () successful (n = 40), () stagnant (n = 34). In percent.
table 7 Profitability Relative to Industry Average According to ManagerialSelf-Evaluation
Category () ()
Return on sales . .
Returns on investment . .
notes () successful (n = 40), () stagnant (n = 34). -point Likert scale, – best, –under average.
the characteristics of the samples, but there were some representativesof food industry and services too. Foreign owned companies dominated(72.5) (table 5). Each of them had dominant owners, 66.7 of them hadowners with 75 share or more. The proportion of subsidiaries is 65.Strong owner control could be observed in about 10 of firms. 15 ofthem had owners with more than 70 share from revenue.Companies belonging to the stagnant clusters lagged behind success-
ful export-oriented companies in regard of export performance and com-pany profitability. Although they had high export intensity (76), it wassignificantly lower than the average rate of successful export-orientedfirms (84). 60 of them had more than 75 export intensity (table 3).Their export revenue was significantly lower than the revenue of suc-cessful companies. There were no companies with over 5 billion huf ex-port revenue (table 2). Although 22 of exporters belonged to this clus-ter, their share from total export revenue was under 5 and their sharefrom total employees was 8.5 in contrast with the fact that successful ex-porters’ share was 34.4 (table 6). Their profitability was under industryaverage according to self-evaluations (table 7).77 of the firms was active in the processing industry due to the char-
acteristics of the samples, followed by it the rate of service companies(22.9). The majority of them was medium-sized (80) and domesticowned (74.3). The proportion of large companies was only 11.4. The
Volume 12 · Number 4 · Winter 2014
334 Annamaria Kazai Onodi and Krisztina Pecze
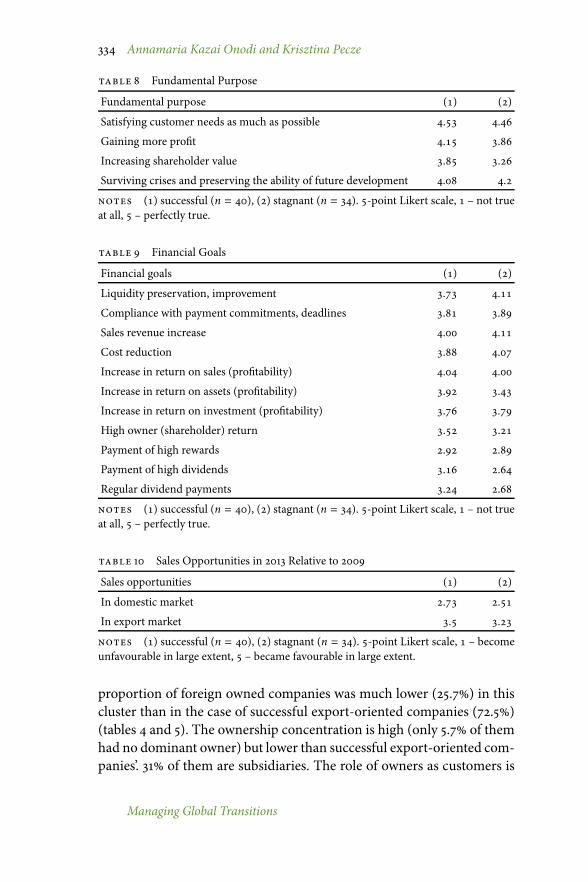
table 8 Fundamental Purpose
Fundamental purpose () ()
Satisfying customer needs as much as possible . .
Gaining more profit . .
Increasing shareholder value . .
Surviving crises and preserving the ability of future development . .
notes () successful (n = 40), () stagnant (n = 34). -point Likert scale, – not trueat all, – perfectly true.
table 9 Financial Goals
Financial goals () ()
Liquidity preservation, improvement . .
Compliance with payment commitments, deadlines . .
Sales revenue increase . .
Cost reduction . .
Increase in return on sales (profitability) . .
Increase in return on assets (profitability) . .
Increase in return on investment (profitability) . .
High owner (shareholder) return . .
Payment of high rewards . .
Payment of high dividends . .
Regular dividend payments . .
notes () successful (n = 40), () stagnant (n = 34). -point Likert scale, – not trueat all, – perfectly true.
table 10 Sales Opportunities in 2013 Relative to 2009
Sales opportunities () ()
In domestic market . .
In export market . .
notes () successful (n = 40), () stagnant (n = 34). -point Likert scale, – becomeunfavourable in large extent, – became favourable in large extent.
proportion of foreign owned companies was much lower (25.7) in thiscluster than in the case of successful export-oriented companies (72.5)(tables 4 and 5). The ownership concentration is high (only 5.7 of themhad no dominant owner) but lower than successful export-oriented com-panies’. 31 of them are subsidiaries. The role of owners as customers is
Managing Global Transitions
Behind the Exporters’ Success 335
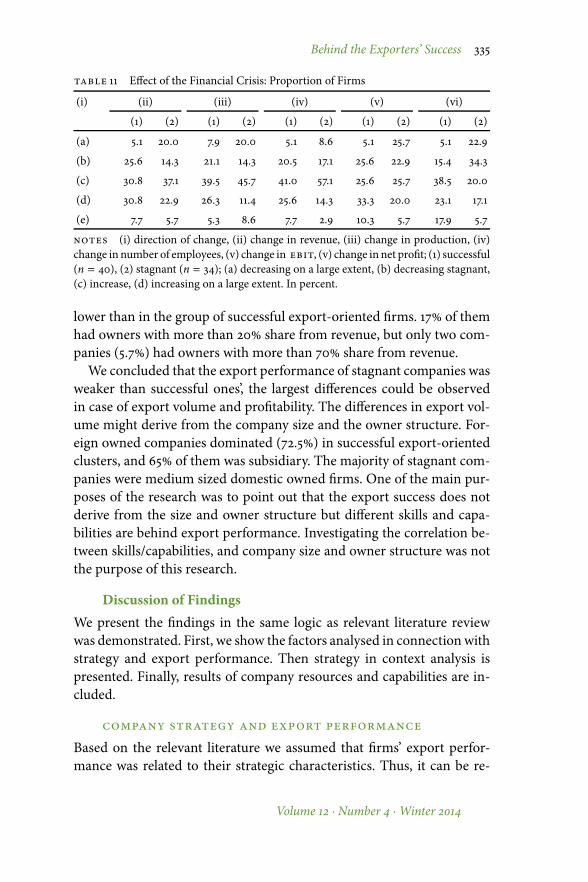
table 11 Effect of the Financial Crisis: Proportion of Firms
(i) (ii) (iii) (iv) (v) (vi)
(1) (2) (1) (2) (1) (2) (1) (2) (1) (2)
(a) 5.1 20.0 7.9 20.0 5.1 8.6 5.1 25.7 5.1 22.9
(b) 25.6 14.3 21.1 14.3 20.5 17.1 25.6 22.9 15.4 34.3
(c) 30.8 37.1 39.5 45.7 41.0 57.1 25.6 25.7 38.5 20.0
(d) 30.8 22.9 26.3 11.4 25.6 14.3 33.3 20.0 23.1 17.1
(e) 7.7 5.7 5.3 8.6 7.7 2.9 10.3 5.7 17.9 5.7
notes (i) direction of change, (ii) change in revenue, (iii) change in production, (iv)change in number of employees, (v) change in ebit, (v) change in net profit; (1) successful(n = 40), (2) stagnant (n = 34); (a) decreasing on a large extent, (b) decreasing stagnant,(c) increase, (d) increasing on a large extent. In percent.
lower than in the group of successful export-oriented firms. 17 of themhad owners with more than 20 share from revenue, but only two com-panies (5.7) had owners with more than 70 share from revenue.We concluded that the export performance of stagnant companies was
weaker than successful ones’, the largest differences could be observedin case of export volume and profitability. The differences in export vol-ume might derive from the company size and the owner structure. For-eign owned companies dominated (72.5) in successful export-orientedclusters, and 65 of them was subsidiary. The majority of stagnant com-panies were medium sized domestic owned firms. One of the main pur-poses of the research was to point out that the export success does notderive from the size and owner structure but different skills and capa-bilities are behind export performance. Investigating the correlation be-tween skills/capabilities, and company size and owner structure was notthe purpose of this research.
Discussion of FindingsWe present the findings in the same logic as relevant literature reviewwas demonstrated. First, we show the factors analysed in connectionwithstrategy and export performance. Then strategy in context analysis ispresented. Finally, results of company resources and capabilities are in-cluded.
company strategy and export performanceBased on the relevant literature we assumed that firms’ export perfor-mance was related to their strategic characteristics. Thus, it can be re-
Volume 12 · Number 4 · Winter 2014
336 Annamaria Kazai Onodi and Krisztina Pecze
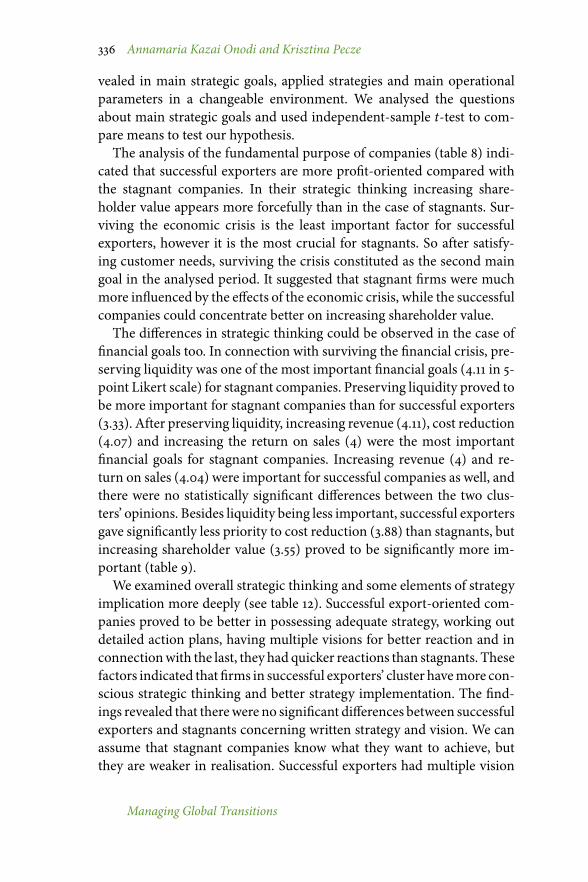
vealed in main strategic goals, applied strategies and main operationalparameters in a changeable environment. We analysed the questionsabout main strategic goals and used independent-sample t-test to com-pare means to test our hypothesis.The analysis of the fundamental purpose of companies (table 8) indi-
cated that successful exporters are more profit-oriented compared withthe stagnant companies. In their strategic thinking increasing share-holder value appears more forcefully than in the case of stagnants. Sur-viving the economic crisis is the least important factor for successfulexporters, however it is the most crucial for stagnants. So after satisfy-ing customer needs, surviving the crisis constituted as the second maingoal in the analysed period. It suggested that stagnant firms were muchmore influenced by the effects of the economic crisis, while the successfulcompanies could concentrate better on increasing shareholder value.The differences in strategic thinking could be observed in the case of
financial goals too. In connection with surviving the financial crisis, pre-serving liquidity was one of the most important financial goals (4.11 in 5-point Likert scale) for stagnant companies. Preserving liquidity proved tobe more important for stagnant companies than for successful exporters(3.33). After preserving liquidity, increasing revenue (4.11), cost reduction(4.07) and increasing the return on sales (4) were the most importantfinancial goals for stagnant companies. Increasing revenue (4) and re-turn on sales (4.04) were important for successful companies as well, andthere were no statistically significant differences between the two clus-ters’ opinions. Besides liquidity being less important, successful exportersgave significantly less priority to cost reduction (3.88) than stagnants, butincreasing shareholder value (3.55) proved to be significantly more im-portant (table 9).We examined overall strategic thinking and some elements of strategy
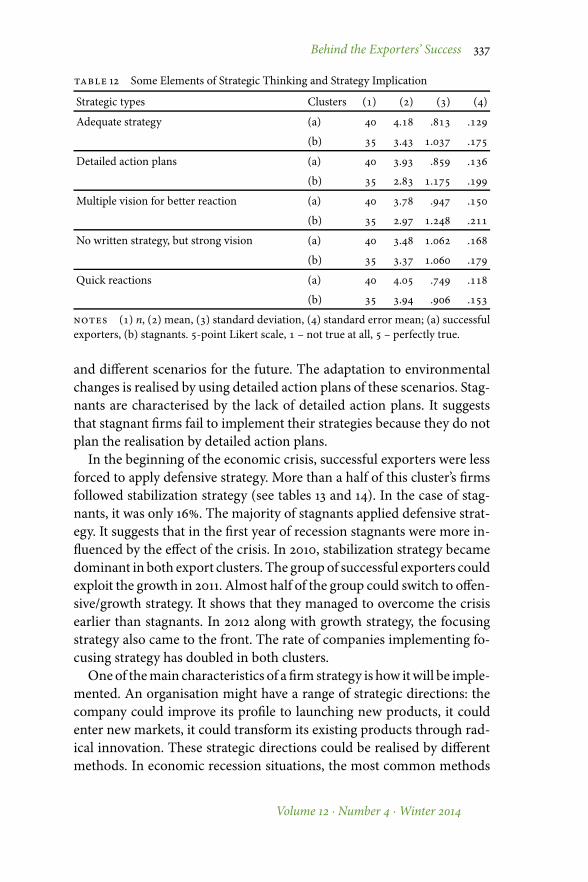
implication more deeply (see table 12). Successful export-oriented com-panies proved to be better in possessing adequate strategy, working outdetailed action plans, having multiple visions for better reaction and inconnectionwith the last, they had quicker reactions than stagnants. Thesefactors indicated that firms in successful exporters’ cluster havemore con-scious strategic thinking and better strategy implementation. The find-ings revealed that therewere no significant differences between successfulexporters and stagnants concerning written strategy and vision. We canassume that stagnant companies know what they want to achieve, butthey are weaker in realisation. Successful exporters had multiple vision
Managing Global Transitions
Behind the Exporters’ Success 337
table 12 Some Elements of Strategic Thinking and Strategy Implication
Strategic types Clusters () () () ()
Adequate strategy (a) . . .
(b) . . .
Detailed action plans (a) . . .
(b) . . .
Multiple vision for better reaction (a) . . .
(b) . . .
No written strategy, but strong vision (a) . . .
(b) . . .
Quick reactions (a) . . .
(b) . . .
notes () n, () mean, () standard deviation, () standard error mean; (a) successfulexporters, (b) stagnants. -point Likert scale, – not true at all, – perfectly true.
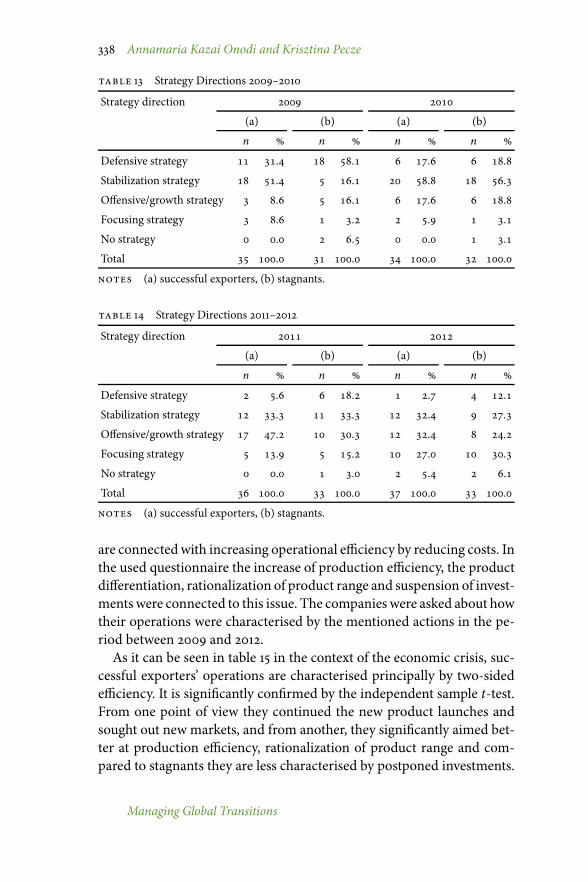
and different scenarios for the future. The adaptation to environmentalchanges is realised by using detailed action plans of these scenarios. Stag-nants are characterised by the lack of detailed action plans. It suggeststhat stagnant firms fail to implement their strategies because they do notplan the realisation by detailed action plans.In the beginning of the economic crisis, successful exporters were less
forced to apply defensive strategy. More than a half of this cluster’s firmsfollowed stabilization strategy (see tables 13 and 14). In the case of stag-nants, it was only 16. The majority of stagnants applied defensive strat-egy. It suggests that in the first year of recession stagnants were more in-fluenced by the effect of the crisis. In 2010, stabilization strategy becamedominant in both export clusters. The group of successful exporters couldexploit the growth in 2011. Almost half of the group could switch to offen-sive/growth strategy. It shows that they managed to overcome the crisisearlier than stagnants. In 2012 along with growth strategy, the focusingstrategy also came to the front. The rate of companies implementing fo-cusing strategy has doubled in both clusters.One of themain characteristics of a firm strategy is how itwill be imple-
mented. An organisation might have a range of strategic directions: thecompany could improve its profile to launching new products, it couldenter new markets, it could transform its existing products through rad-ical innovation. These strategic directions could be realised by differentmethods. In economic recession situations, the most common methods
Volume 12 · Number 4 · Winter 2014
338 Annamaria Kazai Onodi and Krisztina Pecze
table 13 Strategy Directions 2009–2010
Strategy direction
(a) (b) (a) (b)
n n n n
Defensive strategy . . . .
Stabilization strategy . . . .
Offensive/growth strategy . . . .
Focusing strategy . . . .
No strategy . . . .
Total . . . .
notes (a) successful exporters, (b) stagnants.
table 14 Strategy Directions 2011–2012
Strategy direction
(a) (b) (a) (b)
n n n n
Defensive strategy . . . .
Stabilization strategy . . . .
Offensive/growth strategy . . . .
Focusing strategy . . . .
No strategy . . . .
Total . . . .
notes (a) successful exporters, (b) stagnants.
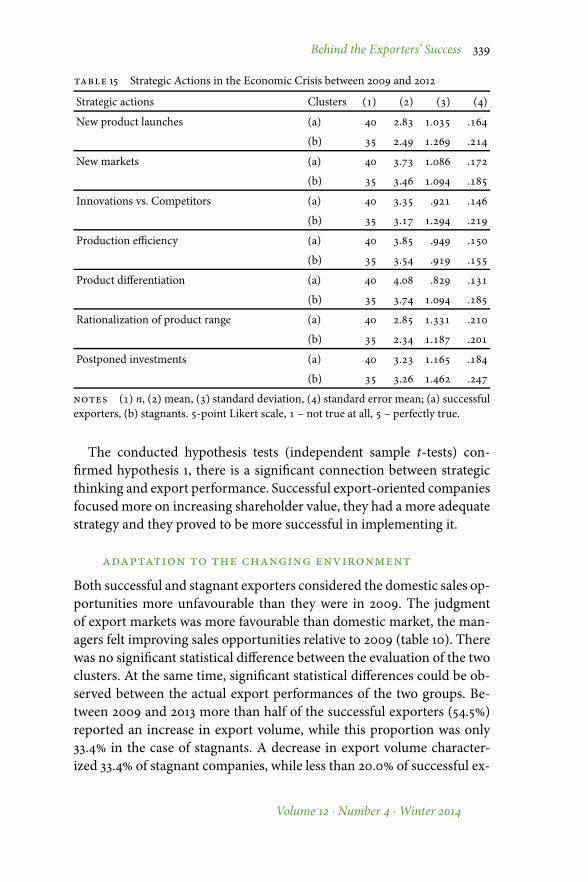
are connectedwith increasing operational efficiency by reducing costs. Inthe used questionnaire the increase of production efficiency, the productdifferentiation, rationalization of product range and suspension of invest-ments were connected to this issue. The companies were asked about howtheir operations were characterised by the mentioned actions in the pe-riod between 2009 and 2012.As it can be seen in table 15 in the context of the economic crisis, suc-
cessful exporters’ operations are characterised principally by two-sidedefficiency. It is significantly confirmed by the independent sample t-test.From one point of view they continued the new product launches andsought out new markets, and from another, they significantly aimed bet-ter at production efficiency, rationalization of product range and com-pared to stagnants they are less characterised by postponed investments.
Managing Global Transitions
Behind the Exporters’ Success 339
table 15 Strategic Actions in the Economic Crisis between 2009 and 2012
Strategic actions Clusters () () () ()
New product launches (a) . . .
(b) . . .
New markets (a) . . .
(b) . . .
Innovations vs. Competitors (a) . . .
(b) . . .
Production efficiency (a) . . .
(b) . . .
Product differentiation (a) . . .
(b) . . .
Rationalization of product range (a) . . .
(b) . . .
Postponed investments (a) . . .
(b) . . .
notes () n, () mean, () standard deviation, () standard error mean; (a) successfulexporters, (b) stagnants. -point Likert scale, – not true at all, – perfectly true.
The conducted hypothesis tests (independent sample t-tests) con-firmed hypothesis 1, there is a significant connection between strategicthinking and export performance. Successful export-oriented companiesfocused more on increasing shareholder value, they had a more adequatestrategy and they proved to be more successful in implementing it.
adaptation to the changing environment
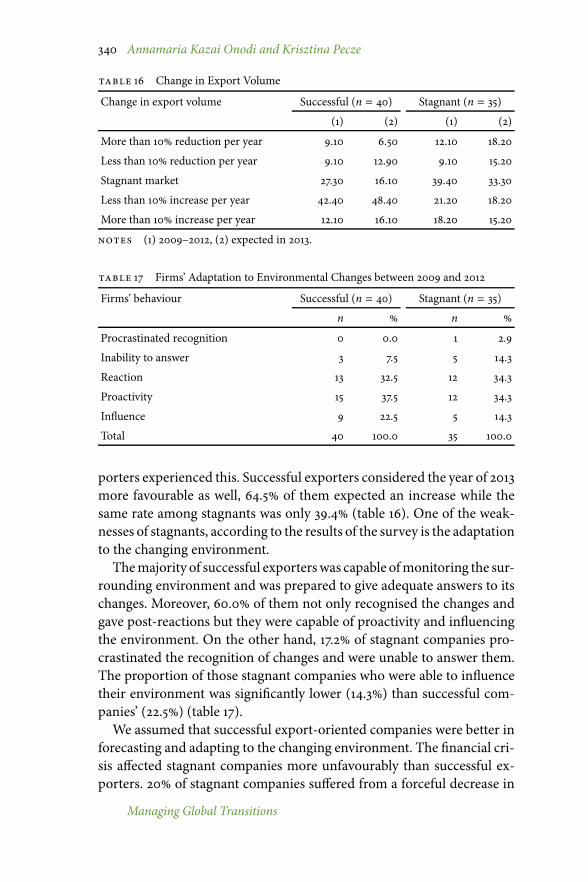
Both successful and stagnant exporters considered the domestic sales op-portunities more unfavourable than they were in 2009. The judgmentof export markets was more favourable than domestic market, the man-agers felt improving sales opportunities relative to 2009 (table 10). Therewas no significant statistical difference between the evaluation of the twoclusters. At the same time, significant statistical differences could be ob-served between the actual export performances of the two groups. Be-tween 2009 and 2013 more than half of the successful exporters (54.5)reported an increase in export volume, while this proportion was only33.4 in the case of stagnants. A decrease in export volume character-ized 33.4 of stagnant companies, while less than 20.0 of successful ex-
Volume 12 · Number 4 · Winter 2014
340 Annamaria Kazai Onodi and Krisztina Pecze
table 16 Change in Export Volume
Change in export volume Successful (n = 40) Stagnant (n = 35)
(1) (2) (1) (2)
More than 10 reduction per year 9.10 6.50 12.10 18.20
Less than 10 reduction per year 9.10 12.90 9.10 15.20
Stagnant market 27.30 16.10 39.40 33.30
Less than 10 increase per year 42.40 48.40 21.20 18.20
More than 10 increase per year 12.10 16.10 18.20 15.20
notes (1) 2009–2012, (2) expected in 2013.
table 17 Firms’ Adaptation to Environmental Changes between 2009 and 2012
Firms’ behaviour Successful (n = 40) Stagnant (n = 35)
n n
Procrastinated recognition 0 0.0 1 2.9
Inability to answer 3 7.5 5 14.3
Reaction 13 32.5 12 34.3
Proactivity 15 37.5 12 34.3
Influence 9 22.5 5 14.3
Total 40 100.0 35 100.0
porters experienced this. Successful exporters considered the year of 2013more favourable as well, 64.5 of them expected an increase while thesame rate among stagnants was only 39.4 (table 16). One of the weak-nesses of stagnants, according to the results of the survey is the adaptationto the changing environment.Themajority of successful exporterswas capable ofmonitoring the sur-
rounding environment and was prepared to give adequate answers to itschanges. Moreover, 60.0 of them not only recognised the changes andgave post-reactions but they were capable of proactivity and influencingthe environment. On the other hand, 17.2 of stagnant companies pro-crastinated the recognition of changes and were unable to answer them.The proportion of those stagnant companies who were able to influencetheir environment was significantly lower (14.3) than successful com-panies’ (22.5) (table 17).We assumed that successful export-oriented companies were better in
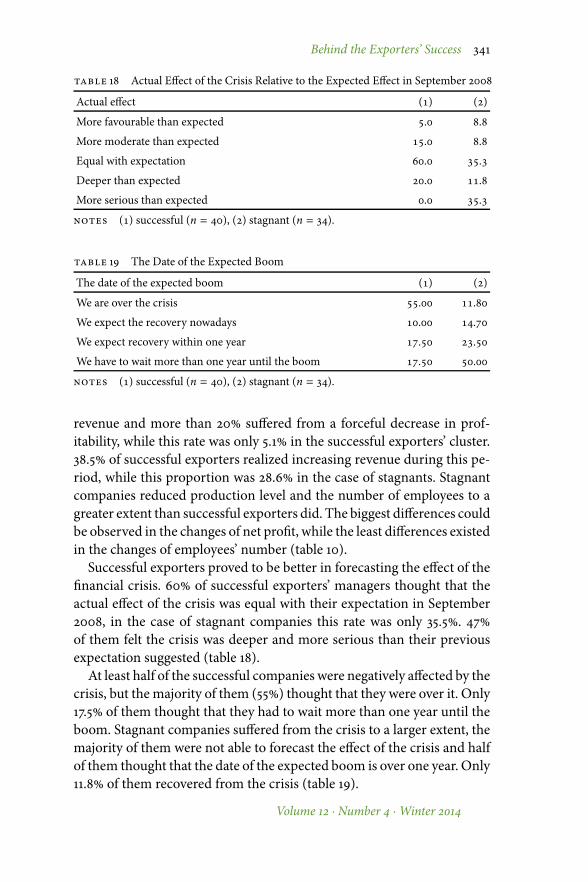
forecasting and adapting to the changing environment. The financial cri-sis affected stagnant companies more unfavourably than successful ex-porters. 20 of stagnant companies suffered from a forceful decrease in
Managing Global Transitions
Behind the Exporters’ Success 341
table 18 Actual Effect of the Crisis Relative to the Expected Effect in September 2008
Actual effect () ()
More favourable than expected . .
More moderate than expected . .
Equal with expectation . .
Deeper than expected . .
More serious than expected . .
notes () successful (n = 40), () stagnant (n = 34).
table 19 The Date of the Expected Boom
The date of the expected boom () ()
We are over the crisis . .
We expect the recovery nowadays . .
We expect recovery within one year . .
We have to wait more than one year until the boom . .
notes () successful (n = 40), () stagnant (n = 34).
revenue and more than 20 suffered from a forceful decrease in prof-itability, while this rate was only 5.1 in the successful exporters’ cluster.38.5 of successful exporters realized increasing revenue during this pe-riod, while this proportion was 28.6 in the case of stagnants. Stagnantcompanies reduced production level and the number of employees to agreater extent than successful exporters did. The biggest differences couldbe observed in the changes of net profit, while the least differences existedin the changes of employees’ number (table 10).Successful exporters proved to be better in forecasting the effect of the
financial crisis. 60 of successful exporters’ managers thought that theactual effect of the crisis was equal with their expectation in September2008, in the case of stagnant companies this rate was only 35.5. 47of them felt the crisis was deeper and more serious than their previousexpectation suggested (table 18).At least half of the successful companies were negatively affected by the
crisis, but the majority of them (55) thought that they were over it. Only17.5 of them thought that they had to wait more than one year until theboom. Stagnant companies suffered from the crisis to a larger extent, themajority of them were not able to forecast the effect of the crisis and halfof them thought that the date of the expected boom is over one year. Only11.8 of them recovered from the crisis (table 19).
Volume 12 · Number 4 · Winter 2014
342 Annamaria Kazai Onodi and Krisztina Pecze
table 20 Self-Evaluation Relative to the Strongest Competitor
Item () ()
Cost efficiency . .
Competitive prices . .
Product quality . .
Product range . .
Production level . .
Short delivery time . .
Delivery on time . .
Flexibility of logistics . .
Creating customer value (opinion of mark. managers) . .
Knowledge of customer needs (opinion of mark. managers) . .
Direct contact with customers . .
Responding to customer needs (opinion of mark. managers) . .
Adjustment to changing customer demand . .
Use of innovative sales incentives . .
Market forecast . .
Responding to competitors’ actions (opinion of mark. managers) . .
Industry forecast (opinion of mark. managers) . .
Employee qualifications . .
Number of innovations . .
R&D expenditure level . .
Ethical conduct . .
Using environmentally friendly material . .
notes () successful (n = 40), () stagnant (n = 34). -point Likert scale, – not trueat all, – perfectly true.
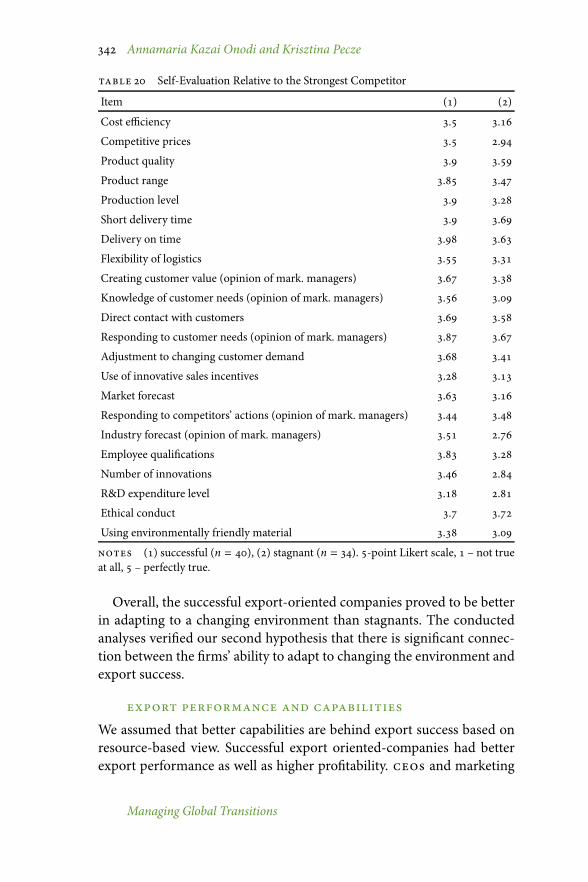
Overall, the successful export-oriented companies proved to be betterin adapting to a changing environment than stagnants. The conductedanalyses verified our second hypothesis that there is significant connec-tion between the firms’ ability to adapt to changing the environment andexport success.
export performance and capabilitiesWe assumed that better capabilities are behind export success based onresource-based view. Successful export oriented-companies had betterexport performance as well as higher profitability. ceos and marketing
Managing Global Transitions
Behind the Exporters’ Success 343
managers were asked to evaluate their companies’ performance relativeto strongest competitors. We compared ceos’ opinions using 17 factorsandmarketing managers’ opinions using 5 factors. There were no signifi-cant differences in the case of only two factors (ethical conduct, respond-ing to competitors’ actions). Independent samples t-test confirmed thatthe successful exporters’ self-evaluations were better than stagnants’. Thebiggest differences can be observed in the industry forecast. The market-ing managers of stagnant companies considered their forecasting abili-ties weaker than their competitors’. In connection with it, stagnants’ self-evaluation proved to be weaker than successful companies concerningmarket forecast, knowledge of customer needs, responding to customerneeds, adjustment to the changing customer demand. These results un-derpin our previous conclusions that successful export-oriented compa-nies are better at adjusting to a changing environment. Beyond this, thebiggest differences occurred in production level, number of innovations,competitive prices and employee qualifications but significant differencescould be observed in logistics, product quality, product range and cost ef-ficiency. We have to highlight that stagnants evaluated their own perfor-mance weaker than strongest competitors’ not only in industry forecastbut in level of prices and innovations (table 20).Managerial self-evaluation might contain several distortion factors.
The reliability of these results was increased by the fact that two differ-ent persons within a company gave similar evaluations and the analysisof different parts of the questionnaires indicated similar conclusions. Wealso compared the managerial capabilities based on self-evaluations. Sta-tistically significant differences can only be observed in half of the investi-gated factors (this rate was 90 in the case of companies’ characteristics).Managers of successful exporters proved to be better at professional skills,leadership capabilities, analytical and computing skills, but there were nodifferences for example in problem solving, communication and businessskills, and willingness to take risks.We conducted a regression analysis to identify the capabilities that had
the strongest influence on export performance (measured by export vol-ume). The explanatory power of the regression function was weak (5.3),the most deceiving factors were customer value creation and deliverytime, which are consistent with the previous results.Overall, the successful export-oriented companies proved to be better
at operational characteristics than stagnants, the biggest differences couldbe observed in forecasting and innovation. The conducted analyses ver-
Volume 12 · Number 4 · Winter 2014
344 Annamaria Kazai Onodi and Krisztina Pecze
ified our third hypothesis that there is a significant connection betweenthe firms’ capabilities and export success.
Discussion
Successful export-oriented companies are more proactive and innovativethan stagnants, thus they are capable of adapting to the changing envi-ronment. The study confirms the view held by Reid (1981) that exportingmust be considered as a dynamic capability because the context of a firmchanges continually throughout its exporting processes. Managers of lesssuccessful exporter companies need to develop the capabilities to moni-tor environmental changes. They need to lead the company in a mannerthat allows them to become more proactive and more flexible in theirstrategy.The study highlighted that the appropriate strategic thinking could
play a significant role in improving export success. Stagnants wereweakerin the realisation of their strategic goals because of the lack of strate-gic planning and detailed action plans. The implication of the study isthat stagnant companies need to develop their forecast abilities, flexibil-ity to adapt to the changing environment and operational efficiency. Stag-nant companies lagged behind successful exporters concerning industryforecast, production level, number of innovations, competitive prices andemployee qualifications.
References
Ábel, I., and E. Czakó (eds.). 2013. Az export siker nyomában. Budapest:Alinea.
Barney, J. 1991. ‘Firm Resources and Sustained Competitive Advantage.’Journal of Management 17 (1): 99–120.
Calantone, R. J., D. Kim, J. B. Schmidt, and T. S. Cavusgil 2006. ‘The In-fluence of Internal and External Firm Factors on International ProductAdaptation Strategy and Export Performance: A Three-Country Com-parison.’ Journal of Business Research 59:176–85.
Dean, D. L., B. Mengüc, and C. P. Myers. 2000. ‘Revising Firm Character-istics, Strategy, and Export Performance Relationship.’ Industrial Mar-keting Management 29:461–77.
Dhanaraj, C., in W. P. Beamish. 2003. ‘A Resource-Based Approach to theStudy of Export Performance.’ Journal of Small Business Management41 (3): 242–61
Grant, R.M. 1996. ‘Toward aKnowledge-Based Theory of the Firm.’ Strate-gic Management Journal 17 (Winter Special Issue): 93–107.
Managing Global Transitions
Behind the Exporters’ Success 345
Haahti, A., V. Madupu, U. Yavas, and E. Babakus. 2005. ‘CooperativeStrategy, Knowledge Intensity and Export Performance of Small andMedium Sized Enterprises. Journal of World Business 40:124–38.
Hatemi, A. J., and M. Irandoust. 2001. ‘Productivity Performance and Ex-port Performance.’ Eastern Economic Journal 27 (2): 149–64.
Lee, J., and B. Habte-Giorgis. 2004. ‘Empirical Approach to the Sequen-tial Relationships between Firm Strategy, Export Activity, and Per-formance in us Manufacturing Firms.’ International Business Review13:101–29.
Kállay, L., and L. Lengyel. 2008. ‘A magyar kis- és középvállalatok nemzet-köziesedésének főbb jellemői az Európai Uniós csatlakozás előtt.’ Vál-lalkozás és Innováció 2 (1): 54–76.
Knudsen, T., and T. K. Madsen 2002. ‘Export Strategy: A Dynamic Capa-bilities Perspective.’ Scandinavian Journal of Management 18:475–502.
Kor, Y. Y., and A. Mesko. 2013. ‘Dynamic Managerial Capabilities: Con-figuration of Top Executives’ Capabilities and Firm’s Dominant Logic.’Strategic Management Journal 31:233–44.
Leonidou, C. L., C. S. Katsikeas, and S. Samiee. 2002. ‘Marketing Strat-egy Determinants of Export Performance: AMeta-Analysis.’ Journal ofBusiness Research 55:51–67.
Matyusz, Z. 2014. ‘A 2013-as versenyképességi kutatás vállalati mintájánakalap jellemzői és reprezentativitása.’ https://webmail.uni-corvinus.hu/service/home/ /?auth=co&loc=hu_HU&id=12172&part=4
Munkácsi, Zs. 2009. ‘Kik exportálnak Magyarországon? Vállalati méretés külföldi tulajdon szerinti exportkoncentráció és a külföldi tulajdonhatása az exportorientációra.’ mnb-szemle, July, 22–38.
Porter, M. E. 1980. Competitive Strategy: Technique for Analysing Industriesand Competitors.New York: Free Press.
———. 1990. Competitive Advantages of Nations.New York: Free Press.Reid, S. D. 1981. ‘The Decision-Maker and Export Entry and Expansion.’
Journal of International Business Studies 12 (2): 101–12Robertson, C., and S. K. Chetty. 2000. ‘A Contingency-Based Approach
to Understanding Export Performance.’ International Business Review9:211–35.
Szerb, L., and G. Márkus. 2008. ‘Nemzetköziesedési tendenciák a kis ésközepes méretű vállalatok körében Magyarországon a 2000-es évekközepén.’ Vállalkozás és Innováció 2 (2): 36–58.
Teece,D. J. 2014. ‘ADynamicCapabilities-BasedEntrepreneurial Theory ofthe Multinational Enterprise.’ Journal of International Business Studies45:8–37.
Teece, D. J., G. Pisano, and A. Shuen. 1997. ‘Dynamic Capabilities andStrategic Management.’ Strategic Management Journal 18:509–34.
Volume 12 · Number 4 · Winter 2014
346 Annamaria Kazai Onodi and Krisztina Pecze
Wernerfelt, B. 1984. ‘A Resource-Based View of the Firm.’ Strategic Man-agement Journal 5:171–80
Wolf, J. A., and T. L. Pett. 2000. ‘Internationalization of Small Firms: AnExamination of Export Competitive Patterns, Firmsize, and ExportPerformance.’ Journal of Small Business Management 38 (2): 34–47.
This paper is published under the terms of the Attribution-NonCommercial-NoDerivatives 4.0 International (cc by-nc-nd 4.0)License (http://creativecommons.org/licenses/by-nc-nd/4.0/).
Managing Global Transitions