Embed Size (px)
Citation preview

Belgium: WHO and UNICEF estimates of immunization coverage: 2018 revision
July 2, 2019; page 1 WHO and UNICEF estimates of national immunization coverage - next revision available July 15, 2020 data received as of June 28, 2019

Belgium: WHO and UNICEF estimates of immunization coverage: 2018 revision
BACKGROUND NOTE: Each year WHO and UNICEF jointly review reports submitted by MemberStates regarding national immunization coverage, finalized survey reports as well as data from thepublished and grey literature. Based on these data, with due consideration to potential biases and theviews of local experts, WHO and UNICEF attempt to distinguish between situations where theavailable empirical data accurately reflect immunization system performance and those where the dataare likely to be compromised and present a misleading view of immunization coverage while jointlyestimating the most likely coverage levels for each country.
WHO and UNICEF estimates are country-specific; that is to say, each country’s data are reviewedindividually, and data are not borrowed from other countries in the absence of data. Estimates are notbased on ad hoc adjustments to reported data; in some instances empirical data are available from asingle source, usually the nationally reported coverage data. In cases where no data are available for agiven country/vaccine/year combination, data are considered from earlier and later years andinterpolated to estimate coverage for the missing year(s). In cases where data sources are mixed andshow large variation, an attempt is made to identify the most likely estimate with consideration of thepossible biases in available data. For methods see:
*Burton et al. 2009. WHO and UNICEF estimates of national infant immunization coverage: methodsand processes.*Burton et al. 2012. A formal representation of the WHO and UNICEF estimates of nationalimmunization coverage: a computational logic approach.*Brown et al. 2013. An introduction to the grade of confidence used to characterize uncertainty aroundthe WHO and UNICEF estimates of national immunization coverage.
DATA SOURCES.
ADMINISTRATIVE coverage: Reported by national authorities and based on aggregatedadministrative reports from health service providers on the number of vaccinations administeredduring a given period (numerator data) and reported target population data (denominator data).May be biased by inaccurate numerator and/or denominator data.
OFFICIAL coverage: Estimated coverage reported by national authorities that reflects theirassessment of the most likely coverage based on any combination of administrative coverage,survey-based estimates or other data sources or adjustments. Approaches to determineOFFICIAL coverage may differ across countries.
SURVEY coverage: Based on estimated coverage from population-based household surveys amongchildren aged 12-23 months or 24-35 months following a review of survey methods and results.Information is based on the combination of vaccination history from documented evidence orcaregiver recall. Survey results are considered for the appropriate birth cohort based on theperiod of data collection.
ABBREVIATIONS
BCG: percentage of births who received one dose of Bacillus Calmette Guerin vaccine.
DTP1 / DTP3: percentage of surviving infants who received the 1st / 3rd dose, respectively, ofdiphtheria and tetanus toxoid with pertussis containing vaccine.
Pol3: percentage of surviving infants who received the 3rd dose of polio containing vaccine. May beeither oral or inactivated polio vaccine.
IPV1: percentage of surviving infants who received at least one dose of inactivated polio vaccine. Incountries utilizing an immunization schedule recommending either (i) a primary series of threedoses of oral polio vaccine (OPV) plus at least one dose of IPV where OPV is included in routine
immunization and/or campaign or (ii) a sequential schedule of IPV followed by OPV, WHO andUNICEF estimates for IPV1 reflect coverage with at least one routine dose of IPV among infants<1 year of age among countries. For countries utilizing IPV containing vaccine use only, i.e., norecommended dose of OPV, the WHO and UNICEF estimate for IPV1 corresponds to coveragefor the 1st dose of IPV.
Production of IPV coverage estimates, which begins in 2015, results in no change of theestimated coverage levels for the 3rd dose of polio (Pol3). For countries recommending routineimmunization with a primary series of three doses of IPV alone, WHO and UNICEF estimatedPol3 coverage is equivalent to estimated coverage with three doses of IPV. For countries with asequential schedule, estimated Pol3 coverage is based on that for the 3rd dose of polio vaccineregardless of vaccine type.
MCV1: percentage of surviving infants who received the 1st dose of measles containing vaccine. Incountries where the national schedule recommends the 1st dose of MCV at 12 months or laterbased on the epidemiology of disease in the country, coverage estimates reflect the percentage ofchildren who received the 1st dose of MCV as recommended.
MCV2: percentage of children who received the 2nd dose of measles containing vaccine according tothe nationally recommended schedule.
RCV1: percentage of surviving infants who received the 1st dose of rubella containing vaccine. Coverage estimates are based on WHO and UNICEF estimates of coverage for the dose of measlescontaining vaccine that corresponds to the first measles-rubella combination vaccine. Nationallyreported coverage of RCV is not taken into consideration nor are the data represented in theaccompanying graph and data table.
HepBB: percentage of births which received a dose of hepatitis B vaccine within 24 hours of delivery.Estimates of hepatitis B birth dose coverage are produced only for countries with a universalbirth dose policy. Estimates are not produced for countries that recommend a birth dose toinfants born to HepB virus-infected mothers only or where there is insufficient information todetermine whether vaccination is within 24 hours of birth.
HepB3: percentage of surviving infants who received the 3rd dose of hepatitis B containing vaccinefollowing the birth dose.
Hib3: percentage of surviving infants who received the 3rd dose of Haemophilus influenzae type bcontaining vaccine.
RotaC: percentage of surviving infants who received the final recommended dose of rotavirus vaccine,which can be either the 2nd or the 3rd dose depending on the vaccine.
PcV3: percentage of surviving infants who received the 3rd dose of pneumococcal conjugate vaccine.In countries where the national schedule recommends two doses during infancy and a boosterdose at 12 months or later based on the epidemiology of disease in the country, coverageestimates may reflect the percentage of surviving infants who received two doses of PcV prior tothe 1st birthday.
YFV: percentage of surviving infants who received one dose of yellow fever vaccine in countries whereYFV is part of the national immunization schedule for children or is recommended in at riskareas; coverage estimates are annualized for the entire cohort of surviving infants.
Disclaimer: All reasonable precautions have been taken by the World Health Organization andUnited Nations Children’s Fund to verify the information contained in this publication. However,the published material is being distributed without warranty of any kind, either expressed orimplied. The responsibility for the interpretation and use of the material lies with the reader. Inno event shall the World Health Organization or United Nations Children’s Fund be liable fordamages arising from its use.
July 2, 2019; page 2 WHO and UNICEF estimates of national immunization coverage - next revision available July 15, 2020 data received as of June 28, 2019

Belgium - BCG
2007 2008 2009 2010 2011 2012 2013 2014 2015 2016 2017 2018Estimate NA NA NA NA NA NA NA NA NA NA NA NA
Estimate GoC NA NA NA NA NA NA NA NA NA NA NA NA
Official NA NA NA NA NA NA NA NA NA NA NA NAAdministrative NA NA NA NA NA NA NA NA NA NA NA NA
Survey NA NA NA NA NA NA NA NA NA NA NA NA
The WHO and UNICEF estimates of national immunization coverage (wuenic) are based on data and informationthat are of varying, and, in some instances, unknown quality. Beginning with the 2011 revision we describethe grade of confidence (GoC) we have in these estimates. As there is no underlying probability model uponwhich the estimates are based, we are unable to present classical measures of uncertainty, e.g., confidenceintervals. Moreover, we have chosen not to make subjective estimates of plausibility/certainty ranges aroundthe coverage. The GoC reflects the degree of empirical support upon which the estimates are based. It isnot a judgment of the quality of data reported by national authorities.
••• Estimate is supported by reported data [R+], coverage recalculated with an independent denominatorfrom the World Population Prospects: 2017 revision from the UN Population Division (D+), and atleast one supporting survey within 2 years [S+]. While well supported, the estimate still carries a riskof being wrong.
•• Estimate is supported by at least one data source; [R+], [S+], or [D+]; and no data source, [R-], [D-], or[S-], challenges the estimate.
• There are no directly supporting data; or data from at least one source; [R-], [D-], [S-]; challenge the estimate.
In all cases these estimates should be used with caution and should be assessed in lightof the objective for which they are being used.
July 2, 2019; page 3 WHO and UNICEF estimates of national immunization coverage - next revision available July 15, 2020 data received as of June 28, 2019

Belgium - DTP1
2007 2008 2009 2010 2011 2012 2013 2014 2015 2016 2017 2018Estimate 99 99 99 99 99 99 99 99 99 99 99 99
Estimate GoC •• •• •• •• •• •• •• •• •• •• •• ••Official 99 99 100 100 100 100 100 100 100 99 99 99
Administrative NA NA NA NA NA NA NA NA NA NA NA NASurvey NA NA NA NA NA NA NA NA NA NA NA NA
The WHO and UNICEF estimates of national immunization coverage (wuenic) are based on data and informationthat are of varying, and, in some instances, unknown quality. Beginning with the 2011 revision we describethe grade of confidence (GoC) we have in these estimates. As there is no underlying probability model uponwhich the estimates are based, we are unable to present classical measures of uncertainty, e.g., confidenceintervals. Moreover, we have chosen not to make subjective estimates of plausibility/certainty ranges aroundthe coverage. The GoC reflects the degree of empirical support upon which the estimates are based. It isnot a judgment of the quality of data reported by national authorities.
••• Estimate is supported by reported data [R+], coverage recalculated with an independent denominatorfrom the World Population Prospects: 2017 revision from the UN Population Division (D+), and atleast one supporting survey within 2 years [S+]. While well supported, the estimate still carries a riskof being wrong.
•• Estimate is supported by at least one data source; [R+], [S+], or [D+]; and no data source, [R-], [D-], or[S-], challenges the estimate.
• There are no directly supporting data; or data from at least one source; [R-], [D-], [S-]; challenge the estimate.
In all cases these estimates should be used with caution and should be assessed in lightof the objective for which they are being used.
Description:
2018: Estimate based on coverage reported by national government. National government re-ports are based on population weighted regional survey results from Flanders (2016),Wallonia (2015) and Brussels (2012) and an assumption of stable coverage since the yearof the most recent regional survey and year of calculation. GoC=R+
2017: Estimate based on coverage reported by national government. National government re-ports are based on population weighted regional survey results from Flanders (2016),Wallonia (2015) and Brussels (2012) and an assumption of stable coverage since the yearof the most recent regional survey and year of calculation. GoC=R+
2016: Estimate based on coverage reported by national government. National government re-ports are based on population weighted regional survey results from Flanders (2016),Wallonia (2015) and Brussels (2012) and an assumption of stable coverage since the yearof the most recent regional survey and year of calculation. GoC=R+
2015: Estimate based on coverage reported by national government. National government re-ports are based on population weighted regional survey results from Flanders (2016),Wallonia (2015) and Brussels (2012) and an assumption of stable coverage since the yearof the most recent regional survey and year of calculation. GoC=R+
2014: Estimate based on coverage reported by national government. National government re-ports are based on population weighted regional survey results from Flanders (2008),Wallonia (2009) and Brussels (2006) and an assumption of stable coverage since the yearof the most recent regional survey and year of calculation. GoC=R+
2013: Estimate based on coverage reported by national government. National government re-ports are based on population weighted regional survey results from Flanders (2008),Wallonia (2009) and Brussels (2006) and an assumption of stable coverage since the yearof the most recent regional survey and year of calculation. GoC=R+
2012: Estimate based on coverage reported by national government. National government re-ports are based on population weighted regional survey results from Flanders (2008),Wallonia (2009) and Brussels (2006) and an assumption of stable coverage since the yearof the most recent regional survey and year of calculation. GoC=R+
2011: Estimate based on coverage reported by national government. National government re-ports are based on population weighted regional survey results from Flanders (2008),Wallonia (2009) and Brussels (2006) and an assumption of stable coverage since the yearof the most recent regional survey and year of calculation. GoC=R+
2010: Estimate based on coverage reported by national government. National government re-ports are based on population weighted regional survey results from Flanders (2008),Wallonia (2009) and Brussels (2006) and an assumption of stable coverage since the yearof the most recent regional survey and year of calculation. GoC=R+
2009: Estimate based on coverage reported by national government. National government re-ports are based on population weighted regional survey results from Flanders (2008),Wallonia (2009) and Brussels (2006) and an assumption of stable coverage since the yearof the most recent regional survey and year of calculation. GoC=R+
2008: Estimate based on coverage reported by national government. GoC=R+
July 2, 2019; page 4 WHO and UNICEF estimates of national immunization coverage - next revision available July 15, 2020 data received as of June 28, 2019

Belgium - DTP1
2007: Estimate based on coverage reported by national government. GoC=R+
July 2, 2019; page 5 WHO and UNICEF estimates of national immunization coverage - next revision available July 15, 2020 data received as of June 28, 2019
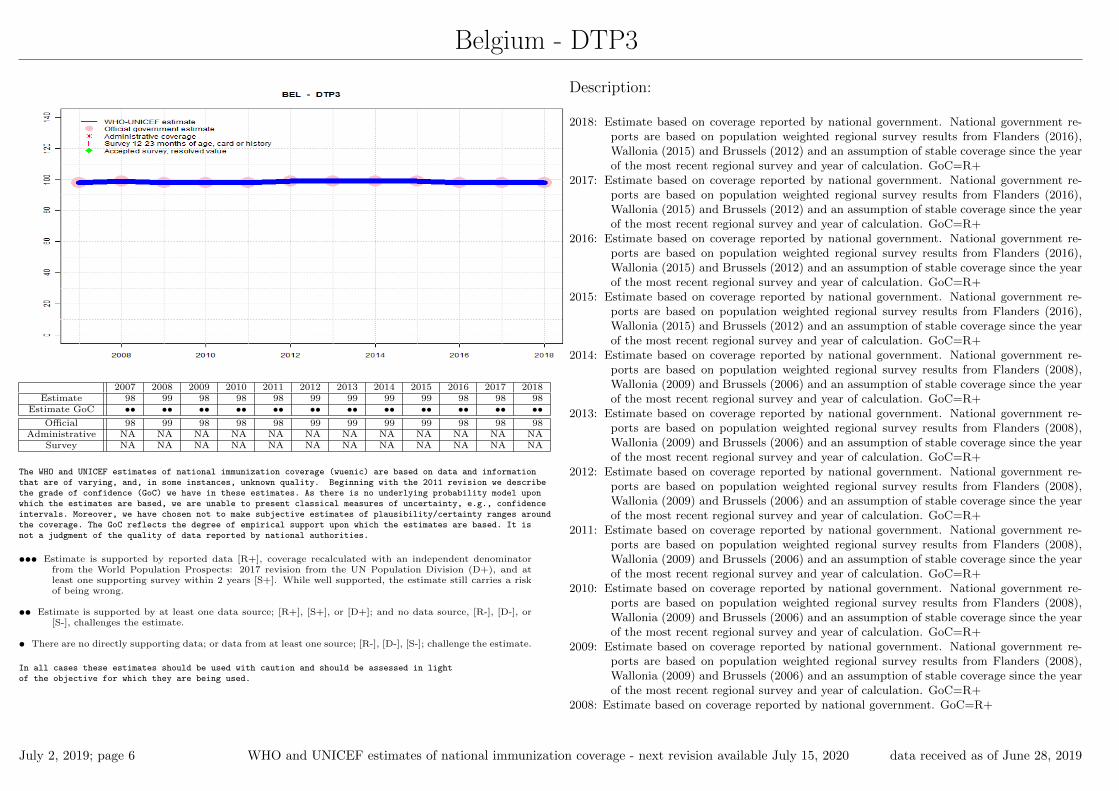
Belgium - DTP3
2007 2008 2009 2010 2011 2012 2013 2014 2015 2016 2017 2018Estimate 98 99 98 98 98 99 99 99 99 98 98 98
Estimate GoC •• •• •• •• •• •• •• •• •• •• •• ••Official 98 99 98 98 98 99 99 99 99 98 98 98
Administrative NA NA NA NA NA NA NA NA NA NA NA NASurvey NA NA NA NA NA NA NA NA NA NA NA NA
The WHO and UNICEF estimates of national immunization coverage (wuenic) are based on data and informationthat are of varying, and, in some instances, unknown quality. Beginning with the 2011 revision we describethe grade of confidence (GoC) we have in these estimates. As there is no underlying probability model uponwhich the estimates are based, we are unable to present classical measures of uncertainty, e.g., confidenceintervals. Moreover, we have chosen not to make subjective estimates of plausibility/certainty ranges aroundthe coverage. The GoC reflects the degree of empirical support upon which the estimates are based. It isnot a judgment of the quality of data reported by national authorities.
••• Estimate is supported by reported data [R+], coverage recalculated with an independent denominatorfrom the World Population Prospects: 2017 revision from the UN Population Division (D+), and atleast one supporting survey within 2 years [S+]. While well supported, the estimate still carries a riskof being wrong.
•• Estimate is supported by at least one data source; [R+], [S+], or [D+]; and no data source, [R-], [D-], or[S-], challenges the estimate.
• There are no directly supporting data; or data from at least one source; [R-], [D-], [S-]; challenge the estimate.
In all cases these estimates should be used with caution and should be assessed in lightof the objective for which they are being used.
Description:
2018: Estimate based on coverage reported by national government. National government re-ports are based on population weighted regional survey results from Flanders (2016),Wallonia (2015) and Brussels (2012) and an assumption of stable coverage since the yearof the most recent regional survey and year of calculation. GoC=R+
2017: Estimate based on coverage reported by national government. National government re-ports are based on population weighted regional survey results from Flanders (2016),Wallonia (2015) and Brussels (2012) and an assumption of stable coverage since the yearof the most recent regional survey and year of calculation. GoC=R+
2016: Estimate based on coverage reported by national government. National government re-ports are based on population weighted regional survey results from Flanders (2016),Wallonia (2015) and Brussels (2012) and an assumption of stable coverage since the yearof the most recent regional survey and year of calculation. GoC=R+
2015: Estimate based on coverage reported by national government. National government re-ports are based on population weighted regional survey results from Flanders (2016),Wallonia (2015) and Brussels (2012) and an assumption of stable coverage since the yearof the most recent regional survey and year of calculation. GoC=R+
2014: Estimate based on coverage reported by national government. National government re-ports are based on population weighted regional survey results from Flanders (2008),Wallonia (2009) and Brussels (2006) and an assumption of stable coverage since the yearof the most recent regional survey and year of calculation. GoC=R+
2013: Estimate based on coverage reported by national government. National government re-ports are based on population weighted regional survey results from Flanders (2008),Wallonia (2009) and Brussels (2006) and an assumption of stable coverage since the yearof the most recent regional survey and year of calculation. GoC=R+
2012: Estimate based on coverage reported by national government. National government re-ports are based on population weighted regional survey results from Flanders (2008),Wallonia (2009) and Brussels (2006) and an assumption of stable coverage since the yearof the most recent regional survey and year of calculation. GoC=R+
2011: Estimate based on coverage reported by national government. National government re-ports are based on population weighted regional survey results from Flanders (2008),Wallonia (2009) and Brussels (2006) and an assumption of stable coverage since the yearof the most recent regional survey and year of calculation. GoC=R+
2010: Estimate based on coverage reported by national government. National government re-ports are based on population weighted regional survey results from Flanders (2008),Wallonia (2009) and Brussels (2006) and an assumption of stable coverage since the yearof the most recent regional survey and year of calculation. GoC=R+
2009: Estimate based on coverage reported by national government. National government re-ports are based on population weighted regional survey results from Flanders (2008),Wallonia (2009) and Brussels (2006) and an assumption of stable coverage since the yearof the most recent regional survey and year of calculation. GoC=R+
2008: Estimate based on coverage reported by national government. GoC=R+
July 2, 2019; page 6 WHO and UNICEF estimates of national immunization coverage - next revision available July 15, 2020 data received as of June 28, 2019

Belgium - DTP3
2007: Estimate based on coverage reported by national government. GoC=R+
July 2, 2019; page 7 WHO and UNICEF estimates of national immunization coverage - next revision available July 15, 2020 data received as of June 28, 2019

Belgium - Pol3
2007 2008 2009 2010 2011 2012 2013 2014 2015 2016 2017 2018Estimate 99 99 98 98 98 99 99 99 99 98 98 98
Estimate GoC •• •• •• •• •• •• •• •• •• •• •• ••Official 99 99 98 98 98 99 99 99 99 98 98 98
Administrative NA NA NA NA NA NA NA NA NA NA NA NASurvey NA NA NA NA NA NA NA NA NA NA NA NA
The WHO and UNICEF estimates of national immunization coverage (wuenic) are based on data and informationthat are of varying, and, in some instances, unknown quality. Beginning with the 2011 revision we describethe grade of confidence (GoC) we have in these estimates. As there is no underlying probability model uponwhich the estimates are based, we are unable to present classical measures of uncertainty, e.g., confidenceintervals. Moreover, we have chosen not to make subjective estimates of plausibility/certainty ranges aroundthe coverage. The GoC reflects the degree of empirical support upon which the estimates are based. It isnot a judgment of the quality of data reported by national authorities.
••• Estimate is supported by reported data [R+], coverage recalculated with an independent denominatorfrom the World Population Prospects: 2017 revision from the UN Population Division (D+), and atleast one supporting survey within 2 years [S+]. While well supported, the estimate still carries a riskof being wrong.
•• Estimate is supported by at least one data source; [R+], [S+], or [D+]; and no data source, [R-], [D-], or[S-], challenges the estimate.
• There are no directly supporting data; or data from at least one source; [R-], [D-], [S-]; challenge the estimate.
In all cases these estimates should be used with caution and should be assessed in lightof the objective for which they are being used.
Description:
2018: Estimate based on coverage reported by national government. National government re-ports are based on population weighted regional survey results from Flanders (2016),Wallonia (2015) and Brussels (2012) and an assumption of stable coverage since the yearof the most recent regional survey and year of calculation. GoC=R+
2017: Estimate based on coverage reported by national government. National government re-ports are based on population weighted regional survey results from Flanders (2016),Wallonia (2015) and Brussels (2012) and an assumption of stable coverage since the yearof the most recent regional survey and year of calculation. GoC=R+
2016: Estimate based on coverage reported by national government. National government re-ports are based on population weighted regional survey results from Flanders (2016),Wallonia (2015) and Brussels (2012) and an assumption of stable coverage since the yearof the most recent regional survey and year of calculation. GoC=R+
2015: Estimate based on coverage reported by national government. National government re-ports are based on population weighted regional survey results from Flanders (2016),Wallonia (2015) and Brussels (2012) and an assumption of stable coverage since the yearof the most recent regional survey and year of calculation. GoC=R+
2014: Estimate based on coverage reported by national government. National government re-ports are based on population weighted regional survey results from Flanders (2008),Wallonia (2009) and Brussels (2006) and an assumption of stable coverage since the yearof the most recent regional survey and year of calculation. GoC=R+
2013: Estimate based on coverage reported by national government. National government re-ports are based on population weighted regional survey results from Flanders (2008),Wallonia (2009) and Brussels (2006) and an assumption of stable coverage since the yearof the most recent regional survey and year of calculation. GoC=R+
2012: Estimate based on coverage reported by national government. National government re-ports are based on population weighted regional survey results from Flanders (2008),Wallonia (2009) and Brussels (2006) and an assumption of stable coverage since the yearof the most recent regional survey and year of calculation. GoC=R+
2011: Estimate based on coverage reported by national government. National government re-ports are based on population weighted regional survey results from Flanders (2008),Wallonia (2009) and Brussels (2006) and an assumption of stable coverage since the yearof the most recent regional survey and year of calculation. GoC=R+
2010: Estimate based on coverage reported by national government. National government re-ports are based on population weighted regional survey results from Flanders (2008),Wallonia (2009) and Brussels (2006) and an assumption of stable coverage since the yearof the most recent regional survey and year of calculation. GoC=R+
2009: Estimate based on coverage reported by national government. National government re-ports are based on population weighted regional survey results from Flanders (2008),Wallonia (2009) and Brussels (2006) and an assumption of stable coverage since the yearof the most recent regional survey and year of calculation. GoC=R+
2008: Estimate based on coverage reported by national government. GoC=R+
July 2, 2019; page 8 WHO and UNICEF estimates of national immunization coverage - next revision available July 15, 2020 data received as of June 28, 2019

Belgium - Pol3
2007: Estimate based on coverage reported by national government. GoC=R+
July 2, 2019; page 9 WHO and UNICEF estimates of national immunization coverage - next revision available July 15, 2020 data received as of June 28, 2019

Belgium - IPV1
2007 2008 2009 2010 2011 2012 2013 2014 2015 2016 2017 2018Estimate NA NA NA NA NA NA NA NA 99 99 99 99
Estimate GoC NA NA NA NA NA NA NA NA •• •• •• ••Official 99 100 100 100 100 100 100 100 100 100 100 100
Administrative NA NA NA NA NA NA NA NA NA NA NA NASurvey NA NA NA NA NA NA NA NA NA NA NA NA
The WHO and UNICEF estimates of national immunization coverage (wuenic) are based on data and informationthat are of varying, and, in some instances, unknown quality. Beginning with the 2011 revision we describethe grade of confidence (GoC) we have in these estimates. As there is no underlying probability model uponwhich the estimates are based, we are unable to present classical measures of uncertainty, e.g., confidenceintervals. Moreover, we have chosen not to make subjective estimates of plausibility/certainty ranges aroundthe coverage. The GoC reflects the degree of empirical support upon which the estimates are based. It isnot a judgment of the quality of data reported by national authorities.
••• Estimate is supported by reported data [R+], coverage recalculated with an independent denominatorfrom the World Population Prospects: 2017 revision from the UN Population Division (D+), and atleast one supporting survey within 2 years [S+]. While well supported, the estimate still carries a riskof being wrong.
•• Estimate is supported by at least one data source; [R+], [S+], or [D+]; and no data source, [R-], [D-], or[S-], challenges the estimate.
• There are no directly supporting data; or data from at least one source; [R-], [D-], [S-]; challenge the estimate.
In all cases these estimates should be used with caution and should be assessed in lightof the objective for which they are being used.
Description:
Estimates for a dose of inactivated polio vaccine (IPV) begin in 2015 following the Global Po-lio Eradication Initiative’s Polio Eradication and Endgame Strategic Plan: 2013-2018which recommended at least one full dose or two fractional doses of IPV into routineimmunization schedules as a strategy to mitigate the potential consequences should anyre-emergence of type 2 poliovirus occur following the planned withdrawal of Sabin type2 strains from oral polio vaccine (OPV).
2018: Estimate based on coverage reported by national government. National government re-ports are based on population weighted regional survey results from Flanders (2016),Wallonia (2015) and Brussels (2012) and an assumption of stable coverage since the yearof the most recent regional survey and year of calculation. GoC=R+
2017: Estimate based on coverage reported by national government. National government re-ports are based on population weighted regional survey results from Flanders (2016),Wallonia (2015) and Brussels (2012) and an assumption of stable coverage since the yearof the most recent regional survey and year of calculation. GoC=R+
2016: Estimate based on coverage reported by national government. National government re-ports are based on population weighted regional survey results from Flanders (2016),Wallonia (2015) and Brussels (2012) and an assumption of stable coverage since the yearof the most recent regional survey and year of calculation. GoC=R+
2015: Estimate based on coverage reported by national government. National government re-ports are based on population weighted regional survey results from Flanders (2016),Wallonia (2015) and Brussels (2012) and an assumption of stable coverage since the yearof the most recent regional survey and year of calculation. GoC=R+
July 2, 2019; page 10 WHO and UNICEF estimates of national immunization coverage - next revision available July 15, 2020 data received as of June 28, 2019

Belgium - MCV1
2007 2008 2009 2010 2011 2012 2013 2014 2015 2016 2017 2018Estimate 92 93 95 95 95 96 96 96 96 96 96 96
Estimate GoC •• •• •• •• •• •• •• •• •• •• •• ••Official 92 93 95 95 95 96 96 96 96 96 96 96
Administrative NA NA NA NA NA NA NA NA NA NA NA NASurvey NA NA NA NA NA NA NA NA NA NA NA NA
The WHO and UNICEF estimates of national immunization coverage (wuenic) are based on data and informationthat are of varying, and, in some instances, unknown quality. Beginning with the 2011 revision we describethe grade of confidence (GoC) we have in these estimates. As there is no underlying probability model uponwhich the estimates are based, we are unable to present classical measures of uncertainty, e.g., confidenceintervals. Moreover, we have chosen not to make subjective estimates of plausibility/certainty ranges aroundthe coverage. The GoC reflects the degree of empirical support upon which the estimates are based. It isnot a judgment of the quality of data reported by national authorities.
••• Estimate is supported by reported data [R+], coverage recalculated with an independent denominatorfrom the World Population Prospects: 2017 revision from the UN Population Division (D+), and atleast one supporting survey within 2 years [S+]. While well supported, the estimate still carries a riskof being wrong.
•• Estimate is supported by at least one data source; [R+], [S+], or [D+]; and no data source, [R-], [D-], or[S-], challenges the estimate.
• There are no directly supporting data; or data from at least one source; [R-], [D-], [S-]; challenge the estimate.
In all cases these estimates should be used with caution and should be assessed in lightof the objective for which they are being used.
Description:
2018: Estimate based on coverage reported by national government. National government re-ports are based on population weighted regional survey results from Flanders (2016),Wallonia (2015) and Brussels (2012) and an assumption of stable coverage since the yearof the most recent regional survey and year of calculation. GoC=R+
2017: Estimate based on coverage reported by national government. National government re-ports are based on population weighted regional survey results from Flanders (2016),Wallonia (2015) and Brussels (2012) and an assumption of stable coverage since the yearof the most recent regional survey and year of calculation. GoC=R+
2016: Estimate based on coverage reported by national government. National government re-ports are based on population weighted regional survey results from Flanders (2016),Wallonia (2015) and Brussels (2012) and an assumption of stable coverage since the yearof the most recent regional survey and year of calculation. GoC=R+
2015: Estimate based on coverage reported by national government. National government re-ports are based on population weighted regional survey results from Flanders (2016),Wallonia (2015) and Brussels (2012) and an assumption of stable coverage since the yearof the most recent regional survey and year of calculation. GoC=R+
2014: Estimate based on coverage reported by national government. National government re-ports are based on population weighted regional survey results from Flanders (2008),Wallonia (2009) and Brussels (2006) and an assumption of stable coverage since the yearof the most recent regional survey and year of calculation. GoC=R+
2013: Estimate based on coverage reported by national government. National government re-ports are based on population weighted regional survey results from Flanders (2008),Wallonia (2009) and Brussels (2006) and an assumption of stable coverage since the yearof the most recent regional survey and year of calculation. GoC=R+
2012: Estimate based on coverage reported by national government. National government re-ports are based on population weighted regional survey results from Flanders (2008),Wallonia (2009) and Brussels (2006) and an assumption of stable coverage since the yearof the most recent regional survey and year of calculation. GoC=R+
2011: Estimate based on coverage reported by national government. National government re-ports are based on population weighted regional survey results from Flanders (2008),Wallonia (2009) and Brussels (2006) and an assumption of stable coverage since the yearof the most recent regional survey and year of calculation. GoC=R+
2010: Estimate based on coverage reported by national government. National government re-ports are based on population weighted regional survey results from Flanders (2008),Wallonia (2009) and Brussels (2006) and an assumption of stable coverage since the yearof the most recent regional survey and year of calculation. GoC=R+
2009: Estimate based on coverage reported by national government. National government re-ports are based on population weighted regional survey results from Flanders (2008),Wallonia (2009) and Brussels (2006) and an assumption of stable coverage since the yearof the most recent regional survey and year of calculation. GoC=R+
2008: Estimate based on coverage reported by national government. GoC=R+
July 2, 2019; page 11 WHO and UNICEF estimates of national immunization coverage - next revision available July 15, 2020 data received as of June 28, 2019

Belgium - MCV1
2007: Estimate based on coverage reported by national government. GoC=R+
July 2, 2019; page 12 WHO and UNICEF estimates of national immunization coverage - next revision available July 15, 2020 data received as of June 28, 2019
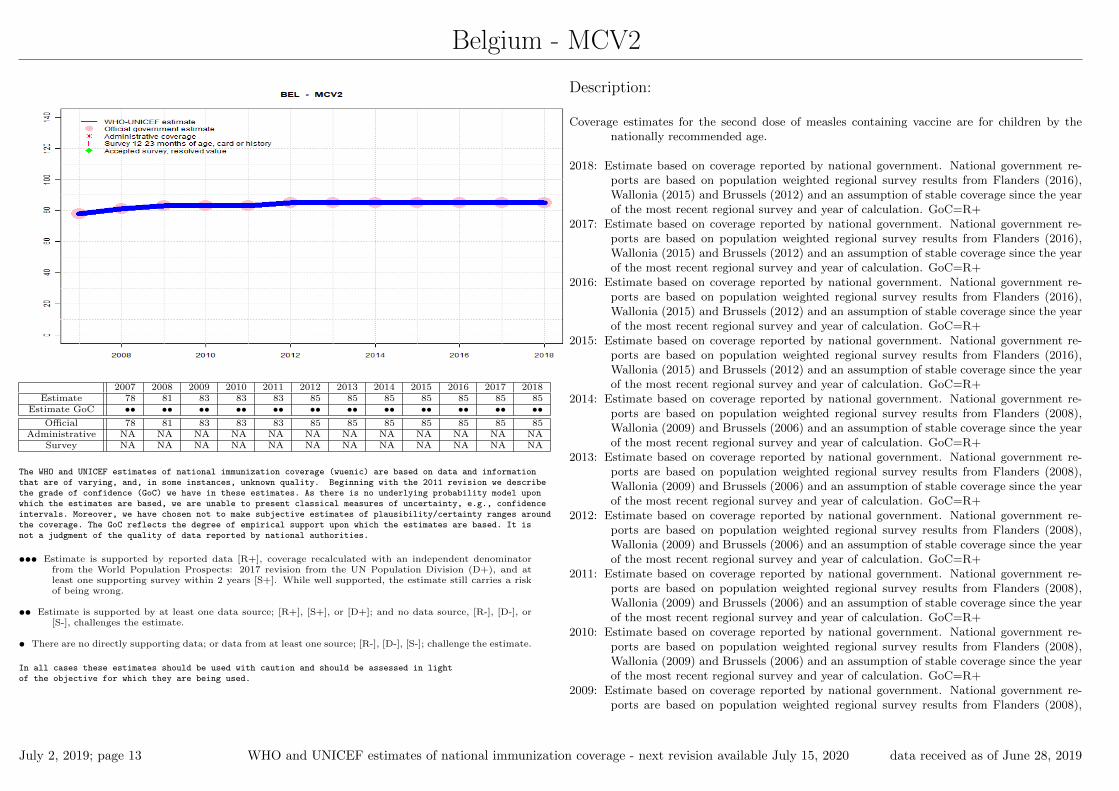
Belgium - MCV2
2007 2008 2009 2010 2011 2012 2013 2014 2015 2016 2017 2018Estimate 78 81 83 83 83 85 85 85 85 85 85 85
Estimate GoC •• •• •• •• •• •• •• •• •• •• •• ••Official 78 81 83 83 83 85 85 85 85 85 85 85
Administrative NA NA NA NA NA NA NA NA NA NA NA NASurvey NA NA NA NA NA NA NA NA NA NA NA NA
The WHO and UNICEF estimates of national immunization coverage (wuenic) are based on data and informationthat are of varying, and, in some instances, unknown quality. Beginning with the 2011 revision we describethe grade of confidence (GoC) we have in these estimates. As there is no underlying probability model uponwhich the estimates are based, we are unable to present classical measures of uncertainty, e.g., confidenceintervals. Moreover, we have chosen not to make subjective estimates of plausibility/certainty ranges aroundthe coverage. The GoC reflects the degree of empirical support upon which the estimates are based. It isnot a judgment of the quality of data reported by national authorities.
••• Estimate is supported by reported data [R+], coverage recalculated with an independent denominatorfrom the World Population Prospects: 2017 revision from the UN Population Division (D+), and atleast one supporting survey within 2 years [S+]. While well supported, the estimate still carries a riskof being wrong.
•• Estimate is supported by at least one data source; [R+], [S+], or [D+]; and no data source, [R-], [D-], or[S-], challenges the estimate.
• There are no directly supporting data; or data from at least one source; [R-], [D-], [S-]; challenge the estimate.
In all cases these estimates should be used with caution and should be assessed in lightof the objective for which they are being used.
Description:
Coverage estimates for the second dose of measles containing vaccine are for children by thenationally recommended age.
2018: Estimate based on coverage reported by national government. National government re-ports are based on population weighted regional survey results from Flanders (2016),Wallonia (2015) and Brussels (2012) and an assumption of stable coverage since the yearof the most recent regional survey and year of calculation. GoC=R+
2017: Estimate based on coverage reported by national government. National government re-ports are based on population weighted regional survey results from Flanders (2016),Wallonia (2015) and Brussels (2012) and an assumption of stable coverage since the yearof the most recent regional survey and year of calculation. GoC=R+
2016: Estimate based on coverage reported by national government. National government re-ports are based on population weighted regional survey results from Flanders (2016),Wallonia (2015) and Brussels (2012) and an assumption of stable coverage since the yearof the most recent regional survey and year of calculation. GoC=R+
2015: Estimate based on coverage reported by national government. National government re-ports are based on population weighted regional survey results from Flanders (2016),Wallonia (2015) and Brussels (2012) and an assumption of stable coverage since the yearof the most recent regional survey and year of calculation. GoC=R+
2014: Estimate based on coverage reported by national government. National government re-ports are based on population weighted regional survey results from Flanders (2008),Wallonia (2009) and Brussels (2006) and an assumption of stable coverage since the yearof the most recent regional survey and year of calculation. GoC=R+
2013: Estimate based on coverage reported by national government. National government re-ports are based on population weighted regional survey results from Flanders (2008),Wallonia (2009) and Brussels (2006) and an assumption of stable coverage since the yearof the most recent regional survey and year of calculation. GoC=R+
2012: Estimate based on coverage reported by national government. National government re-ports are based on population weighted regional survey results from Flanders (2008),Wallonia (2009) and Brussels (2006) and an assumption of stable coverage since the yearof the most recent regional survey and year of calculation. GoC=R+
2011: Estimate based on coverage reported by national government. National government re-ports are based on population weighted regional survey results from Flanders (2008),Wallonia (2009) and Brussels (2006) and an assumption of stable coverage since the yearof the most recent regional survey and year of calculation. GoC=R+
2010: Estimate based on coverage reported by national government. National government re-ports are based on population weighted regional survey results from Flanders (2008),Wallonia (2009) and Brussels (2006) and an assumption of stable coverage since the yearof the most recent regional survey and year of calculation. GoC=R+
2009: Estimate based on coverage reported by national government. National government re-ports are based on population weighted regional survey results from Flanders (2008),
July 2, 2019; page 13 WHO and UNICEF estimates of national immunization coverage - next revision available July 15, 2020 data received as of June 28, 2019
Belgium - MCV2
Wallonia (2009) and Brussels (2006) and an assumption of stable coverage since the yearof the most recent regional survey and year of calculation. GoC=R+
2008: Estimate based on coverage reported by national government. GoC=R+2007: Estimate based on coverage reported by national government. GoC=R+
July 2, 2019; page 14 WHO and UNICEF estimates of national immunization coverage - next revision available July 15, 2020 data received as of June 28, 2019

Belgium - RCV1
2007 2008 2009 2010 2011 2012 2013 2014 2015 2016 2017 2018Estimate 92 93 95 95 95 96 96 96 96 96 96 96
Estimate GoC •• •• •• •• •• •• •• •• •• •• •• ••Official NA NA NA NA NA NA NA NA NA NA NA NA
Administrative NA NA NA NA NA NA NA NA NA NA NA NASurvey NA NA NA NA NA NA NA NA NA NA NA NA
The WHO and UNICEF estimates of national immunization coverage (wuenic) are based on data and informationthat are of varying, and, in some instances, unknown quality. Beginning with the 2011 revision we describethe grade of confidence (GoC) we have in these estimates. As there is no underlying probability model uponwhich the estimates are based, we are unable to present classical measures of uncertainty, e.g., confidenceintervals. Moreover, we have chosen not to make subjective estimates of plausibility/certainty ranges aroundthe coverage. The GoC reflects the degree of empirical support upon which the estimates are based. It isnot a judgment of the quality of data reported by national authorities.
••• Estimate is supported by reported data [R+], coverage recalculated with an independent denominatorfrom the World Population Prospects: 2017 revision from the UN Population Division (D+), and atleast one supporting survey within 2 years [S+]. While well supported, the estimate still carries a riskof being wrong.
•• Estimate is supported by at least one data source; [R+], [S+], or [D+]; and no data source, [R-], [D-], or[S-], challenges the estimate.
• There are no directly supporting data; or data from at least one source; [R-], [D-], [S-]; challenge the estimate.
In all cases these estimates should be used with caution and should be assessed in lightof the objective for which they are being used.
Description:
For this revision, coverage estimates for the first dose of rubella containing vaccine are basedon WHO and UNICEF estimates of coverage of measles containing vaccine. Nationallyreported coverage of rubella containing vaccine is not taken into consideration nor arethey represented in the the accompanying graph and data table.
2018: Estimate based on estimated MCV1. National government reports are based on popula-tion weighted regional survey results from Flanders (2016), Wallonia (2015) and Brussels(2012) and an assumption of stable coverage since the year of the most recent regionalsurvey and year of calculation. GoC=R+
2017: Estimate based on estimated MCV1. National government reports are based on popula-tion weighted regional survey results from Flanders (2016), Wallonia (2015) and Brussels(2012) and an assumption of stable coverage since the year of the most recent regionalsurvey and year of calculation. GoC=R+
2016: Estimate based on estimated MCV1. National government reports are based on popula-tion weighted regional survey results from Flanders (2016), Wallonia (2015) and Brussels(2012) and an assumption of stable coverage since the year of the most recent regionalsurvey and year of calculation. GoC=R+
2015: Estimate based on estimated MCV1. National government reports are based on popula-tion weighted regional survey results from Flanders (2016), Wallonia (2015) and Brussels(2012) and an assumption of stable coverage since the year of the most recent regionalsurvey and year of calculation. GoC=R+
2014: Estimate based on estimated MCV1. National government reports are based on popula-tion weighted regional survey results from Flanders (2008), Wallonia (2009) and Brussels(2006) and an assumption of stable coverage since the year of the most recent regionalsurvey and year of calculation. GoC=R+
2013: Estimate based on estimated MCV1. National government reports are based on popula-tion weighted regional survey results from Flanders (2008), Wallonia (2009) and Brussels(2006) and an assumption of stable coverage since the year of the most recent regionalsurvey and year of calculation. GoC=R+
2012: Estimate based on estimated MCV1. National government reports are based on popula-tion weighted regional survey results from Flanders (2008), Wallonia (2009) and Brussels(2006) and an assumption of stable coverage since the year of the most recent regionalsurvey and year of calculation. GoC=R+
2011: Estimate based on estimated MCV1. National government reports are based on popula-tion weighted regional survey results from Flanders (2008), Wallonia (2009) and Brussels(2006) and an assumption of stable coverage since the year of the most recent regionalsurvey and year of calculation. GoC=R+
2010: Estimate based on estimated MCV1. National government reports are based on popula-tion weighted regional survey results from Flanders (2008), Wallonia (2009) and Brussels(2006) and an assumption of stable coverage since the year of the most recent regionalsurvey and year of calculation. GoC=R+
July 2, 2019; page 15 WHO and UNICEF estimates of national immunization coverage - next revision available July 15, 2020 data received as of June 28, 2019

Belgium - RCV1
2009: Estimate based on estimated MCV1. National government reports are based on popula-tion weighted regional survey results from Flanders (2008), Wallonia (2009) and Brussels(2006) and an assumption of stable coverage since the year of the most recent regionalsurvey and year of calculation. GoC=R+
2008: Estimate based on estimated MCV1. GoC=R+2007: Estimate based on estimated MCV1. GoC=R+
July 2, 2019; page 16 WHO and UNICEF estimates of national immunization coverage - next revision available July 15, 2020 data received as of June 28, 2019

Belgium - HepBB
2007 2008 2009 2010 2011 2012 2013 2014 2015 2016 2017 2018Estimate NA NA NA NA NA NA NA NA NA NA NA NA
Estimate GoC NA NA NA NA NA NA NA NA NA NA NA NA
Official NA NA NA NA NA NA NA NA NA NA NA NAAdministrative NA NA NA NA NA NA NA NA NA NA NA NA
Survey NA NA NA NA NA NA NA NA NA NA NA NA
The WHO and UNICEF estimates of national immunization coverage (wuenic) are based on data and informationthat are of varying, and, in some instances, unknown quality. Beginning with the 2011 revision we describethe grade of confidence (GoC) we have in these estimates. As there is no underlying probability model uponwhich the estimates are based, we are unable to present classical measures of uncertainty, e.g., confidenceintervals. Moreover, we have chosen not to make subjective estimates of plausibility/certainty ranges aroundthe coverage. The GoC reflects the degree of empirical support upon which the estimates are based. It isnot a judgment of the quality of data reported by national authorities.
••• Estimate is supported by reported data [R+], coverage recalculated with an independent denominatorfrom the World Population Prospects: 2017 revision from the UN Population Division (D+), and atleast one supporting survey within 2 years [S+]. While well supported, the estimate still carries a riskof being wrong.
•• Estimate is supported by at least one data source; [R+], [S+], or [D+]; and no data source, [R-], [D-], or[S-], challenges the estimate.
• There are no directly supporting data; or data from at least one source; [R-], [D-], [S-]; challenge the estimate.
In all cases these estimates should be used with caution and should be assessed in lightof the objective for which they are being used.
July 2, 2019; page 17 WHO and UNICEF estimates of national immunization coverage - next revision available July 15, 2020 data received as of June 28, 2019

Belgium - HepB3
2007 2008 2009 2010 2011 2012 2013 2014 2015 2016 2017 2018Estimate 94 98 97 97 97 98 98 98 98 97 97 97
Estimate GoC •• •• •• •• •• •• •• •• •• •• •• ••Official 94 98 97 97 97 98 98 98 98 97 97 97
Administrative NA NA NA NA NA NA NA NA NA NA NA NASurvey NA NA NA NA NA NA NA NA NA NA NA NA
The WHO and UNICEF estimates of national immunization coverage (wuenic) are based on data and informationthat are of varying, and, in some instances, unknown quality. Beginning with the 2011 revision we describethe grade of confidence (GoC) we have in these estimates. As there is no underlying probability model uponwhich the estimates are based, we are unable to present classical measures of uncertainty, e.g., confidenceintervals. Moreover, we have chosen not to make subjective estimates of plausibility/certainty ranges aroundthe coverage. The GoC reflects the degree of empirical support upon which the estimates are based. It isnot a judgment of the quality of data reported by national authorities.
••• Estimate is supported by reported data [R+], coverage recalculated with an independent denominatorfrom the World Population Prospects: 2017 revision from the UN Population Division (D+), and atleast one supporting survey within 2 years [S+]. While well supported, the estimate still carries a riskof being wrong.
•• Estimate is supported by at least one data source; [R+], [S+], or [D+]; and no data source, [R-], [D-], or[S-], challenges the estimate.
• There are no directly supporting data; or data from at least one source; [R-], [D-], [S-]; challenge the estimate.
In all cases these estimates should be used with caution and should be assessed in lightof the objective for which they are being used.
Description:
2018: Estimate based on coverage reported by national government. National government re-ports are based on population weighted regional survey results from Flanders (2016),Wallonia (2015) and Brussels (2012) and an assumption of stable coverage since the yearof the most recent regional survey and year of calculation. GoC=R+
2017: Estimate based on coverage reported by national government. National government re-ports are based on population weighted regional survey results from Flanders (2016),Wallonia (2015) and Brussels (2012) and an assumption of stable coverage since the yearof the most recent regional survey and year of calculation. GoC=R+
2016: Estimate based on coverage reported by national government. National government re-ports are based on population weighted regional survey results from Flanders (2016),Wallonia (2015) and Brussels (2012) and an assumption of stable coverage since the yearof the most recent regional survey and year of calculation. GoC=R+
2015: Estimate based on coverage reported by national government. National government re-ports are based on population weighted regional survey results from Flanders (2016),Wallonia (2015) and Brussels (2012) and an assumption of stable coverage since the yearof the most recent regional survey and year of calculation. GoC=R+
2014: Estimate based on coverage reported by national government. National government re-ports are based on population weighted regional survey results from Flanders (2008),Wallonia (2009) and Brussels (2006) and an assumption of stable coverage since the yearof the most recent regional survey and year of calculation. GoC=R+
2013: Estimate based on coverage reported by national government. National government re-ports are based on population weighted regional survey results from Flanders (2008),Wallonia (2009) and Brussels (2006) and an assumption of stable coverage since the yearof the most recent regional survey and year of calculation. GoC=R+
2012: Estimate based on coverage reported by national government. National government re-ports are based on population weighted regional survey results from Flanders (2008),Wallonia (2009) and Brussels (2006) and an assumption of stable coverage since the yearof the most recent regional survey and year of calculation. GoC=R+
2011: Estimate based on coverage reported by national government. National government re-ports are based on population weighted regional survey results from Flanders (2008),Wallonia (2009) and Brussels (2006) and an assumption of stable coverage since the yearof the most recent regional survey and year of calculation. GoC=R+
2010: Estimate based on coverage reported by national government. National government re-ports are based on population weighted regional survey results from Flanders (2008),Wallonia (2009) and Brussels (2006) and an assumption of stable coverage since the yearof the most recent regional survey and year of calculation. GoC=R+
2009: Estimate based on coverage reported by national government. National government re-ports are based on population weighted regional survey results from Flanders (2008),Wallonia (2009) and Brussels (2006) and an assumption of stable coverage since the yearof the most recent regional survey and year of calculation. GoC=R+
2008: Estimate based on coverage reported by national government. GoC=R+
July 2, 2019; page 18 WHO and UNICEF estimates of national immunization coverage - next revision available July 15, 2020 data received as of June 28, 2019

Belgium - HepB3
2007: Estimate based on coverage reported by national government. GoC=R+
July 2, 2019; page 19 WHO and UNICEF estimates of national immunization coverage - next revision available July 15, 2020 data received as of June 28, 2019

Belgium - Hib3
2007 2008 2009 2010 2011 2012 2013 2014 2015 2016 2017 2018Estimate 98 98 98 98 98 98 98 98 98 97 97 97
Estimate GoC •• •• •• •• •• •• •• •• •• •• •• ••Official 98 98 98 98 98 98 98 98 98 97 97 97
Administrative NA NA NA NA NA NA NA NA NA NA NA NASurvey NA NA NA NA NA NA NA NA NA NA NA NA
The WHO and UNICEF estimates of national immunization coverage (wuenic) are based on data and informationthat are of varying, and, in some instances, unknown quality. Beginning with the 2011 revision we describethe grade of confidence (GoC) we have in these estimates. As there is no underlying probability model uponwhich the estimates are based, we are unable to present classical measures of uncertainty, e.g., confidenceintervals. Moreover, we have chosen not to make subjective estimates of plausibility/certainty ranges aroundthe coverage. The GoC reflects the degree of empirical support upon which the estimates are based. It isnot a judgment of the quality of data reported by national authorities.
••• Estimate is supported by reported data [R+], coverage recalculated with an independent denominatorfrom the World Population Prospects: 2017 revision from the UN Population Division (D+), and atleast one supporting survey within 2 years [S+]. While well supported, the estimate still carries a riskof being wrong.
•• Estimate is supported by at least one data source; [R+], [S+], or [D+]; and no data source, [R-], [D-], or[S-], challenges the estimate.
• There are no directly supporting data; or data from at least one source; [R-], [D-], [S-]; challenge the estimate.
In all cases these estimates should be used with caution and should be assessed in lightof the objective for which they are being used.
Description:
2018: Estimate based on coverage reported by national government. National government re-ports are based on population weighted regional survey results from Flanders (2016),Wallonia (2015) and Brussels (2012) and an assumption of stable coverage since the yearof the most recent regional survey and year of calculation. GoC=R+
2017: Estimate based on coverage reported by national government. National government re-ports are based on population weighted regional survey results from Flanders (2016),Wallonia (2015) and Brussels (2012) and an assumption of stable coverage since the yearof the most recent regional survey and year of calculation. GoC=R+
2016: Estimate based on coverage reported by national government. National government re-ports are based on population weighted regional survey results from Flanders (2016),Wallonia (2015) and Brussels (2012) and an assumption of stable coverage since the yearof the most recent regional survey and year of calculation. GoC=R+
2015: Estimate based on coverage reported by national government. National government re-ports are based on population weighted regional survey results from Flanders (2016),Wallonia (2015) and Brussels (2012) and an assumption of stable coverage since the yearof the most recent regional survey and year of calculation. GoC=R+
2014: Estimate based on coverage reported by national government. National government re-ports are based on population weighted regional survey results from Flanders (2008),Wallonia (2009) and Brussels (2006) and an assumption of stable coverage since the yearof the most recent regional survey and year of calculation. GoC=R+
2013: Estimate based on coverage reported by national government. National government re-ports are based on population weighted regional survey results from Flanders (2008),Wallonia (2009) and Brussels (2006) and an assumption of stable coverage since the yearof the most recent regional survey and year of calculation. GoC=R+
2012: Estimate based on coverage reported by national government. National government re-ports are based on population weighted regional survey results from Flanders (2008),Wallonia (2009) and Brussels (2006) and an assumption of stable coverage since the yearof the most recent regional survey and year of calculation. GoC=R+
2011: Estimate based on coverage reported by national government. National government re-ports are based on population weighted regional survey results from Flanders (2008),Wallonia (2009) and Brussels (2006) and an assumption of stable coverage since the yearof the most recent regional survey and year of calculation. GoC=R+
2010: Estimate based on coverage reported by national government. National government re-ports are based on population weighted regional survey results from Flanders (2008),Wallonia (2009) and Brussels (2006) and an assumption of stable coverage since the yearof the most recent regional survey and year of calculation. GoC=R+
2009: Estimate based on coverage reported by national government. National government re-ports are based on population weighted regional survey results from Flanders (2008),Wallonia (2009) and Brussels (2006) and an assumption of stable coverage since the yearof the most recent regional survey and year of calculation. GoC=R+
2008: Estimate based on coverage reported by national government. GoC=R+
July 2, 2019; page 20 WHO and UNICEF estimates of national immunization coverage - next revision available July 15, 2020 data received as of June 28, 2019

Belgium - Hib3
2007: Estimate based on coverage reported by national government. GoC=R+
July 2, 2019; page 21 WHO and UNICEF estimates of national immunization coverage - next revision available July 15, 2020 data received as of June 28, 2019

Belgium - RotaC
2007 2008 2009 2010 2011 2012 2013 2014 2015 2016 2017 2018Estimate NA NA NA NA NA 86 86 86 88 87 87 87
Estimate GoC NA NA NA NA NA •• •• •• •• •• •• ••Official NA NA NA NA NA 86 86 86 88 87 87 87
Administrative NA NA NA NA NA NA NA NA NA NA NA NASurvey NA NA NA NA NA NA NA NA NA NA NA NA
The WHO and UNICEF estimates of national immunization coverage (wuenic) are based on data and informationthat are of varying, and, in some instances, unknown quality. Beginning with the 2011 revision we describethe grade of confidence (GoC) we have in these estimates. As there is no underlying probability model uponwhich the estimates are based, we are unable to present classical measures of uncertainty, e.g., confidenceintervals. Moreover, we have chosen not to make subjective estimates of plausibility/certainty ranges aroundthe coverage. The GoC reflects the degree of empirical support upon which the estimates are based. It isnot a judgment of the quality of data reported by national authorities.
••• Estimate is supported by reported data [R+], coverage recalculated with an independent denominatorfrom the World Population Prospects: 2017 revision from the UN Population Division (D+), and atleast one supporting survey within 2 years [S+]. While well supported, the estimate still carries a riskof being wrong.
•• Estimate is supported by at least one data source; [R+], [S+], or [D+]; and no data source, [R-], [D-], or[S-], challenges the estimate.
• There are no directly supporting data; or data from at least one source; [R-], [D-], [S-]; challenge the estimate.
In all cases these estimates should be used with caution and should be assessed in lightof the objective for which they are being used.
Description:
2018: Estimate based on coverage reported by national government. National government re-ports are based on population weighted regional survey results from Flanders (2016),Wallonia (2015) and Brussels (2012) and an assumption of stable coverage since the yearof the most recent regional survey and year of calculation. GoC=R+
2017: Estimate based on coverage reported by national government. National government re-ports are based on population weighted regional survey results from Flanders (2016),Wallonia (2015) and Brussels (2012) and an assumption of stable coverage since the yearof the most recent regional survey and year of calculation. GoC=R+
2016: Estimate based on coverage reported by national government. National government re-ports are based on population weighted regional survey results from Flanders (2016),Wallonia (2015) and Brussels (2012) and an assumption of stable coverage since the yearof the most recent regional survey and year of calculation. GoC=R+
2015: Estimate based on coverage reported by national government. National government re-ports are based on population weighted regional survey results from Flanders (2016),Wallonia (2015) and Brussels (2012) and an assumption of stable coverage since the yearof the most recent regional survey and year of calculation. GoC=R+
2014: Estimate based on coverage reported by national government. National government re-ports are based on population weighted regional survey results from Flanders (2008),Wallonia (2009) and Brussels (2006) and an assumption of stable coverage since the yearof the most recent regional survey and year of calculation. GoC=R+
2013: Estimate based on coverage reported by national government. National government re-ports are based on population weighted regional survey results from Flanders (2008),Wallonia (2009) and Brussels (2006) and an assumption of stable coverage since the yearof the most recent regional survey and year of calculation. GoC=R+
2012: Estimate based on coverage reported by national government. National government re-ports are based on population weighted regional survey results from Flanders (2008),Wallonia (2009) and Brussels (2006) and an assumption of stable coverage since the yearof the most recent regional survey and year of calculation. Rotavirus vaccine introducedin 2007. Reporting started in 2012. GoC=R+
July 2, 2019; page 22 WHO and UNICEF estimates of national immunization coverage - next revision available July 15, 2020 data received as of June 28, 2019

Belgium - PcV3
2007 2008 2009 2010 2011 2012 2013 2014 2015 2016 2017 2018Estimate NA NA NA NA NA 93 93 93 94 94 94 94
Estimate GoC NA NA NA NA NA •• •• •• •• •• •• ••Official NA NA NA NA NA 93 93 93 94 94 94 94
Administrative NA NA NA NA NA NA NA NA NA NA NA NASurvey NA NA NA NA NA NA NA NA NA NA NA NA
The WHO and UNICEF estimates of national immunization coverage (wuenic) are based on data and informationthat are of varying, and, in some instances, unknown quality. Beginning with the 2011 revision we describethe grade of confidence (GoC) we have in these estimates. As there is no underlying probability model uponwhich the estimates are based, we are unable to present classical measures of uncertainty, e.g., confidenceintervals. Moreover, we have chosen not to make subjective estimates of plausibility/certainty ranges aroundthe coverage. The GoC reflects the degree of empirical support upon which the estimates are based. It isnot a judgment of the quality of data reported by national authorities.
••• Estimate is supported by reported data [R+], coverage recalculated with an independent denominatorfrom the World Population Prospects: 2017 revision from the UN Population Division (D+), and atleast one supporting survey within 2 years [S+]. While well supported, the estimate still carries a riskof being wrong.
•• Estimate is supported by at least one data source; [R+], [S+], or [D+]; and no data source, [R-], [D-], or[S-], challenges the estimate.
• There are no directly supporting data; or data from at least one source; [R-], [D-], [S-]; challenge the estimate.
In all cases these estimates should be used with caution and should be assessed in lightof the objective for which they are being used.
Description:
2018: Estimate based on coverage reported by national government. National government re-ports are based on population weighted regional survey results from Flanders (2016),Wallonia (2015) and Brussels (2012) and an assumption of stable coverage since the yearof the most recent regional survey and year of calculation. GoC=R+
2017: Estimate based on coverage reported by national government. National government re-ports are based on population weighted regional survey results from Flanders (2016),Wallonia (2015) and Brussels (2012) and an assumption of stable coverage since the yearof the most recent regional survey and year of calculation. GoC=R+
2016: Estimate based on coverage reported by national government. National government re-ports are based on population weighted regional survey results from Flanders (2016),Wallonia (2015) and Brussels (2012) and an assumption of stable coverage since the yearof the most recent regional survey and year of calculation. GoC=R+
2015: Estimate based on coverage reported by national government. National government re-ports are based on population weighted regional survey results from Flanders (2016),Wallonia (2015) and Brussels (2012) and an assumption of stable coverage since the yearof the most recent regional survey and year of calculation. GoC=R+
2014: Estimate based on coverage reported by national government. National government re-ports are based on population weighted regional survey results from Flanders (2008),Wallonia (2009) and Brussels (2006) and an assumption of stable coverage since the yearof the most recent regional survey and year of calculation. GoC=R+
2013: Estimate based on coverage reported by national government. National government re-ports are based on population weighted regional survey results from Flanders (2008),Wallonia (2009) and Brussels (2006) and an assumption of stable coverage since the yearof the most recent regional survey and year of calculation. GoC=R+
2012: Estimate based on coverage reported by national government. National government reportsare based on population weighted regional survey results from Flanders (2008), Wallonia(2009) and Brussels (2006) and an assumption of stable coverage since the year of themost recent regional survey and year of calculation. Pneumococcal vaccine introducedin 2006. Reporting started in 2012. GoC=R+
July 2, 2019; page 23 WHO and UNICEF estimates of national immunization coverage - next revision available July 15, 2020 data received as of June 28, 2019

Belgium - survey details
2014 Studie van de vaccinatiegraad bij jonge kinderen en adolescenten inVlaanderen in 2016
Vaccine Confirmation method Coverage Age cohort Sample Cards seenDTP1 Card 98.7 18-24 m 746 100DTP3 Card 97 18-24 m 746 100HepB1 Card 98.2 18-24 m 746 100HepB3 Card 96.9 18-24 m 746 100Hib1 Card 98.2 18-24 m 746 100Hib3 Card 96.8 18-24 m 746 100MCV1 Card 96.2 18-24 m 746 100PcV1 Card 98.3 18-24 m 746 100PcV3 Card 94.9 18-24 m 746 100Pol1 Card 99.1 18-24 m 746 100Pol3 Card 98.9 18-24 m 746 100RotaC Card 89.7 18-24 m 746 100
2013 Enquete de couverture vaccinale des enfants de 18 a 24 mois en regionde Wallonie - 2015
Vaccine Confirmation method Coverage Age cohort Sample Cards seenDTP1 Card 99.6 18-24 m 546 100DTP3 Card 98.9 18-24 m 546 100HepB1 Card 99.1 18-24 m 546 100HepB3 Card 98.2 18-24 m 546 100Hib1 Card 99.6 18-24 m 546 100Hib3 Card 98.7 18-24 m 546 100MCV1 Card 95.6 18-24 m 546 100PCV1 Card 97.6 18-24 m 546 100PCV3 Card 96.9 18-24 m 546 100Pol1 Card 100 18-24 m 546 100Pol3 Card 99.1 18-24 m 546 100RotaC Card 87.2 18-24 m 546 100
2010 Enquete de couverture vaccinale des enfants de 18 a 24 mois en Regionde Bruxelles-Capitale 2012
Vaccine Confirmation method Coverage Age cohort Sample Cards seenDTP1 Card 99.6 18-24 m 538 100DTP3 Card 98.7 18-24 m 538 100HepB1 Card 96.7 18-24 m 538 100HepB3 Card 96.3 18-24 m 538 100Hib1 Card 97.2 18-24 m 538 100Hib3 Card 96.7 18-24 m 538 100MCV1 Card 94.1 18-24 m 538 100PcV1 Card 97 18-24 m 538 100PcV3 Card 90.1 18-24 m 538 100Pol1 Card 99.6 18-24 m 538 100Pol3 Card 98.7 18-24 m 538 100RotaC Card 72.7 18-24 m 538 100
2010 Studie van de vaccinatiegraad bij jonge kinderen en adolescenten inVlaanderen in 2012
Vaccine Confirmation method Coverage Age cohort Sample Cards seenDTP1 Card 99.5 18-24 m 874 92DTP3 Card 98.7 18-24 m 874 92HepB1 Card 99.4 18-24 m 874 92HepB3 Card 98.5 18-24 m 874 92Hib1 Card 99.4 18-24 m 874 92Hib3 Card 98.7 18-24 m 874 92MCV1 Card 96.6 18-24 m 874 92PcV1 Card 99.3 18-24 m 874 92PcV3 Card 96.5 18-24 m 874 92Pol1 Card 99.6 18-24 m 874 92Pol3 Card 98.9 18-24 m 874 92RotaC Card 92.2 18-24 m 874 92
Further information and estimates for previous years are available at:
July 2, 2019; page 24 WHO and UNICEF estimates of national immunization coverage - next revision available July 15, 2020 data received as of June 28, 2019

Belgium - survey details
http://www.data.unicef.org/child-health/immunization
http://www.who.int/immunization/monitoring_surveillance/routine/coverage/en/index4.html
July 2, 2019; page 25 WHO and UNICEF estimates of national immunization coverage - next revision available July 15, 2020 data received as of June 28, 2019