Embed Size (px)
Citation preview

“Smart Cities” 2016 - Economy and entrepreneurship in the Danube region, Novi Sad October 31st 2016
Belgrade Belgrade -- SMART City on SMART City on the the Two European RiversTwo European Rivers City of Belgrade Development City of Belgrade Development Strategy 2016Strategy 2016
Dr. Žaklina Gligorijević, Eng. Arch. Urban Planning Institute of Belgrade

• Initiated by NGO (PALGO Centre) in 2005, developed in partnership with the City Authority; Special Mayor’s Committee to provide constant technical, institutional and political process support;
• Best practices from Vienna, Prague, Budapest, Munich and Warsaw, international consultants involved since 2006; Report on the State of the City of Belgrade 2006: all sectors and 17 municipalities evaluated the current situation and established development goals for the forthcoming period;
• SWOT Analyses 2007;
• First draft public debate 2008, and political change;
• Re-activation of the process by the Urban Planning Institute, PUC, 2010,
• Public debate and the adoption by the City Assembly in June 2011,
• Adjusted Strategic Goals and the Action Plan to 2021 to be adopted in 2016.
City of Belgrade Development Strategy City of Belgrade Development Strategy CBDS CBDS TimelineTimeline

• Post-socialist, post-sanctions environment, after profound political changes, followed by legal, political, social and economic reforms;
• A dramatically different urban matrix compared to planned sustainable development: uncontrolled growth, informal housing, sprawl, lack of urban culture, etc.
• Lack of resources, knowledge and skills, both in management and within the professional community;
• Sectoral mentality, lack of communication, overall projects and innovations.
CBDS CBDS Context ChallengesContext Challenges

• New State and City regulations: in planning and building, organization and financing local governments, PPPs, Capital City Law, anti-corruption legislation, etc.
• Economic development influenced by dynamic investment activity (from 2000-2004 in average 1 billion euro per year, “Financial Times” title City of the
future in Southern Europe for 2006/07).
• Unusual engagement and coordination of all of the sectors and all 17 municipalities, varying in status and responsibilities;
• New topics within “Spatial and urban development”, 2007:
- city identity, design (Cores of Belgrade, City icons),
- land-use according to new market demands,
- urban revitalization and transformation principles,
- new transportation, environmental and spatial city policies.
CBDS CBDS Process ChallengesProcess Challenges

In traditional, Former Yugoslavia planning, long term social and economic development plans were the base for the spatial development. Belgrade General plans were adjusted every 10 to 20 years (1950, 1972, 1985, 1995, 2003, 2009, 2015).
Master plans of Belgrade 1972, 1985, Urban planning Institute , PE

• To position Belgrade on the map within the network of competitive and desirable SEE destinations,
by addressing its values and potentials and optimizing the use of valuable resources.
• To enable city sustainable development in a healthy environment for Belgrade citizens.
CBDS 2011 Main CBDS 2011 Main GGoalsoals

CBDSCBDS ChaptersChapters
a) Economic development, b) Social development, c) City infrastructure, d) Communication and Transport, e) Environmental protection, f) Urban
development and Identity, g) Governance.

List of projects by sector, with
• anticipated budget,
• sources for financing, and
• the administrative bodies within the City
responsible for their implementation.
Operational part of the Operational part of the CBDSCBDS
Strategic Priorities Strategic Priorities
20112011--20162016
andand 20162016..--2020.2020.

Implementation Evaluation until 2016Implementation Evaluation until 2016
1. City has engaged most of its capacity into Communication and Transportation sectors, the most important and the most demanding.
2. The Environmental sector, the most proactive, hence also meeting the expectations.
3. City Planning sector.
4. The social development priorities and city infrastructure, both related to planning, seem to be according to CBDS priorities.
5. The economic development, including PPPs and other partnerships, PPP, new models of investments in important city projects.

CBDS and Regional Spatial plan for the Administrative Territory of the
City, 2011 – the first strategic documents where the City claimed
its vision of further development in the context of the wider EU
region, towards
sustainable economy, advanced technology, greater territorial
cohesion and higher levels of accessibility, decentralization and
polycentricism.
T h e b a s e f o r t h e c o o p e r a t i o n a l o n g D a n u b e .
ACTIONS Following CBDS
in Regional and Urban Planning Sector

Regional Spatial Plan of the Belgrade
Administrative Territory 17 municipalities,
330.000 ha
7 Spatial Plans for 7 municipalities:
Grocka,
Mladenovac, Barajevo,
Sopot, Surčin,
Obrenovac, Lazarevac
Belgrade General Plan 77.000 ha
General Regulation Plan for the inner City of Belgrade
60 000 hа
Planning and Building Laws 2009, 2014, CBDS Priority 4.1

The themes considered since 2011: • Public spaces; • New locations for social and affordable housing (“Ovča”, “Ivana
Ribara”); • Urban transformation of former industrial zones (“IKL”, 2014); • Relocation of all of the city industry to new business and industrial
parks, near the ring roads (PDR Bubanj potok); • Spatial plan for the regulation of the Sava Amphitheatre, the Belgrade
most important brownfield and waterfront rehabilitation area, etc.
Environmental protection projects in planning • Plan od Detail regulation for the Landfill „Vinča“ , • Several environmental strategies and plans

Results of the Transportation sector
Capital city infrastructure projects for improved mobility
• Two new bridges - one crossing the Sava and the other Danube River, and the North Tangent Road;
• Bypass road connecting north and south highways - plans for the External Ring Road;
• Plans for the Belgrade Internal Semi Ring Road (from New Belgrade to the existing bridge on Danube);
• Revision of the Transport Master Plan – SMARTPLAN and the first Metro line;
• Relocation of the Main Rail Station from the Savamala and construction of the “Prokop” and the „New Belgrade“ Rail Stations;
• Enchantment of the City Central pedestrian zone;
• Plans for the underground garages, reconstructions of the City boulevards (Vojvode Stepe, in progress, Bulevar oslobođenja, in preparation), etc.

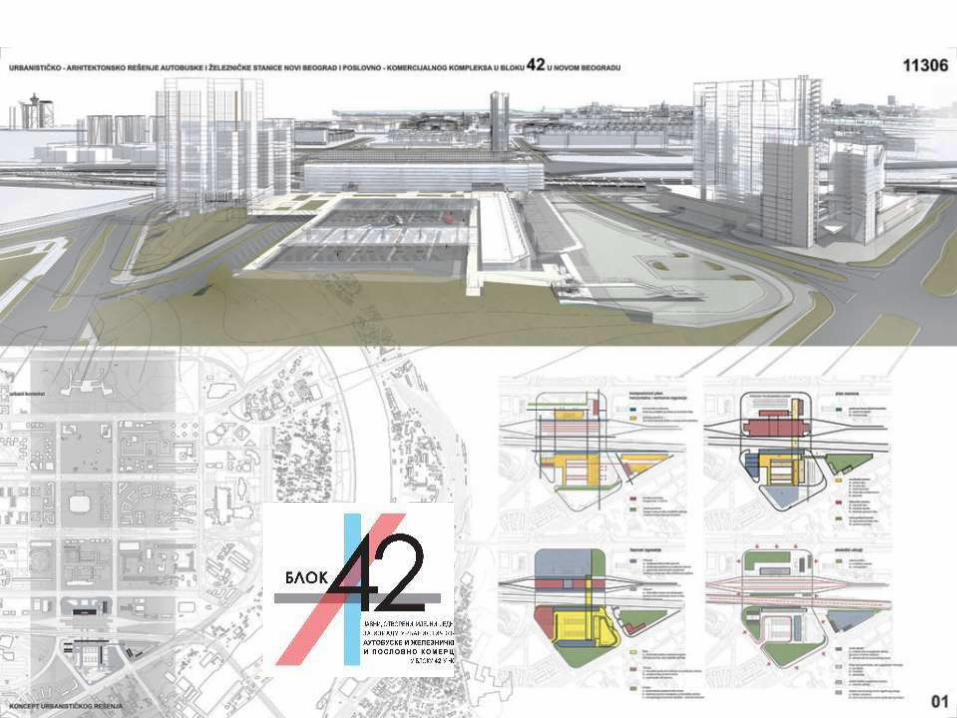
Relocation of the existing Central Bus Station to New Belgrade Block 42

The site New Belgrade Block 42

Block 42 NBGD, 2014


• UMP Tunnel Senjak Topčidersko brdo and • Connection of the Sava and Danube slope with the reconstruction of the Old Sava Bridge

Connection of the Sava and Danube slope

Roads connecting the “Prokop” or CENTRE Station

City of Belgrade City of Belgrade Development Development Strategy Strategy 2016–2021.
DRAFT October 2016.
ОБЛАСТ: УРБАНИ РАЗВОЈ

• The ambiance of the liberal economy, the accession process to EU;
• CBDS Priority – economic development: Empowerment of the economic city concurrency based on attracting target investments, fast development of the knowledge based economies that bring higher added value.
• New city Projects, based on the improved transportation and technical infrastructure.
• Communication between sectors, joint presentation and the cooperation with world cities.
• integrated model, although still in the partial synthesis and through the sectoral priorities .
Context and challenges for the Context and challenges for the CBDS 2016 CBDS 2016 -- EfficiencyEfficiency

PLAN v.s. STRATEGY : The image of the future city –
Integral development process.
The City We Wont? The goal, long-term vision
horizont: 20, 30 years
How to Reach the Goal? Process definition, methods, resources:
the first step: a 5 years action plan
SUSTAINABLE URBAN DEVELOPMENT
CBDSCBDS 2016 2016

City of Belgrade Development Strategy 2016–2021
URBAN DEVELOPMENT VISON
URBAN DEVELOPMENT URBAN DEVELOPMENT ASPECTS 2 x 2 ASPECTS 2 x 2
1. Regional/ European /Global context
Local context – the city for its citizens
2. Long-term vision, and Action plan for 2021
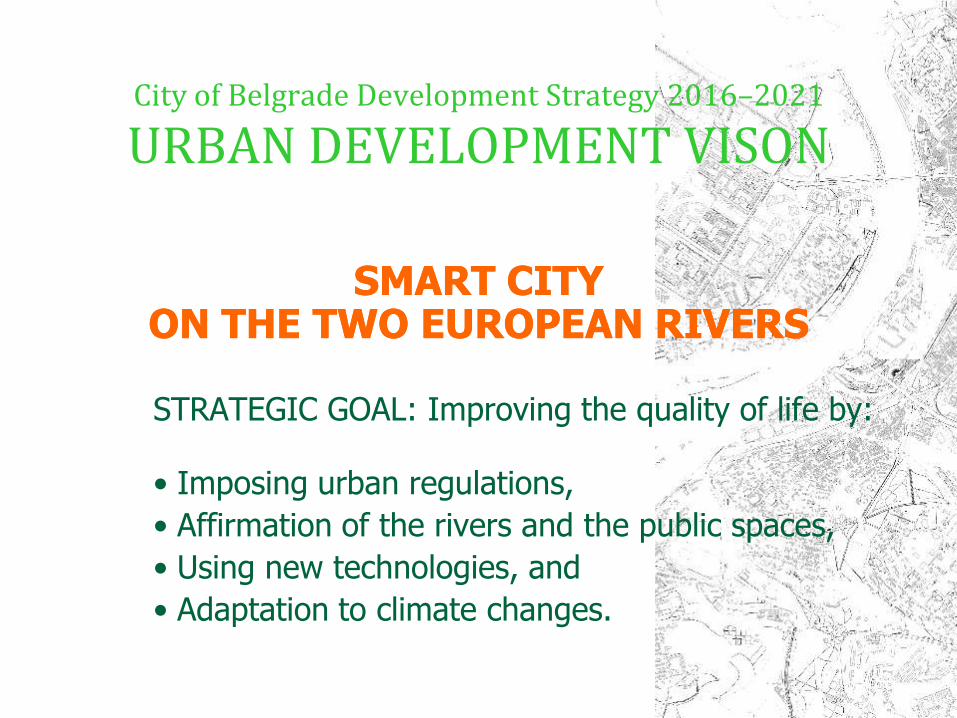
SMART CITY SMART CITY ON THE TWO EUROPEAN RIVERSON THE TWO EUROPEAN RIVERS
STRATEGIC GOAL: Improving the quality of life by:
• Imposing urban regulations,
• Affirmation of the rivers and the public spaces,
• Using new technologies, and
• Adaptation to climate changes.
City of Belgrade Development Strategy 2016–2021
URBAN DEVELOPMENT VISON

City of Belgrade Development Strategy 2016–2021
PRIORITY 2.1.
SMART SMART CITYCITY
2.1.1. Long term vision of the SMART city development,
2.1.2. Urban planning segment of the Beograd GIS,
2.1.3. The centre for monitoring and coordination of all the City services,
2.1.4. Innovative urban planning and design models,
2.1.5. SMART infrastructure and the support for the sustainable mobility.


http://gis2.beoland.com/gisBgExternal/


Sustainable urban development and Sustainable urban development and balanced support to important balanced support to important
investments and projectsinvestments and projects
2.2.1. Implementation of the urban plans,
2.2.2. Improving administrative procedures making business-friendly environment,
2.2.3. Support to important projects and PPPs,
2.2.4. Providing public amenities and especially high quality public spaces.
City of Belgrade Development Strategy 2016–2021
PRIORITY 2.2.


Total Area: 116 ha Area of the urban blocks: 71.44 ha Public-other building land ratio : 54.6 % : 45,6 % Total GBA: 1,85 MILL м2 FAR 2.7 Housing : commercial use Ratio 58% : 42% Population : 17 771 Density: 153 ст./ha Average apartment area : 167 m2
SPECIAL REGIONAL PLAN FOR THE DEVELOPMENT OF THE PART OF THE CITY OF BELGARDE SAVA WATERFRONT AREA “BELGRADE ON THE WATER“ PROJECT
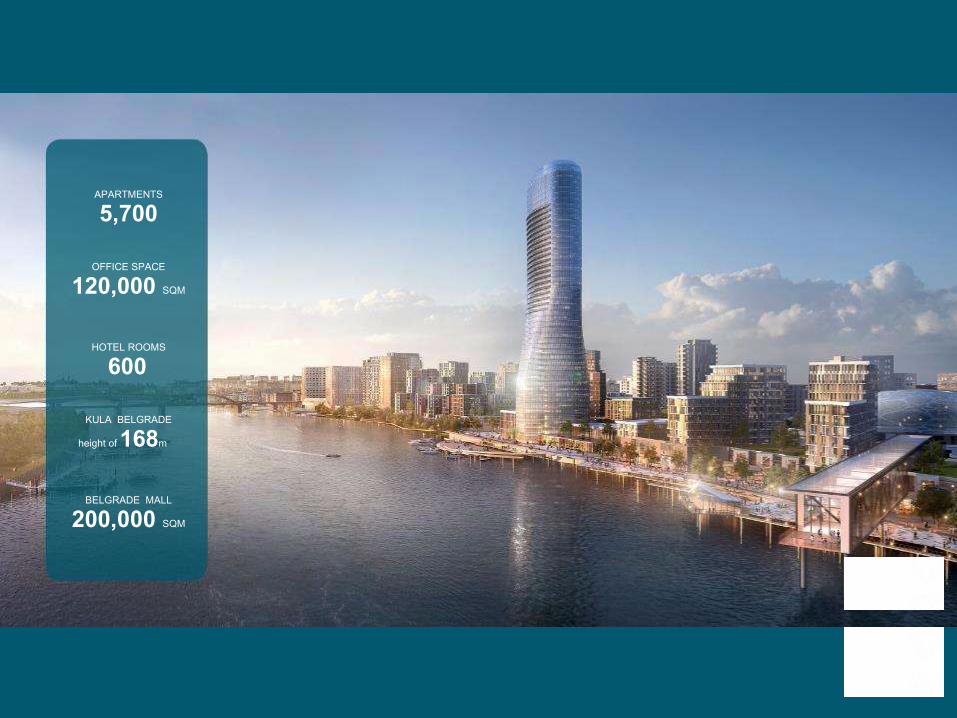
APARTMENTS
5,700
OFFICE SPACE
120,000 SQM
HOTEL ROOMS
600
KULA BELGRADE
height of 168m
BELGRADE MALL
200,000 SQM


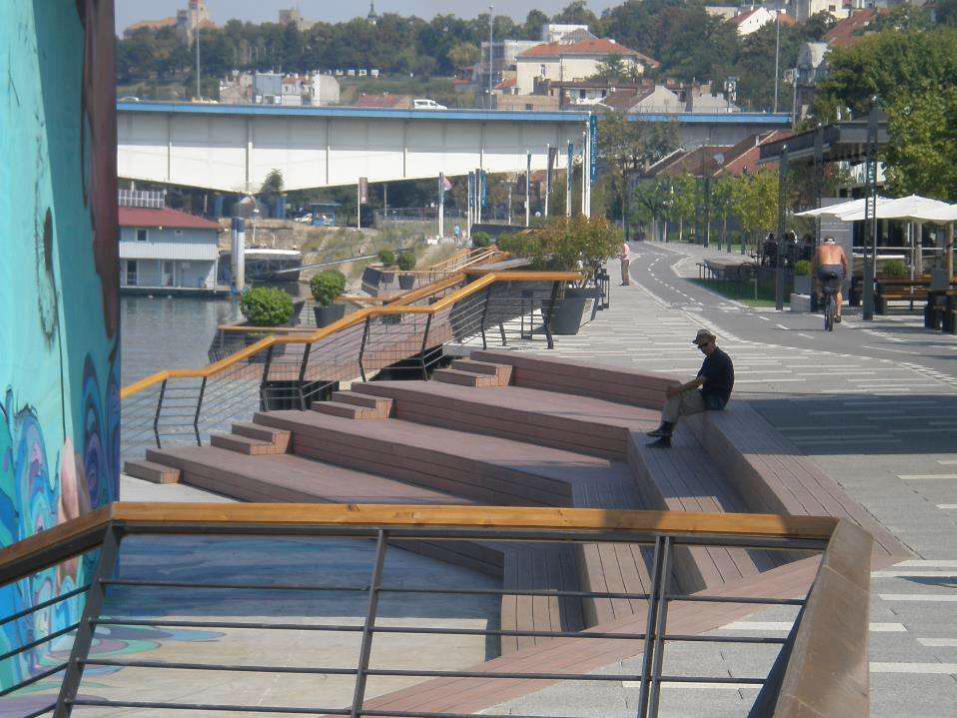
SAVA PROMENADA
• Inseparable part of Belgrade Waterfront and favouritee destination for river lovers
• A range of activities for the whole family to enjoy throughout the year
• Children playgrounds, sport courts, restaurants, water terraces
• Stretching along 1.8 kilometers, ideal destination for jogging, cycling, walking and spending the quality outdoor leisure time

https://www.belgradewaterfront.com/rs/beograd-na-vodi-
residences/?gclid=CjwKEAjwv7HABRCSxfrjkJPnrWgSJAA45qA2Zs8Cw36Q2h6tnqzsb4VFpacSGhiICFQBoiUKA3_IlRoCZR3w_wcB
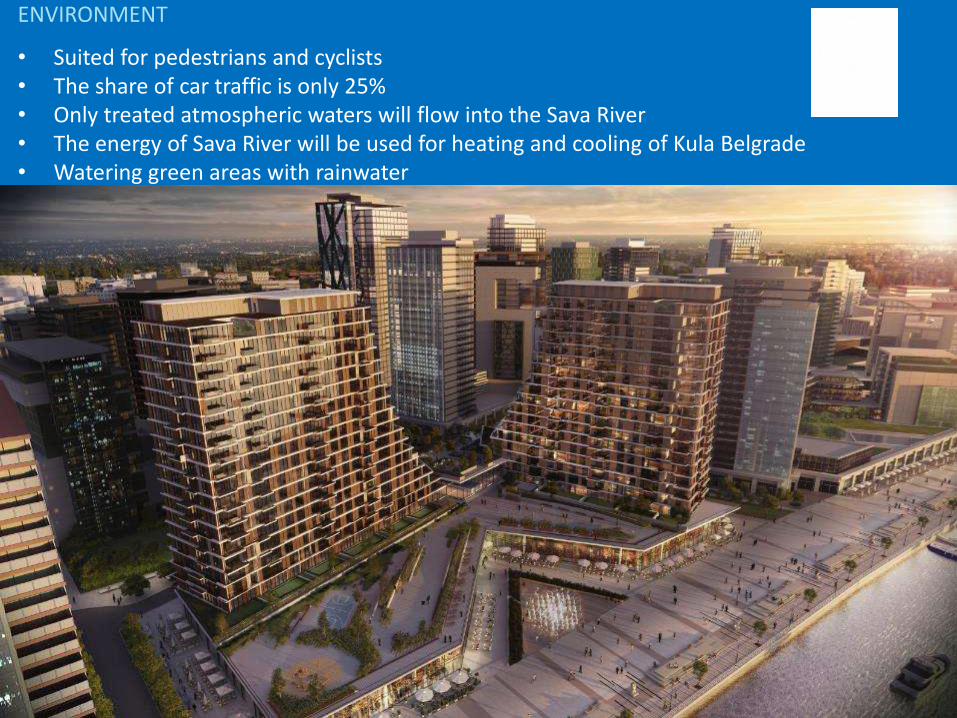
ENVIRONMENT
• Suited for pedestrians and cyclists • The share of car traffic is only 25% • Only treated atmospheric waters will flow into the Sava River • The energy of Sava River will be used for heating and cooling of Kula Belgrade • Watering green areas with rainwater

STRATEGIJA RAZVOJA GRADA BEOGRADA 2016–2021.
PRIORITET 2.3.
IMPROVING THE CITY IMPROVING THE CITY IDENTITIDENTITYY
2.3.1. Implementation of the plans related to the rivers and waterfronts,
2.3.2. Public spaces,
2.3.3. Design competitions for the important sites ,
2.3.4. Synchronized reconstruction f the facades,
2.3.5. location of the informal constructions from the public spaces.

Typology and Capacity Study for the new Belgrade Urban Development of the
Left Bank of the Sava River Urban planning for the Block 18, Shipyard , Blocks 69 and 18а, and 68
Belgrade Urban Planning Institute, PUC, 2016

SWAT analysis and the conceptual planning solution
Total Area: 175.2 ha Building Area: 74.6 ha

Urban design competition BLOK 18 NBGD, 2016.


International and national design competitions : • Beton-Hala Centar, na Savskom pristaništu 2011. • Bus and Rail Station Bloku 42 New Belgrade, 2014. • Slavija Square, i • Three central Belgrade Squares, 2015,
• Social and affordable housing,
• Kindergartens and schools.

• New transportation hierarchy, priorities pedestrians cycling, public transportation,• Pedestrian zone Knez Mihailova street, • Urbana pockets, • Public design competitions and the public space design Manual

Culture projects and the revitalization Culture projects and the revitalization of the Belgrade historic areasof the Belgrade historic areas
2.4.1. Revitalization of the historic urban areas
2.4.2. Design competitions and constructing of the new culture facilities
2.4.3. Support for the open space projects and events
2.4.4. Creative sector support
2.4.5. Clear historic heritage status for the buildings and city areas
City of Belgrade Development Strategy 2016–2021
PRIORITY 2.4.

A view of Kalemegdan Park, Belgrade’s birthplace. Credit Danielle Villasana for The New York Times
http://www.nytimes.com/interactive/2016/08/25/travel/what-to-do-36-hours-in-belgrade.html?_r=1

Obilićev venac

• Philharmonic orchestra Building, • Block 13 New Belgrade • City Gallery, Kosančicev venac • City of Belgrade Museum building • Old Fairground, New Belgrade, •

Urban recycling, temporary use of the industrial heritage for culture and Ciglana,Klub ljubitelja teške industrije, Karaburma

City of Belgrade Housing policyCity of Belgrade Housing policy
2.5.1. Housing policy to 2040,
2.5.2. Improvement and maintenance of the housing stock
2.5.3. Principles and the City social and affordable housing projects.
City of Belgrade Development Strategy 2016–2021
PRIORITY 2.5.

City of Belgrade Development Strategy 2016–2021
INDICATORS?
City of Belgrade Development Strategy 2016–2021
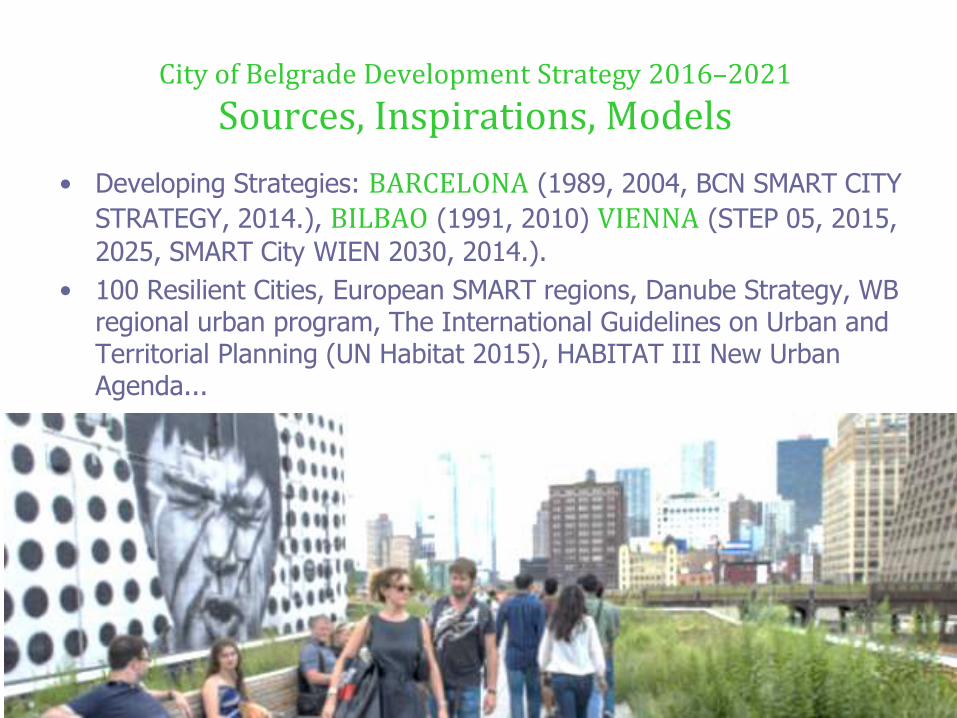
Sources, Inspirations, Models
• Developing Strategies: BARCELONA (1989, 2004, BCN SMART CITY
STRATEGY, 2014.), BILBAO (1991, 2010) VIENNA (STEP 05, 2015,
2025, SMART City WIEN 2030, 2014.).
• 100 Resilient Cities, European SMART regions, Danube Strategy, WB regional urban program, The International Guidelines on Urban and Territorial Planning (UN Habitat 2015), HABITAT III New Urban Agenda...

Sustainability-certified Buildings Number of LEED or BREAM sustainability certified buildings in the city (Note: if your city uses another standard please indicate)
% of commercial and industrial buildings with smart meters
% of commercial buildings with a building automation system
Smart homes % of homes (multi-family & single-family) w/ smart meters
% of total energy derived from renewable sources (ISO 37120: 7.4)
Total residential energy use per capita (in kWh/yr) (ISO 37120: 7.1)
% of municipal grid meeting all of following requirements for smart grid (1. 2-way communication; 2.) Automated control
systems for addressing system outages 3.) real-time information for customers; 4.) Permits distributed generation; 5.)
Supports net metering
Carbon Footprint Greenhouse gas emissioned measured in tonnes per capita (ISO 37120: 8.3)
Air qualty Fine Particular matter 2.5 concentration (µg/m3) (ISO 37120: 8.1)
% of city's solid waste that is recycled (ISO 37120: 16.2)
Total collected municipal solid waste city per capita (in kg) (ISO 37120: 16.3)
% of commercial buildings with smart water meters
Total water consumption per capita (litres/day) (ISO 37120: 21.5)
Climate resilience planning Does your city have a public climate resilience strategy/plan in place? (Y/N) If yes provide link.
Density Population weighted density (average densities of the separate census tracts that make up a metro)
Green Space per capita Green areas per 100,000 (in m2) (ISO 37120: 19.1)
Efficient Transport Clean-energy Transport Kilometers of bicycle paths and lanes per 100,000 (ISO 37120: 18.7)
# of shared bicycles per capita
# of shared vehicles per capita
# of EV charging stations within the city
Annual # of public transport trips per capita (ISO 37120: 18.3)
% non-motorized transport trips of total transport
Integrated fare system for public transport
Smart cards % of total revenue from public transit obtained via unified smart card systems
Presence of demand-based pricing (e.g. congestion pricing, variably priced toll lanes, variably priced parking spaces). Y/N
% of traffic lights connected to real-time traffic management system
# of public transit services that offer real time information to the public: 1 point for each transit category up to 5 total points
(bus, regional train, metro, rapid transit system (e.g. BRT, tram), and sharing modes (e.g. bikesharing, carsharing)
Availability of multi-modal transit app with at least 3 services integrated (Y/N)
Online services Online Procedures % of government services that can be accessed by citizens via web or mobile phone
Electronic Benefits Payments Existence of electronic benefit payments (e.g. social security) to citizens (Y/N)
WiFi Coverage Number of WiFi hotspots per km2
% of commercial and residential users with internet download speeds of at least 2 Mbit/s
% of commercial and residential users with internet download speeds of at least 1 gigabit/s
Sensor Coverage# of infrastructure components with installed sensors 1 point for each: traffic, public transit demand, parking, air quality,
waste, H2O, public lighting
Integrated health + safety
operations
# of services integrated in a singular operations center leveraing real-time data. 1 point for each: ambulance,
emergency/disaster response, fire, police, weather, transit, air quality
Open Data Open data use
Open Apps # of mobile apps available (iPhone) based on open data
Privacy Existence of official citywide privacy policy to protect confidential citizen data
New startups Number of new opportunity-based startups/year
R + D % GDP invested in R&D in private sector
Employment levels % of persons in full-time employment (ISO 37120: 5.4)
Innovation Innovation cities index
Productivity GRP per capita Gross Regional Product per capita (in US$, except in EU, in Euros)
Exports % of GRP based on technology exports
International Events Hold Number of international congresses and fairs atendees.
Internet-connected Households % of Internet-connected households
Smart phone penetration % of residents with smartphone access
Civic engagement # of civic engagement activities offered by the muncipality last year
Voter participation in last municipal election (% of eligible voters) (ISO 37120: 11.1)
Secondary Education % of students completing secondary education (ISO 37120: 6.3)
University Graduates Number of higher education degrees per 100,000 inhabitants (ISO 37120: 6.7)
Foreign-born immigrants % of population born in a foreign country
Urban Living Lab # of officially registered ENOLL living labs
Creative Industry Jobs Percentage of labor force (LF) engaged in creative industries
Life ConditionsPercentage of inhabitants with housing deficiency in any of the following 5 aereas (potable water, sanitation, overcrowding,
deficient material quality, or lacking electricity)
Gini Index Gini coefficient of inequality
Quality of life ranking Mercer ranking in most recent quality of life survey
Investment in Culture % of municipal budget allocated to culture
Crime Violent crime rate per 100,000 population (ISO 37120: 14.5)
Smart Crime Prevention# technologies in use to assist with crime prevention, 1 point for each of the following: livestreaming video cameras, taxi
apps, predictive crime software technologies
Single health history % of residents w/ single, unified health histories facilitating patient and health provider access to complete medical records
Life Expectancy Average life expectancy (ISO 37120: 12.1)
Smart City Index
Open Government
Economy
Entrepreneurship & Innovation
People
Government
LivingSafety
Culture and Well-being
Local and Global Conexion
Health
Creativity
Inclusion
Education
Mobility
Environment
Dimension Working Area
Multi-modal Access
Resources Management
Technology Infrastructure
Your City Data Additional Info (Optional)
Broadband coverage
Sustainable Urban Planning
Smart Buildings
Indicator
Infrastructure
Description
Public Transport
Water consumption
Energy
Waste Generation
Access to real-time information

o http://readinessguide.smartcitiescouncil.com/readiness-guide/built-environment
o Key Performance Indicators (KPIs) and Metrics for Smart Sustainable Cities , SSCs, The International Telecommunication Union (ITU)
o Smart City Index Master Indicators

Thank you for your attention!Thank you for your attention!
Thank you for your attention!Thank you for your attention!