Embed Size (px)
Citation preview
Quantification of ammonia oxidation rates and ammonia-oxidizing archaea and
bacteria at high resolution in the Gulf of California and eastern tropical North
Pacific Ocean
J. Michael Beman,a,b,* Brian N. Popp,b and Susan E. Alford a
a School of Natural Sciences, University of California, Merced, CaliforniabSchool of Ocean and Earth Science and Technology, University of Hawaii, Honolulu, Hawaii
Abstract
Ammonia-oxidizing microorganisms compete with phytoplankton for reduced nitrogen in the euphotic zoneand provide oxidized nitrogen to other microbes present in the sea. We report 15NH z
4 oxidation ratemeasurements made at 5–20-m resolution using an in situ array and quantification of ammonia-oxidizing archaea(AOA) and ammonia-oxidizing bacteria (AOB) in corresponding samples from the upper water column andoxygen minimum zone (OMZ) of the Gulf of California (GOC) and eastern tropical North Pacific Ocean (ETNP).15NH z
4 oxidation rates varied substantially with depth and between stations: they were greatest at the base of theeuphotic zone, and maximum rates were up to 28-fold greater than rates measured within 5–10 m. Pyrosequencingand quantitative polymerase chain reactions (QPCR) indicated that AOA were present throughout the watercolumn at all latitudes and always outnumbered AOB. AOB constituted only 39 of 432,240 16S ribosomalribonucleic acid gene sequences produced via pyrosequencing but were more abundant at greater depths andhigher latitudes. 15NH z
4 oxidation rates were correlated with AOA abundance at some stations and weredetectable in 96% of samples, including depths where oxygen concentrations were , 5 mmol kg21 and depthswithin the euphotic zone, where up to 42% of ammonia oxidation occurred. Ammonia is rapidly oxidized withindiscrete depth intervals in the GOC and ETNP; while pyrosequencing and QPCR demonstrate that AOB areconfined to deeper portions of the water column, AOA appear to be active within the euphotic zone, where theymay quickly respond to nitrogen inputs.
Nitrification is a central process in the oceanic nitrogen(N) cycle that acts as a biogeochemical bridge between Ninputs from the atmosphere via N2 fixation and N losses viathe anaerobic processes of denitrification and anaerobicammonium oxidation (anammox) (Francis et al. 2007;Canfield et al. 2010a). Because N is a required nutrient forall organisms and limits primary production across largeareas of the ocean (Mills et al. 2004), determining hownitrification may affect N availability is of criticalimportance. However, two emerging lines of researchindicate that our understanding of oceanic nitrification isincomplete: nitrification is now thought to occur at higherrates and over greater depth ranges than previouslyappreciated (Yool et al. 2007; Church et al. 2010; Santoroet al. 2010), and marine Thaumarchaeota (Brochier-Armanet et al. 2008) play a substantial but poorlyconstrained role in nitrification (Agogue et al. 2008; Bemanet al. 2008; Santoro et al. 2010). Because the cultivatedmarine thaumarchaeon Nitrosopumilus maritimus (Kon-neke et al. 2005) has a remarkable affinity for ammonia(NH3) that would allow organisms with similar physiologyto directly and successfully compete with phytoplanktonfor N (Martens-Habbena et al. 2009), placing quantitativeconstraints on nitrification rates and nitrifier distributionsin the sea is essential to our understanding of oceanic Ncycling.
The two sequential steps of nitrification are catalyzed bydifferent groups of microorganisms: ammonia-oxidizing
bacteria (AOB) and ammonia-oxidizing archaea (AOA)oxidize ammonia (NH3) to nitrite (NO {
2 ), and nitrite-oxidizing bacteria (NOB) subsequently oxidize NO {
2 tonitrate (NO {
3 ); our focus in this study is the first and rate-limiting step of the process: ammonia oxidation. Coupledammonia and nitrite oxidation consequently convert themost reduced form of N in the ocean (NH3) to the mostoxidized form (NO {
3 ) such that the energy gained by AOA,AOB, and NOB must ultimately be expended by otherorganisms when they assimilate NO {
2 or NO {3 (Raven
2009)—phytoplankton, for instance, must reduce NO {2 or
NO {3 when these oxidized forms of N are incorporated for
biosynthesis. Light is thought to inhibit nitrification, withammonia oxidizers being less sensitive than NOB (reviewedby Lomas and Lipschultz 2006). However, nitrification canbe detected in the euphotic zone (Wankel et al. 2007;Church et al. 2010; Santoro et al. 2010), indicating thatnitrification occurs in the light. This also suggests thatnitrifiers directly compete with phytoplankton for reducedN. In fact, Yool et al. (2007) combined published openocean nitrification rate measurements (mostly using 15N-labeled NH z
4 ) with an intensive measurement program inthe North Atlantic Ocean and found that specificnitrification rates (normalized to [NH z
4 ] and expressed asday21) were high in surface waters and showed littleseasonality or variation with latitude. The major implica-tion of this work was that estimates of the f-ratio (Eppleyand Peterson 1979)—and hence carbon export—weresignificantly lower when accounting for near-surfacenitrification. Yool and colleagues calculated that 25–30%* Corresponding author: [email protected]
Limnol. Oceanogr., 57(3), 2012, 711–726
E 2012, by the Association for the Sciences of Limnology and Oceanography, Inc.doi:10.4319/lo.2012.57.3.0711
711
of all marine primary production (i.e., not just newproduction) is sustained by NO {
3 that is produced in theeuphotic zone by nitrification. This surprising global-scalecalculation is supported by direct measurements on aregional scale: Santoro et al. (2010) compared 14C primaryproduction rates with nitrification rates measured in theCalifornia Current and calculated that nitrification couldsupply 25–36% of the N required by phytoplankton.
A more important biogeochemical role for oceanicnitrification squares well with ammonia serving as anenergy source for marine Thaumarchaeota: these organismsdominate microbial communities beneath the euphoticzone, where they number , 30% of all cells and constituteone of the most abundant microbial groups in the sea(Karner et al. 2001). Evidence for ammonia oxidation bymarine Thaumarchaeota continues to accumulate, and witha few exceptions (Agogue et al. 2008; but see Konstanti-nidis et al. 2009; Church et al. 2010; Santoro et al. 2010),molecular studies indicate that many Thaumarchaeota havethe ability to oxidize ammonia (i.e., are AOA; Francis et al.2005) and actively do so in the ocean (Lam et al. 2007;Beman et al. 2008; Church et al. 2010). AOA outnumberAOB by several orders of magnitude in seawater (Mincer etal. 2007; Beman et al. 2008, 2010), but how these microbialgroups vary in relation to one another and acrossoceanographic gradients is not well known.
Ammonia oxidation is particularly important in oceanicoxygen minimum zones (OMZs), where low oxygenconditions at depth allow N loss through anaerobic Ncycling processes to occur. How exactly N cycling proceedsin these regions is debated (Lam et al. 2009; Ward et al.2009; Canfield et al. 2010b) but has an important bearingon the global N cycle because OMZs are unequivocallyareas of fixed N loss from the ocean. In OMZs, ammoniaand nitrite oxidation provide a source of oxidized Ncompounds that may be used by denitrifiers or anammoxbacteria as electron acceptors and converted to gaseousforms under anaerobic conditions (Lam et al. 2007, 2009;Canfield et al. 2010a). Ammonia oxidation is therefore aprerequisite for N loss in OMZs. Nitrogen loss subsequentlystarves these regions of fixed N (Beman et al. 2005; White etal. 2007), and N turns over rapidly in these regions (Wardand Zafiriou 1988; Lipschultz et al. 1990; Lam et al. 2009);hence, competition for N between high-affinity AOA andother organisms is likely to be intense. Adding to thiscomplexity, OMZs are expanding as a consequence ofclimate change (Keeling et al. 2010), altering the rates anddistribution of N transformations in the water column.Placing quantitative bounds on microbially driven biogeo-chemical processes occurring in OMZs is therefore essential.
Here we quantify ammonia oxidation rates and ammo-nia oxidizer distributions across an oceanographic transectthrough northern portions of the eastern tropical NorthPacific Ocean (ETNP), the largest oceanic OMZ. Using anin situ floating array and stable isotope tracer, ammoniaoxidation rates were measured at higher resolution withdepth than in any previous study. Ammonia oxidizers werequantified using real-time quantitative polymerase chainreactions (QPCR) and next-generation pyrosequencing ofbacterial communities, producing a detailed view of
ammonia oxidation in this biogeochemically importantregion of the ocean.
Methods
Sampling—Samples were collected in July and August2008 aboard the R/V New Horizon. Seven stations wereoccupied for several days each, and temperature, conduc-tivity, and chlorophyll concentrations were measured usinga Seabird SBE 9 conductivity-temperature-depth (CTD)sensor package equipped with a Seapoint fluorometer andphotosynthetically active radiation sensor (BiosphericalInstruments QSP-2300). Samples were collected using 10-liter PVC bottles deployed on the CTD rosette; samples fornutrient measurements and Winkler titrations were typi-cally collected on the first cast and analyzed within hours ofcollection to characterize the structure of the water column.We selected depths for rate measurements and collection ofdeoxyribonucleic acid (DNA) samples based primarily onnutrient concentrations: one to three depths above theprimary NO {
2 and NH z4 maxima were targeted, followed
by five to seven depths spaced every 5 m and severaladditional depths spaced every 10–20 m. At each of thesedepths, ammonia oxidation rates were measured viaaddition of 15N-labeled NH z
4 to polycarbonate samplebottles deployed on a free-floating array (see below), andDNA samples were collected (see below). Water samplesfor rate measurements and DNA samples were collected onthe same cast at all stations. These were collected 14–20 hfollowing nutrient/Winkler samples at Sta. 1–6; at Sta. 7,nutrient and oxygen samples were collected 4 h after therate and DNA samples.
Biogeochemical measurements—Oxygen concentrationswere measured using a SBE oxygen sensor and correctedbased on Winkler titrations (r2 5 0.997 for 187 samples forthe cruise). Winkler-corrected SBE oxygen data are shownfor the casts where rate and DNA samples were collected.NH z
4 concentrations were measured using the fluorometricmethod of Holmes et al. (1999), and NO {
2 and NO {3
concentrations were measured using standard colorimetrictechniques (Strickland and Parsons 1972); NO {
3 wasreduced to NO {
2 with cadmium for measurement. Samplescollected at depths greater than 100 m were frozen andanalyzed at the College of Oceanic and AtmosphericSciences at Oregon State University following the cruise.A subset of samples that were measured aboard ship wasincluded in this analysis, and shore-based analyses agreedwell with shipboard measurements (r2 5 0.88) but wereslightly lower in concentration. Hence, frozen samples werecorrected to shipboard-measured concentrations; r2 forstandard curves were 0.996–0.999 (oxygen measurements),0.959–0.999 (NH z
4 measurements), and 0.993–0.999 (NO {2
and NO {3 measurements).
In situ free-floating array—To measure ammonia oxida-tion rates as accurately as possible under in situ conditions,we deployed a free-floating array with sample bottlessuspended at multiple depths in the water column. Thedesign of the free-floating array and the procedure used for
712 Beman et al.
its deployment and recovery followed that described byPrahl et al. (2005). Water samples were collected from therosette into 250-mL polycarbonate bottles in the dark usingsilicone tubing, and samples were overfilled by threevolumes to avoid oxygen contamination; chilled 15N-labeled NH4Cl (see below) was quickly added via a 1-mLpipette, and the bottles were sealed. Bottles were attachedto the array immediately before deployment at dawn, andthe array was deployed for , 24 h under in situtemperature and light conditions. Our deepest array-basedincubations were placed at 160-m depth, and samplescollected from depths greater than 160 m were incubated at12uC onboard the ship using temperature-controlledincubators; this includes nine samples reported here. Forfive suboxic samples (Sta. 2, 100 m; Sta. 3, 100 and 120 m;and Sta. 4, 140 and 160 m), duplicate incubations wereconducted both on the array and onboard the ship in 125-mL Wheaton serum bottles sealed with Viton stoppers tominimize oxygen exposure. Following array recovery,samples were filtered through 0.2-mm syringe filters,collected in 50-mL high-density polyethylene bottles, andfrozen at 220uC until analysis at the University of Hawaii.
15NH z4 oxidation rate measurements—Ammonia oxida-
tion rates were measured by adding 99 atom percent (at%)15NH z
4 to a concentration of 42 nmol L21 and measuringthe accumulation of 15N label in the oxidized NO {
2 + NO {3
pool after incubation for , 24 h (Ward 2008). The d15Nvalue of N2O produced from NO {
2 + NO {3 using the
‘‘denitrifier method’’ (Sigman et al. 2001) was measuredusing methods described in Popp et al. (1995) and Dore etal. (1998). Briefly, N2O produced from NO {
2 + NO {3 was
transferred from a reaction vial, cryofocused, separatedfrom other gases using a 0.32-mm-inner-diameter 3 25-mPoraPLOT-Q capillary column (Agilent Technologies) atroom temperature, and introduced into an ion sourceMAT252 mass spectrometer through a modified interface.Isotopic reference materials (United States GeologicalSurvey-32, National Institute of Standards and Technolo-gy-3, University of Hawaii NaNO3) bracketed every 12–16samples and d15N values measured online were linearlycorrelated (r2 5 0.996–0.999) with accepted referencematerial d15N values. Coefficients of variation for duplicatesamples using this method ranged from 0.9% to 4.1% basedon 41% of samples analyzed in duplicate. Accuracy andprecision were further evaluated by multiple analyses of asodium nitrate solution for which the d15N value of thesolid NaNO3 (i.e., University of Hawaii NaNO3) had beenpreviously determined using an online carbon-nitrogenanalyzer coupled with an isotope ratio mass spectrometer(ConFlo II Delta-Plus) and were found to be less than6 0.5% (6 0.00018 at% 15N) for samples containing . 2.5nanomoles of nitrate.
Initial at% enrichment of the substrate at the beginningof the experiment (no NH z
4 ; see Eq. 1) was calculated byisotope mass balance based on NH z
4 concentrationsdetermined fluorometrically (Holmes et al. 1999) assumingthat the 15N activity of unlabeled NH z
4 was 0.3663 at%15N. Rates of ammonia oxidation (15Rox) were calculatedusing an equation modified from Ward et al. (1989b):
15Rox~(nt{noNO{
x )|½NO{3 zNO{
2 �(nNHz
4 {noNHz4 )|t
ð1Þ
where nt is the at% 15N in the NO {3 + NO {
2 pool measuredat time t, noNO {
x , is the measured at% 15N of unlabeledNO {
3 + NO {2 , noNH z
4 is the initial at% enrichment of
NH z4 at the beginning of the experiment, nNH z
4 is at%15N of NH z
4 at time t, and [NO {3 + NO {
2 ] is theconcentration of the NO {
x pool. We assume that 15Nenrichment of the substrate changed negligibly in the openocean waters we examined (Kanda et al. 1987). Integratedrates of 15NH z
4 oxidation were calculated on the basis ofthe average rates measured per depth interval above therate peak and by integrating a fitted (power law) curvefrom the rate peak down through the water column.
13C uptake measurements—Carbon uptake rates weremeasured using 13C-labeled bicarbonate tracer at eachsampling station. Water was transferred from rosettebottles into , 2-liter, acid-cleaned (10% HCl), and Milli-Q-rinsed polycarbonate bottles using acid-washed andsterilized silicone tubing; for each incubation depth,duplicate , 2-liter volumes were collected for determina-tion of the ambient (time-zero) d13C value of particles andvolumetric concentrations of particulate organic carbonand nitrogen. To each bottle, 0.25 mL of a 0.05 molarNaH13CO3 (99 atom% 13C, Cambridge Isotope Laborato-ries) solution were added using a plunger-type syringe. Allincubation bottles were filled to overflowing before beingsealed with a Teflon-lined butyl rubber septum cap. Samplebottles were gently mixed, attached to the array, anddeployed for , 24 h as described above. At the end of eachincubation period, suspended particles were collected bygentle vacuum filtration through a 25-mm precombustedglass-fiber filter (450uC for 12 h, Whatman GF/F, nominalpore size 0.7 mm). Filters were immediately frozen (220uC)until analysis. Samples were acid fumed, dried overnight at60uC, and then encapsulated in tin cups prior to analysis oftheir carbon isotopic composition using the methodologydescribed in Prahl et al. (2005). Based on previousexperience in the Gulf of California, a 15% dark correctionwas applied to all calculations of 13C uptake rates (Whiteet al. 2007).
DNA sample collection and extraction—Two liters ofseawater were collected from the CTD rosette and filteredthrough 25-mm-diameter 0.2-mm Suppor filters (PallCorporation) using a peristaltic pump. Filters were flashfrozen in liquid nitrogen and then stored at 280uC untilDNA extraction using a protocol slightly modified fromBeman et al. (2008): filters were bead beat for 2 min andthen incubated with 800 mL of lysis buffer (20 mmol L21
EDTA, 400 mmol L21 NaCl, 750 mmol L21 sucrose,50 mmol L21 Tris) and 100 mL of 10% SDS at 99uC for1 min using a dry heat block; following the addition of100 mL of proteinase K (10 mg mL21), samples wereincubated at 55uC for 3 h. Lysates were purified usingQiagen DNeasy columns according the manufacturer’sprotocol (Qiagen), and DNA concentrations were mea-
Pacific Ocean ammonia oxidation 713
sured using the PicoGreen assay and the manufacturer’sprotocol (Life Technologies Corporation).
QPCR analyses—QPCR analyses were identical to thoseused by Beman et al. (2010). Archaeal amoA and 16Sribosomal ribonucleic acid (rRNA) QPCR assays used thefollowing reaction chemistry: 12.5 mL of SYBR Premix F(Epicentre Biotechnologies), 2 mmol L21 MgCl2,0.4 mmol L21 of each primer, 1.25 units of AmpliTaqpolymerase (Life Technologies Corporation), 40 ng mL21
bovine serum albumin (Life Technologies Corporation),and 1 ng DNA in a final volume of 25 mL. bAOB werequantified using the same reaction chemistry but withoutadditional MgCl2. Primers (and relevant references forprimer sequences), cycling conditions, QPCR standards,
standard curve correlation coefficients, and PCR efficien-cies are listed in Table 1. All QPCR assays were performedon a Stratagene MX3005P QPCR system (Agilent Tech-nologies), and continuity among QPCR assays wasmaintained by including in each run a subset of samples(n 5 6–8) from the previous run.
Pyrosequencing—DNA samples collected at all depths atSta. 1–6 were sequenced using Titanium chemistry on theRoche 454 FLX platform at Research and TestingLaboratories. No samples from Sta. 7 were sequenced.We used the Bacteria-specific primers 27F (59-GAGTTT-GATCNTGGCTCAG-39) and 519R (59-GWNTTA-CNGCGGCKGCTG-39) (Engelbrektson et al. 2010) mod-ified with additional degeneracies (Ns in primer sequence)
Table 1. Details of QPCR assays used in this study. Includes primers used (and reference), cycling conditions, standards used, rangeof r2 values for standard curves from different QPCR runs, and efficiency range for different runs.
Assay Primers (reference) Cycling conditions QPCR standard r2 Efficiency
Archaeal amoA Arch-amoAF andArch-amoAR(Francis et al. 2005)
95uC (4 min); 30 3 95uC (30 s),53uC (45 s), 72uC (60 s withdetection step); dissociationcurve
Clone GOC-G-60-9(GenBank accessionno. EU340472)dilution series
0.986–0.999 86.6–100%
MG1 Crenarchaeota16S rRNA
GI_741F and GI_956R(Mincer et al. 2007)
95uC (4 min); 30 3 94uC (15 s),58uC (30 s), 72uC (30 s),detection step at 78uC (7 s);dissociation curve
Clone arc11april01.150dilution series
0.953–0.992 96.0–114%
BetaproteobacterialamoA
amoAF and amoA2R(Rotthauwe et al.1997)
95uC (5 min); 40 3 of 94uC(45 s), 56uC (30 s), 72uC(60 s), detection step at 81uC(7 s); dissociation curve
Clone HB_A_0206_G01 (GenBankaccessionno. EU155190)dilution series
0.968–0.998 82.9–100%
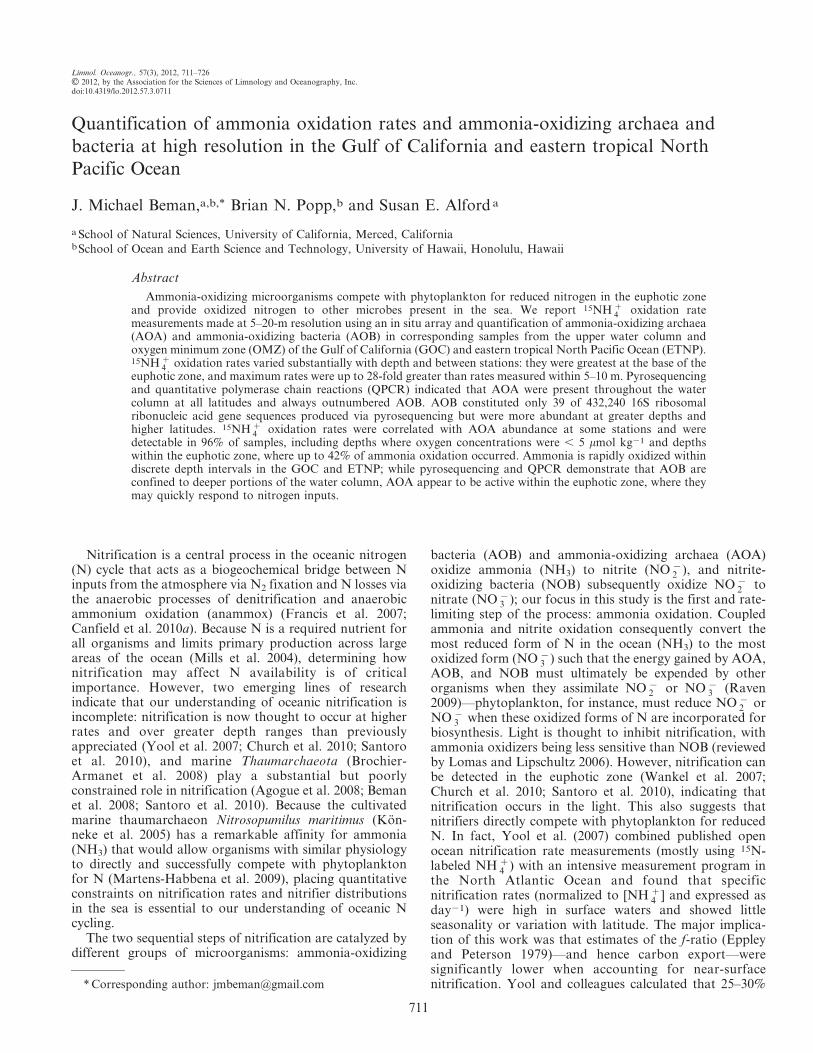
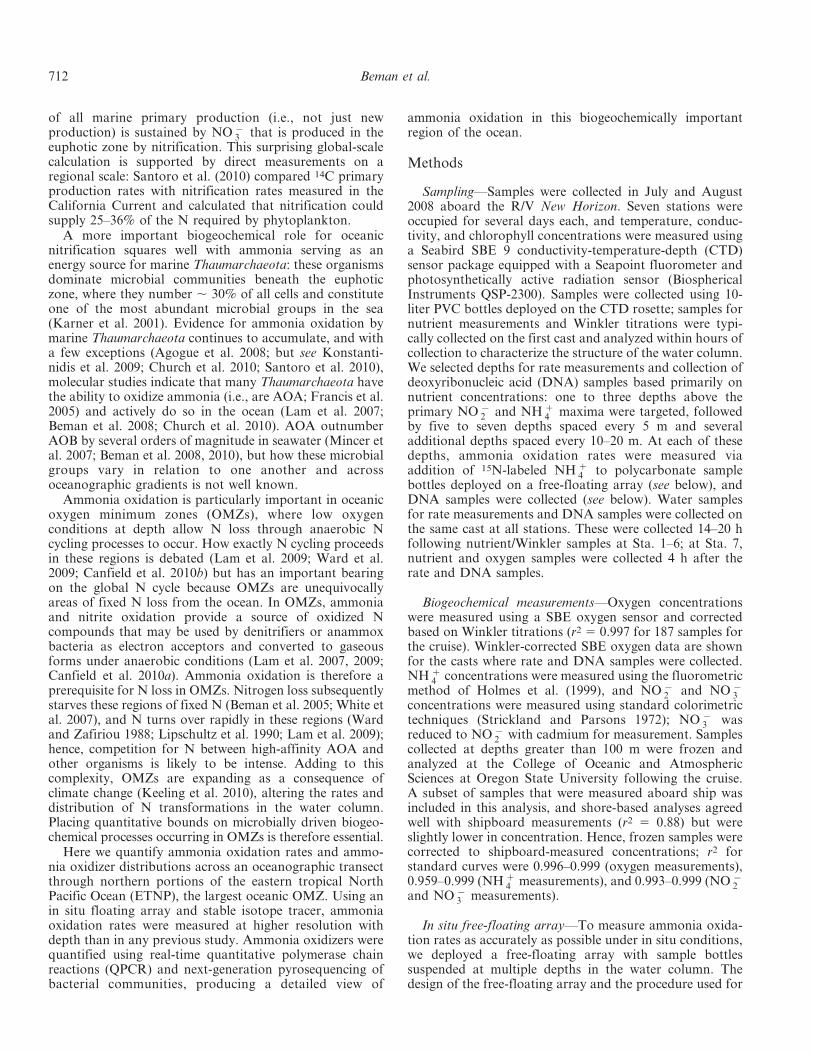
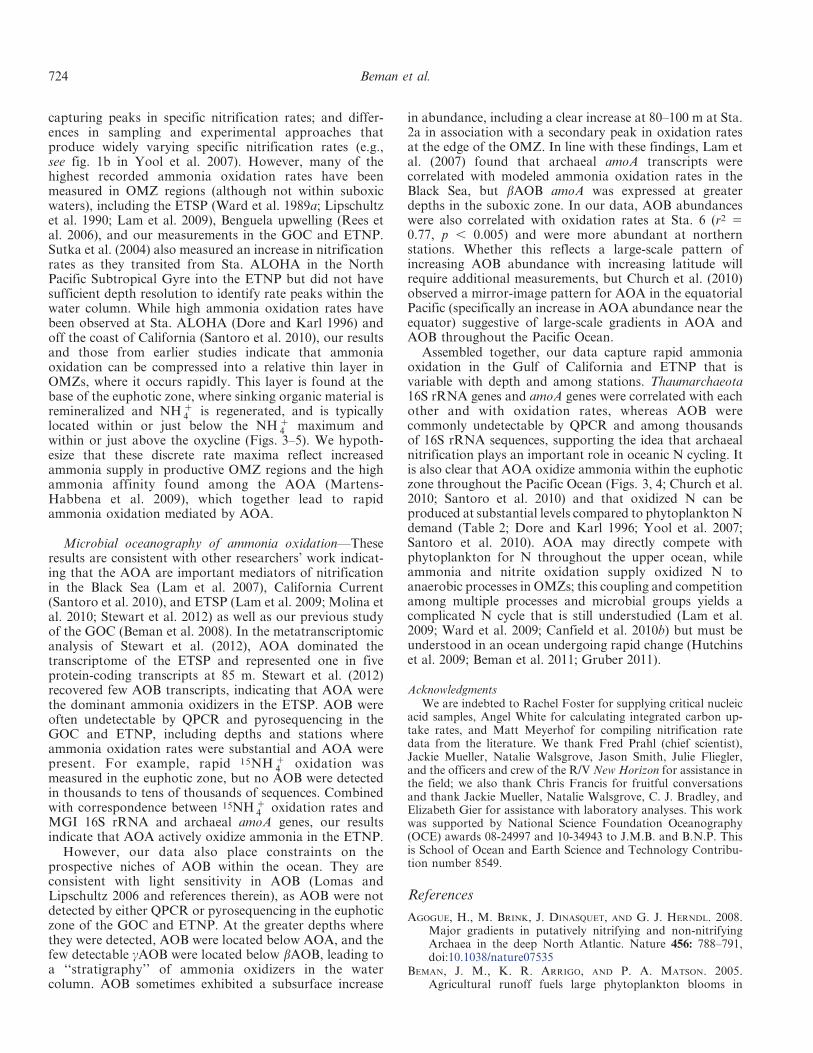
Fig. 1. Cruise track in the GOC and ETNP. Station locations are plotted on dissolvedoxygen concentrations (mmol L21) at 100-m depth from the World Ocean Atlas in OceanData View.
714 Beman et al.
to amplify a portion of the bacterial 16S rRNA gene.Relevant Roche linkers were attached to primers, as wereeight-base ‘‘bar codes’’ (Hamady et al. 2008) used to sort 60individual samples from the six stations. For the 60samples, we recovered 714,245 sequences with a medianread length of 475 base pairs (bp).
For quality control, we used the approach of Huse et al.(2007) that is commonly used in the literature (Brown et al.2009; Galand et al. 2009). Briefly, we used the programmothur (http://www.mothur.org; Schloss et al. 2009) todiscard sequences: . 6 100 bp from the median sequencelength, containing any ambiguous bases, containing homo-polymers . 8 bp, of , 25 average quality score, and thatdid not exactly match the forward primer and bar codesequence. The final criterion is where most (62% of alldiscarded sequences) sequences were removed. We did notscreen sequences based on the reverse primer, as some ofthe reads are high-quality sequences that did not extend to
the reverse primer. In total, 282,005 sequences (34%) didnot meet quality control criteria and were excluded fromsubsequent analyses; a total of 432,240 bacterial 16S rRNAsequences were analyzed. Community composition ofindividual samples was determined using the RibosomalDatabase Project Classifier (http://pyro.cme.msu.edu;Wang et al. 2007) using default parameters. Kunin et al.(2010) note that pyrosequencing errors may inflateestimates of microbial diversity, but our analysis isinsensitive to this, as we are identifying AOB sequencesbased on similarity to database sequences. AOB 16S rRNAsequence data have been submitted to the GenBankdatabase under accession numbers JQ478836-JQ478874.
Data analysis—Oceanographic data were visualized inOcean Data View (http://odv.awi.de), and statisticalanalyses were conducted in MATLAB version 7.6.0(R2008a).
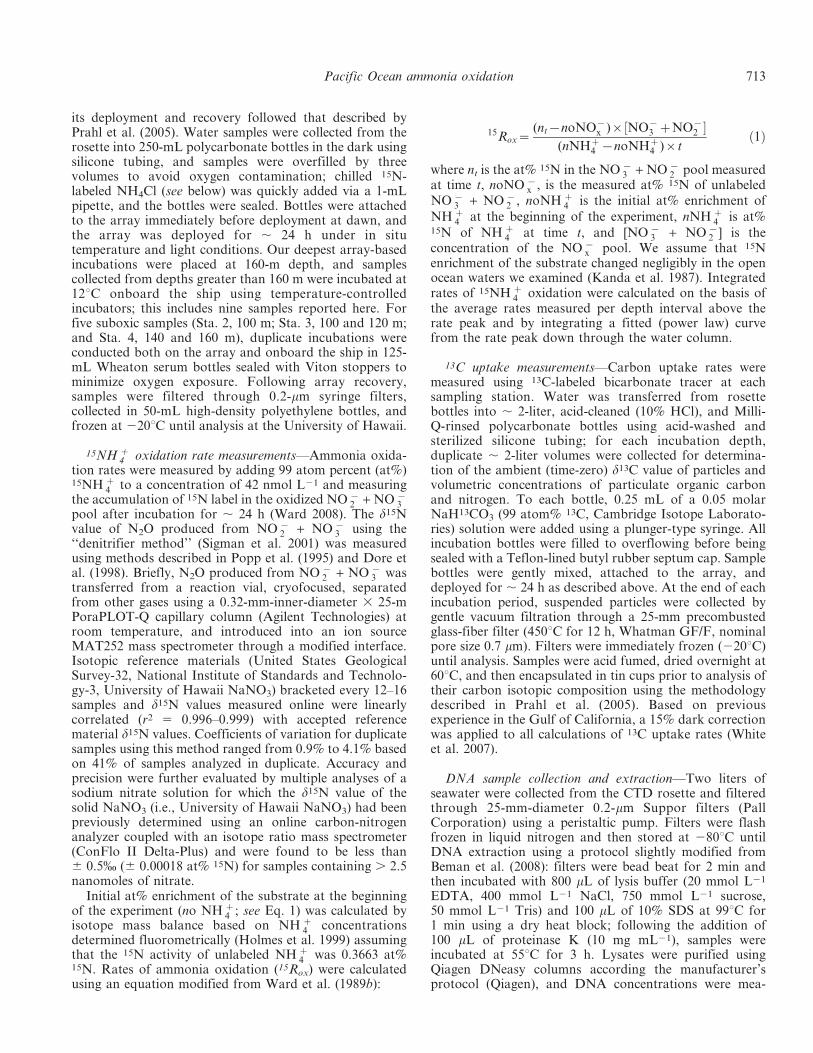
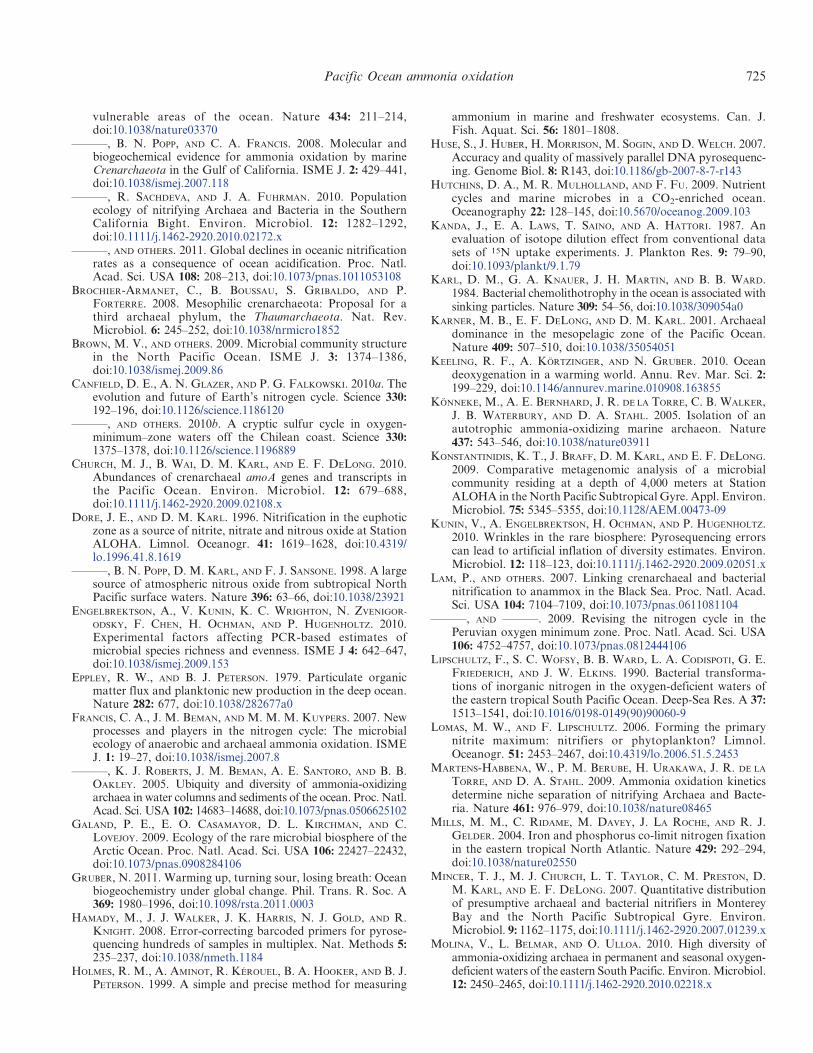
Fig. 2. Sections of (A) temperature (uC), (B) dissolved oxygen concentrations (mmol kg21), and (C) nitrate concentrations(mmol L21) along the cruise track. Location of stations is indicated along the horizontal axis; vertical axes display depths down to 1000 m.Small black dots denote the depths of bottle samples collected for nitrate measurements, and discrete temperature and oxygen data for thesame depths were extracted from the CTD data. Data were gridded in Ocean Data View.
Pacific Ocean ammonia oxidation 715
716 Beman et al.
Results
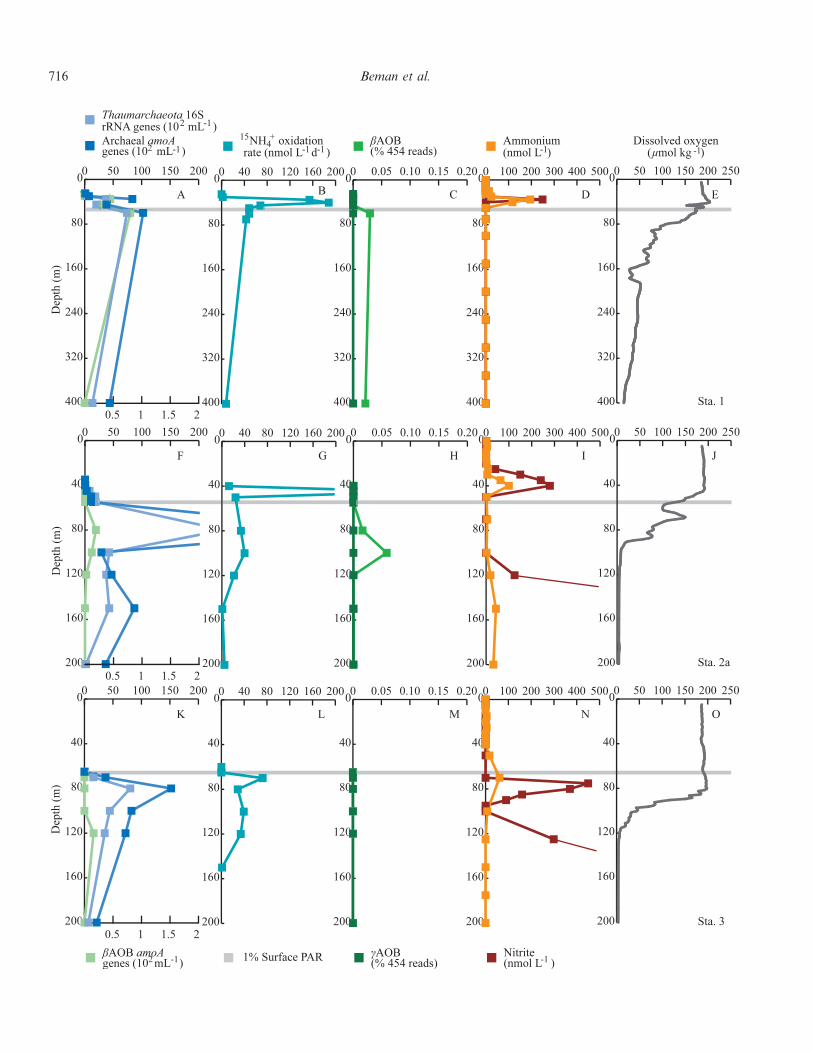
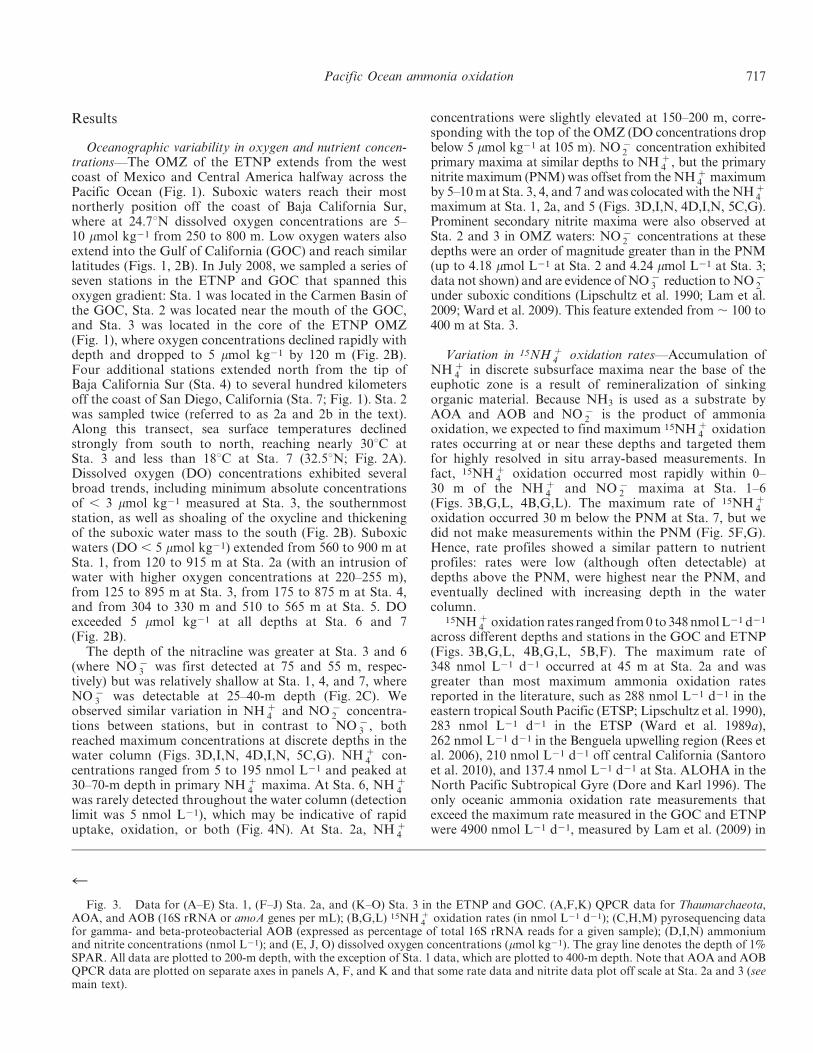
Oceanographic variability in oxygen and nutrient concen-trations—The OMZ of the ETNP extends from the westcoast of Mexico and Central America halfway across thePacific Ocean (Fig. 1). Suboxic waters reach their mostnortherly position off the coast of Baja California Sur,where at 24.7uN dissolved oxygen concentrations are 5–10 mmol kg21 from 250 to 800 m. Low oxygen waters alsoextend into the Gulf of California (GOC) and reach similarlatitudes (Figs. 1, 2B). In July 2008, we sampled a series ofseven stations in the ETNP and GOC that spanned thisoxygen gradient: Sta. 1 was located in the Carmen Basin ofthe GOC, Sta. 2 was located near the mouth of the GOC,and Sta. 3 was located in the core of the ETNP OMZ(Fig. 1), where oxygen concentrations declined rapidly withdepth and dropped to 5 mmol kg21 by 120 m (Fig. 2B).Four additional stations extended north from the tip ofBaja California Sur (Sta. 4) to several hundred kilometersoff the coast of San Diego, California (Sta. 7; Fig. 1). Sta. 2was sampled twice (referred to as 2a and 2b in the text).Along this transect, sea surface temperatures declinedstrongly from south to north, reaching nearly 30uC atSta. 3 and less than 18uC at Sta. 7 (32.5uN; Fig. 2A).Dissolved oxygen (DO) concentrations exhibited severalbroad trends, including minimum absolute concentrationsof , 3 mmol kg21 measured at Sta. 3, the southernmoststation, as well as shoaling of the oxycline and thickeningof the suboxic water mass to the south (Fig. 2B). Suboxicwaters (DO , 5 mmol kg21) extended from 560 to 900 m atSta. 1, from 120 to 915 m at Sta. 2a (with an intrusion ofwater with higher oxygen concentrations at 220–255 m),from 125 to 895 m at Sta. 3, from 175 to 875 m at Sta. 4,and from 304 to 330 m and 510 to 565 m at Sta. 5. DOexceeded 5 mmol kg21 at all depths at Sta. 6 and 7(Fig. 2B).
The depth of the nitracline was greater at Sta. 3 and 6(where NO {
3 was first detected at 75 and 55 m, respec-tively) but was relatively shallow at Sta. 1, 4, and 7, whereNO {
3 was detectable at 25–40-m depth (Fig. 2C). Weobserved similar variation in NH z
4 and NO {2 concentra-
tions between stations, but in contrast to NO {3 , both
reached maximum concentrations at discrete depths in thewater column (Figs. 3D,I,N, 4D,I,N, 5C,G). NH z
4 con-centrations ranged from 5 to 195 nmol L21 and peaked at30–70-m depth in primary NH z
4 maxima. At Sta. 6, NH z4
was rarely detected throughout the water column (detectionlimit was 5 nmol L21), which may be indicative of rapiduptake, oxidation, or both (Fig. 4N). At Sta. 2a, NH z
4
concentrations were slightly elevated at 150–200 m, corre-sponding with the top of the OMZ (DO concentrations dropbelow 5 mmol kg21 at 105 m). NO {
2 concentration exhibitedprimary maxima at similar depths to NH z
4 , but the primarynitrite maximum (PNM) was offset from the NH z
4 maximumby 5–10 m at Sta. 3, 4, and 7 and was colocated with the NH z
4maximum at Sta. 1, 2a, and 5 (Figs. 3D,I,N, 4D,I,N, 5C,G).Prominent secondary nitrite maxima were also observed atSta. 2 and 3 in OMZ waters: NO {
2 concentrations at thesedepths were an order of magnitude greater than in the PNM(up to 4.18 mmol L21 at Sta. 2 and 4.24 mmol L21 at Sta. 3;data not shown) and are evidence of NO {
3 reduction to NO {2
under suboxic conditions (Lipschultz et al. 1990; Lam et al.2009; Ward et al. 2009). This feature extended from , 100 to400 m at Sta. 3.
Variation in 15NH z4 oxidation rates—Accumulation of
NH z4 in discrete subsurface maxima near the base of the
euphotic zone is a result of remineralization of sinkingorganic material. Because NH3 is used as a substrate byAOA and AOB and NO {
2 is the product of ammoniaoxidation, we expected to find maximum 15NH z
4 oxidationrates occurring at or near these depths and targeted themfor highly resolved in situ array-based measurements. Infact, 15NH z
4 oxidation occurred most rapidly within 0–30 m of the NH z
4 and NO {2 maxima at Sta. 1–6
(Figs. 3B,G,L, 4B,G,L). The maximum rate of 15NH z4
oxidation occurred 30 m below the PNM at Sta. 7, but wedid not make measurements within the PNM (Fig. 5F,G).Hence, rate profiles showed a similar pattern to nutrientprofiles: rates were low (although often detectable) atdepths above the PNM, were highest near the PNM, andeventually declined with increasing depth in the watercolumn.
15NH z4 oxidation rates ranged from 0 to 348 nmol L21 d21
across different depths and stations in the GOC and ETNP(Figs. 3B,G,L, 4B,G,L, 5B,F). The maximum rate of348 nmol L21 d21 occurred at 45 m at Sta. 2a and wasgreater than most maximum ammonia oxidation ratesreported in the literature, such as 288 nmol L21 d21 in theeastern tropical South Pacific (ETSP; Lipschultz et al. 1990),283 nmol L21 d21 in the ETSP (Ward et al. 1989a),262 nmol L21 d21 in the Benguela upwelling region (Rees etal. 2006), 210 nmol L21 d21 off central California (Santoroet al. 2010), and 137.4 nmol L21 d21 at Sta. ALOHA in theNorth Pacific Subtropical Gyre (Dore and Karl 1996). Theonly oceanic ammonia oxidation rate measurements thatexceed the maximum rate measured in the GOC and ETNPwere 4900 nmol L21 d21, measured by Lam et al. (2009) in
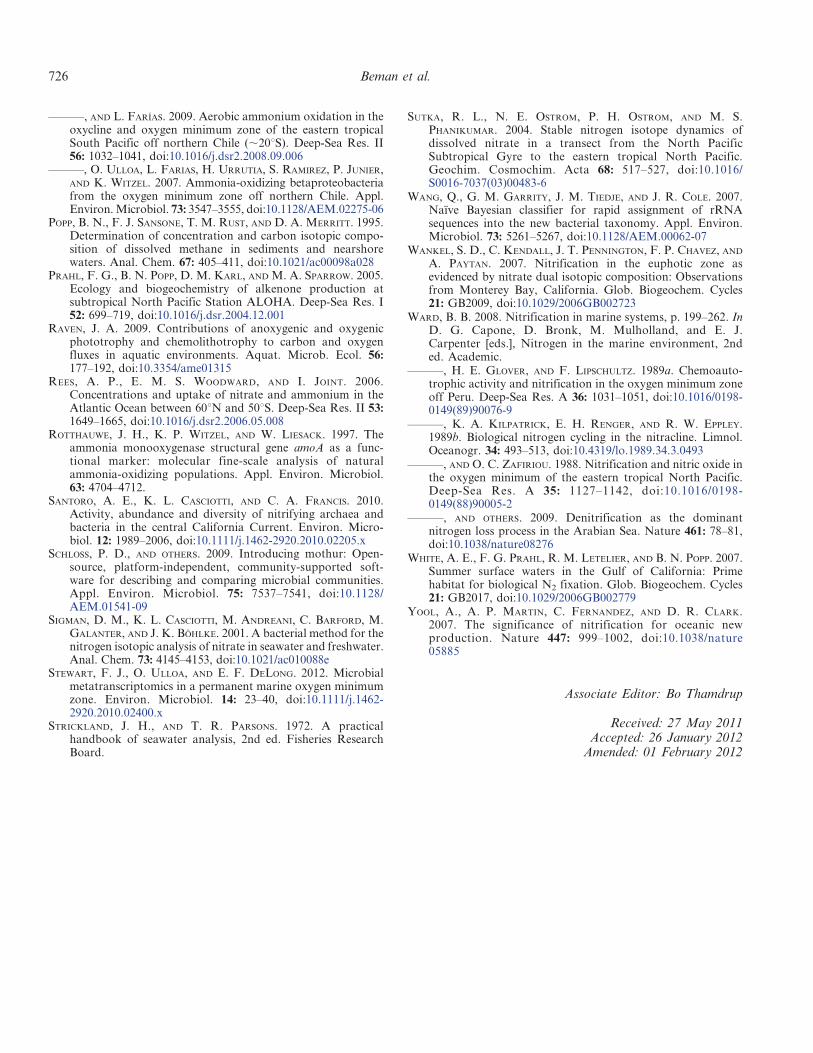
r
Fig. 3. Data for (A–E) Sta. 1, (F–J) Sta. 2a, and (K–O) Sta. 3 in the ETNP and GOC. (A,F,K) QPCR data for Thaumarchaeota,AOA, and AOB (16S rRNA or amoA genes per mL); (B,G,L) 15NH z
4 oxidation rates (in nmol L21 d21); (C,H,M) pyrosequencing datafor gamma- and beta-proteobacterial AOB (expressed as percentage of total 16S rRNA reads for a given sample); (D,I,N) ammoniumand nitrite concentrations (nmol L21); and (E, J, O) dissolved oxygen concentrations (mmol kg21). The gray line denotes the depth of 1%SPAR. All data are plotted to 200-m depth, with the exception of Sta. 1 data, which are plotted to 400-m depth. Note that AOA and AOBQPCR data are plotted on separate axes in panels A, F, and K and that some rate data and nitrite data plot off scale at Sta. 2a and 3 (seemain text).
Pacific Ocean ammonia oxidation 717
718 Beman et al.
the ETSP, and 1000 nmol L21 d21, measured by Molina andFarias (2009), also in the ETSP. Our highest measured ratewas also 14–28 times greater than those measured just 5 mabove and below, at 40- and 50-m depth at Sta. 2a (Fig. 3G).This finding highlights the need for high-resolution mea-surements of nitrification rates in the water column, aspronounced peaks in 15NH z
4 oxidation rates also occurredat Sta. 1 and, to a lesser degree, at Sta. 3–5. Rates at Sta. 1ranged from 0 to 188 nmol L21 d21, for example, withmaximum rates of 154–188 nmol L21 d21 at 35–40 m thatexceeded rates at 30 m (2 nmol L21 d21) and 45 m(68.1 nmol L21 d21). Coarse resolution measurements thatmiss these discrete peaks would obviously underestimateammonia oxidation rates.
Ammonia oxidizer abundances and distributions—AOAand AOB abundances were quantified in tandem with15NH z
4 oxidation rate measurements, and QPCR mea-surements of 16S rRNA genes from marine Thaumarch-aeota and archaeal ammonia mono-oxygenase subunit A(amoA) genes were strongly correlated with each otherthroughout the GOC and ETNP (r2 5 0.95, p , 0.001).These data indicate that all Thaumarchaeota present in theGOC and ETNP, including those present under low-oxygen conditions, carry the amoA gene and therefore maybe able to oxidize ammonia. These results contradict thoseproduced using different amoA primer sets and that insteadshow a decrease in the ratio of amoA-containing Thau-marchaeota with depth (Agogue et al. 2008); however, theprimers used in other studies likely miss some ‘‘deep’’ AOAecotypes that have been detected in numerous other studies(see discussion in Konstantinidis et al. 2009; Santoro et al.2010) and that all report strong correspondence betweenthaumarchaeal 16S rRNA and amoA genes (Church et al.2010; Beman et al. 2010; Santoro et al. 2010).
AOA outnumbered betaproteobacterial AOB (bAOB) atevery depth at every station by 5.5–15,300-fold. bAOB werequantified using a QPCR protocol specific for the bacterialamoA gene but were undetectable in most samples(Figs. 3A,F,K, 4A,F,K, 5A). However, we observed ageneral increase in bAOB abundance with increasinglatitude: bAOB were not detected at Sta. 4, were presentat low abundance at 120 m at Sta. 3 (16 amoA genes mL21;Fig. 3K), were slightly more abundant at Sta. 2a (0–22amoA genes mL21; Fig. 3F), and increased in abundancefrom 0 to 126 amoA genes mL21 at Sta. 1 and 5(Figs. 3A,F), from 0 to 154 amoA genes mL21 at Sta. 6
(Fig. 4K), and from 179 to 518 amoA genes mL21 at Sta. 7(Fig. 5E). bAOB were also present over an expanded rangeof depths at more northerly stations, from 60 to 100 m atSta. 5, for example, and from 65 to 150 m at Sta. 6. At Sta.6, AOA and AOB amoA genes were positively correlated(r2 5 0.71, p , 0.01).
These findings were corroborated by pyrosequencing ofbacterial 16S rRNA genes from all samples from Sta. 1–6.Out of 420,240 total sequences, only 33 were from bAOB,and only six gammaproteobacterial AOB (cAOB) se-quences were detected (Table 3). AOB constituted just 0–0.1959% of reads in each library. The percentage of bAOBwas correlated with amoA abundance measured usingQPCR (Pearson’s r2 5 0.59, p , 0.001), and because thepyrosequencing libraries reflect the relative proportion of agiven group within the bacterial assemblage (bacteria-specific 16S rRNA primers were used) while QPCR datameasure abundances per unit volume, the correlationbetween QPCR and pyrosequencing data was stronger forthe Spearman correlation (Spearman’s r2 5 0.95, p ,0.001). There were several instances where bAOB weredetected at low levels using QPCR but were not present inpyrosequencing libraries; however, the opposite did notoccur—AOB were always detectable via QPCR whenpresent in the pyrosequencing libraries.
Pyrosequencing also allowed us to resolve individualclades of bAOB—Nitrosomonas and Nitrosospira sp.—andcAOB, such as Nitrosococcus oceanii; cAOB were rarelydetected via pyrosequencing in the GOC and ETNP andwere recovered only in libraries from 550 to 800 m at Sta. 1,300 m at Sta. 2a, 160 m at Sta. 4, 200 m at Sta. 5, and 65 mat Sta. 6 (Table 3). This is consistent with low cAOBabundances reported in previous studies (Lam et al. 2007;Molina et al. 2007; Beman et al. 2008). The bAOB groupNitrosomonas was detected only at 80 and 100 m at Sta. 2a,whereas Nitrosospira sp. were detected at multiple depths atSta. 1 and 2a and 5 and 6. The distribution of bAOB andcAOB 16S rRNA genes was also consistent within thewater column, as Nitrosospira were typically present tens ofmeters below the PNM and just below the depth of 1%surface photosynthetically active radiation (SPAR; mea-sured by CTD), while the cAOB Nitrosococcus weregenerally present at greater depths. The absolute abun-dance, the proportion of the bacterial community (based onpyrosequencing), and the depth range of AOB increasedwith latitude (Figs. 3A,C,F,H,K,M, 4A,C,F,H,K,M,5A,E).
r
Fig. 4. Data for (A–E) Sta. 4, (F–J) Sta. 5, and (K–O) Sta. 6 in the ETNP and GOC. (A,F,K) QPCR data for Thaumarchaeota,AOA, and AOB (16S rRNA or amoA genes per mL); (B,G,L) 15NH z
4 oxidation rates (in nmol L21 d21); (C,H,M) pyrosequencing datafor gamma- and beta-proteobacterial AOB expressed as percentage of total 16S rRNA reads for a given sample; (D,I,N) ammonium andnitrite concentrations (nmol L21); and (E,J,O) dissolved oxygen concentrations (mmol kg21). The gray line denotes the depth of 1%SPAR, and all data are plotted to 200-m depth. Note that AOA and AOB QPCR data are plotted on separate axes in panels A, F, and Kand that 15NH z
4 oxidation rates are plotted on axes with different ranges compared to those in Fig. 3 (100 vs. 200 nmol L21 d21); rangesare identical for all other variables. Dashed lines connecting data points denote presence of DNA samples with QPCR inhibition that aresubsequently excluded from statistical analyses.
Pacific Ocean ammonia oxidation 719
Discussion
AOA, AOB, and 15NH z4 oxidation rates—15NH z
4 oxi-dation rate profiles in the GOC and ETNP werecharacterized generally by low rates near the surface, peakrates near the PNM and NH z
4 maximum at the base of theeuphotic zone, and sharp decreases with depth that aretypical of nitrification rates (Ward and Zafiriou 1988;Lipschultz et al. 1990; Ward 2008). Rate peaks werefrequently offset from the PNM and ammonium maximum
by several meters, however these maxima are generated viadecoupling between NO {
2 and NH z4 supply and demand,
and ammonia oxidation is one of several processes thatproduce and consume these compounds. NH z
4 is generatedby remineralization of sinking organic material and isassimilated by phytoplankton or oxidized; NO {
2 isproduced by ammonia oxidation or through secretion byphytoplankton, and is then assimilated or oxidized.Formation of the PNM appears to be driven primarily byphytoplankton (reviewed by Lomas and Lipschultz 2006),
Fig. 5. Data for (E–H) Sta. 7 and the second sampling of (A–D) Sta. 2 in the ETNP and GOC. (A,E) QPCR data forThaumarchaeota, AOA, and AOB (16S rRNA or amoA genes per mL); (B,F) 15NH z
4 oxidation rates (in nmol L21 d21); (C,G)ammonium and nitrite concentrations (nmol L21); and (D,H) dissolved oxygen concentrations (mmol kg21). Because of the limited QPCRdata collected at Sta. 7, QPCR data are plotted as discrete data points rather than as a continuous depth profile. The gray line denotes thedepth of 1% SPAR, and all data are plotted to 200-m depth. Note that AOA and AOB QPCR data are plotted on separate axes in panelsA and E and that QPCR data and 15NH z
4 oxidation rates from Sta. 7 are plotted on axes with different ranges compared to the otherfigures; ranges are identical for all other variables.
720 Beman et al.
and our data are consistent with this, as the 15NH z4
oxidation rate maximum fell below the PNM at Sta. 2a, 2b,4, 6, and 7, and rates were low within the PNM at thesestations (Figs. 3–5). The rate maximum was 5 m above thePNM at Sta. 3, which likely reflects some combination oflight limitation of phytoplankton, AOA/AOB, and NO {
2oxidation. The rate peak and PNM were located at thesame depth at Sta. 1 and 5, and it is possible that ammoniaoxidation contributes to the formation of the PNM at thesestations. 15NH z
4 oxidation rates peaked within theammonium maximum at Sta. 1, 3, and 5, suggesting thatammonia oxidizers quickly respond to regeneration ofNH z
4 at these stations. The rate maximum fell below theammonium maximum at Sta. 2a, 4, and 7, but it is possiblethat ammonia oxidation in fact depletes NH z
4 throughrapid oxidation at these depths. Sta. 6 and 2b are goodexamples of this, as little NH z
4 was present within thewater column, and ammonia oxidation was active over abroad depth range (Figs. 4L,N, 5B,C).
Depth profiles of AOA based on amoA and 16S rRNAgenes displayed a general pattern similar to 15NH z
4oxidation rates: amoA and 16S rRNA genes were absentor present only at low levels in the euphotic zone, reached asubsurface peak near the PNM, and then decreased withdepth (Figs. 3A,F,K, 4A,F,K, 5A,E). This is consistentwith AOA profiles collected off the coast of California(Santoro et al. 2010), in the equatorial Pacific Ocean(Church et al. 2010), and in the Black Sea (Lam et al. 2007).At some stations in the GOC and ETNP, rate and AOAprofiles were similar, and ammonia oxidation rates andarchaeal amoA genes were correlated with one another. The
strongest correlation was observed at Sta. 6 (r2 5 0.88, p ,0.001, for linear relationship; log r2 5 0.83, p , 0.002, forlogarithm of amoA genes), whereas rates and amoA geneswere more weakly related at Sta. 1 (linear r2 5 0.43, p 50.15; r2 5 0.38, p . 0.05, for log[amoA]), Sta. 3 (linear r2 50.24, p . 0.05; r2 5 0.39, p 5 0.07, for log[amoA]), and Sta.7 (linear r2 5 0.57, p . 0.05; r2 5 0.84, p 5 0.08, forlog[amoA]). At Sta. 4, rates and amoA were correlated inthe upper 100 m of the water column (linear r2 5 0.34, p .0.05; r2 5 0.89, p 5 0.06, for log[amoA]). However, asubsurface peak in amoA genes, which occurred without aconcurrent subsurface peak in rates, reduced the strength ofthe relationship throughout the water column (linear r2 50.043, p . 0.05; r2 5 0.001, p . 0.05, for log[amoA]).
Sta. 2a and 5 exhibited sharp peaks in oxidation rateswithin the euphotic zone, but AOA were most abundant35–50 m below these rate peaks (Figs. 3F,G, 4F,G). Acrossour data set, rates were maximal, and AOA were mostabundant (based on both 16S rRNA and amoA) at Sta. 2a,yet these peak values were separated by 35 m in the watercolumn. Church et al. (2010) found high rates of amoAexpression in the euphotic zone of the tropical andsubtropical Pacific, including both high absolute levels oftranscripts and elevated transcript abundances relative togene copies. Although this may represent increasedturnover of ammonia mono-oxygenase proteins due todamage (Church et al. 2010), our data—based onmeasurement of oxidation rates relative to gene abun-dances—also indicate relatively high per cell activity.Interestingly, identical measurements repeated at Sta. 28 d later produced different AOA and rate profiles (e.g.,
Fig. 6. Specific nitrification rates in the GOC and ETNP. Data from different stations areshown in shades of gray and with different symbols. Dashed lines denote 1% SPAR at Sta. 7(50 m) and Sta. 3 (66 m); the depths of 1% SPAR at other stations fall between these values.
Pacific Ocean ammonia oxidation 721
maximum of 123 nmol L21 d21 at 80 m) as well as strongercorrespondence between rates and amoA (r2 5 0.46;Fig. 5A,B), suggesting that AOA respond rapidly tochanging oceanographic conditions.
AOA have exceptional affinity for NH3 and swiftlyrespond to pulses of N in pure culture (Martens-Habbenaet al. 2009); we suggest that at Sta. 2 and 5 and in parts ofthe subtropical and tropical Pacific (Church et al. 2010),AOA rapidly metabolize newly available N, leading to highper cell oxidation rates and transcript abundances. Overtime, increased NH z
4 supply leads to elevated oxidationrates and allows AOA populations to expand andeventually approach steady state. This leads to thecorrespondence between rates and amoA observed at Sta.1, 3, 6, and 7 and in the upper 100 m at Sta. 4. In support ofthis idea, per cell rates calculated from the slope of theregressions of 15NH z
4 oxidation rates on thaumarchaeal
16S rRNA genes (assuming one copy of the 16S rRNAgene and excluding Sta. 2a and 5) yield values of 0.2–9.6fmol cell21 d21. These values closely match those reportedby Konneke et al. (2005) for N. maritimus (1.8–15.4 fmolcell21 d21). If this concept is correct, a testable hypothesiswould be that AOA and oxidation rates are correlated instratified or biogeochemically stable marine systems;calculated per cell rates would be more variable inphysically disturbed systems or in areas where there is aninflux of N due to lack of equilibration between populationsize and activity.
Oxygen, light, and 15NH z4 oxidation rates—Because N is
regenerated while oxygen is depleted via microbial respira-tion of sinking organic material, ammonia oxidation ratesare expected to closely parallel consumption of DO (Ward2008). Nitrification may in fact directly contribute to
Table 2. Integrated ammonia oxidation rates and the proportion occurring within the euphotic zone compared with integratedcarbon fixation rate. Integrated ammonia oxidation rates were calculated over the top 300 m of the water column, and the proportionoccurring above 1% surface photosynthetically active radiation (SPAR) is expressed as a percentage of the total. Integrated carbonfixation rates are also shown. The proportion of N demand that is directly provided by nitrification in the euphotic zone is calculated onthe basis of integrated carbon fixation rates and Redfield stoichiometry and expressed as percentage.
Sta.Depth of 1%
SPAR (m)
Integratedammonia oxidation
(mmol m22 d21)
% of integratedammonia oxidation
above 1% SPAR
Integratedcarbon fixation
(mmol m22 d21)
N provided bynitrification in
euphotic zone (%)
1 56 7.7 33 67 252 55 4.6 42 34 373 66 2.3 1.6 31 0.774 56 1.4 19 27 6.45 57 3.0 29 47 126 60 4.9 1.5 30 1.6
Table 3. Presence of 16S rRNA sequences from AOB in pyrosequencing data. For stations and sampling depths where AOB weredetected, the total number of 16S rRNA sequences recovered is shown, as are total numbers of 16S rRNA sequences for the different ofbAOB and cAOB genera Nitrosospira, Nitrosomonas, and Nitrosococcus. The sum of these is also expressed as a percentage of the totalsequences for each sample. Note that no AOB were detected via pyrosequencing at Sta. 3 and 4.
Sta. Depth (m)Total bacterial 16SrRNA sequences
Nitrosospira bAOB 16SrRNA sequences
Nitrosomonas bAOB16S rRNA sequences
Nitrosococcus cAOB16S rRNA sequences
AOB (% of 16SrRNA sequences)
1 60 6749 2 0 0 0.02961 400 9285 2 0 0 0.02151 550 12,924 1 0 1 0.01551 700 6517 0 0 1 0.01531 750 8530 0 0 1 0.01171 800 8300 0 0 1 0.01202 80 5982 0 1 0 0.01672 100 6860 3 1 0 0.05832 250 5302 1 0 0 0.01895 60 6274 2 0 0 0.03185 70 3702 2 0 0 0.05405 80 8406 4 0 0 0.04765 100 7093 1 0 0 0.01415 200 12,627 0 0 1 0.00796 65 7193 2 0 1 0.04176 80 4084 8 0 0 0.19596 100 1400 2 0 0 0.14296 150 2192 1 0 0 0.0456
Total 432,240 31 2 6 0.0090
722 Beman et al.
consumption of DO (Ward 2008), and assuming that DOconcentrations and consumption are, to a first approxima-tion, related to one another, we expect 15NH z
4 oxidationrates to correlate with DO concentrations. Excludingshallow samples that had high oxygen concentrations butlow rates (probably due to partial light limitation; seebelow), 15NH z
4 oxidation rates were positively correlatedwith oxygen concentrations at Sta. 1–5 (r2 5 0.51–0.98, allANOVA p , 0.05). The slopes of these relationshipsdiffered from station to station, but this results from thefact that DO integrates consumption over long periods oftime, whereas rate measurements capture the short-termresponse of microbial communities to N supply. Sta. 6 and7 were characterized by broad 15NH z
4 oxidation rateprofiles where maximum rates were spread over tens ofmeters in the water column and were not correlated withDO. These maximum rates were also lower than thosemeasured at other stations (Figs. 4L, 5F). The decay ofammonia oxidation with depth in the ocean demonstratesthat it does not occur primarily on large, rapidly sinkingparticles (Ward 2008); hence, one possible explanation forthe patterns observed at Sta. 6 and 7 is particle-basednitrification (Karl et al. 1984). While we did not specificallyexamine this, it is interesting in light of the increasedabundance of AOB and the correlations between AOA,AOB, and rates observed at these stations (Figs. 3, 4). Hereour data may capture a mix of particle-based andplanktonic ammonia oxidation that is conducted by somecombination of both AOA and AOB.
At both Sta. 2a and Sta. 3, a secondary rate peakoccurred at 100 m on the edge of suboxic waters(Fig. 3G,L), and we frequently detected 15NH z
4 oxidationdown to DO concentrations of 4.1–8.5 mmol kg21 in theGOC and ETNP. Rates were relatively low at these depths(due to low NH z
4 flux), but suboxic nitrification has beenobserved before in both the ETNP (Ward and Zafiriou1988) and the ETSP (Lipschultz et al. 1990). Exposure toatmospheric oxygen during sampling and processing wasraised as a possible issue in previous studies (Ward andZafiriou 1988) and could be a factor here, but Lipschultz etal. (1990) observed extremely high rates of 15NH z
4oxidation under low DO in the ETSP, and Ward andZafiriou’s (1998) results from the ETNP are similar to ourown, as they observed positive correlation between DO and15NH z
4 oxidation rates (other than for euphotic zonesamples). Shipboard measurements using sealed Wheatonvials did not differ significantly from parallel array-basedmeasurements (ANOVA p . 0.05), indicating that oxygencontamination did not alter our measurements.
Substantial rates of ammonia oxidation were alsomeasured within the euphotic zone in the GOC and ETNP.While our sampling approach specifically excluded eupho-tic zone samples at Sta. 3 and 6, our measurements wereconducted under in situ light and temperature and wereconducted above the level of 1% SPAR at Sta. 1, 2a, 4, and5 (level of 1% SPAR indicated by gray line in Figs. 3,4). Atthese four stations, 15NH z
4 oxidation was readily detectedwithin the euphotic zone. Sta. 1, 2a, 4, and 5 also displayeddetectable NH z
4 above 1% SPAR, indicating that NH z4 is
available for oxidation within the euphotic zone. It is not
possible to use our data set to separate the effects of lightand NH z
4 supply on ammonia oxidation, but future workshould address the interplay between light limitation andthe availability of NH z
4 . We used our data to calculateintegrated rates of ammonia oxidation over the top 300 mof the water column and found variation among stations of1.38–7.72 mmol m22 d21 (Table 2)—values that are nearlyidentical to integrated rates of 1.13–2.76 mmol m22 d21
previously measured in the ETNP (Ward and Zafiriou1988). Up to 42% of ammonia oxidation occurred withinthe euphotic zone (Sta. 2a), but this proportion was as littleas 1.5–1.6% (based on limited measurements at Sta. 6 and3) and was 19–33% at Sta. 1, 4, and 5 (Table 2). Integratedeuphotic zone ammonia oxidation rates were also com-pared to integrated C uptake rates measured using 13C-labeled bicarbonate. Based on Redfield C : N stoichiometryof , 6.625, 0.8–37% of the N assimilated by phytoplanktonmay have been previously oxidized in the euphotic zone(Table 2). This is consistent with Santoro et al. (2010) inapproach, and the proportion of N supplied by euphoticzone nitrification is similar (0.8–37% here vs. 25–36% in theCalifornia current), but our wider range of estimates resultsfrom in situ rate measurements that capture substantialvariation in the depth distribution and magnitude ofammonia oxidation.
Following Yool et al. (2007), we calculated specificnitrification rates by dividing measured oxidation rates (inunits of nmol L21 d21) by NH z
4 concentrations (in nmolL21), yielding units of d21 (where NH z
4 was undetectable,specific nitrification rates obviously could not be calculat-ed). The highest specific rates measured in this study wereup to 242-fold greater than the median value (0.2 d21) usedby Yool et al. (2007), and 31 of 34 rate measurements weregreater than 0.2 d21 (Fig. 6). The lowest measured valuewas 0.08 d21. We found consistent variation in specificnitrification rates with depth: rates in the GOC and ETNPwere generally low above 50 m but showed a sharp increaseat 50 m at several stations and were elevated down to, 100-m depth. Although estimates of N produced byeuphotic zone nitrification as a proportion of phytoplank-ton N demand converge on , 25–30% (Wankel et al. 2007;Yool et al. 2007; Santoro et al. 2010; Table 2), our resultsindicate that ammonia oxidation does not occur at uniformrates in the euphotic zone, as we consistently measured highrates at the bottom of euphotic zone. This variation couldbe an important factor in global estimates of nitrificationand hence new production. A key point is that smallchanges in the depth of maximum nitrification relative tothe depth of the euphotic zone can strongly affect theproportion of nitrification taking place within vs. below theeuphotic zone (Table 2; Fig. 6). This may be importantwhen considering the effects of warming-induced stratifi-cation, which may affect euphotic zone depth (Gruber2011), and ocean acidification, which may displacenitrification downward (Beman et al. 2011), on the N cycle.
Methodological explanations for the discrete ratemaxima that we observed include fluorometric measure-ments of NH z
4 made at nmol L21 concentrations, whichincrease measurement accuracy; rate measurements madeat 5–20-m resolution with depth, increasing the chances of
Pacific Ocean ammonia oxidation 723
capturing peaks in specific nitrification rates; and differ-ences in sampling and experimental approaches thatproduce widely varying specific nitrification rates (e.g.,see fig. 1b in Yool et al. 2007). However, many of thehighest recorded ammonia oxidation rates have beenmeasured in OMZ regions (although not within suboxicwaters), including the ETSP (Ward et al. 1989a; Lipschultzet al. 1990; Lam et al. 2009), Benguela upwelling (Rees etal. 2006), and our measurements in the GOC and ETNP.Sutka et al. (2004) also measured an increase in nitrificationrates as they transited from Sta. ALOHA in the NorthPacific Subtropical Gyre into the ETNP but did not havesufficient depth resolution to identify rate peaks within thewater column. While high ammonia oxidation rates havebeen observed at Sta. ALOHA (Dore and Karl 1996) andoff the coast of California (Santoro et al. 2010), our resultsand those from earlier studies indicate that ammoniaoxidation can be compressed into a relative thin layer inOMZs, where it occurs rapidly. This layer is found at thebase of the euphotic zone, where sinking organic material isremineralized and NH z
4 is regenerated, and is typicallylocated within or just below the NH z
4 maximum andwithin or just above the oxycline (Figs. 3–5). We hypoth-esize that these discrete rate maxima reflect increasedammonia supply in productive OMZ regions and the highammonia affinity found among the AOA (Martens-Habbena et al. 2009), which together lead to rapidammonia oxidation mediated by AOA.
Microbial oceanography of ammonia oxidation—Theseresults are consistent with other researchers’ work indicat-ing that the AOA are important mediators of nitrificationin the Black Sea (Lam et al. 2007), California Current(Santoro et al. 2010), and ETSP (Lam et al. 2009; Molina etal. 2010; Stewart et al. 2012) as well as our previous studyof the GOC (Beman et al. 2008). In the metatranscriptomicanalysis of Stewart et al. (2012), AOA dominated thetranscriptome of the ETSP and represented one in fiveprotein-coding transcripts at 85 m. Stewart et al. (2012)recovered few AOB transcripts, indicating that AOA werethe dominant ammonia oxidizers in the ETSP. AOB wereoften undetectable by QPCR and pyrosequencing in theGOC and ETNP, including depths and stations whereammonia oxidation rates were substantial and AOA werepresent. For example, rapid 15NH z
4 oxidation wasmeasured in the euphotic zone, but no AOB were detectedin thousands to tens of thousands of sequences. Combinedwith correspondence between 15NH z
4 oxidation rates andMGI 16S rRNA and archaeal amoA genes, our resultsindicate that AOA actively oxidize ammonia in the ETNP.
However, our data also place constraints on theprospective niches of AOB within the ocean. They areconsistent with light sensitivity in AOB (Lomas andLipschultz 2006 and references therein), as AOB were notdetected by either QPCR or pyrosequencing in the euphoticzone of the GOC and ETNP. At the greater depths wherethey were detected, AOB were located below AOA, and thefew detectable cAOB were located below bAOB, leading toa ‘‘stratigraphy’’ of ammonia oxidizers in the watercolumn. AOB sometimes exhibited a subsurface increase
in abundance, including a clear increase at 80–100 m at Sta.2a in association with a secondary peak in oxidation ratesat the edge of the OMZ. In line with these findings, Lam etal. (2007) found that archaeal amoA transcripts werecorrelated with modeled ammonia oxidation rates in theBlack Sea, but bAOB amoA was expressed at greaterdepths in the suboxic zone. In our data, AOB abundanceswere also correlated with oxidation rates at Sta. 6 (r2 50.77, p , 0.005) and were more abundant at northernstations. Whether this reflects a large-scale pattern ofincreasing AOB abundance with increasing latitude willrequire additional measurements, but Church et al. (2010)observed a mirror-image pattern for AOA in the equatorialPacific (specifically an increase in AOA abundance near theequator) suggestive of large-scale gradients in AOA andAOB throughout the Pacific Ocean.
Assembled together, our data capture rapid ammoniaoxidation in the Gulf of California and ETNP that isvariable with depth and among stations. Thaumarchaeota16S rRNA genes and amoA genes were correlated with eachother and with oxidation rates, whereas AOB werecommonly undetectable by QPCR and among thousandsof 16S rRNA sequences, supporting the idea that archaealnitrification plays an important role in oceanic N cycling. Itis also clear that AOA oxidize ammonia within the euphoticzone throughout the Pacific Ocean (Figs. 3, 4; Church et al.2010; Santoro et al. 2010) and that oxidized N can beproduced at substantial levels compared to phytoplankton Ndemand (Table 2; Dore and Karl 1996; Yool et al. 2007;Santoro et al. 2010). AOA may directly compete withphytoplankton for N throughout the upper ocean, whileammonia and nitrite oxidation supply oxidized N toanaerobic processes in OMZs; this coupling and competitionamong multiple processes and microbial groups yields acomplicated N cycle that is still understudied (Lam et al.2009; Ward et al. 2009; Canfield et al. 2010b) but must beunderstood in an ocean undergoing rapid change (Hutchinset al. 2009; Beman et al. 2011; Gruber 2011).
AcknowledgmentsWe are indebted to Rachel Foster for supplying critical nucleic
acid samples, Angel White for calculating integrated carbon up-take rates, and Matt Meyerhof for compiling nitrification ratedata from the literature. We thank Fred Prahl (chief scientist),Jackie Mueller, Natalie Walsgrove, Jason Smith, Julie Fliegler,and the officers and crew of the R/V New Horizon for assistance inthe field; we also thank Chris Francis for fruitful conversationsand thank Jackie Mueller, Natalie Walsgrove, C. J. Bradley, andElizabeth Gier for assistance with laboratory analyses. This workwas supported by National Science Foundation Oceanography(OCE) awards 08-24997 and 10-34943 to J.M.B. and B.N.P. Thisis School of Ocean and Earth Science and Technology Contribu-tion number 8549.
References
AGOGUE, H., M. BRINK, J. DINASQUET, AND G. J. HERNDL. 2008.Major gradients in putatively nitrifying and non-nitrifyingArchaea in the deep North Atlantic. Nature 456: 788–791,doi:10.1038/nature07535
BEMAN, J. M., K. R. ARRIGO, AND P. A. MATSON. 2005.Agricultural runoff fuels large phytoplankton blooms in
724 Beman et al.
vulnerable areas of the ocean. Nature 434: 211–214,doi:10.1038/nature03370
———, B. N. POPP, AND C. A. FRANCIS. 2008. Molecular andbiogeochemical evidence for ammonia oxidation by marineCrenarchaeota in the Gulf of California. ISME J. 2: 429–441,doi:10.1038/ismej.2007.118
———, R. SACHDEVA, AND J. A. FUHRMAN. 2010. Populationecology of nitrifying Archaea and Bacteria in the SouthernCalifornia Bight. Environ. Microbiol. 12: 1282–1292,doi:10.1111/j.1462-2920.2010.02172.x
———, AND OTHERS. 2011. Global declines in oceanic nitrificationrates as a consequence of ocean acidification. Proc. Natl.Acad. Sci. USA 108: 208–213, doi:10.1073/pnas.1011053108
BROCHIER-ARMANET, C., B. BOUSSAU, S. GRIBALDO, AND P.FORTERRE. 2008. Mesophilic crenarchaeota: Proposal for athird archaeal phylum, the Thaumarchaeota. Nat. Rev.Microbiol. 6: 245–252, doi:10.1038/nrmicro1852
BROWN, M. V., AND OTHERS. 2009. Microbial community structurein the North Pacific Ocean. ISME J. 3: 1374–1386,doi:10.1038/ismej.2009.86
CANFIELD, D. E., A. N. GLAZER, AND P. G. FALKOWSKI. 2010a. Theevolution and future of Earth’s nitrogen cycle. Science 330:192–196, doi:10.1126/science.1186120
———, AND OTHERS. 2010b. A cryptic sulfur cycle in oxygen-minimum–zone waters off the Chilean coast. Science 330:1375–1378, doi:10.1126/science.1196889
CHURCH, M. J., B. WAI, D. M. KARL, AND E. F. DELONG. 2010.Abundances of crenarchaeal amoA genes and transcripts inthe Pacific Ocean. Environ. Microbiol. 12: 679–688,doi:10.1111/j.1462-2920.2009.02108.x
DORE, J. E., AND D. M. KARL. 1996. Nitrification in the euphoticzone as a source of nitrite, nitrate and nitrous oxide at StationALOHA. Limnol. Oceanogr. 41: 1619–1628, doi:10.4319/lo.1996.41.8.1619
———, B. N. POPP, D. M. KARL, AND F. J. SANSONE. 1998. A largesource of atmospheric nitrous oxide from subtropical NorthPacific surface waters. Nature 396: 63–66, doi:10.1038/23921
ENGELBREKTSON, A., V. KUNIN, K. C. WRIGHTON, N. ZVENIGOR-
ODSKY, F. CHEN, H. OCHMAN, AND P. HUGENHOLTZ. 2010.Experimental factors affecting PCR-based estimates ofmicrobial species richness and evenness. ISME J 4: 642–647,doi:10.1038/ismej.2009.153
EPPLEY, R. W., AND B. J. PETERSON. 1979. Particulate organicmatter flux and planktonic new production in the deep ocean.Nature 282: 677, doi:10.1038/282677a0
FRANCIS, C. A., J. M. BEMAN, AND M. M. M. KUYPERS. 2007. Newprocesses and players in the nitrogen cycle: The microbialecology of anaerobic and archaeal ammonia oxidation. ISMEJ. 1: 19–27, doi:10.1038/ismej.2007.8
———, K. J. ROBERTS, J. M. BEMAN, A. E. SANTORO, AND B. B.OAKLEY. 2005. Ubiquity and diversity of ammonia-oxidizingarchaea in water columns and sediments of the ocean. Proc. Natl.Acad. Sci. USA 102: 14683–14688, doi:10.1073/pnas.0506625102
GALAND, P. E., E. O. CASAMAYOR, D. L. KIRCHMAN, AND C.LOVEJOY. 2009. Ecology of the rare microbial biosphere of theArctic Ocean. Proc. Natl. Acad. Sci. USA 106: 22427–22432,doi:10.1073/pnas.0908284106
GRUBER, N. 2011. Warming up, turning sour, losing breath: Oceanbiogeochemistry under global change. Phil. Trans. R. Soc. A369: 1980–1996, doi:10.1098/rsta.2011.0003
HAMADY, M., J. J. WALKER, J. K. HARRIS, N. J. GOLD, AND R.KNIGHT. 2008. Error-correcting barcoded primers for pyrose-quencing hundreds of samples in multiplex. Nat. Methods 5:235–237, doi:10.1038/nmeth.1184
HOLMES, R. M., A. AMINOT, R. KEROUEL, B. A. HOOKER, AND B. J.PETERSON. 1999. A simple and precise method for measuring
ammonium in marine and freshwater ecosystems. Can. J.Fish. Aquat. Sci. 56: 1801–1808.
HUSE, S., J. HUBER, H. MORRISON, M. SOGIN, AND D. WELCH. 2007.Accuracy and quality of massively parallel DNA pyrosequenc-ing. Genome Biol. 8: R143, doi:10.1186/gb-2007-8-7-r143
HUTCHINS, D. A., M. R. MULHOLLAND, AND F. FU. 2009. Nutrientcycles and marine microbes in a CO2-enriched ocean.Oceanography 22: 128–145, doi:10.5670/oceanog.2009.103
KANDA, J., E. A. LAWS, T. SAINO, AND A. HATTORI. 1987. Anevaluation of isotope dilution effect from conventional datasets of 15N uptake experiments. J. Plankton Res. 9: 79–90,doi:10.1093/plankt/9.1.79
KARL, D. M., G. A. KNAUER, J. H. MARTIN, AND B. B. WARD.1984. Bacterial chemolithotrophy in the ocean is associated withsinking particles. Nature 309: 54–56, doi:10.1038/309054a0
KARNER, M. B., E. F. DELONG, AND D. M. KARL. 2001. Archaealdominance in the mesopelagic zone of the Pacific Ocean.Nature 409: 507–510, doi:10.1038/35054051
KEELING, R. F., A. KORTZINGER, AND N. GRUBER. 2010. Oceandeoxygenation in a warming world. Annu. Rev. Mar. Sci. 2:199–229, doi:10.1146/annurev.marine.010908.163855
KONNEKE, M., A. E. BERNHARD, J. R. DE LA TORRE, C. B. WALKER,J. B. WATERBURY, AND D. A. STAHL. 2005. Isolation of anautotrophic ammonia-oxidizing marine archaeon. Nature437: 543–546, doi:10.1038/nature03911
KONSTANTINIDIS, K. T., J. BRAFF, D. M. KARL, AND E. F. DELONG.2009. Comparative metagenomic analysis of a microbialcommunity residing at a depth of 4,000 meters at StationALOHA in the North Pacific Subtropical Gyre. Appl. Environ.Microbiol. 75: 5345–5355, doi:10.1128/AEM.00473-09
KUNIN, V., A. ENGELBREKTSON, H. OCHMAN, AND P. HUGENHOLTZ.2010. Wrinkles in the rare biosphere: Pyrosequencing errorscan lead to artificial inflation of diversity estimates. Environ.Microbiol. 12: 118–123, doi:10.1111/j.1462-2920.2009.02051.x
LAM, P., AND OTHERS. 2007. Linking crenarchaeal and bacterialnitrification to anammox in the Black Sea. Proc. Natl. Acad.Sci. USA 104: 7104–7109, doi:10.1073/pnas.0611081104
———, AND ———. 2009. Revising the nitrogen cycle in thePeruvian oxygen minimum zone. Proc. Natl. Acad. Sci. USA106: 4752–4757, doi:10.1073/pnas.0812444106
LIPSCHULTZ, F., S. C. WOFSY, B. B. WARD, L. A. CODISPOTI, G. E.FRIEDERICH, AND J. W. ELKINS. 1990. Bacterial transforma-tions of inorganic nitrogen in the oxygen-deficient waters ofthe eastern tropical South Pacific Ocean. Deep-Sea Res. A 37:1513–1541, doi:10.1016/0198-0149(90)90060-9
LOMAS, M. W., AND F. LIPSCHULTZ. 2006. Forming the primarynitrite maximum: nitrifiers or phytoplankton? Limnol.Oceanogr. 51: 2453–2467, doi:10.4319/lo.2006.51.5.2453
MARTENS-HABBENA, W., P. M. BERUBE, H. URAKAWA, J. R. DE LA
TORRE, AND D. A. STAHL. 2009. Ammonia oxidation kineticsdetermine niche separation of nitrifying Archaea and Bacte-ria. Nature 461: 976–979, doi:10.1038/nature08465
MILLS, M. M., C. RIDAME, M. DAVEY, J. LA ROCHE, AND R. J.GELDER. 2004. Iron and phosphorus co-limit nitrogen fixationin the eastern tropical North Atlantic. Nature 429: 292–294,doi:10.1038/nature02550
MINCER, T. J., M. J. CHURCH, L. T. TAYLOR, C. M. PRESTON, D.M. KARL, AND E. F. DELONG. 2007. Quantitative distributionof presumptive archaeal and bacterial nitrifiers in MontereyBay and the North Pacific Subtropical Gyre. Environ.Microbiol. 9: 1162–1175, doi:10.1111/j.1462-2920.2007.01239.x
MOLINA, V., L. BELMAR, AND O. ULLOA. 2010. High diversity ofammonia-oxidizing archaea in permanent and seasonal oxygen-deficient waters of the eastern South Pacific. Environ. Microbiol.12: 2450–2465, doi:10.1111/j.1462-2920.2010.02218.x
Pacific Ocean ammonia oxidation 725
———, AND L. FARIAS. 2009. Aerobic ammonium oxidation in theoxycline and oxygen minimum zone of the eastern tropicalSouth Pacific off northern Chile (,20uS). Deep-Sea Res. II56: 1032–1041, doi:10.1016/j.dsr2.2008.09.006
———, O. ULLOA, L. FARIAS, H. URRUTIA, S. RAMIREZ, P. JUNIER,AND K. WITZEL. 2007. Ammonia-oxidizing betaproteobacteriafrom the oxygen minimum zone off northern Chile. Appl.Environ. Microbiol. 73: 3547–3555, doi:10.1128/AEM.02275-06
POPP, B. N., F. J. SANSONE, T. M. RUST, AND D. A. MERRITT. 1995.Determination of concentration and carbon isotopic compo-sition of dissolved methane in sediments and nearshorewaters. Anal. Chem. 67: 405–411, doi:10.1021/ac00098a028
PRAHL, F. G., B. N. POPP, D. M. KARL, AND M. A. SPARROW. 2005.Ecology and biogeochemistry of alkenone production atsubtropical North Pacific Station ALOHA. Deep-Sea Res. I52: 699–719, doi:10.1016/j.dsr.2004.12.001
RAVEN, J. A. 2009. Contributions of anoxygenic and oxygenicphototrophy and chemolithotrophy to carbon and oxygenfluxes in aquatic environments. Aquat. Microb. Ecol. 56:177–192, doi:10.3354/ame01315
REES, A. P., E. M. S. WOODWARD, AND I. JOINT. 2006.Concentrations and uptake of nitrate and ammonium in theAtlantic Ocean between 60uN and 50uS. Deep-Sea Res. II 53:1649–1665, doi:10.1016/j.dsr2.2006.05.008
ROTTHAUWE, J. H., K. P. WITZEL, AND W. LIESACK. 1997. Theammonia monooxygenase structural gene amoA as a func-tional marker: molecular fine-scale analysis of naturalammonia-oxidizing populations. Appl. Environ. Microbiol.63: 4704–4712.
SANTORO, A. E., K. L. CASCIOTTI, AND C. A. FRANCIS. 2010.Activity, abundance and diversity of nitrifying archaea andbacteria in the central California Current. Environ. Micro-biol. 12: 1989–2006, doi:10.1111/j.1462-2920.2010.02205.x
SCHLOSS, P. D., AND OTHERS. 2009. Introducing mothur: Open-source, platform-independent, community-supported soft-ware for describing and comparing microbial communities.Appl. Environ. Microbiol. 75: 7537–7541, doi:10.1128/AEM.01541-09
SIGMAN, D. M., K. L. CASCIOTTI, M. ANDREANI, C. BARFORD, M.GALANTER, AND J. K. BOHLKE. 2001. A bacterial method for thenitrogen isotopic analysis of nitrate in seawater and freshwater.Anal. Chem. 73: 4145–4153, doi:10.1021/ac010088e
STEWART, F. J., O. ULLOA, AND E. F. DELONG. 2012. Microbialmetatranscriptomics in a permanent marine oxygen minimumzone. Environ. Microbiol. 14: 23–40, doi:10.1111/j.1462-2920.2010.02400.x
STRICKLAND, J. H., AND T. R. PARSONS. 1972. A practicalhandbook of seawater analysis, 2nd ed. Fisheries ResearchBoard.
SUTKA, R. L., N. E. OSTROM, P. H. OSTROM, AND M. S.PHANIKUMAR. 2004. Stable nitrogen isotope dynamics ofdissolved nitrate in a transect from the North PacificSubtropical Gyre to the eastern tropical North Pacific.Geochim. Cosmochim. Acta 68: 517–527, doi:10.1016/S0016-7037(03)00483-6
WANG, Q., G. M. GARRITY, J. M. TIEDJE, AND J. R. COLE. 2007.Naıve Bayesian classifier for rapid assignment of rRNAsequences into the new bacterial taxonomy. Appl. Environ.Microbiol. 73: 5261–5267, doi:10.1128/AEM.00062-07
WANKEL, S. D., C. KENDALL, J. T. PENNINGTON, F. P. CHAVEZ, AND
A. PAYTAN. 2007. Nitrification in the euphotic zone asevidenced by nitrate dual isotopic composition: Observationsfrom Monterey Bay, California. Glob. Biogeochem. Cycles21: GB2009, doi:10.1029/2006GB002723
WARD, B. B. 2008. Nitrification in marine systems, p. 199–262. InD. G. Capone, D. Bronk, M. Mulholland, and E. J.Carpenter [eds.], Nitrogen in the marine environment, 2nded. Academic.
———, H. E. GLOVER, AND F. LIPSCHULTZ. 1989a. Chemoauto-trophic activity and nitrification in the oxygen minimum zoneoff Peru. Deep-Sea Res. A 36: 1031–1051, doi:10.1016/0198-0149(89)90076-9
———, K. A. KILPATRICK, E. H. RENGER, AND R. W. EPPLEY.1989b. Biological nitrogen cycling in the nitracline. Limnol.Oceanogr. 34: 493–513, doi:10.4319/lo.1989.34.3.0493
———, AND O. C. ZAFIRIOU. 1988. Nitrification and nitric oxide inthe oxygen minimum of the eastern tropical North Pacific.Deep-Sea Res. A 35: 1127–1142, doi:10.1016/0198-0149(88)90005-2
———, AND OTHERS. 2009. Denitrification as the dominantnitrogen loss process in the Arabian Sea. Nature 461: 78–81,doi:10.1038/nature08276
WHITE, A. E., F. G. PRAHL, R. M. LETELIER, AND B. N. POPP. 2007.Summer surface waters in the Gulf of California: Primehabitat for biological N2 fixation. Glob. Biogeochem. Cycles21: GB2017, doi:10.1029/2006GB002779
YOOL, A., A. P. MARTIN, C. FERNANDEZ, AND D. R. CLARK.2007. The significance of nitrification for oceanic newproduction. Nature 447: 999–1002, doi:10.1038/nature05885
Associate Editor: Bo Thamdrup
Received: 27 May 2011Accepted: 26 January 2012
Amended: 01 February 2012
726 Beman et al.