Embed Size (px)
Citation preview
Waste Quantification and Characterization – Nairobi (2008) _________________________________________________________________________________
__________________________________________________________________________________
Extracted from the report “Solid Waste Management in Nairobi: A Situation Analysis”
1 Introduction to Nairobi
Nairobi City is the capital of Kenya with a population of more than four million people, approximately 25 per cent of Kenya’s urban population and occupies an area of 696.1 km2, which is 0.1 per cent of Kenya’s total surface area (UNCHS 2001). Like many African cities, Nairobi continues to experience influx of population from the rural areas, mushrooming of informal settlements and inadequate infrastructure for solid waste management.
� Population Growth
The table presented below, which has been adapted from the City of Nairobi Environmental Outlook (UNEP & UN-Habitat, 2007), shows Nairobi’s near exponential historical population growth.
Table 1: Nairobi’s Population since 1906
Waste Quantification and Characterization – Nairobi (Kenya)
Waste Quantification and Characterization – Nairobi (2008) _________________________________________________________________________________
__________________________________________________________________________________
Extracted from the report “Solid Waste Management in Nairobi: A Situation Analysis”
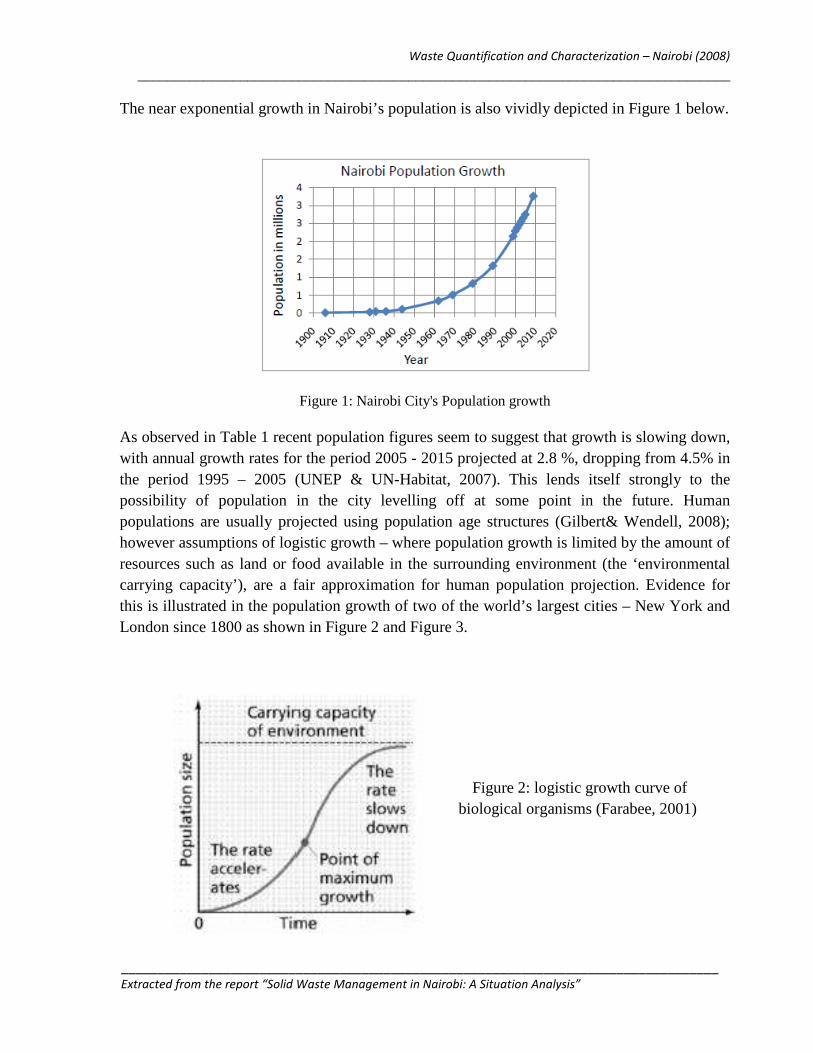
The near exponential growth in Nairobi’s population is also vividly depicted in Figure 1 below.
Figure 1: Nairobi City's Population growth
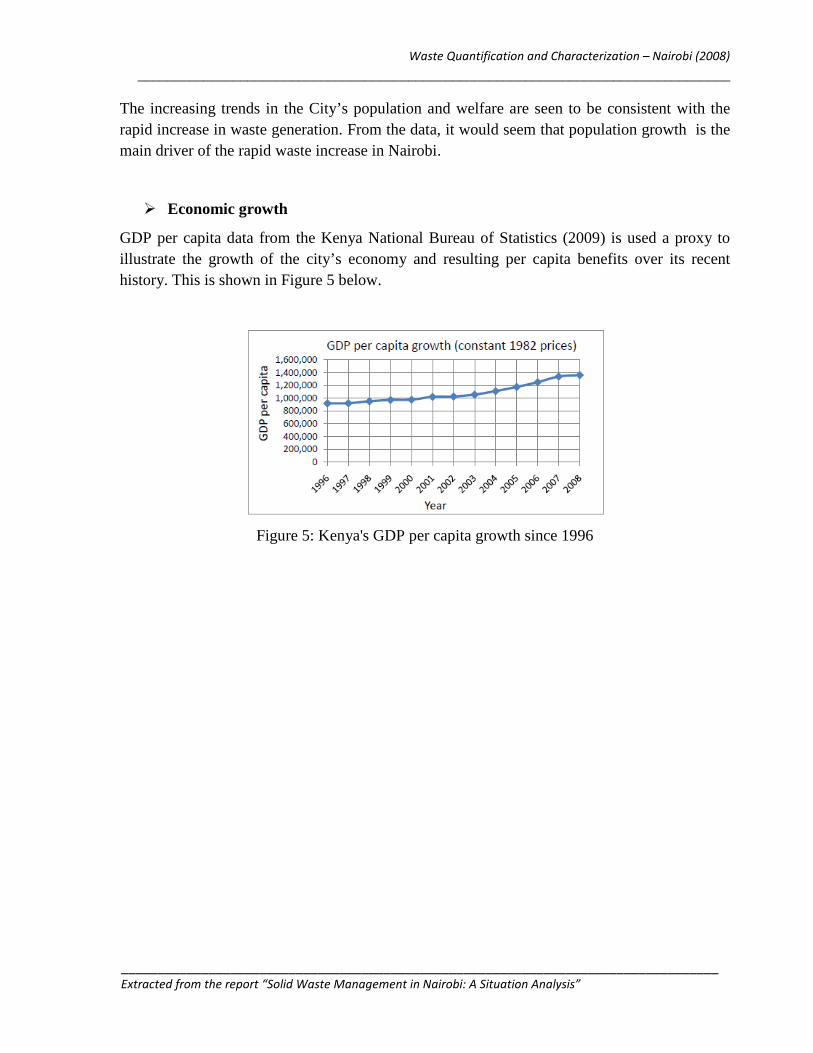
As observed in Table 1 recent population figures seem to suggest that growth is slowing down, with annual growth rates for the period 2005 - 2015 projected at 2.8 %, dropping from 4.5% in the period 1995 – 2005 (UNEP & UN-Habitat, 2007). This lends itself strongly to the possibility of population in the city levelling off at some point in the future. Human populations are usually projected using population age structures (Gilbert& Wendell, 2008); however assumptions of logistic growth – where population growth is limited by the amount of resources such as land or food available in the surrounding environment (the ‘environmental carrying capacity’), are a fair approximation for human population projection. Evidence for this is illustrated in the population growth of two of the world’s largest cities – New York and London since 1800 as shown in Figure 2 and Figure 3.
Figure 2: logistic growth curve of biological organisms (Farabee, 2001)

Waste Quantification and Characterization – Nairobi (2008) _________________________________________________________________________________
__________________________________________________________________________________
Extracted from the report “Solid Waste Management in Nairobi: A Situation Analysis”
Figure 3: Population growth curves of New York (Gibson& Jung, 2005) and London (Wendell Cox Consultancy, 2001) respectively
From these observations, there is reasonable ground to believe that Nairobi City’s population shall start to level off at some point and cannot continue its current exponential growth. For the purposes of projecting Nairobi’s waste generation into the future therefore, logistic population growth is assumed. While the physical application of the concept of an area’s population ‘carrying capacity’ is tricky as cities tend to expand geographically and to increasingly import resources from further afield; a population carrying capacity of Nine million residents is assumed for the logistic population projection model used for Nairobi, on the basis of trying to match the initial population growth in the logistic model as closely as possible to the recorded growth of Nairobi’s population as above. The results of the projected vs. recorded population in the past, and population projections from 2009 are shown in Figure 4 below.
Figure 4: Kenya's GDP per capita growth since 1996
Waste Quantification and Characterization – Nairobi (2008) _________________________________________________________________________________
__________________________________________________________________________________
Extracted from the report “Solid Waste Management in Nairobi: A Situation Analysis”
The increasing trends in the City’s population and welfare are seen to be consistent with the rapid increase in waste generation. From the data, it would seem that population growth is the main driver of the rapid waste increase in Nairobi.
� Economic growth
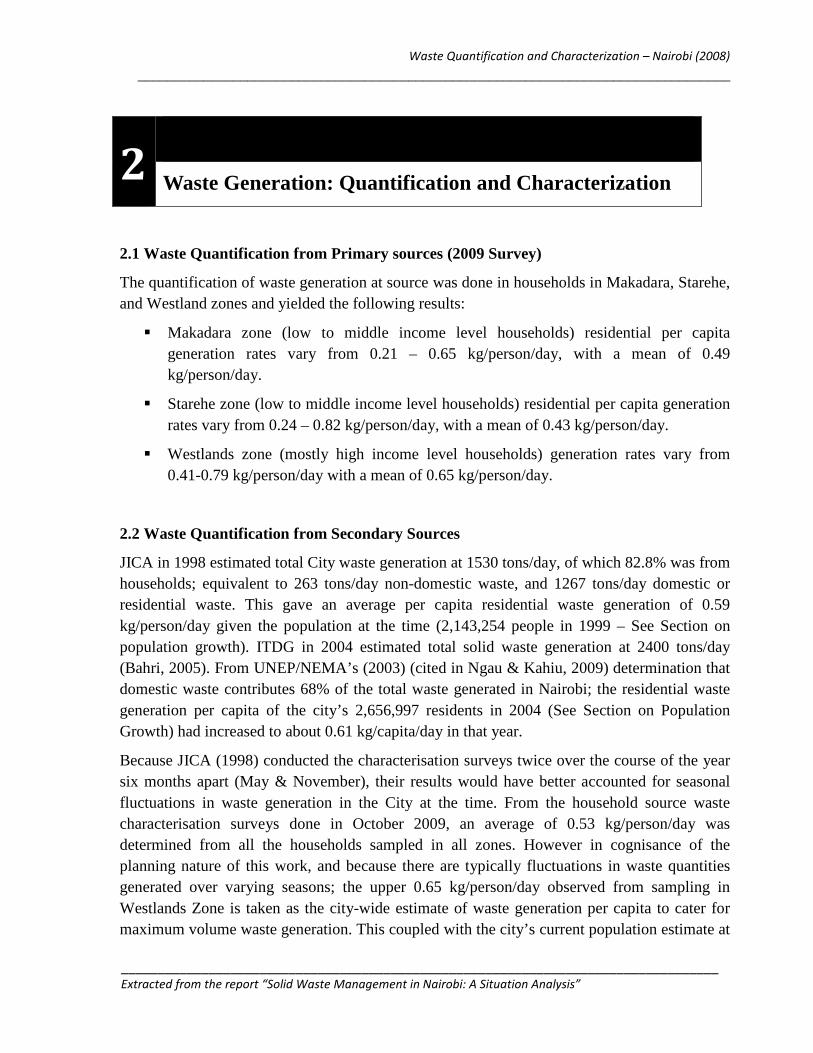
GDP per capita data from the Kenya National Bureau of Statistics (2009) is used a proxy to illustrate the growth of the city’s economy and resulting per capita benefits over its recent history. This is shown in Figure 5 below.
Figure 5: Kenya's GDP per capita growth since 1996
Waste Quantification and Characterization – Nairobi (2008) _________________________________________________________________________________
__________________________________________________________________________________
Extracted from the report “Solid Waste Management in Nairobi: A Situation Analysis”
1.1 Results and Implications of Waste Characterization Surveys
The baseline data has been collected from primary and secondary information. Primary information was based on surveys at different sources and secondary sources were researched from books, reports, historical data, etc.
Waste characterization surveys were carried out at designated City Council of Nairobi (CCN) communal waste collection points, and at immediate source (waste taken directly from households and various business, commerce and institutional premises) respectively, to determine the current character of Nairobi’s waste. The sample numbers taken and used for the characterisations achieved theoretical 99% Confidence levels for residential/domestic and non-domestic waste characterisation at immediate source, and 95% and 90% Confidence levels respectively for domestic and non-domestic waste characterisation at communal waste collection points.
1
Baseline Data (2006)
Waste Quantification and Characterization – Nairobi (2008) _________________________________________________________________________________
__________________________________________________________________________________
Extracted from the report “Solid Waste Management in Nairobi: A Situation Analysis”
2.1 Waste Quantification from Primary sources (2009 Survey)
The quantification of waste generation at source was done in households in Makadara, Starehe, and Westland zones and yielded the following results:
� Makadara zone (low to middle income level households) residential per capita generation rates vary from 0.21 – 0.65 kg/person/day, with a mean of 0.49 kg/person/day.
� Starehe zone (low to middle income level households) residential per capita generation rates vary from 0.24 – 0.82 kg/person/day, with a mean of 0.43 kg/person/day.
� Westlands zone (mostly high income level households) generation rates vary from 0.41-0.79 kg/person/day with a mean of 0.65 kg/person/day.
2.2 Waste Quantification from Secondary Sources
JICA in 1998 estimated total City waste generation at 1530 tons/day, of which 82.8% was from households; equivalent to 263 tons/day non-domestic waste, and 1267 tons/day domestic or residential waste. This gave an average per capita residential waste generation of 0.59 kg/person/day given the population at the time (2,143,254 people in 1999 – See Section on population growth). ITDG in 2004 estimated total solid waste generation at 2400 tons/day (Bahri, 2005). From UNEP/NEMA’s (2003) (cited in Ngau & Kahiu, 2009) determination that domestic waste contributes 68% of the total waste generated in Nairobi; the residential waste generation per capita of the city’s 2,656,997 residents in 2004 (See Section on Population Growth) had increased to about 0.61 kg/capita/day in that year.
Because JICA (1998) conducted the characterisation surveys twice over the course of the year six months apart (May & November), their results would have better accounted for seasonal fluctuations in waste generation in the City at the time. From the household source waste characterisation surveys done in October 2009, an average of 0.53 kg/person/day was determined from all the households sampled in all zones. However in cognisance of the planning nature of this work, and because there are typically fluctuations in waste quantities generated over varying seasons; the upper 0.65 kg/person/day observed from sampling in Westlands Zone is taken as the city-wide estimate of waste generation per capita to cater for maximum volume waste generation. This coupled with the city’s current population estimate at
2
Waste Generation: Quantification and Characterization
Waste Quantification and Characterization – Nairobi (2008) _________________________________________________________________________________
__________________________________________________________________________________
Extracted from the report “Solid Waste Management in Nairobi: A Situation Analysis”
3.265 million gives a maximum residential waste generation estimate of 2122 tons/day. UNEP/NEMA (2003) (cited in Ngau & Kahiu, 2009) found that domestic waste contributes 68% of the total waste generated in Nairobi; it can therefore be estimated that current Non-domestic waste generation is about 999 tons/day, and Total waste generation in the City in turn is currently at most about 3121 tons/day. This represents an increase of 30% from the estimate waste generation figures of 2400 tons/day in 2004 by ITDG (Bahri, 2005), and a full doubling of waste generation in ten years from 1530 tons/day in 1998 (JICA, 1998).
2.3 Waste Characterization from Primary Sources (2009 Survey)
� Residential/Domestic
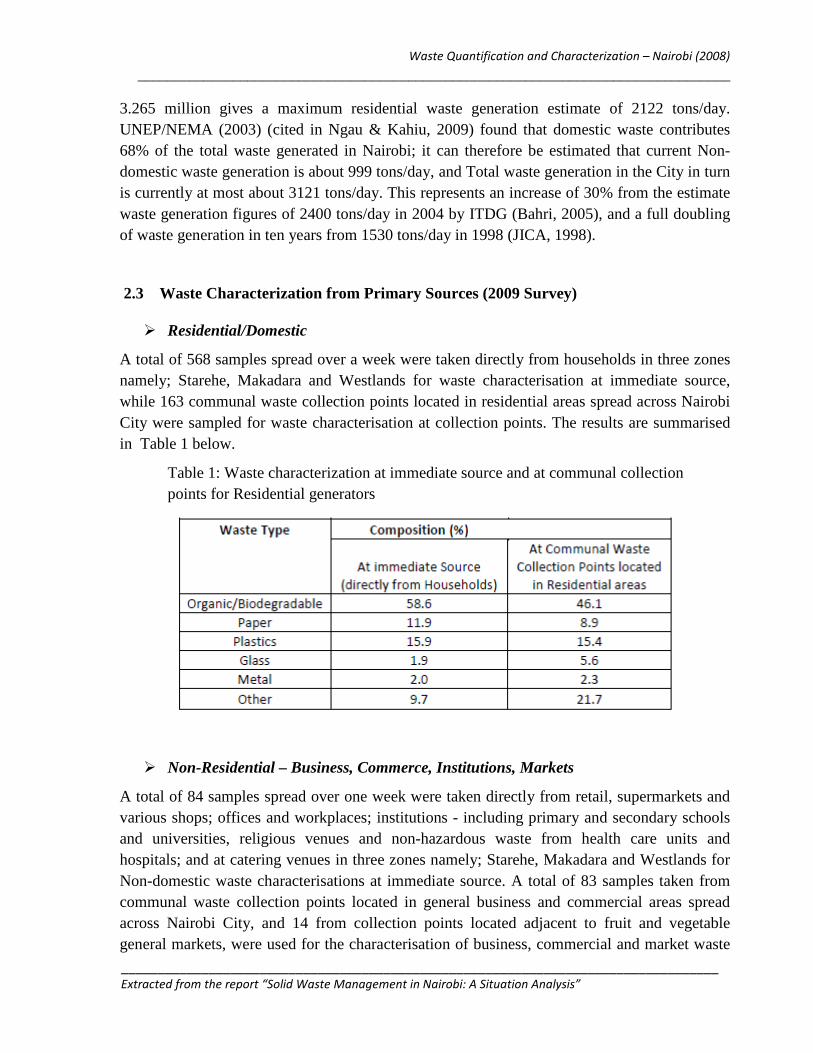
A total of 568 samples spread over a week were taken directly from households in three zones namely; Starehe, Makadara and Westlands for waste characterisation at immediate source, while 163 communal waste collection points located in residential areas spread across Nairobi City were sampled for waste characterisation at collection points. The results are summarised in Table 1 below.
Table 1: Waste characterization at immediate source and at communal collection points for Residential generators
� Non-Residential – Business, Commerce, Institutions, Markets
A total of 84 samples spread over one week were taken directly from retail, supermarkets and various shops; offices and workplaces; institutions - including primary and secondary schools and universities, religious venues and non-hazardous waste from health care units and hospitals; and at catering venues in three zones namely; Starehe, Makadara and Westlands for Non-domestic waste characterisations at immediate source. A total of 83 samples taken from communal waste collection points located in general business and commercial areas spread across Nairobi City, and 14 from collection points located adjacent to fruit and vegetable general markets, were used for the characterisation of business, commercial and market waste
Waste Quantification and Characterization – Nairobi (2008) _________________________________________________________________________________
__________________________________________________________________________________
Extracted from the report “Solid Waste Management in Nairobi: A Situation Analysis”
at communal waste collection points.
A further 102 samples from communal waste collection points located in areas that had mixed residential and business/commercial activity were taken but are excluded from this summary, they however generally had waste compositions that fell between those observed at communal collection points located in or adjacent to residential areas only as in Table 1 above, and business/commerce only areas as shown below in Table 2.
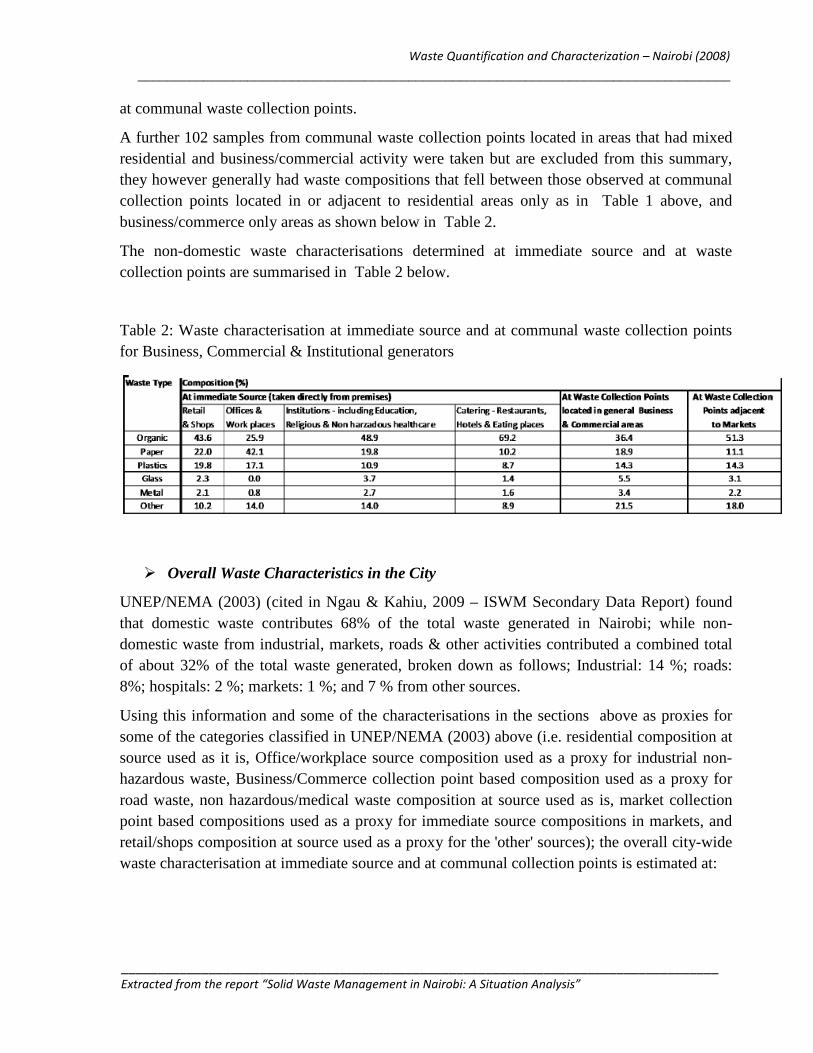
The non-domestic waste characterisations determined at immediate source and at waste collection points are summarised in Table 2 below.
Table 2: Waste characterisation at immediate source and at communal waste collection points for Business, Commercial & Institutional generators
� Overall Waste Characteristics in the City
UNEP/NEMA (2003) (cited in Ngau & Kahiu, 2009 – ISWM Secondary Data Report) found that domestic waste contributes 68% of the total waste generated in Nairobi; while non-domestic waste from industrial, markets, roads & other activities contributed a combined total of about 32% of the total waste generated, broken down as follows; Industrial: 14 %; roads: 8%; hospitals: 2 %; markets: 1 %; and 7 % from other sources.
Using this information and some of the characterisations in the sections above as proxies for some of the categories classified in UNEP/NEMA (2003) above (i.e. residential composition at source used as it is, Office/workplace source composition used as a proxy for industrial non-hazardous waste, Business/Commerce collection point based composition used as a proxy for road waste, non hazardous/medical waste composition at source used as is, market collection point based compositions used as a proxy for immediate source compositions in markets, and retail/shops composition at source used as a proxy for the 'other' sources); the overall city-wide waste characterisation at immediate source and at communal collection points is estimated at:
Waste Quantification and Characterization – Nairobi (2008) _________________________________________________________________________________
__________________________________________________________________________________
Extracted from the report “Solid Waste Management in Nairobi: A Situation Analysis”
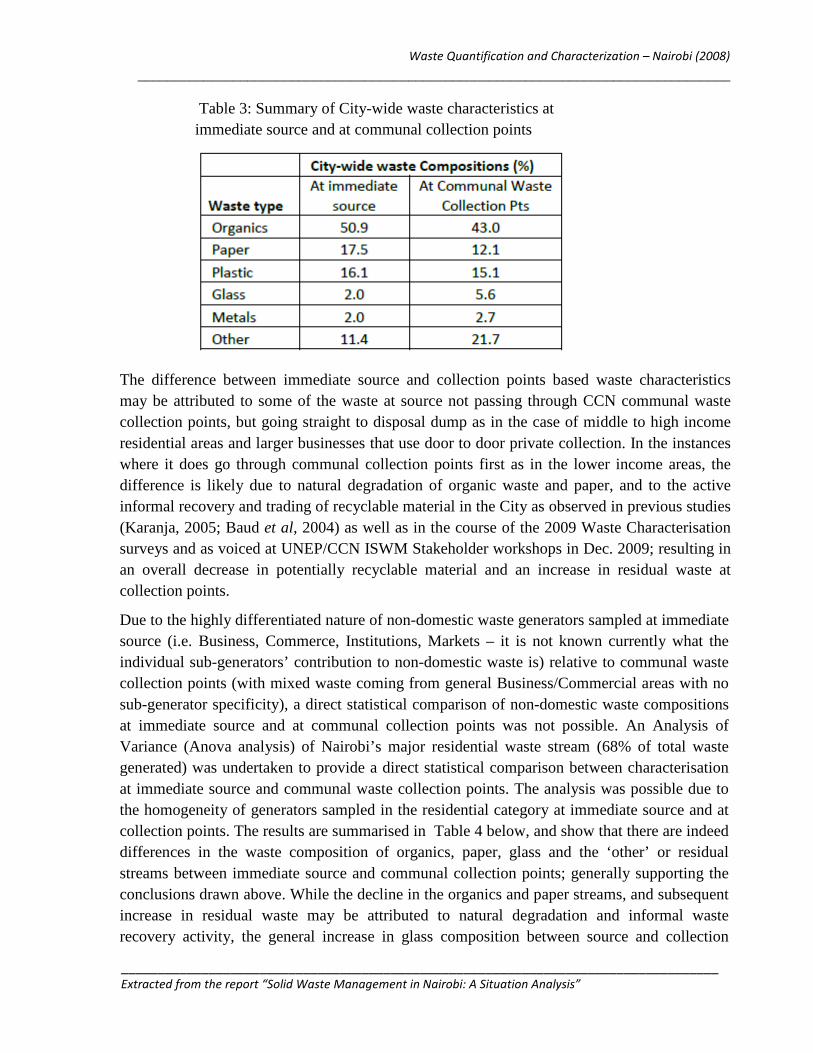
Table 3: Summary of City-wide waste characteristics at immediate source and at communal collection points
The difference between immediate source and collection points based waste characteristics may be attributed to some of the waste at source not passing through CCN communal waste collection points, but going straight to disposal dump as in the case of middle to high income residential areas and larger businesses that use door to door private collection. In the instances where it does go through communal collection points first as in the lower income areas, the difference is likely due to natural degradation of organic waste and paper, and to the active informal recovery and trading of recyclable material in the City as observed in previous studies (Karanja, 2005; Baud et al, 2004) as well as in the course of the 2009 Waste Characterisation surveys and as voiced at UNEP/CCN ISWM Stakeholder workshops in Dec. 2009; resulting in an overall decrease in potentially recyclable material and an increase in residual waste at collection points.
Due to the highly differentiated nature of non-domestic waste generators sampled at immediate source (i.e. Business, Commerce, Institutions, Markets – it is not known currently what the individual sub-generators’ contribution to non-domestic waste is) relative to communal waste collection points (with mixed waste coming from general Business/Commercial areas with no sub-generator specificity), a direct statistical comparison of non-domestic waste compositions at immediate source and at communal collection points was not possible. An Analysis of Variance (Anova analysis) of Nairobi’s major residential waste stream (68% of total waste generated) was undertaken to provide a direct statistical comparison between characterisation at immediate source and communal waste collection points. The analysis was possible due to the homogeneity of generators sampled in the residential category at immediate source and at collection points. The results are summarised in Table 4 below, and show that there are indeed differences in the waste composition of organics, paper, glass and the ‘other’ or residual streams between immediate source and communal collection points; generally supporting the conclusions drawn above. While the decline in the organics and paper streams, and subsequent increase in residual waste may be attributed to natural degradation and informal waste recovery activity, the general increase in glass composition between source and collection
Waste Quantification and Characterization – Nairobi (2008) _________________________________________________________________________________
__________________________________________________________________________________
Extracted from the report “Solid Waste Management in Nairobi: A Situation Analysis”
points is curious and could be due to non desirability of the material for waste recovery owing to a lack of broken glass recycling capacity in the City, a scenario that is also alluded to by Karanja (2005).
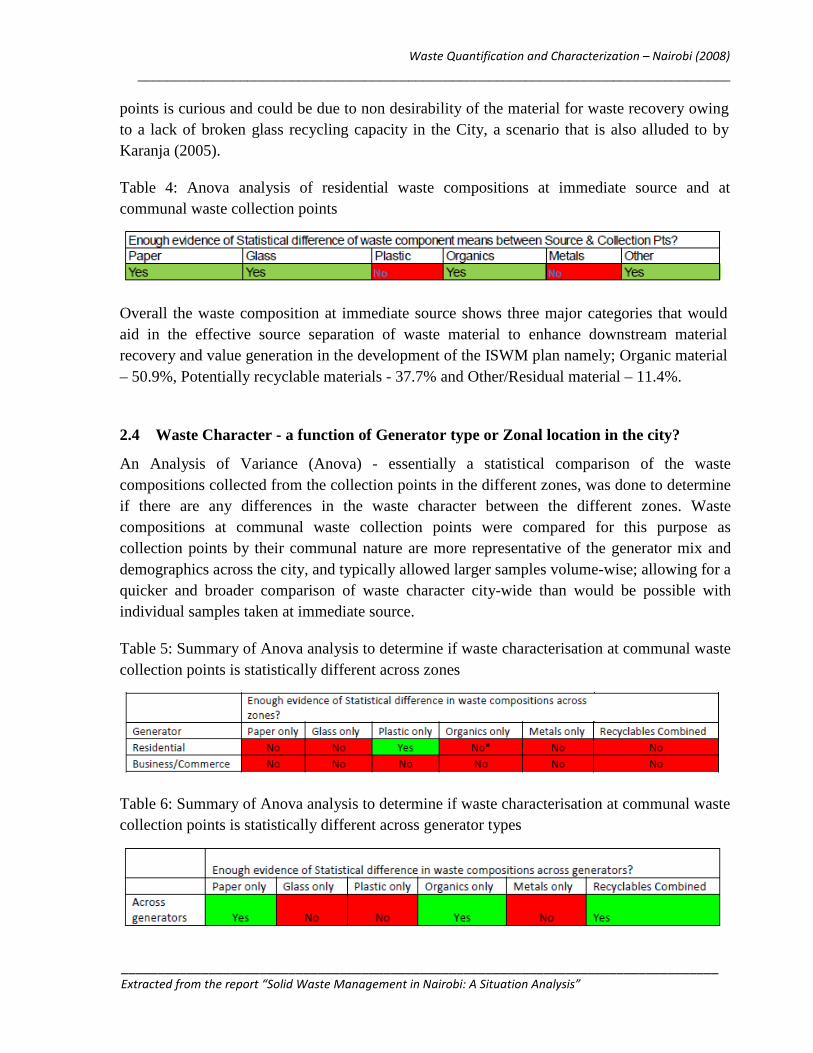
Table 4: Anova analysis of residential waste compositions at immediate source and at communal waste collection points
Overall the waste composition at immediate source shows three major categories that would aid in the effective source separation of waste material to enhance downstream material recovery and value generation in the development of the ISWM plan namely; Organic material – 50.9%, Potentially recyclable materials - 37.7% and Other/Residual material – 11.4%.
2.4 Waste Character - a function of Generator type or Zonal location in the city?
An Analysis of Variance (Anova) - essentially a statistical comparison of the waste compositions collected from the collection points in the different zones, was done to determine if there are any differences in the waste character between the different zones. Waste compositions at communal waste collection points were compared for this purpose as collection points by their communal nature are more representative of the generator mix and demographics across the city, and typically allowed larger samples volume-wise; allowing for a quicker and broader comparison of waste character city-wide than would be possible with individual samples taken at immediate source.
Table 5: Summary of Anova analysis to determine if waste characterisation at communal waste collection points is statistically different across zones
Table 6: Summary of Anova analysis to determine if waste characterisation at communal waste collection points is statistically different across generator types
Waste Quantification and Characterization – Nairobi (2008) _________________________________________________________________________________
__________________________________________________________________________________
Extracted from the report “Solid Waste Management in Nairobi: A Situation Analysis”
The results show a relative indifference in waste compositions between zones with the exception of plastic, and therefore no strong evidence for the need for specific zone based waste intervention activities. The analysis instead shows that waste character in Nairobi is different across generator types, and is a stronger function of the responsible generators i.e. residences/households and commerce/institutions, than of the geographical location of generators. Any detailed intervention policies developed targeting specific waste types should therefore be directed at specific generator groups exhibiting strong compositions of the particular material of interest.
2.5 Waste Characterization from Secondary Sources
The waste characterisation determined in 2009 deviates slightly but not radically from previous studies. JICA study (1998) determined the Nairobi Municipal Solid Waste stream to comprise of: 51% food waste, 17% paper (15% recyclable), 12% plastics (5% containers), 7% grass and wood, 3% metal, 3% textile, 2% glass, and others (5%) and ITDG (now called Practical Action) in 2004 gave a slightly different municipal solid waste composition with organics comprising 61%, 21% plastics and 12% paper (Bahri, 2005).
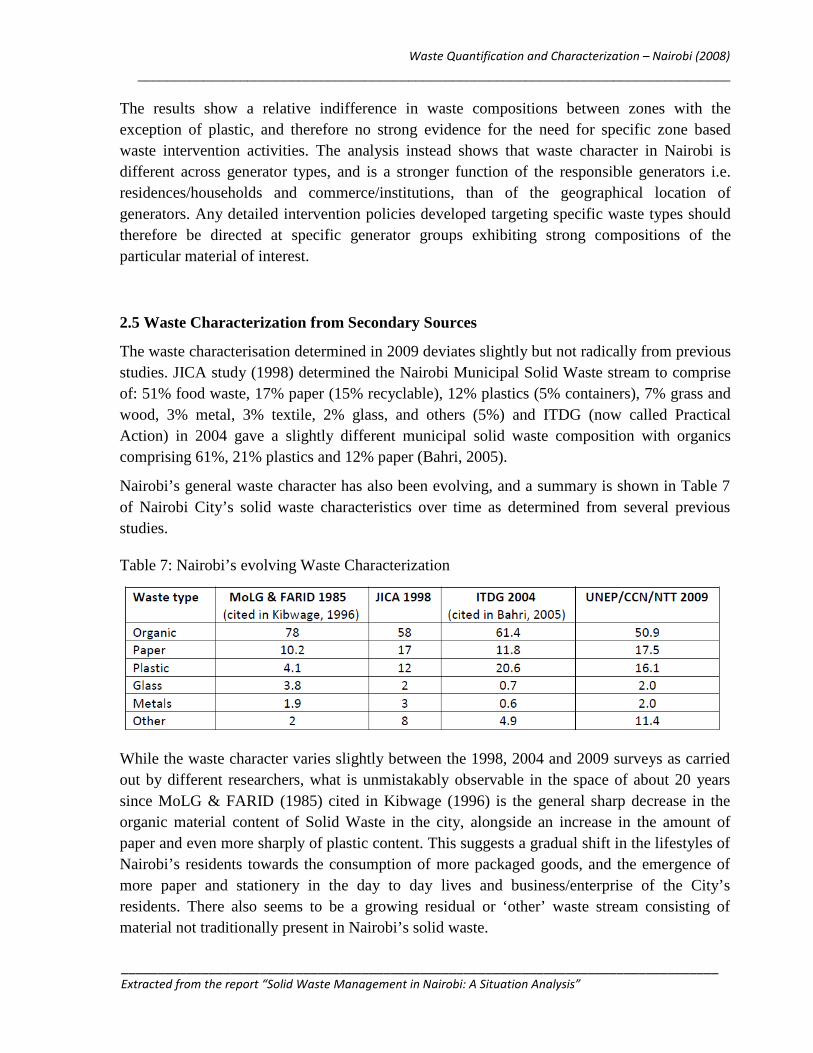
Nairobi’s general waste character has also been evolving, and a summary is shown in Table 7 of Nairobi City’s solid waste characteristics over time as determined from several previous studies.
Table 7: Nairobi’s evolving Waste Characterization
While the waste character varies slightly between the 1998, 2004 and 2009 surveys as carried out by different researchers, what is unmistakably observable in the space of about 20 years since MoLG & FARID (1985) cited in Kibwage (1996) is the general sharp decrease in the organic material content of Solid Waste in the city, alongside an increase in the amount of paper and even more sharply of plastic content. This suggests a gradual shift in the lifestyles of Nairobi’s residents towards the consumption of more packaged goods, and the emergence of more paper and stationery in the day to day lives and business/enterprise of the City’s residents. There also seems to be a growing residual or ‘other’ waste stream consisting of material not traditionally present in Nairobi’s solid waste.
Waste Quantification and Characterization – Nairobi (2008) _________________________________________________________________________________
__________________________________________________________________________________
Extracted from the report “Solid Waste Management in Nairobi: A Situation Analysis”
2.6 Solid Waste Projections into the future
Waste growth is function of population and economic growth. Using the population projections discussed in the section of population growth, and knowledge of waste generation per capita increase with GDP, future residential waste generation can be estimated. JICA (1998) used a simple technique, taking waste generation and income statistics from the Tokyo Metropolitan Area for the period between 1956 and 1968 - while it was still a developing economy with a GDP comparable to Kenya’s, to project future waste flows for Nairobi. This extraction of information from the developing phase of a developed (‘mature’) economy provides an estimation method for the waste growth behaviour to be expected in a developing economy, more so as populations in developing nations are generally aspiring to the lifestyles of citizens in developed countries. Using these statistics, JICA (1998) found the ratio of annual growth in waste discharged per capita (% increase) to annual increase in GDP per capita (% increase) - also referred to as discharge flexibility, to be 0.51. Determination of similar data from another actual developing world city - Bangkok, Thailand, between 1990 and 1995 found this ratio to be 0.52. JICA (1998) assumed a discharge flexibility of 0.5 for their residential waste projections; and their projection for total solid waste generation in 2004 of 2140 tons/day MSW compares fairly well with ITDG’s estimation in 2004 (Bahri, 2005) of 2400 tons/day at the time.
Ten years later, there is now some data available on how waste generation per capita has varied over this period relative to GDP per capita. Using GDP per capita figures for the period 1998-2007 from the Kenya National Bureau of Statistics (2009), GDP per capita has increased at an annual average of 3.89%. Using JICA’s (1998) per capita residential waste generation of about 0.59 kg/capita/day, and taking 0.65 kg/capita/day as the current rate, residential waste generation per capita has increased at an average of 0.9% annually since 1998. The discharge flexibility ratio over this period has therefore been about 0.23. This discharge flexibility ratio is used as the basis for the projection of future residential waste generation relative to economic growth, and in conjunction with the projected population gives future projection estimates for total domestic waste generation in Nairobi. Non-domestic waste generation, being the product of much more complex interplay between various factors including general economic growth, day time working population and day time economic activity (not always necessarily based in the city permanently, e.g. open markets and market traders whose participants might be peri-urban residents, city resource imports that fluctuate with need, and peri-urban resident movement to institutions in the city such as education and healthcare etc), is modelled and projected simplistically assuming linear growth based on recorded experience from 1998 to 2009. From 263 tons/day in 1998 to 999 tons/day of Non-domestic waste in 2009, Non-domestic waste has grown at a simple linear annual growth of 25% from 1998 levels.
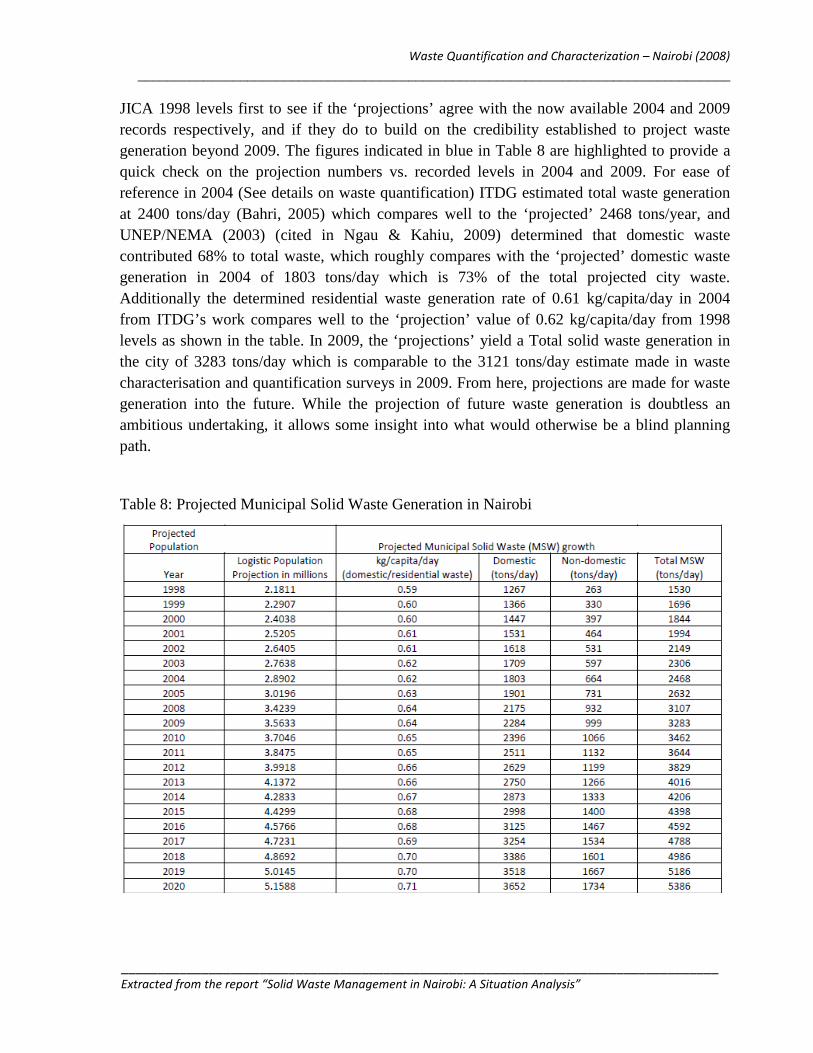
Using the assumptions discussed above; population, per capita domestic waste generation rates, Non-domestic waste generation and Total Municipal Solid Waste generation projections are estimated as shown in Table 8 based on JICA levels in 1998. Projections are done from the
Waste Quantification and Characterization – Nairobi (2008) _________________________________________________________________________________
__________________________________________________________________________________
Extracted from the report “Solid Waste Management in Nairobi: A Situation Analysis”
JICA 1998 levels first to see if the ‘projections’ agree with the now available 2004 and 2009 records respectively, and if they do to build on the credibility established to project waste generation beyond 2009. The figures indicated in blue in Table 8 are highlighted to provide a quick check on the projection numbers vs. recorded levels in 2004 and 2009. For ease of reference in 2004 (See details on waste quantification) ITDG estimated total waste generation at 2400 tons/day (Bahri, 2005) which compares well to the ‘projected’ 2468 tons/year, and UNEP/NEMA (2003) (cited in Ngau & Kahiu, 2009) determined that domestic waste contributed 68% to total waste, which roughly compares with the ‘projected’ domestic waste generation in 2004 of 1803 tons/day which is 73% of the total projected city waste. Additionally the determined residential waste generation rate of 0.61 kg/capita/day in 2004 from ITDG’s work compares well to the ‘projection’ value of 0.62 kg/capita/day from 1998 levels as shown in the table. In 2009, the ‘projections’ yield a Total solid waste generation in the city of 3283 tons/day which is comparable to the 3121 tons/day estimate made in waste characterisation and quantification surveys in 2009. From here, projections are made for waste generation into the future. While the projection of future waste generation is doubtless an ambitious undertaking, it allows some insight into what would otherwise be a blind planning path.
Table 8: Projected Municipal Solid Waste Generation in Nairobi
Waste Quantification and Characterization – Nairobi (2008) _________________________________________________________________________________
__________________________________________________________________________________
Extracted from the report “Solid Waste Management in Nairobi: A Situation Analysis”
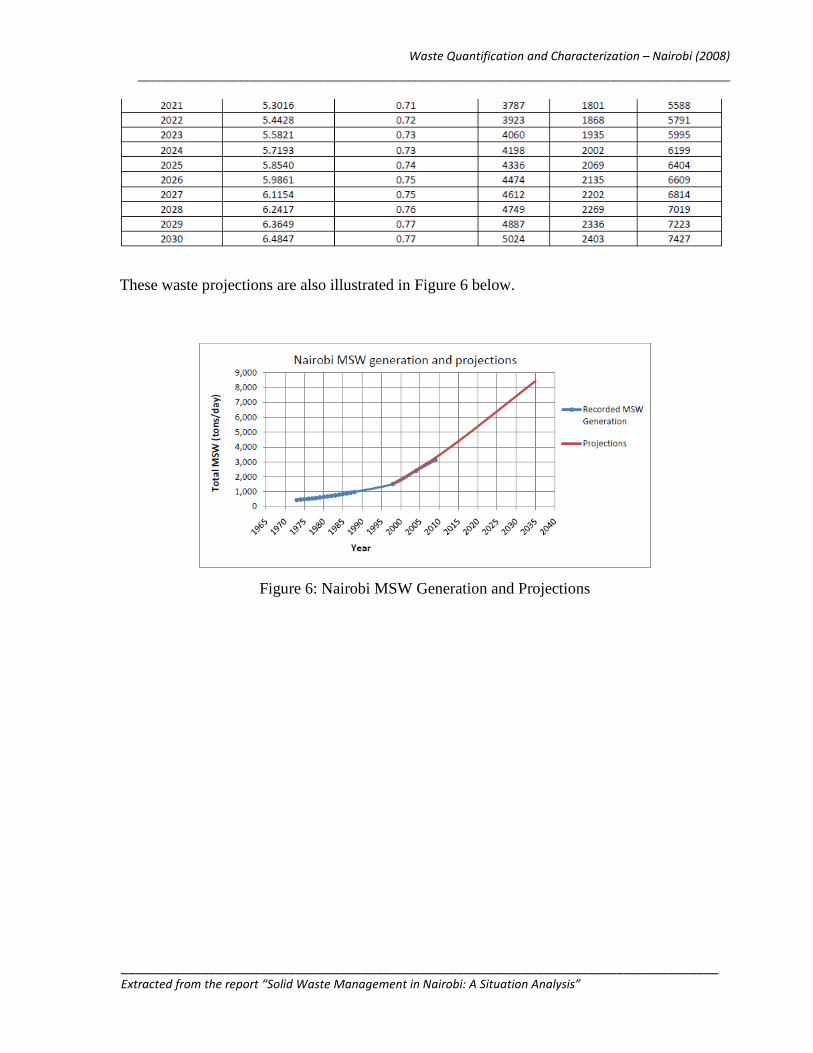
These waste projections are also illustrated in Figure 6 below.
Figure 6: Nairobi MSW Generation and Projections