Embed Size (px)
Citation preview
BENCHMARKING THE RESILIENCE OF
ORGANISATIONS
A thesis submitted in partial fulfilment of the requirements for the degree of Doctor of Philosophy
in the Civil and Natural Resources Engineering Department by Amy Stephenson
at the University of Canterbury 2010

Table of Contents
Acknowledgements ............................................................................................................ i Abstract ............................................................................................................................ iii Chapter 1 – Introduction ................................................................................................... 1
1.1 The Importance of Organisational Resilience................................................... 3
1.2 Why Measure Organisational Resilience? ........................................................ 5
1.3 Aims and Objectives ......................................................................................... 7
1.4 The Contributions of this Research................................................................... 8
1.5 Thesis Structure .............................................................................................. 10
Chapter 2 – Theoretical Development ............................................................................ 13
2.1 The Exploration of Organisations through Crisis Literature .......................... 14
2.1.1 Systems Thinking and Theory .................................................................. 16
2.2 The Organisational Development of Crises .................................................... 17
2.3 Organisational Response to Crisis .................................................................. 25
2.4 Resilience ........................................................................................................ 35
2.4.1 Disaster Resilience .................................................................................... 36
2.4.2 Organisational Resilience ......................................................................... 37
2.4.2.1 Relevant Standards ............................................................................ 44
2.4.3 Measuring Organisational Resilience ....................................................... 49
2.4.4 Benchmarking ........................................................................................... 54
2.5 Anticipation vs. Resilience ............................................................................. 57
2.6 Research Questions ......................................................................................... 60
Chapter 3 – Identifying Indicators of Organisational Resilience.................................... 63
3.1 Relative Overall Resilience ............................................................................ 64
3.2 Indicators Mini-workshop ............................................................................... 65
3.2.1 Mini-workshop Method and Process ........................................................ 65
3.2.2 Mini-workshop Outcomes ........................................................................ 67
3.3 Indicator Literature Review ............................................................................ 67
3.3.1 Resilience Ethos ........................................................................................ 68
3.3.2 Situation Awareness ................................................................................. 73
3.3.3 Management of Keystone Vulnerabilities ................................................ 86
3.3.4 Adaptive Capacity ..................................................................................... 99
3.4 Summary and Use of the Indicators .............................................................. 114
Chapter 4 – Thesis Methodology .................................................................................. 115
4.1 Methods ........................................................................................................ 115
4.1.1 Unit of Analysis ...................................................................................... 115
4.1.2 A Web-based Self-assessment Survey .................................................... 117
4.1.3 Semi-structured Interviews ..................................................................... 119
4.1.4 Sampling ................................................................................................. 119
4.1.4.1 Sampling Frame ............................................................................... 120
4.1.4.2 Sample ............................................................................................. 122
4.1.5 Factor Analysis ....................................................................................... 124
4.1.5.1 Principal Axis Factor Analysis ........................................................ 127
4.2 Hypotheses .................................................................................................... 129
4.2.1 Relative Overall Resilience .................................................................... 130
4.2.2 Adjusted Relative Overall Resilience ..................................................... 132
4.2.3 Additional Hypotheses ............................................................................ 135
4.3 Survey Administration and Approaching Organisations .............................. 139
Chapter 5 - Scale Development .................................................................................... 143
5.1 Scale Development Process .......................................................................... 143
5.1.1 Item Generation ...................................................................................... 144
5.1.2 Item Development ................................................................................... 145
5.1.3 Organisational Performance Items .......................................................... 145
5.2 Pilot Study ..................................................................................................... 149
5.2.1 Sample .................................................................................................... 150
5.2.2 Ethics Approval ...................................................................................... 150
5.2.3 Building a Resilience Measurement Tool ............................................... 151
5.2.4 Interviews ................................................................................................ 151
5.2.5 Results of the Pilot Study ........................................................................ 153
5.2.6 Pilot Study Conclusions .......................................................................... 155
5.2.7 Changes Made to the Resilience Measurement Tool after the Pilot Study 156
5.2.7.1 Changes to Demographic Items ....................................................... 156
5.2.7.2 Changes to Reflective Organisational Performance Items .............. 157
5.2.7.3 Changes to the Survey Instrument ................................................... 159
Chapter 6 – Evaluating the Resilience Measurement Tool ........................................... 161
6.1 Sample and Response Rate ........................................................................... 161
6.2 Exploratory Factor Analysis ......................................................................... 168
6.2.1 Testing the Relative Overall Resilience Model ...................................... 170
6.2.1.1 3-Factor Solution ............................................................................. 170
6.2.2 Testing Adjusted Relative Overall Resilience ........................................ 171
6.2.2.1 4-Factor Solution ............................................................................. 171
6.2.2.2 5-Factor Solution ............................................................................. 173
6.2.2.3 3-Factor Solution ............................................................................. 173
6.2.2.4 2-Factor Solution ............................................................................. 173
6.3 A New Model of Organisational Resilience ................................................. 174
6.3.1 Minimisation of Silo Mentality ............................................................... 176
6.3.2 Capability & Capacity of Internal Resources ......................................... 177
6.3.3 Staff Engagement & Involvement .......................................................... 177
6.3.4 Information & Knowledge ...................................................................... 178
6.3.5 Leadership, Management & Governance Structures .............................. 179
6.3.6 Innovation & Creativity .......................................................................... 180
6.3.7 Devolved & Responsive Decision Making ............................................. 181
6.3.8 Internal & External Situation Monitoring & Reporting .......................... 181
6.3.9 Planning Strategies ................................................................................. 182
6.3.10 Participation in Exercises ........................................................................ 184
6.3.11 Proactive Posture .................................................................................... 184
6.3.12 Capability & Capacity of External Resources ........................................ 186
6.3.13 Recovery Priorities ................................................................................. 187
6.4 Evaluating Metrics of Organisational Resilience ......................................... 188
6.5 Theoretical Evaluation of the Resilience Measurement Tool ....................... 189
6.6 Additional Hypotheses Resilience ................................................................ 192
6.6.1 Resilience and Organisation Size ........................................................... 193
6.6.2 The Value of Plans .................................................................................. 194
6.6.3 Resilience and Crisis Experience ............................................................ 196
6.6.4 The Role of Exercises in Resilience ....................................................... 196
6.6.5 Resilience and Organisational Performance ........................................... 197
Chapter 7 – Evaluating the Resilience of Organisations in Auckland .......................... 201
7.1 Approaches to Resilience .............................................................................. 201
7.2 Overall Resilience in Auckland .................................................................... 207
7.2.1 Resilience Strengths in Auckland ........................................................... 208
7.2.2 Resilience Weaknesses in Auckland ....................................................... 209
7.3 Resilience of Industry Sectors in Auckland .................................................. 210
7.3.1 The Most Resilience Sector – Health and Community ........................... 210
7.3.2 The Least Resilient Sector – Wholesale Trade ....................................... 211
7.3.3 The Property and Business Services Sector ............................................ 212
7.4 Resilience of Organisations .......................................................................... 212
7.5 Crises in Auckland over the Last 5 Years ..................................................... 217
7.6 Anecdotal Evidence ...................................................................................... 218
7.7 Improving Resilience in Auckland ............................................................... 219
7.7.1 Leveraging Strengths in Auckland ......................................................... 222
7.7.2 Addressing Weaknesses in Auckland ..................................................... 223
7.8 Conclusions about the Resilience of Organisations in the Auckland Region ...................................................................................................................... 225
Chapter 8 – The Resilience Benchmarking Methodology ............................................ 227
8.1 The Development of the Resilience Benchmarking Methodology ............... 227
8.1.1 Common Elements of Benchmarking Models ........................................ 227
8.1.2 Business Continuity and Emergency Management Models ................... 228
8.1.3 Information for the Business Case for Resilience .................................. 230
8.1.4 Changes in Resilience and Resilience Maturity ..................................... 236
8.2 A Methodology for Benchmarking Organisational Resilience ..................... 238
Chapter 9 – Conclusion ................................................................................................. 243
9.1 Research Findings ......................................................................................... 243
9.1.1 A New Model of Organisational Resilience ........................................... 244
9.1.2 Organisational Resilience in Auckland ................................................... 246
9.1.3 The Business Case for Organisational Resilience .................................. 247
9.2 Research Limitations and Future Research .................................................. 248
9.2.1 Sample Size ............................................................................................. 248
9.2.2 Stratified Samples ................................................................................... 249
9.2.3 Differences in Perception of Organisational Resilience between Senior Managers and Staff ............................................................................................... 250
9.2.4 Strengthening the Planning Strategies Indicator ..................................... 250
9.2.5 Physical Infrastructure and Resources .................................................... 251
9.2.6 Confirmatory Study ................................................................................ 253
9.2.7 Relationships between Indicators ........................................................... 254
9.2.8 Longitudinal and Case Study Research .................................................. 255
9.2.9 Measures of Organisational Performance ............................................... 255
9.3.10 The Business Case for Resilience ........................................................... 256
9.3 Thesis Summary ........................................................................................... 256
References ..................................................................................................................... 259
Appendix A ................................................................................................................... 275
Appendix B ................................................................................................................... 287
Appendix C ................................................................................................................... 301
Appendix D ................................................................................................................... 323
Appendix E ................................................................................................................... 339
Appendix F ................................................................................................................... 349
Appendix G ................................................................................................................... 355

Table of Figures
Figure 2.1: The Onion Model of Crisis Management - The Nature and Impact of Organisational Culture on Crisis Management ............................................................... 20
Figure 2.2: The Genesis of Crisis ................................................................................... 21
Figure 2.3: Model of Crisis Management ....................................................................... 22
Figure 2.4: The Integrated Model of Crisis Management .............................................. 24
Figure 2.5: The DRC Typology of Organised Behaviour in Disaster ............................ 26
Figure 2.6: Organisational Performance at the Edge of Chaos ....................................... 29
Figure 2.7: The Bell-shaped Curve vs. the Power Law: The Importance of 'Fat Tails' .. 30
Figure 2.8: Post-crisis Turnaround Stages ...................................................................... 31
Figure 2.9: High Reliability Organisations ..................................................................... 34
Figure 2.10: Stress-strain State Space Analogy .............................................................. 39
Figure 2.11: Organisational Resilience as a Function of the Area under the Curve ....... 40
Figure 2.12: The Integrated Functions Model ................................................................ 41
Figure 2.13: Herringbone Resilience Model ................................................................... 42
Figure 2.14: Resilience Strategies Model ....................................................................... 43
Figure 2.15: Organisational Resilience Management System Flow Diagram ................ 45
Figure 2.16: Framework for Managing Disruption-related Risk .................................... 46
Figure 2.17: Risk Management Process ......................................................................... 47
Figure 2.18: The Relationship between Principles, Framework and Process ................. 48
Figure 2.19: The Benchmarking Wheel .......................................................................... 56
Figure 3.20: Workshop Process ...................................................................................... 65
Figure 3.21: Commitment to Resilience Audit ............................................................... 71
Figure 3.22: The Distinctions between Adaptive Capacity and Vulnerability in a Disaster Context ............................................................................................................ 100
Figure 4.23: Factor Analysis Rotation .......................................................................... 125
Figure 4.24: Variance in Principal Components Factor Analysis ................................ 128
Figure 4.25: Relative Overall Resilience Model........................................................... 130
Figure 4.26: Relative Overall Resilience Equation....................................................... 131
Figure 4.27: Adjusted Relative Overall Resilience Model ........................................... 133
Figure 4.28: Adjusted Relative Overall Resilience Equation ....................................... 133
Figure 5.29: Scale Development Process ..................................................................... 143
Figure 5.30: Process for Developing Questions to Measure the Indicators of Organisational Resilience ............................................................................................. 144
Figure 6.31: Faulty Organisational Assumptions and Beliefs ...................................... 167
Figure 6.32: Senior Managers' Reasons for Not Taking Part in the Research .............. 167
Figure 7.33: Approaches to Resilience and their Associated Strategies ....................... 206
Figure 7.34: Scores for the Indicators of Organisational Resilience for the Most Resilience Organisation ................................................................................................ 214
Figure 7.35: Scores for the Indicators of Organisational Resilience for the Least Resilient Organisation ................................................................................................... 216
Figure 7.36: Types of Crises Experienced .................................................................... 217
Figure 7.37: Severity of Crises Experienced ................................................................ 218
Figure 8.38: The Benchmarking Wheel ........................................................................ 228
Figure 8.39: The Business Continuity Management Lifecycle .................................... 229
Figure 8.40: The Progression of Resilience Maturity ................................................... 237
Figure 8.41: Resilience Benchmarking Methodology .................................................. 241
Figure 9.42: A New Model of Organisational Resilience ............................................ 245
Table of Tables
Table 1.1: Organisational Resilience and Competitive Excellence .................................. 7
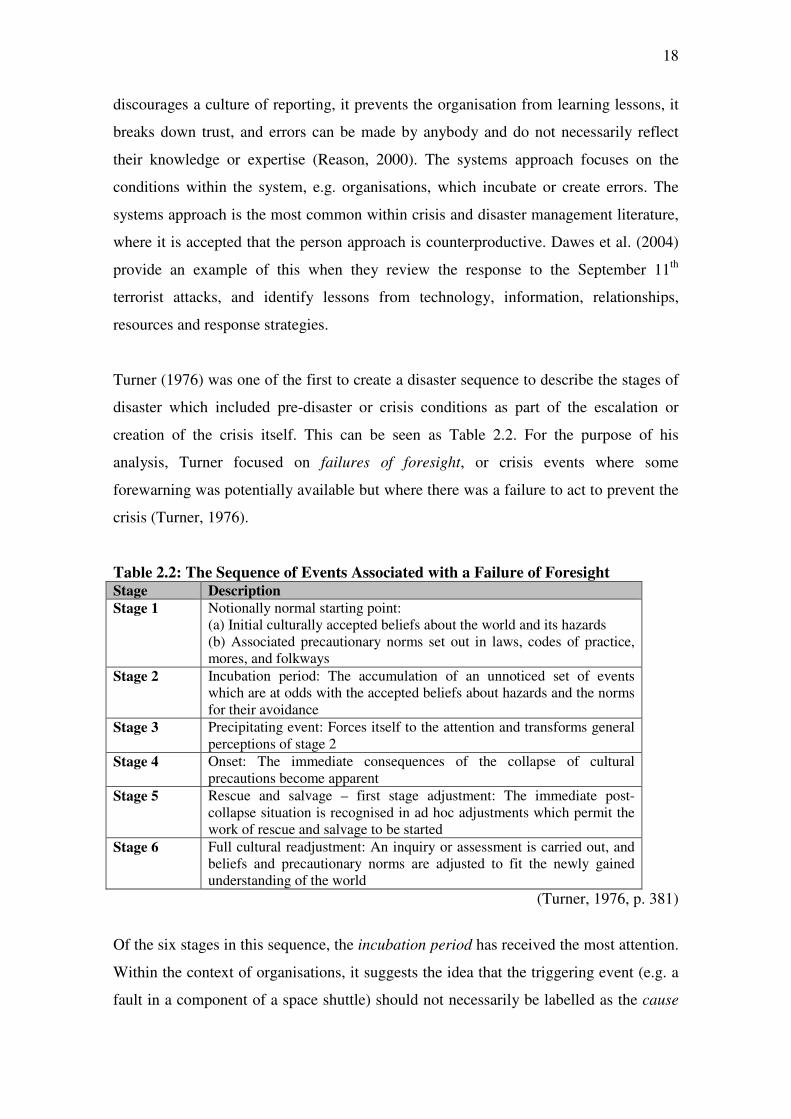
Table 2.2: The Sequence of Events Associated with a Failure of Foresight .................. 18
Table 2.3: Lengnick-Hall and Beck’s (2005) Adaptive Fit and Underlying Assumptions ........................................................................................................................................ 27
Table 2.4: Tierney's (2003) Components and Domains of Resilience ........................... 38
Table 2.5: McManus's Dimensions and Indicators of Organisational Resilience .......... 54
Table 3.6: McManus's Dimensions and Indicators of Organisational Resilience .......... 64
Table 3.7: A Summary of the Key Points from the Workshop Discussion on Each of the Dimensions of Organisational Resilience ....................................................................... 66
Table 3.8: Updated Indicators of Organisational Resilience .......................................... 68
Table 3.9: Bigley and Roberts (2001) Structuring Mechanisms .................................... 77
Table 3.10: Valle’s (2009) Characteristics of an Adaptive Culture ............................. 105
Table 3.11: Communication Challenges in the Emergency Response Identified by Manoj and Baker (2007) ............................................................................................... 108
Table 4.12: Time Taken to Complete the Survey ......................................................... 118
Table 4.13: Composition of the Veda Advantage Database by Industry Sector .......... 121
Table 4.14: The Composition of the Random Auckland Sample by Industry Sector... 123
Table 4.15: The Composition of the Random Auckland Sample by Organisation Size ...................................................................................................................................... 124
Table 4.16: McManus's Indicators and Dimensions of Organisational Resilience ...... 130
Table 4.17: Dimensions and Indicators in the Updated Model of Organisational Resilience ...................................................................................................................... 132
Table 4.18: Progress Approaching Organisations ........................................................ 141
Table 5.19: Measures of Organisational Performance .................................................. 146
Table 5.20: Pilot Study Sample .................................................................................... 150
Table 5.21: Comparison of Pilot Study Organisations' Overall Resilience Rank ........ 154
Table 6.22: Composition of Participating Organisations by Industry Sector ............... 162
Table 6.23: Composition of Participating Organisations by Organisation Size ........... 162
Table 6.24: Hierarchical Position of Individual Participants ........................................ 163
Table 6.25: KMO and Bartlett's Test of Sphericity ...................................................... 169
Table 6.26: A New Model of Organisational Resilience .............................................. 174
Table 6.27: Minimisation of Silo Mentality Items ....................................................... 176
Table 6.28: Capability & Capacity of Internal Resources Items .................................. 177
Table 6.29: Staff Engagement & Involvement Items ................................................... 178
Table 6.30: Information & Knowledge Items ............................................................... 178
Table 6.31: Leadership, Management & Governance Items ........................................ 180
Table 6.32: Innovation & Creativity Items ................................................................... 180
Table 6.33: Devolved & Responsive Decision Making Items ...................................... 181
Table 6.34: Internal & External Situation Monitoring & Reporting Items .................. 182
Table 6.35: Planning Strategies Items .......................................................................... 183
Table 6.36: Participation in Exercises Items................................................................. 184
Table 6.37: Proactive Posture Items ............................................................................. 185
Table 6.38: Capability & Capacity of External Resources Items ................................. 186
Table 6.39: Recovery Priorities Items .......................................................................... 187
Table 6.40: Reliability of the Organisational Resilience Measurement Tool ............... 189
Table 6.41: Incorporation of Adaptation and Planning in the Literature Measuring Organisational Resilience or Related Concepts ............................................................ 190
Table 6.42: Organisation Resilience and Organisation Size ......................................... 194
Table 6.43: Organisational Resilience, Having a Plan and Plan Quality...................... 195
Table 6.44: Organisational Resilience, Crisis Experience and Crisis Severity ............ 196
Table 6.45: Organisational Resilience and Participation in Exercises ......................... 197
Table 6.46: Organisational Resilience and Organisational Performance (For-profit-organisations only) ........................................................................................................ 198
Table 6.47: Organisational Resilience and Organisational Performance (Not-for-profit Organisations Only) ...................................................................................................... 200
Table 7.48: Descriptive Statistics for the Dimensions of Organisational Resilience ... 205
Table 7.49: Average Auckland Scores for the Dimensions and Indicators of Organisational Resilience ............................................................................................. 207
Table 7.50: Number of Organisations Scoring within each Score Boundary ............... 207
Table 7.51: Organisations Score for the Dimensions and Overall Resilience by Industry Sector ............................................................................................................................ 210
Table 8.52: Information Required to Make a Business Case for Resilience Investment ...................................................................................................................................... 235
Table 9.53: Number of Items Retained in the New Model ........................................... 246
Table 9.54: Planning Strategies Items .......................................................................... 251
Table 9.55: Suggested Items to Strengthen the Planning Strategies Indicator ............. 251
Table 9.56: Possible Resources and Infrastructure Items ............................................. 253
Table of Charts
Chart 1: Reasons Given for Not Taking Part ................................................................ 142
Chart 6.2: Organisational Resilience Scores by Organisation Size .............................. 193
Chart 7.3: Approaches to Resilience by Industry Sector .............................................. 202
Chart 7.4: Approaches to Resilience by Organisation Size .......................................... 203
Chart 7.5: All Organisations’ Scores for Adaptive Capacity ........................................ 204
Chart 7.6: All Organisations’ Scores for Planning ....................................................... 204
Tables of Boxes
Box 1: Definition of Resilience Ethos ............................................................................ 70
Box 2: Definition of Commitment to Resilience ............................................................ 71
Box 3: Definition of Network Perspective ..................................................................... 73
Box 4: Definition of Situation Awareness ...................................................................... 74
Box 5: Definition of Roles and Responsibilities ............................................................ 78
Box 6: Definition of Understanding and Analysis of Hazards and Consequences......... 79
Box 7: Definition of Connectivity Awareness ................................................................ 81
Box 8: Definition of Insurance Awareness ..................................................................... 82
Box 9: Definition of Recovery Priorities ........................................................................ 83
Box 10: Definition of Internal and External Situation Monitoring and Reporting ......... 85
Box 11: Definition of Informed Decision Making ......................................................... 86
Box 12: Definition of Management of Keystone Vulnerabilities ................................... 87
Box 13: Definition of Planning Strategies ...................................................................... 91
Box 14: Definition of Participation in Exercises ............................................................ 93
Box 15: Definition of Capability and Capacity of Internal Resources ........................... 94
Box 16: Definition of Capability and Capacity of External Resources .......................... 95
Box 17: Definition of Organisational Connectivity ........................................................ 97
Box 18: Definition of Robust Processes for Identifying and Analysing Vulnerabilities 98
Box 19: Definition of Staff Engagement and Involvement ............................................ 99
Box 20: Definition of Adaptive Capacity ..................................................................... 100
Box 21: Definition of Silo Mentality ............................................................................ 103
Box 22: Definition of Communications and Relationships .......................................... 104
Box 23: Definition Organisational Vision and Outcome Expectancy .......................... 106
Box 24: Definition of Information and Knowledge ...................................................... 109
Box 25: Definition of Leadership, Management and Governance Structures .............. 111
Box 26: Definition of Innovation and Creativity .......................................................... 113
Box 27: Definition of Devolved and Responsive Decision Making ............................ 114
i
Acknowledgements
Thanks to Gavin for encouraging me to apply for a scholarship that would take me to
the other side of the world for three years, thanks for being upset when you realised that
it meant I’d have to actually go to New Zealand, and thanks for following and
supporting me throughout my Ph.D. research.
Thanks to Mum and Dad who have continued to send me parcels of socks and letters
from home, and who have never said no to anything that was important to me. Thanks
for helping me get to New Zealand and thanks for giving me a reason to come home.
Thanks to Erica Seville and John Vargo who have guided me to the productive edge of
chaos on a bi-weekly basis, and who have put so much time and effort into helping me
to develop my research skills and my thesis.
Thanks to Derek Roger who was a fantastic help during the analysis of my research.
I’ve heard that it’s easy when you know how, but I would never of known how without
your help.

ii
iii
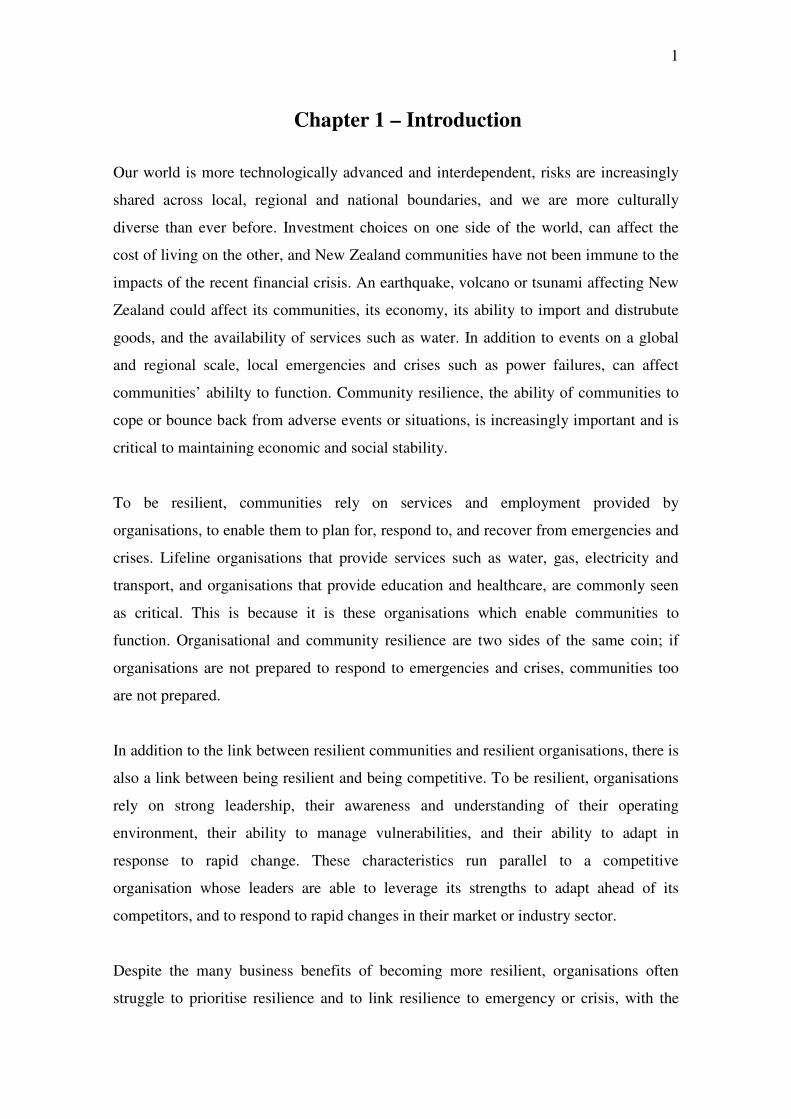
Abstract
Our world is more technologically advanced and interdependent, risks are increasingly
shared across local, regional and national boundaries and we are more culturally diverse
than ever before. As a result, communities are increasingly confronted with emergencies
and crises which challenge their social and economic stability. To be resilient,
communities rely on services and employment provided by organisations, to enable
them to plan for, respond to, and recover from emergencies and crises. However
organisational and community resilience are two sides of the same coin; if organisations
are not prepared to respond to emergencies and crises, communities too are not
prepared.
Resilient organisations are also better poised to develop competitive advantage.
However despite the potential business and performance rewards of becoming more
resilient, organisations struggle to prioritise resilience and to allocate resources to
resilience, which could be put to more immediate use. To enable organisations to invest
in their resilience, the business case for resilience must be better than the case for new
equipment or new staff.
This thesis develops a methodology and survey tool for measuring and benchmarking
organisational resilience. Previous qualitative case study research is reviewed and
operationalised as a resilience measurement tool. The tool is tested on a random sample
of Auckland organisations and factor analysis is used to further develop the instrument.
The resilience benchmarking methodology is designed to guide organisations’ use of the
resilience measurement tool and its incorporation into business-as-usual continuous
improvement.
Significant contributions of this thesis include a new model of organisational resilience,
the resilience measurement tool, and the resilience benchmarking methodology.
Together these outputs translate the concept of resilience for organisations and provide
information on resilience strengths and weaknesses that enable them to proactively
address their resilience and to develop a business case for resilience investment.

iv
1
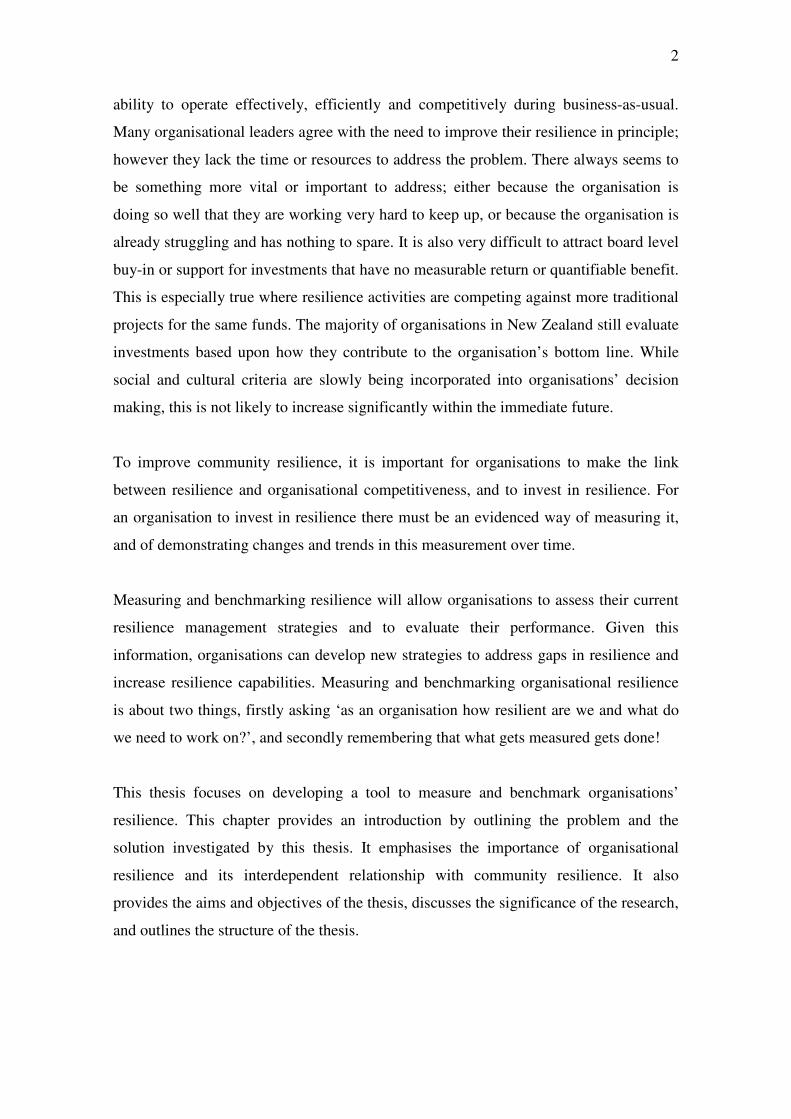
Chapter 1 – Introduction
Our world is more technologically advanced and interdependent, risks are increasingly
shared across local, regional and national boundaries, and we are more culturally
diverse than ever before. Investment choices on one side of the world, can affect the
cost of living on the other, and New Zealand communities have not been immune to the
impacts of the recent financial crisis. An earthquake, volcano or tsunami affecting New
Zealand could affect its communities, its economy, its ability to import and distrubute
goods, and the availability of services such as water. In addition to events on a global
and regional scale, local emergencies and crises such as power failures, can affect
communities’ abililty to function. Community resilience, the ability of communities to
cope or bounce back from adverse events or situations, is increasingly important and is
critical to maintaining economic and social stability.
To be resilient, communities rely on services and employment provided by
organisations, to enable them to plan for, respond to, and recover from emergencies and
crises. Lifeline organisations that provide services such as water, gas, electricity and
transport, and organisations that provide education and healthcare, are commonly seen
as critical. This is because it is these organisations which enable communities to
function. Organisational and community resilience are two sides of the same coin; if
organisations are not prepared to respond to emergencies and crises, communities too
are not prepared.
In addition to the link between resilient communities and resilient organisations, there is
also a link between being resilient and being competitive. To be resilient, organisations
rely on strong leadership, their awareness and understanding of their operating
environment, their ability to manage vulnerabilities, and their ability to adapt in
response to rapid change. These characteristics run parallel to a competitive
organisation whose leaders are able to leverage its strengths to adapt ahead of its
competitors, and to respond to rapid changes in their market or industry sector.
Despite the many business benefits of becoming more resilient, organisations often
struggle to prioritise resilience and to link resilience to emergency or crisis, with the
2
ability to operate effectively, efficiently and competitively during business-as-usual.
Many organisational leaders agree with the need to improve their resilience in principle;
however they lack the time or resources to address the problem. There always seems to
be something more vital or important to address; either because the organisation is
doing so well that they are working very hard to keep up, or because the organisation is
already struggling and has nothing to spare. It is also very difficult to attract board level
buy-in or support for investments that have no measurable return or quantifiable benefit.
This is especially true where resilience activities are competing against more traditional
projects for the same funds. The majority of organisations in New Zealand still evaluate
investments based upon how they contribute to the organisation’s bottom line. While
social and cultural criteria are slowly being incorporated into organisations’ decision
making, this is not likely to increase significantly within the immediate future.
To improve community resilience, it is important for organisations to make the link
between resilience and organisational competitiveness, and to invest in resilience. For
an organisation to invest in resilience there must be an evidenced way of measuring it,
and of demonstrating changes and trends in this measurement over time.
Measuring and benchmarking resilience will allow organisations to assess their current
resilience management strategies and to evaluate their performance. Given this
information, organisations can develop new strategies to address gaps in resilience and
increase resilience capabilities. Measuring and benchmarking organisational resilience
is about two things, firstly asking ‘as an organisation how resilient are we and what do
we need to work on?’, and secondly remembering that what gets measured gets done!
This thesis focuses on developing a tool to measure and benchmark organisations’
resilience. This chapter provides an introduction by outlining the problem and the
solution investigated by this thesis. It emphasises the importance of organisational
resilience and its interdependent relationship with community resilience. It also
provides the aims and objectives of the thesis, discusses the significance of the research,
and outlines the structure of the thesis.
3
1.1 The Importance of Organisational Resilience
Mitroff (2001, p. 29) discusses trends in crises, primarily man-made events or
situations, and notes that, the fifteen years prior to his analysis in 2001, saw a sharp
increase in the number of accidents. He goes on to attribute this to the increased
complexity of social and technological systems and argues that crises have become an
integral part of modern life. McManus et al. (2008) argue that increasing reliance on
technology and technology providers has highlighted the interconnectedness and
vulnerability inherent in such complex systems. Boin and Lagadec (2000, p. 185)
support this when they note that “Crises are becoming more complex in nature, they
are increasingly transboundary and interconnected”.
Organisational resilience is a continuously moving target which contributes to
performance during business-as-usual and crisis situations (Mitroff, 2005). It requires
organisations to adapt and to be highly reliable (Weick & Sutcliffe, 2007), and enables
them to manage disruptive challenges (Durodie, 2003). Seville et al. (2008, p. 18)
discuss organisational resilience as an organisation’s “…ability to survive, and
potentially even thrive, in times of crisis”. Organisational resilience is important for two
key reasons; firstly because community and organisational resilience are interdependent
in a complex environment (Dalziell & McManus, 2004), and secondly because being
resilient can provide organisations with competitive advantage (Parsons, 2007).
In the literature, community and organisational resilience are often addressed separately.
However, communities rely on organisations to plan for, respond to and recover from
disasters, and to provide critical services such as power, transport, healthcare, and food
and water (Chang & Chamberlin, 2003). McManus et al. (2008) argue that the resilience
of organisations directly contributes to the speed and success of community recovery
following a crisis or disaster. Buckle (2006) reflects this when he discusses
organisations as a level of social resilience. McManus et al. go on to discuss
communities’ expectations of organisations and argue,
“Consumers and communities are increasingly demanding that
organisations exhibit high reliability in the face of adversity and that
4
decision makers are able to address not only the crises that they know will
happen, but also those that they cannot foresee”.
(McManus, et al., 2008, p. 82)
In order to address community resilience, organisations must ensure that they are able to
avoid crisis where possible, to maintain essential services during a response, and to
recover operations as quickly as possible.
Coleman (2004, p. 3) examines the frequency and cost of corporate crises defined as
“…any problem or disruption which triggers negative stakeholder reactions and results
in extensive public scrutiny”, and notes that in Australia “…one in four organisations
which is impacted by a crisis does not survive” (Coleman, 2004, p. 8). Stern et al.
(2003) discuss the failure of critical infrastructure in Auckland, the major financial and
population centre of New Zealand. In February 1998, after years of industry
restructuring, all four of the main power cables supplying Auckland’s central business
district failed. While there was no formal declaration of an emergency, the outage
lasted for three weeks and affected 2000 businesses (Newlove, et al., 2003). Hiles
(2008, p. xx) notes,
“Maybe Auckland is simply unlucky. Failure of a 110KV power line in
Auckland on 12th June 2006 exposed the still fragile power grid, left 750 000
people without power and cost businesses an estimated $70 million in lost
trade”.
During this crisis, organisation size offered no protection. Hiles (2008) highlights how
the University of Auckland had to tell 24,000 staff and students to stay home, and Ports
of Auckland had to turn ships away. While the Auckland power crisis happened in
1998, 10% of the Auckland organisations that took part in this research had experienced
a power crisis in the last five years. Given the frequency and impact of these crises, and
the consequences of performing poorly, it is critical that organisations address their
resilience.
5
However crises can also present an opportunity for organisations that are resilient. Starr
et al. (2003b, p. 3) support this when they argue,
“A resilient organisation effectively aligns its strategy, operations,
management systems, governance structure, and decision-support
capabilities so that it can uncover and adjust to continually changing risks,
endure disruptions to its primary earnings drivers, and create advantages
over less adaptive competitors”.
Here Starr et al. link organisational resilience with organisations’ ability to be
competitive.
1.2 Why Measure Organisational Resilience?
Metrics for measuring and evaluating organisational resilience can contribute to four
key organisational needs:
• The need to demonstrate progress towards becoming more resilient
• The need for leading, as opposed to lagging, indicators of resilience
• The need to link improvements in organisational resilience with competitiveness
• The need to demonstrate a business case for resilience investments
In recent years, organisations have increasingly focused on their ability to respond to
crises. However, organisations often struggle to prioritise and allocate resources to
building resilience, given the difficulty of demonstrating progress or success
(Stephenson, et al., 2010). This is partly because emergency management and business
continuity programs have to compete for resources, against profit-driven activities for
which there are metrics for evaluating whether they have produced financial growth or
not (Kay, 2010). Resilience however, focuses on social and cultural factors within
organisations which are more difficult to measure and to link to financial outcomes. One
example would be the difficulty of quantifying how the cost of running an emergency
exercise affects an organisation’s resilience and their bottom line. Organisations must be
6
able to demonstrate progress towards becoming more resilient by quantifying
improvements in their resilience, and tracking changes in that measurement over time.
Flin at el. (2000) review scales developed to measure safety climate in high reliability
industries and note that in recent years, operating companies and regulators have moved
away from lagging indicators, towards leading indicators of safety. Lagging indicators
are based on retrospective data and, in the context of resilience, would measure how
resilient an organisation has been. An example of this would be looking at an
organisation’s experience of crises to describe its resilience over the last 10 years, and
then using that as a predictor of its resilience for the next 10 years. Leading indicators
measure observable processes, actions and practises which are thought to contribute to
the organisation’s resilience. An example of this would be measuring an organisation’s
ability to communicate across organisational, social and cultural boundaries as a factor
which contributes towards their resilience. Flin et al. (2000, p. 178) argue that leading
indicators,
“…may reduce the need to wait for the system to fail in order to identify
weaknesses and to take remedial actions”.
In the context of resilience, this is very important because leading indicators can provide
organisations with information on their resilience strengths and weaknesses before a
crisis happens. In a competitive environment, an organisation that is aware of its
resilience strengths is also more equipped to find opportunities out of a crisis situation
(Knight & Pretty, 1997).
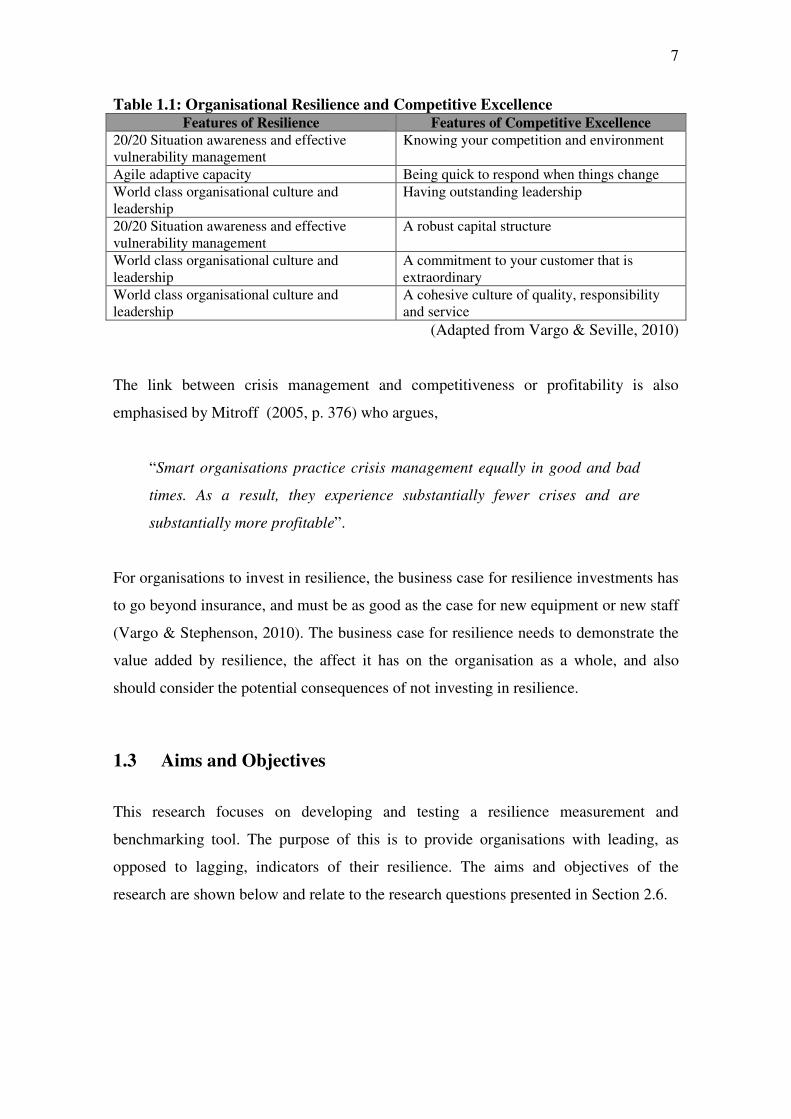
Resilient organisations can also be more competitive during business-as-usual. Vargo
and Seville (2010) discuss competitive excellence and provide Table 1.1 to illustrate the
similarities and links between competitive excellence and organisational resilience. The
comparison shows that elements of resilience and competitive excellence share many of
the same features. For example the organisation’s situation awareness, or its ability to
interpret information about its business environment and understand what that
information means for the organisation now and in the future, is very similar to its
ability to know its competition and environment.
7
Table 1.1: Organisational Resilience and Competitive Excellence Features of Resilience Features of Competitive Excellence
20/20 Situation awareness and effective vulnerability management
Knowing your competition and environment
Agile adaptive capacity Being quick to respond when things change
World class organisational culture and leadership
Having outstanding leadership
20/20 Situation awareness and effective vulnerability management
A robust capital structure
World class organisational culture and leadership
A commitment to your customer that is extraordinary
World class organisational culture and leadership
A cohesive culture of quality, responsibility and service
(Adapted from Vargo & Seville, 2010)
The link between crisis management and competitiveness or profitability is also
emphasised by Mitroff (2005, p. 376) who argues,
“Smart organisations practice crisis management equally in good and bad
times. As a result, they experience substantially fewer crises and are
substantially more profitable”.
For organisations to invest in resilience, the business case for resilience investments has
to go beyond insurance, and must be as good as the case for new equipment or new staff
(Vargo & Stephenson, 2010). The business case for resilience needs to demonstrate the
value added by resilience, the affect it has on the organisation as a whole, and also
should consider the potential consequences of not investing in resilience.
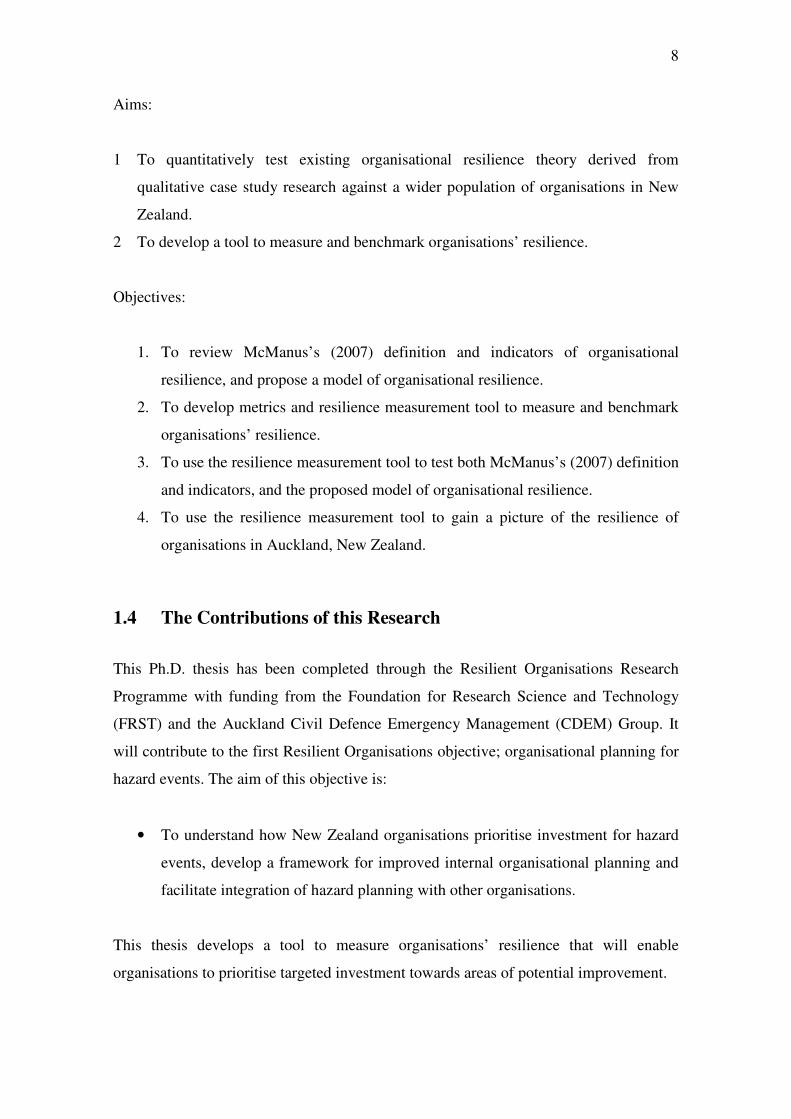
1.3 Aims and Objectives
This research focuses on developing and testing a resilience measurement and
benchmarking tool. The purpose of this is to provide organisations with leading, as
opposed to lagging, indicators of their resilience. The aims and objectives of the
research are shown below and relate to the research questions presented in Section 2.6.
8
Aims:
1 To quantitatively test existing organisational resilience theory derived from
qualitative case study research against a wider population of organisations in New
Zealand.
2 To develop a tool to measure and benchmark organisations’ resilience.
Objectives:
1. To review McManus’s (2007) definition and indicators of organisational
resilience, and propose a model of organisational resilience.
2. To develop metrics and resilience measurement tool to measure and benchmark
organisations’ resilience.
3. To use the resilience measurement tool to test both McManus’s (2007) definition
and indicators, and the proposed model of organisational resilience.
4. To use the resilience measurement tool to gain a picture of the resilience of
organisations in Auckland, New Zealand.
1.4 The Contributions of this Research
This Ph.D. thesis has been completed through the Resilient Organisations Research
Programme with funding from the Foundation for Research Science and Technology
(FRST) and the Auckland Civil Defence Emergency Management (CDEM) Group. It
will contribute to the first Resilient Organisations objective; organisational planning for
hazard events. The aim of this objective is:
• To understand how New Zealand organisations prioritise investment for hazard
events, develop a framework for improved internal organisational planning and
facilitate integration of hazard planning with other organisations.
This thesis develops a tool to measure organisations’ resilience that will enable
organisations to prioritise targeted investment towards areas of potential improvement.
9
In addition to contributing to the objectives of the Resilient Organisations Research
Programme, this thesis:
• Quantitatively tests organisational resilience theory;
• contributes to organisational resilience literature;
• provides a snap shot of the resilience of Auckland organisations;
• provides a tool for organisations to measure and compare their resilience; and
• contributes towards the business case for resilience.
This thesis reviews and tests organisational resilience theory, using data collected from
a random sample of Auckland organisations. This quantitative analysis is part of the
development of the resilience measurement tool, and integrates previous research into a
model of organisational resilience which is supported by the data. This thesis also adds
to the literature on what organisational resilience is, and identifies leading indicators
and metrics that can be used to measure it. This contrasts with current literature which
relies on a qualitative case study approach (McManus, et al., 2008), or on measuring
latent resilience (Mallak, 1998b) or resilience potential (Somers, 2009).
As part of developing the resilience measurement tool, it was tested on a sample of
Auckland organisations. The resilience results of these organisations, and the
implications for the resilience of Auckland organisations as a whole are discussed. This
thesis also presents a tool for measuring organisational resilience and a benchmarking
methodology to guide its use. This is important because it allows organisations,
regardless of size or income, to access the tool and to integrate it into their
organisational management. As a result, the tool has the potential to empower
organisations to take a more proactive stance towards managing their resilience.
This research also contributes to the business case for organisational resilience and
demonstrates a link between resilience and profitability. Recommendations for further
research to better understand this link, and how organisations can use it to link
investments in resilience with the organisation’s bottom line, are discussed.
10
1.5 Thesis Structure
Chapter 2 – Theoretical Development. This chapter presents a review of the literature
which provides the theoretical basis for this research. It includes a discussion of the key
points that have been developed to form the hypotheses and models that are tested, and
also presents the research questions.
Chapter 3 – Identifying the Indicators of Organisational Resilience. This chapter
presents a review of McManus’ (2007) model of Relative Overall Resilience (ROR)
which is used as the starting point for this thesis. It also discusses a workshop which
was used as part of a review to update the indicators of organisational resilience.
Chapter 4 – Thesis Methodology. This research uses survey methodology to test a
model and tool for measuring organisational resilience. This chapter discusses the
methods used and also presents the hypothesised models, based on McManus’ (2007)
Relative Overall Resilience model, and an Adjusted Relative Overall Resilience model,
which are tested through this thesis.
Chapter 5 – Scale Development. This chapter discusses the development of the
resilience measurement tool including the generation of survey items or questions, and
the pilot study which was used as a pre-test for the tool.
Chapter 6 – Evaluating the Resilience Measurement Tool. This chapter presents the
results and analysis for the test of the resilience measurement tool. The reliability and
validity of the tool are discussed.
Chapter 7 – Evaluating the Resilience of Organisations in Auckland. This chapter uses
the data gathered through the resilience measurement tool, to evaluate the resilience of
the Auckland organisations that took part in the research. Results are discussed in
relation to the resilience of the community of organisations that took part, and the
various industry sectors represented. The highest and lowest scoring organisations, as
well as the industry sector achieving the highest response rate, are also presented as case
studies to demonstrate the detail achieved through the tool.
11
Chapter 8 – The Resilience Benchmarking Methodology. This chapter presents the
benchmarking methodology which has been developed through this thesis to guide the
application and use of the resilience measurement tool.
Chapter 9 – Conclusion. This chapter summarises the research findings, answers the
research questions, discusses the limitations of the research, and provides suggestions
for future research.

12
13
Chapter 2 – Theoretical Development
This thesis takes a systems approach towards organisational resilience, and integrates
literature from crisis management and high reliability organisation theory. It also
considers literature on organisational management and performance, organisational
culture and business continuity.
The literature is introduced by considering how crisis management literature, which is
based on the study of industrial accidents, can be applied to organisations. This
literature is reviewed in relation to how crises develop within organisations and how
organisations respond to crisis, change and uncertainty. As part of the discussion, a
number of disaster and crisis models are reviewed. The purpose of discussing these
models is to provide a background of current theory on how organisations and their
environment interact, before, during and after crises and emergencies.
The discussion of organisational resilience defines resilience and introduces the concept
of high reliability organisations (HROs). It also discusses whether HRO theory, based
on the study of organisations such as air traffic control and nuclear submarines, is
applicable to other organisations. The relationship between organisational resilience and
organisational performance, excellence and competitiveness are also discussed.
Standards relating to organisational resilience, risk management and business continuity
are reviewed to identify any aspects which are applicable to the resilience measurement
tool developed through this thesis.
Previous research, which focuses on measuring organisational resilience, is reviewed to
identify potential indicators and metrics for this study. Types and uses of benchmarking
are discussed in the context of the methods used in this thesis, and also as part of the
methodology developed through this thesis, for the continued use of the resilience
measurement tool by organisations.
The literature review in this chapter is concluded with a discussion of anticipation vs.
resilience which is a central theme that runs through the literature and is relevant to the
final results of this thesis.
14
The research questions, presented in Section 2.6, follow on from the literature review,
and link into the aims and objectives discussed in Section 1.3. They provide direction
for the thesis and outline what the thesis sets out to achieve.
2.1 The Exploration of Organisations through Crisis Literature
This section defines crisis and crisis management, and discusses the applicability of
crisis management theory to this thesis. This provides a context for the remainder of the
literature review, and its integration into a discussion of organisational resilience.
There are many different definitions of crisis, but the term is most often used in relation
to political and organisational crises. Boin and McConnell (2007) discuss events or
situations of change and uncertainty affecting organisations on a variety of scales;
emergencies, crises, disasters and catastrophes. They characterise crises as threats to the
core values of the system, under conditions of deep-routed uncertainty and rapid change
that require rapid action (Boin & McConnell, 2007). Shrivastava et al. (1988) offer the
most appropriate definition in the context of organisational resilience; they define crises
as,
“…organisationally-based disasters which cause extensive damage and
social disruption, involve multiple stakeholders, and unfold through
complex technological, organisational and social processes”.
(Shrivastava, et al., 1988, p. 285)
This definition implies that crises are large-scale events, however other authors
recognise that crises are often created by the accumulation of smaller events or cascade
failures (Turner, 1976). Despite the negative connotations of organisational crises
presented by most definitions, Smith (1990, p. 266) argues that “…organisations can
have a “successful” crisis which helps to improve the overall performance of the
enterprise”.
15
Pearson and Clair (1998, p. 61) define crisis management as,
“…a systematic attempt by organisational members with external
stakeholders to avert crises or to effectively manage those that do occur”.
Here, Pearson and Clair suggest that crisis management is systematic, involves external
stakeholders, and accept that it is impossible to avoid or prevent all crises. In addition
Mitroff (2001) notes that increased globalisation and competitiveness is driving the
emergence of new organisational forms and types. These organisations are characterised
by the ability to adapt to a rapidly changing competitive environment, a characteristic
which is increasingly incorporated into discussions of crisis management (Mitroff,
2001) and resilience (Woods & Wreathall, 2008).
Crisis management theory is traditionally based on studies of industrial accidents such
as the Challenger and Columbia space shuttles and Bhopal (Stead & Smallman, 1999).
However, since this time, crisis management principles have also been applied to other
types of organisational failure. When discussing the applicability of crisis management
theory to business failure, Stead and Smallman (1999, p. 13) provide an example of this
and note “Understanding financial crises using industrial crisis theory and analytical
tools has been shown to be possible and effective”. Here Stead and Smallman suggest
that crisis management theory can be used to explore other types of organisational
failure such as financial crisis.
Hills (2000) reviews the place of resilience as a tool in crisis management, and
discusses resilience as a quality or characteristic displayed by an organisation in
response to change or pressure. As a result of this view, he links resilience and crisis
management, and suggests that resilience is an outcome or goal, and that crisis
management is a strategy or tool which organisations can use to achieve it.
In the context of this thesis, crisis management theory and literature provides a
framework against which organisational resilience, and the interaction between
organisations and their environment, can be discussed. In line with the use of crisis
management theory, organisations are viewed as systems.
16
2.1.1 Systems Thinking and Theory
This section introduces the concept of systems thinking, and how it relates to
organisational resilience. An understanding of systems thinking is important for this
research, because it underpins the majority of the literature that is reviewed as well as
the way that resilience is discussed in this thesis.
Crisis management and organisational resilience are dominated by systems thinking and
a general systems approach (Stead & Smallman, 1999). Systems’ thinking involves
viewing organisations and groups as though they were systems, made up of
components, which together have a value which is more than just the sum of their parts.
Examples of the application of systems theory to the field of resilience and crisis
management include Coles’ (2003) systems based discussion of UK national
vulnerability, and Comfort et al.’s (2001) discussion of risks emerging from the
interaction between private and non-profit organisations.
In the context of organisational resilience, systems’ thinking is useful because it
considers the relationships between components as a potential source of failure or
alternatively strength. In particular, the speed of impact of the relationships between
components and the critical path of relationships between components for the system to
function are important. Two of the key concepts within systems thinking are complexity
and coupling which refer to the speed of the relationship between component parts.
Perrow (1999) discusses the concept of coupling, and notes that systems can be tightly
or loosely coupled. In tightly coupled systems there is no buffer or gap between
components – a change in one will immediately cause a change in another. Perrow
(1999, p. 93) discusses the sequence of events in a tightly coupled system and argues
that “B must follow A, because that is the only way to make the product”. An example of
a tightly coupled system could be a dam, chemical plant or power grid.
In loosely coupled systems there is a buffer or gap between components. A change in
one component may still cause a change in another, but it will not be immediate
(Perrow, 1999). An example of a loosely coupled system would be a university; there is
more than one way to achieve an outcome and feedback is slow (Weick, 1976). The
17
concept of coupling is important for organisational resilience, because it describes the
connectivity and responsiveness between the organisation and its environment.
The concepts of linear vs. complex systems are also important in systems thinking.
Perrow discusses systems in which interactions can be either linear - “…those in
expected and familiar…sequence, and those that are quite visible even if unplanned”
(Perrow, 1999, p. 78), or complex - “…those of unfamiliar sequences, or unplanned and
unexpected sequences, and either not visible or not immediately comprehensible”
(Perrow, 1999, p. 78). An example of a linear system would be a production line where
each step had to be completed in a sequential order. An example of a complex system
would be a production line where not all processes were essential, and the sequence was
flexible. The concept of complexity is important for organisational resilience, because
complex systems can produce problems as a result of their complexity. However, they
can also produce redundancy, which can increase resilience. In contrast, linear systems
can be more predictable, but they lack flexibility.
Zhichang (2007) discusses the difficulties of applying systems thinking to human social
systems e.g. organisations. He argues that the role of managers creates a paradox; on
one side they are human and are part of the system, on the other they have to stand
outside of the system to be able to understand it. This problem is particularly apparent
during scenario building and risk identification.
2.2 The Organisational Development of Crises
This section discusses how crises develop within organisations. This literature is
introduced by considering whether crises are caused by human error or interaction, or
by the design of organisations (or systems) themselves. Five models or sequences of
crisis generation are presented and reviewed, each representing a different approach to
organisational crises. The contribution of each model to this thesis is discussed.
Reason (2000) introduces two approaches to the accident or crisis causation problem;
person and system. The person approach focuses on the errors of individuals and
attributing blame. Reason observes several problems with the person approach; it
18
discourages a culture of reporting, it prevents the organisation from learning lessons, it
breaks down trust, and errors can be made by anybody and do not necessarily reflect
their knowledge or expertise (Reason, 2000). The systems approach focuses on the
conditions within the system, e.g. organisations, which incubate or create errors. The
systems approach is the most common within crisis and disaster management literature,
where it is accepted that the person approach is counterproductive. Dawes et al. (2004)
provide an example of this when they review the response to the September 11th
terrorist attacks, and identify lessons from technology, information, relationships,
resources and response strategies.
Turner (1976) was one of the first to create a disaster sequence to describe the stages of
disaster which included pre-disaster or crisis conditions as part of the escalation or
creation of the crisis itself. This can be seen as Table 2.2. For the purpose of his
analysis, Turner focused on failures of foresight, or crisis events where some
forewarning was potentially available but where there was a failure to act to prevent the
crisis (Turner, 1976).
Table 2.2: The Sequence of Events Associated with a Failure of Foresight Stage Description
Stage 1 Notionally normal starting point: (a) Initial culturally accepted beliefs about the world and its hazards (b) Associated precautionary norms set out in laws, codes of practice, mores, and folkways
Stage 2 Incubation period: The accumulation of an unnoticed set of events which are at odds with the accepted beliefs about hazards and the norms for their avoidance
Stage 3 Precipitating event: Forces itself to the attention and transforms general perceptions of stage 2
Stage 4 Onset: The immediate consequences of the collapse of cultural precautions become apparent
Stage 5 Rescue and salvage – first stage adjustment: The immediate post-collapse situation is recognised in ad hoc adjustments which permit the work of rescue and salvage to be started
Stage 6 Full cultural readjustment: An inquiry or assessment is carried out, and beliefs and precautionary norms are adjusted to fit the newly gained understanding of the world
(Turner, 1976, p. 381)
Of the six stages in this sequence, the incubation period has received the most attention.
Within the context of organisations, it suggests the idea that the triggering event (e.g. a
fault in a component of a space shuttle) should not necessarily be labelled as the cause
19
of a disaster or crisis. This is revisited by Smith (1990) who argues that managerial style
and organisational culture often promulgate crises.
In his seminal publication Man-made Disasters, Turner (1978) discusses an ill-
structured problem, as a complex problem which needs to be managed by a variety of
groups across organisational boundaries, because no one individual or organisation has
a big enough picture (Turner, 1978). Using this idea, Turner (1978) suggests that the
interaction between social and technical systems could provide a platform for the
incubation of crisis.
The incubation of crisis is also the stage of Turner’s (1976) sequence where resilience is
most important. This is highlighted by Turner and Toft (2006) when they extend
Turner’s original discussion with ideas of organisational learning. Traditionally,
resilient characteristics are more visible in the response phase (Dynes & Quarantelli,
1986); described in Turner’s model as stages 5 and 6. However, resilience is not
necessarily only a reactive approach, it can also be proactive. Organisations must use
their awareness and understanding of the situation to continuously jump ahead of their
current performance curve. This then fits into the incubation of crisis stage because an
awareness and understanding of the situation and potential consequences could prevent
the accumulation of unnoticed events (Turner, 1976).
Mitroff et al. (1989) explore the effects of corporate culture on crisis management. They
argue that organisational culture is the most influential factor on crisis management, and
present this argument using the model seen as Figure 2.1. In this model, core
organisational identity represents factors including self-centeredness, defensive
mechanisms, and fatalism or passivity. The organisational assumptions layer represents
those assumptions that can make organisations vulnerable to crises, e.g. large
organisations sometimes feel that an organisation of their size could recover from any
crisis (Mitroff, et al., 1989). The organisational structure and the organisation’s plans,
actions and behaviours layers, represent the aspects of organisational culture which are
most visible. Factors of this include crisis management structures, flexibility, roles and
responsibilities, resources cohesion and surveillance (Mitroff, et al., 1989).
20
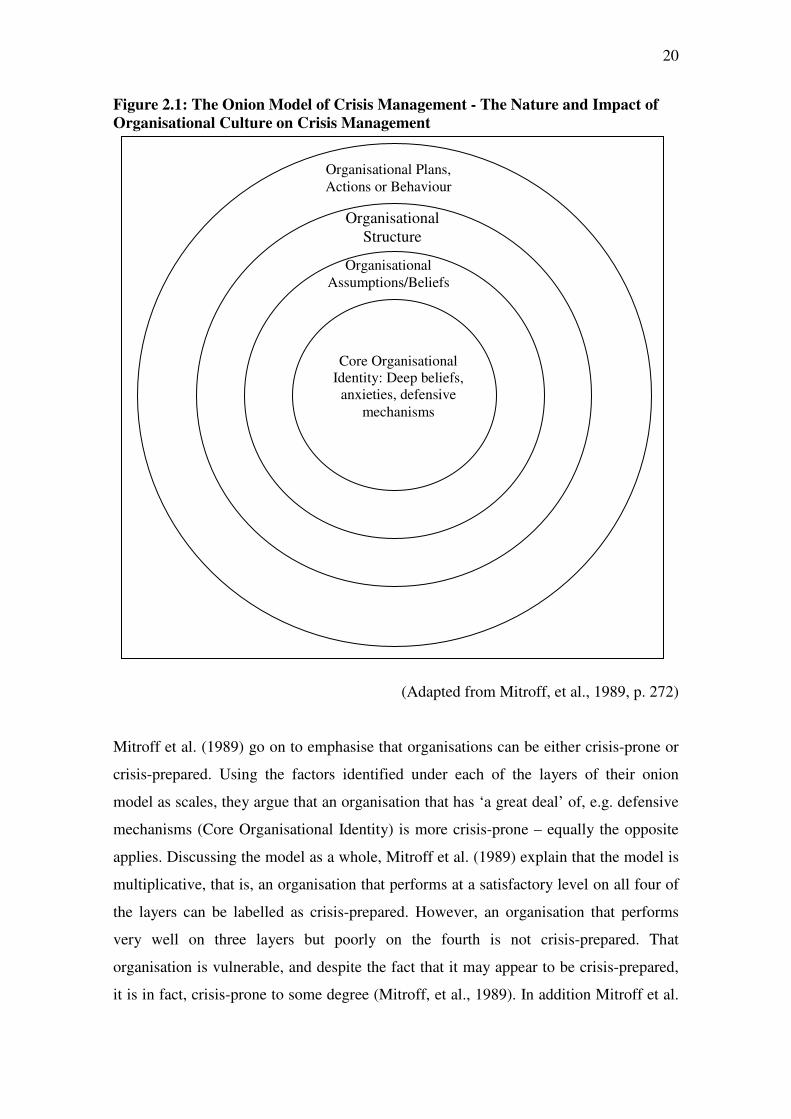
Figure 2.1: The Onion Model of Crisis Management - The Nature and Impact of
Organisational Culture on Crisis Management
(Adapted from Mitroff, et al., 1989, p. 272)
Mitroff et al. (1989) go on to emphasise that organisations can be either crisis-prone or
crisis-prepared. Using the factors identified under each of the layers of their onion
model as scales, they argue that an organisation that has ‘a great deal’ of, e.g. defensive
mechanisms (Core Organisational Identity) is more crisis-prone – equally the opposite
applies. Discussing the model as a whole, Mitroff et al. (1989) explain that the model is
multiplicative, that is, an organisation that performs at a satisfactory level on all four of
the layers can be labelled as crisis-prepared. However, an organisation that performs
very well on three layers but poorly on the fourth is not crisis-prepared. That
organisation is vulnerable, and despite the fact that it may appear to be crisis-prepared,
it is in fact, crisis-prone to some degree (Mitroff, et al., 1989). In addition Mitroff et al.
Core Organisational Identity: Deep beliefs,
anxieties, defensive
mechanisms
Organisational Assumptions/Beliefs
Organisational Structure
Organisational Plans, Actions or Behaviour
21
(1989) suggest a hierarchy of influence between the layers (from the inside out) when
they argue that good performance on the outer three layers, will not produce a crisis-
prepared organisation unless it also performs well on the core beliefs layer.
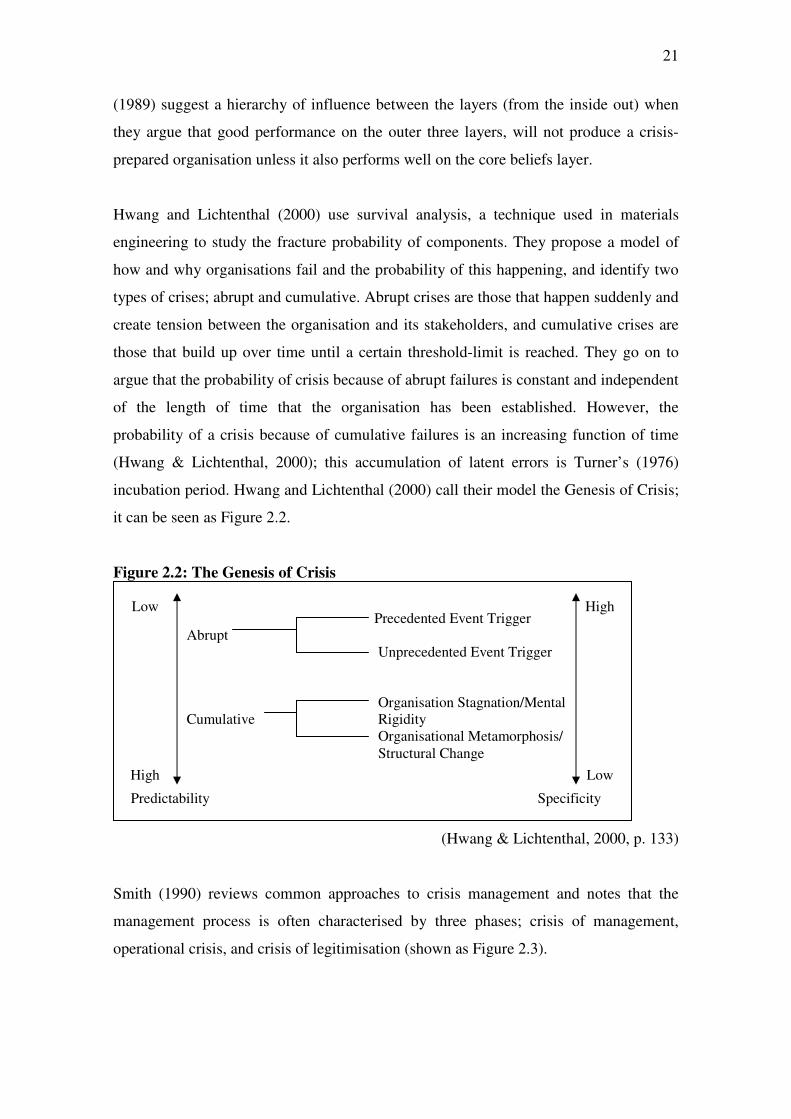
Hwang and Lichtenthal (2000) use survival analysis, a technique used in materials
engineering to study the fracture probability of components. They propose a model of
how and why organisations fail and the probability of this happening, and identify two
types of crises; abrupt and cumulative. Abrupt crises are those that happen suddenly and
create tension between the organisation and its stakeholders, and cumulative crises are
those that build up over time until a certain threshold-limit is reached. They go on to
argue that the probability of crisis because of abrupt failures is constant and independent
of the length of time that the organisation has been established. However, the
probability of a crisis because of cumulative failures is an increasing function of time
(Hwang & Lichtenthal, 2000); this accumulation of latent errors is Turner’s (1976)
incubation period. Hwang and Lichtenthal (2000) call their model the Genesis of Crisis;
it can be seen as Figure 2.2.
Figure 2.2: The Genesis of Crisis
(Hwang & Lichtenthal, 2000, p. 133)
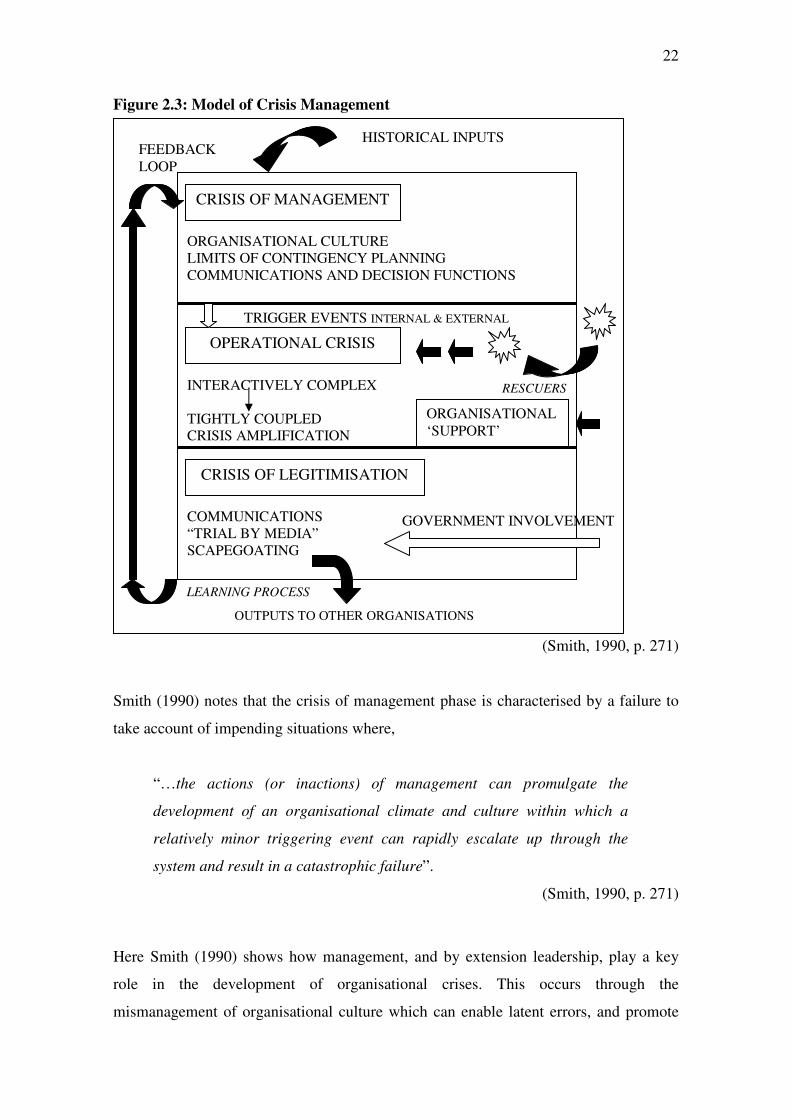
Smith (1990) reviews common approaches to crisis management and notes that the
management process is often characterised by three phases; crisis of management,
operational crisis, and crisis of legitimisation (shown as Figure 2.3).
Low
High
High
Low
Precedented Event Trigger Abrupt Unprecedented Event Trigger Organisation Stagnation/Mental Cumulative Rigidity Organisational Metamorphosis/ Structural Change
Predictability Specificity
22
Figure 2.3: Model of Crisis Management
(Smith, 1990, p. 271)
Smith (1990) notes that the crisis of management phase is characterised by a failure to
take account of impending situations where,
“…the actions (or inactions) of management can promulgate the
development of an organisational climate and culture within which a
relatively minor triggering event can rapidly escalate up through the
system and result in a catastrophic failure”.
(Smith, 1990, p. 271)
Here Smith (1990) shows how management, and by extension leadership, play a key
role in the development of organisational crises. This occurs through the
mismanagement of organisational culture which can enable latent errors, and promote
HISTORICAL INPUTS FEEDBACK LOOP
TRIGGER EVENTS INTERNAL & EXTERNAL INTERACTIVELY COMPLEX TIGHTLY COUPLED CRISIS AMPLIFICATION
ORGANISATIONAL CULTURE LIMITS OF CONTINGENCY PLANNING COMMUNICATIONS AND DECISION FUNCTIONS
COMMUNICATIONS “TRIAL BY MEDIA” SCAPEGOATING
CRISIS OF MANAGEMENT
OPERATIONAL CRISIS
CRISIS OF LEGITIMISATION
ORGANISATIONAL ‘SUPPORT’
LEARNING PROCESS
OUTPUTS TO OTHER ORGANISATIONS
GOVERNMENT INVOLVEMENT
RESCUERS
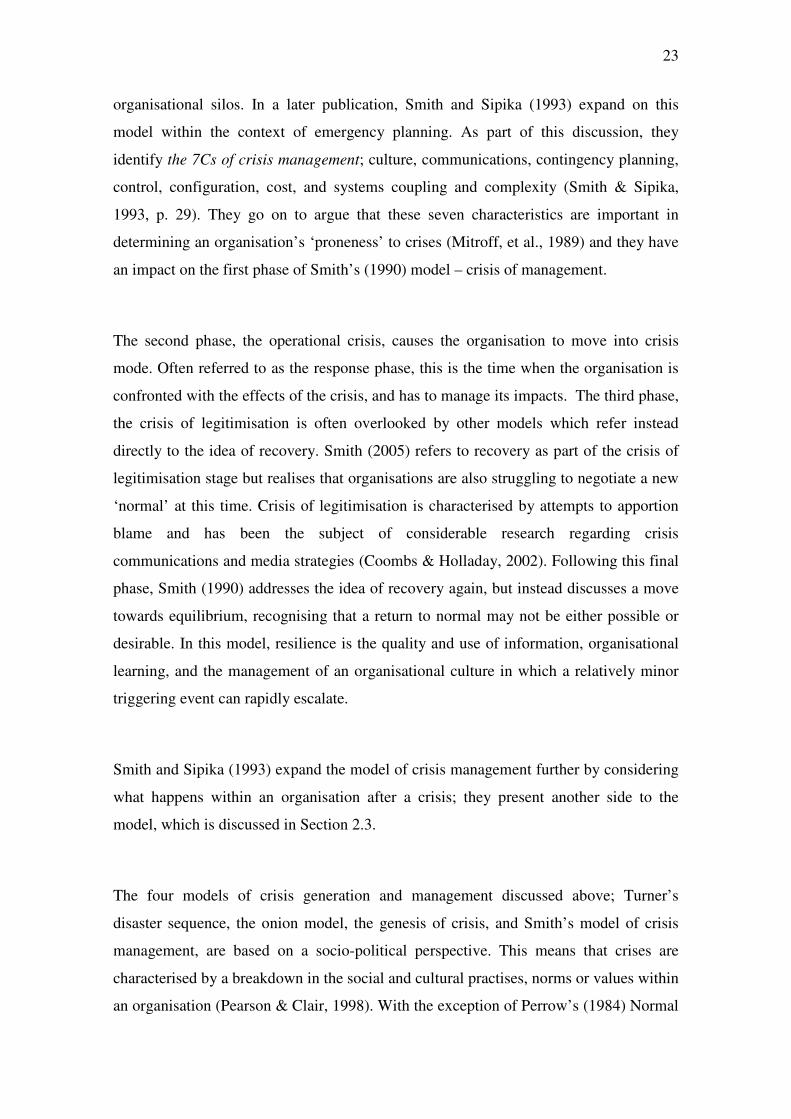
23
organisational silos. In a later publication, Smith and Sipika (1993) expand on this
model within the context of emergency planning. As part of this discussion, they
identify the 7Cs of crisis management; culture, communications, contingency planning,
control, configuration, cost, and systems coupling and complexity (Smith & Sipika,
1993, p. 29). They go on to argue that these seven characteristics are important in
determining an organisation’s ‘proneness’ to crises (Mitroff, et al., 1989) and they have
an impact on the first phase of Smith’s (1990) model – crisis of management.
The second phase, the operational crisis, causes the organisation to move into crisis
mode. Often referred to as the response phase, this is the time when the organisation is
confronted with the effects of the crisis, and has to manage its impacts. The third phase,
the crisis of legitimisation is often overlooked by other models which refer instead
directly to the idea of recovery. Smith (2005) refers to recovery as part of the crisis of
legitimisation stage but realises that organisations are also struggling to negotiate a new
‘normal’ at this time. Crisis of legitimisation is characterised by attempts to apportion
blame and has been the subject of considerable research regarding crisis
communications and media strategies (Coombs & Holladay, 2002). Following this final
phase, Smith (1990) addresses the idea of recovery again, but instead discusses a move
towards equilibrium, recognising that a return to normal may not be either possible or
desirable. In this model, resilience is the quality and use of information, organisational
learning, and the management of an organisational culture in which a relatively minor
triggering event can rapidly escalate.
Smith and Sipika (1993) expand the model of crisis management further by considering
what happens within an organisation after a crisis; they present another side to the
model, which is discussed in Section 2.3.
The four models of crisis generation and management discussed above; Turner’s
disaster sequence, the onion model, the genesis of crisis, and Smith’s model of crisis
management, are based on a socio-political perspective. This means that crises are
characterised by a breakdown in the social and cultural practises, norms or values within
an organisation (Pearson & Clair, 1998). With the exception of Perrow’s (1984) Normal
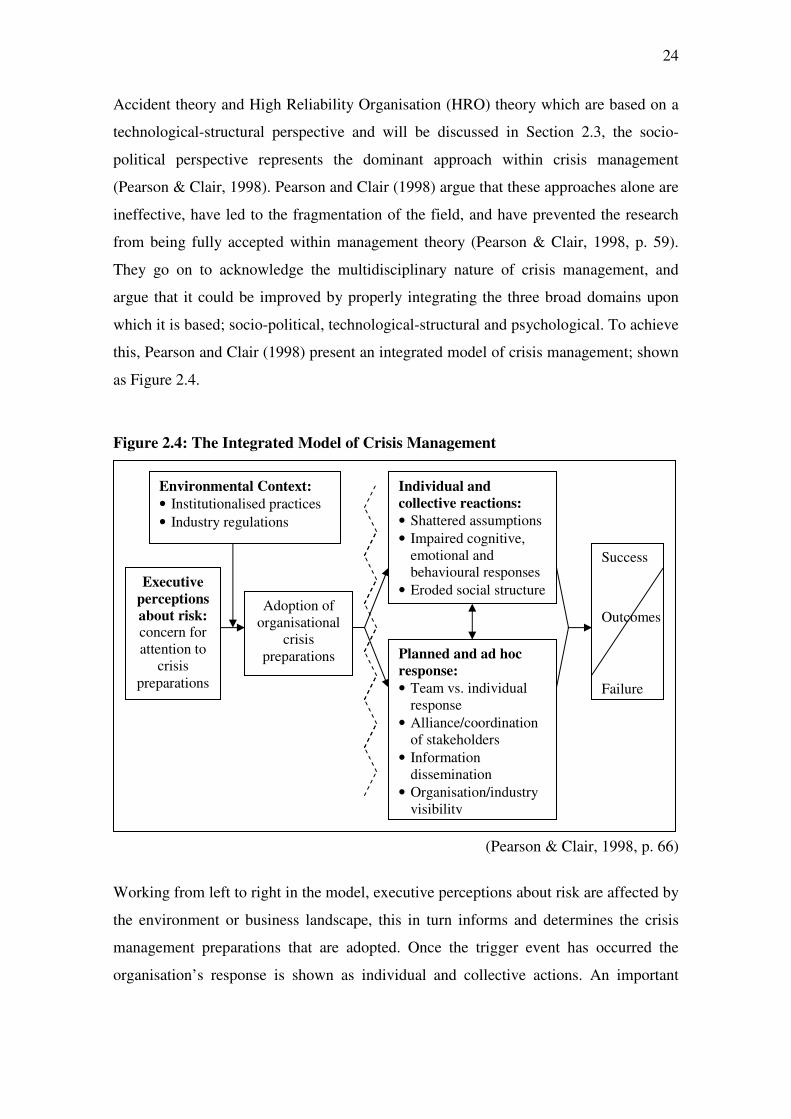
24
Accident theory and High Reliability Organisation (HRO) theory which are based on a
technological-structural perspective and will be discussed in Section 2.3, the socio-
political perspective represents the dominant approach within crisis management
(Pearson & Clair, 1998). Pearson and Clair (1998) argue that these approaches alone are
ineffective, have led to the fragmentation of the field, and have prevented the research
from being fully accepted within management theory (Pearson & Clair, 1998, p. 59).
They go on to acknowledge the multidisciplinary nature of crisis management, and
argue that it could be improved by properly integrating the three broad domains upon
which it is based; socio-political, technological-structural and psychological. To achieve
this, Pearson and Clair (1998) present an integrated model of crisis management; shown
as Figure 2.4.
Figure 2.4: The Integrated Model of Crisis Management
(Pearson & Clair, 1998, p. 66)
Working from left to right in the model, executive perceptions about risk are affected by
the environment or business landscape, this in turn informs and determines the crisis
management preparations that are adopted. Once the trigger event has occurred the
organisation’s response is shown as individual and collective actions. An important
Executive
perceptions
about risk: concern for attention to
crisis preparations
Adoption of organisational
crisis preparations
Environmental Context:
• Institutionalised practices
• Industry regulations
Individual and
collective reactions:
• Shattered assumptions
• Impaired cognitive, emotional and behavioural responses
• Eroded social structure
Planned and ad hoc
response:
• Team vs. individual response
• Alliance/coordination of stakeholders
• Information dissemination
• Organisation/industry visibility
Outcomes
Success
Failure
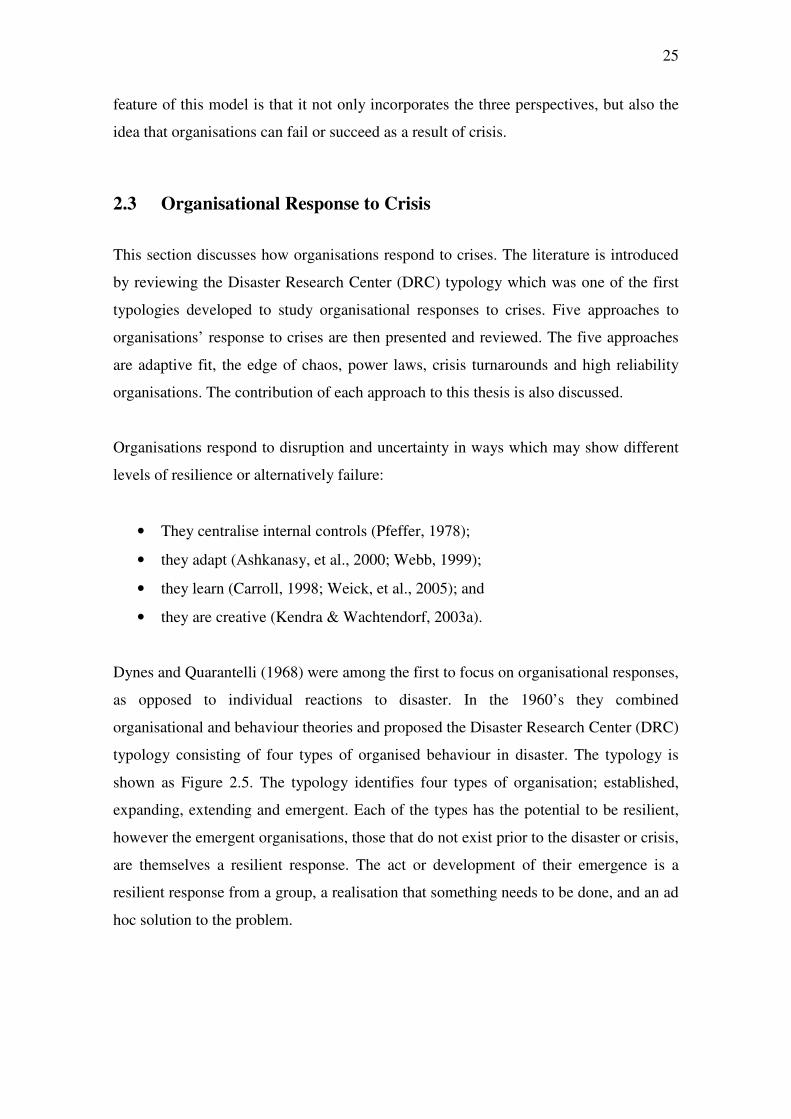
25
feature of this model is that it not only incorporates the three perspectives, but also the
idea that organisations can fail or succeed as a result of crisis.
2.3 Organisational Response to Crisis
This section discusses how organisations respond to crises. The literature is introduced
by reviewing the Disaster Research Center (DRC) typology which was one of the first
typologies developed to study organisational responses to crises. Five approaches to
organisations’ response to crises are then presented and reviewed. The five approaches
are adaptive fit, the edge of chaos, power laws, crisis turnarounds and high reliability
organisations. The contribution of each approach to this thesis is also discussed.
Organisations respond to disruption and uncertainty in ways which may show different
levels of resilience or alternatively failure:
• They centralise internal controls (Pfeffer, 1978);
• they adapt (Ashkanasy, et al., 2000; Webb, 1999);
• they learn (Carroll, 1998; Weick, et al., 2005); and
• they are creative (Kendra & Wachtendorf, 2003a).
Dynes and Quarantelli (1968) were among the first to focus on organisational responses,
as opposed to individual reactions to disaster. In the 1960’s they combined
organisational and behaviour theories and proposed the Disaster Research Center (DRC)
typology consisting of four types of organised behaviour in disaster. The typology is
shown as Figure 2.5. The typology identifies four types of organisation; established,
expanding, extending and emergent. Each of the types has the potential to be resilient,
however the emergent organisations, those that do not exist prior to the disaster or crisis,
are themselves a resilient response. The act or development of their emergence is a
resilient response from a group, a realisation that something needs to be done, and an ad
hoc solution to the problem.
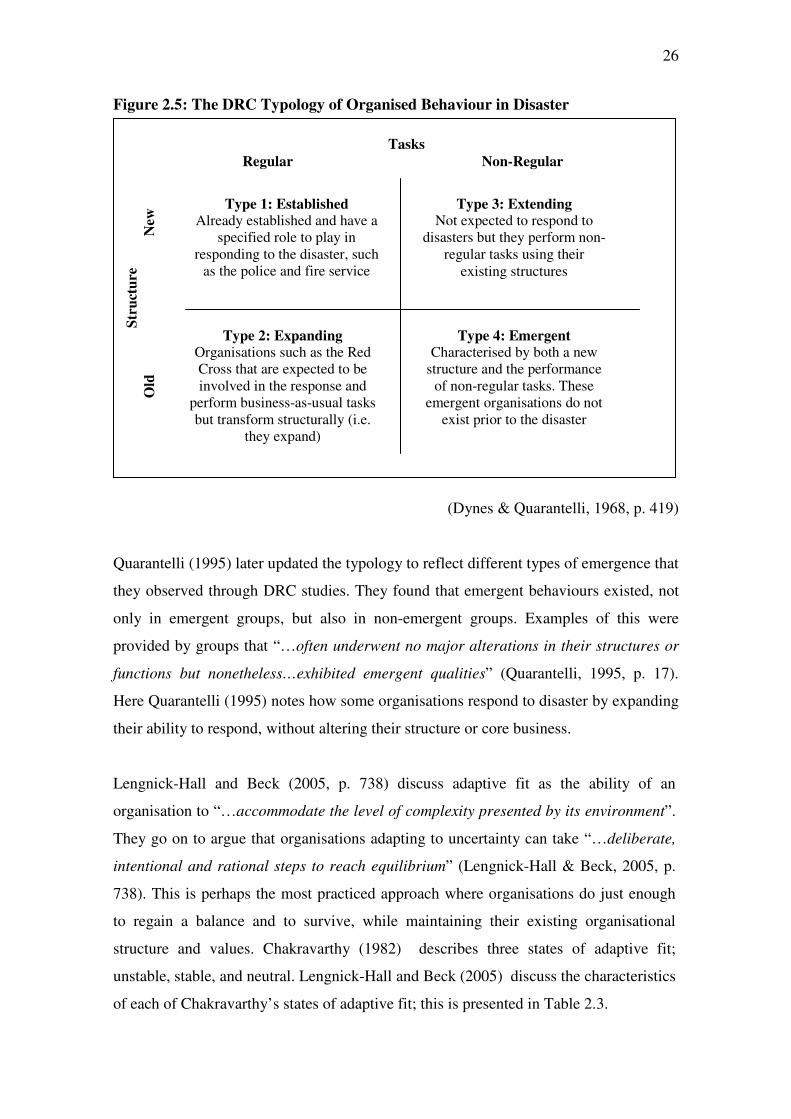
26
Figure 2.5: The DRC Typology of Organised Behaviour in Disaster
(Dynes & Quarantelli, 1968, p. 419)
Quarantelli (1995) later updated the typology to reflect different types of emergence that
they observed through DRC studies. They found that emergent behaviours existed, not
only in emergent groups, but also in non-emergent groups. Examples of this were
provided by groups that “…often underwent no major alterations in their structures or
functions but nonetheless…exhibited emergent qualities” (Quarantelli, 1995, p. 17).
Here Quarantelli (1995) notes how some organisations respond to disaster by expanding
their ability to respond, without altering their structure or core business.
Lengnick-Hall and Beck (2005, p. 738) discuss adaptive fit as the ability of an
organisation to “…accommodate the level of complexity presented by its environment”.
They go on to argue that organisations adapting to uncertainty can take “…deliberate,
intentional and rational steps to reach equilibrium” (Lengnick-Hall & Beck, 2005, p.
738). This is perhaps the most practiced approach where organisations do just enough
to regain a balance and to survive, while maintaining their existing organisational
structure and values. Chakravarthy (1982) describes three states of adaptive fit;
unstable, stable, and neutral. Lengnick-Hall and Beck (2005) discuss the characteristics
of each of Chakravarthy’s states of adaptive fit; this is presented in Table 2.3.
Type 1: Established Already established and have a
specified role to play in responding to the disaster, such
as the police and fire service
Type 3: Extending Not expected to respond to
disasters but they perform non-regular tasks using their
existing structures
Type 2: Expanding Organisations such as the Red Cross that are expected to be involved in the response and
perform business-as-usual tasks but transform structurally (i.e.
they expand)
Type 4: Emergent Characterised by both a new
structure and the performance of non-regular tasks. These
emergent organisations do not exist prior to the disaster
Tasks
Regular Non-Regular
Str
uct
ure
Old
N
ew
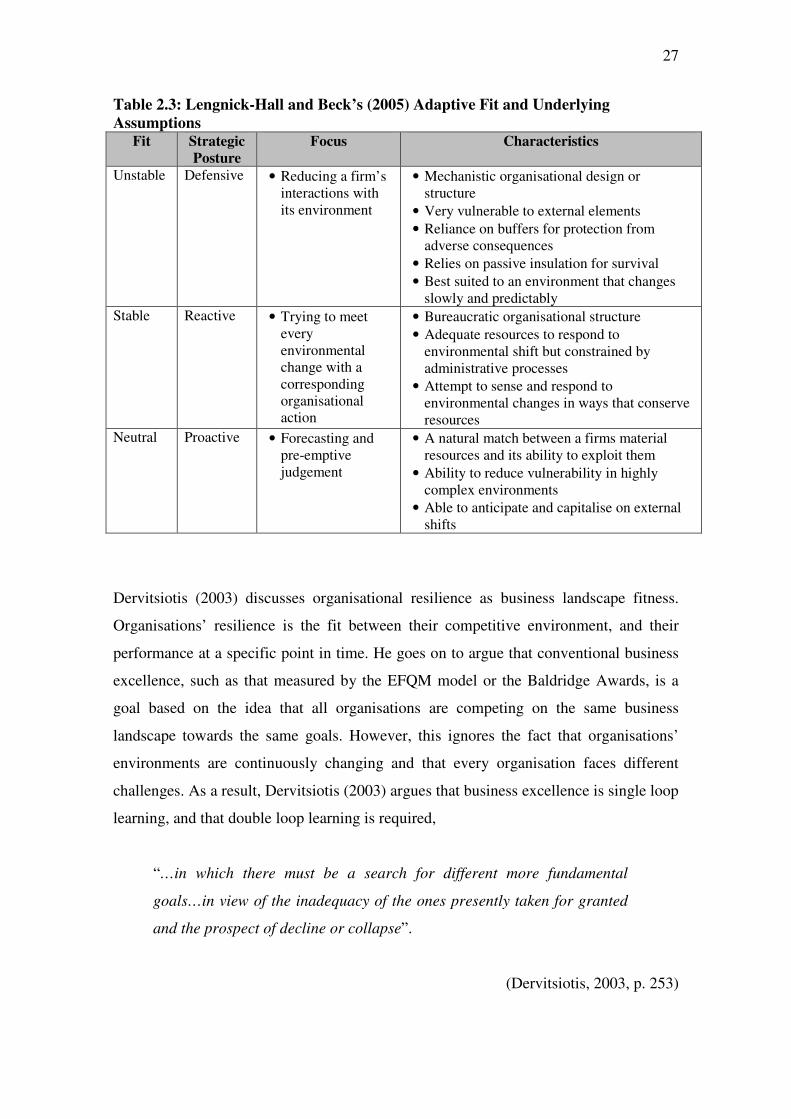
27
Table 2.3: Lengnick-Hall and Beck’s (2005) Adaptive Fit and Underlying
Assumptions Fit Strategic
Posture
Focus Characteristics
Unstable Defensive • Reducing a firm’s interactions with its environment
• Mechanistic organisational design or structure
• Very vulnerable to external elements
• Reliance on buffers for protection from adverse consequences
• Relies on passive insulation for survival
• Best suited to an environment that changes slowly and predictably
Stable Reactive • Trying to meet every environmental change with a corresponding organisational action
• Bureaucratic organisational structure
• Adequate resources to respond to environmental shift but constrained by administrative processes
• Attempt to sense and respond to environmental changes in ways that conserve resources
Neutral Proactive • Forecasting and pre-emptive judgement
• A natural match between a firms material resources and its ability to exploit them
• Ability to reduce vulnerability in highly complex environments
• Able to anticipate and capitalise on external shifts
Dervitsiotis (2003) discusses organisational resilience as business landscape fitness.
Organisations’ resilience is the fit between their competitive environment, and their
performance at a specific point in time. He goes on to argue that conventional business
excellence, such as that measured by the EFQM model or the Baldridge Awards, is a
goal based on the idea that all organisations are competing on the same business
landscape towards the same goals. However, this ignores the fact that organisations’
environments are continuously changing and that every organisation faces different
challenges. As a result, Dervitsiotis (2003) argues that business excellence is single loop
learning, and that double loop learning is required,
“…in which there must be a search for different more fundamental
goals…in view of the inadequacy of the ones presently taken for granted
and the prospect of decline or collapse”.
(Dervitsiotis, 2003, p. 253)
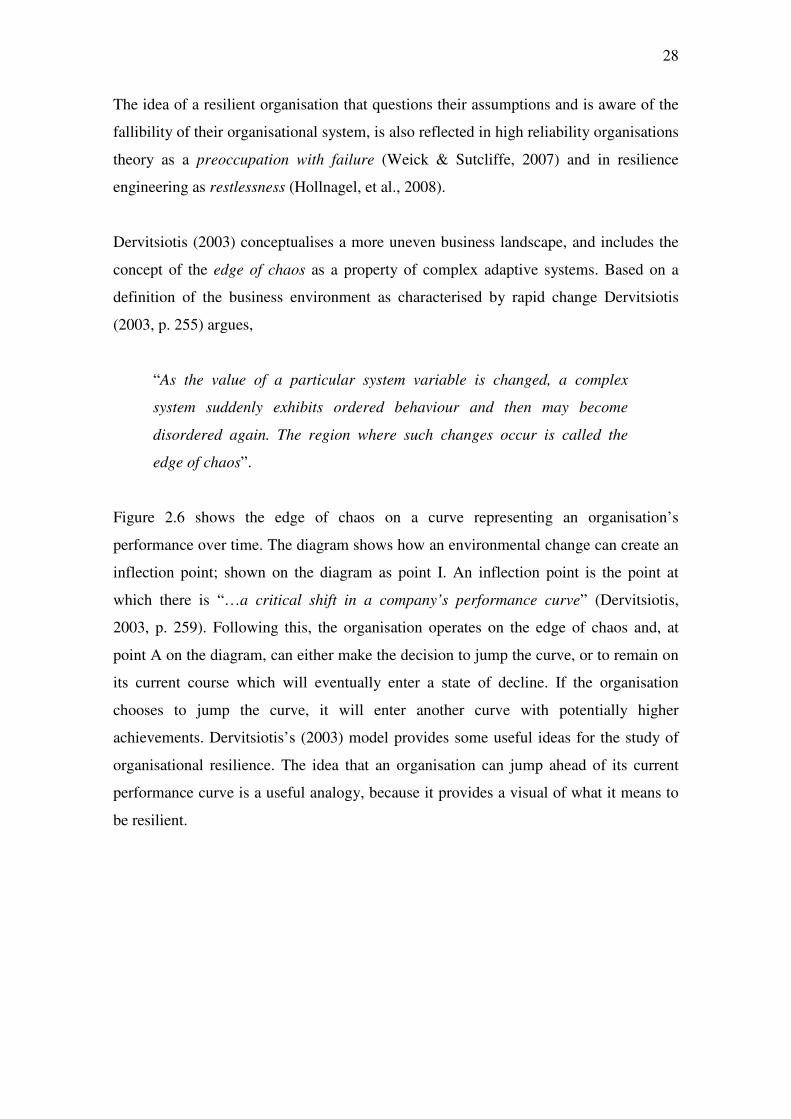
28
The idea of a resilient organisation that questions their assumptions and is aware of the
fallibility of their organisational system, is also reflected in high reliability organisations
theory as a preoccupation with failure (Weick & Sutcliffe, 2007) and in resilience
engineering as restlessness (Hollnagel, et al., 2008).
Dervitsiotis (2003) conceptualises a more uneven business landscape, and includes the
concept of the edge of chaos as a property of complex adaptive systems. Based on a
definition of the business environment as characterised by rapid change Dervitsiotis
(2003, p. 255) argues,
“As the value of a particular system variable is changed, a complex
system suddenly exhibits ordered behaviour and then may become
disordered again. The region where such changes occur is called the
edge of chaos”.
Figure 2.6 shows the edge of chaos on a curve representing an organisation’s
performance over time. The diagram shows how an environmental change can create an
inflection point; shown on the diagram as point I. An inflection point is the point at
which there is “…a critical shift in a company’s performance curve” (Dervitsiotis,
2003, p. 259). Following this, the organisation operates on the edge of chaos and, at
point A on the diagram, can either make the decision to jump the curve, or to remain on
its current course which will eventually enter a state of decline. If the organisation
chooses to jump the curve, it will enter another curve with potentially higher
achievements. Dervitsiotis’s (2003) model provides some useful ideas for the study of
organisational resilience. The idea that an organisation can jump ahead of its current
performance curve is a useful analogy, because it provides a visual of what it means to
be resilient.
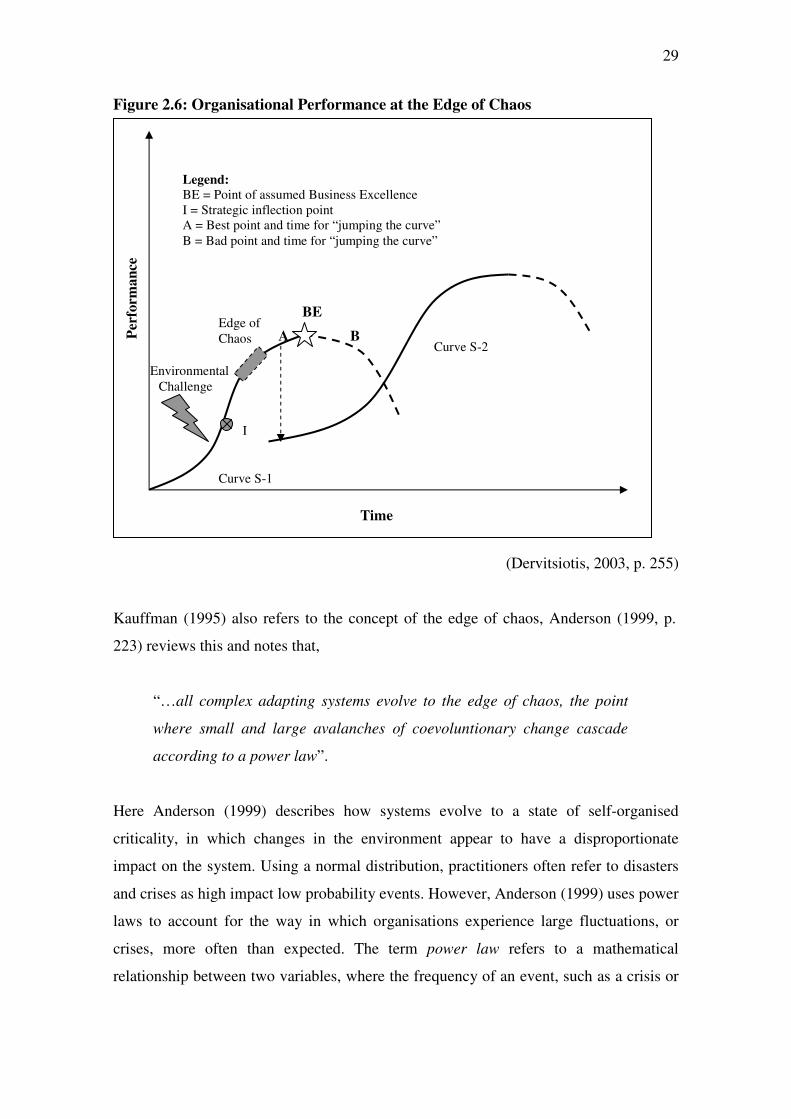
29
Figure 2.6: Organisational Performance at the Edge of Chaos
(Dervitsiotis, 2003, p. 255)
Kauffman (1995) also refers to the concept of the edge of chaos, Anderson (1999, p.
223) reviews this and notes that,
“…all complex adapting systems evolve to the edge of chaos, the point
where small and large avalanches of coevoluntionary change cascade
according to a power law”.
Here Anderson (1999) describes how systems evolve to a state of self-organised
criticality, in which changes in the environment appear to have a disproportionate
impact on the system. Using a normal distribution, practitioners often refer to disasters
and crises as high impact low probability events. However, Anderson (1999) uses power
laws to account for the way in which organisations experience large fluctuations, or
crises, more often than expected. The term power law refers to a mathematical
relationship between two variables, where the frequency of an event, such as a crisis or
Environmental Challenge
Time
Per
form
an
ce
Curve S-1
Edge of Chaos A
BE
B Curve S-2
Legend:
BE = Point of assumed Business Excellence I = Strategic inflection point A = Best point and time for “jumping the curve” B = Bad point and time for “jumping the curve”
I
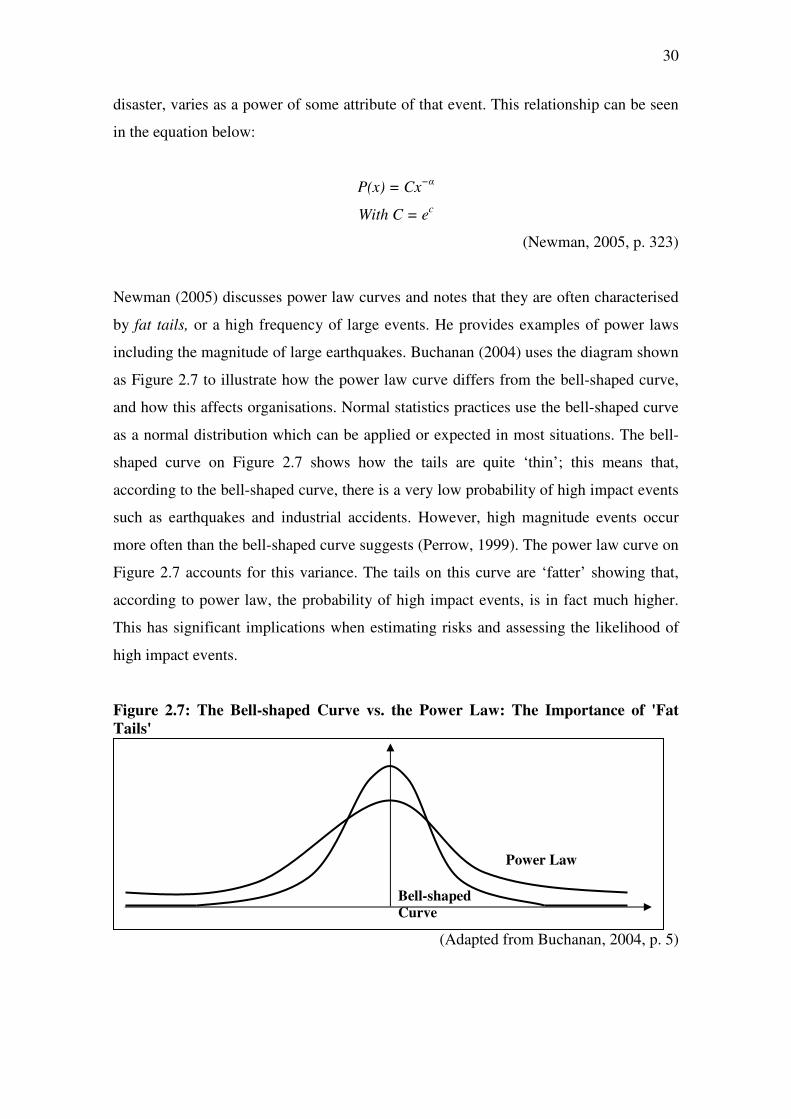
30
disaster, varies as a power of some attribute of that event. This relationship can be seen
in the equation below:
P(x) = Cx−α
With C = ec
(Newman, 2005, p. 323)
Newman (2005) discusses power law curves and notes that they are often characterised
by fat tails, or a high frequency of large events. He provides examples of power laws
including the magnitude of large earthquakes. Buchanan (2004) uses the diagram shown
as Figure 2.7 to illustrate how the power law curve differs from the bell-shaped curve,
and how this affects organisations. Normal statistics practices use the bell-shaped curve
as a normal distribution which can be applied or expected in most situations. The bell-
shaped curve on Figure 2.7 shows how the tails are quite ‘thin’; this means that,
according to the bell-shaped curve, there is a very low probability of high impact events
such as earthquakes and industrial accidents. However, high magnitude events occur
more often than the bell-shaped curve suggests (Perrow, 1999). The power law curve on
Figure 2.7 accounts for this variance. The tails on this curve are ‘fatter’ showing that,
according to power law, the probability of high impact events, is in fact much higher.
This has significant implications when estimating risks and assessing the likelihood of
high impact events.
Figure 2.7: The Bell-shaped Curve vs. the Power Law: The Importance of 'Fat
Tails'
(Adapted from Buchanan, 2004, p. 5)
Bell-shaped
Curve
Power Law
31
Buchanan suggests that organisations can use the power law curve, and the knowledge
that high impact low probability events happen more often than we might think, to
develop strategies to manage crises.
Smith and Sipika (1993) present a model of the post-crisis turnaround stages of crisis
management which is shown as Figure 2.8. Within this, they identify three stages;
defensive phase, consolidation phase and offensive phase.
Figure 2.8: Post-crisis Turnaround Stages
(Smith & Sipika, 1993, p. 33)
During the Defensive Phase organisations activate their formal and informal response
mechanisms. Working within their continuity plans and arrangements, organisations
Defensive Phase
Consolidation Phase
Offensive Phase
Contingency Planning Communications Coupling and
Complexity
Crisis Decision Units Scapegoating Constrained Decision Horizons Control of the Media Systems’ Design
Divestment
Cost
Control
Compensating Victims Financial Restructuring Investment Restructuring Calming the Market Information Management
- Controlling Disinformation
Restructuring for a Responsive Structure Review of Management Style Change of Personnel Marketing
Acquisition
Configuration
Culture
Crisis Event
Ov
erla
p B
etw
een
Ph
ases
Period of Intense Threat
Fai
lure
Rec
ycl
ing
of
Tu
rnar
oun
d O
pti
on
s
32
often operate under uncertainty where the flow and availability of information is
restricted. Smith and Sipika (1993) include coupling and complexity in the model, not
only because these are key factors in creating crises, but because it is important for
organisations to ensure that they have identified the cause of crises and fixed any
problems, before moving on. During the Consolidation Phase, organisations place more
emphasis on strategy, and focus on organisational recovery. As indicated in the model,
organisations also look to restore confidence to their internal and external stakeholders
and networks. The Offensive Phase is characterised by changes to the organisations’
culture, and configuration or structure. Here, the organisation is experiencing the crisis
of legitimisation (Smith, 1990), and it is important to reassure stakeholders further by
restructuring the organisation to improve systems and processes to prevent future crises,
and by reviewing existing management. This phase is also linked to cultural change
within the organisation because leadership, or management and structure, are both
integral to the re-positioning, maintenance or change of an organisation’s culture.
Smith and Sipika’s model of post-crisis turnaround is useful for the discussion of
organisational resilience because it provides a description of how organisations can
respond to a crisis that they have failed to prevent.
The concept of High Reliability Organisations (HRO’s) originates from the military.
These organisations have a collective preoccupation with the possibility of failure
(Reason, 2000); they expect things to go wrong and errors are generalised rather than
isolated. High Reliability theory was originally developed to explain how organisations
such as nuclear submarines and air traffic control centres maintain high levels of safety
and low incidence of accidents despite operating in hazardous and continuously
changing environments. Reason (2000, p. 768) characterizes HRO’s as those
organisations “…which have less than their fair share of accidents”. The concept has
since been extended to describe space agencies, chemical facilities and clinical
environments. Bigley and Roberts (2001) argue that reliability is an increasingly critical
quality and competency for organisations responding to crises. They go on to define
reliability as “…the capacity to continuously and effectively manage working
conditions” (Bigley & Roberts, 2001, p. 1281). Bigley and Roberts discuss a fire
department and argue that a structure based on an incident command system can be
highly reliable; they go on to note that,
33
“They appear able to structure and restructure themselves on a moment-
to-moment basis and to provide members with means to oscillate
effectively between various preplanned organisational solutions to the
more predictable aspects of a disaster circumstance and improvised
approaches for the unforeseen”.
(Bigley & Roberts, 2001, p. 1282)
This describes more than being able to manage working conditions, and is very similar
to resilience. HRO’s can,
“…reconfigure themselves to suit local circumstances. In their routine
mode, they are controlled in the conventional hierarchical manner. But in
high tempo or emergency situations, controls shift…The organisation
reverts seamlessly to the routine control mode once the crisis has
passed”. (In doing so they recognise) …that human variability in the
shape of compensations and adaptations to changing events is one of the
system’s most important safeguards”.
(Reason, 2000, p. 770)
This provides an example of a strategy which achieves a balance between anticipation
and resilience and is discussed in more detail in Section 2.5. Reason (2000, p. 769) goes
on to argue, “High reliability organisations…offer important models for what
constitutes a resilient system”. The similarities or cross-over between HRO and
resilience theory are further emphasised by Weick and Sutcliffe (2007) who use HRO
theory as a basis for their organisational resilience audits which measure organisational
resilience and ask to what extent organisations display HRO characteristics. They go on
to discuss patterns of organisational resilience and argue,
“HROs overcome error when interdependent people with varied
experience apply a richer set of resources to a disturbance at great speed
and under the guidance of swift negative feedback”
(Weick & Sutcliffe, 2007, p. 72)
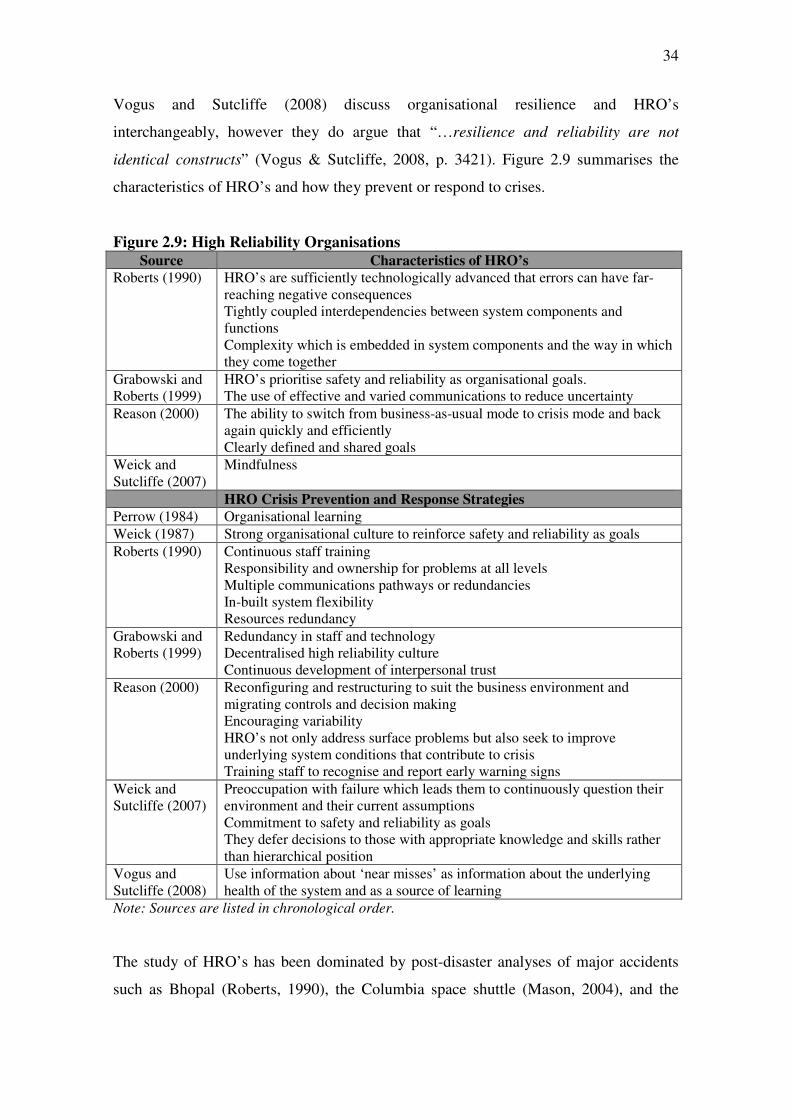
34
Vogus and Sutcliffe (2008) discuss organisational resilience and HRO’s
interchangeably, however they do argue that “…resilience and reliability are not
identical constructs” (Vogus & Sutcliffe, 2008, p. 3421). Figure 2.9 summarises the
characteristics of HRO’s and how they prevent or respond to crises.
Figure 2.9: High Reliability Organisations
Source Characteristics of HRO’s
Roberts (1990) HRO’s are sufficiently technologically advanced that errors can have far-reaching negative consequences Tightly coupled interdependencies between system components and functions Complexity which is embedded in system components and the way in which they come together
Grabowski and Roberts (1999)
HRO’s prioritise safety and reliability as organisational goals. The use of effective and varied communications to reduce uncertainty
Reason (2000) The ability to switch from business-as-usual mode to crisis mode and back again quickly and efficiently Clearly defined and shared goals
Weick and Sutcliffe (2007)
Mindfulness
HRO Crisis Prevention and Response Strategies
Perrow (1984) Organisational learning
Weick (1987) Strong organisational culture to reinforce safety and reliability as goals
Roberts (1990) Continuous staff training Responsibility and ownership for problems at all levels Multiple communications pathways or redundancies In-built system flexibility Resources redundancy
Grabowski and Roberts (1999)
Redundancy in staff and technology Decentralised high reliability culture Continuous development of interpersonal trust
Reason (2000) Reconfiguring and restructuring to suit the business environment and migrating controls and decision making Encouraging variability HRO’s not only address surface problems but also seek to improve underlying system conditions that contribute to crisis Training staff to recognise and report early warning signs
Weick and Sutcliffe (2007)
Preoccupation with failure which leads them to continuously question their environment and their current assumptions Commitment to safety and reliability as goals They defer decisions to those with appropriate knowledge and skills rather than hierarchical position
Vogus and Sutcliffe (2008)
Use information about ‘near misses’ as information about the underlying health of the system and as a source of learning
Note: Sources are listed in chronological order.
The study of HRO’s has been dominated by post-disaster analyses of major accidents
such as Bhopal (Roberts, 1990), the Columbia space shuttle (Mason, 2004), and the
35
Challenger space shuttle (Weir, 2002). Few studies have been conducted on
organisations that have the potential for catastrophe but have not experienced major
accidents (Roberts, 1990). The characteristics that contribute to organisations’
reliability, may also contribute towards their resilience. Normal Accident Theory (NAT)
argues that the cause of accidents is in “…the complexity and coupling of the system
itself, not in the failures of its components” (Perrow, 1999, p. 354) and that as a result,
accidents are inevitable. This theory is not in competition or contradiction to HRO
theory (HRT) but is complimentary. Rijmpa (1997, p. 21) examines the two theories and
argues,
“NAT does not only explain normal accidents: it can also be used to
explain overall reliability. HRT explains more than overall highly reliable
performance: it also highlights factors which contribute to an
organisation’s proneness to system accidents”.
In his seminal work, ‘Normal Accidents’ Perrow (1999) discusses high risk
organisations as those organisations that combine a complex environment with tightly
coupled operations and have the potential to fail with catastrophic consequences
(Perrow, 1999). Weick (1987) argues that organisational culture determines whether or
not high risk organisations can transform into HRO’s. In terms of organisational
resilience, high reliability is a desirable trait (Vogus & Sutcliffe, 2008).
2.4 Resilience
This section introduces and defines the concept of resilience and specifically disaster
and organisational resilience. Models of organisational resilience are presented and
reviewed and the applicability of each is discussed. This section also reviews standards
that are relevant to the thesis as well as previous research on measuring organisational
resilience and benchmarking as a methodology for continuous improvement.
Resilience is a theoretical concept, a metaphor, a result of interactions between people
and the environment, a property of a dynamic system (Carpenter, et al., 2001), a
measurable social and cultural construct (Mallak, 1998b) and a paradigm (Paton &
36
Johnston, 2001). The first use of the term resilience is contested but can be attributed to
either ecology, physics or psychology (Manyena, 2006). In ecology, it was introduced
through Hollings’ (1973) seminal work Resilience and Stability of Ecological Systems.
Holling described resilience as,
“…a measure of persistence of systems and their ability to absorb change
and disturbance and still maintain the same relationships between
populations or state variables”.
(Holling, 1973, p. 14)
Kasperson and Kasperson (2005) discuss examples of the influence of random events on
natural systems and suggest that we can better understand resilience if we “…shift the
emphasis towards assuming change and then try to explain stability” (Kasperson &
Kasperson, 2005, p. 255). Holling (1973) also notes that traditional analysis within the
field of ecology has been inherited from developments in physics. In physics resilience
is “…the ability for a material to get back to its initial shape following an external
shock” (Lecoze & Capo, 2006, p. 3). Zimmerman and Arunkumar (1994, p. 2) refer to
psychological resilience and argue that it refers to “…fending off maladaptive responses
to risk and their potential negative consequences”. Another common understanding of
resilience, is the ability to bounce back (Coutu, 2002). Holling (1996) discusses the
difference between resilience in engineering versus resilience in ecology. He describes
resilience in engineering as the stability of equilibrium near a steady state and argues
that, in engineering, resilience can be measured as the speed of return to equilibrium.
2.4.1 Disaster Resilience
In the context of emergency management, the term resilience was established with the
adoption of the Hyogo Framework for Action 2005-2015 by the United Nations as the
result of the World Conference on Disaster Reduction in 2005. The framework focused
on the prioritisation of risk reduction, identifying risks and enhancing early warning
systems, building a culture of safety and resilience, reducing underlying risk factors,
and strengthening disaster preparedness and response capabilities (UNISDR, 2005).
37
Tierney and Bruneau (2007, p. 14) note that “…resilience has gained prominence as a
topic in the field of disaster research, supplanting the concept of disaster resilience”.
Coles and Buckle (2004) argue that recent events such as the September 11th Terrorist
Attacks in America have given currency to the concept of resilience and increased its
use within emergency planning and management. This can be observed in the
emergency management legislation and accompanying guidance of the UK (Civil
Contingencies Secretariat, 2004) and New Zealand (MCDEM, 2004). McEntire (2005)
discusses the emergence of the resilience paradigm within emergency management and
notes how it was interpreted differently by some academics as hazard mitigation, and by
some practitioners as post-disaster recovery.
Conflicts between definitions of disaster resilience are common. Some authors argue
that resilience and anticipation are separate (Wildavsky, 1998) and others argue that
they are complementary (Comfort, et al., 2001). Vogus and Sutcliffe (2008, p. 3418)
clarify this and differentiate an anticipatory approach “…that attempts to avoid error by
design” from a resilience approach,
“…that recognizes the inherent fallibility of any organisational system
and instead attempts to monitor how closely the system is operating
relative to its performance limits and to manage any deviations as quickly
as possible once they emerge”.
(Vogus & Sutcliffe, 2008, p. 3418)
This is discussed further in Section 2.5.
2.4.2 Organisational Resilience
The majority of research into organisational resilience has been qualitative and
descriptive (Somers, 2007). However some researchers have used concepts from
engineering to operationalise organisational resilience. Researchers at the Multi-
disciplinary Center for Earthquake Engineering Research (MCEER) incorporate
withstanding forces and coping and define resilience as the capacity for,
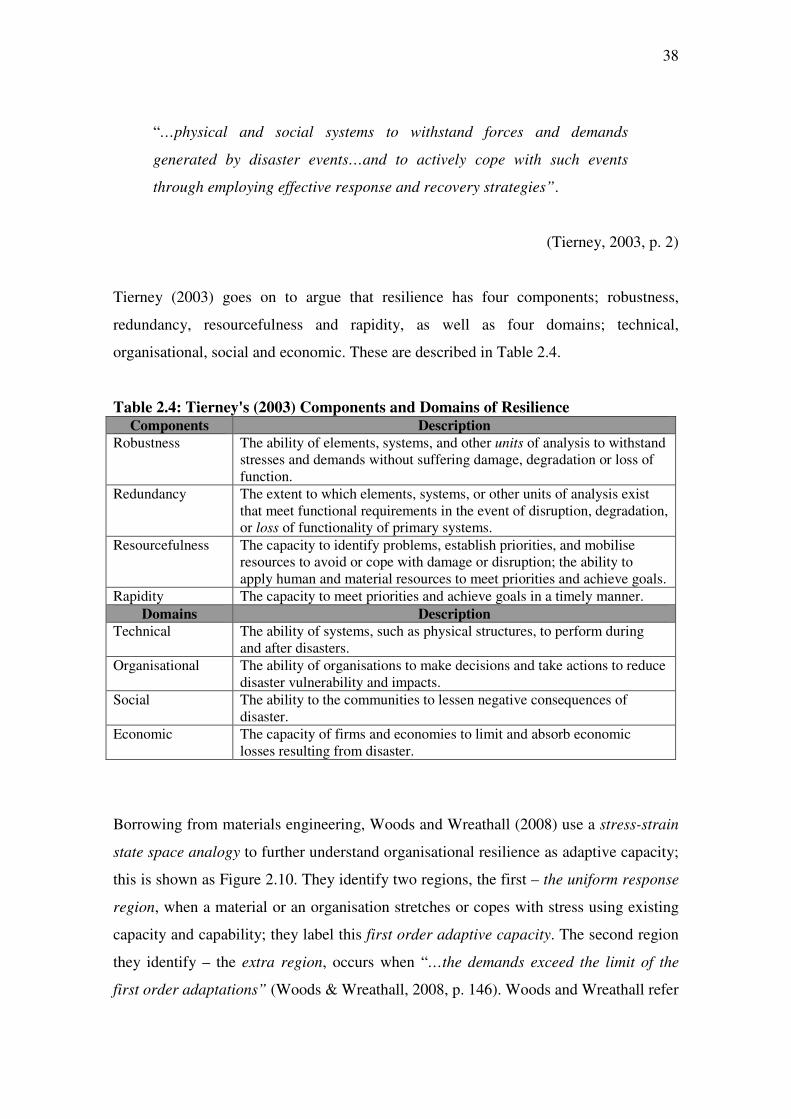
38
“…physical and social systems to withstand forces and demands
generated by disaster events…and to actively cope with such events
through employing effective response and recovery strategies”.
(Tierney, 2003, p. 2)
Tierney (2003) goes on to argue that resilience has four components; robustness,
redundancy, resourcefulness and rapidity, as well as four domains; technical,
organisational, social and economic. These are described in Table 2.4.
Table 2.4: Tierney's (2003) Components and Domains of Resilience Components Description
Robustness The ability of elements, systems, and other units of analysis to withstand stresses and demands without suffering damage, degradation or loss of function.
Redundancy The extent to which elements, systems, or other units of analysis exist that meet functional requirements in the event of disruption, degradation, or loss of functionality of primary systems.
Resourcefulness The capacity to identify problems, establish priorities, and mobilise resources to avoid or cope with damage or disruption; the ability to apply human and material resources to meet priorities and achieve goals.
Rapidity The capacity to meet priorities and achieve goals in a timely manner.
Domains Description
Technical The ability of systems, such as physical structures, to perform during and after disasters.
Organisational The ability of organisations to make decisions and take actions to reduce disaster vulnerability and impacts.
Social The ability to the communities to lessen negative consequences of disaster.
Economic The capacity of firms and economies to limit and absorb economic losses resulting from disaster.
Borrowing from materials engineering, Woods and Wreathall (2008) use a stress-strain
state space analogy to further understand organisational resilience as adaptive capacity;
this is shown as Figure 2.10. They identify two regions, the first – the uniform response
region, when a material or an organisation stretches or copes with stress using existing
capacity and capability; they label this first order adaptive capacity. The second region
they identify – the extra region, occurs when “…the demands exceed the limit of the
first order adaptations” (Woods & Wreathall, 2008, p. 146). Woods and Wreathall refer
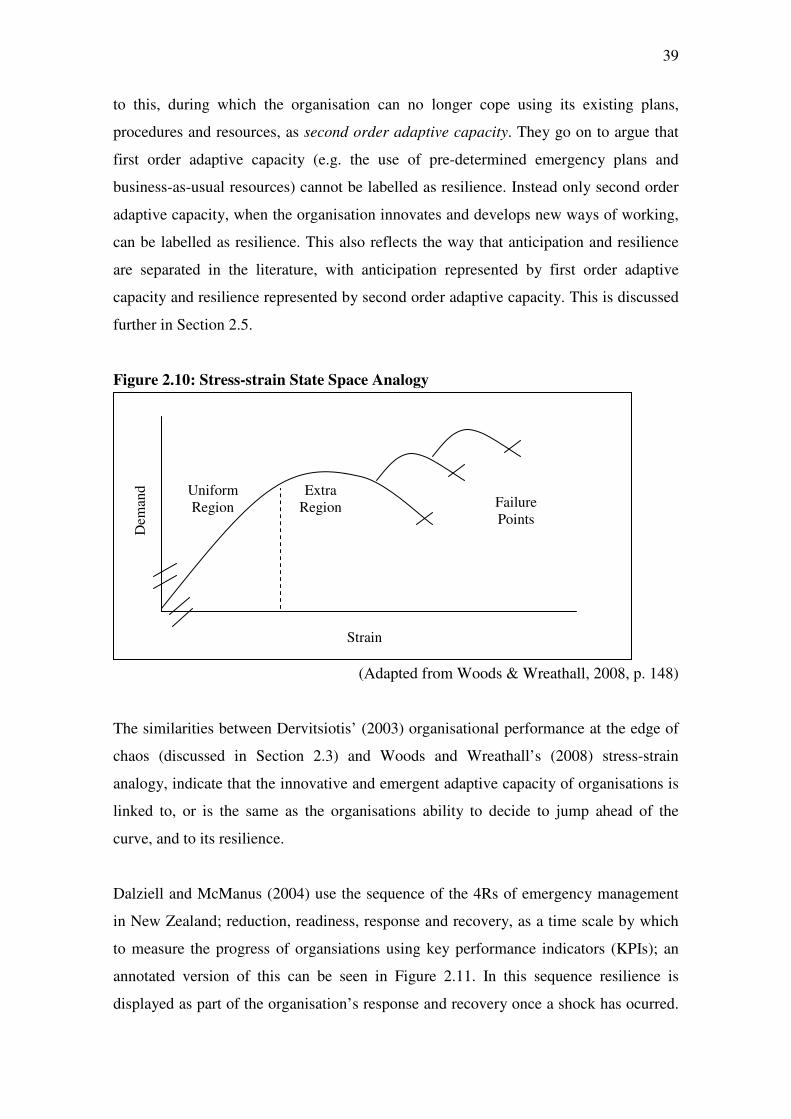
39
to this, during which the organisation can no longer cope using its existing plans,
procedures and resources, as second order adaptive capacity. They go on to argue that
first order adaptive capacity (e.g. the use of pre-determined emergency plans and
business-as-usual resources) cannot be labelled as resilience. Instead only second order
adaptive capacity, when the organisation innovates and develops new ways of working,
can be labelled as resilience. This also reflects the way that anticipation and resilience
are separated in the literature, with anticipation represented by first order adaptive
capacity and resilience represented by second order adaptive capacity. This is discussed
further in Section 2.5.
Figure 2.10: Stress-strain State Space Analogy
(Adapted from Woods & Wreathall, 2008, p. 148)
The similarities between Dervitsiotis’ (2003) organisational performance at the edge of
chaos (discussed in Section 2.3) and Woods and Wreathall’s (2008) stress-strain
analogy, indicate that the innovative and emergent adaptive capacity of organisations is
linked to, or is the same as the organisations ability to decide to jump ahead of the
curve, and to its resilience.
Dalziell and McManus (2004) use the sequence of the 4Rs of emergency management
in New Zealand; reduction, readiness, response and recovery, as a time scale by which
to measure the progress of organsiations using key performance indicators (KPIs); an
annotated version of this can be seen in Figure 2.11. In this sequence resilience is
displayed as part of the organisation’s response and recovery once a shock has ocurred.
Strain
Dem
and
Uniform Region
Extra Region Failure
Points
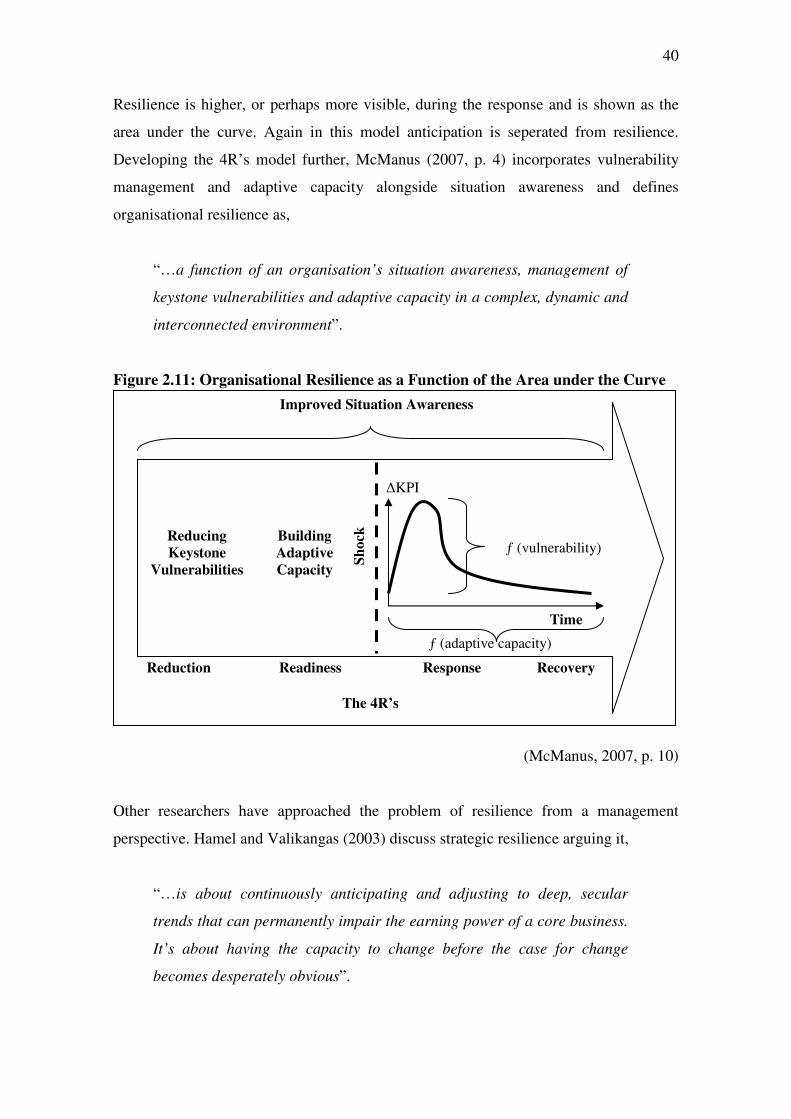
40
Resilience is higher, or perhaps more visible, during the response and is shown as the
area under the curve. Again in this model anticipation is seperated from resilience.
Developing the 4R’s model further, McManus (2007, p. 4) incorporates vulnerability
management and adaptive capacity alongside situation awareness and defines
organisational resilience as,
“…a function of an organisation’s situation awareness, management of
keystone vulnerabilities and adaptive capacity in a complex, dynamic and
interconnected environment”.
Figure 2.11: Organisational Resilience as a Function of the Area under the Curve
(McManus, 2007, p. 10)
Other researchers have approached the problem of resilience from a management
perspective. Hamel and Valikangas (2003) discuss strategic resilience arguing it,
“…is about continuously anticipating and adjusting to deep, secular
trends that can permanently impair the earning power of a core business.
It’s about having the capacity to change before the case for change
becomes desperately obvious”.
Reduction Readiness Response Recovery
Sh
ock
Reducing
Keystone
Vulnerabilities
Building
Adaptive
Capacity
∆KPI
ƒ (vulnerability)
Time
ƒ (adaptive capacity)
The 4R’s
Improved Situation Awareness
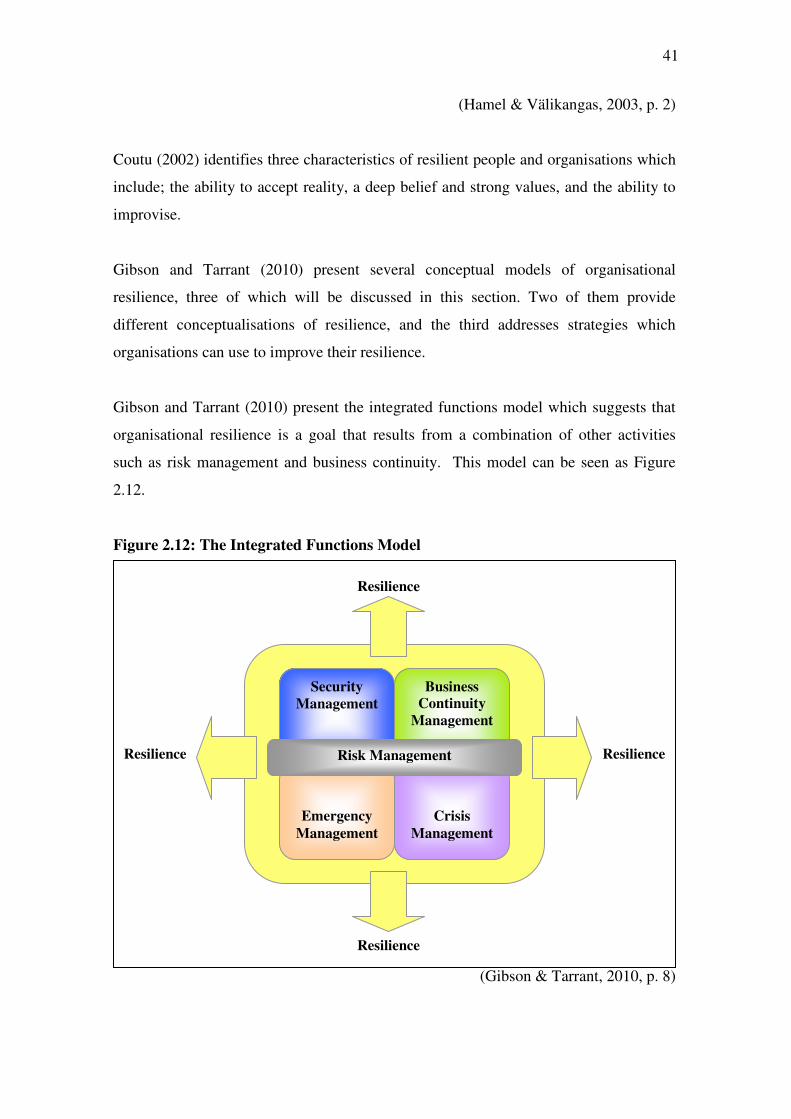
41
(Hamel & Välikangas, 2003, p. 2)
Coutu (2002) identifies three characteristics of resilient people and organisations which
include; the ability to accept reality, a deep belief and strong values, and the ability to
improvise.
Gibson and Tarrant (2010) present several conceptual models of organisational
resilience, three of which will be discussed in this section. Two of them provide
different conceptualisations of resilience, and the third addresses strategies which
organisations can use to improve their resilience.
Gibson and Tarrant (2010) present the integrated functions model which suggests that
organisational resilience is a goal that results from a combination of other activities
such as risk management and business continuity. This model can be seen as Figure
2.12.
Figure 2.12: The Integrated Functions Model
(Gibson & Tarrant, 2010, p. 8)
Security
Management
Business
Continuity
Management
Emergency
Management
Crisis
Management
Risk Management
Resilience Resilience
Resilience
Resilience
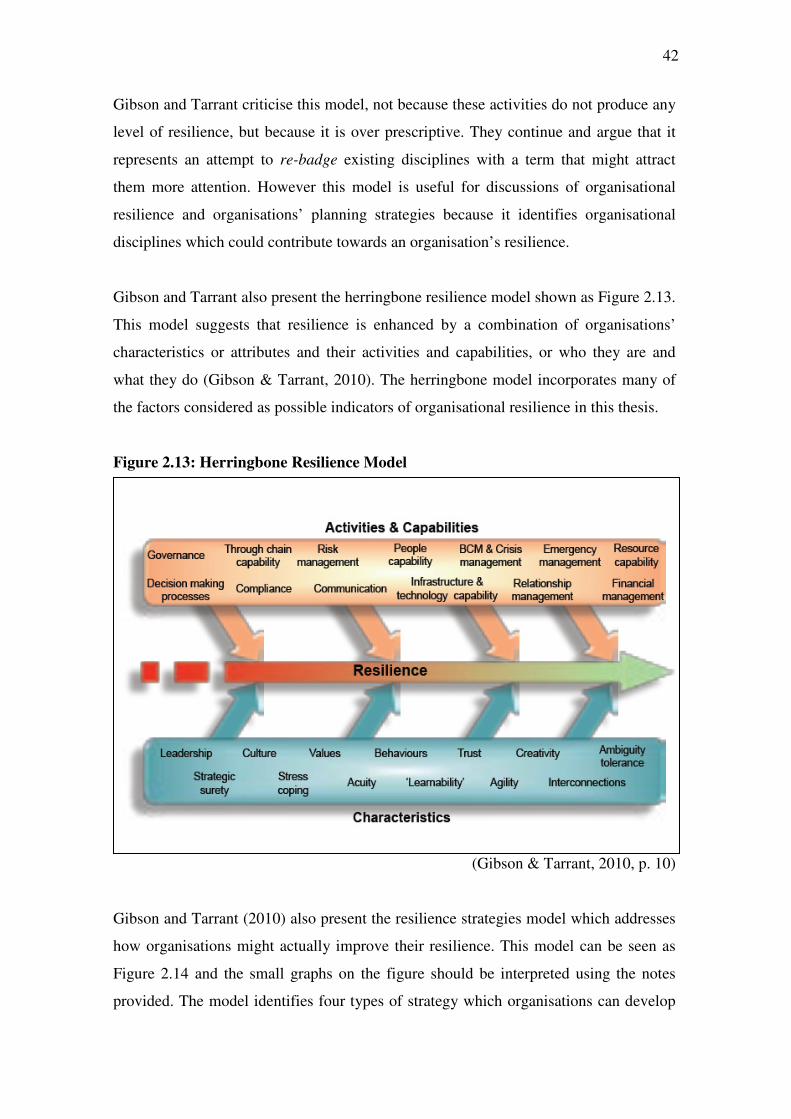
42
Gibson and Tarrant criticise this model, not because these activities do not produce any
level of resilience, but because it is over prescriptive. They continue and argue that it
represents an attempt to re-badge existing disciplines with a term that might attract
them more attention. However this model is useful for discussions of organisational
resilience and organisations’ planning strategies because it identifies organisational
disciplines which could contribute towards an organisation’s resilience.
Gibson and Tarrant also present the herringbone resilience model shown as Figure 2.13.
This model suggests that resilience is enhanced by a combination of organisations’
characteristics or attributes and their activities and capabilities, or who they are and
what they do (Gibson & Tarrant, 2010). The herringbone model incorporates many of
the factors considered as possible indicators of organisational resilience in this thesis.
Figure 2.13: Herringbone Resilience Model
(Gibson & Tarrant, 2010, p. 10)
Gibson and Tarrant (2010) also present the resilience strategies model which addresses
how organisations might actually improve their resilience. This model can be seen as
Figure 2.14 and the small graphs on the figure should be interpreted using the notes
provided. The model identifies four types of strategy which organisations can develop
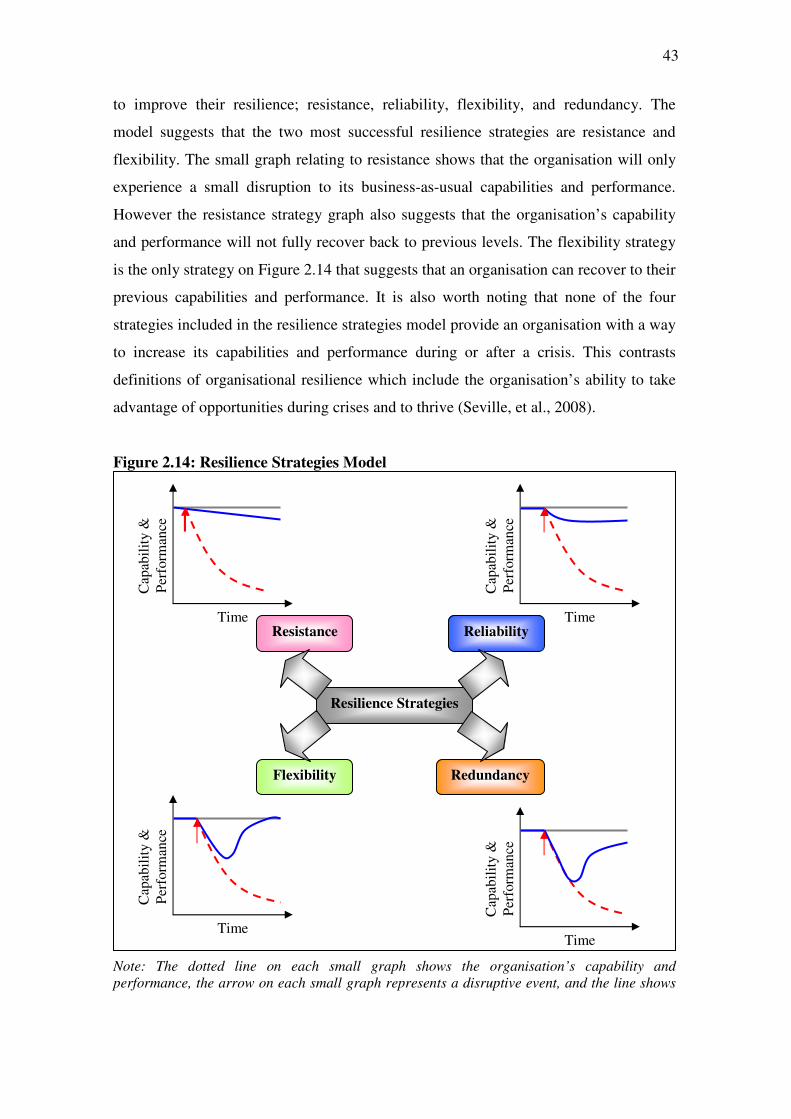
43
to improve their resilience; resistance, reliability, flexibility, and redundancy. The
model suggests that the two most successful resilience strategies are resistance and
flexibility. The small graph relating to resistance shows that the organisation will only
experience a small disruption to its business-as-usual capabilities and performance.
However the resistance strategy graph also suggests that the organisation’s capability
and performance will not fully recover back to previous levels. The flexibility strategy
is the only strategy on Figure 2.14 that suggests that an organisation can recover to their
previous capabilities and performance. It is also worth noting that none of the four
strategies included in the resilience strategies model provide an organisation with a way
to increase its capabilities and performance during or after a crisis. This contrasts
definitions of organisational resilience which include the organisation’s ability to take
advantage of opportunities during crises and to thrive (Seville, et al., 2008).
Figure 2.14: Resilience Strategies Model
Note: The dotted line on each small graph shows the organisation’s capability and performance, the arrow on each small graph represents a disruptive event, and the line shows
Time
Cap
abil
ity
&
Per
form
ance
Time
Cap
abil
ity
&
Per
form
ance
Time
Cap
abil
ity
&
Per
form
ance
Time
Cap
abil
ity
&
Per
form
ance
Reliability
Redundancy Flexibility
Resistance
Resilience Strategies
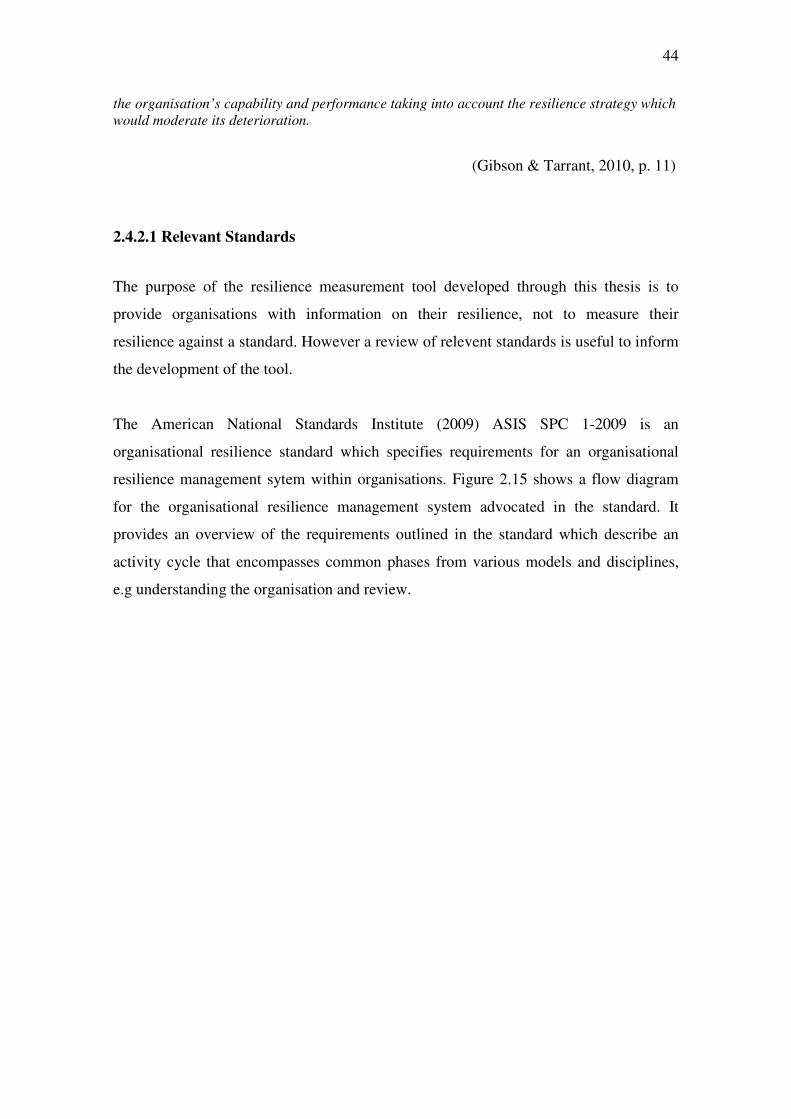
44
the organisation’s capability and performance taking into account the resilience strategy which would moderate its deterioration.
(Gibson & Tarrant, 2010, p. 11)
2.4.2.1 Relevant Standards
The purpose of the resilience measurement tool developed through this thesis is to
provide organisations with information on their resilience, not to measure their
resilience against a standard. However a review of relevent standards is useful to inform
the development of the tool.
The American National Standards Institute (2009) ASIS SPC 1-2009 is an
organisational resilience standard which specifies requirements for an organisational
resilience management sytem within organisations. Figure 2.15 shows a flow diagram
for the organisational resilience management system advocated in the standard. It
provides an overview of the requirements outlined in the standard which describe an
activity cycle that encompasses common phases from various models and disciplines,
e.g understanding the organisation and review.
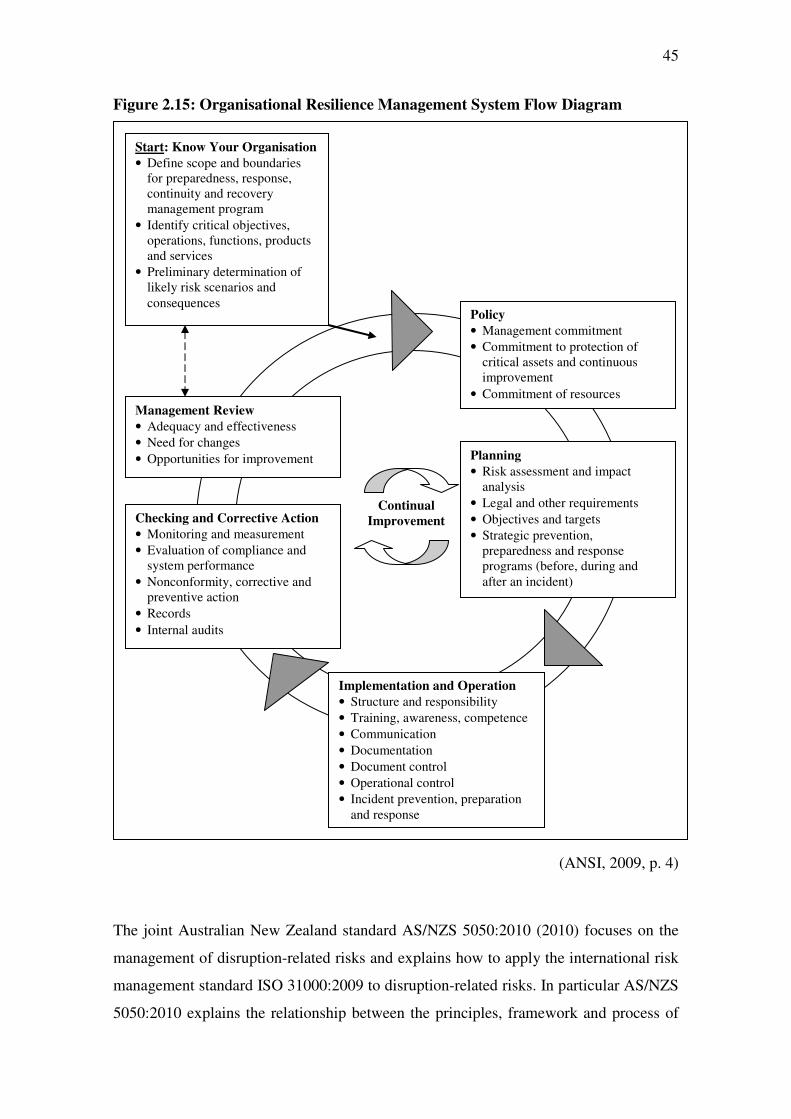
45
Figure 2.15: Organisational Resilience Management System Flow Diagram
(ANSI, 2009, p. 4)
The joint Australian New Zealand standard AS/NZS 5050:2010 (2010) focuses on the
management of disruption-related risks and explains how to apply the international risk
management standard ISO 31000:2009 to disruption-related risks. In particular AS/NZS
5050:2010 explains the relationship between the principles, framework and process of
Continual
Improvement
Policy
• Management commitment
• Commitment to protection of critical assets and continuous improvement
• Commitment of resources
Planning
• Risk assessment and impact analysis
• Legal and other requirements
• Objectives and targets
• Strategic prevention, preparedness and response programs (before, during and after an incident)
Implementation and Operation
• Structure and responsibility
• Training, awareness, competence
• Communication
• Documentation
• Document control
• Operational control
• Incident prevention, preparation and response
Checking and Corrective Action
• Monitoring and measurement
• Evaluation of compliance and system performance
• Nonconformity, corrective and preventive action
• Records
• Internal audits
Management Review
• Adequacy and effectiveness
• Need for changes
• Opportunities for improvement
Start: Know Your Organisation
• Define scope and boundaries for preparedness, response, continuity and recovery management program
• Identify critical objectives, operations, functions, products and services
• Preliminary determination of likely risk scenarios and
consequences
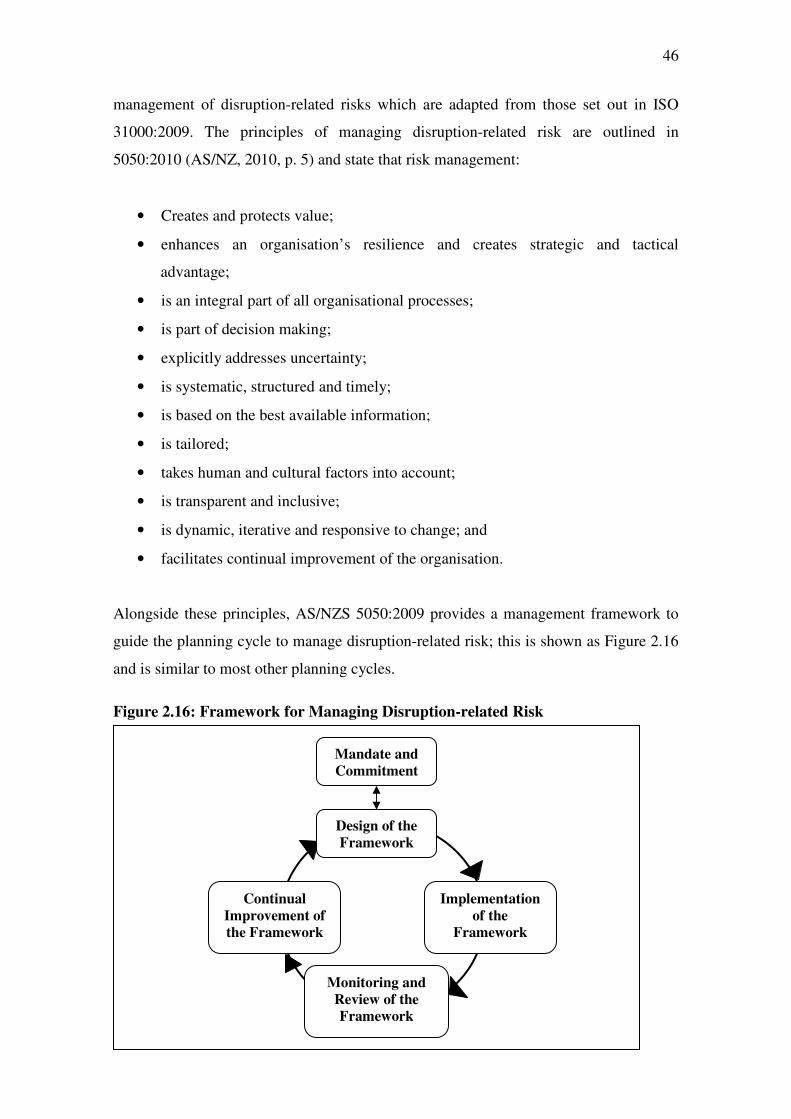
46
management of disruption-related risks which are adapted from those set out in ISO
31000:2009. The principles of managing disruption-related risk are outlined in
5050:2010 (AS/NZ, 2010, p. 5) and state that risk management:
• Creates and protects value;
• enhances an organisation’s resilience and creates strategic and tactical
advantage;
• is an integral part of all organisational processes;
• is part of decision making;
• explicitly addresses uncertainty;
• is systematic, structured and timely;
• is based on the best available information;
• is tailored;
• takes human and cultural factors into account;
• is transparent and inclusive;
• is dynamic, iterative and responsive to change; and
• facilitates continual improvement of the organisation.
Alongside these principles, AS/NZS 5050:2009 provides a management framework to
guide the planning cycle to manage disruption-related risk; this is shown as Figure 2.16
and is similar to most other planning cycles.
Figure 2.16: Framework for Managing Disruption-related Risk
Design of the
Framework
Mandate and
Commitment
Implementation
of the
Framework
Monitoring and
Review of the
Framework
Continual
Improvement of
the Framework
47
(AS/NZ, 2010, p. 18)
The management framework then relates to a process for managing disruption-related
risk which is taken from the older Australia New Zealand risk management standard
4360:2004 (AS/NZ, 2004) and is shown as Figure 2.17.
Figure 2.17: Risk Management Process
(AS/NZ, 2010, p. 22)
AS/NZS 5050:2009 also presents a model for how the principles, framework and
process relate together; this is shown as Figure 2.18. The important parts of the diagram
are the arrows linking the principles, framework and process. As shown, the principles
directly feed into the mandate and commitment element of the framework. This means
that the principles should provide the drivers for management commitment to risk
management. The implementation of the framework is then linked to the risk
management process.
Ris
k A
sses
smen
t
Risk Identification
Risk Analysis
(including business impact
analysis)
Risk Evaluation
Co
mm
un
icati
on
an
d C
on
sult
ati
on
Mo
nit
or
an
d R
evie
w
Establish the Context
Risk Treatment
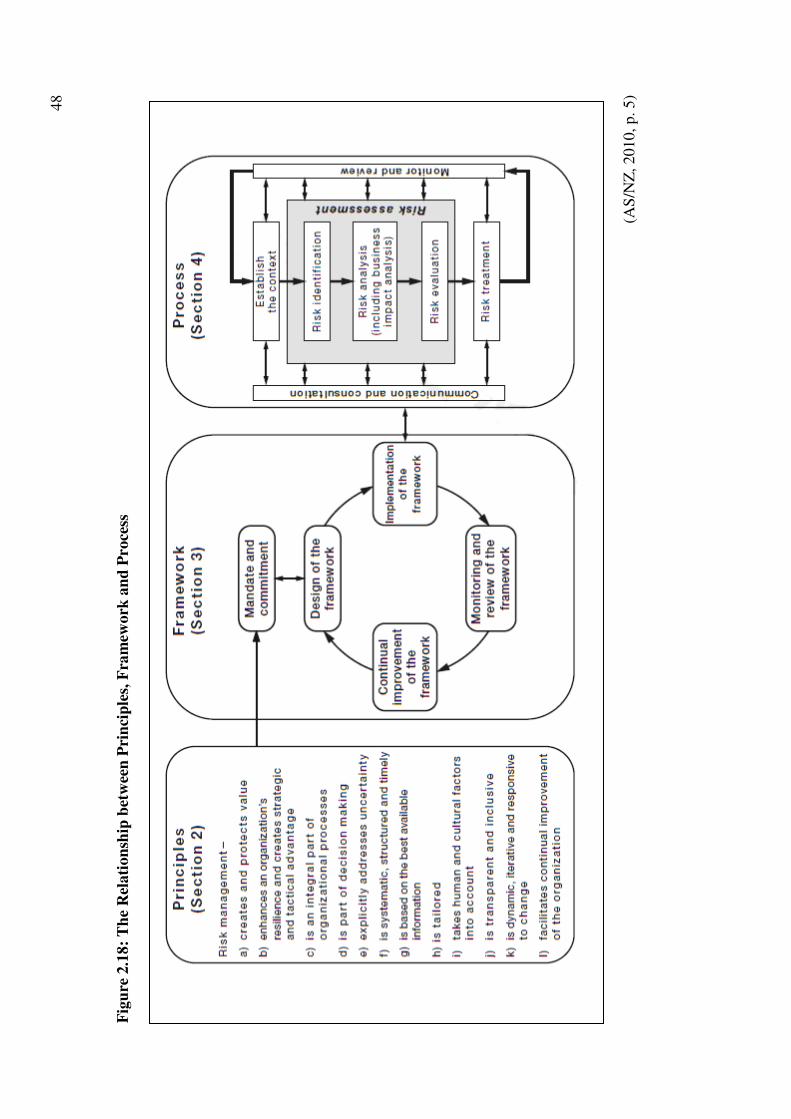
48
Fig
ure
2.1
8:
Th
e R
elati
on
ship
bet
wee
n P
rin
cip
les,
Fra
mew
ork
an
d P
roce
ss
(AS
/NZ
, 2010, p. 5
)
49
2.4.3 Measuring Organisational Resilience
Somers (2009) describes resilience as a reaction to an event and argues that
“…resilience is demonstrated after an event or crisis has ocurred” (Somers, 2009, p.
13). As a result, to measure resilience during business-as-usual, he focuses on
measuring latent resilience or resilience potential. However this ignores the positive role
that resilience can play in helping organisations to avoid crises (Pearson & Clair, 1998).
This could include monitoring and detection of early warning signals which help
organisations to avoid or prevent crisis or decline. Much the same as organisational
culture, the visibility of resilience does not necessarily reflect its impact on the
organisation and it’s operations. As a result, this thesis argues that resilience is always
active within an organisation but may only be visble during the post-crisis phases.
Attempts to measure or assess organisational resilience can generally be classified as
either qualitative case studies and interviews, or quantitative surveys. Mallak (1998b)
surveyed nursing executives in the acute healthcare industry to measure organisational
resilience. To enable this, he operationalised three concepts introduced by Weick
(1993); bricolage, attitude of wisdom, and virtual role system. With responses from 128
nursing executives Mallak (1998b) used confirmatory factor analysis to develop six
factors which he named goal directed solution seeking, avoidance or skepticism, critical
understanding, role dependence, source resilience, and access to resources. Through his
analysis Mallak focuses on the individual as the unit of analysis and argues that
organisational resilience relies on the resilience of individuals. This link is not
emphasised within the majority of organisational literature, however it is supported
within information systems and technology (Cho, et al., 2006; Riolli & Savicki, 2003).
Somers (2009) extended Mallak’s (1998b) research and applied it to 142 public works
organisations. He used Mallak’s six factors to measure resilience potential or latent
resilience, defined as “…resilience that is not presently evident or realised” (Somers,
2007, p. 13). Through his research Somers (2009) uses data from a non-probablility
sample, which does not involve a random selection, to develop the Organisational
Resilience Potential Scale (ORPS). In addition to Mallak’s six factors, Somers (2009)
also includes measures of decision structure and centralisation, connectivity, continuity
50
planning and agency acreditation in the ORPS. While both Mallak’s (1998b) and
Somers’s (2009) studies represent significant theoretical contributions, neither was
developed using a random sample and so cannot be used as the sole basis for a robust
resilience measurement tool.
Weick and Sutcliffe (2007) discuss high reliability as a key characteristic of resilience
and present a series of nine audits to measure resilience. Each resilience audit consists
of questions based on high reliability and organisational theory. Smith et al. (2005, p.
130) advocate the use of Weick and Sutcliffe’s resilience audits to organisational
managers to create mindfulness and to diagnose areas that need specific attention.
However, the audits have yet to be fully quantitatively tested (Fratus, 2006, p. 29).
Some of Weick and Sutcliffe’s concepts and questions have been used in the
development of the resilience measurement tool; this will be discussed in Chapter 5.
Paton (2007) developed a survey to measure community resilience in Auckland New
Zealand. While Paton did not measure organisational resilience, it is included here
because it was resilience measured using a survey within the same geographic area as
the research in this thesis, and because of the possible links between individual and
organisational resilience as suggested by Mallak (1998b). Paton (2007, p. 7) defines
community resilience as,
“…the capacity of a community, its members and the systems that
facilitate its normal activities to adapt in ways that maintain functional
relationships in the presence of significant disturbances”.
He goes on to discuss resilience and adaptive capacity interchangeably and argues that
resilience comprises four components; resources, competencies, planning and
development strategies, and sustained availability. Based on these general components,
Paton (2007) developed a survey tool to measure community resilience based on a
volcanic eruption scenario. He argues,
“The assessment of resilience must take place in a context in which the
demands that people have to adapt to is known or can be estimated”.
51
(Paton, 2007, p. 12)
Here Paton is arguing that, when developing a model of community resilience, it is
important to be able to collect responses in the context of a scenario where the
researcher can evaluate whether or not a particular response makes the participant more
or less resilient. For example, when measuring negative outcome expectancy Paton
(2007, p. 49) asks respondents the extent to which they agree or disagree that volcanic
eruptions are too destructive to bother preparing for. This enables Paton to make a
judgement on whether the respondent would prepare, given the likelihood and
consequence of a specific event. This of course might be quite different to whether a
respondent in Auckland might prepare for a flood.
He administered the survey by telephone to a random sample of 400 households in
August 2005; however a problem with the survey administration left 297 useable
responses which were then taken forward to develop a model of community resilience.
Paton (2007) used Principal Components Analysis, which is essentially the same as
factor analysis with rotation, to determine dimensionality, Cronbach’s Alpha to test
reliability, and structural equation modelling to develop the model. Through this
analysis Paton (2007, p. 21) identified eight components of community resilience which
included;
• Action coping;
• positive outcome expectancy;
• community participation;
• empowerment;
• negative outcome expectancy;
• articulating problems;
• trust; and
• intention.
The UK Business Continuity Institute (BCI, 2007) developed an online business
continuity benchmarking survey to benchmark organisations’ performance against the
BCI business continuity guidelines which are based on the British Standards Institute
52
BS25999 (BSI, 2006). While this survey was primarily concerned with operational
continuity, it paved the way for a raft of similar surveys and tools in the UK which are
slowly incorporating the more social and cultural elements of resilience.
The UK Financial Services Authority (2005), as part of the Tripartite Authorities,
conducted a resilience benchmarking study of the UK financial sector in 2005. As part
of this study they developed an online benchmarking survey and used it to benchmark
the resilience of 60 financial sector organisations. Although the focus of the study was
described as resilience, the questions themselves focused primarily on business
continuity and addressed recovery times, the effectiveness of planning, and potential
areas of vulnerability (Financial Services Authority, 2006). The results of the study
identified IT resilience as a key strength and the primary focus of most organisations’
business continuity activities. However the social and cultural side of resilience was
noted as an area that needed more attention (Financial Services Authority, 2006).
The UK Financial Services Authority (2010) has also more recently completed a similar
project to benchmark the resilience of the UK insurance sector. The online resilience
benchmarking survey that was used for the financial sector was adapted and used to
benchmark the resilience of 19 insurance sector organisations. Again this study focused
on business continuity; however it also included more emphasis on staff welfare, human
resources management, and risk assessment (Financial Services Authority, 2010).
Hurley-Hanson (2006) investigates whether organisations increased their crisis response
planning following the September 11th Terrorist Attacks. To do this she developed a
survey to measure employees’ perceptions of their organisations’ crisis preparedness.
Hurley-Hanson’s (2006) survey focused on the following segments;
• Employee safety and security;
• crisis planning and communications;
• resilience (the ability to recover from catastrophic event); and
• economic and human losses.
53
Despite calls from the US Government for organisations to prepare, and the poignant
reminder provided by 9/11, Hurley-Hanson (2006) found that the majority of
organisations, even those that were directly affected by 9/11, were still unprepared for
crisis (Hurley-Hanson, 2006).
As part of the Resilient Organisations Research Programme, McManus (2007) used
grounded theory to explore organisational resilience in New Zealand. She conducted a
qualitative study using semi-structured interviews with ten case study organisations to
assess their resilience qualities. From these case studies, McManus proposed a
definition of organisational resilience as,
“…a function of an organisation’s situation awareness, management of
keystone vulnerabilities and adaptive capacity in a complex, dynamic and
interconnected environment”.
(McManus, 2007, p. 4)
Through this she hypothesised a model where Relative Overall Resilience (ROR) is
composed of three dimensions (situation awareness, management of keystone
vulnerabilities and adaptive capacity) and also proposed fifteen indictors of
organisational resilience; five for each dimension. The ROR model has been chosen as
the starting point for this thesis because it presents an operationalised definition of
organisational resilience which has been developed through research with New Zealand
organisations and so provides a good context for this study. The indicators it proposes
can be seen in Table 2.5; definitions of each of the three dimensions and the fifteen
indicators are discussed in Chapter 3.
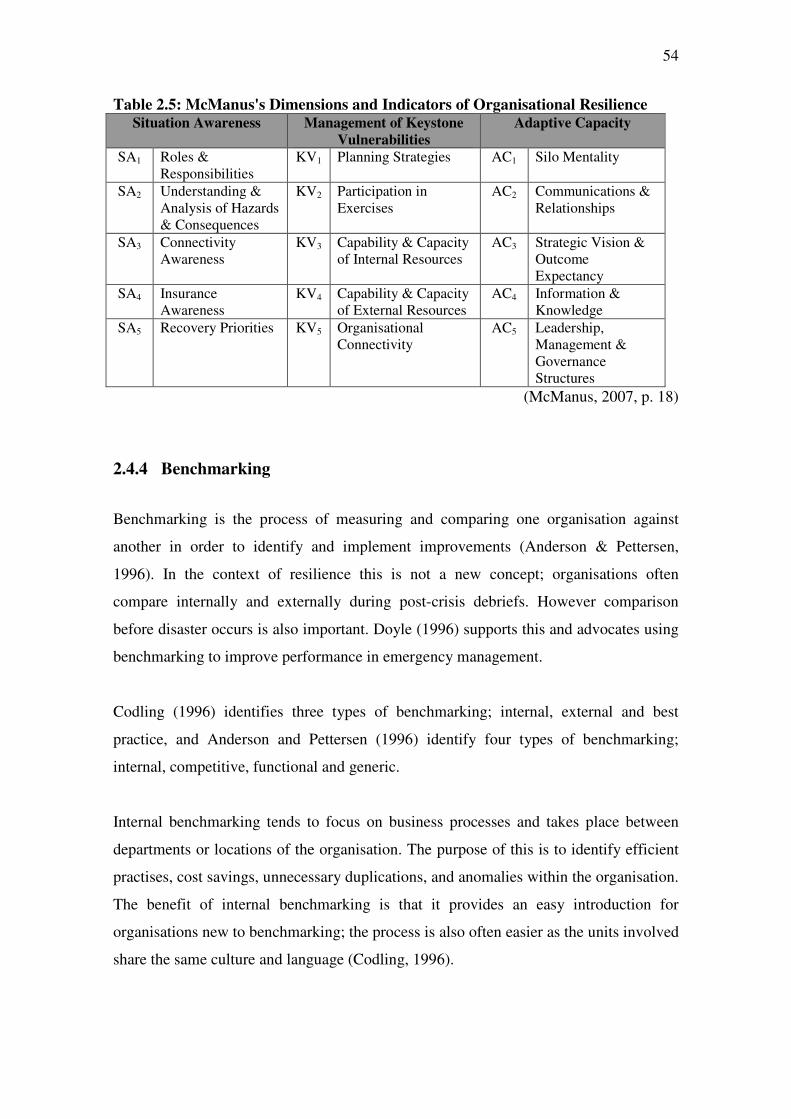
54
Table 2.5: McManus's Dimensions and Indicators of Organisational Resilience Situation Awareness Management of Keystone
Vulnerabilities
Adaptive Capacity
SA1 Roles & Responsibilities
KV1 Planning Strategies AC1 Silo Mentality
SA2 Understanding & Analysis of Hazards & Consequences
KV2 Participation in Exercises
AC2 Communications & Relationships
SA3 Connectivity Awareness
KV3 Capability & Capacity of Internal Resources
AC3 Strategic Vision & Outcome Expectancy
SA4 Insurance Awareness
KV4 Capability & Capacity of External Resources
AC4 Information & Knowledge
SA5 Recovery Priorities KV5 Organisational Connectivity
AC5 Leadership, Management & Governance Structures
(McManus, 2007, p. 18)
2.4.4 Benchmarking
Benchmarking is the process of measuring and comparing one organisation against
another in order to identify and implement improvements (Anderson & Pettersen,
1996). In the context of resilience this is not a new concept; organisations often
compare internally and externally during post-crisis debriefs. However comparison
before disaster occurs is also important. Doyle (1996) supports this and advocates using
benchmarking to improve performance in emergency management.
Codling (1996) identifies three types of benchmarking; internal, external and best
practice, and Anderson and Pettersen (1996) identify four types of benchmarking;
internal, competitive, functional and generic.
Internal benchmarking tends to focus on business processes and takes place between
departments or locations of the organisation. The purpose of this is to identify efficient
practises, cost savings, unnecessary duplications, and anomalies within the organisation.
The benefit of internal benchmarking is that it provides an easy introduction for
organisations new to benchmarking; the process is also often easier as the units involved
share the same culture and language (Codling, 1996).
55
External benchmarking focuses on comparing an organisation and its processes with
other organisations which the organisation does not share a common management or
workforce. The purpose of external benchmarking is again to identify efficiency, cost
savings and unnecessary duplications and anomalies, as well as to examine two or more
organisations in light of their differences. Codling (1996, p. 10) argues,
“The more externally focused the benchmarking exercise, the greater the
potential for removing blinkers, overturning paradigms, and over-coming
the ‘not-invented-here’ syndrome”.
Best practice benchmarking focuses on seeking out the world leader in a particular
process, and then benchmarking against them in order to identify what makes that
organisation the world leader, and how your organisation can learn from their example.
Out of the three types of benchmarking Codling (1996) argues that best practise
benchmarking offers the highest potential gains including paradigm shifts,
breakthroughs, and the most significant improvement. Generic benchmarking involves
benchmarking against an organisation in a totally unrelated industry.
Competitive benchmarking is where an organisation compares their business processes
against a direct competitor (Anderson & Pettersen, 1996). Although in theory this
sounds like a great opportunity for identifying lessons and for investigating network
resilience, organisations rarely do it because of the need to maintain competitive
advantage and protect copyright.
Functional benchmarking provides a step towards competitive benchmarking and
involves partnering with an organisation that is very close to your own, for example a
supplier or customer, who faces the same industry challenges and climate but is not a
direct competitor. This can provide an examination of an industry sector and can also
help to align processes across an organisation’s value chain.
Anderson and Pettersen (1996) also discuss what organisations compare when they
benchmark. They identify three types of comparison; performance, processes and
strategy. Comparing process and strategy can provide organisations with information on
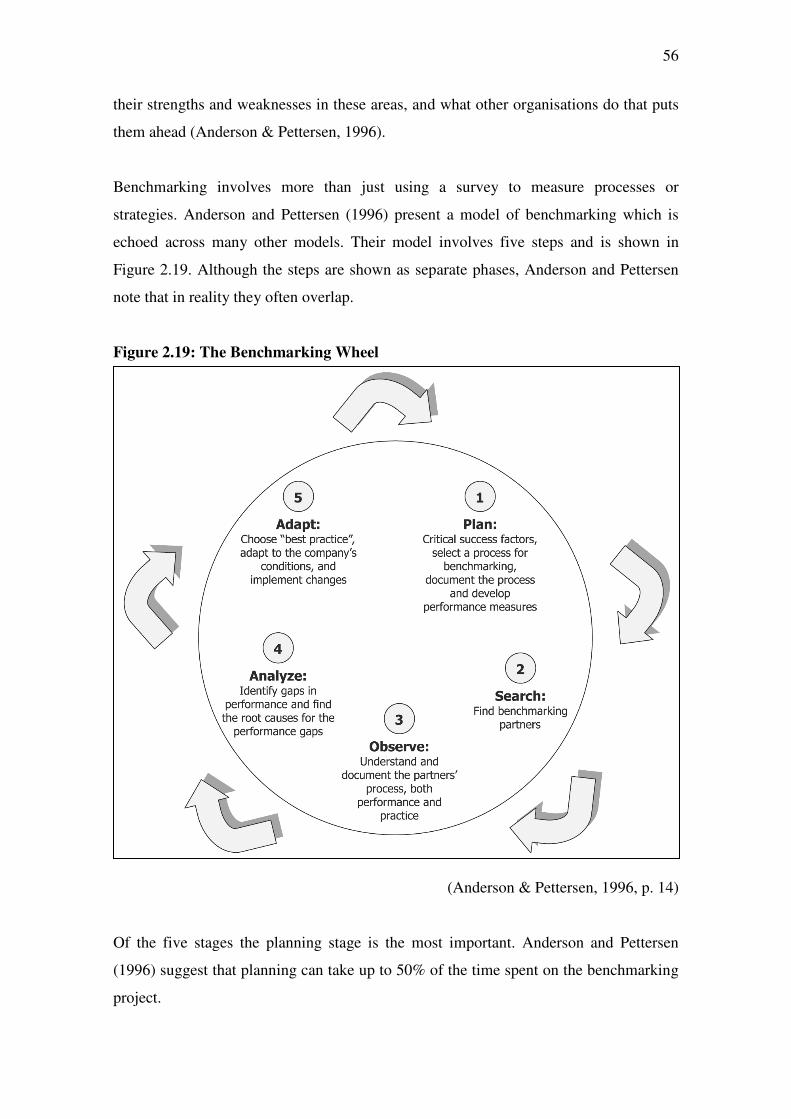
56
their strengths and weaknesses in these areas, and what other organisations do that puts
them ahead (Anderson & Pettersen, 1996).
Benchmarking involves more than just using a survey to measure processes or
strategies. Anderson and Pettersen (1996) present a model of benchmarking which is
echoed across many other models. Their model involves five steps and is shown in
Figure 2.19. Although the steps are shown as separate phases, Anderson and Pettersen
note that in reality they often overlap.
Figure 2.19: The Benchmarking Wheel
(Anderson & Pettersen, 1996, p. 14)
Of the five stages the planning stage is the most important. Anderson and Pettersen
(1996) suggest that planning can take up to 50% of the time spent on the benchmarking
project.
57
For the purposes of this thesis, external benchmarking was used to compare
measurements of resilience between organisations in Auckland. The thesis methodology
is presented in Chapter 4 and the benchmarking methodology, which has been
developed to guide the continuous use of the tool over time, is presented and discussed
in Chapter 8.
2.5 Anticipation vs. Resilience
A central theme throughout this thesis is the question of anticipation vs. resilience,
planning vs. adaptation. This section defines anticipation and resilience and discusses
how these two approaches can be combined within organisations to address
organisational resilience.
Anticipation involves predicting possible sources of failure or causes of crisis or
disaster, so that they can be planned for, mitigated or avoided altogether. Vogus and
Sutcliffe (2008) refer to this as avoiding error by design whereby a system of controls,
processes and checks is put in place to prevent possible crises from occurring. Comfort
(2001, p. 146) argues,
“A strategy of anticipation builds upon a careful assessment of the
community to identify not only its vulnerabilities to risk, but also likely
points of strength and safety”.
Hurley-Hanson (2006) emphasises the importance of developing crisis response plans
and provides numerous examples, mainly in relation to September 11th, of successful
crisis responses enabled by planning. However Boin and McConnell (2007, p. 53)
discuss critical infrastructure breakdowns and argue that “…prevention and planning
come with serious shortcomings”. Valle (1999) highlights this when he discusses an
anticipatory approach to organising, where leaders anticipate problems by focusing on
rules, procedures and policies and discourage deviation from them. These leaders
reward those members of staff who follow the rules and this also serves to discourage
innovation, improvisation and creativity. Valle (1999) goes on to note that an
58
anticipatory approach is more suited to environments characterised by stability and
predictable outcomes.
In contrast resilience, as discussed in Section 2.4, involves adaptation to changing
environments. Vogus and Sutcliffe (2008) discuss the resilience approach and note that
resilient organisations recognise that it is impossible to prevent all crises and disasters
all of the time. Instead they monitor their organisation as a system with inputs and
outputs, the characteristics of which can provide information about the health of the
system. Comfort (2001, p. 146) argues,
“A strategy of resilience identifies the capacity of a community to mobilise
in response to a threat, once it has occurred”.
Here she notes that resilience is also about a capacity to act and refers to it as an
emergent response to a threat, rather than an existing property. Comfort (1994)
discusses self-organisation and adaptation as part of resilience and notes that
organisations often restructure the way in which they mobilise and manage resources as
they progress through the response.
Egan (2007, p. 8) argues that anticipation and resilience are not mutually exclusive and
that “…anticipatory change…should be based on developing greater resilience”.
Wildavsky (1998) discusses ways to reduce risk and proposes a balance between
anticipation and resilience. Comfort (2001) discusses Wildavsky’s work and argues that
disaster management practices are moving towards a combination of anticipation and
resilience strategies. She goes on to explain that this combination provides a dynamic
tension which, if managed effectively can produce effective response strategies
(Comfort, et al., 2001). Boin and Lagadec (2000, p. 188) also suggest a two-pronged
approach and state “While we agree that resilience is the key to coping, it is necessary
to organise for resilience”. Here they suggest that the anticipatory approach, including
planning, is used to enable organisations to be resilient. Planning and formalising
response arrangements in advance means that the organisation is free, at the time of
crisis, to be much more adaptive and resilient in its response (Hurley-Hanson, 2006).
59
Weick and Sutcliffe (2007) discuss high reliability organisations (HROs) as resilient
organisations, and present one possible resolution of the conflict between anticipatory
and resilience strategies. They go on to identify 3 principles of anticipation and 2
principles of containment which they argue characterise HROs. The 3 principles of
anticipation are preoccupation with failure, reluctance to simplify, and sensitivity to
operations.
Weick and Sutcliffe (2007) discuss organisations’ preoccupation with failure as their
understanding that it is impossible to prevent all accidents and crises from happening.
Instead, HROs look to identify weak signals, or early warning signals, which will
enable them to avoid the accumulation of unnoticed events which can lead to disaster
(Turner, 1976). In detecting these potential failures, Weick and Sutcliffe (2007) also
note that HROs question their organisations’ assumptions and accepted ways of
working. HROs are concerned with how their expectations or assumptions can mislead
them, or mask potential crises from their attention. HROs are reluctant to simplify
problems or the way they view systems, because this means losing sight of some of the
complexity which has an impact on the possible outcomes of their actions. An
understanding of the complexity and coupling of their organisation as a system is also
important for HROs sensitivity to operations. HROs monitor their performance and are
responsive to unexpected changes or deviations in the system’s performance, regardless
of whether they look important at the time or not (Weick & Sutcliffe, 2007).
Weick and Sutcliffe (2007) also identify 3 problems posed by anticipation and planning,
which provide evidence of the need for a combined anticipation and resilience strategy.
Firstly, plans can cause complacency and mindlessness. They formalise the expectations
of the organisation to such an extent, that the ‘preoccupation with failure’ and
‘reluctance to simply’ are much more difficult to achieve (Weick & Sutcliffe, 2007).
Secondly, plans limit organisations’ view of what to expect and what can be achieved
during an emergency response. Although this may not be their intention, plans appear to
specify that a crisis will occur in a certain way, however there are no routine crises
(Boin & Lagadec, 2000). Thirdly, plans promote a standardised response to crisis which
discourages innovation and improvisation (Weick & Sutcliffe, 2007). Crichton et al.
(2009) echo this and argue that planning encourages blindness to new and emerging
risks.
60
Weick and Sutcliffe (2007) discuss the idea of containment as minimising the impact or
escalation of an unexpected crisis that has occurred. They go on to identify 2 principles
of containment which are commitment to resilience, and deference to expertise.
Commitment to resilience, which is also discussed in Section 3.3.1, concerns
organisations’ ability to make sense of emerging patterns and a mind-set and culture
that favours organisational learning from errors as opposed to purely the prevention of
errors (Weick & Sutcliffe, 2007). This means that the organisation is focused on
increasing its resilience and is able to prioritise resilience to the extent that resources for
addressing resilience issues can be made available. This commitment is also related to
what Pearson and Clair (1998) refer to as executive perceptions about risk which are
one of the drivers of success of a resilience management program.
Weick and Sutcliffe (2007) argue that during business-as-usual all organisations,
including HRO’s, demonstrate deference to the powerful. This means that decisions are
made based on hierarchical position and delegated responsibility. However as the pace
of change increases and a crisis begins, HROs push decision making down to the front
line of the organisation where people have access to better information and expertise to
make informed decisions which incorporate the complexity of the system.
This combination of anticipation and resilience is important for organisations that need
to be both planned and adaptive in order to be competitive across a range of
environmental changes and shifts.
2.6 Research Questions
Despite the organisational resilience theories and concepts reviewed so far, key
questions still remain and this thesis attempts to answer a few of them. This section
presents the research questions which will be answered through this thesis. A discussion
of how, and where in the thesis, each research question is answered is also included.
Each of the research questions is also linked to the aims and objectives discussed in
Section 1.3.
61
Research Question 1: What social or behavioural indicators influence and
determine organisations’ resilience?
To develop a tool to measure and benchmark organisations’ resilience, it is necessary to
identify indicators that can be used to measure organisational resilience. Organisational
resilience research was reviewed and updated through a literature review and a
workshop to identify possible social and behavioural indicators of organisational
resilience. The indicator literature review is presented in Chapter 3, and a discussion of
the workshop is presented in Section 3.2. The proposed indicators were tested using a
random sample of Auckland organisations. The results and analysis, including a factor
analysis, as well as a new model of organisational resilience are presented in Chapter 6.
This satisfies objectives 1 and 3 as discussed in Section 1.3.
Research Question 2: What metrics can be developed to measure the indicators of
organisational resilience?
To measure organisational resilience it is important to develop robust metrics and
scales. Metrics and scales were developed to measure the proposed indicators of
organisational resilience using the literature reviews and indicator definitions presented
in Chapter 3. The proposed metrics were then pre-tested and refined through the pilot
study which is presented in Chapter 5. This satisfies objective 2 as discussed in Section
1.3. Cronbach’s alpha was used to test the reliability of the metrics and scales and the
alphas for each scale are discussed alongside the metrics developed in Chapter 6. This
satisfies objective 3 as discussed in Section 1.3.
Research Question 3: What conclusions can be drawn from the data about
organisational resilience in the Auckland region?
It is important to identify what information the resilience measurement tool provides
and to discuss the usefulness of the information. As part of developing the resilience
measurement tool, it was tested using a random sample of Auckland organisations. The
results of the Auckland organisations are presented in Chapter 7; this satisfies objective
4 as discussed in Section 1.3.
62
Research Question 4: What is a suitable benchmarking methodology for
organisational resilience?
A resilience benchmarking methodology was designed to guide the ongoing use of the
resilience measurement tool developed through this thesis. The benchmarking
methodology draws on various elements of the research including the literature review,
survey methodology, the administration of the survey in the Auckland test, and the
feedback from organisations that took part in the research. This satisfies objective 2 as
discussed in Section 1.3 and is presented in Chapter 8.
63
Chapter 3 – Identifying Indicators of Organisational
Resilience
McManus (2007) used grounded theory to explore organisational resilience in New
Zealand. She conducted a qualitative study using semi-structured interviews, with ten
case study organisations, to assess their resilience qualities from 2005-2007. From these
case studies, McManus hypothesised a model where Relative Overall Resilience (ROR)
is composed of three dimensions (situation awareness, management of keystone
vulnerabilities and adaptive capacity), and also proposed fifteen indictors of
organisational resilience; five for each dimension.
McManus’s (2007) ROR model was selected as a starting point for this research
because it was developed from an operational definition of organisational resilience,
that clearly identifies its component parts, and was developed within the New Zealand
context. The operational definition reflects the systems approach taken throughout this
thesis, and also provides a good basis for the development of metrics. A discussion of
the component parts and the broad approach of the ROR model, can be found in Section
2.4.3, McManus (2007) and McManus et al. (2008).
Before developing the resilience measurement tool based on McManus’s ROR model, it
is important to assess whether the model is applicable to a wider population of
organisations. McManus’s case study organisations were selected to represent a range of
organisation types and sizes. However, McManus (2007, p. 113) notes that the
indicators identified through her research are limited to the case study organisations. It
is therefore important that the ROR model is reviewed before developing the resilience
measurement tool. In its initial stages, the measurement tool should encompass all
possible indicators of organisational resilience. It can then be refined during the analysis
to find the most parsimonious model of organisational resilience, and the tool can be
developed so that it is applicable to as many organisations as possible.
This chapter discusses a mini-workshop and literature review that were used to review
the definition and indicators of organisational resilience proposed by McManus (2007),
as part of her Relative Overall Resilience (ROR) model. Through the mini-workshop
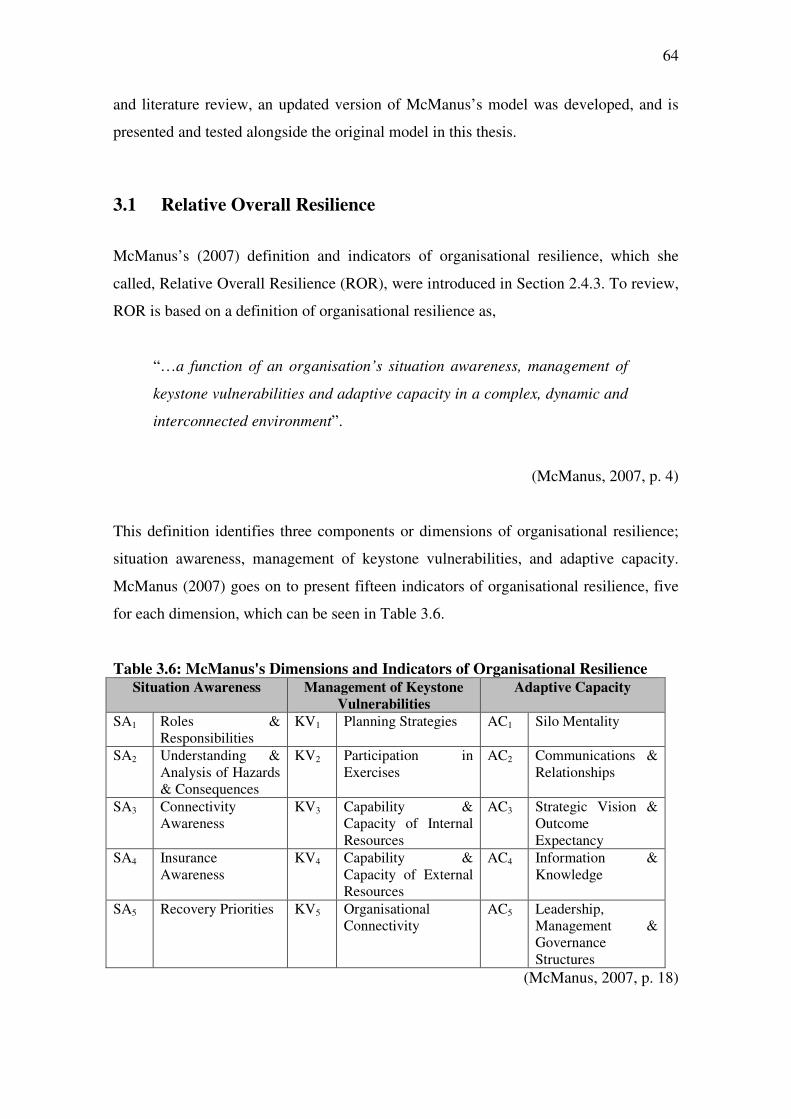
64
and literature review, an updated version of McManus’s model was developed, and is
presented and tested alongside the original model in this thesis.
3.1 Relative Overall Resilience
McManus’s (2007) definition and indicators of organisational resilience, which she
called, Relative Overall Resilience (ROR), were introduced in Section 2.4.3. To review,
ROR is based on a definition of organisational resilience as,
“…a function of an organisation’s situation awareness, management of
keystone vulnerabilities and adaptive capacity in a complex, dynamic and
interconnected environment”.
(McManus, 2007, p. 4)
This definition identifies three components or dimensions of organisational resilience;
situation awareness, management of keystone vulnerabilities, and adaptive capacity.
McManus (2007) goes on to present fifteen indicators of organisational resilience, five
for each dimension, which can be seen in Table 3.6.
Table 3.6: McManus's Dimensions and Indicators of Organisational Resilience
Situation Awareness Management of Keystone
Vulnerabilities
Adaptive Capacity
SA1 Roles & Responsibilities
KV1 Planning Strategies AC1 Silo Mentality
SA2 Understanding & Analysis of Hazards & Consequences
KV2 Participation in Exercises
AC2 Communications & Relationships
SA3 Connectivity Awareness
KV3 Capability & Capacity of Internal Resources
AC3 Strategic Vision & Outcome Expectancy
SA4 Insurance Awareness
KV4 Capability & Capacity of External Resources
AC4 Information & Knowledge
SA5 Recovery Priorities KV5 Organisational Connectivity
AC5 Leadership, Management & Governance Structures
(McManus, 2007, p. 18)
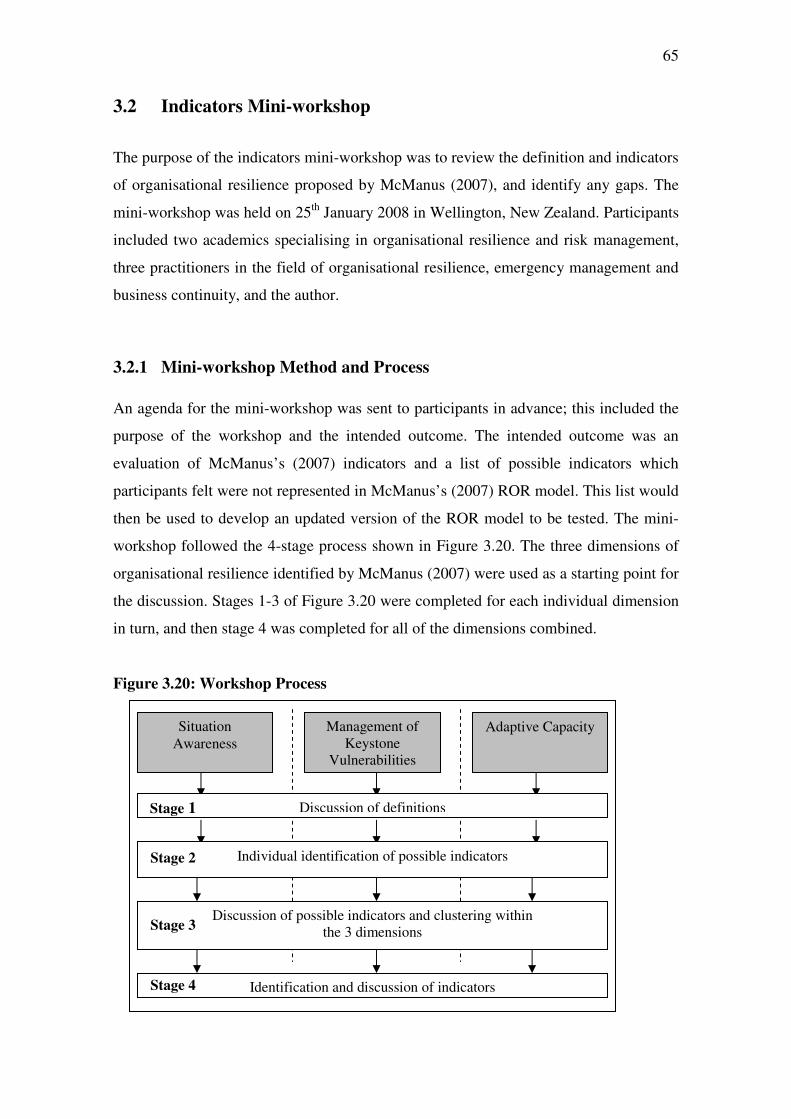
65
3.2 Indicators Mini-workshop
The purpose of the indicators mini-workshop was to review the definition and indicators
of organisational resilience proposed by McManus (2007), and identify any gaps. The
mini-workshop was held on 25th January 2008 in Wellington, New Zealand. Participants
included two academics specialising in organisational resilience and risk management,
three practitioners in the field of organisational resilience, emergency management and
business continuity, and the author.
3.2.1 Mini-workshop Method and Process
An agenda for the mini-workshop was sent to participants in advance; this included the
purpose of the workshop and the intended outcome. The intended outcome was an
evaluation of McManus’s (2007) indicators and a list of possible indicators which
participants felt were not represented in McManus’s (2007) ROR model. This list would
then be used to develop an updated version of the ROR model to be tested. The mini-
workshop followed the 4-stage process shown in Figure 3.20. The three dimensions of
organisational resilience identified by McManus (2007) were used as a starting point for
the discussion. Stages 1-3 of Figure 3.20 were completed for each individual dimension
in turn, and then stage 4 was completed for all of the dimensions combined.
Figure 3.20: Workshop Process
Situation Awareness
Management of Keystone
Vulnerabilities
Adaptive Capacity
Discussion of definitions
Individual identification of possible indicators
Discussion of possible indicators and clustering within the 3 dimensions
Identification and discussion of indicators
Stage 1
Stage 2
Stage 3
Stage 4
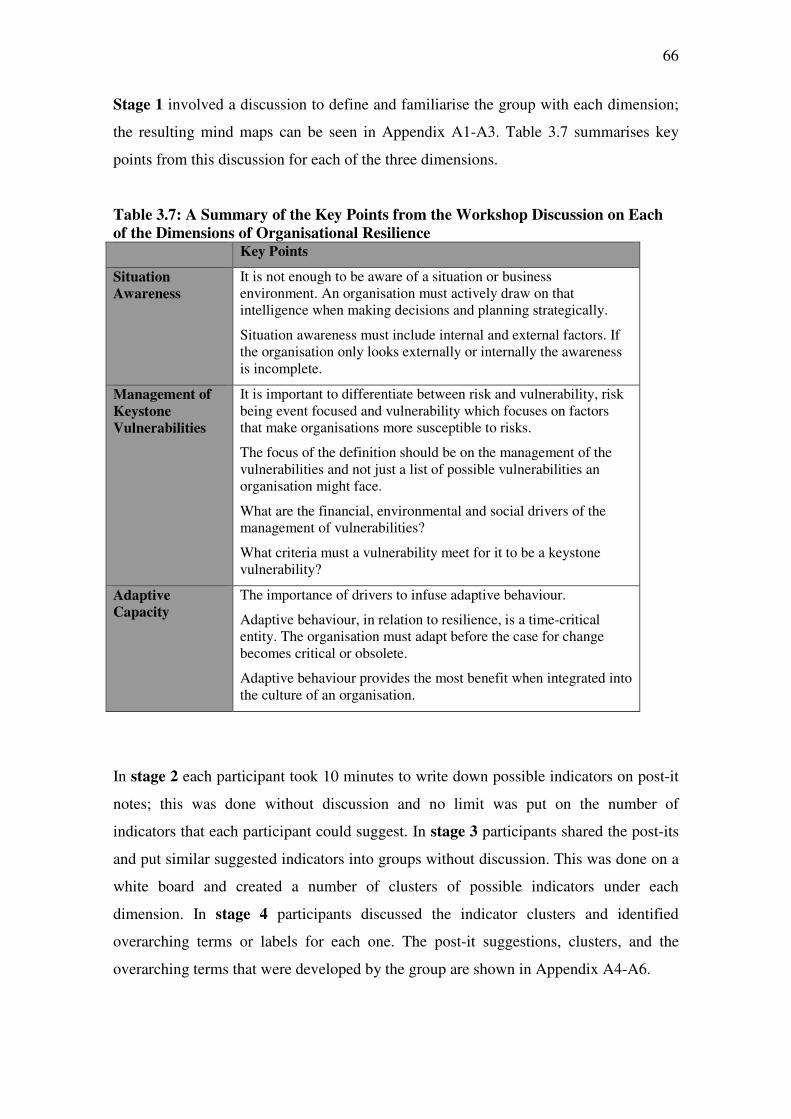
66
Stage 1 involved a discussion to define and familiarise the group with each dimension;
the resulting mind maps can be seen in Appendix A1-A3. Table 3.7 summarises key
points from this discussion for each of the three dimensions.
Table 3.7: A Summary of the Key Points from the Workshop Discussion on Each
of the Dimensions of Organisational Resilience Key Points
Situation
Awareness
It is not enough to be aware of a situation or business environment. An organisation must actively draw on that intelligence when making decisions and planning strategically.
Situation awareness must include internal and external factors. If the organisation only looks externally or internally the awareness is incomplete.
Management of
Keystone
Vulnerabilities
It is important to differentiate between risk and vulnerability, risk being event focused and vulnerability which focuses on factors that make organisations more susceptible to risks.
The focus of the definition should be on the management of the vulnerabilities and not just a list of possible vulnerabilities an organisation might face.
What are the financial, environmental and social drivers of the management of vulnerabilities?
What criteria must a vulnerability meet for it to be a keystone vulnerability?
Adaptive
Capacity
The importance of drivers to infuse adaptive behaviour.
Adaptive behaviour, in relation to resilience, is a time-critical entity. The organisation must adapt before the case for change becomes critical or obsolete.
Adaptive behaviour provides the most benefit when integrated into the culture of an organisation.
In stage 2 each participant took 10 minutes to write down possible indicators on post-it
notes; this was done without discussion and no limit was put on the number of
indicators that each participant could suggest. In stage 3 participants shared the post-its
and put similar suggested indicators into groups without discussion. This was done on a
white board and created a number of clusters of possible indicators under each
dimension. In stage 4 participants discussed the indicator clusters and identified
overarching terms or labels for each one. The post-it suggestions, clusters, and the
overarching terms that were developed by the group are shown in Appendix A4-A6.
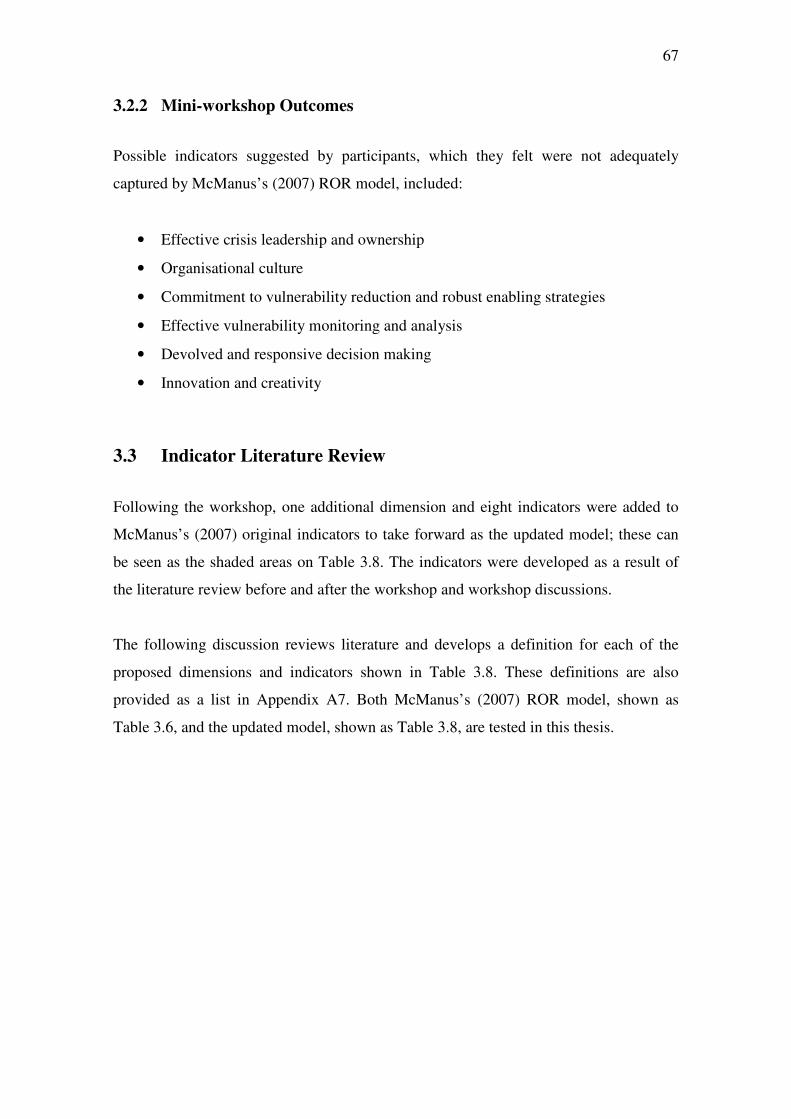
67
3.2.2 Mini-workshop Outcomes
Possible indicators suggested by participants, which they felt were not adequately
captured by McManus’s (2007) ROR model, included:
• Effective crisis leadership and ownership
• Organisational culture
• Commitment to vulnerability reduction and robust enabling strategies
• Effective vulnerability monitoring and analysis
• Devolved and responsive decision making
• Innovation and creativity
3.3 Indicator Literature Review
Following the workshop, one additional dimension and eight indicators were added to
McManus’s (2007) original indicators to take forward as the updated model; these can
be seen as the shaded areas on Table 3.8. The indicators were developed as a result of
the literature review before and after the workshop and workshop discussions.
The following discussion reviews literature and develops a definition for each of the
proposed dimensions and indicators shown in Table 3.8. These definitions are also
provided as a list in Appendix A7. Both McManus’s (2007) ROR model, shown as
Table 3.6, and the updated model, shown as Table 3.8, are tested in this thesis.
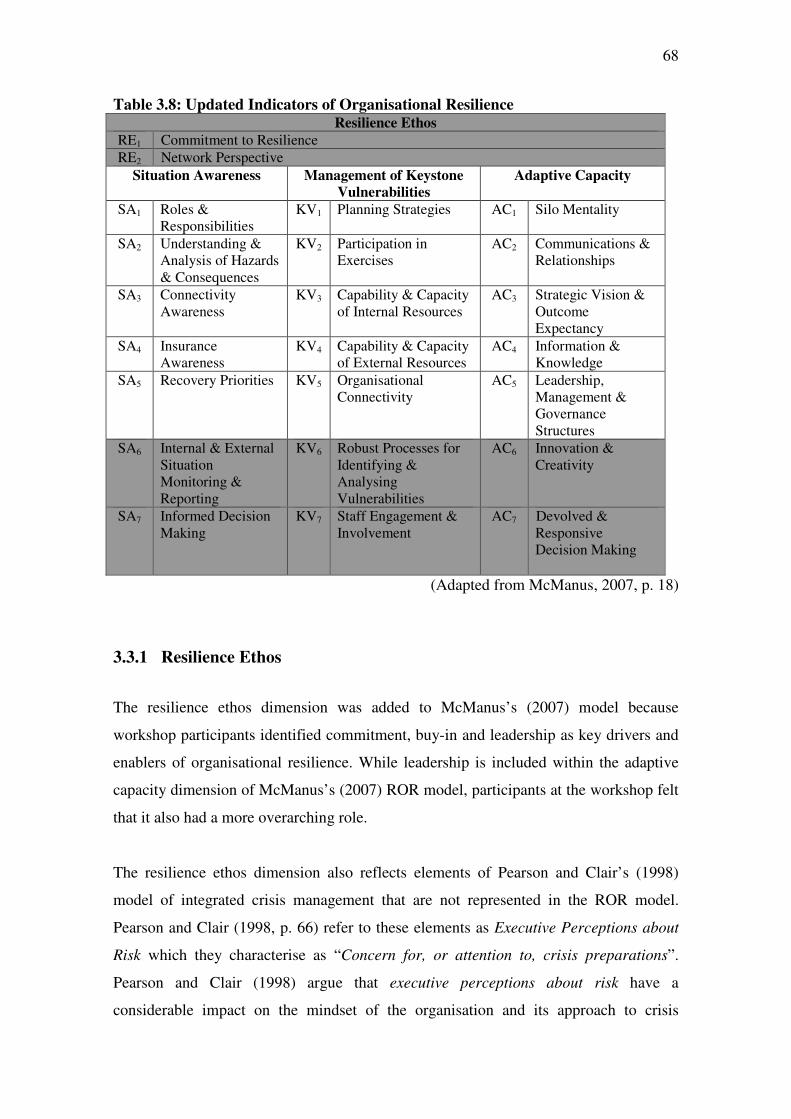
68
Table 3.8: Updated Indicators of Organisational Resilience Resilience Ethos
RE1 Commitment to Resilience
RE2 Network Perspective
Situation Awareness Management of Keystone
Vulnerabilities
Adaptive Capacity
SA1 Roles & Responsibilities
KV1 Planning Strategies AC1 Silo Mentality
SA2 Understanding & Analysis of Hazards & Consequences
KV2 Participation in Exercises
AC2 Communications & Relationships
SA3 Connectivity Awareness
KV3 Capability & Capacity of Internal Resources
AC3 Strategic Vision & Outcome Expectancy
SA4 Insurance Awareness
KV4 Capability & Capacity of External Resources
AC4 Information & Knowledge
SA5 Recovery Priorities KV5 Organisational Connectivity
AC5 Leadership, Management & Governance Structures
SA6 Internal & External Situation Monitoring & Reporting
KV6 Robust Processes for Identifying & Analysing Vulnerabilities
AC6 Innovation & Creativity
SA7 Informed Decision Making
KV7 Staff Engagement & Involvement
AC7 Devolved & Responsive Decision Making
(Adapted from McManus, 2007, p. 18)
3.3.1 Resilience Ethos
The resilience ethos dimension was added to McManus’s (2007) model because
workshop participants identified commitment, buy-in and leadership as key drivers and
enablers of organisational resilience. While leadership is included within the adaptive
capacity dimension of McManus’s (2007) ROR model, participants at the workshop felt
that it also had a more overarching role.
The resilience ethos dimension also reflects elements of Pearson and Clair’s (1998)
model of integrated crisis management that are not represented in the ROR model.
Pearson and Clair (1998, p. 66) refer to these elements as Executive Perceptions about
Risk which they characterise as “Concern for, or attention to, crisis preparations”.
Pearson and Clair (1998) argue that executive perceptions about risk have a
considerable impact on the mindset of the organisation and its approach to crisis
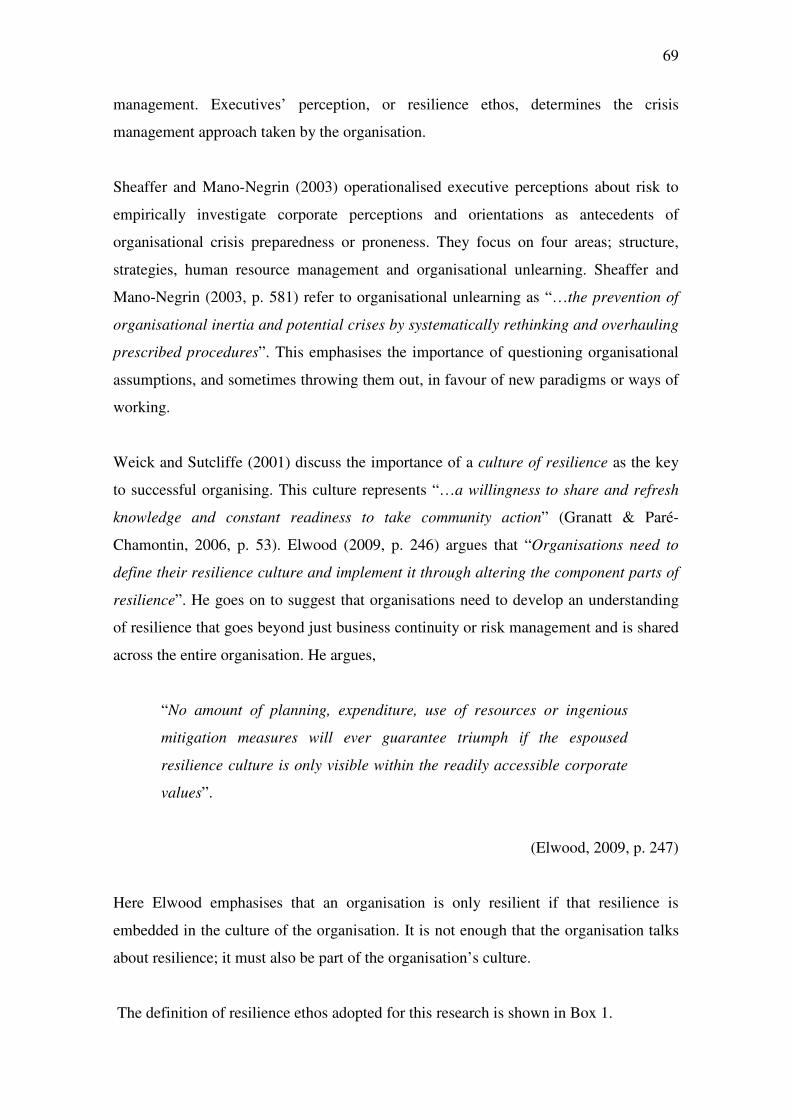
69
management. Executives’ perception, or resilience ethos, determines the crisis
management approach taken by the organisation.
Sheaffer and Mano-Negrin (2003) operationalised executive perceptions about risk to
empirically investigate corporate perceptions and orientations as antecedents of
organisational crisis preparedness or proneness. They focus on four areas; structure,
strategies, human resource management and organisational unlearning. Sheaffer and
Mano-Negrin (2003, p. 581) refer to organisational unlearning as “…the prevention of
organisational inertia and potential crises by systematically rethinking and overhauling
prescribed procedures”. This emphasises the importance of questioning organisational
assumptions, and sometimes throwing them out, in favour of new paradigms or ways of
working.
Weick and Sutcliffe (2001) discuss the importance of a culture of resilience as the key
to successful organising. This culture represents “…a willingness to share and refresh
knowledge and constant readiness to take community action” (Granatt & Paré-
Chamontin, 2006, p. 53). Elwood (2009, p. 246) argues that “Organisations need to
define their resilience culture and implement it through altering the component parts of
resilience”. He goes on to suggest that organisations need to develop an understanding
of resilience that goes beyond just business continuity or risk management and is shared
across the entire organisation. He argues,
“No amount of planning, expenditure, use of resources or ingenious
mitigation measures will ever guarantee triumph if the espoused
resilience culture is only visible within the readily accessible corporate
values”.
(Elwood, 2009, p. 247)
Here Elwood emphasises that an organisation is only resilient if that resilience is
embedded in the culture of the organisation. It is not enough that the organisation talks
about resilience; it must also be part of the organisation’s culture.
The definition of resilience ethos adopted for this research is shown in Box 1.
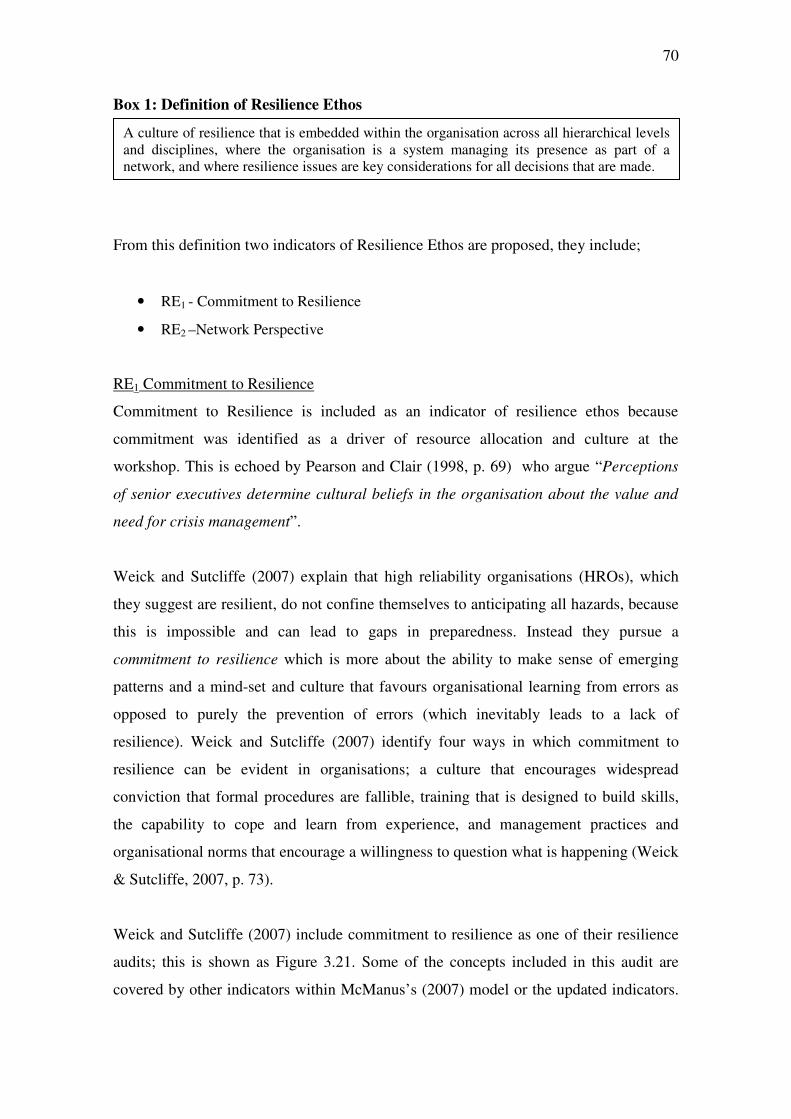
70
Box 1: Definition of Resilience Ethos
From this definition two indicators of Resilience Ethos are proposed, they include;
• RE1 - Commitment to Resilience
• RE2 –Network Perspective
RE1 Commitment to Resilience
Commitment to Resilience is included as an indicator of resilience ethos because
commitment was identified as a driver of resource allocation and culture at the
workshop. This is echoed by Pearson and Clair (1998, p. 69) who argue “Perceptions
of senior executives determine cultural beliefs in the organisation about the value and
need for crisis management”.
Weick and Sutcliffe (2007) explain that high reliability organisations (HROs), which
they suggest are resilient, do not confine themselves to anticipating all hazards, because
this is impossible and can lead to gaps in preparedness. Instead they pursue a
commitment to resilience which is more about the ability to make sense of emerging
patterns and a mind-set and culture that favours organisational learning from errors as
opposed to purely the prevention of errors (which inevitably leads to a lack of
resilience). Weick and Sutcliffe (2007) identify four ways in which commitment to
resilience can be evident in organisations; a culture that encourages widespread
conviction that formal procedures are fallible, training that is designed to build skills,
the capability to cope and learn from experience, and management practices and
organisational norms that encourage a willingness to question what is happening (Weick
& Sutcliffe, 2007, p. 73).
Weick and Sutcliffe (2007) include commitment to resilience as one of their resilience
audits; this is shown as Figure 3.21. Some of the concepts included in this audit are
covered by other indicators within McManus’s (2007) model or the updated indicators.
A culture of resilience that is embedded within the organisation across all hierarchical levels and disciplines, where the organisation is a system managing its presence as part of a network, and where resilience issues are key considerations for all decisions that are made.
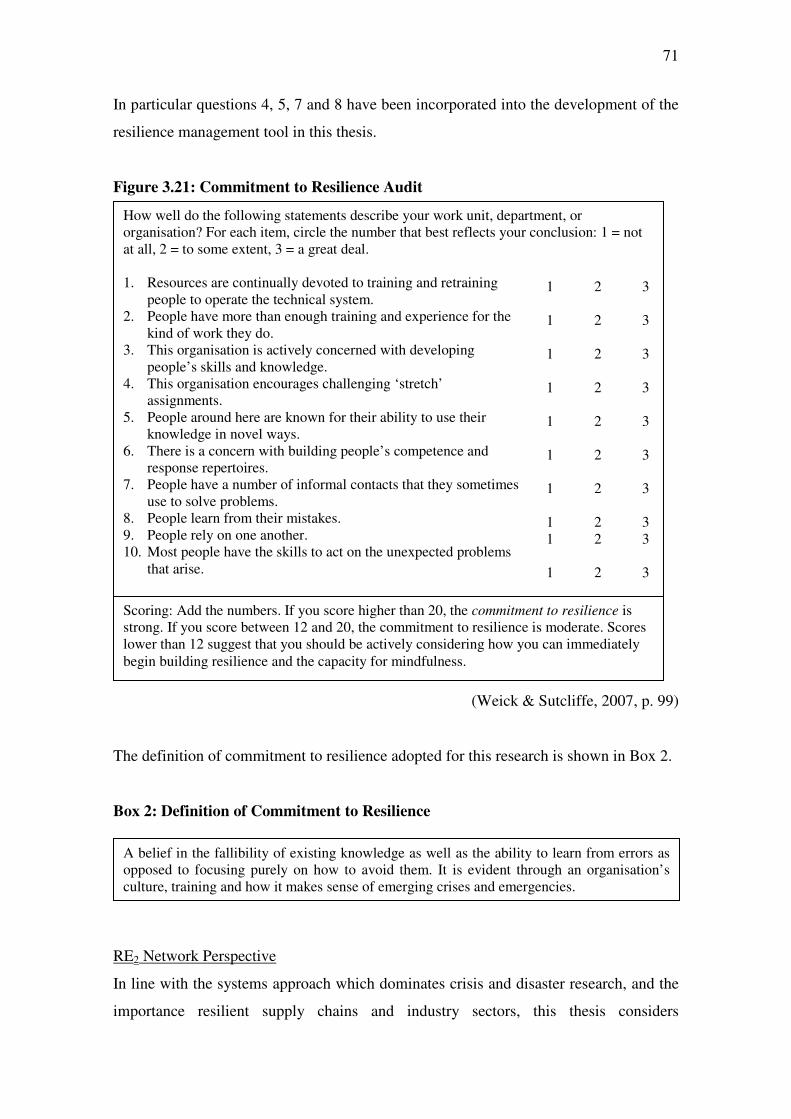
71
In particular questions 4, 5, 7 and 8 have been incorporated into the development of the
resilience management tool in this thesis.
Figure 3.21: Commitment to Resilience Audit
(Weick & Sutcliffe, 2007, p. 99)
The definition of commitment to resilience adopted for this research is shown in Box 2.
Box 2: Definition of Commitment to Resilience
RE2 Network Perspective
In line with the systems approach which dominates crisis and disaster research, and the
importance resilient supply chains and industry sectors, this thesis considers
A belief in the fallibility of existing knowledge as well as the ability to learn from errors as opposed to focusing purely on how to avoid them. It is evident through an organisation’s culture, training and how it makes sense of emerging crises and emergencies.
How well do the following statements describe your work unit, department, or organisation? For each item, circle the number that best reflects your conclusion: 1 = not at all, 2 = to some extent, 3 = a great deal. 1. Resources are continually devoted to training and retraining
people to operate the technical system. 2. People have more than enough training and experience for the
kind of work they do. 3. This organisation is actively concerned with developing
people’s skills and knowledge. 4. This organisation encourages challenging ‘stretch’
assignments. 5. People around here are known for their ability to use their
knowledge in novel ways. 6. There is a concern with building people’s competence and
response repertoires. 7. People have a number of informal contacts that they sometimes
use to solve problems. 8. People learn from their mistakes. 9. People rely on one another. 10. Most people have the skills to act on the unexpected problems
that arise.
1 2 3
1 2 3
1 2 3
1 2 3
1 2 3
1 2 3
1 2 3
1 2 3 1 2 3
1 2 3
Scoring: Add the numbers. If you score higher than 20, the commitment to resilience is strong. If you score between 12 and 20, the commitment to resilience is moderate. Scores lower than 12 suggest that you should be actively considering how you can immediately begin building resilience and the capacity for mindfulness.
72
communities of organisations as networks, and how this relates to their resilience ethos.
Benini (1999) argues that the network structure is becoming the dominant pattern of
organisation as a response to increased global competition and interdependency. This is
reflected by Starr et al. (2003b, p. 29) who argue,
“Over the course of the last half century, the vertically integrated company
has given way to the networked enterprise, an organisational structure
characterised by greater agility and adaptability”.
Borgatti and Foster (2003) discuss network organisations, a concept that became
popular in the 1980s. Network organisations are characterised by relationships that rely
on trust and embedded cultural values, and achieve a balance between flexibility and
control. Borgatti and Foster (2003, p. 996) go on to identify some of the features of
network organisations including “…flat hierarchy, empowered workers, self-governing
teams, heavy use of temporary structures (e.g. project teams, task forces), lateral
communication, knowledge-based”.
A culture of network resilience, having a network perspective, is important not only
between organisations but also within organisations. McManus (2007, p. 5) argues that
“…much of the risk that organisations face is tied up in their intrinsic
interconnectedness; the organisational network”. The inherent interdependency
between organisations is important for organisational resilience because it can lead to
rapid changes in the business environment and the escalation of crises. This occurs due
to the level of coupling between two organisations or tasks. Organisations or tasks that
are tightly coupled have little room for error; change in one will affect change in the
other - escalation. Alternatively, some organisations or tasks may be loosely coupled;
this means that while they are linked, there is more lag time built into the relationship
and changes in one may or may not cause significant changes in the other, and these
changes may be delayed (Perrow, 1999). In the context of a culture of network
resilience this means that a resilient organisation will be aware of network
interdependencies and coupling. However for this to be possible the organisation’s
culture must enable that awareness, and the organisation’s ability to create and maintain
the desired structure.
73
The definition of network perspective is shown in Box 3.
Box 3: Definition of Network Perspective
3.3.2 Situation Awareness
The term situation awareness was first used in connection with the military where pilots
are required to understand, assimilate and act on large volumes of information in order
to perform their roles (Endsley, 1995). Endsley et al. (2003, p. 13) define situation
awareness as,
“…being aware of what is happening around you and understanding what
that information means to you now and in the future”.
They go on to note that the term is usually applied to operational situations. One
example of this is Masys (2005) application to airline operation and safety which
argues that situation awareness is distributed across teams, groups and organisations, as
well as human and machine agents. Masys (2005) draws on Stout and Salas (1998) and
argues that situation awareness (SA),
“…should be regarded as an essential requirement for competent
performance in dynamic environments, with inaccurate and incomplete SA
often leading to dangerous and life-threatening consequences”.
(Masys, 2005, p. 548)
Crichton et al. (2005) echo this when they discuss incident command skills in the oil
industry. They argue that situation awareness is a vital command skill in a crisis
because the first step in decision making is to evaluate the situation. Roth et al. (2006)
discuss the importance of shared situation awareness as an informal cooperative
strategy between railroad workers which “…facilitates work, and contributes to the
A culture that acknowledges organisational interdependencies and realises the importance of actively seeking to manage those interdependencies to better prevent or respond to crises and emergencies. It is a culture where the drivers of organisational resilience, and the motivators to engage with resilience, are present.
74
overall efficiency, safety, and resilience…of railroad operations” (Roth, et al., 2006, p.
967). This informal cooperative strategy, which occurs within the organisation’s
culture, is the mechanism through which the organisation shares or communicates their
situation awareness.
The definition of situation awareness adopted for this research is shown in Box 4.
Box 4: Definition of Situation Awareness
This thesis proposes seven indicators of situation awareness; these are shown below.
Indicators SA1 to SA5 are McManus’s (2007) indicators of situation awareness within
with her Relative Overall Resilience (ROR) model, and indicators SA6 and SA7 have
been added as part of the updated model discussed in Section 3.3.
• SA1 – Roles and Responsibilities
• SA2 – Understanding and Analysis of Hazards and Consequences
• SA3 – Connectivity Awareness
• SA4 – Insurance Awareness
• SA5 – Recovery Priorities
• SA6 – Internal and External Situation Monitoring and Reporting
• SA7 – Informed Decision Making
SA1 – Roles and Responsibilities
The concepts of role and responsibility form part of a widely accepted public rhetoric
and are often used interchangeably. In the context of disasters, roles and responsibilities
are continuously assigned and re-assigned. McManus et al. (2007) argue that knowledge
of one’s own role as well as the role of others is a key awareness issue. Bello et al.
(2007, p. 1) emphasise the importance of roles and responsibilities when they discuss a
Government Accountability Office report in which “…analysis following Hurricane
Katrina showed improvements were needed in leadership roles and responsibilities”.
An organisation’s understanding of its business landscape, its awareness of what is happening around it, and what that information means for the organisation now and in the future.
75
Organisations are affected by roles and responsibilities at all levels of organisational
activity and function, however it is easier to observe during the response phase. Dynes
(1986, p. 5) echoes this when he states,
“…the emergency period of sudden disasters optimise the conditions for
role “problems” and provide the best opportunity to examine the
functioning of roles”.
Robbins et al. (2003, p. 281) define roles as “A set of expected behaviour patterns
attributed to someone occupying a given position in a social unit”. This definition
includes notions of position, conveying that an individual or group holds a position
which is related to the role that they take. Vecchio (2000) discusses three different types
of role; expected role, perceived role and enacted role. An expected role is pre-defined,
accepted and formalised, and is often recorded in a job description, plan or manual. A
perceived role can also be accepted and recorded, but it is a set of actions or activities
which an individual or group themselves believe they should carry out. An enacted role
is one that an individual or group actually performs. Vecchio (2000) goes on to note that
enacted roles are more likely to reflect a person’s perceived role than their expected role
and this provides impetus for pre-disaster training for roles and responsibilities. Vecchio
(2000) describes factors that contribute to this relationship; role conflict and role
ambiguity.
Nicholson Jr. and Goh (1983, p. 149) define role conflict as, “…an incompatibility
between job tasks, resources, rules or policies and other people”. An example of this
would be a nurse who is also a parent of a young child (O’Sullivan, et al., 2009). Dynes
and Quarantelli (1986) review whether or not role conflict exists and note that different
types of disaster encourage different types of behaviour. They argue that the conditions
for role conflict are most often created by disasters such as earthquakes that occur
without warning (e.g. so that other arrangements for childcare cannot be made in
advance) and affect a large area (e.g. others in the local area that may have helped with
childcare have also been affected by the disaster).
At the same time Dynes and Quarantelli (1986) observe that while in theory, and
perhaps in normal situations, role conflict affects performance, there is no empirical or
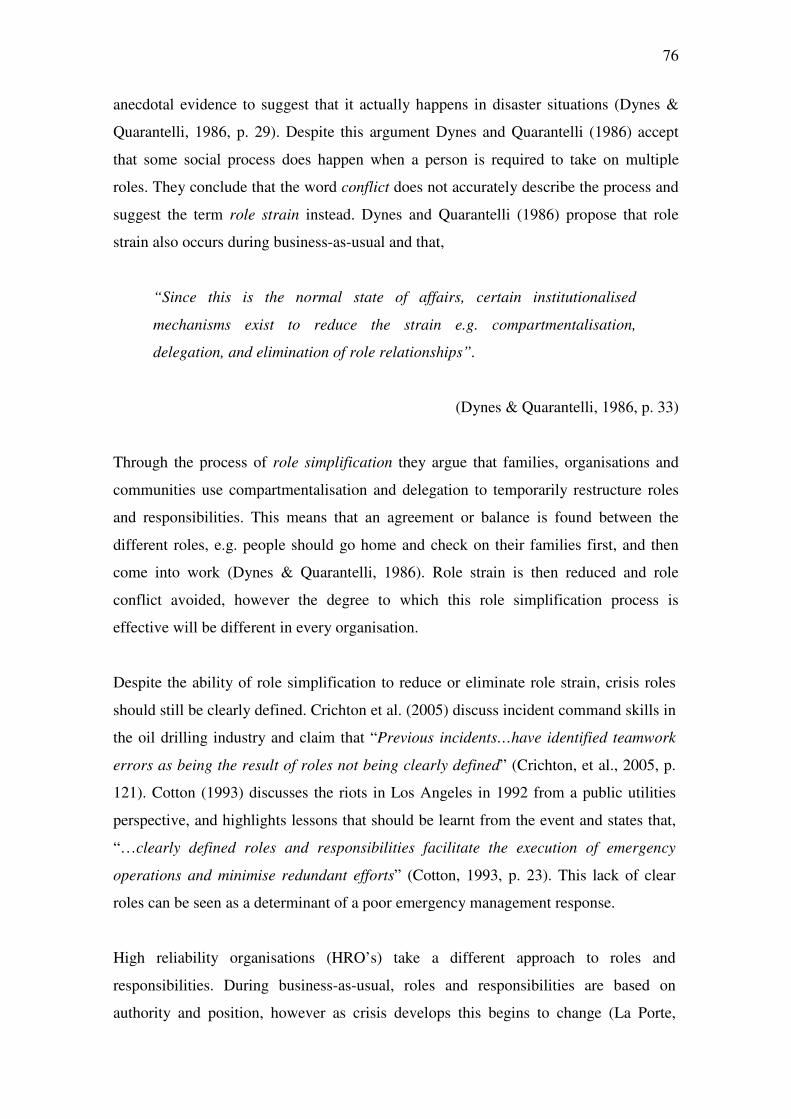
76
anecdotal evidence to suggest that it actually happens in disaster situations (Dynes &
Quarantelli, 1986, p. 29). Despite this argument Dynes and Quarantelli (1986) accept
that some social process does happen when a person is required to take on multiple
roles. They conclude that the word conflict does not accurately describe the process and
suggest the term role strain instead. Dynes and Quarantelli (1986) propose that role
strain also occurs during business-as-usual and that,
“Since this is the normal state of affairs, certain institutionalised
mechanisms exist to reduce the strain e.g. compartmentalisation,
delegation, and elimination of role relationships”.
(Dynes & Quarantelli, 1986, p. 33)
Through the process of role simplification they argue that families, organisations and
communities use compartmentalisation and delegation to temporarily restructure roles
and responsibilities. This means that an agreement or balance is found between the
different roles, e.g. people should go home and check on their families first, and then
come into work (Dynes & Quarantelli, 1986). Role strain is then reduced and role
conflict avoided, however the degree to which this role simplification process is
effective will be different in every organisation.
Despite the ability of role simplification to reduce or eliminate role strain, crisis roles
should still be clearly defined. Crichton et al. (2005) discuss incident command skills in
the oil drilling industry and claim that “Previous incidents…have identified teamwork
errors as being the result of roles not being clearly defined” (Crichton, et al., 2005, p.
121). Cotton (1993) discusses the riots in Los Angeles in 1992 from a public utilities
perspective, and highlights lessons that should be learnt from the event and states that,
“…clearly defined roles and responsibilities facilitate the execution of emergency
operations and minimise redundant efforts” (Cotton, 1993, p. 23). This lack of clear
roles can be seen as a determinant of a poor emergency management response.
High reliability organisations (HRO’s) take a different approach to roles and
responsibilities. During business-as-usual, roles and responsibilities are based on
authority and position, however as crisis develops this begins to change (La Porte,
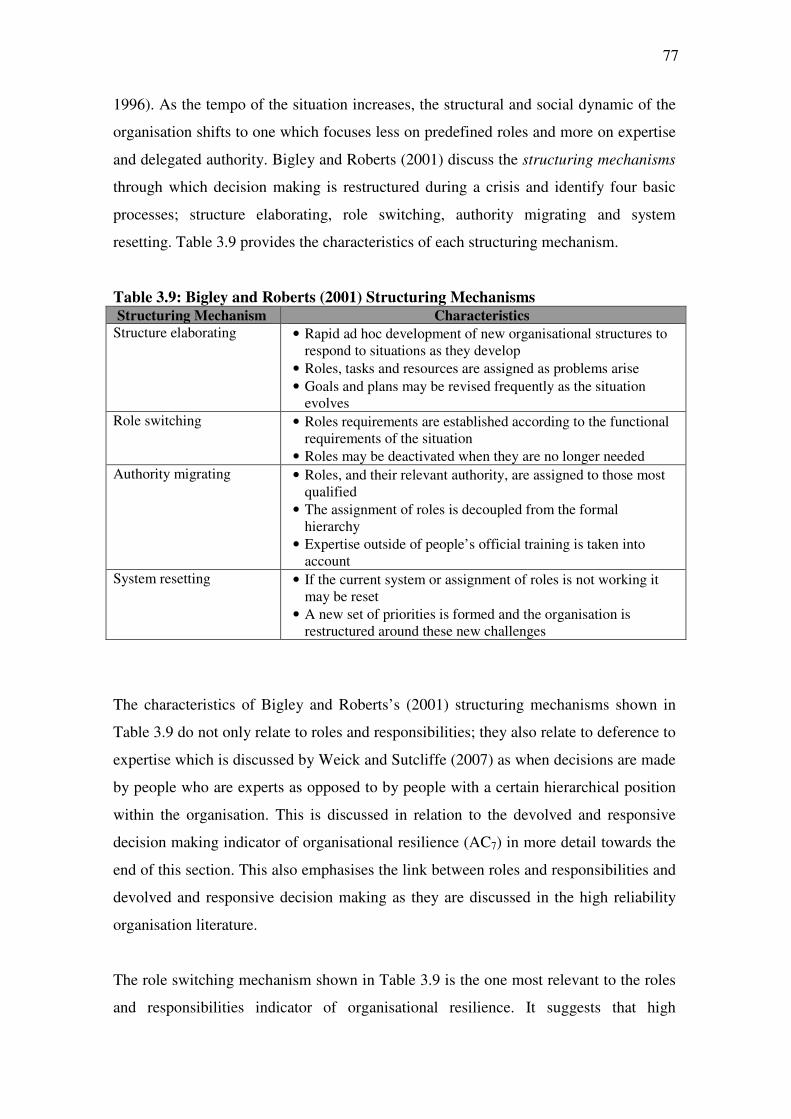
77
1996). As the tempo of the situation increases, the structural and social dynamic of the
organisation shifts to one which focuses less on predefined roles and more on expertise
and delegated authority. Bigley and Roberts (2001) discuss the structuring mechanisms
through which decision making is restructured during a crisis and identify four basic
processes; structure elaborating, role switching, authority migrating and system
resetting. Table 3.9 provides the characteristics of each structuring mechanism.
Table 3.9: Bigley and Roberts (2001) Structuring Mechanisms
Structuring Mechanism Characteristics
Structure elaborating • Rapid ad hoc development of new organisational structures to respond to situations as they develop
• Roles, tasks and resources are assigned as problems arise
• Goals and plans may be revised frequently as the situation evolves
Role switching • Roles requirements are established according to the functional requirements of the situation
• Roles may be deactivated when they are no longer needed
Authority migrating • Roles, and their relevant authority, are assigned to those most qualified
• The assignment of roles is decoupled from the formal hierarchy
• Expertise outside of people’s official training is taken into account
System resetting • If the current system or assignment of roles is not working it may be reset
• A new set of priorities is formed and the organisation is restructured around these new challenges
The characteristics of Bigley and Roberts’s (2001) structuring mechanisms shown in
Table 3.9 do not only relate to roles and responsibilities; they also relate to deference to
expertise which is discussed by Weick and Sutcliffe (2007) as when decisions are made
by people who are experts as opposed to by people with a certain hierarchical position
within the organisation. This is discussed in relation to the devolved and responsive
decision making indicator of organisational resilience (AC7) in more detail towards the
end of this section. This also emphasises the link between roles and responsibilities and
devolved and responsive decision making as they are discussed in the high reliability
organisation literature.
The role switching mechanism shown in Table 3.9 is the one most relevant to the roles
and responsibilities indicator of organisational resilience. It suggests that high
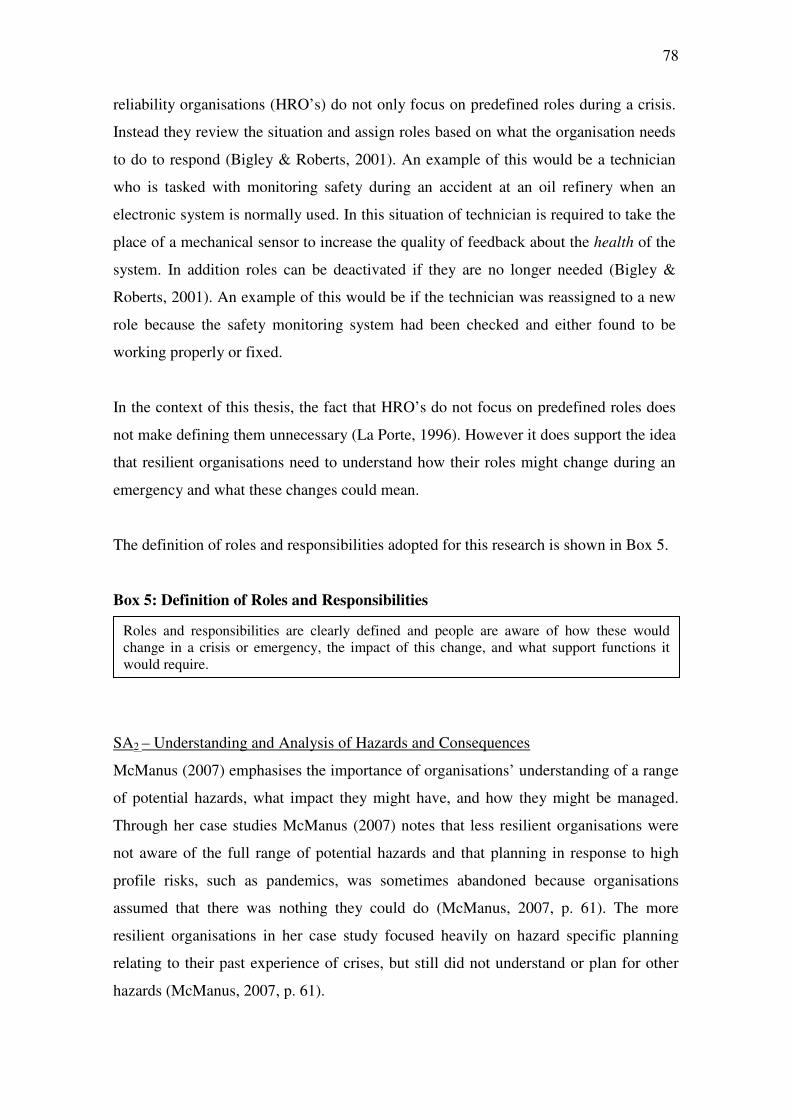
78
reliability organisations (HRO’s) do not only focus on predefined roles during a crisis.
Instead they review the situation and assign roles based on what the organisation needs
to do to respond (Bigley & Roberts, 2001). An example of this would be a technician
who is tasked with monitoring safety during an accident at an oil refinery when an
electronic system is normally used. In this situation of technician is required to take the
place of a mechanical sensor to increase the quality of feedback about the health of the
system. In addition roles can be deactivated if they are no longer needed (Bigley &
Roberts, 2001). An example of this would be if the technician was reassigned to a new
role because the safety monitoring system had been checked and either found to be
working properly or fixed.
In the context of this thesis, the fact that HRO’s do not focus on predefined roles does
not make defining them unnecessary (La Porte, 1996). However it does support the idea
that resilient organisations need to understand how their roles might change during an
emergency and what these changes could mean.
The definition of roles and responsibilities adopted for this research is shown in Box 5.
Box 5: Definition of Roles and Responsibilities
SA2 – Understanding and Analysis of Hazards and Consequences
McManus (2007) emphasises the importance of organisations’ understanding of a range
of potential hazards, what impact they might have, and how they might be managed.
Through her case studies McManus (2007) notes that less resilient organisations were
not aware of the full range of potential hazards and that planning in response to high
profile risks, such as pandemics, was sometimes abandoned because organisations
assumed that there was nothing they could do (McManus, 2007, p. 61). The more
resilient organisations in her case study focused heavily on hazard specific planning
relating to their past experience of crises, but still did not understand or plan for other
hazards (McManus, 2007, p. 61).
Roles and responsibilities are clearly defined and people are aware of how these would change in a crisis or emergency, the impact of this change, and what support functions it would require.
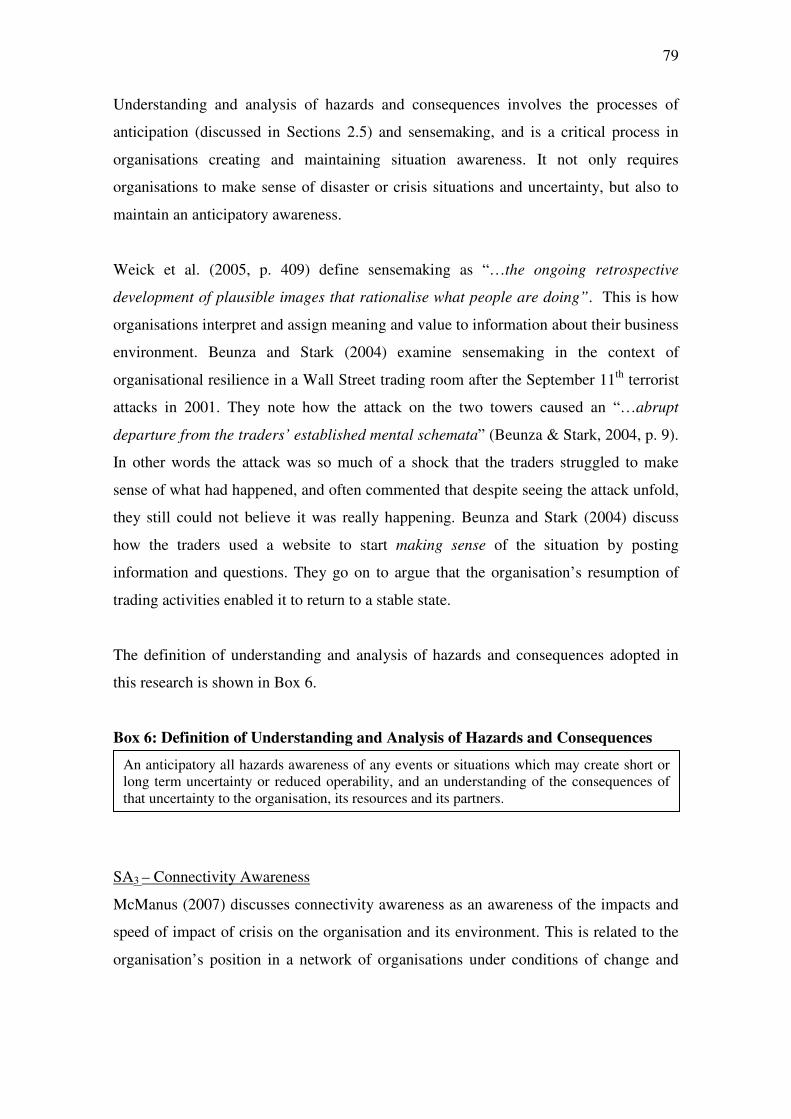
79
Understanding and analysis of hazards and consequences involves the processes of
anticipation (discussed in Sections 2.5) and sensemaking, and is a critical process in
organisations creating and maintaining situation awareness. It not only requires
organisations to make sense of disaster or crisis situations and uncertainty, but also to
maintain an anticipatory awareness.
Weick et al. (2005, p. 409) define sensemaking as “…the ongoing retrospective
development of plausible images that rationalise what people are doing”. This is how
organisations interpret and assign meaning and value to information about their business
environment. Beunza and Stark (2004) examine sensemaking in the context of
organisational resilience in a Wall Street trading room after the September 11th terrorist
attacks in 2001. They note how the attack on the two towers caused an “…abrupt
departure from the traders’ established mental schemata” (Beunza & Stark, 2004, p. 9).
In other words the attack was so much of a shock that the traders struggled to make
sense of what had happened, and often commented that despite seeing the attack unfold,
they still could not believe it was really happening. Beunza and Stark (2004) discuss
how the traders used a website to start making sense of the situation by posting
information and questions. They go on to argue that the organisation’s resumption of
trading activities enabled it to return to a stable state.
The definition of understanding and analysis of hazards and consequences adopted in
this research is shown in Box 6.
Box 6: Definition of Understanding and Analysis of Hazards and Consequences
SA3 – Connectivity Awareness
McManus (2007) discusses connectivity awareness as an awareness of the impacts and
speed of impact of crisis on the organisation and its environment. This is related to the
organisation’s position in a network of organisations under conditions of change and
An anticipatory all hazards awareness of any events or situations which may create short or long term uncertainty or reduced operability, and an understanding of the consequences of that uncertainty to the organisation, its resources and its partners.
80
uncertainty. It also involves understanding the coupling and complexity inherent in the
organisation’s network.
In the context of networks, McManus (2007, p. 6) argues that there is “…the potential
for small changes at one scale to become significant, even devastating, at another”. She
goes on to note how a broken link in the network can not only affect one organisation,
but can also cause a ripple effect. This ripple effect could then have effects on a whole
community, industry sector, economy, or geographic region. This demonstrates the
potential consequences of an organisation’s connectivity. It is therefore important that
an organisation has an awareness of what events or situations could cause significant
network disruption, how disruptions could escalate, and what signals could serve as
early warnings of network disruptions.
For a resilient organisation connectivity could present opportunities in the form of
potential to gain market share (Starr, et al., 2003b), but for less resilient organisations
this can lead to decline and failure. Van der Vegt and Janssen (2003) identify four
sources of interdependence in work group systems; role differentiation, the distribution
of skills and resources, the manner in which goals are achieved, and the manner in
which performance is rewarded and feedback is given. They go on to suggest that the
structure of these interdependencies largely determines system performance. Other
potential sources of interdependency include shared resources, geographical proximity,
supply chain relationships and government regulation and legislation. Viewed as
interdependencies these links can be seen as a negative characteristic for organisations,
links that could create crisis if a high level of awareness is not maintained and
relationships managed. However organisational networks are also a potential source of
strength. When describing network resilience Ehrhardt et al. (2008) states,
“Once the transition to a highly connected network has taken place, the
network is robust, surviving even a reversion to ‘unfavourable’
conditions”.
(Ehrhardt, et al., 2008, p. 2)
81
Ehrhardt (2008) also emphasises how the relationships between organisations can often
change abruptly. As a result, it is important for organisations to maintain and
continually refresh their awareness. Carroll (1998) further emphasises the importance of
connectivity awareness when he argues that organisational knowledge is distributed
among organisation members; no one individual has all of the necessary information
and organisational knowledge is shared. The organisation must work as a cohesive
system to develop and distribute awareness of it connectivity.
The definition of connectivity awareness adopted for this research is shown in Box 7.
Box 7: Definition of Connectivity Awareness
SA4 – Insurance Awareness
McManus (2007) emphasises the importance of an organisation’s knowledge and
awareness of their business disruption insurance as well as the realities of claiming on
insurance following a large scale disaster. She goes on to suggest that the accuracy of
the organisation’s perception of their business disruption insurance is critical and, in the
context of her case studies, she notes,
“In most organisations this knowledge only extended to an assumption that
there was some level of coverage, but few knew any details…(they)
assumed that business interruption insurance would be immediately
accessible following a crisis, and also that it would provide adequate
coverage for the duration of the event and expected recovery”.
(McManus, 2007, p. 62)
Starr et al. (2003a) discuss insurance in the context of risk management where it is seen
as a mitigation and preparedness measure, and note that the level of insurance cover is a
critical question for organisations increasing their resilience. Webb et al. (2002) used
An awareness of the organisation’s internal and external interdependencies and links, and an understanding of the potential scale and impact that crises or emergencies could have on those relationships.
82
the purchase of earthquake insurance as an indicator of preparedness when discussing
organisations in US cities. This is echoed by Chow (2000) when he claims that the
purchase of insurance cover is a key success factor in information systems disaster
recovery in Hong Kong. Hickman and Crandall (1997) move away from the mere
purchase of insurance and argue that an awareness of insurance coverage is essential for
crisis preparation.
The definition of insurance awareness adopted for this research is shown Box 8.
Box 8: Definition of Insurance Awareness
SA5 – Recovery Priorities
The term recovery can mean different things to different people in different situations,
for example repair, restoration and reconstruction (Alexander, 2002), or more
sociological and cultural community recovery (Nigg, 1993).
Graham (2007) highlights the need for clear recovery priorities and objectives that can
guide organisations in creating both short and long term strategies and decisions
following disasters. He goes on to discuss the recovery of small businesses following
the September 11th attacks and argues that short and long term objectives are different.
Short term objectives are often pursued at the expense of long term strategies and
Graham notes,
“Short-term solutions are typically enacted to minimise uncertainty, to
create a back-to-business mentality that enables individuals to cope with
the immediate uncertainty of working in a devastated zone…Yet, this
clouds victims’ ability to consider the future”.
(Graham, 2007, p. 308)
An awareness of insurance held by the organisation and an accurate understanding of the coverage that those insurance policies provide in a crisis or emergency situation.
83
Here Graham also describes how the back-to-business mentality can cloud victims’
ability to consider the future and the changes that they may need to make to recover and
avoid future crises. Further to this, Webb et al. (2002) argue that owners’ perception of
the broader business climate is the strongest predictor of long term organisational
recovery.
Petterson (1999, p. 3) discusses community recovery and the value of pre-existing
recovery plans defining them as,
“…steps that could be outlined ahead of time to ensure that community
development and infrastructure is rebuilt to withstand similar future events
or other hazards the community might face”.
Clearly defined recovery priorities could include broad strategic visions and directions,
or more specific targets related to stakeholders, economic measures, production, service
delivery or competitiveness. They could also take into account the prioritisation of
systems, technologies or locations and their contribution to the organisation’s survival.
The definition of recovery priorities adopted for this research is shown in Box 9.
Box 9: Definition of Recovery Priorities
SA6 – Internal and External Situation Monitoring and Reporting
The internal and external situation monitoring and reporting indicator was added to the
adjusted model to encompass elements of monitoring, analysis and feedback loops that
workshop participants felt were missing from McManus’s (2007) Relative Overall
Resilience (ROR) model. The majority of crisis management models acknowledge input
or feedback from the organisation’s environment. In Smith’s (1990) model of crisis
management, feedback loops, organisational learning and historical inputs are included
as inputs to the organisation’s crisis management. Pearson and Clair (1998) echo this
An organisation wide awareness of what the organisation’s priorities would be following a crisis or emergency, clearly defined at the organisation level, as well as an understanding of the organisation’s minimum operating requirements.
84
when they discuss the impact of the organisation’s environmental context on its ability
to anticipate and respond to crises.
Internal and external situation monitoring and reporting refers to the processes and
mechanisms that organisations use to create and maintain situation awareness. This
knowledge and understanding of the situation is developed through common displays,
environments and communication (Masys, 2005), as well as decision support systems
and previous experience (Endsley, et al., 2003).
Matheus et al. (2003) argue that situation analysis (the process of developing situation
awareness, similar to situation monitoring and reporting) requires organisations to
monitor the business environment using mechanical and human sensors, and then use
their connectivity awareness to provide a context for the information to be interpreted.
Hale et al. (2006, p. 290) argue “Responding effectively to signals from audits is also a
characteristic of a resilient organisation”. Here they emphasise how resilient
organisations not only conduct audits of their performance (or situation analysis) but
also respond effectively to the conclusions and recommendations of those audits. Many
organisations however, neglect to actually address issues identified as critical during
the crisis or post-crisis phase (Birkland, 2009). It is therefore important to monitor
methods of achieving situation awareness and how well it is percolating and being
shared across the organisation. Within organisations, this information sharing is
achieved through reporting such as documentation, speech, memos, meetings or emails
etc. One further important aspect of this feedback is whether the information being
shared is actually being received and understood, this includes whether or not it is being
assimilated into shared organisational situation awareness.
Senge (2006) notes that we are taught to break down problems to solve them and make
them more manageable. However he argues that this is counterproductive because it
oversimplifies our world view and means that we cannot appreciate or account for the
complexity inherent in our environment. This is echoed by Weick and Sutcliffe (2007)
who identify reluctance to simplify as a principle of high reliability organisations
(HROs) arguing that “…less simplification allows you to see more” (Weick & Sutcliffe,
2007, p. 10). To address this Senge (2006) emphasises the value of systems thinking,
one of his five disciplines of learning organisations. He argues that understanding
85
problems as part of a system provides a more complete view of the problem, its
complexity and interdependencies. The development of a full world view or the ability
to see the big picture, by assimilating (rather than simplifying) complex system
feedback, enables organisations to develop situation awareness.
The definition of internal and external situation monitoring and reporting adopted for
this research is shown in Box 10.
Box 10: Definition of Internal and External Situation Monitoring and Reporting
SA7 – Informed Decision Making
Decision making is addressed in the literature in different ways including levels of
decentralisation, empowerment and trust (Mishra, 1996), and decision making as a
paradigm applicable to complex organisational environments (Huber & McDaniel,
1986). In the context of crisis management, much of the literature discusses decision
making as a potential source of error (Pearson & Clair, 1998; Smith, 2006). Smith
(2006) discusses possible models of crisis management and argues,
“The scope of the decision making process within crisis situations is often
narrowed by the urgent nature of events which require an expeditious
resolution of the fundamental problem”.
(Smith, 2006, p. 150)
Here Smith highlights both the difficulty of decision making in crisis situations and the
need to make decisions quickly despite this difficulty. The inclusion of informed
decision making as an indicator of organisational resilience reflects that it is not
sufficient for an organisation to be aware of a situation; they must also use that
knowledge and incorporate it into their decision making. It is about feeding the
information, knowledge and understanding (situation awareness) into the corporate
The creation, management and monitoring of human and mechanical sensors that continuously identify and characterise the organisation’s internal and external environment, and the proactive reporting of this situation awareness throughout the organisation to identify weak signals of crisis or emergency.
86
decision making machinery. Mallak (1998b) discusses the resilience of healthcare
providers and notes, “As workers become more empowered, more important decisions
are made, often without immediate approval and under time pressure” (Mallak, 1998b,
p. 148). Smart and Vertinsky (1977) discuss the effect of group pathologies on crisis
decision units and advocate varying membership to ensure that leaders are exposed to
new points of view, discussing alternatives with others outside of the crisis decision
unit, and inviting experts to comment on decisions and processes.
The definition of informed decision making adopted for this research is shown as Box
11.
Box 11: Definition of Informed Decision Making
3.3.3 Management of Keystone Vulnerabilities
The term vulnerability has many different definitions and applications; social and
cultural (Etkin, et al., 2004), infrastructure (Ezell, 2007), business (Chang & Falit-
Baiamonte, 2003), IT networks (Martin, 2001), children (Engle, et al., 1996), and
ecological systems (Adger, et al., 2005). When proposing the management of keystone
vulnerabilities as a dimension of organisational resilience, McManus (2007) focuses on
organisational vulnerability.
Turner (1978) made the first theoretical analysis of organisational vulnerability to
technological disasters emphasising the role of organisational norms and values. Several
authors have also utilised case study and survey research to identify organisational
vulnerabilities which have contributed to organisational losses or failure during and
after disasters. Kroll et al. (1990) identify organisational size as a vulnerability when
they discuss how small businesses suffered more severe losses during and after the
Loma Prieta earthquake. Durkin (1984) and Alesch and Holly (1998) identify pre-
The extent to which the organisation looks to its internal and external environment for information relevant to its organisational activities and uses that information to inform decisions at all levels of the organisation to prevent or better respond to crises or emergencies.
87
disaster economic health as a vulnerability during and after the 1984 Coalinga
earthquake and the 1994 Northridge earthquake. Alesch and Holly (1998) also identify
the owners entrepreneurial skills, or lack of, and the effect of the disaster on demand for
the organisation’s products or services as vulnerabilities. Chang and Falit-Baiamonte
(2003) review research conducted at the University of Delaware Disaster Research
Center using large scale survey research and highlight a number of vulnerabilities
observed during and after floods, hurricanes and earthquakes. These vulnerabilities
include disruption to infrastructure, difficulties with supplies and shipments, drops in
demand, and pre-disaster economic health (Chang & Falit-Baiamonte, 2003, p. 60).
During the indicators workshop, participants questioned what criteria would
characterise vulnerabilities as keystone vulnerabilities. McManus (2007) discusses this
and notes other uses of the term keystone: ecological and architectural. She goes on to
define keystone vulnerabilities as,
“…components in the organisational system, which by their loss or
impairment have the potential to cause exceptional effects throughout the
system; associated components of the system depend on them for support”.
(McManus, 2007, p. 14)
This is also addressed within the field of business continuity management (BCM) where
organisations aim to identify and assess potential single points of failure, such as a
single source suppliers or resources, through business impact analyses (BSI, 2006).
The definition of management of keystone vulnerabilities adopted for this research is
shown in Box 12.
Box 12: Definition of Management of Keystone Vulnerabilities
The identification, proactive management, and treatment of vulnerabilities that if realised, would threaten the organisation’s ability to survive.
88
The seven indicators of management of keystone vulnerabilities proposed in this thesis
are shown below. Indicators KV1 to KV5 are McManus’s (2007) indicators of
management of keystone vulnerabilities within with her Relative Overall Resilience
(ROR) model, and indicators KV6 and KV7 have been added as part of the updated
model.
• KV1 – Planning Strategies
• KV2 – Participation in Exercises
• KV3 – Capability and Capacity of Internal Resources
• KV4 – Capability and Capacity of External Resources
• KV5 – Organisational Connectivity
• KV6 – Robust Processes for Identifying and Analysing Vulnerabilities
• KV7 – Staff Engagement and Involvement
KV1 – Planning Strategies
McManus (2007) discusses planning strategies as the collective term for business
continuity, risk and emergency management, and planning programs. In addition to
public sector planning, Alexander (2005, p. 158) argues “…many commercial and
industrial companies have recognised that they need to prepare business continuity or
crisis control plans”. Spillan and Hough (2003) emphasise the importance of planning
and argue that every organisation should have a plan. Continuing they note that, “With
an effective plan, business may even be able to turn adversity into advantage” (Spillan
& Hough, 2003, p. 399). Penrose (2000) supports this and suggests prior planning as the
characteristic that differentiates between organisations that survive crisis and
organisations that are able to take advantage of opportunities.
Approaches to planning vary, however there are four broad planning strategies
applicable to organisations; business continuity management (Cerullo & Cerullo, 2004),
emergency planning or management (Williams, et al., 2000), crisis management
(Fowler, et al., 2007) and risk management (Starr, et al., 2003a).
Laye and Torre-Enciso (2001) discuss strategies to reduce the impact of disasters on
businesses and identify business continuity planning and management as the primary
89
approach. Business continuity management (BCM) has evolved from an IT based
discipline in the 1970s to focus on managing disruption to business processes and
assets. The UK Business Continuity Institute (BCI, 2006) defines business continuity
management (BCM) as a,
“Holistic management process that identifies potential threats to an
organisation and the impacts to business operations that those threats, if
realized, might cause, and which provides a framework for building
organisational resilience with the capability for an effective response that
safeguards the interests of its key stakeholders, reputation, brand and
value-creating activities”.
This definition presents BCM as a management process aimed at building
organisational resilience through managing and responding to disruption-related risks.
Castillo (2004) also argues that while planning documents are useful they do not
address the fundamental issue – staying in business. This is reflected by Clarke (1999)
who argues that planning documents themselves can be fantasy documents and are often
more symbolic as a sign of managements’ good intensions, than functional, effective
and realistic as a sign of managements’ capabilities.
Emergency planning or management (EM) is generally performed by government
organisations or units (Doyle, 1996). Often this involves the publication of a national
strategy such as the ‘Resilient New Zealand National Civil Defence Emergency
Management Strategy 2003-2006’ (MCDEM, 2004), laws such as the UK ‘Civil
Contingencies Act’ (Civil Contingencies Secretariat, 2004), and guidelines such as the
UK Resilience ‘Emergency Response and Recovery’ (Civil Contingencies Secretariat,
2010).
The New Zealand Ministry of Civil Defence and Emergency Management defines
emergency management as,
“…the application of knowledge, measures, and practices that—
(i) are necessary or desirable for the safety of the public or property;
and
90
(ii) are designed to guard against, prevent, reduce, or overcome any
hazard or harm or loss that may be associated with any emergency;
and
(b) includes, without limitation, the planning, organisation, co-
ordination, and implementation of those measures, knowledge and
practices”.
(MCDEM, 2006, p. 216)
This definition focuses on emergency management as concerned with public safety,
property, and reducing and responding to hazards. Alexander (2002) argues that the
main scope of emergency management is the protection and safety of disaster victims
and that protecting the public, physical structures and infrastructure are secondary. This
does not necessarily mean that public protection is not important, but reflects the origins
of the profession within the emergency services and government organisations.
Crisis management focuses primarily on the response to, and management of, man-
made events or situations that are caused by, or affect organisations (Mitroff, 2001). A
particular focuses within crisis management is communicating with stakeholders, the
public and the media during and after a crisis, and crisis leadership (Blythe, 2010). One
reason that crisis communications and leadership receive so much attention is that crises
are preventable, unlike natural disasters they did not have to happen, and so
stakeholders, the public and the media are much less forgiving of organisations who fail
to manage crises effectively (Mitroff, 2001). Boin and McConnell (2007) note that crisis
management is a top down response characterised by centralisation which aims to
enable rapid decision making, allocation of resources and control.
Smallman (1996) discusses risk management and describes two poles of opinion;
reactive and proactive. He goes on to argue that reactive risk management “…relies on
institutions setting predetermined risk tolerances and to converting these goals into
quantified decision rules” (Smallman, 1996, p. 14). Within this reactive approach an
organisation decides the level of risk that it is willing to accept, and then applies that as
decision criteria when deciding whether to invest in a project, which risks to address,
calculating the probability of making a profit etc. He goes on to argue that this approach
91
is narrow and reactive because the organisation is responding to immediate threats as
indicated by their current model.
Smallman (1996) discusses proactive risk management and argues that this is more
holistic and is based on formal risk assessments where as many risks as possible are
assessed and then prioritised according to the most immediate. The difference between
the reactive and the proactive is that the reactive approach relies on models based on
statistics and past experience to differentiate between those risks that should be
addressed and those that should not and it also only addresses risks that present a
current threat. In contrast the proactive approach relies on risk assessment based on the
situation awareness of the assessor and it addresses risks with the potential to affect the
organisation as well as current threats. Smallman (1996) goes on to note that
organisations are increasingly following the more holistic proactive risk management
approach.
Despite the importance of planning, and the different strategies available, McManus
(2007) notes that very few of her case study organisations had completed planning, and
any planning that had been done was more often focused on single high profile risks or
events such as pandemics.
The definition of planning strategies adopted for this research is shown in Box 13.
Box 13: Definition of Planning Strategies
KV2 – Participation in Exercises
Peterson and Perry (1999) note that exercises are a critical part of disaster planning and
are advocated by the majority of industrialised nation governments. They go on to argue
that exercises fall under the rubric of preparedness and define them as,
The identification and evaluation of organisational planning strategies designed to identify, assess and manage vulnerabilities in relation to the business environment and its stakeholders.
92
“…rehearsals or simulations of plans that would be instituted during a
response phase to deal with a threat over which there is insufficient human
knowledge and control to prevent”.
(Peterson & Perry, 1999, p. 243)
As they develop their discussion Peterson and Perry (1999) argue that exercises are one
of the three components of preparedness, the other two being planning and training. In
this context exercises serve several purposes; to test the procedures and equipment
specified under a plan, to validate the plan (Peterson & Perry, 1999) to validate training
and to practise carrying out the plan as required (Alexander, 2000).
There are several types of exercises and each has a different purpose and requires
different levels of commitment and resources while providing different types of
outcome. Live or Functional exercises involve participants on location who physically
run through a scenario in real time as they would in an actual disaster. Table top
exercises involve participants conducting the exercise within defined boundaries; they
pretend to manage the scenario (sometimes phone calls are acted out with exercise
coordinators playing the various roles required). Call-out exercises are usually smaller
in nature and exercise only the contact initiation, or activation part of managing a crisis
or emergency. One of the first actions designated in many emergency plans is to contact
key members of staff, in a call-out exercise; participants make these calls to check the
availability of key members and whether or not (if a crisis or emergency were to occur
at that time) they would be able to respond. In addition, each of these exercises can be
carried out by a single agency or can be multi-agency.
When discussing participation in exercises, McManus (2007) also explains the
importance of identifying lessons during post-exercise debriefs and ensuring that they
are incorporated into planning arrangements. In the context of her case study
organisations McManus (2007) identified potential barriers to participation in exercises
including the availability of staff, unwillingness to incur an impact on day-to-day
operations, lack of confidence in the quality of plans, and false assumptions about the
organisation’s ability to rely on past experience.
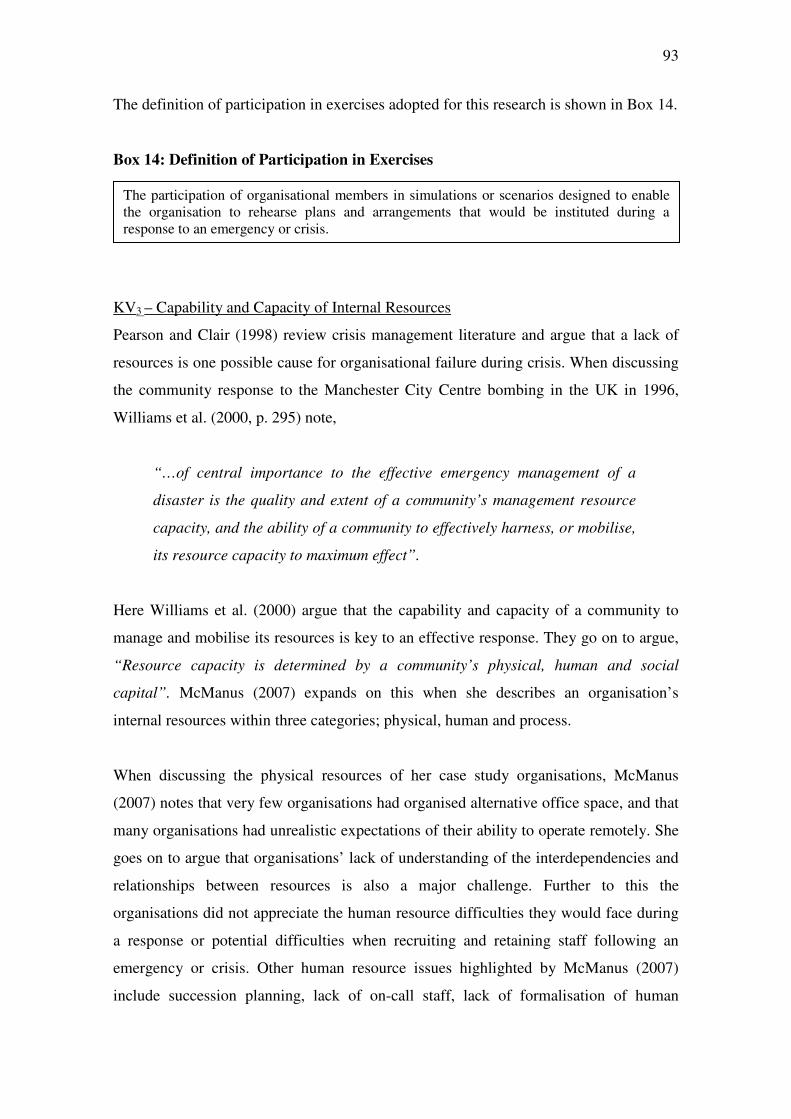
93
The definition of participation in exercises adopted for this research is shown in Box 14.
Box 14: Definition of Participation in Exercises
KV3 – Capability and Capacity of Internal Resources
Pearson and Clair (1998) review crisis management literature and argue that a lack of
resources is one possible cause for organisational failure during crisis. When discussing
the community response to the Manchester City Centre bombing in the UK in 1996,
Williams et al. (2000, p. 295) note,
“…of central importance to the effective emergency management of a
disaster is the quality and extent of a community’s management resource
capacity, and the ability of a community to effectively harness, or mobilise,
its resource capacity to maximum effect”.
Here Williams et al. (2000) argue that the capability and capacity of a community to
manage and mobilise its resources is key to an effective response. They go on to argue,
“Resource capacity is determined by a community’s physical, human and social
capital”. McManus (2007) expands on this when she describes an organisation’s
internal resources within three categories; physical, human and process.
When discussing the physical resources of her case study organisations, McManus
(2007) notes that very few organisations had organised alternative office space, and that
many organisations had unrealistic expectations of their ability to operate remotely. She
goes on to argue that organisations’ lack of understanding of the interdependencies and
relationships between resources is also a major challenge. Further to this the
organisations did not appreciate the human resource difficulties they would face during
a response or potential difficulties when recruiting and retaining staff following an
emergency or crisis. Other human resource issues highlighted by McManus (2007)
include succession planning, lack of on-call staff, lack of formalisation of human
The participation of organisational members in simulations or scenarios designed to enable the organisation to rehearse plans and arrangements that would be instituted during a response to an emergency or crisis.
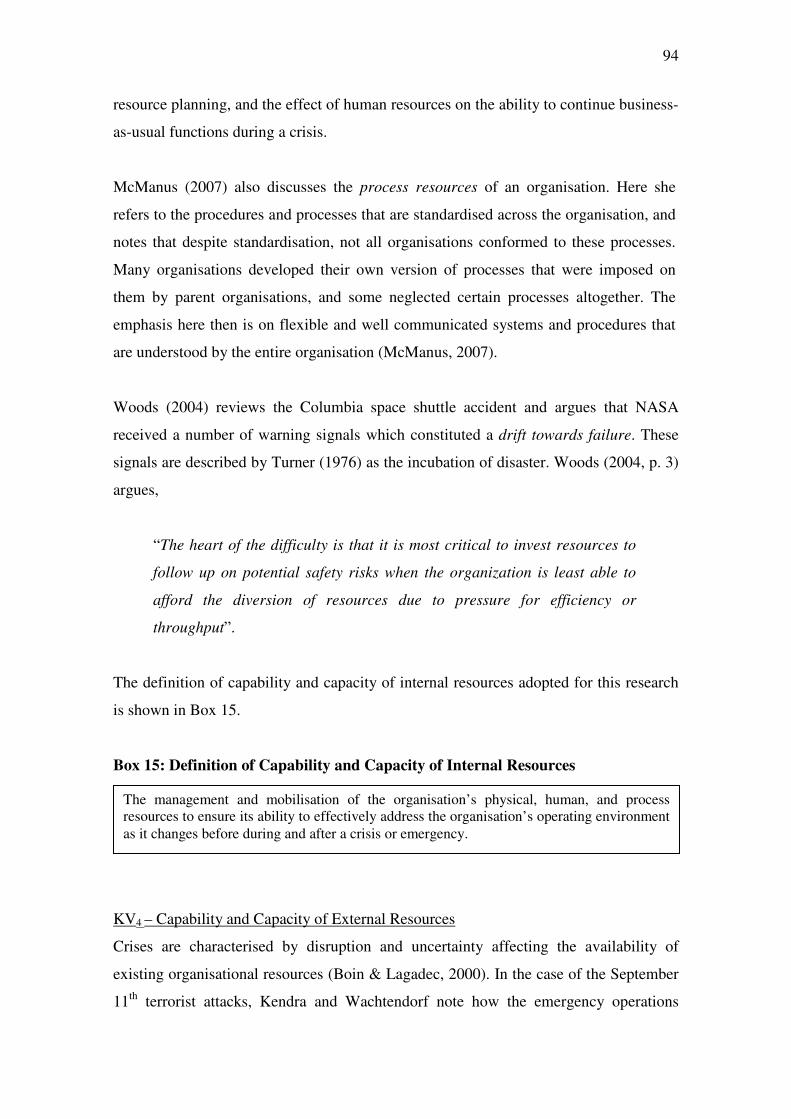
94
resource planning, and the effect of human resources on the ability to continue business-
as-usual functions during a crisis.
McManus (2007) also discusses the process resources of an organisation. Here she
refers to the procedures and processes that are standardised across the organisation, and
notes that despite standardisation, not all organisations conformed to these processes.
Many organisations developed their own version of processes that were imposed on
them by parent organisations, and some neglected certain processes altogether. The
emphasis here then is on flexible and well communicated systems and procedures that
are understood by the entire organisation (McManus, 2007).
Woods (2004) reviews the Columbia space shuttle accident and argues that NASA
received a number of warning signals which constituted a drift towards failure. These
signals are described by Turner (1976) as the incubation of disaster. Woods (2004, p. 3)
argues,
“The heart of the difficulty is that it is most critical to invest resources to
follow up on potential safety risks when the organization is least able to
afford the diversion of resources due to pressure for efficiency or
throughput”.
The definition of capability and capacity of internal resources adopted for this research
is shown in Box 15.
Box 15: Definition of Capability and Capacity of Internal Resources
KV4 – Capability and Capacity of External Resources
Crises are characterised by disruption and uncertainty affecting the availability of
existing organisational resources (Boin & Lagadec, 2000). In the case of the September
11th terrorist attacks, Kendra and Wachtendorf note how the emergency operations
The management and mobilisation of the organisation’s physical, human, and process resources to ensure its ability to effectively address the organisation’s operating environment
as it changes before during and after a crisis or emergency.
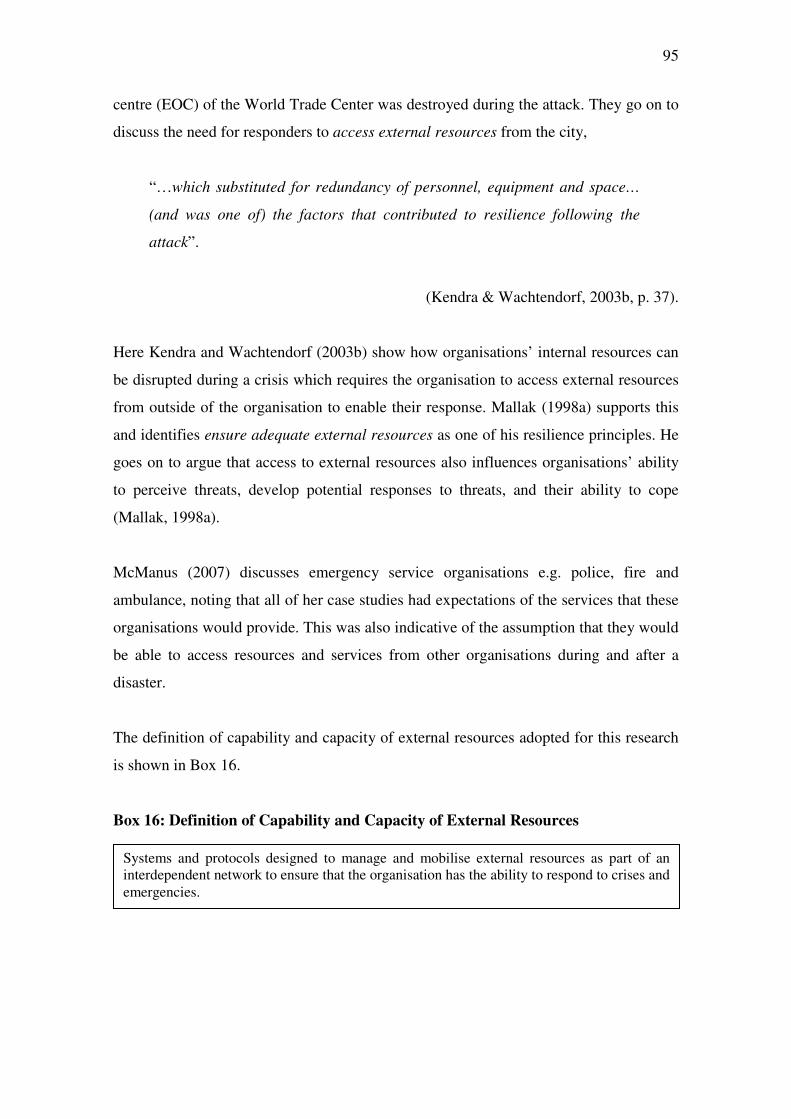
95
centre (EOC) of the World Trade Center was destroyed during the attack. They go on to
discuss the need for responders to access external resources from the city,
“…which substituted for redundancy of personnel, equipment and space…
(and was one of) the factors that contributed to resilience following the
attack”.
(Kendra & Wachtendorf, 2003b, p. 37).
Here Kendra and Wachtendorf (2003b) show how organisations’ internal resources can
be disrupted during a crisis which requires the organisation to access external resources
from outside of the organisation to enable their response. Mallak (1998a) supports this
and identifies ensure adequate external resources as one of his resilience principles. He
goes on to argue that access to external resources also influences organisations’ ability
to perceive threats, develop potential responses to threats, and their ability to cope
(Mallak, 1998a).
McManus (2007) discusses emergency service organisations e.g. police, fire and
ambulance, noting that all of her case studies had expectations of the services that these
organisations would provide. This was also indicative of the assumption that they would
be able to access resources and services from other organisations during and after a
disaster.
The definition of capability and capacity of external resources adopted for this research
is shown in Box 16.
Box 16: Definition of Capability and Capacity of External Resources
Systems and protocols designed to manage and mobilise external resources as part of an interdependent network to ensure that the organisation has the ability to respond to crises and emergencies.
96
KV5 – Organisational Connectivity
McManus (2007) discusses organisational connectivity as the strength of the
relationships the organisation has with other organisations or groups that are critical to
both its business-as-usual and crisis operations. She goes on to describe it as a clear
understanding of the relationships between related organisations (McManus, 2007), not
just in a business-as-usual context but also taking into account connections and links
that may emerge during a crisis. However, this emergence and the existence of links
with organisations that are not connected through business-as-usual arrangements,
requires organisations to plan in advance.
Granatt and Paré-Chamontin (2006) discuss social networks and the importance, for
organisations, of understanding networks. They argue, “…the ability to map and to
exploit the network is vital to resilience” (Granatt & Paré-Chamontin, 2006, p. 54).
They go on to describe the structure of a network with its network location (its place in
wider society), its hubness (the number of points linking through it), and the richness
and reach of its influence. Despite the importance of this understanding, Granatt and
Paré-Chamontin (2006) argue that no one organisation has this awareness (described by
McManus (2007) as Connectivity Awareness). Granatt and Paré-Chamontin (2006, p.
54) go on to discuss superhubs; “A number of very closely coupled hubs”. These
superhubs are not necessarily connected by geographical proximity but “…the effects on
or produced by each component hub must be very similar and similarly dependent”
(Granatt & Paré-Chamontin, 2006, p. 54). Granatt and Paré-Chamontin reflect the ideas
of emergence when they argue that superhubs may not even exist until a crisis. They
state,
“Where great energy or change affects the network, superhubs’ resilience
depends on the ability to remap the network continually, and/or to act
pragmatically and rapidly to reconnoitre new pathways”.
(Granatt & Paré-Chamontin, 2006, p. 55)
Granatt and Paré-Chamontin highlight the difficulties of achieving this awareness on a
large scale e.g. for an organisation wide crisis. In response they suggest hubmasters;
expert observers and reporters at as many hubs as possible. Planning and arrangement of
97
these roles, dedicated to maintaining connectivity awareness, would increase
organisational connectivity, but could also create silos.
The definition of organisational connectivity adopted for this research is shown in Box
17.
Box 17: Definition of Organisational Connectivity
KV6 – Robust Processes for Identifying and Analysing Vulnerabilities
Robust processes for identifying and analysing vulnerabilities was identified as an
indicator of management of keystone vulnerabilities through the indicators workshop.
Participants discussed the importance of analysing keystone vulnerabilities, managing
interdependence and systemic risks, and the identification of early warning signs and
triggers of crisis.
Weick and Sutcliffe (2007) discuss high reliability organisations (HROs) and argue that
their reliability stems from a preoccupation with failure which involves asking four
questions; what needs to go right, what could go wrong, how could things go wrong,
and what things have gone wrong? Weick and Sutcliffe (2007, p. 151) summarise this as
“…actively searching for weak signals that the system is acting in unexpected ways”.
One way of searching for these weak signals suggested by Weick and Sutcliffe is
Creating an Awareness of Vulnerability. This involves reminding people that “…even
though they think they understand their system and the ways in which it can fail,
surprises are still possible” (Weick & Sutcliffe, 2007, p. 152).
Processes that organisations can use to identify and analyse vulnerabilities, such as risk
management and business impact analysis, are well established. This is evident by the
number of standards and guidelines available such as AS/NZ Risk Management
standard 4360 (AS/NZ, 2004), ISO 31000 (ISO, 2009), the National Fire Protection
Association’s NFPA 1600 (NFPA, 2007), the American National Standards Institute
The management of the organisation’s network interdependencies and the continuous development of inter-organisational relationships to enable the organisation to operate successfully and to prevent or respond to crises and emergencies.
98
organisational resilience standard (ANSI, 2009) and the British 25999 Business
Continuity Management standard (BSI, 2006). These are discussed in more detail in
Section 2.4.2.1.
The definition of robust processes for identifying and analysing vulnerabilities adopted
for this research is shown in Box 18.
Box 18: Definition of Robust Processes for Identifying and Analysing
Vulnerabilities
KV7 – Staff Engagement and Involvement
Staff engagement and involvement was identified by participants at the indicators
workshop when participants discussed the importance of managing vulnerabilities
across an organisation. Participants also discussed the importance of ownership and
staff training for embedding resilience. These points are again emphasised by Carthey et
al. (2001) when they provide a checklist for assessing institutional resilience in
healthcare systems. In particular they include;
• “Patient safety is recognised as being everyone’s responsibility, not just that of
the risk management team.
• Meetings relating to patient safety are attended by staff from a wide variety of
departments and levels within the institution.
• Policies are in place that encourage everyone to raise patient safety issues.
• The institution recognises the critical dependence of a safety management
system on the trust of the workforce, particularly in regard to reporting
systems”.
(Adapted from Carthey, et al., 2001, p. 31)
Friedman (2005, p. 24) argues “Both leaders and employees need to be involved in
ensuring that organisations are flexible enough to sustain themselves”. Here Friedman
Processes embedded in the operation of the organisation that identify and analyse the emerging and inherent vulnerabilities in its environment and enable it to effectively manage vulnerabilities to further the networks’ resilience.
99
suggests a link between the organisation’s ability to be flexible and the involvement of
staff. Mallak (1998b) discusses front line workers in healthcare organisations, and
argues, “…resilient behaviours help workers meet customer needs on the spot” (Mallak,
1998b, p. 149). Mallak’s recognition of the role that front line staff play in crises, also
leads to the conclusion that they have a critical role to play in the management of
vulnerabilities. In a separate conference paper Mallak (1999) proposes a model of
organisational resilience comprising of six components; vision, values, elasticity,
empowerment, coping and connections. When discussing empowerment Mallak (1999,
p. 5) argues,
“The resilient organisation provides employment having meaning for the
individual, tapping their competencies, building self-determination, and
having detectable positive impact on operations. Empowered employees
exercise bricolage and high levels of self-efficacy”.
The definition of staff engagement and involvement adopted for this research is shown
in Box 19.
Box 19: Definition of Staff Engagement and Involvement
3.3.4 Adaptive Capacity
Adaptive capacity is addressed in the literature through two approaches; socio-
environmental, and organisational (McManus, 2007). An organisation’s ability to adapt
is at the heart of their ability to display resilient characteristics. Starr et al. (2003b, p. 3)
discuss the importance of adaptation and note that the aim is to “…create advantages
over less adaptive competitors”. This suggests that adaptive capacity is also linked to
competitiveness. Dalziell and McManus (2004, p. 6) define adaptive capacity as,
The engagement and involvement of organisational staff so that they are responsible, accountable and occupied with developing the organisation’s resilience through their work because they understand the links between the organisation’s resilience and its long term success.
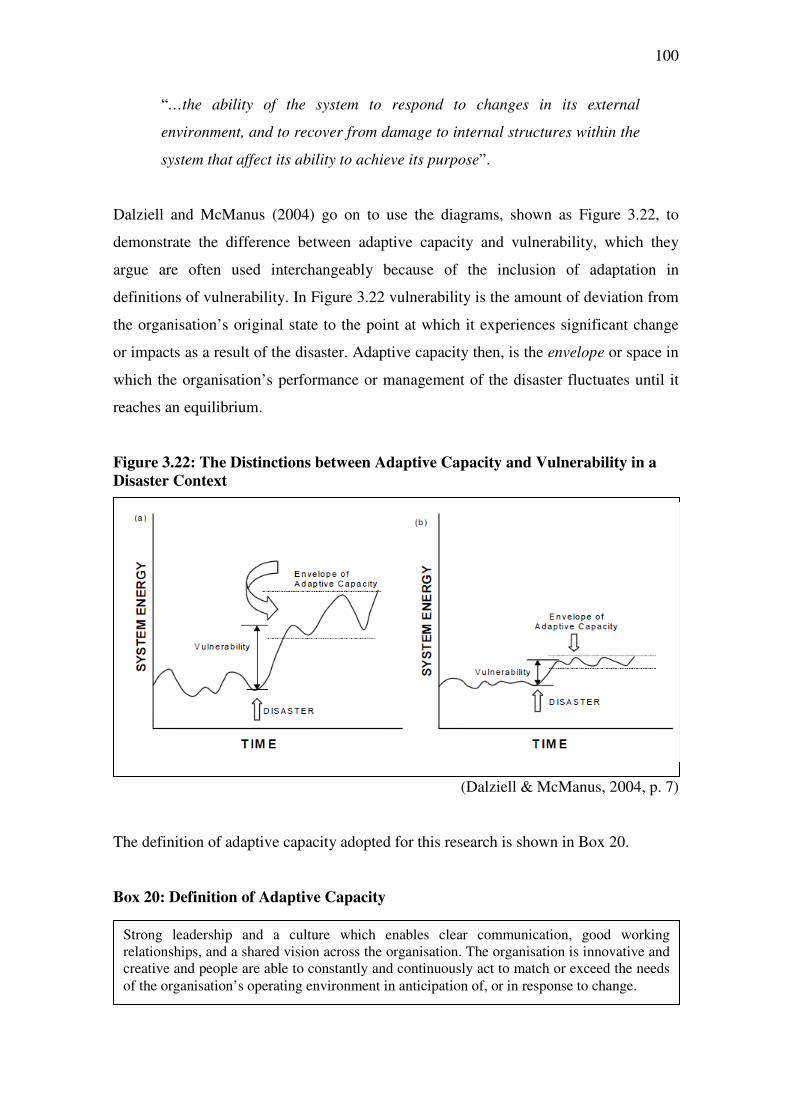
100
“…the ability of the system to respond to changes in its external
environment, and to recover from damage to internal structures within the
system that affect its ability to achieve its purpose”.
Dalziell and McManus (2004) go on to use the diagrams, shown as Figure 3.22, to
demonstrate the difference between adaptive capacity and vulnerability, which they
argue are often used interchangeably because of the inclusion of adaptation in
definitions of vulnerability. In Figure 3.22 vulnerability is the amount of deviation from
the organisation’s original state to the point at which it experiences significant change
or impacts as a result of the disaster. Adaptive capacity then, is the envelope or space in
which the organisation’s performance or management of the disaster fluctuates until it
reaches an equilibrium.
Figure 3.22: The Distinctions between Adaptive Capacity and Vulnerability in a
Disaster Context
(Dalziell & McManus, 2004, p. 7)
The definition of adaptive capacity adopted for this research is shown in Box 20.
Box 20: Definition of Adaptive Capacity
Strong leadership and a culture which enables clear communication, good working relationships, and a shared vision across the organisation. The organisation is innovative and creative and people are able to constantly and continuously act to match or exceed the needs
of the organisation’s operating environment in anticipation of, or in response to change.
101
The seven proposed factors of management of keystone vulnerabilities are shown
below. Indicators AC1 to AC5 are McManus’s (2007) indicators of adaptive capacity
within her Relative Overall Resilience (ROR) model, and indicators AC6 and AC7 have
been added as part of the updated model.
• AC1 – Minimisation of Silo Mentality
• AC2 - Communications and Relationships
• AC3 - Strategic Vision and Outcome Expectancy
• AC4 - Information and Knowledge
• AC5 - Leadership, Management and Governance Structures
• AC6 - Innovation and Creativity
• AC7 - Devolved and Responsive Decision Making
AC1 Minimisation of Silo Mentality Silo mentality is a social phenomenon than can affect individuals, communities,
business units, teams or functions within any group or organisation. It can be created by
geographical proximity, by being spatially far away from something or someone, but it
can also occur between people or groups that share the same office space. It is also true
that the presence of interest communities, groups that convene purely because they
share a common goal, interest or need, may also experience silo mentality (McCormack,
1999).
Fenwick et al. (2009, p. 3) discuss the term silo mentality arguing that “…it is used to
describe inwardly focused organisational units where external relationships are given
insufficient attention”. McCormack (1999, p. 15) discusses silo mentality at a bank and
focuses on how,
“Each division operated as a self-contained unit, hunkered deep in its own
silo, with no regard for anything beyond the silo walls”.
Here McCormack is describing an organisation whose subcultures are misaligned
(Fenwick, et al., 2009), with hierarchical communications (Goh, 2002), which are
weakened by competing agendas and personalities (Stone, 2004). One example is the
silo mentality experienced between employees of an organisation working in the same
102
building and apparently living similar lives. If their daily job does not require them to be
in contact with each other they may not do it of their own accord; as a result, they may
be unaware of each other’s roles, work, activities and projects. This awareness is critical
to creating an adaptive environment where weaknesses and threats are identified and
strengths and opportunities used to enact resilient behaviour.
Silo mentality is intertwined, created by, and feeds into, organisational culture. Davis
(2004, p. 15) describes this as, “…the way we do things around here in our
organisation”. Wisner discusses how an organisation with silo mentality will “…look to
their own…interests rather than that of the…(organisation) as a whole” (Wisner, et al.,
2004, p. 15). Stone (2004, p. 11) supports this when she argues,
“…silos create an environment in which the personal and departmental
interests of ambitious managers may take precedence over the well-being
of the organisation”.
Schein (1996) discusses subcultures and suggests that there are typically three levels of
subculture within organisations; operator, engineering and executive. Carroll (1998)
argues that “employees at different levels in the hierarchy can have different
understandings…and as a result they may not communicate easily”. Powers (2004)
discusses silo mentality as a culture that is opposite to a culture of communication.
Although these subcultures may have a significant relationship to the production of silo
mentality they are not evidence of silo mentality in themselves. Despite this the
relationship between organisational subcultures and the production of silo mentality will
have a significant bearing on organisational resilience. However it is also important to
note that where silo mentality may exist in some parts of an organisation, it doesn’t
necessarily exist in all parts of the organisation.
Guelke (2005) discusses organisational parochialism and turf or silo mentality, and
argues that silo mentality is a “…significant barrier to preparedness and can hinder
organisations at any level” (Guelke, 2005, p. 748) . Large organisations tend to be
distributed across wide geographic areas and may become fragmented and independent
of their component parts. Stone (2004) discusses Karl Albrecht who suggested that
“…silos are symptomatic of organisational dysfunction” (Stone, 2004, p. 11). Silo
103
mentality can affect organisations in many ways; silos create barriers within
organisations. These barriers block strengths and opportunities such as communication,
ideas, innovation, creativity and efficiency, and create weaknesses and threats such as
isolation, lack of awareness, duplication, inefficiency and cost. With this in mind it is
important to include a measurement of silo mentality when benchmarking
organisational resilience.
The definition of silo mentality adopted for this research is shown in Box 21.
Box 21: Definition of Silo Mentality
AC2 Communications and Relationships Smith (1990) provides an example of how communications are most often discussed in
crisis management when he notes that during crises organisations often fail (or the crisis
is escalated) because of their lack of effective communication with the public and the
media. One example of the importance of crisis communications is the Valdez oil tanker
spill. During this spill Exxon were late to communicate about the disaster and then
employed a series of poor communications strategies including down-playing the scale
and potential effects of the spill, blaming other organisations, and blaming individual
members of Exxon staff (Williams & Treadaway, 1992). In addition to the
environmental consequences, the Valdez spill had a number of long term effects
including policy change and increased public pressure on oil companies.
McManus (2007) discusses communications and relationships within and between
organisations as they contribute towards resilience and argues that,
“…there is a link between effective communications pathways, respectful
relationship development and the ability to acquire, transfer and retain
critical information in a crisis”.
(McManus, 2007, p. 70)
Cultural and behavioural barriers which can be divisive within and between organisations which are most often manifested as communication barriers creating disjointed, disconnected and detrimental ways of working.
104
Here, McManus makes links between communications and relationships, information
sharing and situation awareness. She goes on to discuss communications and
relationships as she observed them in her case study organisations, arguing that
organisations often failed to realise the full potential impact of poor relationships in a
crisis. She also notes that internal communications were often viewed as problematic by
staff, but successful by management (McManus, 2007).
Gittell et al. (2006) emphasise the importance of employee relationships during a crisis
to maintain commitment and productivity. In the context of the airline industry in
response to the September 11th terrorist attacks, they go on to argue that positive
employee relationships contribute to organisational success during business-as-usual, as
well as crisis situations. Starr et al. (2003b) also note the variety and complexities of
networks involved in business and argue that communications and managing
relationships is central to managing the inherent risks involved.
The definition of communications and relationships adopted for this research is shown
in Box 22.
Box 22: Definition of Communications and Relationships
AC3 Strategic Vision and Outcome Expectancy Organisational vision is addressed in the literature in three ways; vision as a common
trait of the effective leader, how to define and write visions which inspire and motivate,
and the role of vision in achieving organisational goals (Testa, 1999). Larwood et al.
(1995) note the difficulty in defining vision which is a construct and a strategic process
intended to cope with uncertainty. McManus (2007, p. 71) argues that organisational
vision has three critical aspects; how well articulated and communicated it is, how well
day-to-day operations represent the vision, and whether or not the vision provides useful
direction when engaging in the response to an emergency or crisis.
The proactive fostering of respectful relationships with stakeholders to create effective communications pathways which enable the organisation to operate successfully during business-as-usual and crisis or emergency situations.
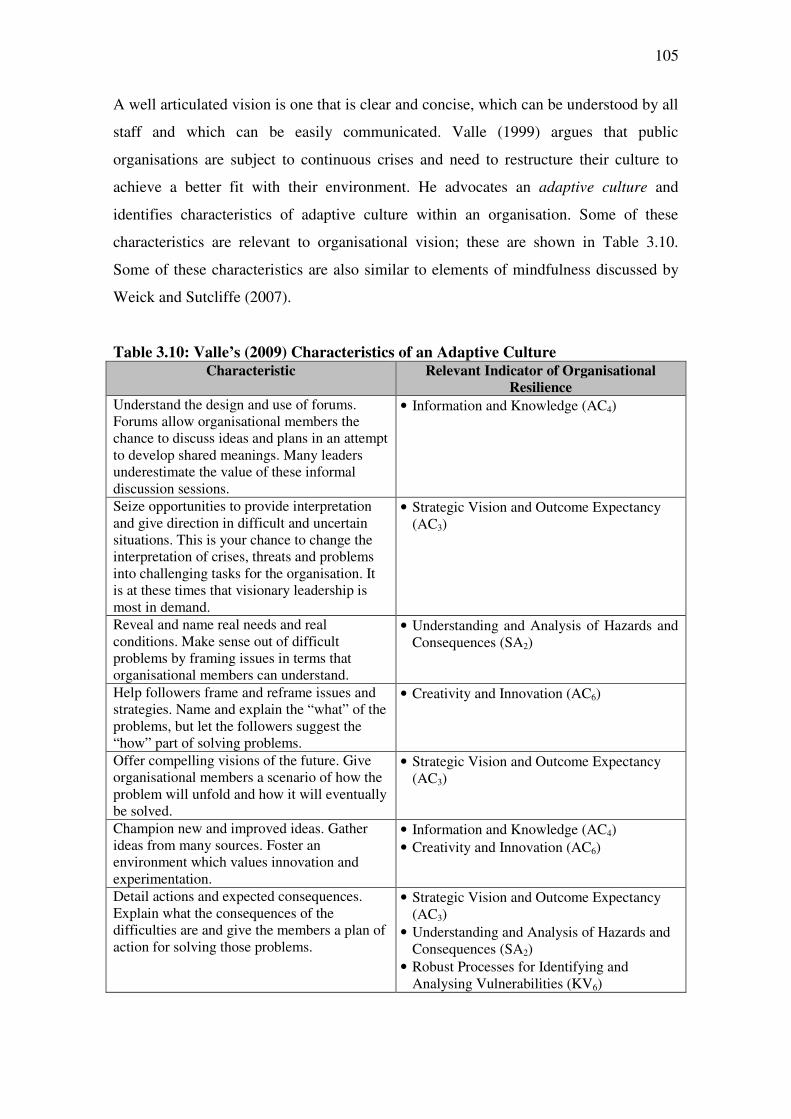
105
A well articulated vision is one that is clear and concise, which can be understood by all
staff and which can be easily communicated. Valle (1999) argues that public
organisations are subject to continuous crises and need to restructure their culture to
achieve a better fit with their environment. He advocates an adaptive culture and
identifies characteristics of adaptive culture within an organisation. Some of these
characteristics are relevant to organisational vision; these are shown in Table 3.10.
Some of these characteristics are also similar to elements of mindfulness discussed by
Weick and Sutcliffe (2007).
Table 3.10: Valle’s (2009) Characteristics of an Adaptive Culture
Characteristic Relevant Indicator of Organisational
Resilience
Understand the design and use of forums. Forums allow organisational members the chance to discuss ideas and plans in an attempt to develop shared meanings. Many leaders underestimate the value of these informal discussion sessions.
• Information and Knowledge (AC4)
Seize opportunities to provide interpretation and give direction in difficult and uncertain situations. This is your chance to change the interpretation of crises, threats and problems into challenging tasks for the organisation. It is at these times that visionary leadership is most in demand.
• Strategic Vision and Outcome Expectancy (AC3)
Reveal and name real needs and real conditions. Make sense out of difficult problems by framing issues in terms that organisational members can understand.
• Understanding and Analysis of Hazards and Consequences (SA2)
Help followers frame and reframe issues and strategies. Name and explain the “what” of the problems, but let the followers suggest the “how” part of solving problems.
• Creativity and Innovation (AC6)
Offer compelling visions of the future. Give organisational members a scenario of how the problem will unfold and how it will eventually be solved.
• Strategic Vision and Outcome Expectancy (AC3)
Champion new and improved ideas. Gather ideas from many sources. Foster an environment which values innovation and experimentation.
• Information and Knowledge (AC4)
• Creativity and Innovation (AC6)
Detail actions and expected consequences. Explain what the consequences of the difficulties are and give the members a plan of action for solving those problems.
• Strategic Vision and Outcome Expectancy (AC3)
• Understanding and Analysis of Hazards and Consequences (SA2)
• Robust Processes for Identifying and Analysing Vulnerabilities (KV6)
106
Weick (1993) and Horne and Orr (1998) emphasise the importance of shared vision to
an effective crisis response. Kendra and Wachtendorf (2003b) support this and utilise
Weick’s (1993) virtual role systems resilience factor when they argue,
“Each person ‘mentally takes all roles’, so that even in situations of peril
and disruption everyone is able to maintain a shared vision of risks, goals
and possible actions”.
(Kendra & Wachtendorf, 2003b, p. 42)
In the context of organisational vision, McManus (2007) also discusses a fire fighting
mentality which she observed in her case study organisations. The organisations’ crisis
response was reactive, with a narrow scope, and was characterised by a focus on short
term operability without consideration of long term implications. McManus (2007, p.
72) goes on to note,
“For those decision makers without the ability to look towards the
organisational vision, and identify where the organisation should be
heading in a crisis, fire fighting is the alternative”.
The definition of organisational vision and outcome expectancy adopted for this
research is shown in Box 23.
Box 23: Definition Organisational Vision and Outcome Expectancy
AC4 Information and Knowledge McManus (2007) argues that information and knowledge is related to communications
and relationships (the second adaptive capacity indicator) and roles and responsibilities
(the second situation awareness indicator). Information and knowledge are also related
to the minimisation of silo mentality because information and knowledge must be
gathered and shared across silos. McManus (2007) goes on to argue that the critical
A clearly defined vision which is understood across and between organisations and empowers stakeholders to view the organisation’s future positively.
107
knowledge held by key members of staff, and the nature and format of information are
key considerations within this indicator.
Smith (2005) notes how loss of key staff can erode an organisation’s corporate memory,
which can lead to the accumulation of unnoticed events and the incubation of disaster
(Turner, 1976). Smith (2005) explains that the problem of eroding corporate memory
has been linked with re-engineering and restructuring in organisations. Loss of an
organisation’s corporate memory can also affect whether they are able to retain and
learn lessons from past crises. Carmeli and Schaubroeck (2008, p. 179) emphasise the
importance of,
“…learning from experience in smaller-scale failure (precrisis) situations,
where participants can identify faulty assumptions and when necessary
unlearn the behaviours deriving from these assumptions, instead
incorporating more appropriate behaviour patterns that can make the
organisation less vulnerable to future crises”.
Despite the importance of learning from disruptions and crises, many organisations rush
into producing post-crisis debrief reports which purport to identify lessons learned
(Birkland, 2009), but which in reality contain few real lessons and are more symbolic
(Clarke, 1999). Mitroff (2005) discusses survey research which has focused on whether
New York organisations have learnt anything since the September 11th attacks and
argues,
“We are back where we started—seemingly not taking the lessons of this
tragic event seriously. September 11th may have changed our national
psyche, but it has not changed our long-term attitudes toward the
importance of crisis management in the day-to-day course of business”.
(Mitroff, 2005, p. 376)
The nature and format of information is also important during a crisis. This involves the
type of information required during a crisis, how it is stored, where is it stored, how it
will be accessed, and how it will be shared (McManus, 2007). Tarn et al. (2008) discuss
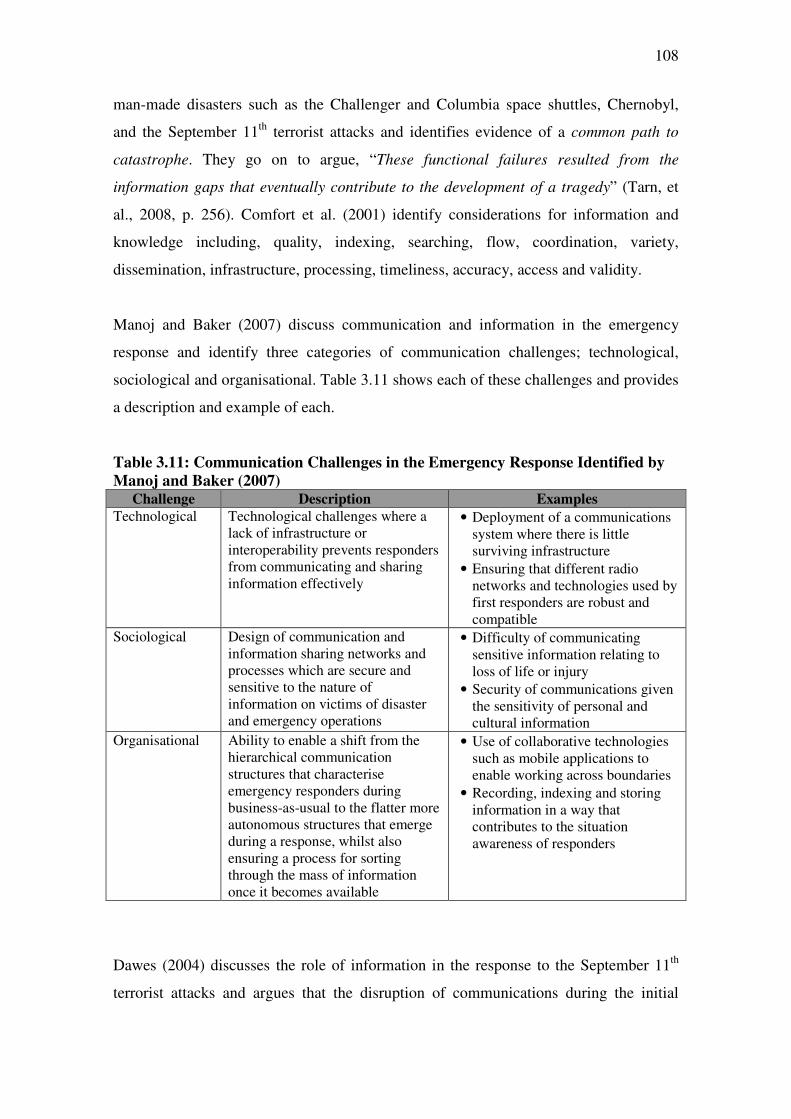
108
man-made disasters such as the Challenger and Columbia space shuttles, Chernobyl,
and the September 11th terrorist attacks and identifies evidence of a common path to
catastrophe. They go on to argue, “These functional failures resulted from the
information gaps that eventually contribute to the development of a tragedy” (Tarn, et
al., 2008, p. 256). Comfort et al. (2001) identify considerations for information and
knowledge including, quality, indexing, searching, flow, coordination, variety,
dissemination, infrastructure, processing, timeliness, accuracy, access and validity.
Manoj and Baker (2007) discuss communication and information in the emergency
response and identify three categories of communication challenges; technological,
sociological and organisational. Table 3.11 shows each of these challenges and provides
a description and example of each.
Table 3.11: Communication Challenges in the Emergency Response Identified by
Manoj and Baker (2007) Challenge Description Examples
Technological Technological challenges where a lack of infrastructure or interoperability prevents responders from communicating and sharing information effectively
• Deployment of a communications system where there is little surviving infrastructure
• Ensuring that different radio networks and technologies used by first responders are robust and compatible
Sociological Design of communication and information sharing networks and processes which are secure and sensitive to the nature of information on victims of disaster and emergency operations
• Difficulty of communicating sensitive information relating to loss of life or injury
• Security of communications given the sensitivity of personal and cultural information
Organisational Ability to enable a shift from the hierarchical communication structures that characterise emergency responders during business-as-usual to the flatter more autonomous structures that emerge during a response, whilst also ensuring a process for sorting through the mass of information once it becomes available
• Use of collaborative technologies such as mobile applications to enable working across boundaries
• Recording, indexing and storing information in a way that contributes to the situation awareness of responders
Dawes (2004) discusses the role of information in the response to the September 11th
terrorist attacks and argues that the disruption of communications during the initial
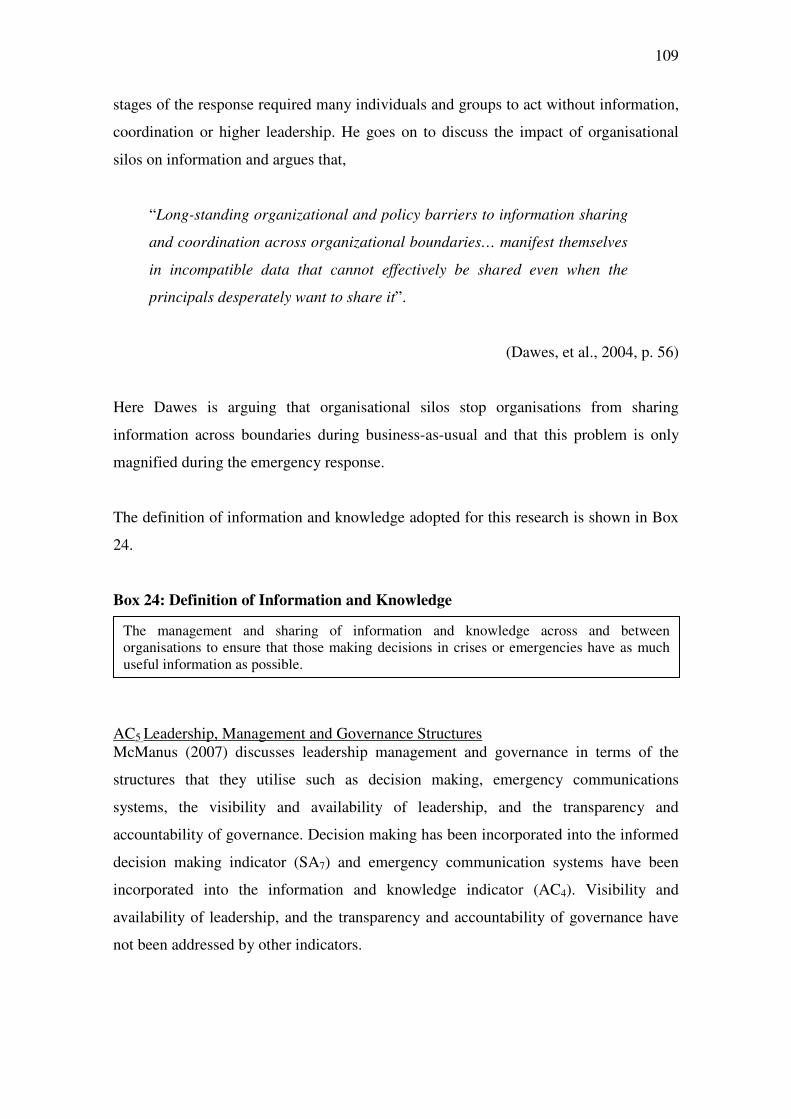
109
stages of the response required many individuals and groups to act without information,
coordination or higher leadership. He goes on to discuss the impact of organisational
silos on information and argues that,
“Long-standing organizational and policy barriers to information sharing
and coordination across organizational boundaries… manifest themselves
in incompatible data that cannot effectively be shared even when the
principals desperately want to share it”.
(Dawes, et al., 2004, p. 56)
Here Dawes is arguing that organisational silos stop organisations from sharing
information across boundaries during business-as-usual and that this problem is only
magnified during the emergency response.
The definition of information and knowledge adopted for this research is shown in Box
24.
Box 24: Definition of Information and Knowledge
AC5 Leadership, Management and Governance Structures McManus (2007) discusses leadership management and governance in terms of the
structures that they utilise such as decision making, emergency communications
systems, the visibility and availability of leadership, and the transparency and
accountability of governance. Decision making has been incorporated into the informed
decision making indicator (SA7) and emergency communication systems have been
incorporated into the information and knowledge indicator (AC4). Visibility and
availability of leadership, and the transparency and accountability of governance have
not been addressed by other indicators.
The management and sharing of information and knowledge across and between organisations to ensure that those making decisions in crises or emergencies have as much useful information as possible.
110
There are many different types of leadership discussed in the management and crisis
literature; transformational and transactional (Harland, et al., 2005), charismatic
(Gardener & Avolio, 1998), strategic (Richardson, 1994) and ethical (Smith, et al.,
2005). Leadership is often identified as a critical component of successful crisis
management (Smith, et al., 2005). This is partly because crisis management is an
executive or management level function which has a strategic focus, and partly because
of the traditional command and control, homeland security and civil defence models
employed in this area as a result of its military origins.
Hamel and Välikangas (2003) and Friedman (2005) agree that business strategies based
on past success cannot provide successful crisis management or organisational
resilience. Friedman (2005, p. 24) argues,
“…strategy and the information gained from retrospective research can
no longer be regarded as relevant, because change is no longer
incremental and predictable”.
This is also reflected by Quarantelli (1996) when he argues that past disaster, crisis, and
emergency trends cannot be extrapolated to predict the future. Pariès (2006) discusses
the role of leaders as facilitators of collective resilience. Westrum (2006) echoes this
when he discusses NASA and the Columbia space shuttle accident, he argues,
“…they key point is the climate of operation…There are individuals who
personally can serve as major bottlenecks to decision processes and
groups who become agents of rapid or thoughtful action. It all depends on
leadership, which shapes the climate and thus sets the priorities”.
(Westrum, 2006, p. 61)
Here Westrum argues that one possible cause of failure is a failure of leadership, a
single person or unit who is able to influence, through culture and climate, the ability of
other team members to be resilient. Westrum (2006) goes on to ask how the outcome of
the Columbia mission might have been different if the Flight Director (a person much
more preoccupied with safety) was in charge of assessing the shuttles airworthiness
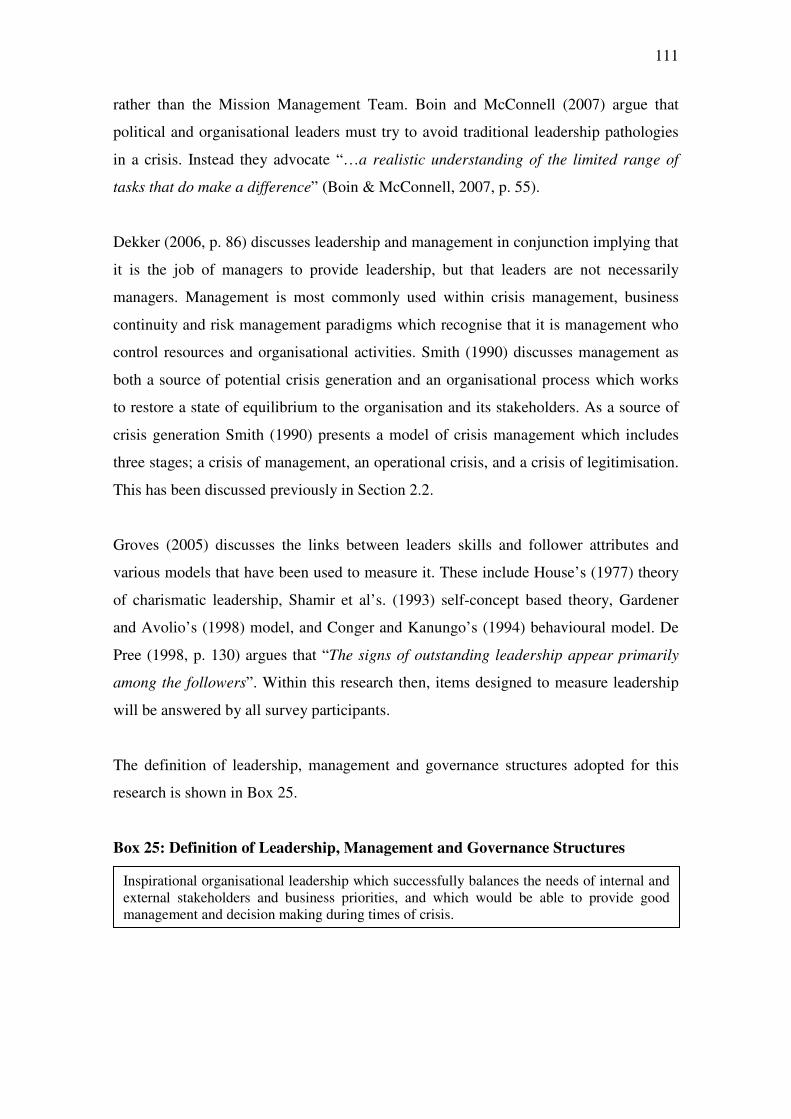
111
rather than the Mission Management Team. Boin and McConnell (2007) argue that
political and organisational leaders must try to avoid traditional leadership pathologies
in a crisis. Instead they advocate “…a realistic understanding of the limited range of
tasks that do make a difference” (Boin & McConnell, 2007, p. 55).
Dekker (2006, p. 86) discusses leadership and management in conjunction implying that
it is the job of managers to provide leadership, but that leaders are not necessarily
managers. Management is most commonly used within crisis management, business
continuity and risk management paradigms which recognise that it is management who
control resources and organisational activities. Smith (1990) discusses management as
both a source of potential crisis generation and an organisational process which works
to restore a state of equilibrium to the organisation and its stakeholders. As a source of
crisis generation Smith (1990) presents a model of crisis management which includes
three stages; a crisis of management, an operational crisis, and a crisis of legitimisation.
This has been discussed previously in Section 2.2.
Groves (2005) discusses the links between leaders skills and follower attributes and
various models that have been used to measure it. These include House’s (1977) theory
of charismatic leadership, Shamir et al’s. (1993) self-concept based theory, Gardener
and Avolio’s (1998) model, and Conger and Kanungo’s (1994) behavioural model. De
Pree (1998, p. 130) argues that “The signs of outstanding leadership appear primarily
among the followers”. Within this research then, items designed to measure leadership
will be answered by all survey participants.
The definition of leadership, management and governance structures adopted for this
research is shown in Box 25.
Box 25: Definition of Leadership, Management and Governance Structures
Inspirational organisational leadership which successfully balances the needs of internal and external stakeholders and business priorities, and which would be able to provide good management and decision making during times of crisis.
112
AC6 Innovation and Creativity Innovation and Creativity was not included in McManus’s (2007) indicators of
organisational resilience in her original ROR model. Creativity was identified through
recent literature on the response to the September 11th terrorist attacks (Kendra &
Wachtendorf, 2003a) and creativity in management decision making (Ford & Gioia,
2000). Innovation was identified through literature on continuous change (Brown &
Eisenhardt, 1997), organisational agility (Plant & Murrell, 1997) and emergent
behaviour during the crisis response (Quarantelli, 1995). Innovation and creativity was
also suggested as an indicator during the workshop when participants felt that it was not
sufficiently covered.
Kendra and Wachtendorf (2003a) discuss creativity in the response to the September
11th terrorist attacks and argue that it is a critical skill for disaster, emergency and crisis
professionals. Through this they observe a number of elements that seemed to enhance,
enable or accompany creativity in the emergency response. The first of these is
emergence, which Kendra and Wachtendorf (2003a, p. 3) define as “…the development
of processes that did not exist before”. Secondly, Kendra and Wachtendorf (2003a)
discuss improvisation, arguing that it is post-crisis, emergent, and inherent in the
definition of a disaster because disasters disrupt existing patterns making improvisation
both necessary and inevitable. They go on to discuss evidence of improvisation in
changing organisational structures, resources, and roles and responsibilities. Here
creativity is differentiated from improvisation because it is important in both pre-
disaster and post-disaster activities (Kendra & Wachtendorf, 2003a).
Guimaraes and Langley (1994) argue that company innovativeness is important for
long-term growth and survival. This is supported in the context of resilience by Hamel
and Välikangas (2003) who argue that an organisation’s survival is dependent on the
extent to which it has mastered three types of innovation; revolution, renewal and
resilience.
The definition of innovation and creativity adopted for this research is shown in Box 26.
113
Box 26: Definition of Innovation and Creativity
AC7 Devolved and Responsive Decision Making Cho (1996) identifies three ways in which organisations use information; they use
information to make sense of their operating environment, they generate new
knowledge through organisational learning, and they search for and evaluate
information to make important decisions. Cho (1996) argues that in theory, decisions
are made rationally. Organisations collect all of the relevant information, assess their
options and then select an option based on rational logical thought and comparison
(Eisenhardt & Zbaracki, 1992).
One of the most well known models of decision making is Simon’s (1957) model of
bounded rationality. In this model Simon argues that the ideal of rational choice, while
desirable, is rarely achievable. In response he proposes a model where decisions are
made according to the boundaries of their specific context and limitations. These
limitations could include the cognitive abilities and experience of the decision maker, a
lack of information, pressure from stakeholders, conflicting values (e.g. production vs.
safety) and time criticality. Therefore it is important that crisis decisions are made by
those qualified to make them rather than those with the authority to make decisions as a
result of their hierarchical position within the organisation. Weick and Sutcliffe (2007)
refer to this as deference to expertise and include it in their research as an element of
mindfulness within organisations. However, in reality it is important that both senior
managers and front line experts are involved in making decisions which could have
implications at operational, tactical and strategic levels.
Mallak (1998a) includes the expansion of decision making in his discussion of
organisational resilience in health care organisations. The expansion of decision making
refers to the delegation of authority to staff to make decisions relating to their work.
This concept is very similar to deference to expertise as discussed by Weick and
Sutcliffe (2007). Mallak (1998a, p. 11) notes that expansion of decision making is
closely linked with ensuring adequate external resources, and argues that it is “Often
An organisational system where innovation and creativity are consistently encouraged and rewarded, and where the generation and evaluation of new ideas is recognised as key to the organisation’s performance during crises or emergencies.
114
considered a critical element of empowerment… (and that it is) a key resilience
concept”.
Smits and Ally (2003, p. 15) argue “Crisis management calls for timely, often
hurried…decision making”. Here they emphasise how the characteristics of crisis
situations can affect decision making. They continue,
“While decision speed in many types of business situations may be positively
correlated with developing as many alternatives as possible and comparing
them simultaneously…crisis situations require up-front work so that the
development phase is greatly abbreviated”.
(Smits & Ally, 2003, p. 15)
Here Smits and Ally (2003) note how the speed, and responsiveness, of decision making
during crisis situations can be improved by including decision making, e.g. structures,
authority and delegations, in crisis planning. The definition of devolved and responsive
decision making adopted for this research is shown in Box 27.
Box 27: Definition of Devolved and Responsive Decision Making
3.4 Summary and Use of the Indicators
Section 3.3 provided a review of literature and a definition for each of the 23 indicators
included in McManus’s (2007) model and the updated model of organisational
resilience.
Each indicator is defined in an emergency or crisis context and these definitions will
form the basis of the questions that are generated and presented in Chapter 5. These
definitions are provided as a list in Appendix A7.
An organisational structure, formal or informal, which evolves during the response to an emergency or crisis, where people have the authority to make decisions directly linked to their work and where, when higher authority is required, this can be obtained quickly and
without excessive bureaucracy.
115
Chapter 4 – Thesis Methodology
This chapter discusses the methods used, the hypotheses that will be tested through this
thesis, and the development of the scales, or measurement tool, to measure
organisational resilience.
4.1 Methods
This section discusses the methods used to develop the resilience measurement tool
including why they were chosen and their limitations. The application of each method is
discussed in the relevant chapter or section as indicated.
4.1.1 Unit of Analysis
When measuring organisational resilience, the organisation is the primary unit of
analysis. However to provide a useful measurement of organisational resilience, it is
important that data collected represents the organisation, and not just one member of
staff such as the CEO or emergency manager (except in the case of sole traders).
Bryman and Bell (2007, p. 197) support this when they state,
“…it can also be argued that it is unwise to rely on a single respondent to
know everything about the organisation…if the respondent is a senior
manager they may also be inclined to represent organisational practises in
a way that portrays their own role and responsibilities more favourably”.
In addition Rogelberg and Stanton (2007) suggest that involving a wide range of
employees from across the organisation will foster commitment to the survey and
encourage more individuals to take part.
The intention of this research was to collect a representative sample of data from each
organisation, and then to aggregate their data to create the submission for the
organisation. The simplest way to achieve this would be to set a threshold of
116
participation, for example 51% of staff from the organisation so that over half of the
staff is represented. However there are no accepted rules about what threshold of
participation should be used.
Hofstede (1990) investigates organisational subcultures across twenty business units
within ten organisations and achieves a response of 87% within each unit. Within this
sample, roughly one third was managers, one third was professionals and one third was
non-professionals. Singer et al. (2003) measured safety climate in 15 California
hospitals and also used a stratified sample within each hospital to ensure representation
of senior executives, attending physicians and other staff. Miller (1993) investigated
industry and country effects on managers’ perception of environmental uncertainty and
surveyed between 1 and 3 managers per organisation.
While a stratified sample might be desirable, the management of a stratified sample or a
high participation threshold represents a considerable commitment of resources and
could discourage organisations from taking part. Instead, invitations to take part in the
research were sent to a senior manager from each organisation who was then asked to
forward it to all staff within the organisation’s Auckland location. The research team
then asked the senior managers to encourage ‘as many staff as possible’ to take part.
The assumption was that once the senior manager had agreed to take part, the invitation
for staff to take part in the research (sent by the senior manager) would be more
successful.
While for some organisations, this resulted in a very high response rate, for others, only
one member of staff took part. Rather than discount these organisations from the
research, it was decided to include them, with a caveat that their results, while important
for the research, would not necessarily provide a wholly accurate measure of their
resilience. If the tool were adopted as a leading indicator for organisations to monitor
and evaluate their resilience over time, the minimum threshold of participation and the
use of a stratified sample would need to be investigated; this is discussed in Chapter 9.
117
4.1.2 A Web-based Self-assessment Survey
Disaster research has traditionally been dominated by qualitative approaches (Bourque,
et al., 2002). As an example of this, Coleman (2004) notes how crisis management
literature has traditionally focused on case studies. These usually investigate large scale
or well-known events such as the Columbia space shuttle disaster (Mason, 2004),
particular response methods or tools such as incident management skills (Crichton, et
al., 2005), or individual organisations such as business continuity at Boeing (Castillo,
2004). Bourque et al. (2002, p. 157) note,
“Disaster researchers’ reluctance to…use of well-designed, standardised
population-based surveys reflects both realistic and unrealistic barriers to
their use…the availability of new, technologically sophisticated methods
for conducting surveys make many of these historical barriers obsolete”.
This is reflected by Stallings (2002) who argues that disaster researchers are
increasingly looking towards survey research.
The resilience measurement tool for this thesis was created as two versions of a web-
based self-assessment survey; a senior manager version and an all-staff version. The all-
staff version contains the resilience measurement questions and the senior managers’
version contains the resilience measurement questions as well as an extra section of
reflective organisational performance questions. This approach enables the researcher to
compare senior manager and staff perceptions and knowledge, and to limit the length of
the all-staff version to include only those questions that most staff would be able to
answer.
Simsek and Veiga (2001) identify three benefits of web-based surveys; cost, data
collection speed, and media richness. The resilience benchmarking tool is hosted by
www.surveymonkey.com which was chosen because it provides a customisable format
for web-based surveys, offers a variety of question and page formats, is inexpensive,
and includes full technical support. A more detailed discussion of the survey and its
format, including screen shots of features and questions is included in Chapter 5. Costs
involved in the survey included the hosting of the web-based survey (NZ$600 for three
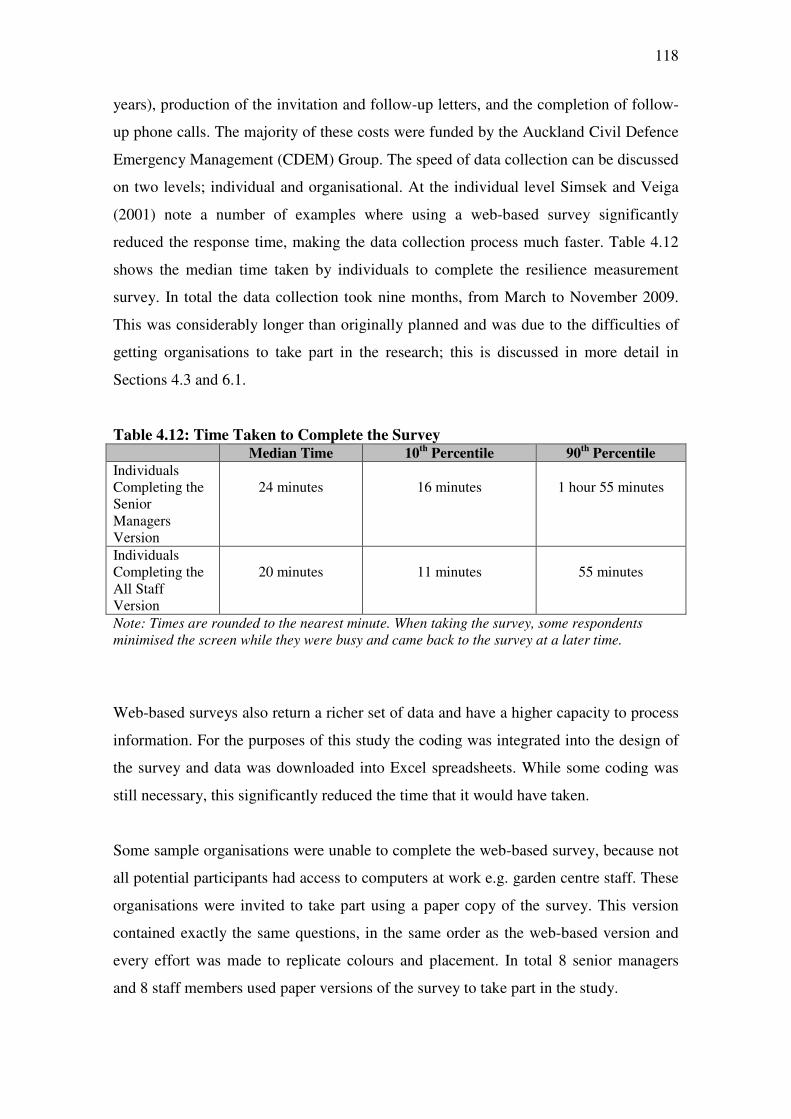
118
years), production of the invitation and follow-up letters, and the completion of follow-
up phone calls. The majority of these costs were funded by the Auckland Civil Defence
Emergency Management (CDEM) Group. The speed of data collection can be discussed
on two levels; individual and organisational. At the individual level Simsek and Veiga
(2001) note a number of examples where using a web-based survey significantly
reduced the response time, making the data collection process much faster. Table 4.12
shows the median time taken by individuals to complete the resilience measurement
survey. In total the data collection took nine months, from March to November 2009.
This was considerably longer than originally planned and was due to the difficulties of
getting organisations to take part in the research; this is discussed in more detail in
Sections 4.3 and 6.1.
Table 4.12: Time Taken to Complete the Survey Median Time 10
th Percentile 90
th Percentile
Individuals Completing the Senior Managers Version
24 minutes
16 minutes
1 hour 55 minutes
Individuals Completing the All Staff Version
20 minutes
11 minutes
55 minutes
Note: Times are rounded to the nearest minute. When taking the survey, some respondents minimised the screen while they were busy and came back to the survey at a later time.
Web-based surveys also return a richer set of data and have a higher capacity to process
information. For the purposes of this study the coding was integrated into the design of
the survey and data was downloaded into Excel spreadsheets. While some coding was
still necessary, this significantly reduced the time that it would have taken.
Some sample organisations were unable to complete the web-based survey, because not
all potential participants had access to computers at work e.g. garden centre staff. These
organisations were invited to take part using a paper copy of the survey. This version
contained exactly the same questions, in the same order as the web-based version and
every effort was made to replicate colours and placement. In total 8 senior managers
and 8 staff members used paper versions of the survey to take part in the study.

119
4.1.3 Semi-structured Interviews
Semi-structured interviews were used in this research to gather feedback from each of
the pilot study participants about the survey. This formed part of the scale development
process discussed in Chapter 5 however is discussed here as a methodology employed
within the research. Bryman and Bell (2007, p. 474) define semi-structured interviews
as when,
“The researcher has a list of questions on fairly specific topics to be
covered…but the interviewee has a great deal of leeway in how to reply”.
The questions used for the semi-structured interviews are discussed in more detail in
Chapter 5, however they broadly address:
• Ease of accessing the survey;
• survey introduction, instructions and ethics;
• content and face validity of the questions themselves;
• format and layout of the survey; and
• time taken to complete the survey.
The semi-structured interviews were either conducted in person through a face-to-face
interview, or through a telephone interview. Notes were made and all participants were
given the opportunity to review their transcripts.
4.1.4 Sampling
This research focuses on measuring the resilience of organisations in the Auckland
region of New Zealand using a random sample. Auckland was chosen because it is the
powerhouse of the New Zealand economy and is also New Zealand’s largest population
centre. A map of the Auckland region can be found in Appendix B1.
Simsek and Veiga (2001) identify two main issues when discussing sampling error;
representativeness and control. In the context of this research representativeness means
120
trying to identify a sample of organisations from the Auckland region which represents
the characteristics of the region as a whole. In order to achieve a representative sample,
the sampling frame must be unbiased and complete, however this is very difficult when
surveying multiple organisations (Simsek & Veiga, 2001) as no complete list is
available. The sampling frame used in this research is presented and discussed in
Section 4.1.4.1.
Sampling control refers to control over a kind of fraud within the survey. It covers
issues such as participants forwarding the survey links to people who should not be in
the sample, or submitting more than one response to influence their results (Simsek &
Veiga, 2001). It is unlikely that an individual from outside of the sample will respond to
the survey without the researcher knowing, or respond more than once, because
participants are asked to provide the name of their organisation and their job title, and
each survey link has a unique identifying code which relates to a particular organisation.
4.1.4.1 Sampling Frame
The purpose of this section is to demonstrate and discuss the representativeness of the
sampling frame of Auckland organisations for this thesis.
A sampling frame is the starting list from which a sample is drawn (Scheaffer, et al.,
1995). Simsek and Veiga (2001) argue that sampling frames should be unbiased,
however they also note that no such unbiased list exists for organisational populations.
To address this they recommend that researchers use multiple data collection methods,
e.g. postal surveys, email surveys, questionnaires on notice boards etc. In this research
every effort was made to ensure that the list used was representative and web-based and
paper-based surveys were used.
The sampling frame chosen for this research was the Veda Advantage organisational
database which lists 31,285 organisations. Veda Advantage is a business directory
service based in New Zealand that provides information on credit for organisations. All
of the industry sectors used by Statistics New Zealand (2009) to classify organisations
in their business statistics are represented within the sampling frame. Table 4.13 shows
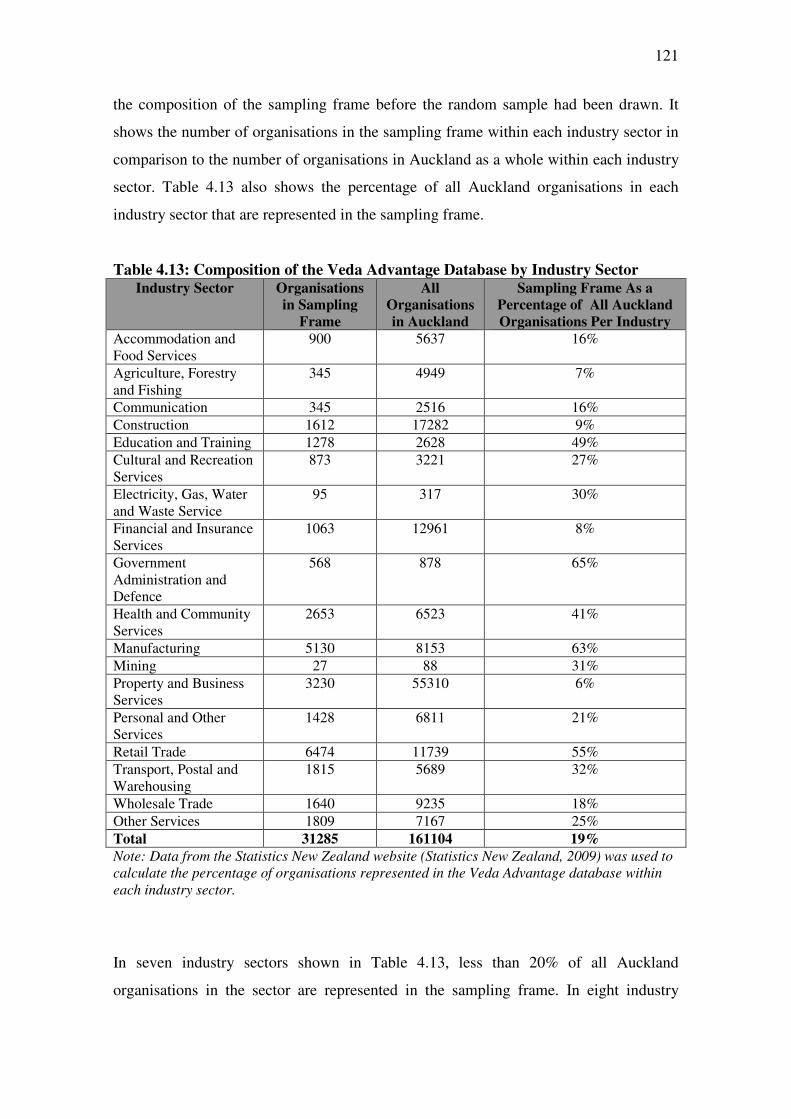
121
the composition of the sampling frame before the random sample had been drawn. It
shows the number of organisations in the sampling frame within each industry sector in
comparison to the number of organisations in Auckland as a whole within each industry
sector. Table 4.13 also shows the percentage of all Auckland organisations in each
industry sector that are represented in the sampling frame.
Table 4.13: Composition of the Veda Advantage Database by Industry Sector Industry Sector Organisations
in Sampling
Frame
All
Organisations
in Auckland
Sampling Frame As a
Percentage of All Auckland
Organisations Per Industry
Accommodation and Food Services
900 5637 16%
Agriculture, Forestry and Fishing
345 4949 7%
Communication 345 2516 16%
Construction 1612 17282 9%
Education and Training 1278 2628 49%
Cultural and Recreation Services
873 3221 27%
Electricity, Gas, Water and Waste Service
95 317 30%
Financial and Insurance Services
1063 12961 8%
Government Administration and Defence
568 878 65%
Health and Community Services
2653 6523 41%
Manufacturing 5130 8153 63%
Mining 27 88 31%
Property and Business Services
3230 55310 6%
Personal and Other Services
1428 6811 21%
Retail Trade 6474 11739 55%
Transport, Postal and Warehousing
1815 5689 32%
Wholesale Trade 1640 9235 18%
Other Services 1809 7167 25%
Total 31285 161104 19%
Note: Data from the Statistics New Zealand website (Statistics New Zealand, 2009) was used to calculate the percentage of organisations represented in the Veda Advantage database within each industry sector.
In seven industry sectors shown in Table 4.13, less than 20% of all Auckland
organisations in the sector are represented in the sampling frame. In eight industry
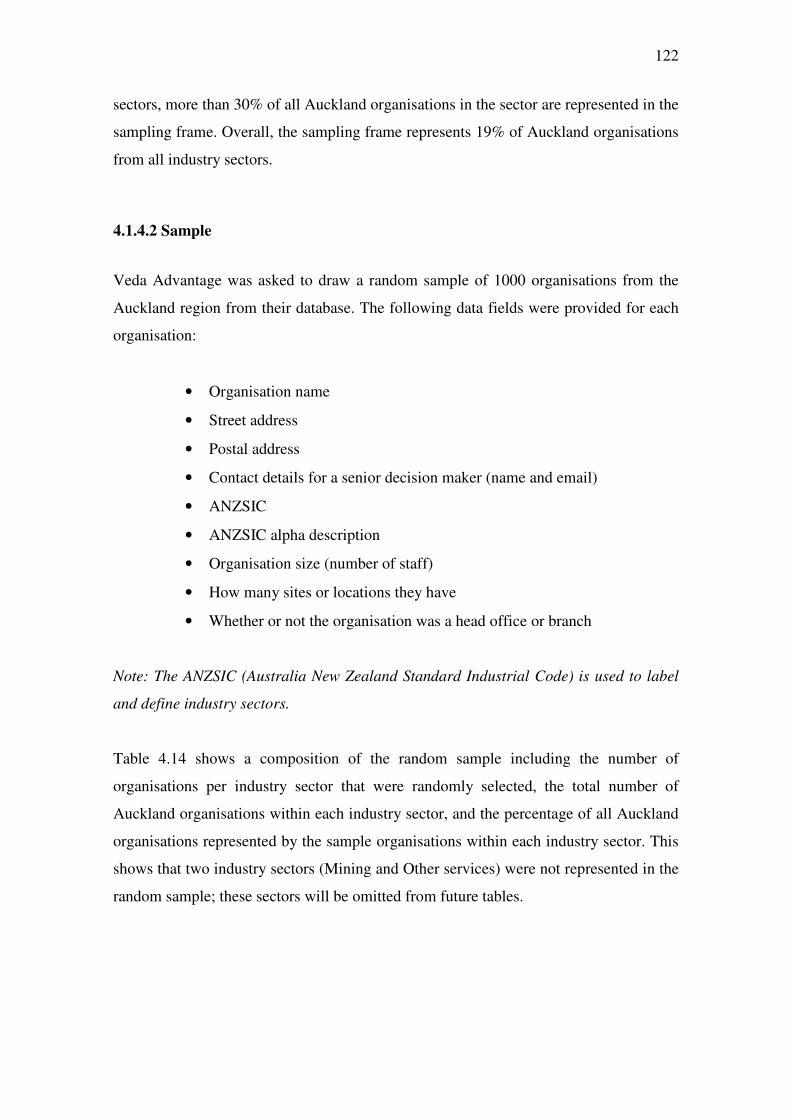
122
sectors, more than 30% of all Auckland organisations in the sector are represented in the
sampling frame. Overall, the sampling frame represents 19% of Auckland organisations
from all industry sectors.
4.1.4.2 Sample
Veda Advantage was asked to draw a random sample of 1000 organisations from the
Auckland region from their database. The following data fields were provided for each
organisation:
• Organisation name
• Street address
• Postal address
• Contact details for a senior decision maker (name and email)
• ANZSIC
• ANZSIC alpha description
• Organisation size (number of staff)
• How many sites or locations they have
• Whether or not the organisation was a head office or branch
Note: The ANZSIC (Australia New Zealand Standard Industrial Code) is used to label
and define industry sectors.
Table 4.14 shows a composition of the random sample including the number of
organisations per industry sector that were randomly selected, the total number of
Auckland organisations within each industry sector, and the percentage of all Auckland
organisations represented by the sample organisations within each industry sector. This
shows that two industry sectors (Mining and Other services) were not represented in the
random sample; these sectors will be omitted from future tables.
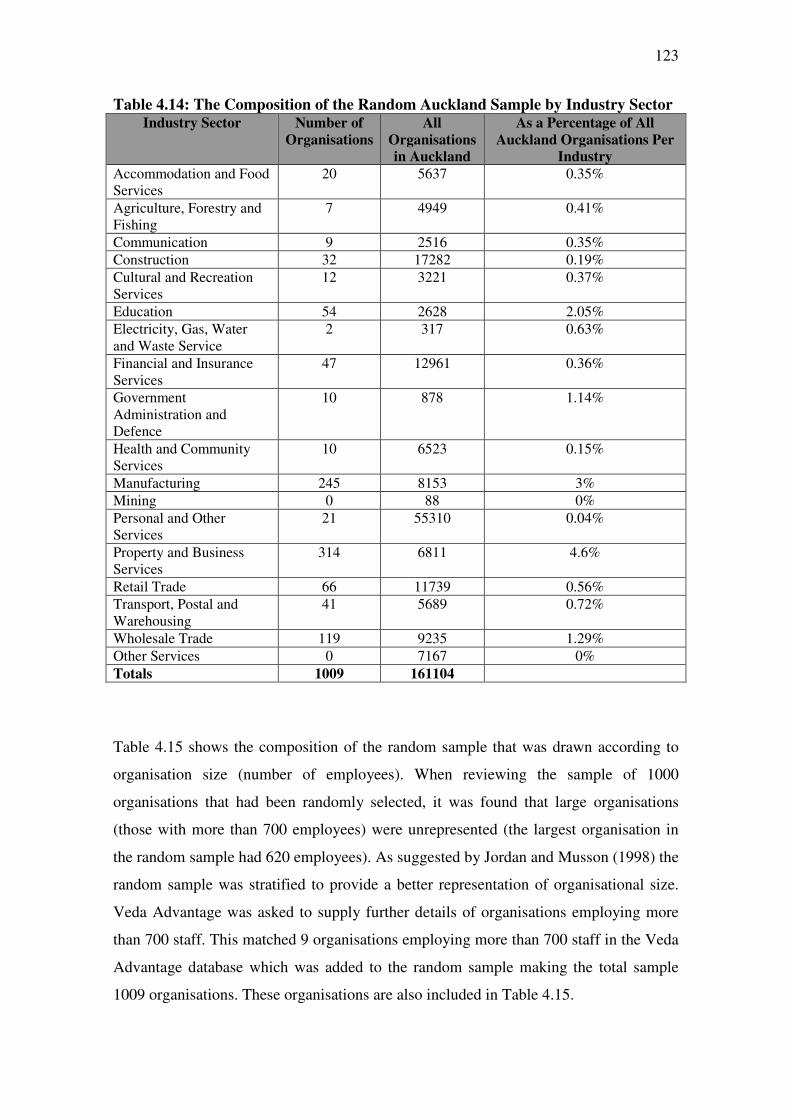
123
Table 4.14: The Composition of the Random Auckland Sample by Industry Sector Industry Sector Number of
Organisations
All
Organisations
in Auckland
As a Percentage of All
Auckland Organisations Per
Industry
Accommodation and Food Services
20 5637 0.35%
Agriculture, Forestry and Fishing
7 4949 0.41%
Communication 9 2516 0.35%
Construction 32 17282 0.19%
Cultural and Recreation Services
12 3221 0.37%
Education 54 2628 2.05%
Electricity, Gas, Water and Waste Service
2 317 0.63%
Financial and Insurance Services
47 12961 0.36%
Government Administration and Defence
10 878 1.14%
Health and Community Services
10 6523 0.15%
Manufacturing 245 8153 3%
Mining 0 88 0%
Personal and Other Services
21 55310 0.04%
Property and Business Services
314 6811 4.6%
Retail Trade 66 11739 0.56%
Transport, Postal and Warehousing
41 5689 0.72%
Wholesale Trade 119 9235 1.29%
Other Services 0 7167 0%
Totals 1009 161104
Table 4.15 shows the composition of the random sample that was drawn according to
organisation size (number of employees). When reviewing the sample of 1000
organisations that had been randomly selected, it was found that large organisations
(those with more than 700 employees) were unrepresented (the largest organisation in
the random sample had 620 employees). As suggested by Jordan and Musson (1998) the
random sample was stratified to provide a better representation of organisational size.
Veda Advantage was asked to supply further details of organisations employing more
than 700 staff. This matched 9 organisations employing more than 700 staff in the Veda
Advantage database which was added to the random sample making the total sample
1009 organisations. These organisations are also included in Table 4.15.
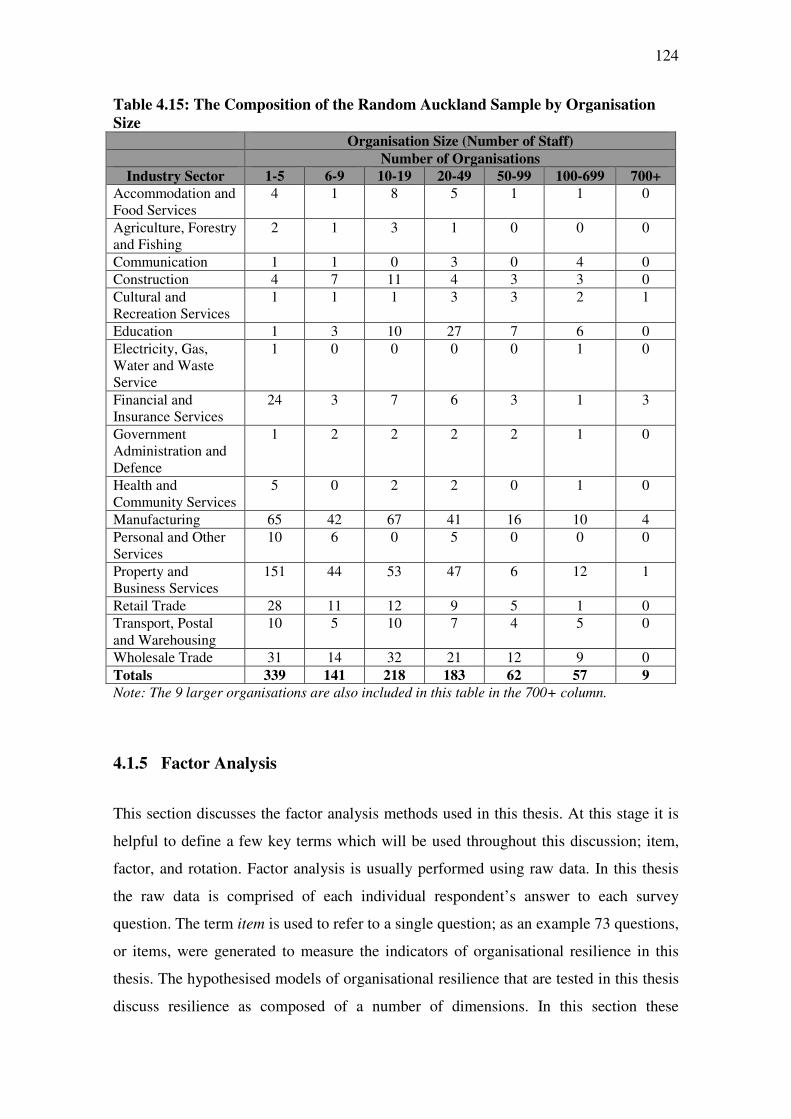
124
Table 4.15: The Composition of the Random Auckland Sample by Organisation
Size Organisation Size (Number of Staff)
Number of Organisations
Industry Sector 1-5 6-9 10-19 20-49 50-99 100-699 700+
Accommodation and Food Services
4 1 8 5 1 1 0
Agriculture, Forestry and Fishing
2 1 3 1 0 0 0
Communication 1 1 0 3 0 4 0
Construction 4 7 11 4 3 3 0
Cultural and Recreation Services
1 1 1 3 3 2 1
Education 1 3 10 27 7 6 0
Electricity, Gas, Water and Waste Service
1 0 0 0 0 1 0
Financial and Insurance Services
24 3 7 6 3 1 3
Government Administration and Defence
1 2 2 2 2 1 0
Health and Community Services
5 0 2 2 0 1 0
Manufacturing 65 42 67 41 16 10 4
Personal and Other Services
10 6 0 5 0 0 0
Property and Business Services
151 44 53 47 6 12 1
Retail Trade 28 11 12 9 5 1 0
Transport, Postal and Warehousing
10 5 10 7 4 5 0
Wholesale Trade 31 14 32 21 12 9 0
Totals 339 141 218 183 62 57 9
Note: The 9 larger organisations are also included in this table in the 700+ column.
4.1.5 Factor Analysis
This section discusses the factor analysis methods used in this thesis. At this stage it is
helpful to define a few key terms which will be used throughout this discussion; item,
factor, and rotation. Factor analysis is usually performed using raw data. In this thesis
the raw data is comprised of each individual respondent’s answer to each survey
question. The term item is used to refer to a single question; as an example 73 questions,
or items, were generated to measure the indicators of organisational resilience in this
thesis. The hypothesised models of organisational resilience that are tested in this thesis
discuss resilience as composed of a number of dimensions. In this section these
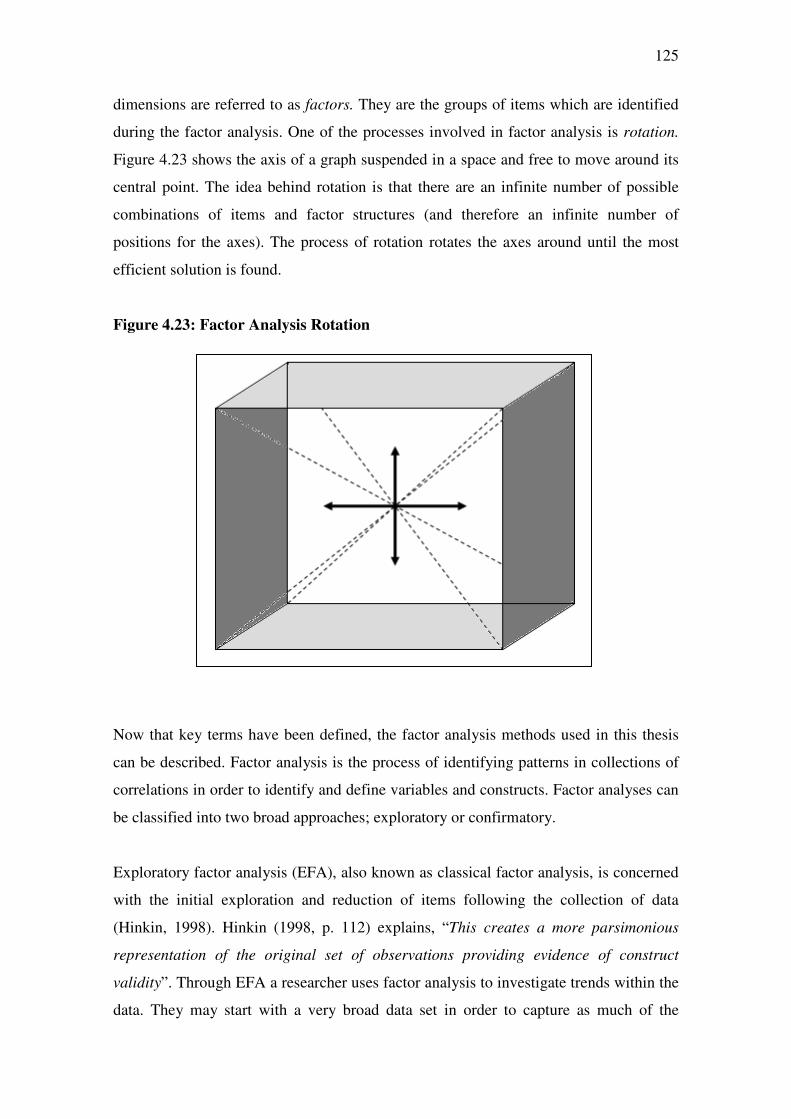
125
dimensions are referred to as factors. They are the groups of items which are identified
during the factor analysis. One of the processes involved in factor analysis is rotation.
Figure 4.23 shows the axis of a graph suspended in a space and free to move around its
central point. The idea behind rotation is that there are an infinite number of possible
combinations of items and factor structures (and therefore an infinite number of
positions for the axes). The process of rotation rotates the axes around until the most
efficient solution is found.
Figure 4.23: Factor Analysis Rotation
Now that key terms have been defined, the factor analysis methods used in this thesis
can be described. Factor analysis is the process of identifying patterns in collections of
correlations in order to identify and define variables and constructs. Factor analyses can
be classified into two broad approaches; exploratory or confirmatory.
Exploratory factor analysis (EFA), also known as classical factor analysis, is concerned
with the initial exploration and reduction of items following the collection of data
(Hinkin, 1998). Hinkin (1998, p. 112) explains, “This creates a more parsimonious
representation of the original set of observations providing evidence of construct
validity”. Through EFA a researcher uses factor analysis to investigate trends within the
data. They may start with a very broad data set in order to capture as much of the
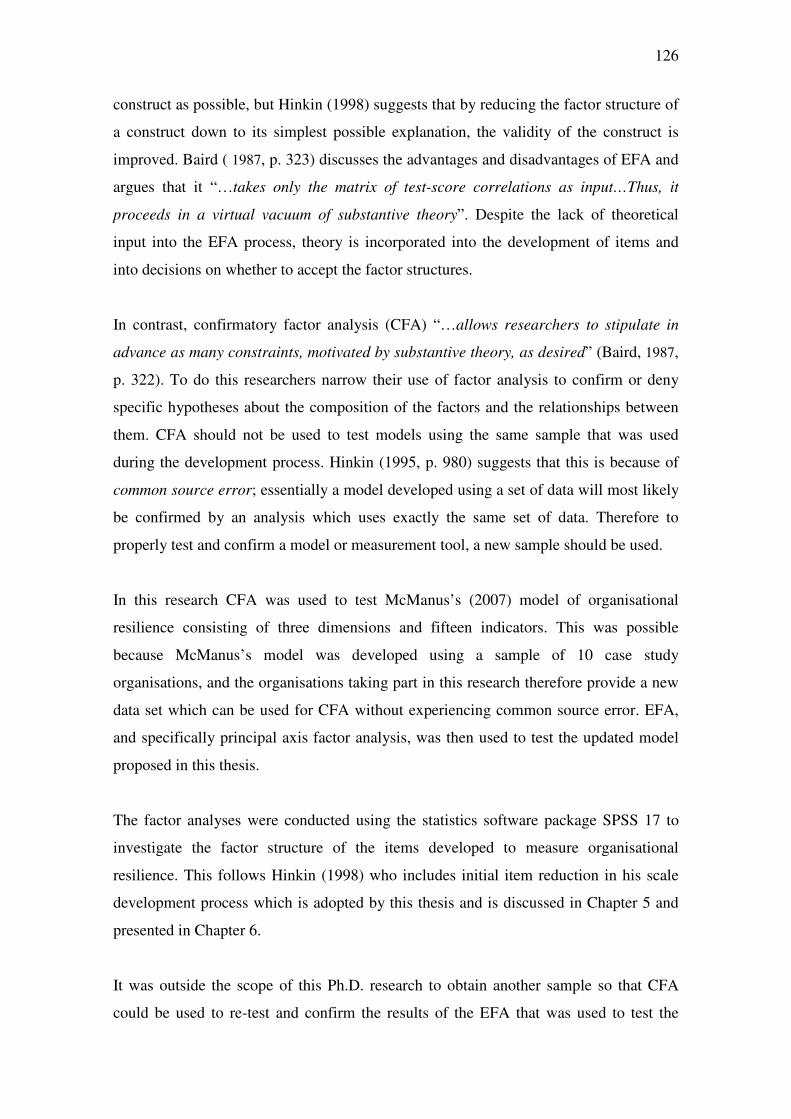
126
construct as possible, but Hinkin (1998) suggests that by reducing the factor structure of
a construct down to its simplest possible explanation, the validity of the construct is
improved. Baird ( 1987, p. 323) discusses the advantages and disadvantages of EFA and
argues that it “…takes only the matrix of test-score correlations as input…Thus, it
proceeds in a virtual vacuum of substantive theory”. Despite the lack of theoretical
input into the EFA process, theory is incorporated into the development of items and
into decisions on whether to accept the factor structures.
In contrast, confirmatory factor analysis (CFA) “…allows researchers to stipulate in
advance as many constraints, motivated by substantive theory, as desired” (Baird, 1987,
p. 322). To do this researchers narrow their use of factor analysis to confirm or deny
specific hypotheses about the composition of the factors and the relationships between
them. CFA should not be used to test models using the same sample that was used
during the development process. Hinkin (1995, p. 980) suggests that this is because of
common source error; essentially a model developed using a set of data will most likely
be confirmed by an analysis which uses exactly the same set of data. Therefore to
properly test and confirm a model or measurement tool, a new sample should be used.
In this research CFA was used to test McManus’s (2007) model of organisational
resilience consisting of three dimensions and fifteen indicators. This was possible
because McManus’s model was developed using a sample of 10 case study
organisations, and the organisations taking part in this research therefore provide a new
data set which can be used for CFA without experiencing common source error. EFA,
and specifically principal axis factor analysis, was then used to test the updated model
proposed in this thesis.
The factor analyses were conducted using the statistics software package SPSS 17 to
investigate the factor structure of the items developed to measure organisational
resilience. This follows Hinkin (1998) who includes initial item reduction in his scale
development process which is adopted by this thesis and is discussed in Chapter 5 and
presented in Chapter 6.
It was outside the scope of this Ph.D. research to obtain another sample so that CFA
could be used to re-test and confirm the results of the EFA that was used to test the
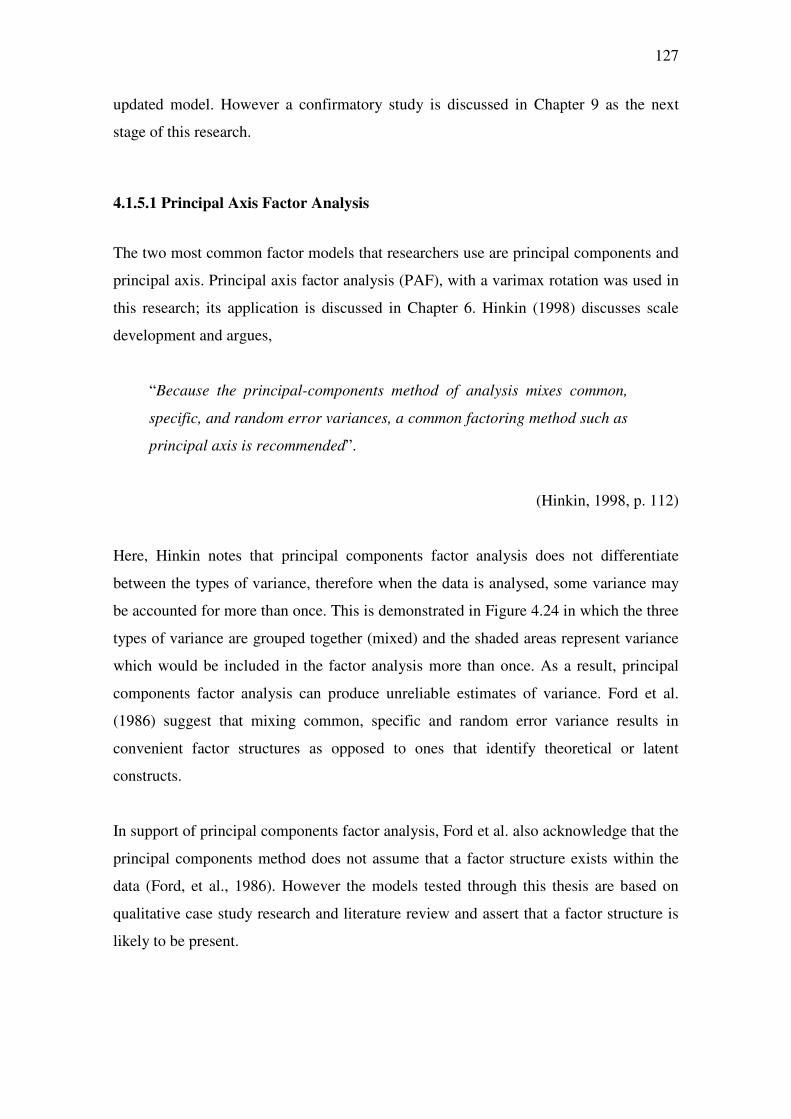
127
updated model. However a confirmatory study is discussed in Chapter 9 as the next
stage of this research.
4.1.5.1 Principal Axis Factor Analysis
The two most common factor models that researchers use are principal components and
principal axis. Principal axis factor analysis (PAF), with a varimax rotation was used in
this research; its application is discussed in Chapter 6. Hinkin (1998) discusses scale
development and argues,
“Because the principal-components method of analysis mixes common,
specific, and random error variances, a common factoring method such as
principal axis is recommended”.
(Hinkin, 1998, p. 112)
Here, Hinkin notes that principal components factor analysis does not differentiate
between the types of variance, therefore when the data is analysed, some variance may
be accounted for more than once. This is demonstrated in Figure 4.24 in which the three
types of variance are grouped together (mixed) and the shaded areas represent variance
which would be included in the factor analysis more than once. As a result, principal
components factor analysis can produce unreliable estimates of variance. Ford et al.
(1986) suggest that mixing common, specific and random error variance results in
convenient factor structures as opposed to ones that identify theoretical or latent
constructs.
In support of principal components factor analysis, Ford et al. also acknowledge that the
principal components method does not assume that a factor structure exists within the
data (Ford, et al., 1986). However the models tested through this thesis are based on
qualitative case study research and literature review and assert that a factor structure is
likely to be present.
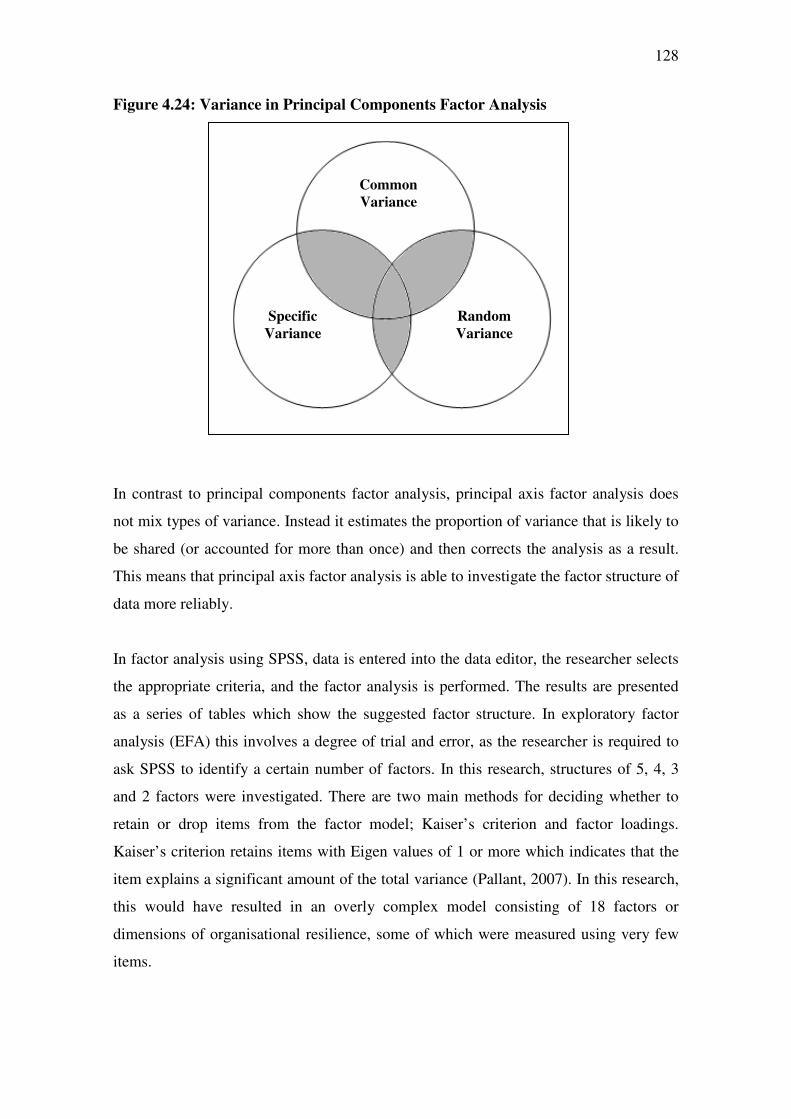
128
Figure 4.24: Variance in Principal Components Factor Analysis
In contrast to principal components factor analysis, principal axis factor analysis does
not mix types of variance. Instead it estimates the proportion of variance that is likely to
be shared (or accounted for more than once) and then corrects the analysis as a result.
This means that principal axis factor analysis is able to investigate the factor structure of
data more reliably.
In factor analysis using SPSS, data is entered into the data editor, the researcher selects
the appropriate criteria, and the factor analysis is performed. The results are presented
as a series of tables which show the suggested factor structure. In exploratory factor
analysis (EFA) this involves a degree of trial and error, as the researcher is required to
ask SPSS to identify a certain number of factors. In this research, structures of 5, 4, 3
and 2 factors were investigated. There are two main methods for deciding whether to
retain or drop items from the factor model; Kaiser’s criterion and factor loadings.
Kaiser’s criterion retains items with Eigen values of 1 or more which indicates that the
item explains a significant amount of the total variance (Pallant, 2007). In this research,
this would have resulted in an overly complex model consisting of 18 factors or
dimensions of organisational resilience, some of which were measured using very few
items.
Common
Variance
Random
Variance
Specific
Variance
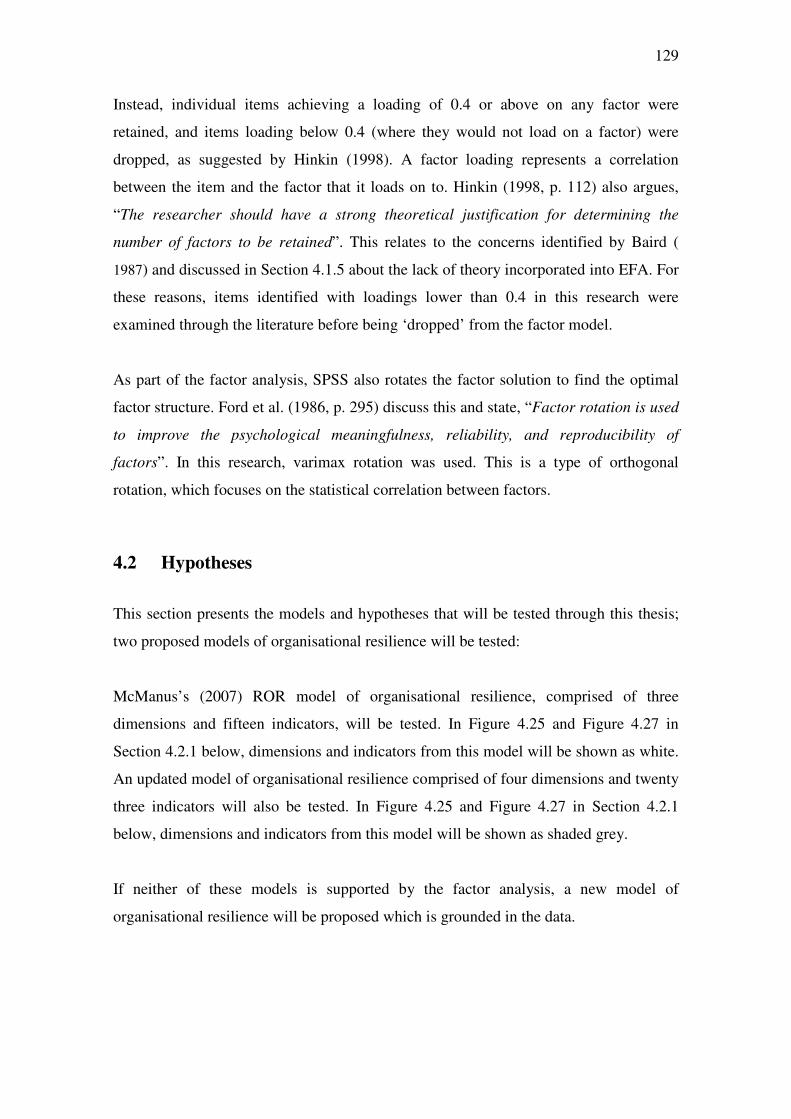
129
Instead, individual items achieving a loading of 0.4 or above on any factor were
retained, and items loading below 0.4 (where they would not load on a factor) were
dropped, as suggested by Hinkin (1998). A factor loading represents a correlation
between the item and the factor that it loads on to. Hinkin (1998, p. 112) also argues,
“The researcher should have a strong theoretical justification for determining the
number of factors to be retained”. This relates to the concerns identified by Baird (
1987) and discussed in Section 4.1.5 about the lack of theory incorporated into EFA. For
these reasons, items identified with loadings lower than 0.4 in this research were
examined through the literature before being ‘dropped’ from the factor model.
As part of the factor analysis, SPSS also rotates the factor solution to find the optimal
factor structure. Ford et al. (1986, p. 295) discuss this and state, “Factor rotation is used
to improve the psychological meaningfulness, reliability, and reproducibility of
factors”. In this research, varimax rotation was used. This is a type of orthogonal
rotation, which focuses on the statistical correlation between factors.
4.2 Hypotheses
This section presents the models and hypotheses that will be tested through this thesis;
two proposed models of organisational resilience will be tested:
McManus’s (2007) ROR model of organisational resilience, comprised of three
dimensions and fifteen indicators, will be tested. In Figure 4.25 and Figure 4.27 in
Section 4.2.1 below, dimensions and indicators from this model will be shown as white.
An updated model of organisational resilience comprised of four dimensions and twenty
three indicators will also be tested. In Figure 4.25 and Figure 4.27 in Section 4.2.1
below, dimensions and indicators from this model will be shown as shaded grey.
If neither of these models is supported by the factor analysis, a new model of
organisational resilience will be proposed which is grounded in the data.
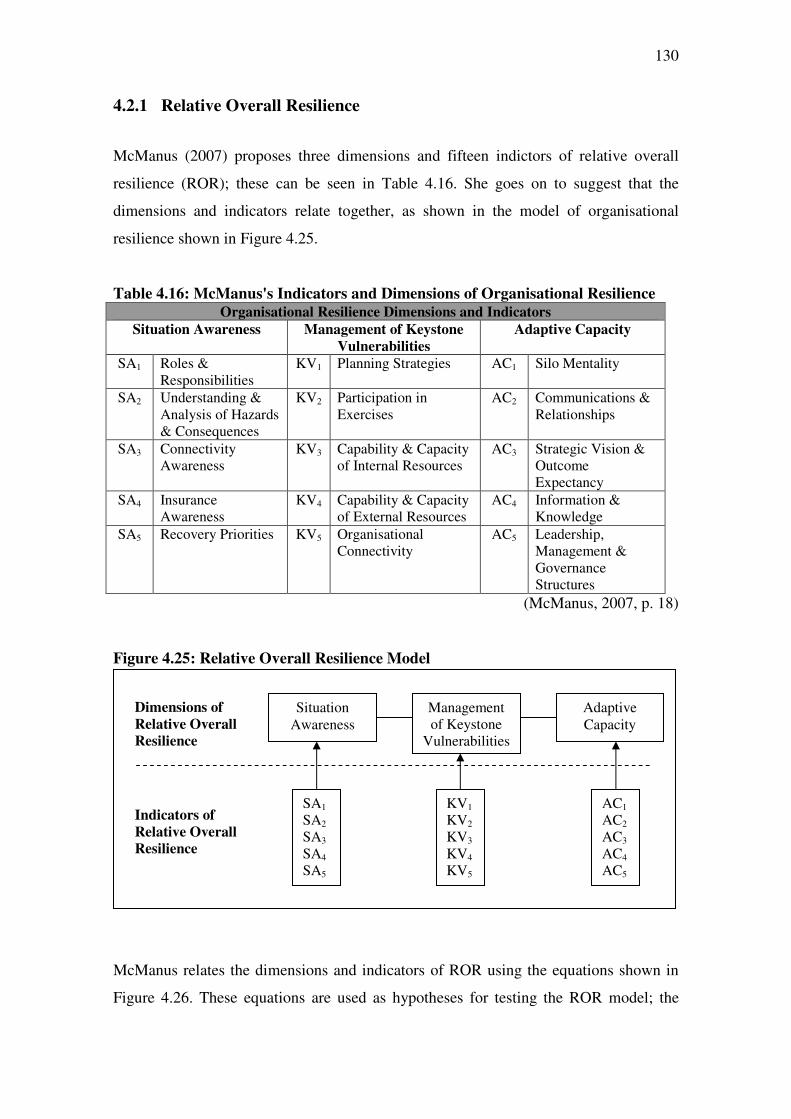
130
4.2.1 Relative Overall Resilience
McManus (2007) proposes three dimensions and fifteen indictors of relative overall
resilience (ROR); these can be seen in Table 4.16. She goes on to suggest that the
dimensions and indicators relate together, as shown in the model of organisational
resilience shown in Figure 4.25.
Table 4.16: McManus's Indicators and Dimensions of Organisational Resilience
Organisational Resilience Dimensions and Indicators
Situation Awareness Management of Keystone
Vulnerabilities
Adaptive Capacity
SA1 Roles & Responsibilities
KV1 Planning Strategies AC1 Silo Mentality
SA2 Understanding & Analysis of Hazards & Consequences
KV2 Participation in Exercises
AC2 Communications & Relationships
SA3 Connectivity Awareness
KV3 Capability & Capacity of Internal Resources
AC3 Strategic Vision & Outcome Expectancy
SA4 Insurance Awareness
KV4 Capability & Capacity of External Resources
AC4 Information & Knowledge
SA5 Recovery Priorities KV5 Organisational Connectivity
AC5 Leadership, Management & Governance Structures
(McManus, 2007, p. 18)
Figure 4.25: Relative Overall Resilience Model
McManus relates the dimensions and indicators of ROR using the equations shown in
Figure 4.26. These equations are used as hypotheses for testing the ROR model; the
Situation Awareness
Management of Keystone
Vulnerabilities
Adaptive Capacity
SA1
SA2
SA3
SA4
SA5
KV1
KV2
KV3
KV4
KV5
AC1
AC2
AC3
AC4
AC5
Dimensions of
Relative Overall
Resilience
Indicators of
Relative Overall
Resilience
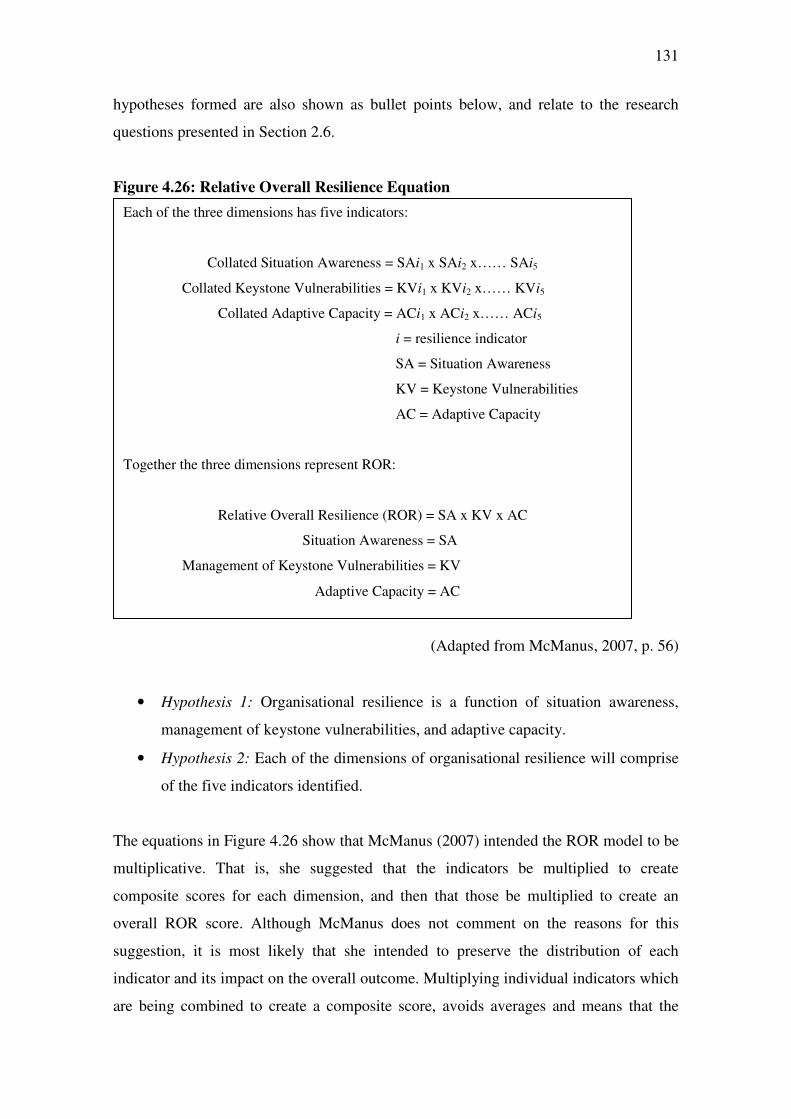
131
hypotheses formed are also shown as bullet points below, and relate to the research
questions presented in Section 2.6.
Figure 4.26: Relative Overall Resilience Equation
(Adapted from McManus, 2007, p. 56)
• Hypothesis 1: Organisational resilience is a function of situation awareness,
management of keystone vulnerabilities, and adaptive capacity.
• Hypothesis 2: Each of the dimensions of organisational resilience will comprise
of the five indicators identified.
The equations in Figure 4.26 show that McManus (2007) intended the ROR model to be
multiplicative. That is, she suggested that the indicators be multiplied to create
composite scores for each dimension, and then that those be multiplied to create an
overall ROR score. Although McManus does not comment on the reasons for this
suggestion, it is most likely that she intended to preserve the distribution of each
indicator and its impact on the overall outcome. Multiplying individual indicators which
are being combined to create a composite score, avoids averages and means that the
Each of the three dimensions has five indicators:
Collated Situation Awareness = SAi1 x SAi2 x…… SAi5
Collated Keystone Vulnerabilities = KVi1 x KVi2 x…… KVi5
Collated Adaptive Capacity = ACi1 x ACi2 x…… ACi5
i = resilience indicator
SA = Situation Awareness
KV = Keystone Vulnerabilities
AC = Adaptive Capacity
Together the three dimensions represent ROR:
Relative Overall Resilience (ROR) = SA x KV x AC
Situation Awareness = SA
Management of Keystone Vulnerabilities = KV
Adaptive Capacity = AC
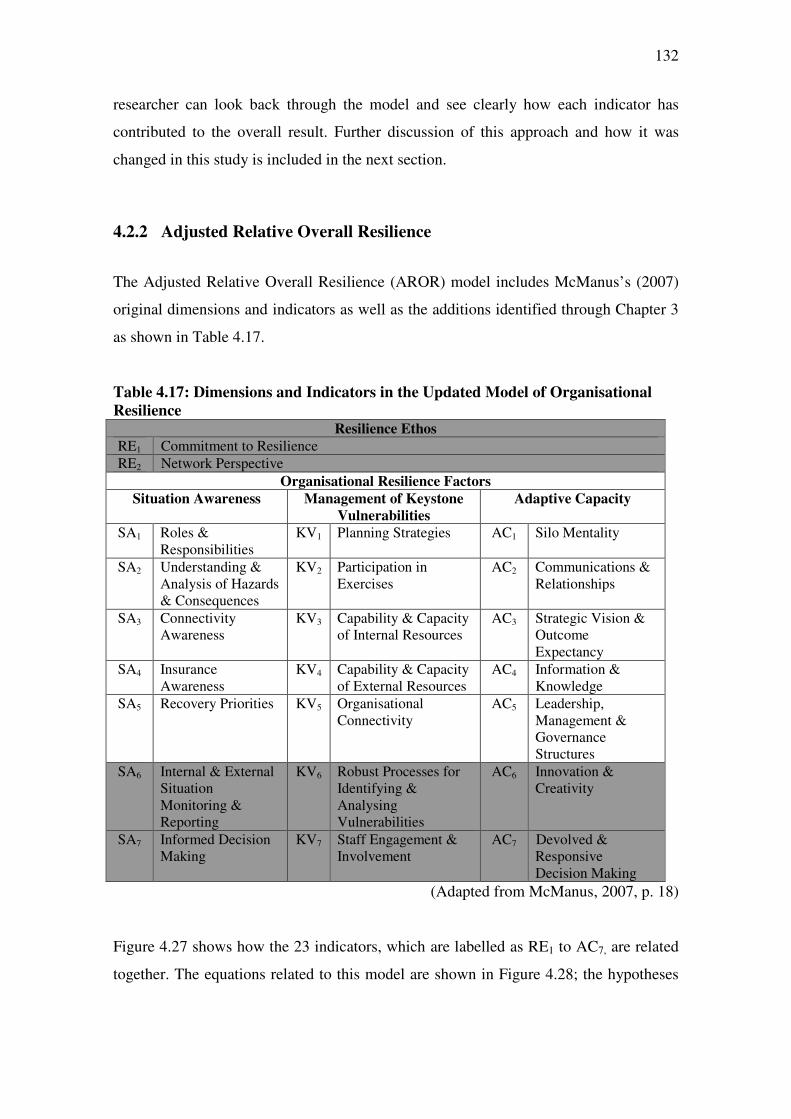
132
researcher can look back through the model and see clearly how each indicator has
contributed to the overall result. Further discussion of this approach and how it was
changed in this study is included in the next section.
4.2.2 Adjusted Relative Overall Resilience
The Adjusted Relative Overall Resilience (AROR) model includes McManus’s (2007)
original dimensions and indicators as well as the additions identified through Chapter 3
as shown in Table 4.17.
Table 4.17: Dimensions and Indicators in the Updated Model of Organisational
Resilience Resilience Ethos
RE1 Commitment to Resilience
RE2 Network Perspective
Organisational Resilience Factors
Situation Awareness Management of Keystone
Vulnerabilities
Adaptive Capacity
SA1 Roles & Responsibilities
KV1 Planning Strategies AC1 Silo Mentality
SA2 Understanding & Analysis of Hazards & Consequences
KV2 Participation in Exercises
AC2 Communications & Relationships
SA3 Connectivity Awareness
KV3 Capability & Capacity of Internal Resources
AC3 Strategic Vision & Outcome Expectancy
SA4 Insurance Awareness
KV4 Capability & Capacity of External Resources
AC4 Information & Knowledge
SA5 Recovery Priorities KV5 Organisational Connectivity
AC5 Leadership, Management & Governance Structures
SA6 Internal & External Situation Monitoring & Reporting
KV6 Robust Processes for Identifying & Analysing Vulnerabilities
AC6 Innovation & Creativity
SA7 Informed Decision Making
KV7 Staff Engagement & Involvement
AC7 Devolved & Responsive Decision Making
(Adapted from McManus, 2007, p. 18)
Figure 4.27 shows how the 23 indicators, which are labelled as RE1 to AC7, are related
together. The equations related to this model are shown in Figure 4.28; the hypotheses
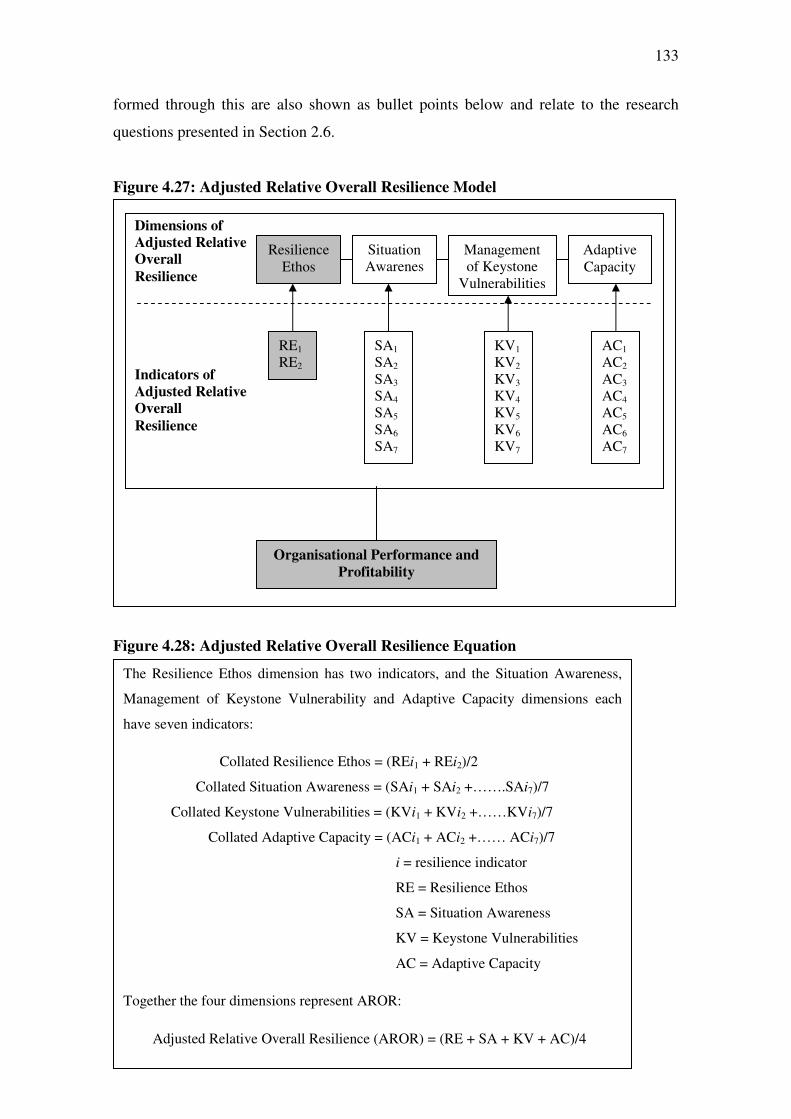
133
formed through this are also shown as bullet points below and relate to the research
questions presented in Section 2.6.
Figure 4.27: Adjusted Relative Overall Resilience Model
Figure 4.28: Adjusted Relative Overall Resilience Equation
The Resilience Ethos dimension has two indicators, and the Situation Awareness,
Management of Keystone Vulnerability and Adaptive Capacity dimensions each
have seven indicators:
Collated Resilience Ethos = (REi1 + REi2)/2
Collated Situation Awareness = (SAi1 + SAi2 +…….SAi7)/7
Collated Keystone Vulnerabilities = (KVi1 + KVi2 +……KVi7)/7
Collated Adaptive Capacity = (ACi1 + ACi2 +…… ACi7)/7
i = resilience indicator
RE = Resilience Ethos
SA = Situation Awareness
KV = Keystone Vulnerabilities
AC = Adaptive Capacity
Together the four dimensions represent AROR:
Adjusted Relative Overall Resilience (AROR) = (RE + SA + KV + AC)/4
Organisational Performance and
Profitability
Dimensions of
Adjusted Relative
Overall
Resilience
Indicators of
Adjusted Relative
Overall
Resilience
Situation Awarenes
s
Management of Keystone
Vulnerabilities
Adaptive Capacity
Resilience Ethos
SA1
SA2
SA3
SA4
SA5
SA6
SA7
KV1
KV2
KV3
KV4
KV5
KV6
KV7
AC1
AC2
AC3
AC4
AC5
AC6
AC7
RE1
RE2
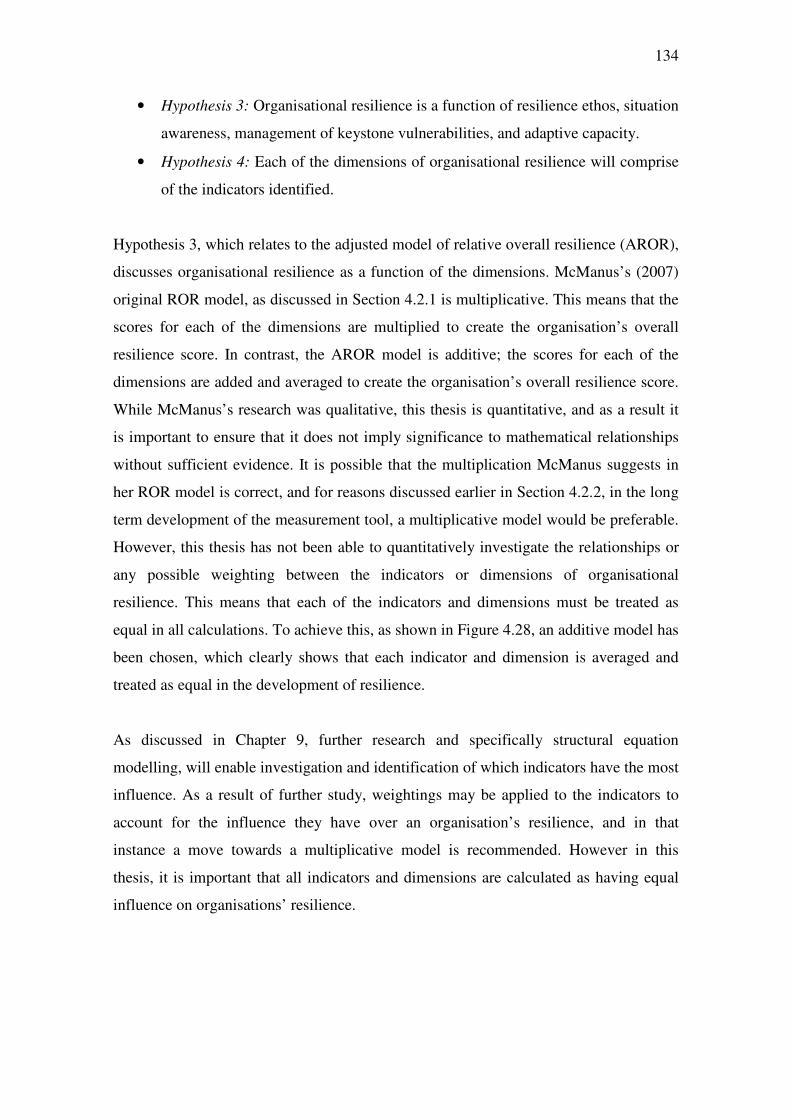
134
• Hypothesis 3: Organisational resilience is a function of resilience ethos, situation
awareness, management of keystone vulnerabilities, and adaptive capacity.
• Hypothesis 4: Each of the dimensions of organisational resilience will comprise
of the indicators identified.
Hypothesis 3, which relates to the adjusted model of relative overall resilience (AROR),
discusses organisational resilience as a function of the dimensions. McManus’s (2007)
original ROR model, as discussed in Section 4.2.1 is multiplicative. This means that the
scores for each of the dimensions are multiplied to create the organisation’s overall
resilience score. In contrast, the AROR model is additive; the scores for each of the
dimensions are added and averaged to create the organisation’s overall resilience score.
While McManus’s research was qualitative, this thesis is quantitative, and as a result it
is important to ensure that it does not imply significance to mathematical relationships
without sufficient evidence. It is possible that the multiplication McManus suggests in
her ROR model is correct, and for reasons discussed earlier in Section 4.2.2, in the long
term development of the measurement tool, a multiplicative model would be preferable.
However, this thesis has not been able to quantitatively investigate the relationships or
any possible weighting between the indicators or dimensions of organisational
resilience. This means that each of the indicators and dimensions must be treated as
equal in all calculations. To achieve this, as shown in Figure 4.28, an additive model has
been chosen, which clearly shows that each indicator and dimension is averaged and
treated as equal in the development of resilience.
As discussed in Chapter 9, further research and specifically structural equation
modelling, will enable investigation and identification of which indicators have the most
influence. As a result of further study, weightings may be applied to the indicators to
account for the influence they have over an organisation’s resilience, and in that
instance a move towards a multiplicative model is recommended. However in this
thesis, it is important that all indicators and dimensions are calculated as having equal
influence on organisations’ resilience.
135
4.2.3 Additional Hypotheses
This section presents additional hypotheses, that are not specifically related to the above
models, but that will be tested though this thesis. These hypotheses address existing
questions within the literature, which can be addressed through the data gathered for this
research.
Each hypothesis will be posed as a null hypothesis; a negative statement of the
relationship between two variables, which the thesis will look to disprove or reject.
Organisational Size
Mitroff et al. (1989) discuss reasons and excuses that organisations use for their lack of
crisis management planning, which they refer to as faulty assumptions and beliefs.
According to Mitroff et al. (1989) some organisations argue that their large size will
protect them from the effects of crisis. This could be attributed to a variety of reasons
including; larger organisations have more resources which enables their response, larger
organisations are more likely to have larger cash reserves, and larger organisations are
more complex systems that require management of interdependencies and risks to
remain competitive, and this has positive effects on their resilience. Fowler et al. (2007)
assess perceived organisational preparedness using a 21-item scale and include a
hypothesis which argues that organisations employing more staff will have a high
perception of their preparedness. However, this hypothesis was only partially supported;
they found that the relationship between organisation size (number of employees) and
perceived preparedness was only significant with organisations that employ 500 or more
employees. This indicates that smaller organisations are generally less prepared.
In contrast, Sheaffer and Mano-Negrin (2003, p. 583) identify several characteristics
which they argue make large organisations more predisposed to crisis. These therefore
support investigation into the link between organisation size and resilience and include:
• A tendency to constantly reorganise and restructure making the organisation
more susceptible to resistance to change
• Negative connotations attached to risk-taking and openness which in turn
discourage innovation and creativity
136
• An inherent complexity which inhibits information processing
• A high likelihood of illegal behaviour
• Null Hypothesis 5: Larger organisations will not achieve higher resilience
scores.
The Value of Plans
Practitioners and academics vary in the value that they ascribe to emergency or crisis
plans. Many authors emphasise the importance of developing plans (Fowler, et al.,
2007). However many also argue that the value of plans is not in the documents
themselves, but in the learning gained through the planning process (Crichton, et al.,
2009). This is also evidenced by Dawes (2004) who notes how planning completed for
the Y2K challenge helped organisations to recover their data following the September
11th attacks in 2001. The Business Continuity Institute (BCI) in the UK (2010, p. 4) note
that, in their survey of business continuity practitioners, 25% said that their organisation
was able to recover from a disruption more quickly as a result of their plan. In her study
of disaster preparedness at Boeing, Castillo (2004) acknowledges the important role
played by well developed plans in organisations’ temporary relocation and long term
recovery following the September 11th terrorist attacks. Discussing business continuity
planning at the time of Hurricane Andrew in 1992, Cerullo and Cerullo (2004, p. 70)
draw on FEMA data and note that of those organisations lacking a business continuity
plan, 80% failed within 2 years of the storm.
In contrast to the positive view of plans, Clarke (1999) argues that plans are fantasy
documents, and Boin and McConnell (2007, p. 53) argue that “…they signal a state of
preparedness that bears little relevance to the challenges that emerge with a crisis”.
Crichton et al. (2009) also suggest that despite developing plans, organisations should
avoid overly rigid response arrangements because flexibility and adaptability are critical
to the response.
• Null Hypothesis 6: Organisations that have a plan will not be more resilient.
137
Crisis Experience and Resilience
Carmeli and Schaubroeck (2008) argue that although crises can cause organisations to
fail, they also present an opportunity for organisations to innovate, restructure and
redefine their performance. Seeing experience of crises as a potential positive for
organisations, they surveyed 106 executives to investigate whether an organisation’s
experience of crisis had a positive impact on their preparedness. Despite indications
found within the literature, Carmeli and Schaubroeck’s (2008) results show no
significant relationship between crisis experience and organisational preparedness.
Hurley-Hanson (2006, p. 489) investigated whether organisations had increased their
crisis planning in response to the September 11th terrorist attacks. She found that, prior
to the attacks, 53% of New York firms surveyed believed that their companies had
identified available resources to meet the costs associated with the safety and security of
their employees. After the attacks this percentage decreased to 30%.
In contrast when studying long term business recovery from the Loma Prieta earthquake
and hurricane Andrew, Webb et al. (2002, p. 47) found that “Previous disaster
experience also appears to be associated with higher levels of preparedness among
business”. Pearson and Mitroff (1993) develop a typology of crisis based on four
quadrants which encompass technical/economic, and human/social crises along one axis
and a continuum from normal to severe on the other. Using this typology as a basis, they
found that organisations were better prepared for a crisis if they had previously
experienced another crisis of the same type.
Given that these studies have focused on preparedness, the issue will be investigated
again here in the context of resilience. Resilience is a much more chaotic, emergent and
adaptive phenomenon than preparedness, and so might have a stronger relationship with
situations that force organisations to confront their weaknesses and to rapidly adapt new
behaviours.
• Null Hypothesis 7: Organisations that have experienced a crisis and survived
will not be more resilient.
138
The Role of Exercises in Resilience
Alexander (2000) discusses the use of scenario methodologies, including emergency
exercises, for teaching the principles of emergency management. He argues that
exercises are useful for training emergency responders, testing students, and illustrating
the limitations of current planning assumptions. T’Hart (1997) notes that exercises can
enable organisations to test and validate plans, translate plans into organisational
knowledge, and increase the range of responses available. However he also explains that
exercise planners often fall into the trap of developing perfect exercises which do not
adequately reflect the organisation’s policy environment, provide a challenge and
opportunity to learn, or align with the organisation’s goals and needs. Borodzicz and
van Haperen (2002) argue that in some crisis simulations, the facilitators and designers
learn more than the players. They go on to suggest that players’ learning is significantly
increased if they are involved in the design and facilitation of the exercise.
The models being tested through this thesis already include an indicator which measures
organisations’ participation in exercises. However hypothesis 8, shown below, will test
whether there is a direct correlation between participation in exercises and
organisations’ resilience as opposed to participation in exercises as part of the
management of keystone vulnerabilities dimension of organisational resilience.
• Null Hypothesis 8: Organisations that achieve a higher score for the participation
in exercises indicator will not achieve a higher resilience score.
Organisational Resilience and Organisational Performance
The assumption is that organisations who achieve high scores for indicators of
profitability and organisational performance will also achieve high scores for
organisational resilience. Mitroff et al. (1989, p. 280) make this link when they argue
that crisis management skills,
“…are also the very same set of skills that are needed to gain a
competitive advantage…those organisations which are not prepared to
handle crises well are not prepared to perform well those activities which
are now critical to success”.
139
Starr et al. (2003b, p. 3) also make the link between competitive advantage and
resilience arguing that resilient organisations can “…create advantages over less
adaptive competitors”. Starr et al. (2003b) also go further and link earnings consistency
and shareholder value to organisations’ ability to prepare and respond effectively to
increasing levels and complexity of risk. Casey and Bartczak (1985) provide a link
between resilience and business-as-usual success and suggest that cash flow and an
organisation’s ability to withstand adverse changes in its operating environment are
closely linked.
• Null Hypothesis 9: Organisations achieving a high resilience score will not
achieve a high score for indicators of organisational performance.
4.3 Survey Administration and Approaching Organisations
Data collection through the web-based resilience measurement tool took nine months
(March-November 2009). However this was not due to technical problems with the
survey or the hosting service, but with the difficulty of getting sample organisations to
take part. Rogelberg and Stanton (2007, p. 195) identify five ways in which non-
response can affect survey research, it:
• Can cause smaller samples resulting in reduced statistical power;
• increase the size of confidence intervals;
• limit the types of statistical techniques that can be used;
• undermine the perceived credibility of the data; and
• undermine the generalisability of the data.
To address this, Simsek and Veiga (2000, p. 102) suggest ways in which non-response
to electronic surveys can be reduced. Each of these suggestions were used in this
research, they include:
• Check the e-mail address for accuracy – researchers telephoned each
organisation to check email addresses.
140
• Check for temporary local and non-local system wide email problems – where
emails were not delivered researchers were able to direct organisations to add
our email address the their accepted list to prevent emails being sent into SPAM
boxes. No other email problems were found.
• Use prior email notification – introduction letters were sent.
• Attempt to convince the respondent of the value of the research and his or her
participation – the introduction letters and the booklet that were sent to sample
organisations included information on the value of the research and
participation.
• Ensure anonymity and confidentiality – participation was anonymous and
confidential and this was stated on the invitation letters and emails.
• Increase credibility through sponsorship manipulation – the Auckland Civil
Defence Emergency Management Group helped to fund and promote the
research.
• Offer some incentives such as gifts or money to motivate – participating
organisations were offered a full results report.
• Shorten the questionnaire when possible – the survey was kept as short as
possible during the development and participants automatically skipped
questions that were not relevant to either them or their organisation.
• Use an email follow-up – all participating organisations were emailed at least
twice during the follow-up.
Sample organisations, discussed in Section 4.1.4.2, were approached and invited to take
part in the research through a series of steps including two mail-outs and email invites
and a series of follow-up phone calls. The first mail-out was sent on 16th March 2009
and included the initial invitation letter which can be seen in Appendix B2. The purpose
of this was to provide organisations with advanced notice of the research so that when
they later saw emails about the research they already had an awareness of the topic and
an understanding of its value and how their participation would help. At the same time,
the research team worked with the Auckland Region Civil Defence Emergency
Management Group to produce a media release and a television interview was given.
One week after the first mail-out, organisations were sent an email inviting them to take
part in the research which included a link to the survey.
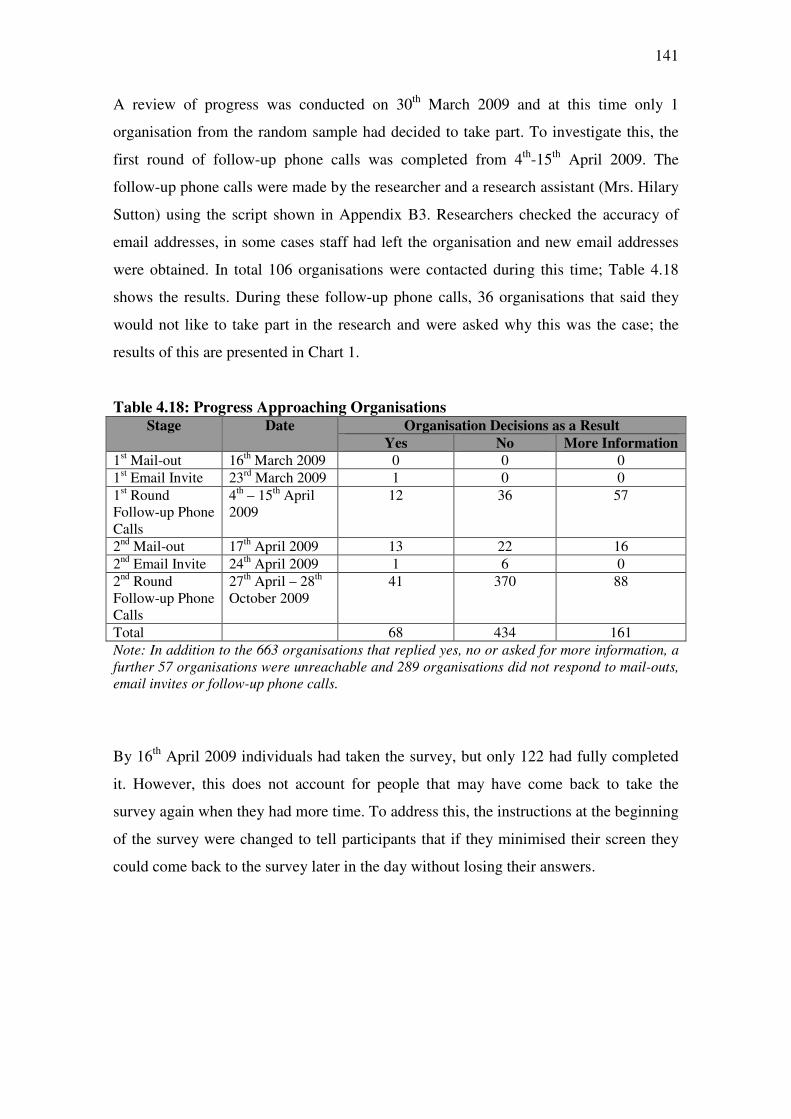
141
A review of progress was conducted on 30th March 2009 and at this time only 1
organisation from the random sample had decided to take part. To investigate this, the
first round of follow-up phone calls was completed from 4th-15th April 2009. The
follow-up phone calls were made by the researcher and a research assistant (Mrs. Hilary
Sutton) using the script shown in Appendix B3. Researchers checked the accuracy of
email addresses, in some cases staff had left the organisation and new email addresses
were obtained. In total 106 organisations were contacted during this time; Table 4.18
shows the results. During these follow-up phone calls, 36 organisations that said they
would not like to take part in the research and were asked why this was the case; the
results of this are presented in Chart 1.
Table 4.18: Progress Approaching Organisations Stage Date Organisation Decisions as a Result
Yes No More Information
1st Mail-out 16th March 2009 0 0 0
1st Email Invite 23rd March 2009 1 0 0
1st Round Follow-up Phone Calls
4th – 15th April 2009
12 36 57
2nd Mail-out 17th April 2009 13 22 16
2nd Email Invite 24th April 2009 1 6 0
2nd Round Follow-up Phone Calls
27th April – 28th October 2009
41 370 88
Total 68 434 161
Note: In addition to the 663 organisations that replied yes, no or asked for more information, a further 57 organisations were unreachable and 289 organisations did not respond to mail-outs, email invites or follow-up phone calls.
By 16th April 2009 individuals had taken the survey, but only 122 had fully completed
it. However, this does not account for people that may have come back to take the
survey again when they had more time. To address this, the instructions at the beginning
of the survey were changed to tell participants that if they minimised their screen they
could come back to the survey later in the day without losing their answers.
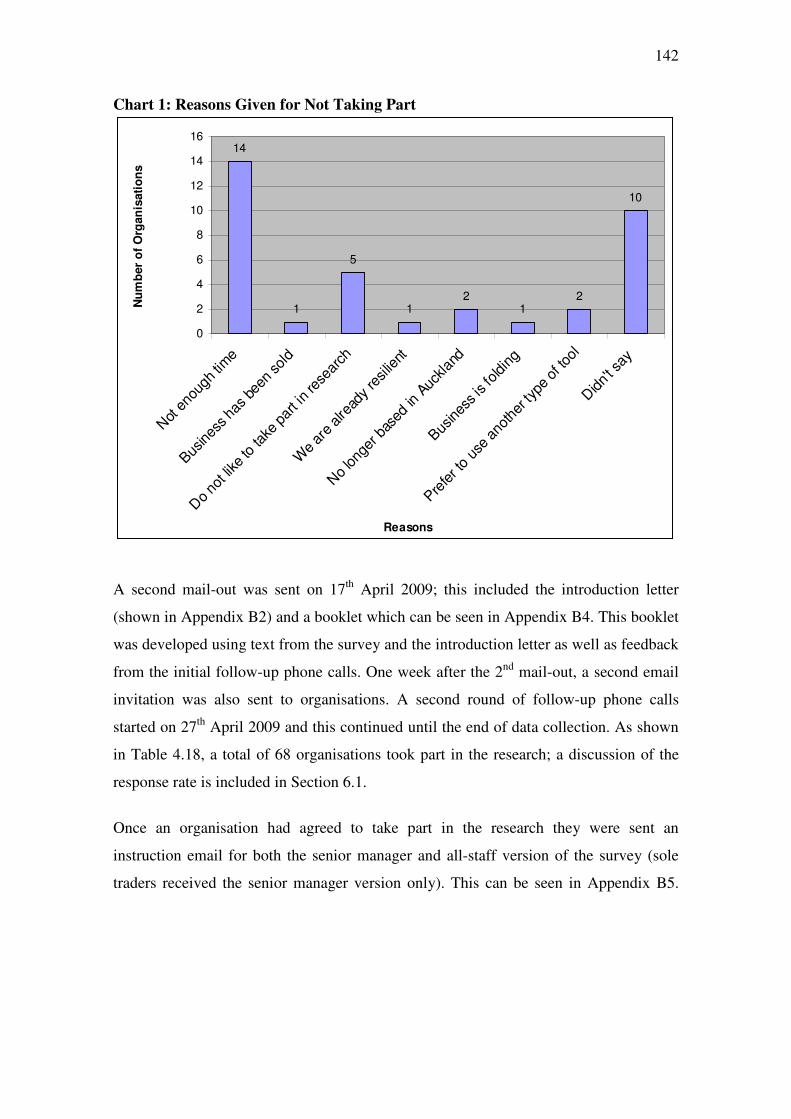
142
Chart 1: Reasons Given for Not Taking Part
14
1
5
12
12
10
0
2
4
6
8
10
12
14
16
Not
eno
ugh
time
Bus
ines
s ha
s be
en sol
d
Do
not like
to ta
ke p
art i
n re
sear
ch
We
are
alre
ady
resilie
nt
No
long
er b
ased
in A
ucklan
d
Bus
ines
s is fo
ldin
g
Pre
fer t
o us
e an
othe
r typ
e of
tool
Didn't s
ay
Reasons
Nu
mb
er
of
Org
an
isati
on
s
A second mail-out was sent on 17th April 2009; this included the introduction letter
(shown in Appendix B2) and a booklet which can be seen in Appendix B4. This booklet
was developed using text from the survey and the introduction letter as well as feedback
from the initial follow-up phone calls. One week after the 2nd mail-out, a second email
invitation was also sent to organisations. A second round of follow-up phone calls
started on 27th April 2009 and this continued until the end of data collection. As shown
in Table 4.18, a total of 68 organisations took part in the research; a discussion of the
response rate is included in Section 6.1.
Once an organisation had agreed to take part in the research they were sent an
instruction email for both the senior manager and all-staff version of the survey (sole
traders received the senior manager version only). This can be seen in Appendix B5.
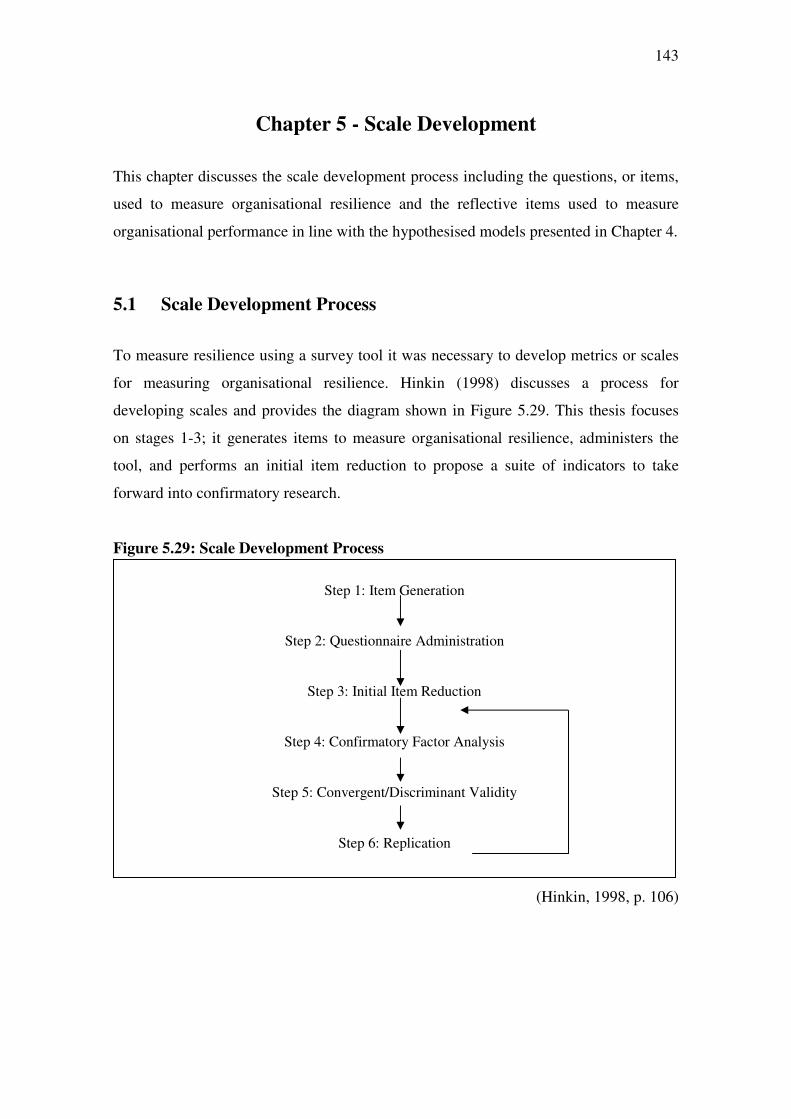
143
Chapter 5 - Scale Development
This chapter discusses the scale development process including the questions, or items,
used to measure organisational resilience and the reflective items used to measure
organisational performance in line with the hypothesised models presented in Chapter 4.
5.1 Scale Development Process
To measure resilience using a survey tool it was necessary to develop metrics or scales
for measuring organisational resilience. Hinkin (1998) discusses a process for
developing scales and provides the diagram shown in Figure 5.29. This thesis focuses
on stages 1-3; it generates items to measure organisational resilience, administers the
tool, and performs an initial item reduction to propose a suite of indicators to take
forward into confirmatory research.
Figure 5.29: Scale Development Process
(Hinkin, 1998, p. 106)
Step 1: Item Generation
Step 2: Questionnaire Administration
Step 3: Initial Item Reduction
Step 4: Confirmatory Factor Analysis
Step 5: Convergent/Discriminant Validity
Step 6: Replication
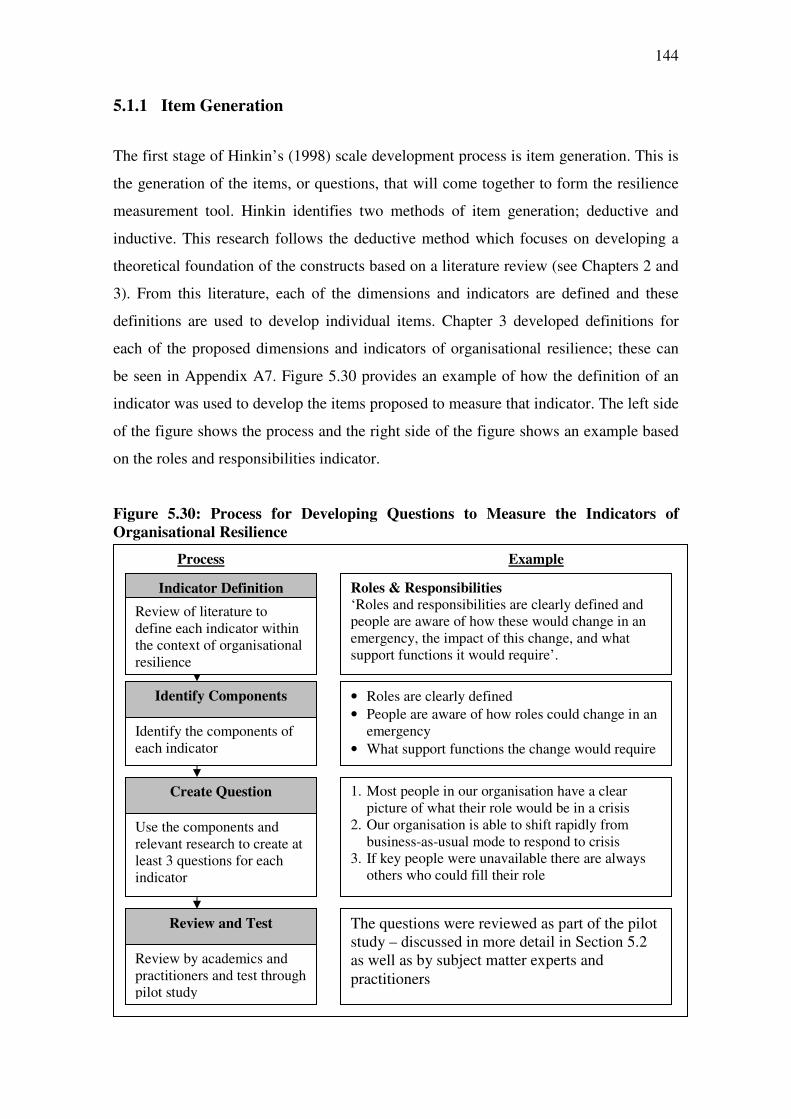
144
5.1.1 Item Generation
The first stage of Hinkin’s (1998) scale development process is item generation. This is
the generation of the items, or questions, that will come together to form the resilience
measurement tool. Hinkin identifies two methods of item generation; deductive and
inductive. This research follows the deductive method which focuses on developing a
theoretical foundation of the constructs based on a literature review (see Chapters 2 and
3). From this literature, each of the dimensions and indicators are defined and these
definitions are used to develop individual items. Chapter 3 developed definitions for
each of the proposed dimensions and indicators of organisational resilience; these can
be seen in Appendix A7. Figure 5.30 provides an example of how the definition of an
indicator was used to develop the items proposed to measure that indicator. The left side
of the figure shows the process and the right side of the figure shows an example based
on the roles and responsibilities indicator.
Figure 5.30: Process for Developing Questions to Measure the Indicators of
Organisational Resilience
Roles & Responsibilities ‘Roles and responsibilities are clearly defined and people are aware of how these would change in an emergency, the impact of this change, and what support functions it would require’.
• Roles are clearly defined
• People are aware of how roles could change in an emergency
• What support functions the change would require
1. Most people in our organisation have a clear picture of what their role would be in a crisis
2. Our organisation is able to shift rapidly from business-as-usual mode to respond to crisis
3. If key people were unavailable there are always others who could fill their role
The questions were reviewed as part of the pilot study – discussed in more detail in Section 5.2 as well as by subject matter experts and practitioners
Identify Components
Identify the components of each indicator
Create Question
Use the components and relevant research to create at least 3 questions for each indicator
Review and Test
Review by academics and practitioners and test through pilot study
Indicator Definition
Review of literature to define each indicator within the context of organisational resilience
Process Example
145
5.1.2 Item Development
This section discusses the generation of the original items that were included in the pilot
study survey. The pilot study is discussed in Section 5.2 which also presents any
changes or additions that were made to the survey items as a result of the pilot study
before the survey was used in the Auckland study.
In total, 73 items were generated, using the process outlined in Figure 5.30, to measure
the indicators of organisational resilience during the pilot study; 13 items were also
developed to measure demographic and background information. The resilience
measurement and demographic and background items can be seen in Appendix C1
which provides a copy of the survey used in the pilot study discussed in Section 5.2.
The majority of items developed for the tool are Likert scales where participants are
asked ‘To what extent do you agree or disagree with the following statements?’
Participants then rated the statements on a 5-point Likert Scale. Hinkin (1998, p. 110)
reviews the use of Likert Scale questions and notes that they are most often used in
survey research and that they are the most appropriate for research involving factor
analysis. The 5 points were marked as shown in the example in Appendix C2 and a
‘Don’t know’ option was also included. Other question types that were used, as
indicated in Appendix C1, include open questions and tick boxes.
5.1.3 Organisational Performance Items
As discussed in Section 4.2.3, hypothesis 8 proposes that organisations achieving a
higher level of resilience will also score more highly on organisational performance
items. This section presents that items that were used to measure organisational
performance during the pilot study. Following the pilot study a number of
organisational performance items were added to the tool; these are presented in Section
5.2.
Appiah and Abor (2009) focus on predicting corporate failure and suggest that there are
significant limitations to using a single ratio to predict the health or risk of failure of an
organisation; instead a combination of indicators should be used. Carton and Hofer
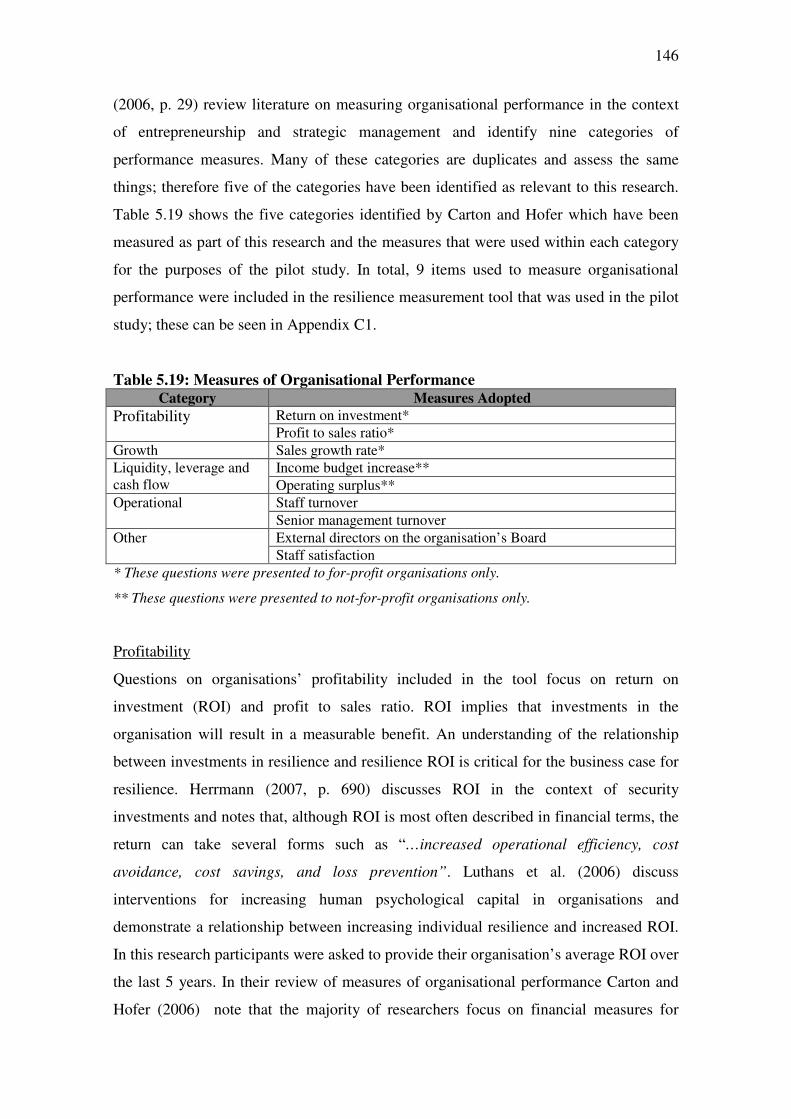
146
(2006, p. 29) review literature on measuring organisational performance in the context
of entrepreneurship and strategic management and identify nine categories of
performance measures. Many of these categories are duplicates and assess the same
things; therefore five of the categories have been identified as relevant to this research.
Table 5.19 shows the five categories identified by Carton and Hofer which have been
measured as part of this research and the measures that were used within each category
for the purposes of the pilot study. In total, 9 items used to measure organisational
performance were included in the resilience measurement tool that was used in the pilot
study; these can be seen in Appendix C1.
Table 5.19: Measures of Organisational Performance Category Measures Adopted
Profitability Return on investment*
Profit to sales ratio*
Growth Sales growth rate*
Liquidity, leverage and cash flow
Income budget increase**
Operating surplus**
Operational Staff turnover
Senior management turnover
Other External directors on the organisation’s Board
Staff satisfaction
* These questions were presented to for-profit organisations only.
** These questions were presented to not-for-profit organisations only.
Profitability
Questions on organisations’ profitability included in the tool focus on return on
investment (ROI) and profit to sales ratio. ROI implies that investments in the
organisation will result in a measurable benefit. An understanding of the relationship
between investments in resilience and resilience ROI is critical for the business case for
resilience. Herrmann (2007, p. 690) discusses ROI in the context of security
investments and notes that, although ROI is most often described in financial terms, the
return can take several forms such as “…increased operational efficiency, cost
avoidance, cost savings, and loss prevention”. Luthans et al. (2006) discuss
interventions for increasing human psychological capital in organisations and
demonstrate a relationship between increasing individual resilience and increased ROI.
In this research participants were asked to provide their organisation’s average ROI over
the last 5 years. In their review of measures of organisational performance Carton and
Hofer (2006) note that the majority of researchers focus on financial measures for
147
either 1 or 3 years. This was extended for this research to match the time horizon that
was expressed in relation to organisations’ crisis experience where we asked
participants whether their organisation had experienced a crisis in the last 5 years.
Sundström and Hollnagel (2006) suggest links between organisational resilience and
profit when they discuss profit as a key driver as organisational systems and argue that
increasing organisational resilience rests on understanding those systems. In contrast
Fletcher and Hilbert (Fletcher & Hilbert, 2007) focus on ecological modelling and argue
that, although initially profit and resilience may be positively correlated, there comes a
point when “…resilience decreases rapidly as maximum profit is approached”. Here
they express a trade-off between system resilience and profit. In the context of
organisations they add that managers need to be aware of the costs of different
management strategies so that they can better decide where to accept this trade-off. In
this research senior managers were asked to provide their organisation’s average annual
profit-to-sales ratio over the last 5 years. This is an assessment of how much profit the
organisation’s sales are making and directly affects their ability to maintain their
stakeholders’ interests.
Growth
Hamel and Välikangas (2003, p. 5) discuss the need for organisations to “…anticipate
the point at which a growth curve suddenly flattens out or a business model runs out of
steam”. Here they emphasise the importance of organisations being aware of changes in
their business environment which could either negatively affect their growth or provide
positive opportunities for growth. This provides evidence for a link between
organisational growth and resilience. Hill et al. (2008) include economic growth in their
discussion of the measurement of regional economic resilience. In this research senior
managers were asked to provide their organisation’s average annual sales growth rate
over the last 5 years.
Liquidity, leverage and cash flow
In this research senior managers of not-for-profit organisations were asked by how
much their organisation’s average annual income budget and income surplus has
increased each year over the least 5 years. An organisation’s average annual income is
148
important because it shows how much money they have available and indicates the
health of the organisation.
Operational
Reason et al. (2001) argue that high staff turnover is an early warning sign within
organisations. They discuss staff turnover in the context of a hospital and note that it
was not addressed because of the continuous drive for efficiency, however in the end,
“The high staff turnover reached such a magnitude that it precluded the
ability of the institution to reach both efficiency targets and to operate
safely”.
(Reason, et al., 2001, p. ii24)
In this thesis senior managers were asked to provide their organisation’s average annual
staff turnover and average annual senior management turnover for the last 5 years.
Other
Gales and Kesner (1994) argue that uncertainty and increased pressure from outside of
organisations encourages the appointment of outsiders to the board of directors (BOD).
They note that reasons for appointment of external directors include; providing outside
support, bringing in key skills or resources, and addressing poor performance. Gales and
Kesner (1994) discuss bankruptcy and define it as “…an acknowledgement of an
organisation’s inability to cope with its environment” and argue that “…conditions
forcing a firm into bankruptcy are indicative of an immediate crisis of survival” (Gales
& Kesner, 1994, p. 271). Posing bankruptcy as an organisational crisis, they go on to
investigate to role of boards of directors, and their structure, in bankruptcy.
Comparing data from 127 organisations that declared bankruptcy, against 127 similarly
matched organisations that did not declare bankruptcy Gales and Kesner (1994) find
that in the two years prior to declaring bankruptcy, the number of external directors on
boards was reduced significantly. While Gales and Kesner do not provide causality, this
does provide an indication of some relationships between bankruptcy and the
composition of boards of directors (Gales & Kesner, 1994). In this research senior
149
managers were asked whether their organisation had external directors on its governing
board. The assumption here is that organisations with more external directors on their
governing board will be more resilient.
The importance of environmental scanning or situation analysis was discussed in
Section 3.3.2. Matheus et al. (2003) argue that situation analysis (the process of
developing situation awareness) requires organisations to monitor the business
environment using mechanical and human sensors, and then use their connectivity
awareness to provide a context for the information to be interpreted. In this research
senior managers were asked whether their organisation has used a staff satisfaction
survey within the last 2 years, and if so to give a description of their score. This
provides information on whether the organisation scans it internal environment, and is
also significantly related to staff turnover (Mobley, 1977). Staff satisfaction can also
provide an early warning of crises such as strike action (Ng, 1991) and (Seashore &
Taber, 1975).
5.2 Pilot Study
This section discusses the pilot study that was part of the development of the items and
the resilience measurement tool. It describes the purpose, sample, methods and
administration of the resilience measurement tool during the pilot study. The results of
the pilot study are presented and any changes made to the tool as a result are discussed.
The final version of the resilience measurement tool that was administered in the
Auckland study is presented in Section 5.2.7.
The purpose of the pilot study was to test the usability and face validity of the survey
tool, and to identify any technical issues with the SurveyMonkey platform. The term
face validity refers to whether an evaluator or expert judges that a measurement
instrument measures what it has been developed to measure, based on their knowledge
and without the use of statistical analysis (McDavid & Hawthorn, 2006).
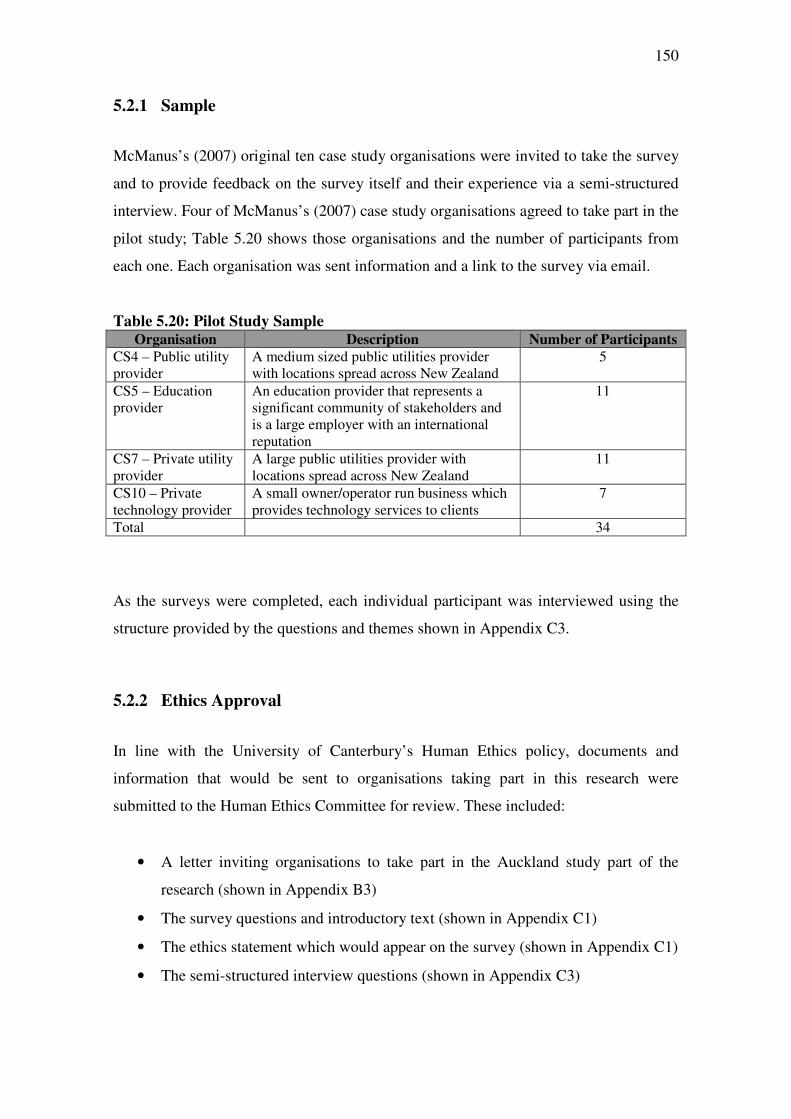
150
5.2.1 Sample
McManus’s (2007) original ten case study organisations were invited to take the survey
and to provide feedback on the survey itself and their experience via a semi-structured
interview. Four of McManus’s (2007) case study organisations agreed to take part in the
pilot study; Table 5.20 shows those organisations and the number of participants from
each one. Each organisation was sent information and a link to the survey via email.
Table 5.20: Pilot Study Sample Organisation Description Number of Participants
CS4 – Public utility provider
A medium sized public utilities provider with locations spread across New Zealand
5
CS5 – Education provider
An education provider that represents a significant community of stakeholders and is a large employer with an international reputation
11
CS7 – Private utility provider
A large public utilities provider with locations spread across New Zealand
11
CS10 – Private technology provider
A small owner/operator run business which provides technology services to clients
7
Total 34
As the surveys were completed, each individual participant was interviewed using the
structure provided by the questions and themes shown in Appendix C3.
5.2.2 Ethics Approval
In line with the University of Canterbury’s Human Ethics policy, documents and
information that would be sent to organisations taking part in this research were
submitted to the Human Ethics Committee for review. These included:
• A letter inviting organisations to take part in the Auckland study part of the
research (shown in Appendix B3)
• The survey questions and introductory text (shown in Appendix C1)
• The ethics statement which would appear on the survey (shown in Appendix C1)
• The semi-structured interview questions (shown in Appendix C3)
151
The Human Ethics Committee reviewed these and approval was given on 11th
November 2008 and no changes were required.
5.2.3 Building a Resilience Measurement Tool
The resilience measurement tool was created using an online hosting service provided
by www.surveymonkey.com. Appendix C4 provides a screenshot which shows some of
the features that were used to create the tool. These include:
• Progress bar – this indicates the percentage of the tool that is completed.
• Question number – this provides a reference for anyone with technical problems
or queries about a question.
• Logos – the Resilient Organisations Research Program, Auckland Civil Defence
Emergency Management, and University of Canterbury logos were used on the
survey.
• Colour scheme – Survey Monkey enables the use of a colour scheme which was
chosen to match the Resilient Organisations branding as well as define different
areas of the screen.
• Skip logic – Although this is not visible to participants, skip logic enables the
research to specify that, for example, the answer to question (a) determines
whether question (b) will be displayed.
Appendix C4 also shows other types of questions used within the survey.
5.2.4 Interviews
Each of the 34 participants that took part in the pilot study on behalf of the 4
organisations was interviewed using a semi-structured interview; this methodology is
discussed in Section 4.1.3. Each interview was guided by the questions shown in
Appendix C3, which address the following issues:
• Accessing the survey
152
• Survey introduction and ethics statement
• Survey questions
• Format and layout
Accessing the Survey
The first group of interview questions asked participants whether they understood the
instructions in the link email or whether they had any technical problems accessing the
survey. One participant, a member of CS5, commented that it might have been useful to
know how quickly they were supposed to respond to the survey. As a result the link
email sent to participants was amended to ask them to complete within two weeks.
Survey Introduction and Ethics Statement
The second group of interview questions asked participants whether the survey
introduction itself was clear, and whether they understood the purpose of the research
and what would happen to their data. One participant was confused about the
confidentiality of the research. The survey introduction stated that the pilot study was
confidential but not anonymous (to enable researchers to conduct the interviews); the
researcher contacted this participant and provided clarification of confidentiality and
anonymity.
Survey Questions
The third group of interview questions asked participants for feedback on the survey
items themselves. Some participants in CS5, the large education provider, said that they
struggled with some of the items which were more appropriate for commercial
organisations and that they had to select ‘neither agree or disagree’ which was the
middle point in the scale when they didn’t know an answer. As previously discussed a
‘Don’t know’ option was provided for each item however several participants didn’t
remember seeing it on the survey. To address this, a sentence was added to the survey
instructions to highlight that a ‘Don’t know’ option would always be available. Some
CS5 staff were also unsure of whether to answer the survey based on the resilience of
their whole organisation or just their department. Within CS5 the various departments
often act independently, however they were instructed to answer on behalf of their
organisation as a whole and clarification of this was added to the instructions.
153
This group of questions also addressed the face validity of the items and asked
participants whether they felt the survey questions were relevant to their organisation’s
resilience. All participants agreed that the items were relevant and two participants
suggested items which might be added. These included more operational questions
about emergency plans and IT back-up, and being able to replace key staff that were
unavailable during a crisis. In response to this, the following four questions were added
to the survey:
1. Does your organisation have a formal written crisis/emergency or business
continuity plan?
2. Is your organisation’s formal written crisis/emergency or business continuity
plan of a sufficient standard to be useful in an emergency?
3. If key people were unavailable there are always others who could fill their role
(question answered using a Likert scale)
4. Does your organisation have back-up IT facilities? (added to the senior manager
version only)
Format and Layout
The fourth group of interview questions asked participants whether the format and
layout of the survey was clear and easy to use. Two participants did not notice the
progress bar that was placed at the top of the screen so a sentence was added to the
instructions to highlight it. All participants that did notice the progress bar found it
useful and none of the participants identified problems with fonts or spacing.
5.2.5 Results of the Pilot Study
This section gives an overview of the results of the pilot study organisations (collected
in 2009) and compares them against their results in McManus’s (2007) study (collected
in 2005-2006). McManus (2007) ranked the case study organisations from the most to
the least resilience to provide a more grounded picture of how resilient they were. Table
5.21 shows a comparison of the rank of the four organisations that took part in this
research in McManus’s (2007) study compared with their rank generated through this
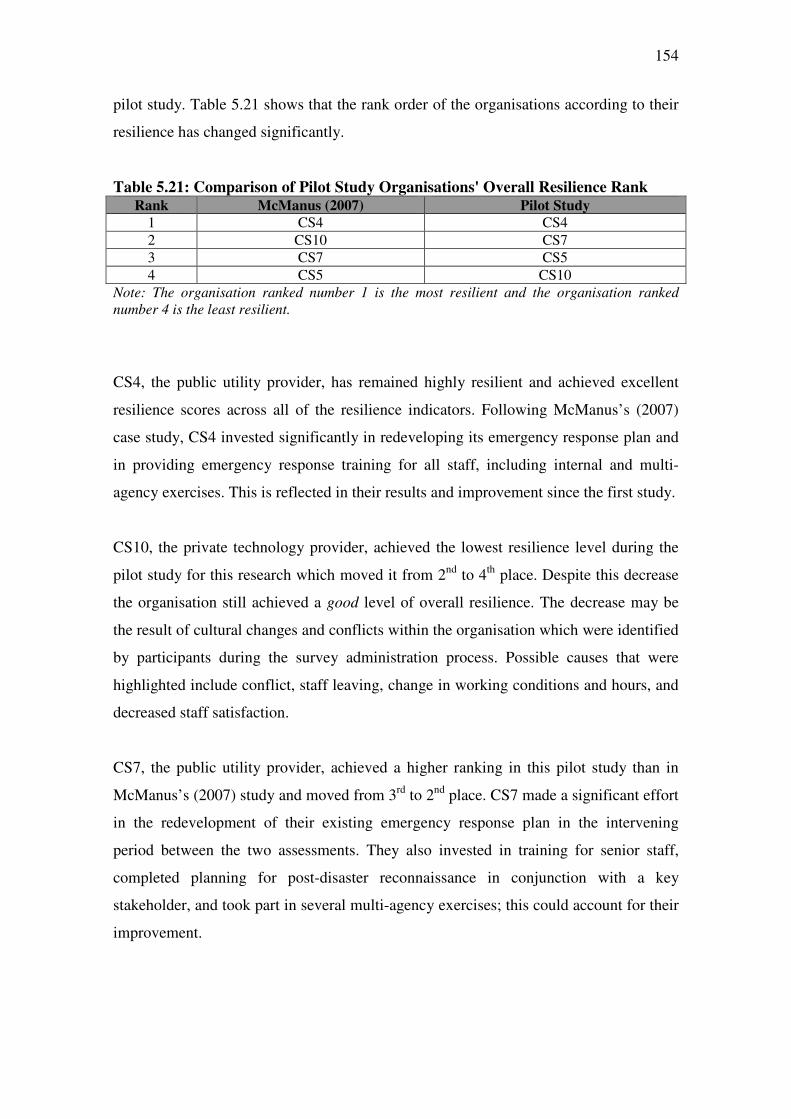
154
pilot study. Table 5.21 shows that the rank order of the organisations according to their
resilience has changed significantly.
Table 5.21: Comparison of Pilot Study Organisations' Overall Resilience Rank
Rank McManus (2007) Pilot Study
1 CS4 CS4
2 CS10 CS7
3 CS7 CS5
4 CS5 CS10
Note: The organisation ranked number 1 is the most resilient and the organisation ranked number 4 is the least resilient.
CS4, the public utility provider, has remained highly resilient and achieved excellent
resilience scores across all of the resilience indicators. Following McManus’s (2007)
case study, CS4 invested significantly in redeveloping its emergency response plan and
in providing emergency response training for all staff, including internal and multi-
agency exercises. This is reflected in their results and improvement since the first study.
CS10, the private technology provider, achieved the lowest resilience level during the
pilot study for this research which moved it from 2nd to 4th place. Despite this decrease
the organisation still achieved a good level of overall resilience. The decrease may be
the result of cultural changes and conflicts within the organisation which were identified
by participants during the survey administration process. Possible causes that were
highlighted include conflict, staff leaving, change in working conditions and hours, and
decreased staff satisfaction.
CS7, the public utility provider, achieved a higher ranking in this pilot study than in
McManus’s (2007) study and moved from 3rd to 2nd place. CS7 made a significant effort
in the redevelopment of their existing emergency response plan in the intervening
period between the two assessments. They also invested in training for senior staff,
completed planning for post-disaster reconnaissance in conjunction with a key
stakeholder, and took part in several multi-agency exercises; this could account for their
improvement.
155
CS5, the education provider, achieved a higher ranking in this pilot study than in
McManus’s (2007) study and moved from 4th to 3rd place. This is likely to be the result
of considerable work that has gone into planning and emergency management
coordination across the organisation. This has included reviewing and formalising the
organisation’s emergency planning arrangements, validating plans and practicing their
response during multi-agency emergency exercises, and establishing an organisation-
wide crisis management and crisis communications structure.
5.2.6 Pilot Study Conclusions
The purpose of the pilot study was to test the usability and face validity of the survey
tool, and to identify any technical issues with the SurveyMonkey platform. Feedback
from the semi-structured interviews was also used to amend the introduction and
instructions of the survey. Changes made to the survey items as a result of the pilot
study are presented in Section 2.5.7.
The interviews highlighted that many participants would most likely not read the
introduction or the instructions. To improve this, the introduction and instructions were
reviewed to make them as simple and short as possible. This should improve the
usability and face validity of the survey.
Throughout the use of the survey, the SurveyMonkey platform performed well and none
of the participants identified any usability issues.
The results of the pilot study organisations (discussed in Section 5.2.5) indicate that the
tool is sensitive enough to pick up changes in an organisation’s resilience over time. It is
possible that changes in resilience identified by the tool are a result of measurement
error or methodological differences. However the differences in resilience identified
through the pilot study reflect the work done by the organisations to improve their
resilience in the time between the two studies. The sensitivity and accuracy of the tool
will require more investigation once the tool is fully developed.
156
5.2.7 Changes Made to the Resilience Measurement Tool after the Pilot
Study
This section discusses changes made to the items in the resilience measurement tool
following the pilot study. The survey, as it was administered to organisations during the
Auckland study which is presented in Chapters 6 and 7, is shown in Appendix C5. This
can be compared with the version that was administered during the pilot study which is
shown in Appendix C1.
5.2.7.1 Changes to Demographic Items
Department or Business Unit
As a result of the pilot study, an item asking participants which department or business
unit they belonged to was added to the demographic section of the survey. The purpose
of this was to provide another way to identify individual participants who might want to
remove their data from the project. Although this didn’t occur during the pilot study the
issue of removing data was discussed and it was decided that, given that the survey is
anonymous, the inclusion of the participants department would help to find the data that
needed to be removed.
Industry Sector
After the pilot study, the item relating to the organisation’s industry sector was
removed. Researchers felt that participants from large or distributed organisations might
answer this differently which may create problems during the analysis (where one
organisation was assigned to more than one industry sector). Instead organisations were
categorised into industry sectors based on their categorisation in the Veda Advantage
database which was the sampling frame for this thesis as discussed in Section 4.1.4.1.
Organisation Type
The organisation type item was moved from the demographics section to the reflective
section of the survey. Researchers decided to do this because the question only needed
to be answered once for each organisation, however it is still counted as a demographic
question. Organisation type was not analysed as an indicator of organisational
157
performance in relation to resilience. The purpose of including this question was to
enable future analysis of organisations’ resilience by organisation type.
Number of Sites of Locations
The number of sites or locations item was moved from the demographics section to the
reflective section of the survey. Senior managers were asked how many sites or
locations their organisation has. This was included as an estimation of organisations’
possible network of external resources and support and relates to questions of
organisational size.
5.2.7.2 Changes to Reflective Organisational Performance Items
Organisation Size
The number of staff (organisation size) was included as potential reflective measure of
organisational performance in relation to resilience. Carton and Hofer (2006) note that
organisational size has not been found to be predictive of business failure. Despite this it
has been included in this study to enable comparisons of results by organisation size and
also to investigate whether size has an impact in relation to resilience. This is addressed
through hypothesis 5 discussed in Section 4.2.3.
Senior Manager Turnover
The question asking about senior manager turnover was taken out because researchers
felt that smaller organisations may not be able to answer this question or it may not be
applicable.
Back-up IT Facilities
The importance of back-up IT facilities is emphasised through standards such as the
BS25999-1 business continuity standard (BSI, 2006) which suggests that organisations
have back-up facilities and arrangements as part of their information strategy. In this
research, senior managers were asked to describe the back-up IT facilities that their
organisation has.
158
Relocation
Webb et al. (2002) compare long term business recovery from the Loma Prieta
earthquake and Hurricane Andrew and identify making plans for relocation as a key
business preparedness action. Beunza and Stark (2004) discuss the relocation of 160
traders following the September 11th terrorist attacks and notes how the organisation’s
relocation was symbolic to its stakeholders. Although the traders did not have extensive
plans made in advance to enable relocation, they were able to use their adaptive
capacity to set up an operational trading room (albeit on a limited basis) within just six
days of the attack. A wide range of crises can trigger an organisation to relocate such as
flooding, earthquakes, social unrest, widespread infrastructure failure etc. In this
research senior managers were asked where they would relocate to if their
organisation’s building, site or location was inaccessible due to physical damage.
Cash Flow
Runyan (2006) interviewed a sample of small businesses following Hurricane Katrina
and identified vulnerability to cash flow interruption as one of the factors impeding the
speed of recovery. Casey and Bartczak (1985) also support this and suggest that cash
flow and an organisation’s ability to withstand adverse changes in its operating
environment are closely linked. Gittell et al. (2005) discuss airline industry responses to
the September 11th terrorist attacks and argue that both cash flow and debt levels play a
crucial role in organisations ability to respond effectively to crisis. In this research
senior managers were asked how they would rate their organisation’s cash flow from
excellent to very poor. Venkatraman and Ramanujam (1987) support the inclusion of
more subjective measures when they argue that perceptual measures are useful and use
managers perception of organisations’ performance relative to competitors in their
research.
Debt to Equity Ratio and Subjective Debt Rating
While debt in itself is not necessarily positive or negative in terms of organisations’
resilience, organisations’ ability to manage and service their debt is important to their
ability to operate. In this research senior managers were asked to provide their
organisation’s debt to equity ratio. If senior managers were unable to provide their
organisation’s debt to equity ratio, they were asked how they felt about their
organisation’s level of debt ranging from very positive to very negative.
159
5.2.7.3 Changes to the Survey Instrument
During the pilot study, participants answered the Likert style questions using a 5-point
scale. Following the pilot study, this was changed to a 4-point scale because it avoided
invalid use of the middle option, it forced participants to include some opinion, and the
researcher felt that the middle option did not significantly contribute to the sensitivity of
the tool.
Several participants in the pilot study noted that they ticked the middle option (neither
agree nor disagree) because they either didn’t see the ‘Don’t know’ option, or because
they assumed it was something that they should know, but didn’t. Given that the middle
option was likely to result in inaccurate and skewed data, and that its use was
ambiguous, the researcher decided to move to a 4-point scale. In addition, a sentence
was added to the survey instructions to clarify that not everyone answering the survey
would be able to answer all of the questions, and that they should use the ‘Don’t know’
option if appropriate. In normal survey practises, researchers would be wary of
presenting a question to participants that might not know the answer, but in the context
of resilience, what people don’t know can also add value and provide information on
whether or not resilience strategies are communicated, shared, and embedded in the
organisation.

160
161
Chapter 6 – Evaluating the Resilience Measurement Tool
This chapter presents the results and analysis, and evaluates the resilience measurement
tool. It includes an examination of the proposed indicators and models of organisational
resilience. The reliability of the tool is also discussed.
Bunderson et al. (2000, p. 374) suggest that the following analyses be conducted to
evaluate the psychometric properties of a proposed measurement tool:
a. An exploratory factor analysis to examine the factor structure of the instrument;
b. a confirmatory factor analysis to test the fit of the proposed measurement model
to the data and to further examine the factor structure;
c. an analysis of the generalisability of the measurement model across
organisational cultures and types; and
d. an analysis of relationships between these models and other constructs of
substantive interest to organisational researchers.
This research focuses on exploratory factor analysis to examine the factor structure of
the instrument. It represents the first stage of the development of a resilience
measurement tool. Chapter 9 discusses direction for future research, including
confirmatory analysis.
6.1 Sample and Response Rate
The sample for this research was 1009 organisations, of which 68 organisations (249
individuals) participated; this represents a response rate of 7%. Table 6.22 shows the
composition of participating organisations by industry sector. Organisations from 13
industry sectors participated and 3 industry sectors represented in the random sample
are not represented among participants. These are accommodation and food services,
electricity, gas and water services, and transport, postal and warehousing. Table 6.23
shows the composition by organisation size.
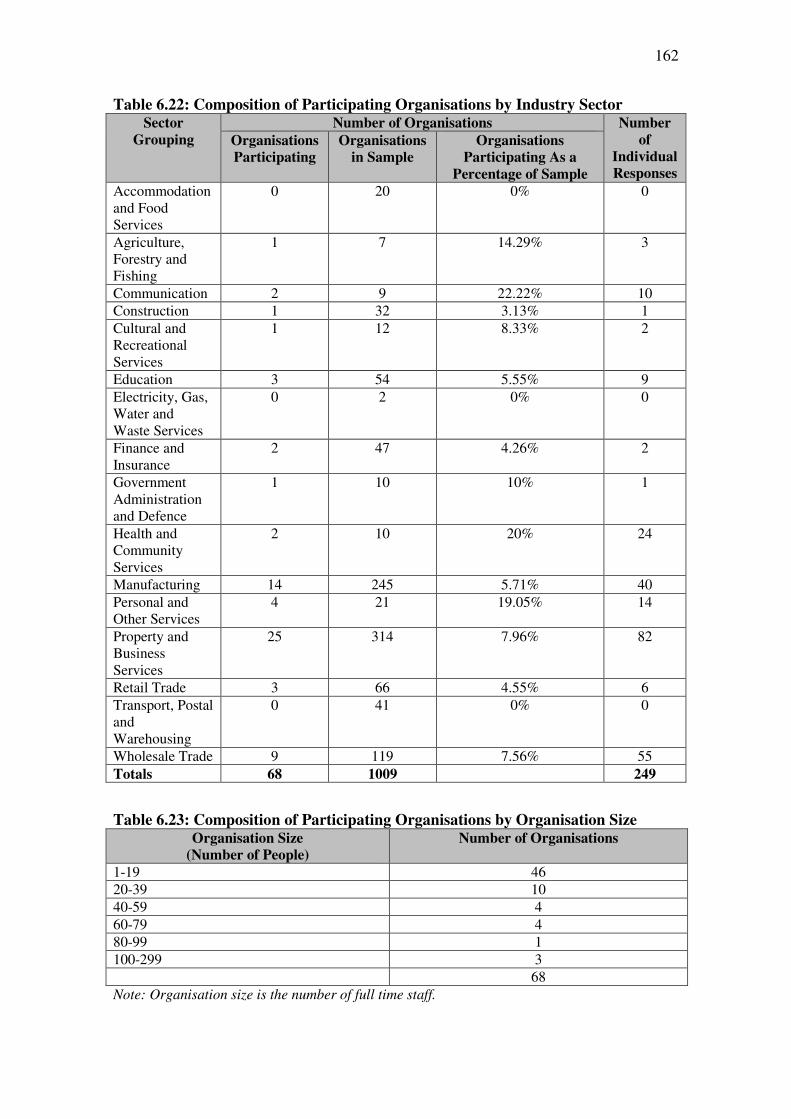
162
Table 6.22: Composition of Participating Organisations by Industry Sector Sector
Grouping
Number of Organisations Number
of
Individual
Responses
Organisations
Participating
Organisations
in Sample
Organisations
Participating As a
Percentage of Sample
Accommodation and Food Services
0 20 0% 0
Agriculture, Forestry and Fishing
1 7 14.29% 3
Communication 2 9 22.22% 10
Construction 1 32 3.13% 1
Cultural and Recreational Services
1 12 8.33% 2
Education 3 54 5.55% 9
Electricity, Gas, Water and Waste Services
0 2 0% 0
Finance and Insurance
2 47 4.26% 2
Government Administration and Defence
1 10 10% 1
Health and Community Services
2 10 20% 24
Manufacturing 14 245 5.71% 40
Personal and Other Services
4 21 19.05% 14
Property and Business Services
25 314 7.96% 82
Retail Trade 3 66 4.55% 6
Transport, Postal and Warehousing
0 41 0% 0
Wholesale Trade 9 119 7.56% 55
Totals 68 1009 249
Table 6.23: Composition of Participating Organisations by Organisation Size Organisation Size
(Number of People)
Number of Organisations
1-19 46
20-39 10
40-59 4
60-79 4
80-99 1
100-299 3
68
Note: Organisation size is the number of full time staff.
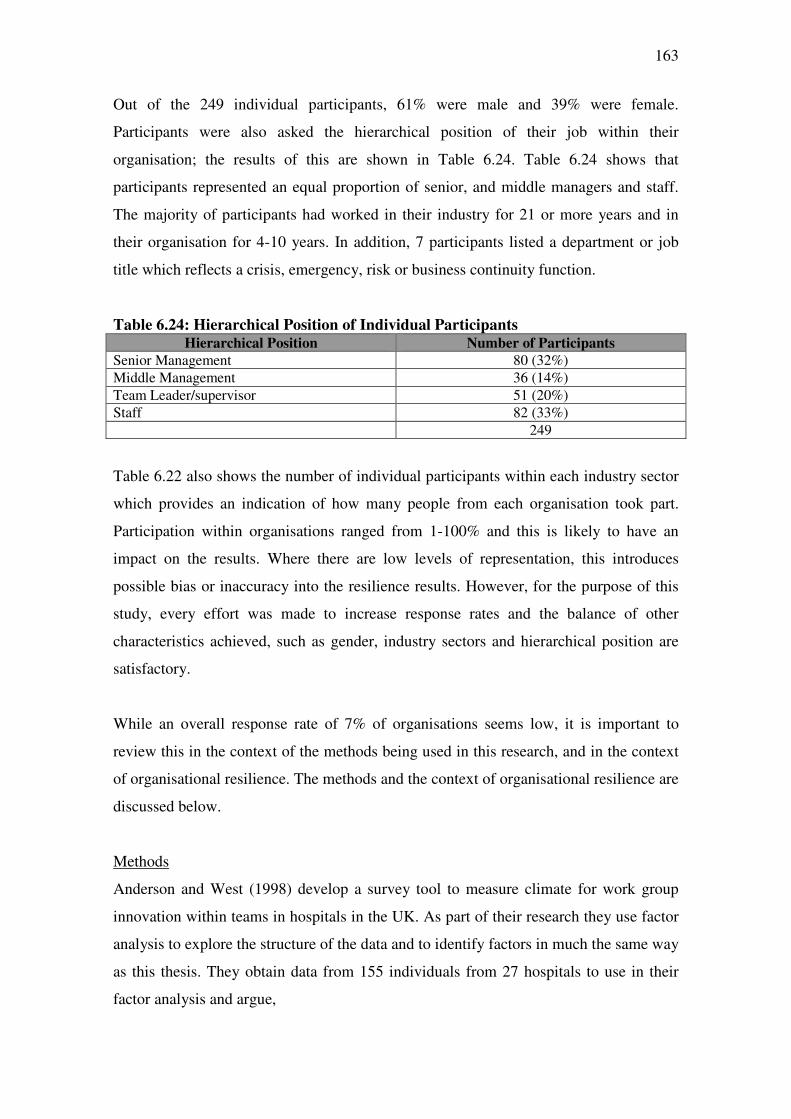
163
Out of the 249 individual participants, 61% were male and 39% were female.
Participants were also asked the hierarchical position of their job within their
organisation; the results of this are shown in Table 6.24. Table 6.24 shows that
participants represented an equal proportion of senior, and middle managers and staff.
The majority of participants had worked in their industry for 21 or more years and in
their organisation for 4-10 years. In addition, 7 participants listed a department or job
title which reflects a crisis, emergency, risk or business continuity function.
Table 6.24: Hierarchical Position of Individual Participants Hierarchical Position Number of Participants
Senior Management 80 (32%)
Middle Management 36 (14%)
Team Leader/supervisor 51 (20%)
Staff 82 (33%)
249
Table 6.22 also shows the number of individual participants within each industry sector
which provides an indication of how many people from each organisation took part.
Participation within organisations ranged from 1-100% and this is likely to have an
impact on the results. Where there are low levels of representation, this introduces
possible bias or inaccuracy into the resilience results. However, for the purpose of this
study, every effort was made to increase response rates and the balance of other
characteristics achieved, such as gender, industry sectors and hierarchical position are
satisfactory.
While an overall response rate of 7% of organisations seems low, it is important to
review this in the context of the methods being used in this research, and in the context
of organisational resilience. The methods and the context of organisational resilience are
discussed below.
Methods
Anderson and West (1998) develop a survey tool to measure climate for work group
innovation within teams in hospitals in the UK. As part of their research they use factor
analysis to explore the structure of the data and to identify factors in much the same way
as this thesis. They obtain data from 155 individuals from 27 hospitals to use in their
factor analysis and argue,
164
“These analyses were computed at the individual level of analysis in
accordance with traditional approaches to item analysis and scale
development…examining item statistics at the individual level avoids
additional problems of dealing with summed data at the team level.
Indeed, combined team-level data can obscure the psychometric
characteristics of items by collapsing-down distribution statistics to the
team level”.
(Anderson & West, 1998, p. 243)
Here Anderson and West (1998) explain that exploratory factor analysis should be
performed at the individual level during an organisation level study. They also argue
that analysis at the individual level, avoids introducing errors into the factor analysis
through the use of summed data e.g. organisations’ averaged resilience scores.
As a result of this, during the factor analysis discussed in Section 6.2, data was analysed
at the individual level (with 249 sets of data) rather than at the organisation level (with
68 sets of data). The sample of 249 also exceeds the minimum sample size suggested by
Hinkin (1995) who argues that a sample of 150 observations is suitable for exploratory
factor analysis. He also goes on to argue that a sample of 150 should also be the
minimum for scale development procedures which are followed in this thesis.
Simsek and Veiga (2001) note that researchers using internet surveys have reported
response rates ranging from 7-76%. This thesis used a random sample of organisations,
many of whom had not heard of organisational resilience before. Despite efforts made
to reduce non-response bias and increase the response rate, participants’ lack of
familiarity and awareness of resilience made it very difficult to convince organisations
to take part. This difficulty is perhaps one of the reasons why very few studies in
disaster or crisis management focus on measuring a random sample of organisations.
Hurley-Hanson (2006) uses a survey to measure whether organisations directly affected
by the September 11th attacks have addressed their preparedness since 2001, and
achieves a response rate of 20%. However, she uses the individual tenants of the World
Trade Centres in New York and Long Beach California as her sampling frame. These
165
individuals have an increased awareness of the importance of resilience (due to their
experiences in the attacks), and Hurley-Hanson (2006) does not attribute the results to
particular organisations, so it is not clear how many organisations were represented.
Other authors conduct surveys using a small number of case study organisations.
Herbane (2010) notes that many of the seminal studies in disaster and crisis
management are based on samples of four organisations or less. These studies usually
focus on examining an organisations’ response to, or progress after, a specific crisis or
emergency (Antonsen, 2009; Beunza & Stark, 2004; Herbane, 2010).
When reviewing the results of this research, it is therefore important to remember that a
portion of the least resilient organisations is most likely not represented. Non-response
error occurs when some members of the chosen sample do not respond to the survey. In
this case, even though the sample may be chosen to be representative, the results are
not. In this thesis, the fact that a portion of the least resilient organisations most likely
did not take part is a source of non-response error. Methods of reducing non-response
error were discussed in Section 4.3.
For this research, the response rate achieved means that while there is enough data to
perform the factor analysis, detailed conclusions about the resilience of organisations
cannot be generalised to organisations outside of the sample.
Organisational Resilience Context
In the context of organisational resilience, the non-response rate, and in particular the
reasons given for not taking part, are as important as the response rate. As part of the
follow-up phone calls to organisations during the administration of the survey,
organisations were asked their reasons for not taking part. Of the 941 organisations from
the random sample that did not take part in the research, 363 provided a reason.
Appendix D1 provides a graph showing the various reasons, and the percentage of
organisations that provided each reason. The reasons included:
• Not enough time or resources
• Organisational change means that it’s not the right time
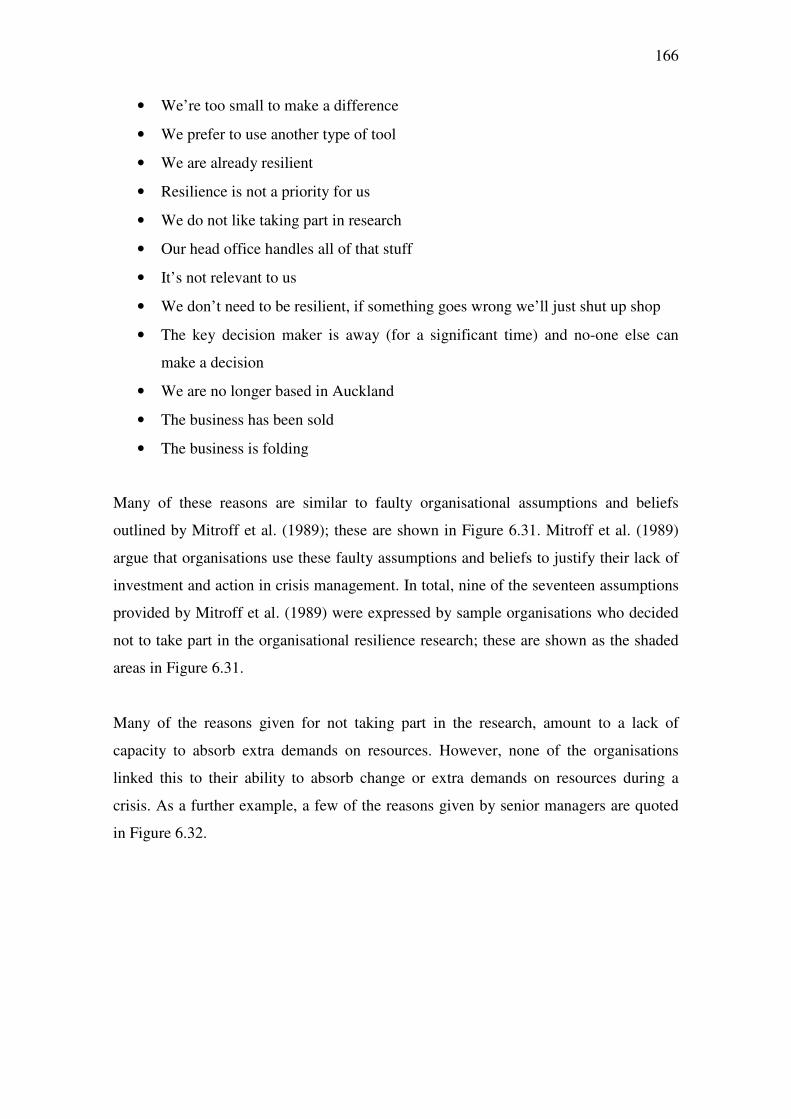
166
• We’re too small to make a difference
• We prefer to use another type of tool
• We are already resilient
• Resilience is not a priority for us
• We do not like taking part in research
• Our head office handles all of that stuff
• It’s not relevant to us
• We don’t need to be resilient, if something goes wrong we’ll just shut up shop
• The key decision maker is away (for a significant time) and no-one else can
make a decision
• We are no longer based in Auckland
• The business has been sold
• The business is folding
Many of these reasons are similar to faulty organisational assumptions and beliefs
outlined by Mitroff et al. (1989); these are shown in Figure 6.31. Mitroff et al. (1989)
argue that organisations use these faulty assumptions and beliefs to justify their lack of
investment and action in crisis management. In total, nine of the seventeen assumptions
provided by Mitroff et al. (1989) were expressed by sample organisations who decided
not to take part in the organisational resilience research; these are shown as the shaded
areas in Figure 6.31.
Many of the reasons given for not taking part in the research, amount to a lack of
capacity to absorb extra demands on resources. However, none of the organisations
linked this to their ability to absorb change or extra demands on resources during a
crisis. As a further example, a few of the reasons given by senior managers are quoted
in Figure 6.32.
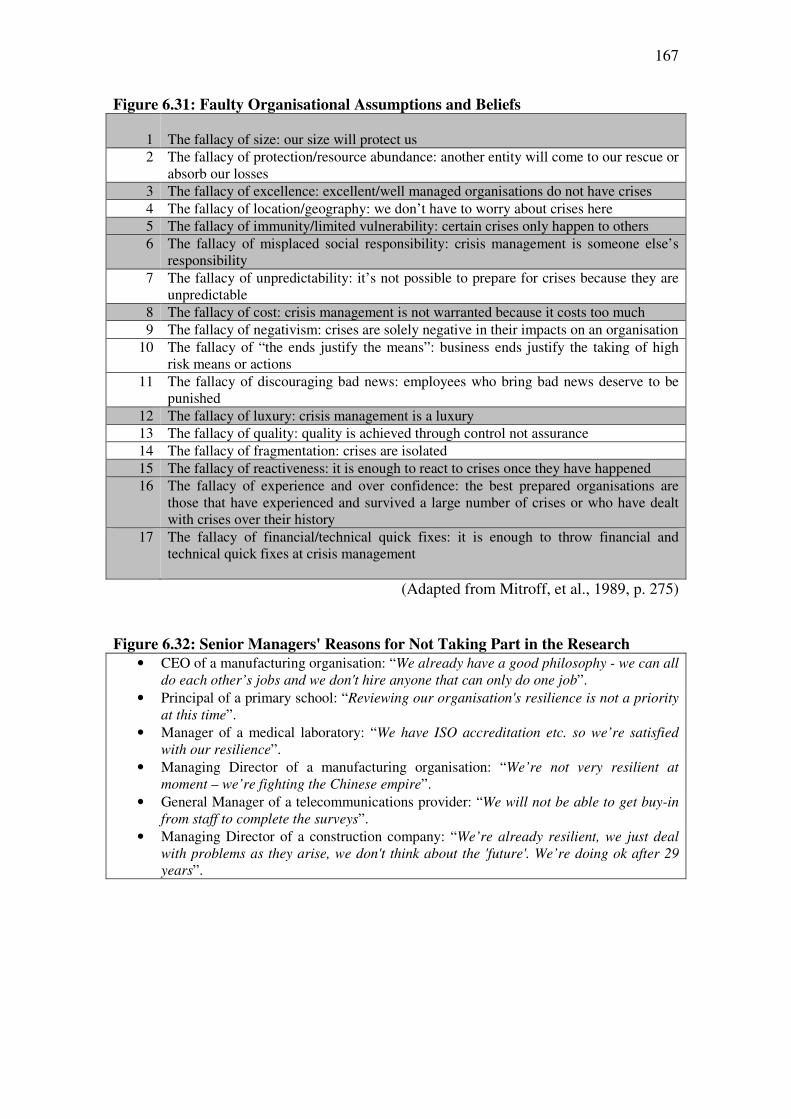
167
Figure 6.31: Faulty Organisational Assumptions and Beliefs
1 The fallacy of size: our size will protect us
2 The fallacy of protection/resource abundance: another entity will come to our rescue or absorb our losses
3 The fallacy of excellence: excellent/well managed organisations do not have crises
4 The fallacy of location/geography: we don’t have to worry about crises here
5 The fallacy of immunity/limited vulnerability: certain crises only happen to others
6 The fallacy of misplaced social responsibility: crisis management is someone else’s responsibility
7 The fallacy of unpredictability: it’s not possible to prepare for crises because they are unpredictable
8 The fallacy of cost: crisis management is not warranted because it costs too much
9 The fallacy of negativism: crises are solely negative in their impacts on an organisation
10 The fallacy of “the ends justify the means”: business ends justify the taking of high risk means or actions
11 The fallacy of discouraging bad news: employees who bring bad news deserve to be punished
12 The fallacy of luxury: crisis management is a luxury
13 The fallacy of quality: quality is achieved through control not assurance
14 The fallacy of fragmentation: crises are isolated
15 The fallacy of reactiveness: it is enough to react to crises once they have happened
16 The fallacy of experience and over confidence: the best prepared organisations are those that have experienced and survived a large number of crises or who have dealt with crises over their history
17 The fallacy of financial/technical quick fixes: it is enough to throw financial and technical quick fixes at crisis management
(Adapted from Mitroff, et al., 1989, p. 275)
Figure 6.32: Senior Managers' Reasons for Not Taking Part in the Research
• CEO of a manufacturing organisation: “We already have a good philosophy - we can all do each other’s jobs and we don't hire anyone that can only do one job”.
• Principal of a primary school: “Reviewing our organisation's resilience is not a priority at this time”.
• Manager of a medical laboratory: “We have ISO accreditation etc. so we’re satisfied with our resilience”.
• Managing Director of a manufacturing organisation: “We’re not very resilient at moment – we’re fighting the Chinese empire”.
• General Manager of a telecommunications provider: “We will not be able to get buy-in from staff to complete the surveys”.
• Managing Director of a construction company: “We’re already resilient, we just deal with problems as they arise, we don't think about the 'future'. We’re doing ok after 29 years”.
168
6.2 Exploratory Factor Analysis
The factor analysis discussed in this research, was performed using principal axis factor
analysis at item, or question level; this method is discussed in Sections 4.1.5.1 and 6.1.
Through factor analysis, items are grouped into factors using patterns of correlations
which show that they are statistically related. When this happens, some items will not
load highly enough, and will not be incorporated into a factor. For this research, items
with a loading of less than 0.4 (Hinkin, 1998) are assessed in relation to their theoretical
contribution, and if appropriate they are dropped from the model. The term ‘factor
structure’ refers to the number of factors that are being extracted from the data; in other
parts of this thesis these are referred to as the dimensions of organisational resilience.
The term item refers to each of the individual questions that were developed to measure
the indicators of organisational resilience. The result of the factor analysis is a list of
items which make up organisational resilience, and which can be combined to serve as
indicators, within the factors or dimensions suggested, in the resilience measurement
tool.
Pallant (2007) notes that the first step in factor analysis is to assess the suitability of the
data collected for factor analysis. She argues that there are two considerations for this;
the sample size (discussed in Section 6.1), and the strength of the relationship between
the items. Pallant (2007, p. 181) suggests two tests that can be performed using SPSS to
check the strength of the relationship between the items; Bartlett’s test of sphericity and
the Kaiser-Meyer-Olkin (KMO) measure of sampling adequacy.
Bartlett’s Test of Sphericity
This test examines the correlation matrix of the data and investigates the hypothesis that
the sample data came from a normal population, in which the items were completely
unrelated. If this hypothesis were accepted, it would mean that none of the items would
group together, and each item would be one factor. A positive outcome is that this
hypothesis is rejected, and that the items are shown to be related to each other , i.e. they
will join together in groups to become factors (Dziuban & Shirkey, 1974).
Results for Bartlett’s test of sphericity are expressed as a value of p and should be
significant (p < 0.05) which represents 95% confidence. This means that the p value
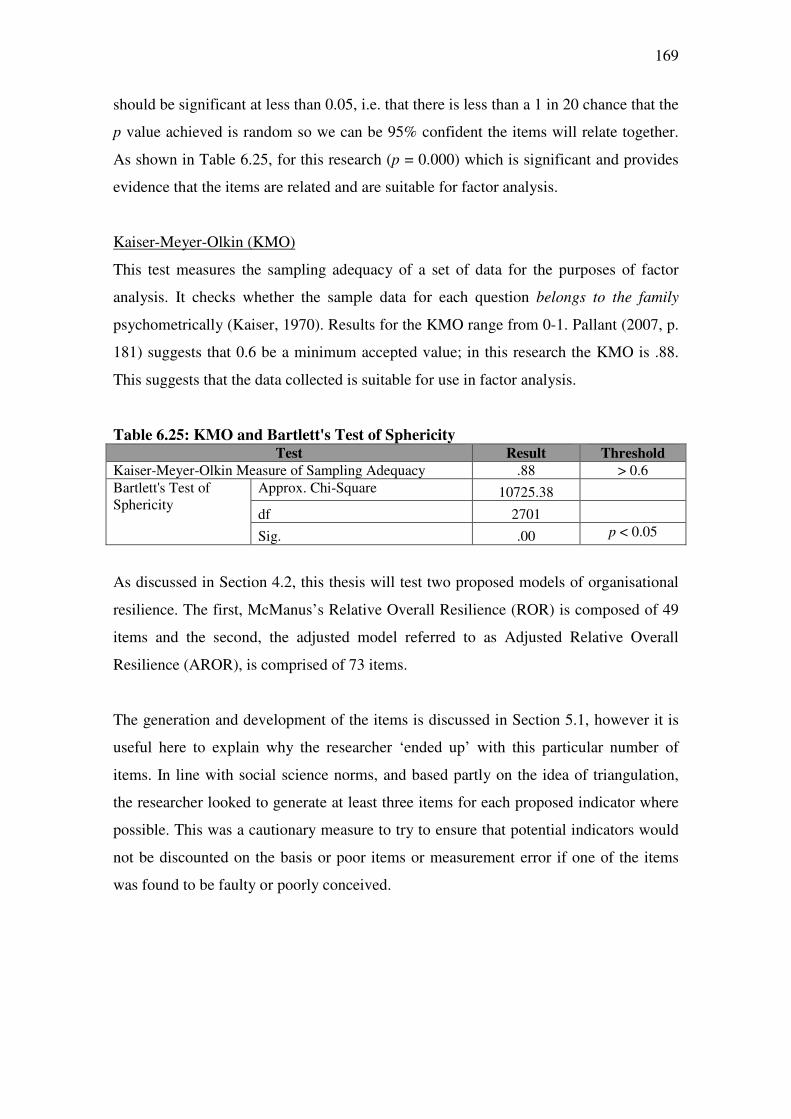
169
should be significant at less than 0.05, i.e. that there is less than a 1 in 20 chance that the
p value achieved is random so we can be 95% confident the items will relate together.
As shown in Table 6.25, for this research (p = 0.000) which is significant and provides
evidence that the items are related and are suitable for factor analysis.
Kaiser-Meyer-Olkin (KMO)
This test measures the sampling adequacy of a set of data for the purposes of factor
analysis. It checks whether the sample data for each question belongs to the family
psychometrically (Kaiser, 1970). Results for the KMO range from 0-1. Pallant (2007, p.
181) suggests that 0.6 be a minimum accepted value; in this research the KMO is .88.
This suggests that the data collected is suitable for use in factor analysis.
Table 6.25: KMO and Bartlett's Test of Sphericity Test Result Threshold
Kaiser-Meyer-Olkin Measure of Sampling Adequacy .88 > 0.6
Bartlett's Test of Sphericity
Approx. Chi-Square 10725.38
df 2701
Sig. .00 p < 0.05
As discussed in Section 4.2, this thesis will test two proposed models of organisational
resilience. The first, McManus’s Relative Overall Resilience (ROR) is composed of 49
items and the second, the adjusted model referred to as Adjusted Relative Overall
Resilience (AROR), is comprised of 73 items.
The generation and development of the items is discussed in Section 5.1, however it is
useful here to explain why the researcher ‘ended up’ with this particular number of
items. In line with social science norms, and based partly on the idea of triangulation,
the researcher looked to generate at least three items for each proposed indicator where
possible. This was a cautionary measure to try to ensure that potential indicators would
not be discounted on the basis or poor items or measurement error if one of the items
was found to be faulty or poorly conceived.
170
6.2.1 Testing the Relative Overall Resilience Model
McManus’s (2007) model of Relative Overall Resilience suggested that organisational
resilience is comprised of three dimensions; situation awareness (SA), management of
keystone vulnerabilities (KV) and adaptive capacity (AC). In turn each of the three
dimensions was comprised of five indicators; this model is discussed in detail in
Chapter 3 and Section 4.2. Through the scale development process described in Chapter
5, this model was operationalised as 49 items or questions in the resilience measurement
tool.
6.2.1.1 3-Factor Solution
Based on McManus’s (2007) model, a 3-factor solution was extracted using principal
axis factor analysis with a varimax rotation; this can be seen in Appendix D2. This
resulted in a solution where 37 of the items used to measure McManus’s indicators were
retained and 12 items were dropped due to poor loadings. The dropped items are shown
in Appendix D3. The solution had 2 substantial factors and a third factor that was weak
with only 4 items (one of which was doubled loaded). This shows that, using the sample
and scales developed through this thesis, McManus’s (2007) 3-factor model of Relative
Overall Resilience is not supported.
Hypothesis 1: Organisational resilience is a function of situation awareness,
management of keystone vulnerabilities, and adaptive capacity.
Through the discussion of the 3-factor analysis presented above it is clear that
organisational resilience is not a function of only the 3 dimensions identified by
McManus (2007). This means that hypothesis 1 is not supported. However while the
dimensions identified by McManus are not supported in their current form, indicators
from all 3 of McManus’s dimensions were incorporated into the 2 substantial factors
which were identified during the analysis.
Hypothesis 2: Each of the dimensions of organisational resilience will comprise of the
five indicators identified.
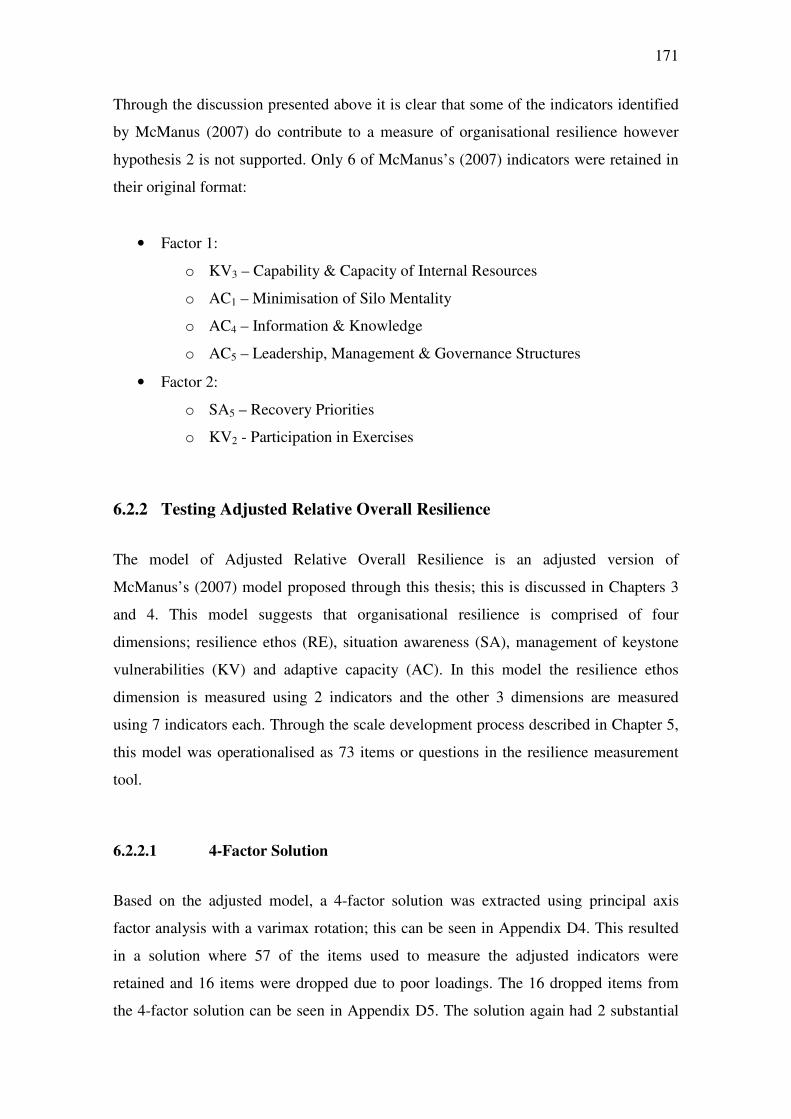
171
Through the discussion presented above it is clear that some of the indicators identified
by McManus (2007) do contribute to a measure of organisational resilience however
hypothesis 2 is not supported. Only 6 of McManus’s (2007) indicators were retained in
their original format:
• Factor 1:
o KV3 – Capability & Capacity of Internal Resources
o AC1 – Minimisation of Silo Mentality
o AC4 – Information & Knowledge
o AC5 – Leadership, Management & Governance Structures
• Factor 2:
o SA5 – Recovery Priorities
o KV2 - Participation in Exercises
6.2.2 Testing Adjusted Relative Overall Resilience
The model of Adjusted Relative Overall Resilience is an adjusted version of
McManus’s (2007) model proposed through this thesis; this is discussed in Chapters 3
and 4. This model suggests that organisational resilience is comprised of four
dimensions; resilience ethos (RE), situation awareness (SA), management of keystone
vulnerabilities (KV) and adaptive capacity (AC). In this model the resilience ethos
dimension is measured using 2 indicators and the other 3 dimensions are measured
using 7 indicators each. Through the scale development process described in Chapter 5,
this model was operationalised as 73 items or questions in the resilience measurement
tool.
6.2.2.1 4-Factor Solution
Based on the adjusted model, a 4-factor solution was extracted using principal axis
factor analysis with a varimax rotation; this can be seen in Appendix D4. This resulted
in a solution where 57 of the items used to measure the adjusted indicators were
retained and 16 items were dropped due to poor loadings. The 16 dropped items from
the 4-factor solution can be seen in Appendix D5. The solution again had 2 substantial
172
factors and 2 factors that were weak with only 8 items in one and 4 items in the other.
This shows that, using the sample and scales developed through this thesis, the 4-factor
adjusted model of Relative Overall Resilience is not supported.
Hypothesis 3: Organisational resilience is a function of resilience ethos, situation
awareness, management of keystone vulnerabilities, and adaptive capacity.
Through the results and analysis presented above it is clear that organisational resilience
is not a function of only the four dimensions identified in the Adjusted Relative Overall
Resilience model. This means that hypothesis 3 is not supported.
Hypothesis 4: Each of the dimensions of organisational resilience will comprise of the
indicators identified.
Through the results and analysis presented above it is clear that some of the indicators
identified by McManus (2007) do contribute to a measure of organisational resilience.
However in the 4-factor solution some indicators have been pulled apart and different
items posited to the 4 factors. The following indicators were retained in their original
format:
• Factor 1:
o AC1 – Minimisation of Silo Mentality
o AC4 – Information & Knowledge
o AC5 – Leadership, Management & Governance Structures
o AC6 – Innovation & Creativity
o AC7 – Devolved & Responsive Decision Making
• Factor 2:
o SA5 – Recovery Priorities
o KV2 – Participation in Exercises
• Factor 3:
o RE2 – Network Perspective
No indicators were retained in their original form in factor 4. Following the results of
the 4-factor analysis, and in line with the process of exploratory factor analysis, other
possible structures were investigated.
173
6.2.2.2 5-Factor Solution
Using the adjusted model items, a 5-factor solution was extracted using principal axis
factor analysis with a varimax rotation; this can be seen in Appendix D6. This resulted
in a solution where 55 of the items used to measure the adjusted indicators were
retained and 18 items were dropped due to poor loadings. The 18 dropped items are
shown in Appendix D7. The solution had 1 very large factor, 1 large factor, and 3
factors that were weak with only 8 items in one and 4 items each of the other two.
6.2.2.3 3-Factor Solution
Using the adjusted model items, the researcher tried to extract a 3-factor solution using
principal axis factor analysis with a varimax rotation; however the rotation would not
converge. To address this, the number of iterations was increased however the 3 factor
solution still failed to converge. This means that a 3-factor solution, based on the
adjusted model, was not possible.
6.2.2.4 2-Factor Solution
When testing McManus’s (2007) model of Relative Overall Resilience in other parts of
this section, the factor solutions most often provided 2 clear factors and this suggests
that it would be useful to try a 2-factor solution with the adjusted model items. A 2-
factor solution was extracted based on the adjusted model items using principal axis
factor analysis with a varimax rotation; this can be seen in Appendix D8. This resulted
in a very clean 2-factor structure where 53 items were retained to measure
organisational resilience and 20 items were dropped due to poor loadings. The 20
dropped items can be seen in Appendix D9.
Dropped items were reviewed in relation to the literature and it was found that the
majority were covered by other items. In hindsight this was due to the language of the
items and reflects how interrelated the concept of resilience is. Despite this the purpose
of the factor analysis was to reduce the number of items and seek a parsimonious
solution and this was achieved. However, the researcher decided to retain 1 of the
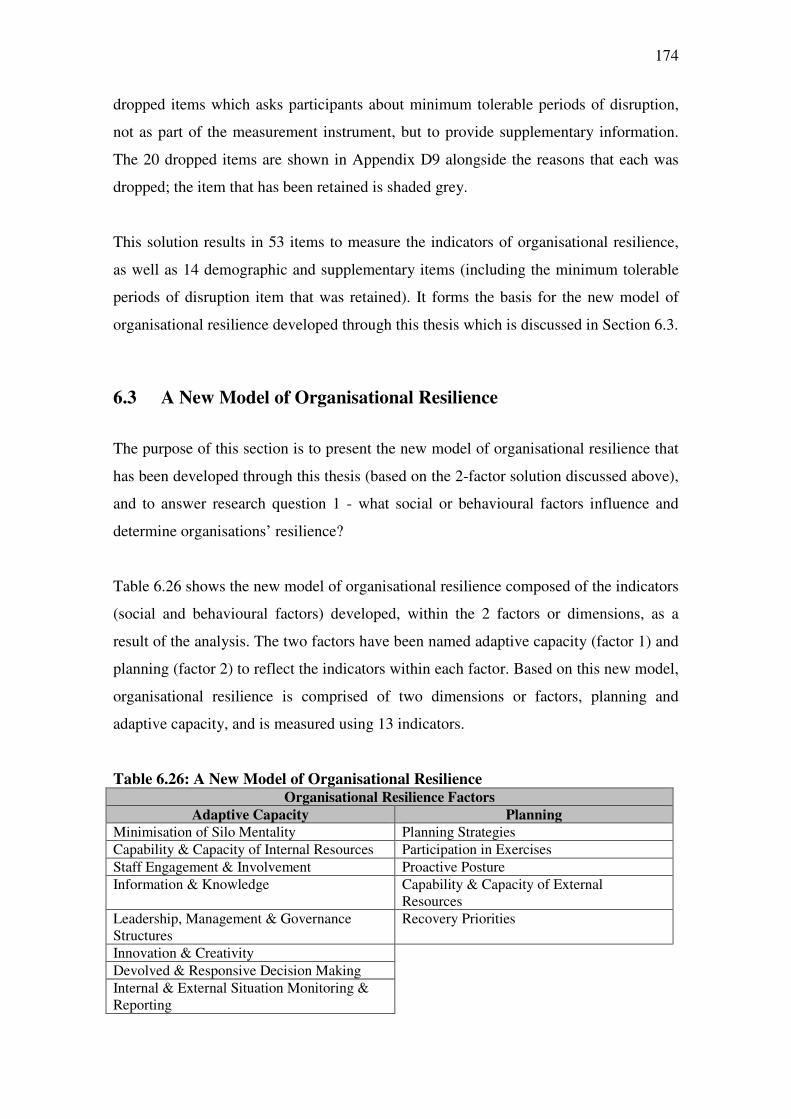
174
dropped items which asks participants about minimum tolerable periods of disruption,
not as part of the measurement instrument, but to provide supplementary information.
The 20 dropped items are shown in Appendix D9 alongside the reasons that each was
dropped; the item that has been retained is shaded grey.
This solution results in 53 items to measure the indicators of organisational resilience,
as well as 14 demographic and supplementary items (including the minimum tolerable
periods of disruption item that was retained). It forms the basis for the new model of
organisational resilience developed through this thesis which is discussed in Section 6.3.
6.3 A New Model of Organisational Resilience
The purpose of this section is to present the new model of organisational resilience that
has been developed through this thesis (based on the 2-factor solution discussed above),
and to answer research question 1 - what social or behavioural factors influence and
determine organisations’ resilience?
Table 6.26 shows the new model of organisational resilience composed of the indicators
(social and behavioural factors) developed, within the 2 factors or dimensions, as a
result of the analysis. The two factors have been named adaptive capacity (factor 1) and
planning (factor 2) to reflect the indicators within each factor. Based on this new model,
organisational resilience is comprised of two dimensions or factors, planning and
adaptive capacity, and is measured using 13 indicators.
Table 6.26: A New Model of Organisational Resilience Organisational Resilience Factors
Adaptive Capacity Planning
Minimisation of Silo Mentality Planning Strategies
Capability & Capacity of Internal Resources Participation in Exercises
Staff Engagement & Involvement Proactive Posture
Information & Knowledge Capability & Capacity of External Resources
Leadership, Management & Governance Structures
Recovery Priorities
Innovation & Creativity
Devolved & Responsive Decision Making
Internal & External Situation Monitoring & Reporting
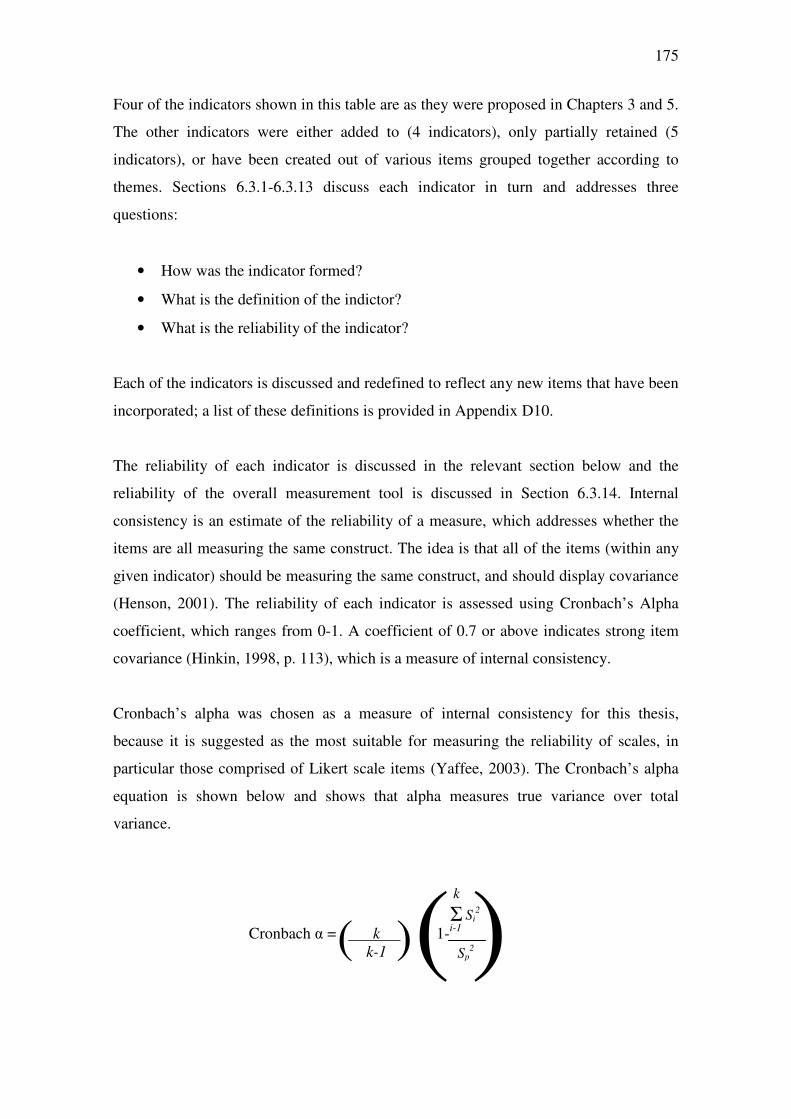
175
Four of the indicators shown in this table are as they were proposed in Chapters 3 and 5.
The other indicators were either added to (4 indicators), only partially retained (5
indicators), or have been created out of various items grouped together according to
themes. Sections 6.3.1-6.3.13 discuss each indicator in turn and addresses three
questions:
• How was the indicator formed?
• What is the definition of the indictor?
• What is the reliability of the indicator?
Each of the indicators is discussed and redefined to reflect any new items that have been
incorporated; a list of these definitions is provided in Appendix D10.
The reliability of each indicator is discussed in the relevant section below and the
reliability of the overall measurement tool is discussed in Section 6.3.14. Internal
consistency is an estimate of the reliability of a measure, which addresses whether the
items are all measuring the same construct. The idea is that all of the items (within any
given indicator) should be measuring the same construct, and should display covariance
(Henson, 2001). The reliability of each indicator is assessed using Cronbach’s Alpha
coefficient, which ranges from 0-1. A coefficient of 0.7 or above indicates strong item
covariance (Hinkin, 1998, p. 113), which is a measure of internal consistency.
Cronbach’s alpha was chosen as a measure of internal consistency for this thesis,
because it is suggested as the most suitable for measuring the reliability of scales, in
particular those comprised of Likert scale items (Yaffee, 2003). The Cronbach’s alpha
equation is shown below and shows that alpha measures true variance over total
variance.
Cronbach α = k 1-i-1 k-1
( ) ( ) k
Σ Si2
Sp2
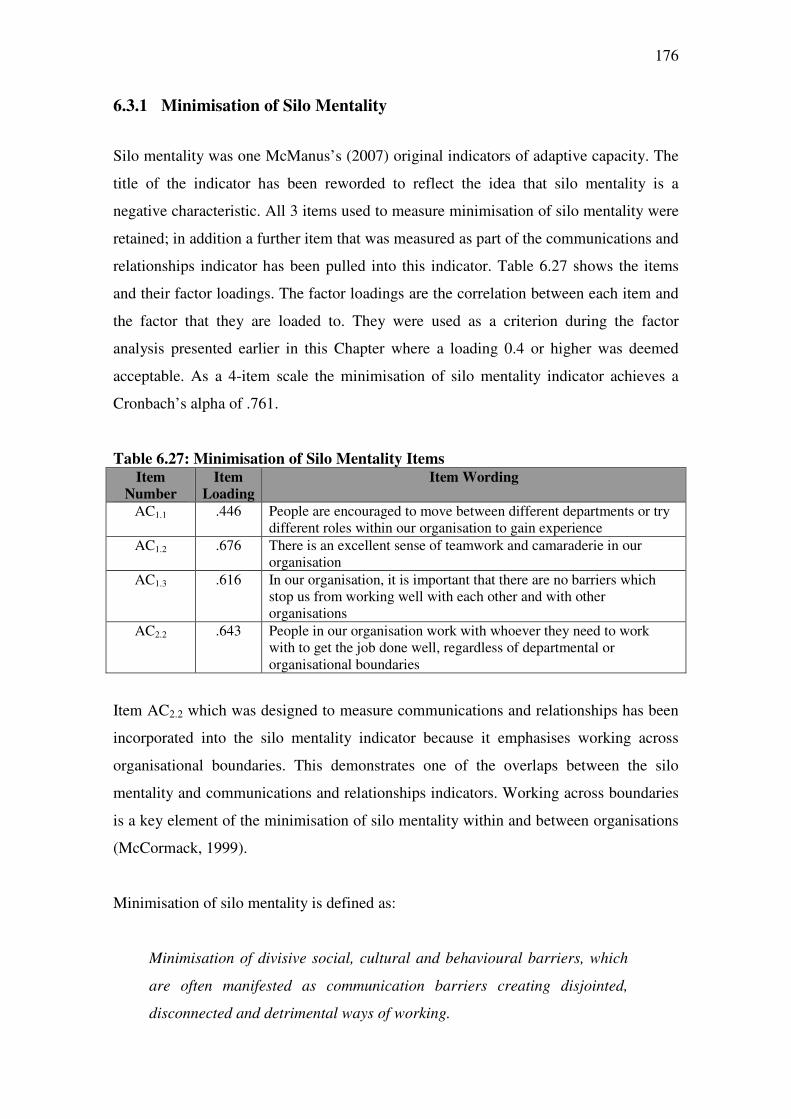
176
6.3.1 Minimisation of Silo Mentality
Silo mentality was one McManus’s (2007) original indicators of adaptive capacity. The
title of the indicator has been reworded to reflect the idea that silo mentality is a
negative characteristic. All 3 items used to measure minimisation of silo mentality were
retained; in addition a further item that was measured as part of the communications and
relationships indicator has been pulled into this indicator. Table 6.27 shows the items
and their factor loadings. The factor loadings are the correlation between each item and
the factor that they are loaded to. They were used as a criterion during the factor
analysis presented earlier in this Chapter where a loading 0.4 or higher was deemed
acceptable. As a 4-item scale the minimisation of silo mentality indicator achieves a
Cronbach’s alpha of .761.
Table 6.27: Minimisation of Silo Mentality Items
Item
Number
Item
Loading
Item Wording
AC1.1 .446 People are encouraged to move between different departments or try different roles within our organisation to gain experience
AC1.2 .676 There is an excellent sense of teamwork and camaraderie in our organisation
AC1.3 .616 In our organisation, it is important that there are no barriers which stop us from working well with each other and with other organisations
AC2.2 .643 People in our organisation work with whoever they need to work with to get the job done well, regardless of departmental or organisational boundaries
Item AC2.2 which was designed to measure communications and relationships has been
incorporated into the silo mentality indicator because it emphasises working across
organisational boundaries. This demonstrates one of the overlaps between the silo
mentality and communications and relationships indicators. Working across boundaries
is a key element of the minimisation of silo mentality within and between organisations
(McCormack, 1999).
Minimisation of silo mentality is defined as:
Minimisation of divisive social, cultural and behavioural barriers, which
are often manifested as communication barriers creating disjointed,
disconnected and detrimental ways of working.
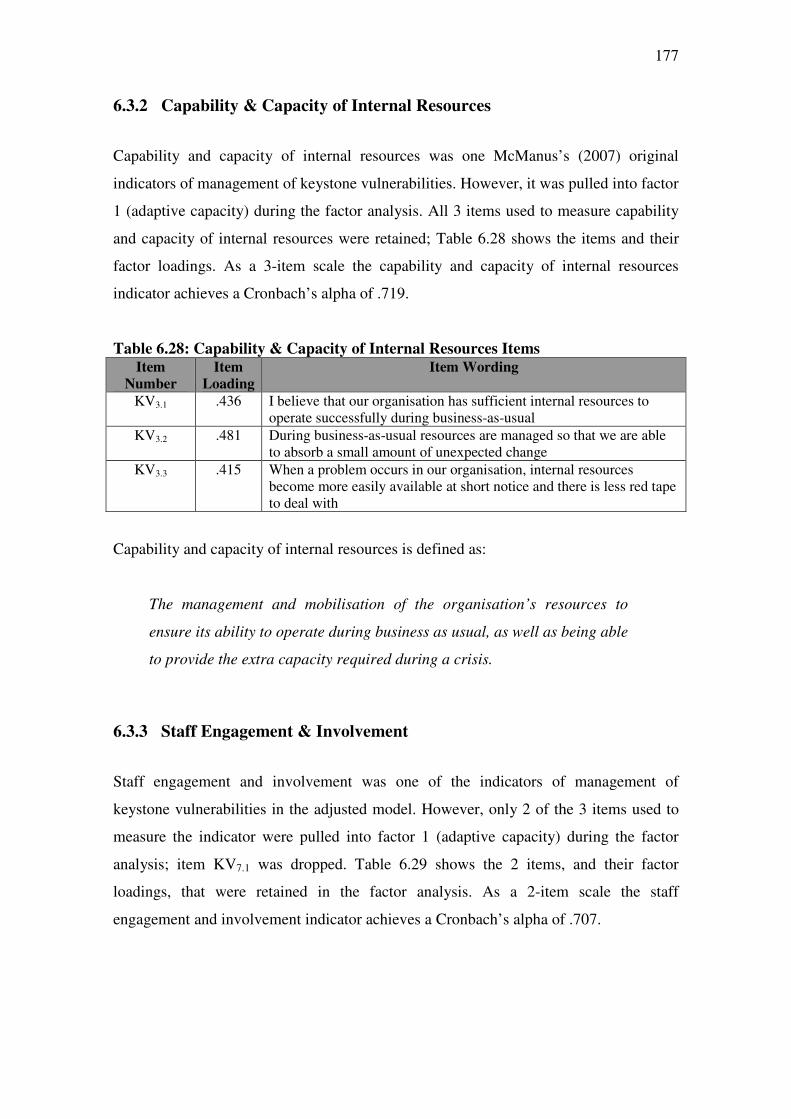
177
6.3.2 Capability & Capacity of Internal Resources
Capability and capacity of internal resources was one McManus’s (2007) original
indicators of management of keystone vulnerabilities. However, it was pulled into factor
1 (adaptive capacity) during the factor analysis. All 3 items used to measure capability
and capacity of internal resources were retained; Table 6.28 shows the items and their
factor loadings. As a 3-item scale the capability and capacity of internal resources
indicator achieves a Cronbach’s alpha of .719.
Table 6.28: Capability & Capacity of Internal Resources Items
Item
Number
Item
Loading
Item Wording
KV3.1 .436 I believe that our organisation has sufficient internal resources to operate successfully during business-as-usual
KV3.2 .481 During business-as-usual resources are managed so that we are able to absorb a small amount of unexpected change
KV3.3 .415 When a problem occurs in our organisation, internal resources become more easily available at short notice and there is less red tape to deal with
Capability and capacity of internal resources is defined as:
The management and mobilisation of the organisation’s resources to
ensure its ability to operate during business as usual, as well as being able
to provide the extra capacity required during a crisis.
6.3.3 Staff Engagement & Involvement
Staff engagement and involvement was one of the indicators of management of
keystone vulnerabilities in the adjusted model. However, only 2 of the 3 items used to
measure the indicator were pulled into factor 1 (adaptive capacity) during the factor
analysis; item KV7.1 was dropped. Table 6.29 shows the 2 items, and their factor
loadings, that were retained in the factor analysis. As a 2-item scale the staff
engagement and involvement indicator achieves a Cronbach’s alpha of .707.
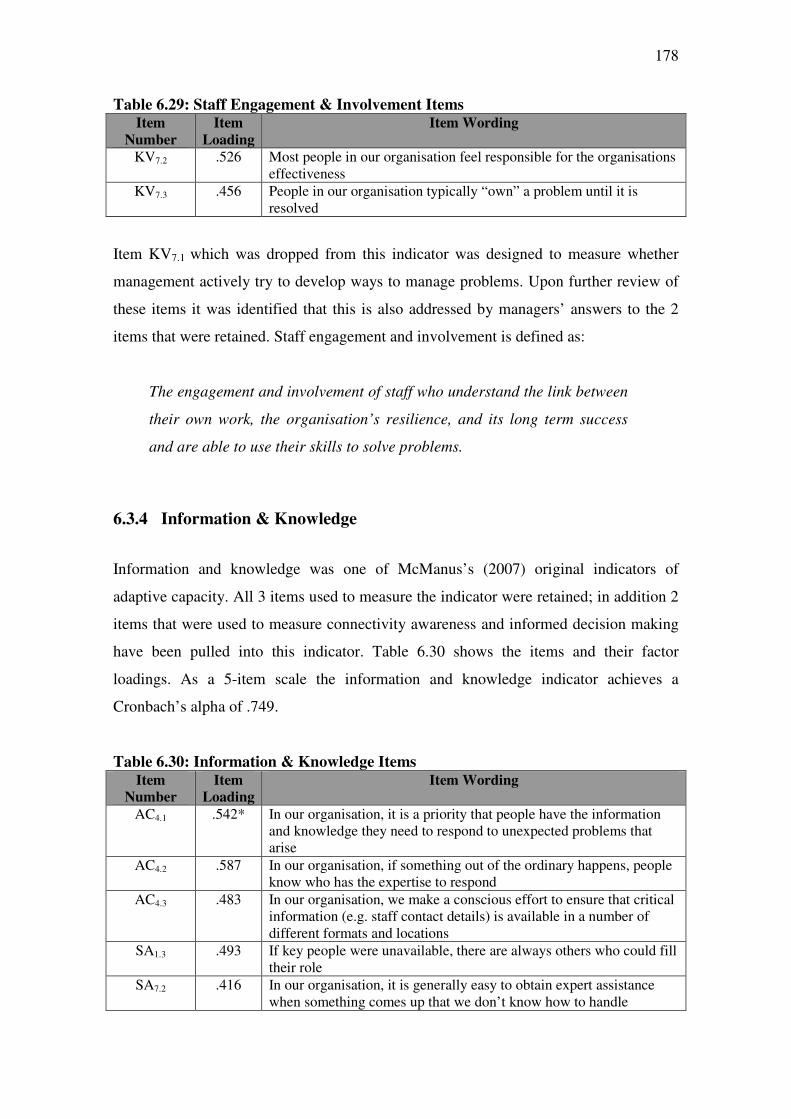
178
Table 6.29: Staff Engagement & Involvement Items Item
Number
Item
Loading
Item Wording
KV7.2 .526 Most people in our organisation feel responsible for the organisations effectiveness
KV7.3 .456 People in our organisation typically “own” a problem until it is resolved
Item KV7.1 which was dropped from this indicator was designed to measure whether
management actively try to develop ways to manage problems. Upon further review of
these items it was identified that this is also addressed by managers’ answers to the 2
items that were retained. Staff engagement and involvement is defined as:
The engagement and involvement of staff who understand the link between
their own work, the organisation’s resilience, and its long term success
and are able to use their skills to solve problems.
6.3.4 Information & Knowledge
Information and knowledge was one of McManus’s (2007) original indicators of
adaptive capacity. All 3 items used to measure the indicator were retained; in addition 2
items that were used to measure connectivity awareness and informed decision making
have been pulled into this indicator. Table 6.30 shows the items and their factor
loadings. As a 5-item scale the information and knowledge indicator achieves a
Cronbach’s alpha of .749.
Table 6.30: Information & Knowledge Items
Item
Number
Item
Loading
Item Wording
AC4.1 .542* In our organisation, it is a priority that people have the information and knowledge they need to respond to unexpected problems that arise
AC4.2 .587 In our organisation, if something out of the ordinary happens, people know who has the expertise to respond
AC4.3 .483 In our organisation, we make a conscious effort to ensure that critical information (e.g. staff contact details) is available in a number of different formats and locations
SA1.3 .493 If key people were unavailable, there are always others who could fill their role
SA7.2 .416 In our organisation, it is generally easy to obtain expert assistance when something comes up that we don’t know how to handle
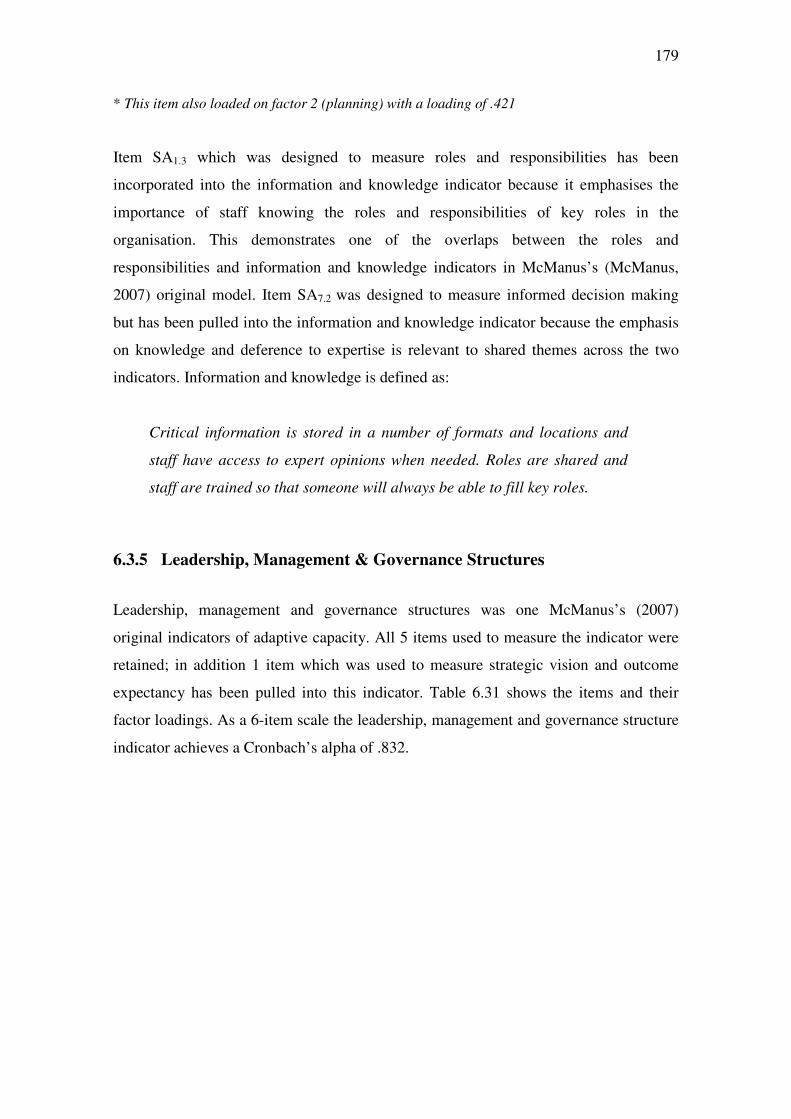
179
* This item also loaded on factor 2 (planning) with a loading of .421
Item SA1.3 which was designed to measure roles and responsibilities has been
incorporated into the information and knowledge indicator because it emphasises the
importance of staff knowing the roles and responsibilities of key roles in the
organisation. This demonstrates one of the overlaps between the roles and
responsibilities and information and knowledge indicators in McManus’s (McManus,
2007) original model. Item SA7.2 was designed to measure informed decision making
but has been pulled into the information and knowledge indicator because the emphasis
on knowledge and deference to expertise is relevant to shared themes across the two
indicators. Information and knowledge is defined as:
Critical information is stored in a number of formats and locations and
staff have access to expert opinions when needed. Roles are shared and
staff are trained so that someone will always be able to fill key roles.
6.3.5 Leadership, Management & Governance Structures
Leadership, management and governance structures was one McManus’s (2007)
original indicators of adaptive capacity. All 5 items used to measure the indicator were
retained; in addition 1 item which was used to measure strategic vision and outcome
expectancy has been pulled into this indicator. Table 6.31 shows the items and their
factor loadings. As a 6-item scale the leadership, management and governance structure
indicator achieves a Cronbach’s alpha of .832.
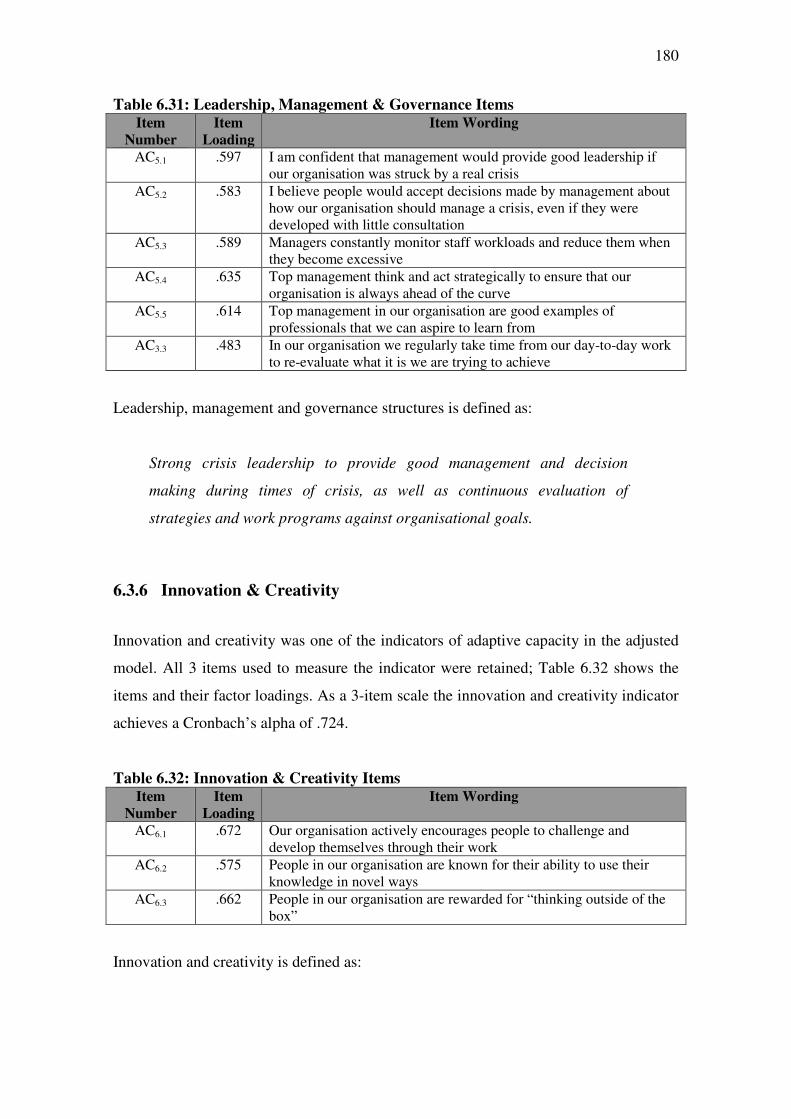
180
Table 6.31: Leadership, Management & Governance Items Item
Number
Item
Loading
Item Wording
AC5.1 .597 I am confident that management would provide good leadership if our organisation was struck by a real crisis
AC5.2 .583 I believe people would accept decisions made by management about how our organisation should manage a crisis, even if they were developed with little consultation
AC5.3 .589 Managers constantly monitor staff workloads and reduce them when they become excessive
AC5.4 .635 Top management think and act strategically to ensure that our organisation is always ahead of the curve
AC5.5 .614 Top management in our organisation are good examples of professionals that we can aspire to learn from
AC3.3 .483 In our organisation we regularly take time from our day-to-day work to re-evaluate what it is we are trying to achieve
Leadership, management and governance structures is defined as:
Strong crisis leadership to provide good management and decision
making during times of crisis, as well as continuous evaluation of
strategies and work programs against organisational goals.
6.3.6 Innovation & Creativity
Innovation and creativity was one of the indicators of adaptive capacity in the adjusted
model. All 3 items used to measure the indicator were retained; Table 6.32 shows the
items and their factor loadings. As a 3-item scale the innovation and creativity indicator
achieves a Cronbach’s alpha of .724.
Table 6.32: Innovation & Creativity Items Item
Number
Item
Loading
Item Wording
AC6.1 .672 Our organisation actively encourages people to challenge and develop themselves through their work
AC6.2 .575 People in our organisation are known for their ability to use their knowledge in novel ways
AC6.3 .662 People in our organisation are rewarded for “thinking outside of the box”
Innovation and creativity is defined as:
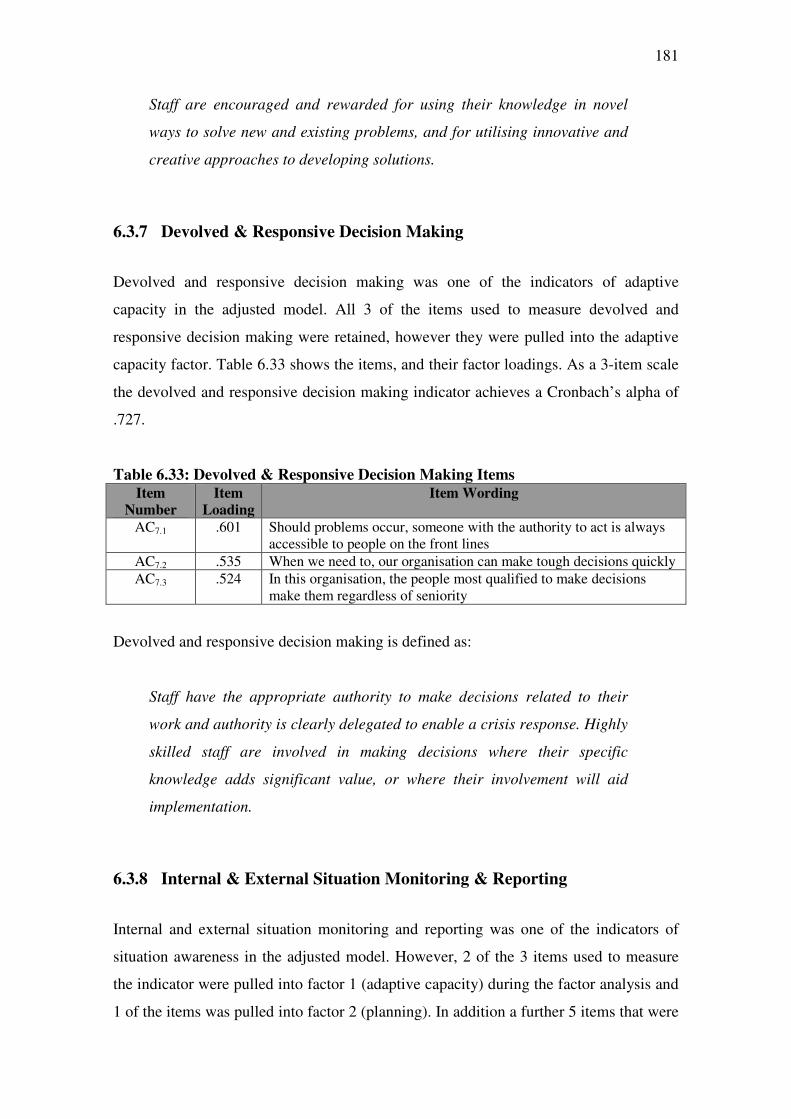
181
Staff are encouraged and rewarded for using their knowledge in novel
ways to solve new and existing problems, and for utilising innovative and
creative approaches to developing solutions.
6.3.7 Devolved & Responsive Decision Making
Devolved and responsive decision making was one of the indicators of adaptive
capacity in the adjusted model. All 3 of the items used to measure devolved and
responsive decision making were retained, however they were pulled into the adaptive
capacity factor. Table 6.33 shows the items, and their factor loadings. As a 3-item scale
the devolved and responsive decision making indicator achieves a Cronbach’s alpha of
.727.
Table 6.33: Devolved & Responsive Decision Making Items
Item
Number
Item
Loading
Item Wording
AC7.1 .601 Should problems occur, someone with the authority to act is always accessible to people on the front lines
AC7.2 .535 When we need to, our organisation can make tough decisions quickly
AC7.3 .524 In this organisation, the people most qualified to make decisions make them regardless of seniority
Devolved and responsive decision making is defined as:
Staff have the appropriate authority to make decisions related to their
work and authority is clearly delegated to enable a crisis response. Highly
skilled staff are involved in making decisions where their specific
knowledge adds significant value, or where their involvement will aid
implementation.
6.3.8 Internal & External Situation Monitoring & Reporting
Internal and external situation monitoring and reporting was one of the indicators of
situation awareness in the adjusted model. However, 2 of the 3 items used to measure
the indicator were pulled into factor 1 (adaptive capacity) during the factor analysis and
1 of the items was pulled into factor 2 (planning). In addition a further 5 items that were
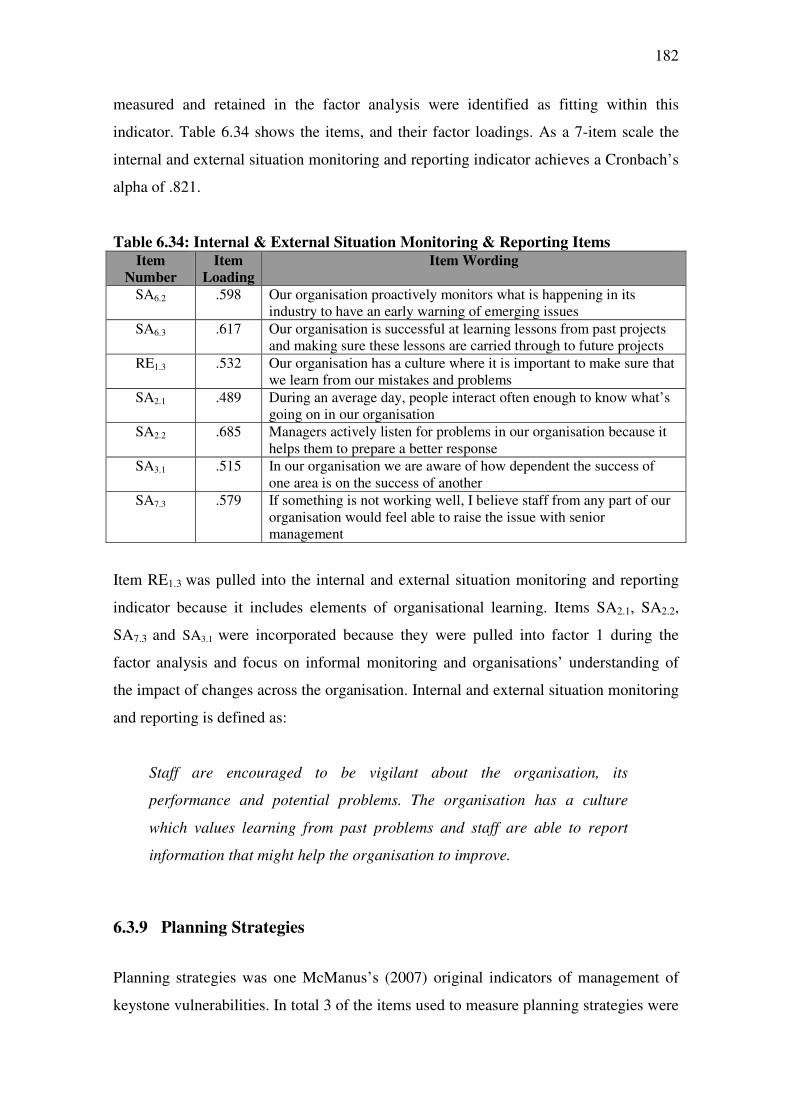
182
measured and retained in the factor analysis were identified as fitting within this
indicator. Table 6.34 shows the items, and their factor loadings. As a 7-item scale the
internal and external situation monitoring and reporting indicator achieves a Cronbach’s
alpha of .821.
Table 6.34: Internal & External Situation Monitoring & Reporting Items
Item
Number
Item
Loading
Item Wording
SA6.2 .598 Our organisation proactively monitors what is happening in its industry to have an early warning of emerging issues
SA6.3 .617 Our organisation is successful at learning lessons from past projects and making sure these lessons are carried through to future projects
RE1.3 .532 Our organisation has a culture where it is important to make sure that we learn from our mistakes and problems
SA2.1 .489 During an average day, people interact often enough to know what’s going on in our organisation
SA2.2 .685 Managers actively listen for problems in our organisation because it helps them to prepare a better response
SA3.1 .515 In our organisation we are aware of how dependent the success of one area is on the success of another
SA7.3 .579 If something is not working well, I believe staff from any part of our organisation would feel able to raise the issue with senior management
Item RE1.3 was pulled into the internal and external situation monitoring and reporting
indicator because it includes elements of organisational learning. Items SA2.1, SA2.2,
SA7.3 and SA3.1 were incorporated because they were pulled into factor 1 during the
factor analysis and focus on informal monitoring and organisations’ understanding of
the impact of changes across the organisation. Internal and external situation monitoring
and reporting is defined as:
Staff are encouraged to be vigilant about the organisation, its
performance and potential problems. The organisation has a culture
which values learning from past problems and staff are able to report
information that might help the organisation to improve.
6.3.9 Planning Strategies
Planning strategies was one McManus’s (2007) original indicators of management of
keystone vulnerabilities. In total 3 of the items used to measure planning strategies were
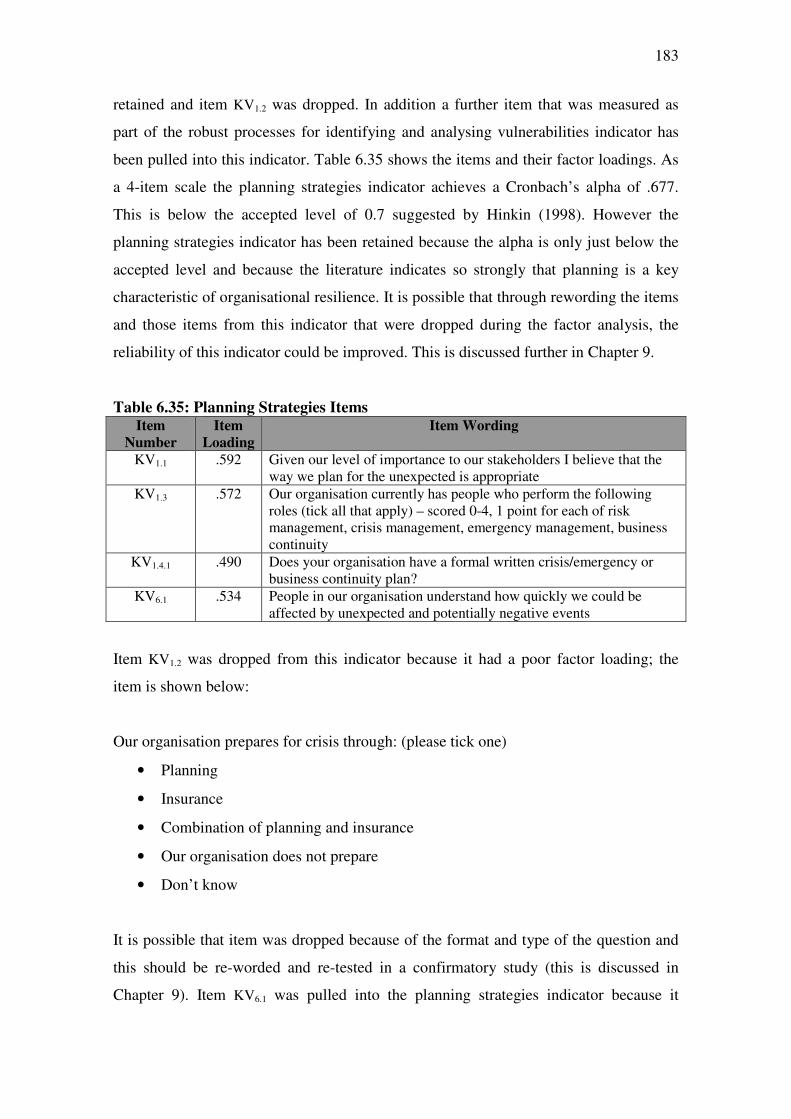
183
retained and item KV1.2 was dropped. In addition a further item that was measured as
part of the robust processes for identifying and analysing vulnerabilities indicator has
been pulled into this indicator. Table 6.35 shows the items and their factor loadings. As
a 4-item scale the planning strategies indicator achieves a Cronbach’s alpha of .677.
This is below the accepted level of 0.7 suggested by Hinkin (1998). However the
planning strategies indicator has been retained because the alpha is only just below the
accepted level and because the literature indicates so strongly that planning is a key
characteristic of organisational resilience. It is possible that through rewording the items
and those items from this indicator that were dropped during the factor analysis, the
reliability of this indicator could be improved. This is discussed further in Chapter 9.
Table 6.35: Planning Strategies Items Item
Number
Item
Loading
Item Wording
KV1.1 .592 Given our level of importance to our stakeholders I believe that the way we plan for the unexpected is appropriate
KV1.3 .572 Our organisation currently has people who perform the following roles (tick all that apply) – scored 0-4, 1 point for each of risk management, crisis management, emergency management, business continuity
KV1.4.1 .490 Does your organisation have a formal written crisis/emergency or business continuity plan?
KV6.1 .534 People in our organisation understand how quickly we could be affected by unexpected and potentially negative events
Item KV1.2 was dropped from this indicator because it had a poor factor loading; the
item is shown below:
Our organisation prepares for crisis through: (please tick one)
• Planning
• Insurance
• Combination of planning and insurance
• Our organisation does not prepare
• Don’t know
It is possible that item was dropped because of the format and type of the question and
this should be re-worded and re-tested in a confirmatory study (this is discussed in
Chapter 9). Item KV6.1 was pulled into the planning strategies indicator because it
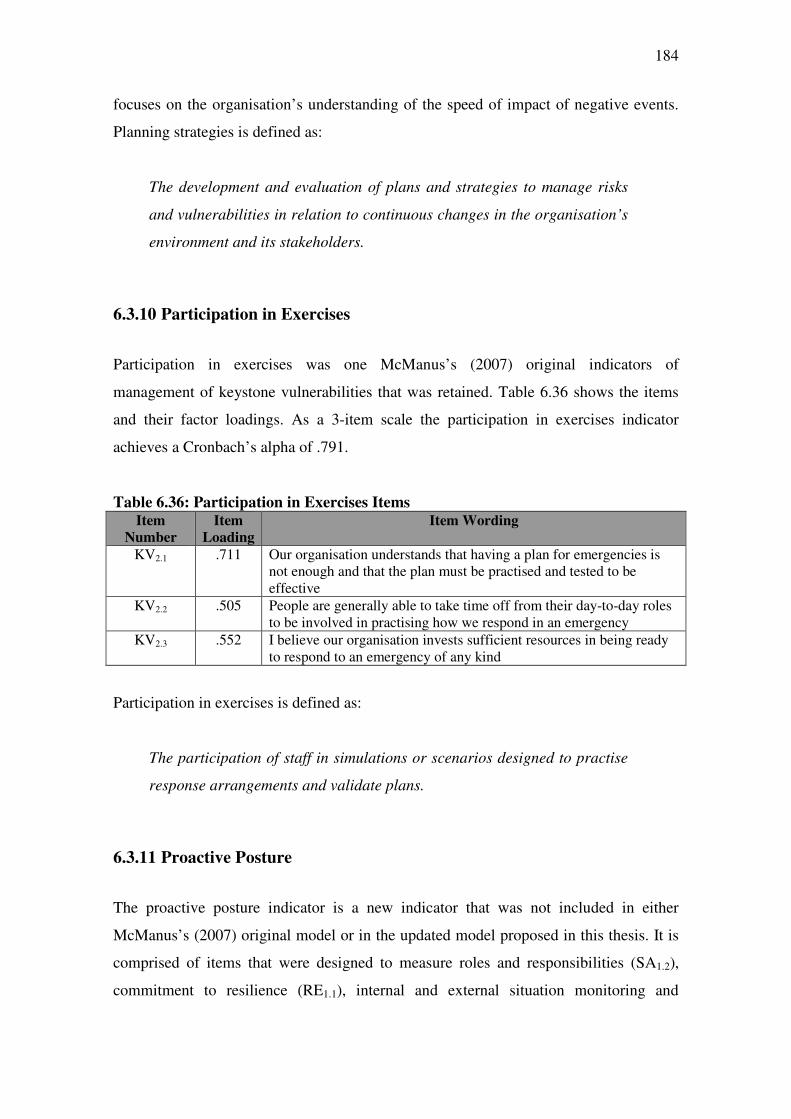
184
focuses on the organisation’s understanding of the speed of impact of negative events.
Planning strategies is defined as:
The development and evaluation of plans and strategies to manage risks
and vulnerabilities in relation to continuous changes in the organisation’s
environment and its stakeholders.
6.3.10 Participation in Exercises
Participation in exercises was one McManus’s (2007) original indicators of
management of keystone vulnerabilities that was retained. Table 6.36 shows the items
and their factor loadings. As a 3-item scale the participation in exercises indicator
achieves a Cronbach’s alpha of .791.
Table 6.36: Participation in Exercises Items Item
Number
Item
Loading
Item Wording
KV2.1 .711 Our organisation understands that having a plan for emergencies is not enough and that the plan must be practised and tested to be effective
KV2.2 .505 People are generally able to take time off from their day-to-day roles to be involved in practising how we respond in an emergency
KV2.3 .552 I believe our organisation invests sufficient resources in being ready to respond to an emergency of any kind
Participation in exercises is defined as:
The participation of staff in simulations or scenarios designed to practise
response arrangements and validate plans.
6.3.11 Proactive Posture
The proactive posture indicator is a new indicator that was not included in either
McManus’s (2007) original model or in the updated model proposed in this thesis. It is
comprised of items that were designed to measure roles and responsibilities (SA1.2),
commitment to resilience (RE1.1), internal and external situation monitoring and
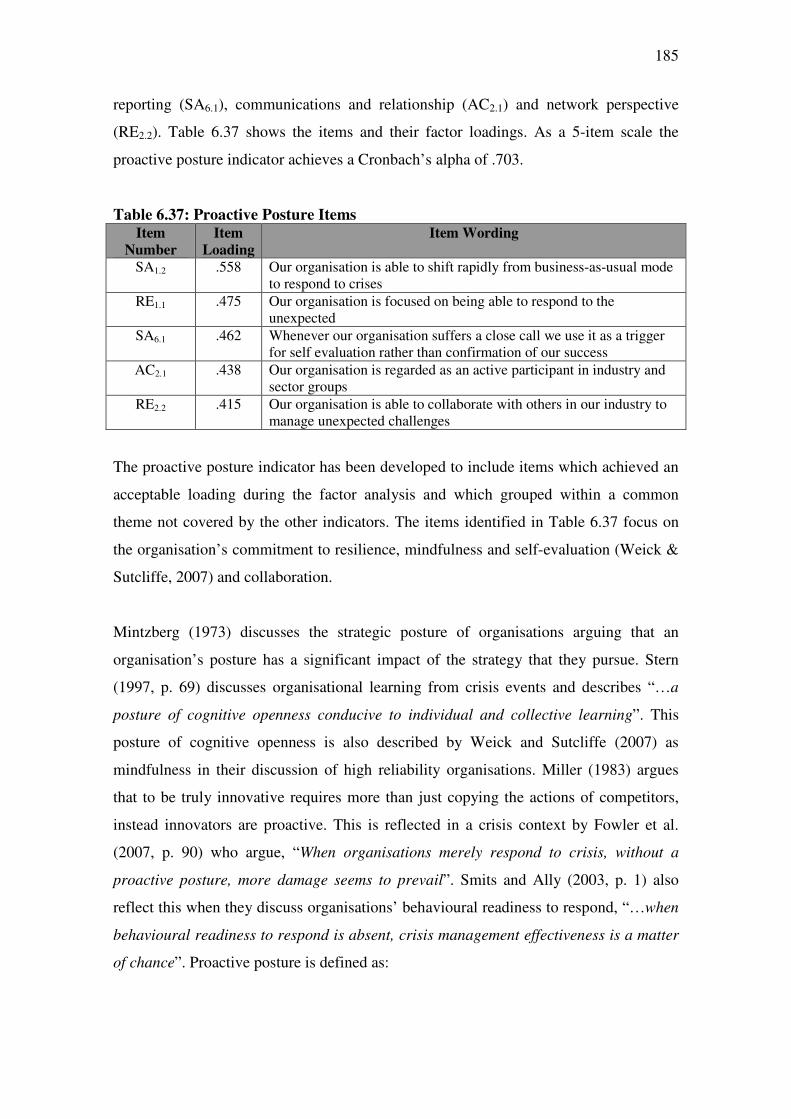
185
reporting (SA6.1), communications and relationship (AC2.1) and network perspective
(RE2.2). Table 6.37 shows the items and their factor loadings. As a 5-item scale the
proactive posture indicator achieves a Cronbach’s alpha of .703.
Table 6.37: Proactive Posture Items Item
Number
Item
Loading
Item Wording
SA1.2 .558 Our organisation is able to shift rapidly from business-as-usual mode to respond to crises
RE1.1 .475 Our organisation is focused on being able to respond to the unexpected
SA6.1 .462 Whenever our organisation suffers a close call we use it as a trigger for self evaluation rather than confirmation of our success
AC2.1 .438 Our organisation is regarded as an active participant in industry and sector groups
RE2.2 .415 Our organisation is able to collaborate with others in our industry to manage unexpected challenges
The proactive posture indicator has been developed to include items which achieved an
acceptable loading during the factor analysis and which grouped within a common
theme not covered by the other indicators. The items identified in Table 6.37 focus on
the organisation’s commitment to resilience, mindfulness and self-evaluation (Weick &
Sutcliffe, 2007) and collaboration.
Mintzberg (1973) discusses the strategic posture of organisations arguing that an
organisation’s posture has a significant impact of the strategy that they pursue. Stern
(1997, p. 69) discusses organisational learning from crisis events and describes “…a
posture of cognitive openness conducive to individual and collective learning”. This
posture of cognitive openness is also described by Weick and Sutcliffe (2007) as
mindfulness in their discussion of high reliability organisations. Miller (1983) argues
that to be truly innovative requires more than just copying the actions of competitors,
instead innovators are proactive. This is reflected in a crisis context by Fowler et al.
(2007, p. 90) who argue, “When organisations merely respond to crisis, without a
proactive posture, more damage seems to prevail”. Smits and Ally (2003, p. 1) also
reflect this when they discuss organisations’ behavioural readiness to respond, “…when
behavioural readiness to respond is absent, crisis management effectiveness is a matter
of chance”. Proactive posture is defined as:
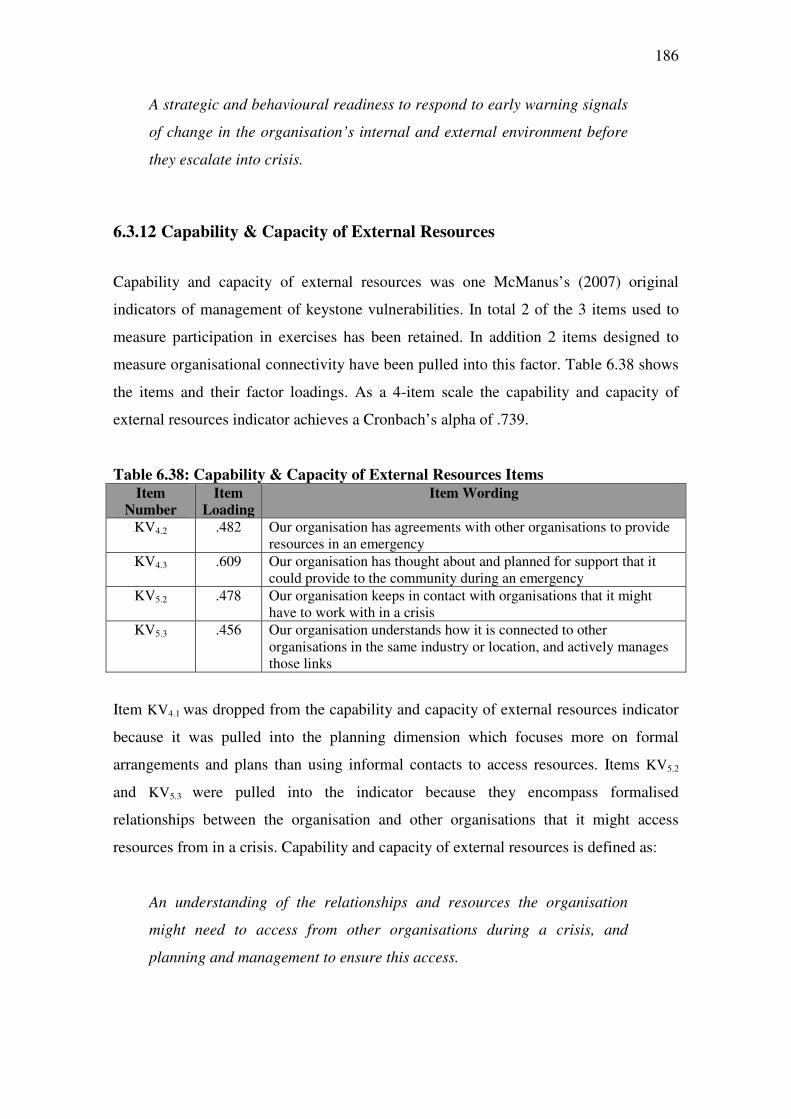
186
A strategic and behavioural readiness to respond to early warning signals
of change in the organisation’s internal and external environment before
they escalate into crisis.
6.3.12 Capability & Capacity of External Resources
Capability and capacity of external resources was one McManus’s (2007) original
indicators of management of keystone vulnerabilities. In total 2 of the 3 items used to
measure participation in exercises has been retained. In addition 2 items designed to
measure organisational connectivity have been pulled into this factor. Table 6.38 shows
the items and their factor loadings. As a 4-item scale the capability and capacity of
external resources indicator achieves a Cronbach’s alpha of .739.
Table 6.38: Capability & Capacity of External Resources Items
Item
Number
Item
Loading
Item Wording
KV4.2 .482 Our organisation has agreements with other organisations to provide resources in an emergency
KV4.3 .609 Our organisation has thought about and planned for support that it could provide to the community during an emergency
KV5.2 .478 Our organisation keeps in contact with organisations that it might have to work with in a crisis
KV5.3 .456 Our organisation understands how it is connected to other organisations in the same industry or location, and actively manages those links
Item KV4.1 was dropped from the capability and capacity of external resources indicator
because it was pulled into the planning dimension which focuses more on formal
arrangements and plans than using informal contacts to access resources. Items KV5.2
and KV5.3 were pulled into the indicator because they encompass formalised
relationships between the organisation and other organisations that it might access
resources from in a crisis. Capability and capacity of external resources is defined as:
An understanding of the relationships and resources the organisation
might need to access from other organisations during a crisis, and
planning and management to ensure this access.
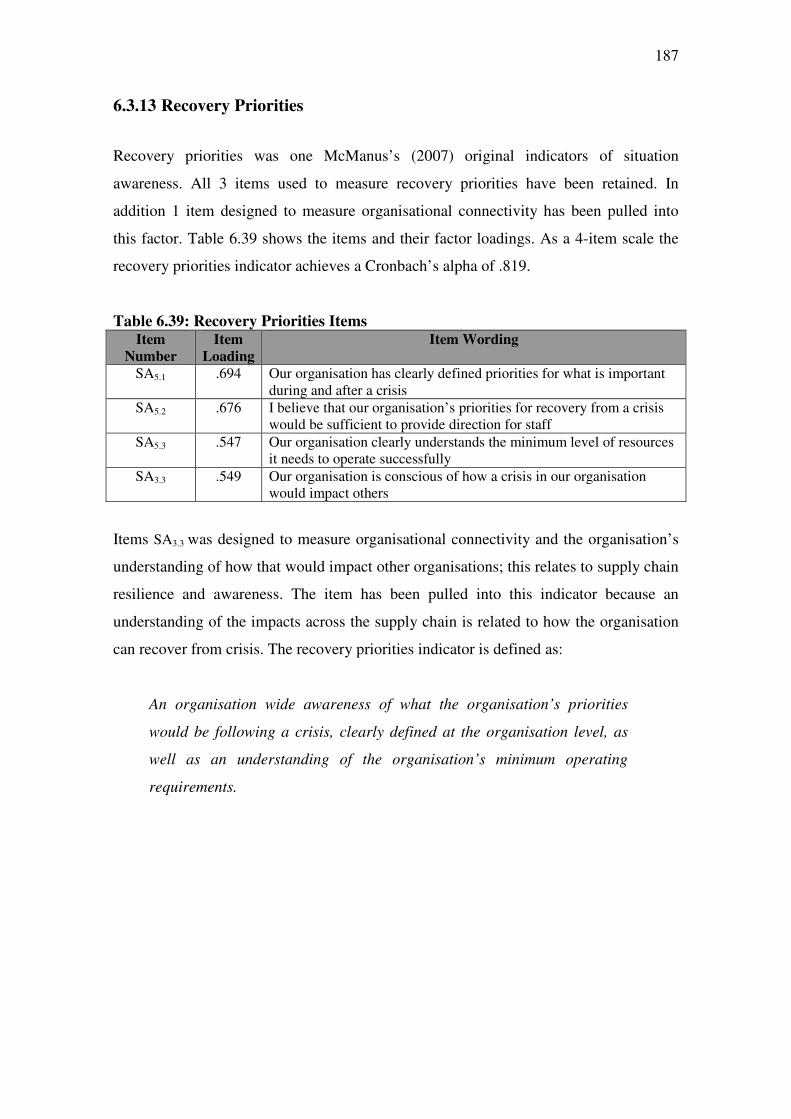
187
6.3.13 Recovery Priorities
Recovery priorities was one McManus’s (2007) original indicators of situation
awareness. All 3 items used to measure recovery priorities have been retained. In
addition 1 item designed to measure organisational connectivity has been pulled into
this factor. Table 6.39 shows the items and their factor loadings. As a 4-item scale the
recovery priorities indicator achieves a Cronbach’s alpha of .819.
Table 6.39: Recovery Priorities Items Item
Number
Item
Loading
Item Wording
SA5.1 .694 Our organisation has clearly defined priorities for what is important during and after a crisis
SA5.2 .676 I believe that our organisation’s priorities for recovery from a crisis would be sufficient to provide direction for staff
SA5.3 .547 Our organisation clearly understands the minimum level of resources it needs to operate successfully
SA3.3 .549 Our organisation is conscious of how a crisis in our organisation would impact others
Items SA3.3 was designed to measure organisational connectivity and the organisation’s
understanding of how that would impact other organisations; this relates to supply chain
resilience and awareness. The item has been pulled into this indicator because an
understanding of the impacts across the supply chain is related to how the organisation
can recover from crisis. The recovery priorities indicator is defined as:
An organisation wide awareness of what the organisation’s priorities
would be following a crisis, clearly defined at the organisation level, as
well as an understanding of the organisation’s minimum operating
requirements.
188
6.4 Evaluating Metrics of Organisational Resilience
This section answers research question 2 which was presented in Section 2.6.
What metrics can be developed to measure the indicators of organisational resilience?
The individual scales discussed in Sections 6.3.1-6.3.13 come together to form the
resilience measurement tool developed through this research. In addition to these scales,
the demographic and organisational performance questions discussed in Chapter 5
enable an organisation to compare their resilience based on industry sector, organisation
size etc.
It is important to provide an estimate of the reliability (internal consistency) of the
adaptive capacity and planning dimensions and of the tool overall. Internal consistency
is an estimate of the reliability of a measure which addresses whether the items are all
measuring the same construct. The idea is that all of the items (within any given
indicator) and all of the indicators (within any given factor) should be measuring the
same construct and should display covariance (Henson, 2001). Table 6.40 provides the
Cronbach’s alpha for the overall resilience measurement tool and the factors as well as
for each of the indicators. Cronbach’s Alpha coefficient ranges from 0-1; a coefficient
of 0.7 or above indicates strong item covariance (Hinkin, 1998, p. 113).
The overall measurement tool and the adaptive capacity and planning factors achieve
very high alphas suggesting that they have strong item covariance (Hinkin, 1998). This
is a very good result indicating the reliability to of tool and means that they vary in
relation to each other and all appear to be measuring the same construct.
Within the planning factor, the planning strategies indicator achieves an alpha which is
just below the 0.7 recommended minimum level. Despite this, the scale has been
retained within the tool because the literature suggests that planning plays a key role in
organisations’ crisis management (Hurley-Hanson, 2006) and resilience (Carthey, et al.,
2001) and (Christopher & Peck, 2004). In this instance it is most likely that while the
items used to measure planning strategies do constitute a unique factor, the items are not
as closely related (Bunderson, et al., 2000). As discussed in Chapter 9, in future
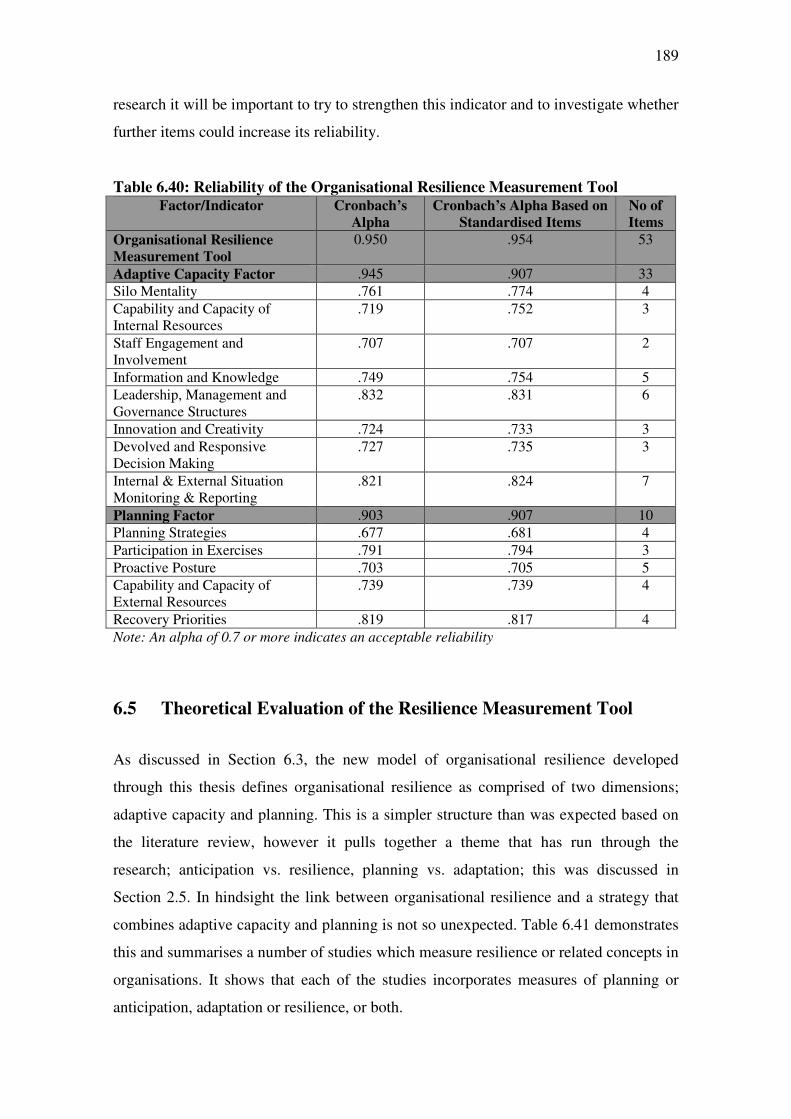
189
research it will be important to try to strengthen this indicator and to investigate whether
further items could increase its reliability.
Table 6.40: Reliability of the Organisational Resilience Measurement Tool
Factor/Indicator Cronbach’s
Alpha
Cronbach’s Alpha Based on
Standardised Items
No of
Items
Organisational Resilience
Measurement Tool
0.950 .954 53
Adaptive Capacity Factor .945 .907 33
Silo Mentality .761 .774 4
Capability and Capacity of Internal Resources
.719 .752 3
Staff Engagement and Involvement
.707 .707 2
Information and Knowledge .749 .754 5
Leadership, Management and Governance Structures
.832 .831 6
Innovation and Creativity .724 .733 3
Devolved and Responsive Decision Making
.727 .735 3
Internal & External Situation Monitoring & Reporting
.821 .824 7
Planning Factor .903 .907 10
Planning Strategies .677 .681 4
Participation in Exercises .791 .794 3
Proactive Posture .703 .705 5
Capability and Capacity of External Resources
.739 .739 4
Recovery Priorities .819 .817 4
Note: An alpha of 0.7 or more indicates an acceptable reliability
6.5 Theoretical Evaluation of the Resilience Measurement Tool
As discussed in Section 6.3, the new model of organisational resilience developed
through this thesis defines organisational resilience as comprised of two dimensions;
adaptive capacity and planning. This is a simpler structure than was expected based on
the literature review, however it pulls together a theme that has run through the
research; anticipation vs. resilience, planning vs. adaptation; this was discussed in
Section 2.5. In hindsight the link between organisational resilience and a strategy that
combines adaptive capacity and planning is not so unexpected. Table 6.41 demonstrates
this and summarises a number of studies which measure resilience or related concepts in
organisations. It shows that each of the studies incorporates measures of planning or
anticipation, adaptation or resilience, or both.
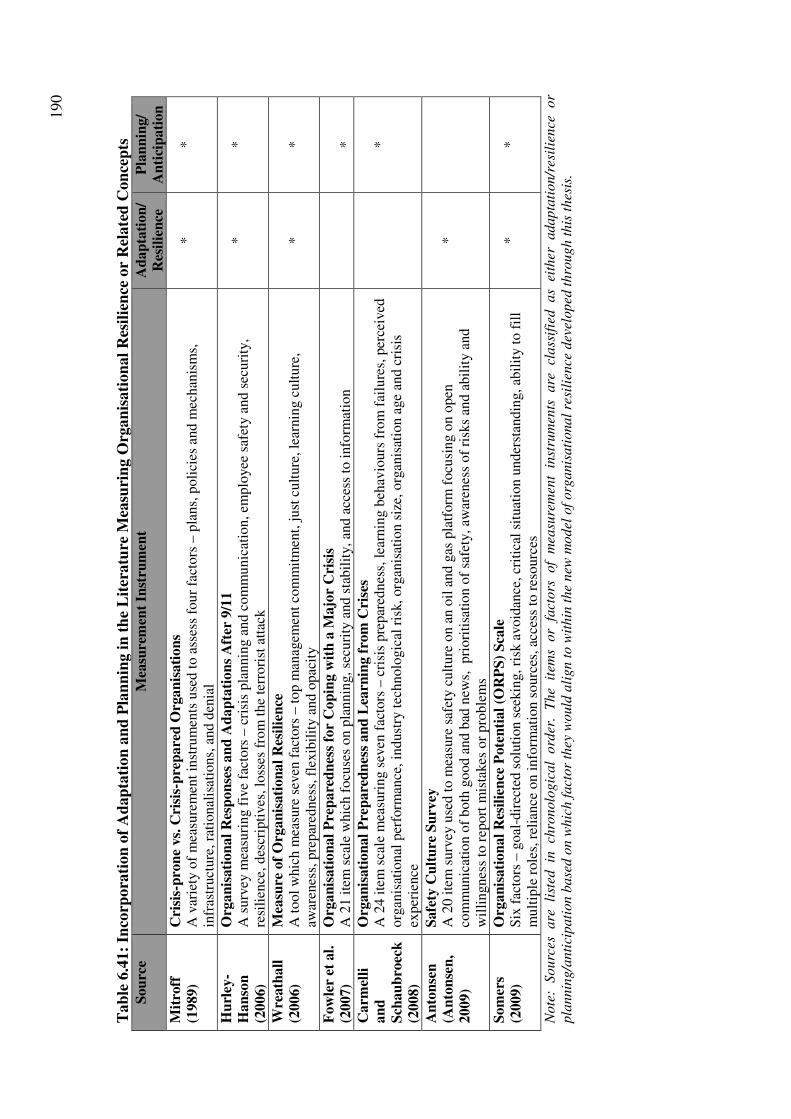
190
Tab
le 6
.41:
Inco
rpora
tion
of
Ad
ap
tati
on
an
d P
lan
nin
g i
n t
he
Lit
eratu
re M
easu
rin
g O
rgan
isati
on
al
Res
ilie
nce
or
Rel
ate
d C
on
cep
ts
Sou
rce
Mea
sure
men
t In
stru
men
t A
dap
tati
on
/
Res
ilie
nce
Pla
nn
ing/
An
tici
pati
on
Mit
roff
(1989)
Cri
sis-
pro
ne
vs.
Cri
sis-
pre
pare
d O
rgan
isati
on
s A
var
iety
of
mea
sure
men
t in
stru
men
ts u
sed t
o a
sses
s fo
ur
fact
ors
– p
lans,
poli
cies
and m
echan
ism
s,
infr
astr
uct
ure
, ra
tional
isat
ions,
and d
enia
l
*
*
Hu
rley
-
Han
son
(2006)
Org
an
isati
on
al
Res
pon
ses
an
d A
dap
tati
on
s A
fter
9/1
1
A s
urv
ey m
easu
ring f
ive
fact
ors
– c
risi
s pla
nnin
g a
nd c
om
munic
atio
n, em
plo
yee
saf
ety a
nd s
ecuri
ty,
resi
lien
ce, des
crip
tives
, lo
sses
fro
m t
he
terr
ori
st a
ttac
k
*
*
Wre
ath
all
(2006)
Mea
sure
of
Org
an
isati
on
al
Res
ilie
nce
A
tool
whic
h m
easu
re s
even
fac
tors
– t
op m
anag
emen
t co
mm
itm
ent,
just
cult
ure
, le
arnin
g c
ult
ure
, aw
aren
ess,
pre
par
ednes
s, f
lexib
ilit
y a
nd o
pac
ity
*
*
Fow
ler
et a
l.
(2007)
Org
an
isati
on
al
Pre
pare
dn
ess
for
Cop
ing w
ith
a M
ajo
r C
risi
s A
21 i
tem
sca
le w
hic
h f
ocu
ses
on p
lannin
g, se
curi
ty a
nd s
tabil
ity, an
d a
cces
s to
info
rmat
ion
*
Carm
elli
an
d
Sch
au
bro
eck
(2008)
Org
an
isati
on
al
Pre
pare
dn
ess
an
d L
earn
ing f
rom
Cri
ses
A 2
4 i
tem
sca
le m
easu
ring s
even
fac
tors
– c
risi
s pre
par
ednes
s, l
earn
ing b
ehav
iours
fro
m f
ailu
res,
per
ceiv
ed
org
anis
atio
nal
per
form
ance
, in
dust
ry t
echnolo
gic
al r
isk, org
anis
atio
n s
ize,
org
anis
atio
n a
ge
and c
risi
s ex
per
ience
*
An
ton
sen
(An
ton
sen
,
2009)
Safe
ty C
ult
ure
Su
rvey
A
20 i
tem
surv
ey u
sed t
o m
easu
re s
afet
y c
ult
ure
on a
n o
il a
nd g
as p
latf
orm
focu
sing o
n o
pen
co
mm
unic
atio
n o
f both
good a
nd b
ad n
ews,
pri
ori
tisa
tion o
f sa
fety
, aw
aren
ess
of
risk
s an
d a
bil
ity a
nd
wil
lingnes
s to
rep
ort
mis
takes
or
pro
ble
ms
*
Som
ers
(2009)
Org
an
isati
on
al
Res
ilie
nce
Pote
nti
al
(OR
PS
) S
cale
S
ix f
acto
rs –
goal
-dir
ecte
d s
olu
tion s
eekin
g, ri
sk a
void
ance
, cr
itic
al s
ituat
ion u
nder
stan
din
g, ab
ilit
y t
o f
ill
mult
iple
role
s, r
elia
nce
on i
nfo
rmat
ion s
ourc
es, ac
cess
to r
esourc
es
*
*
Note
: Sourc
es
are
li
sted
in
ch
ronolo
gic
al
ord
er.
The
item
s or
fact
ors
of
mea
sure
men
t in
stru
men
ts
are
cl
ass
ifie
d
as
eith
er
adapta
tion/r
esil
ience
or
pla
nnin
g/a
nti
cipati
on b
ase
d o
n w
hic
h f
act
or
they
would
ali
gn t
o w
ithin
the
new
model
of
org
anis
ati
onal
resi
lien
ce d
evel
oped
thro
ugh t
his
thes
is.
191
In relation to the strategies observed in the organisations that took part in the Auckland
study conducted through this thesis, different organisations did appear to pursue
different strategies; either anticipation or adaptation. This is discussed in more detail in
Chapter 7.
Gown (1991, p. 443) discusses strategic postures and how “Differences in strategic
posture call for different attitudes and behaviour regarding the tracking of
environmental information”. Here Gown suggests that the different strategic approaches
result in a variety of different behaviours and emphasises a link between strategic
postures and the tracking of environmental information. The hypothesised models of
organisational resilience tested through this thesis incorporated the tracking and
understanding of environmental information within one of the proposed indicators of
situation awareness. During the analysis discussed in Chapter 6, this dimension was not
disregarded, but redistributed between the two remaining dimensions; adaptive capacity
and planning. This again suggests that the theme of anticipation vs. adaptation is central
to organisational resilience. Indicators that were pulled from the situation awareness
dimension into either the adaptive capacity or planning dimension included:
• Adaptive capacity
o Understanding and awareness of hazards and consequences
o Informed decision making
• Planning
o Recovery priorities
In addition some of the indicators were split up, with some items being pulled into
adaptive capacity and some into planning, these included:
• Roles and responsibilities
• Connectivity awareness
• Internal and external situation monitoring and reporting
In the same way the proposed resilience ethos dimension was also redistributed between
the two dimensions. Items referring to organisational culture and learning were pulled
192
into the adaptive capacity dimension and items referring to commitment and
understanding the organisation as part of a network were pulled into the planning
dimension. Through this process each of McManus’s (2007) original dimensions, as
well as the additional dimension of organisational resilience were actually incorporated
into the new model, just within a different factor structure.
6.6 Additional Hypotheses Resilience
This section presents the results and discussion of the additional hypotheses outlined in
Section 4.2.3.
Pearson’s correlation is a measure of the strength of association between two or more
variables, and is used a number of times throughout the following sections. The
correlation produces two pieces of information which are important for evaluating the
strength of the relationship between the two variables; the correlation coefficient, and
the significance.
The correlation coefficient (sometimes referred to as Pearson’s r) is expressed as a
number from -1 to +1, with the extremes representing a strong positive or negative
relationship, and values closer to 0 representing a weaker relationship (Bryman & Bell,
2007). As an example, a strong positive relationship between two variables of 0.847
would indicate that a large amount of the variance in variable A, can be explained by
variable B. The r value can also identify the percentage of variance in A which is
explained by B; this is calculated as r2x100. In the example, this means that Variable B
would explain 72% of the variance in Variable A (0.8472x100).
The significance of the relationship is also an important factor, and indicates the level of
confidence in the relationship that has been demonstrated. This describes how
generalisable the results of the correlation are to the sample population. In this thesis, a
high level of confidence means that the result can be generalised to Auckland
organisations. Confidence levels are represented by a number and the closer that the
number is to 0, the more significant the result. For example a significance of 0.05 means
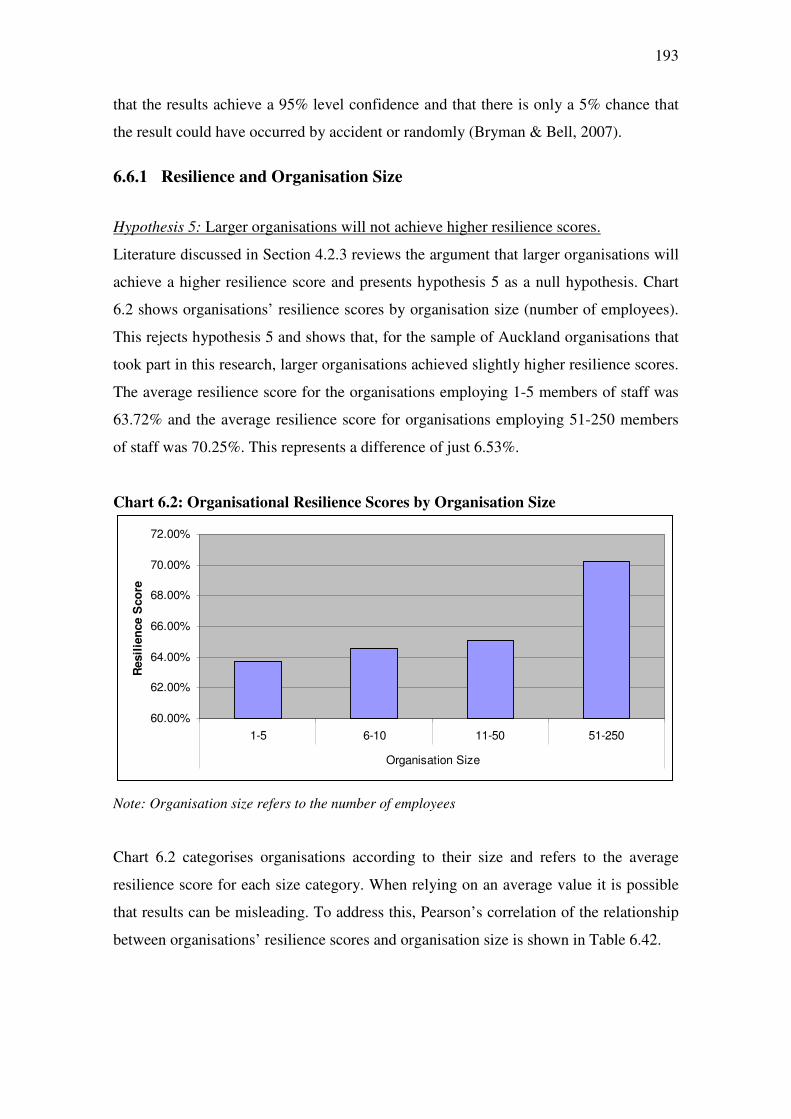
193
that the results achieve a 95% level confidence and that there is only a 5% chance that
the result could have occurred by accident or randomly (Bryman & Bell, 2007).
6.6.1 Resilience and Organisation Size
Hypothesis 5: Larger organisations will not achieve higher resilience scores.
Literature discussed in Section 4.2.3 reviews the argument that larger organisations will
achieve a higher resilience score and presents hypothesis 5 as a null hypothesis. Chart
6.2 shows organisations’ resilience scores by organisation size (number of employees).
This rejects hypothesis 5 and shows that, for the sample of Auckland organisations that
took part in this research, larger organisations achieved slightly higher resilience scores.
The average resilience score for the organisations employing 1-5 members of staff was
63.72% and the average resilience score for organisations employing 51-250 members
of staff was 70.25%. This represents a difference of just 6.53%.
Chart 6.2: Organisational Resilience Scores by Organisation Size
60.00%
62.00%
64.00%
66.00%
68.00%
70.00%
72.00%
1-5 6-10 11-50 51-250
Organisation Size
Resil
ien
ce S
co
re
Note: Organisation size refers to the number of employees
Chart 6.2 categorises organisations according to their size and refers to the average
resilience score for each size category. When relying on an average value it is possible
that results can be misleading. To address this, Pearson’s correlation of the relationship
between organisations’ resilience scores and organisation size is shown in Table 6.42.
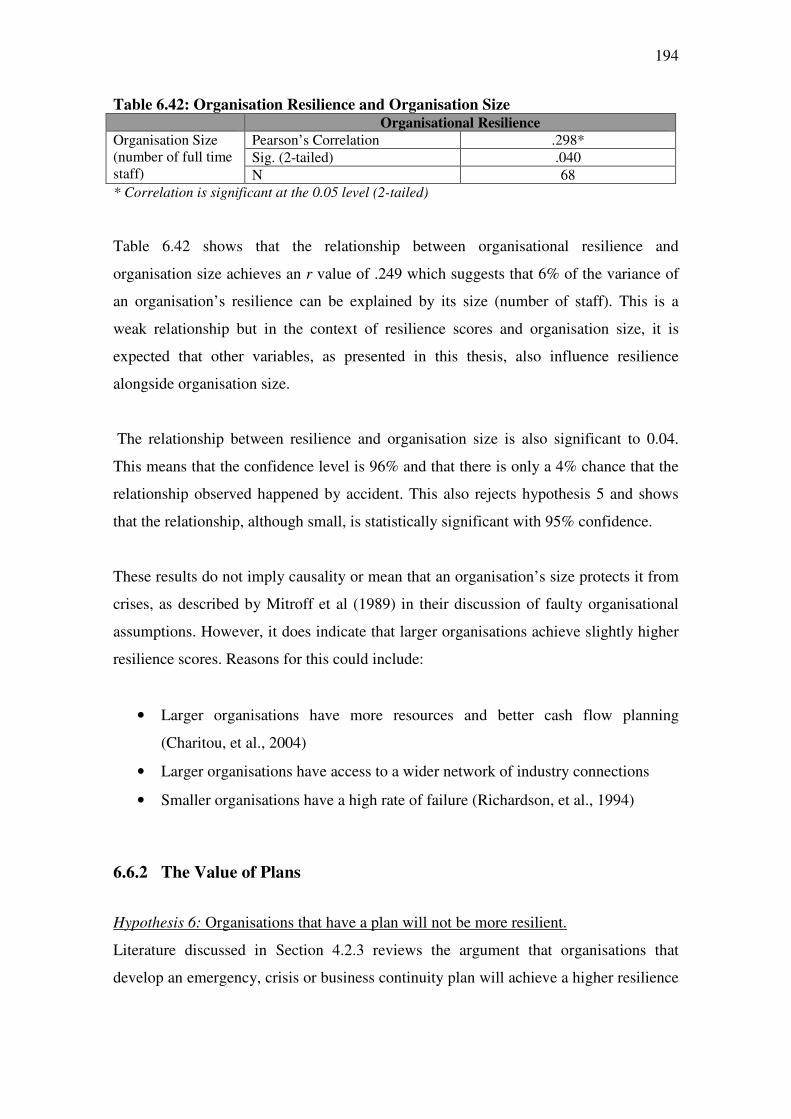
194
Table 6.42: Organisation Resilience and Organisation Size Organisational Resilience
Organisation Size (number of full time staff)
Pearson’s Correlation .298*
Sig. (2-tailed) .040
N 68
* Correlation is significant at the 0.05 level (2-tailed)
Table 6.42 shows that the relationship between organisational resilience and
organisation size achieves an r value of .249 which suggests that 6% of the variance of
an organisation’s resilience can be explained by its size (number of staff). This is a
weak relationship but in the context of resilience scores and organisation size, it is
expected that other variables, as presented in this thesis, also influence resilience
alongside organisation size.
The relationship between resilience and organisation size is also significant to 0.04.
This means that the confidence level is 96% and that there is only a 4% chance that the
relationship observed happened by accident. This also rejects hypothesis 5 and shows
that the relationship, although small, is statistically significant with 95% confidence.
These results do not imply causality or mean that an organisation’s size protects it from
crises, as described by Mitroff et al (1989) in their discussion of faulty organisational
assumptions. However, it does indicate that larger organisations achieve slightly higher
resilience scores. Reasons for this could include:
• Larger organisations have more resources and better cash flow planning
(Charitou, et al., 2004)
• Larger organisations have access to a wider network of industry connections
• Smaller organisations have a high rate of failure (Richardson, et al., 1994)
6.6.2 The Value of Plans
Hypothesis 6: Organisations that have a plan will not be more resilient.
Literature discussed in Section 4.2.3 reviews the argument that organisations that
develop an emergency, crisis or business continuity plan will achieve a higher resilience
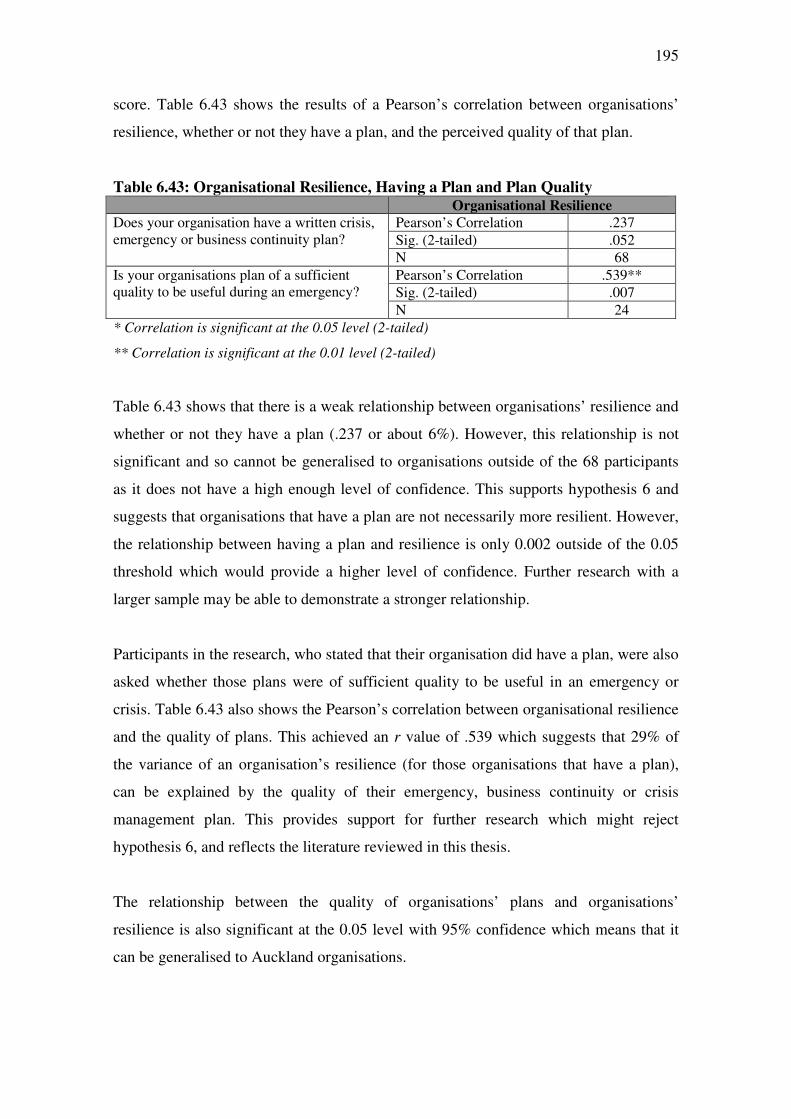
195
score. Table 6.43 shows the results of a Pearson’s correlation between organisations’
resilience, whether or not they have a plan, and the perceived quality of that plan.
Table 6.43: Organisational Resilience, Having a Plan and Plan Quality
Organisational Resilience
Does your organisation have a written crisis, emergency or business continuity plan?
Pearson’s Correlation .237
Sig. (2-tailed) .052
N 68
Is your organisations plan of a sufficient quality to be useful during an emergency?
Pearson’s Correlation .539**
Sig. (2-tailed) .007
N 24
* Correlation is significant at the 0.05 level (2-tailed)
** Correlation is significant at the 0.01 level (2-tailed)
Table 6.43 shows that there is a weak relationship between organisations’ resilience and
whether or not they have a plan (.237 or about 6%). However, this relationship is not
significant and so cannot be generalised to organisations outside of the 68 participants
as it does not have a high enough level of confidence. This supports hypothesis 6 and
suggests that organisations that have a plan are not necessarily more resilient. However,
the relationship between having a plan and resilience is only 0.002 outside of the 0.05
threshold which would provide a higher level of confidence. Further research with a
larger sample may be able to demonstrate a stronger relationship.
Participants in the research, who stated that their organisation did have a plan, were also
asked whether those plans were of sufficient quality to be useful in an emergency or
crisis. Table 6.43 also shows the Pearson’s correlation between organisational resilience
and the quality of plans. This achieved an r value of .539 which suggests that 29% of
the variance of an organisation’s resilience (for those organisations that have a plan),
can be explained by the quality of their emergency, business continuity or crisis
management plan. This provides support for further research which might reject
hypothesis 6, and reflects the literature reviewed in this thesis.
The relationship between the quality of organisations’ plans and organisations’
resilience is also significant at the 0.05 level with 95% confidence which means that it
can be generalised to Auckland organisations.
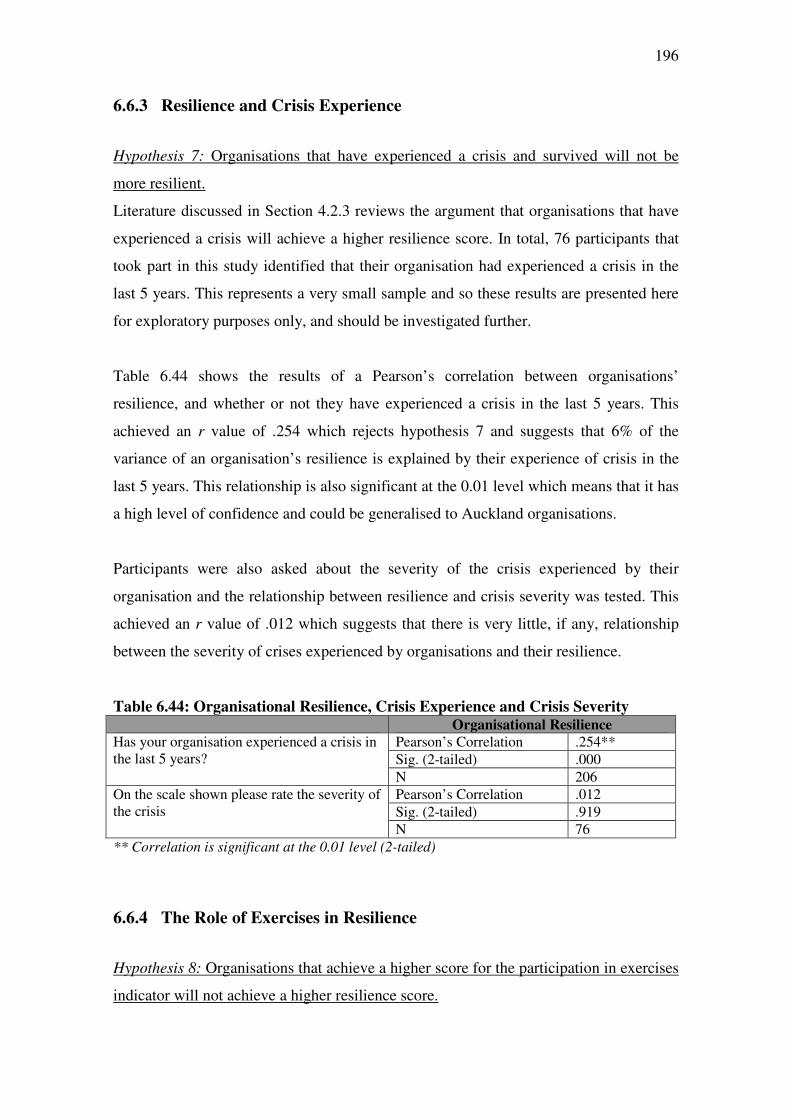
196
6.6.3 Resilience and Crisis Experience
Hypothesis 7: Organisations that have experienced a crisis and survived will not be
more resilient.
Literature discussed in Section 4.2.3 reviews the argument that organisations that have
experienced a crisis will achieve a higher resilience score. In total, 76 participants that
took part in this study identified that their organisation had experienced a crisis in the
last 5 years. This represents a very small sample and so these results are presented here
for exploratory purposes only, and should be investigated further.
Table 6.44 shows the results of a Pearson’s correlation between organisations’
resilience, and whether or not they have experienced a crisis in the last 5 years. This
achieved an r value of .254 which rejects hypothesis 7 and suggests that 6% of the
variance of an organisation’s resilience is explained by their experience of crisis in the
last 5 years. This relationship is also significant at the 0.01 level which means that it has
a high level of confidence and could be generalised to Auckland organisations.
Participants were also asked about the severity of the crisis experienced by their
organisation and the relationship between resilience and crisis severity was tested. This
achieved an r value of .012 which suggests that there is very little, if any, relationship
between the severity of crises experienced by organisations and their resilience.
Table 6.44: Organisational Resilience, Crisis Experience and Crisis Severity Organisational Resilience
Has your organisation experienced a crisis in the last 5 years?
Pearson’s Correlation .254**
Sig. (2-tailed) .000
N 206
On the scale shown please rate the severity of the crisis
Pearson’s Correlation .012
Sig. (2-tailed) .919
N 76
** Correlation is significant at the 0.01 level (2-tailed)
6.6.4 The Role of Exercises in Resilience
Hypothesis 8: Organisations that achieve a higher score for the participation in exercises
indicator will not achieve a higher resilience score.
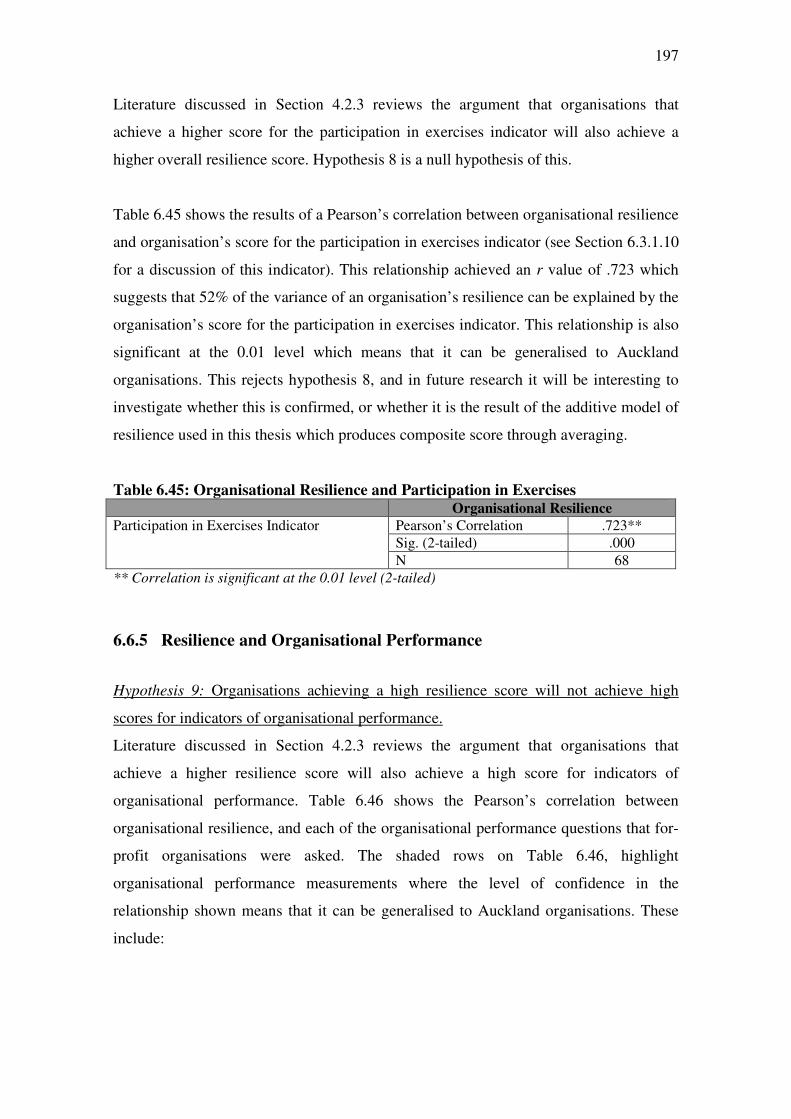
197
Literature discussed in Section 4.2.3 reviews the argument that organisations that
achieve a higher score for the participation in exercises indicator will also achieve a
higher overall resilience score. Hypothesis 8 is a null hypothesis of this.
Table 6.45 shows the results of a Pearson’s correlation between organisational resilience
and organisation’s score for the participation in exercises indicator (see Section 6.3.1.10
for a discussion of this indicator). This relationship achieved an r value of .723 which
suggests that 52% of the variance of an organisation’s resilience can be explained by the
organisation’s score for the participation in exercises indicator. This relationship is also
significant at the 0.01 level which means that it can be generalised to Auckland
organisations. This rejects hypothesis 8, and in future research it will be interesting to
investigate whether this is confirmed, or whether it is the result of the additive model of
resilience used in this thesis which produces composite score through averaging.
Table 6.45: Organisational Resilience and Participation in Exercises Organisational Resilience
Participation in Exercises Indicator Pearson’s Correlation .723**
Sig. (2-tailed) .000
N 68
** Correlation is significant at the 0.01 level (2-tailed)
6.6.5 Resilience and Organisational Performance
Hypothesis 9: Organisations achieving a high resilience score will not achieve high
scores for indicators of organisational performance.
Literature discussed in Section 4.2.3 reviews the argument that organisations that
achieve a higher resilience score will also achieve a high score for indicators of
organisational performance. Table 6.46 shows the Pearson’s correlation between
organisational resilience, and each of the organisational performance questions that for-
profit organisations were asked. The shaded rows on Table 6.46, highlight
organisational performance measurements where the level of confidence in the
relationship shown means that it can be generalised to Auckland organisations. These
include:
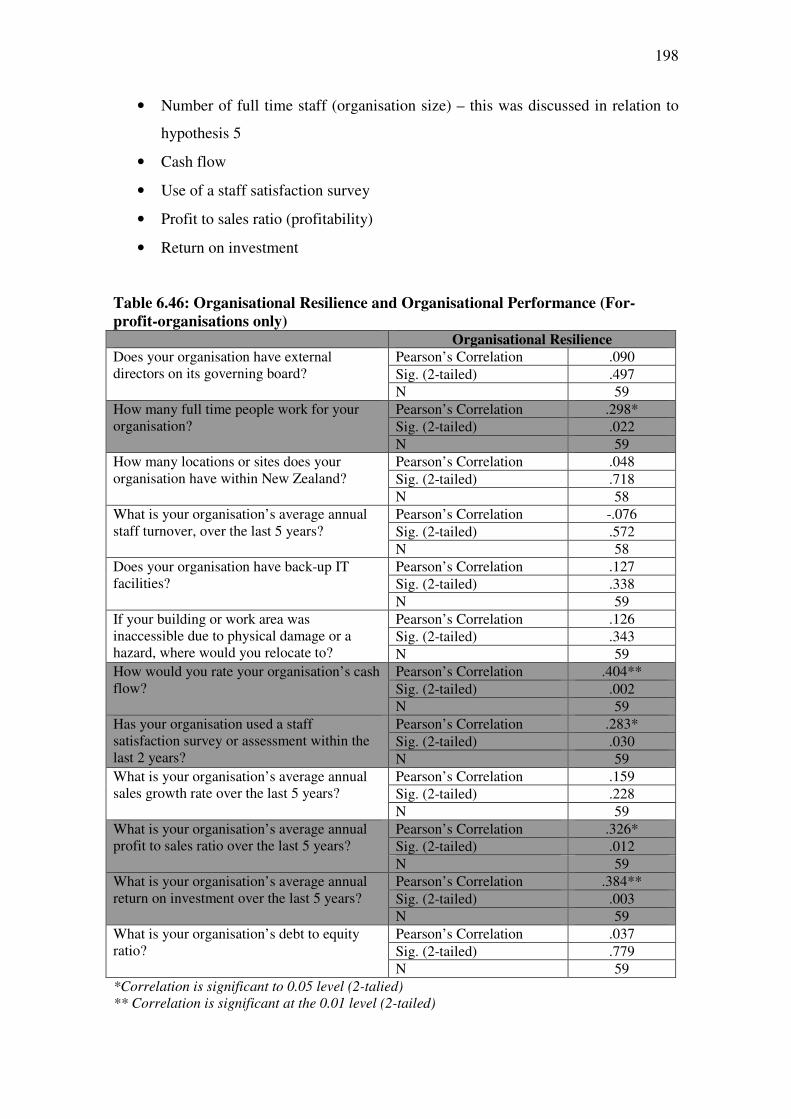
198
• Number of full time staff (organisation size) – this was discussed in relation to
hypothesis 5
• Cash flow
• Use of a staff satisfaction survey
• Profit to sales ratio (profitability)
• Return on investment
Table 6.46: Organisational Resilience and Organisational Performance (For-
profit-organisations only) Organisational Resilience
Does your organisation have external directors on its governing board?
Pearson’s Correlation .090
Sig. (2-tailed) .497
N 59
How many full time people work for your organisation?
Pearson’s Correlation .298*
Sig. (2-tailed) .022
N 59
How many locations or sites does your organisation have within New Zealand?
Pearson’s Correlation .048
Sig. (2-tailed) .718
N 58
What is your organisation’s average annual staff turnover, over the last 5 years?
Pearson’s Correlation -.076
Sig. (2-tailed) .572
N 58
Does your organisation have back-up IT facilities?
Pearson’s Correlation .127
Sig. (2-tailed) .338
N 59
If your building or work area was inaccessible due to physical damage or a hazard, where would you relocate to?
Pearson’s Correlation .126
Sig. (2-tailed) .343
N 59
How would you rate your organisation’s cash flow?
Pearson’s Correlation .404**
Sig. (2-tailed) .002
N 59
Has your organisation used a staff satisfaction survey or assessment within the last 2 years?
Pearson’s Correlation .283*
Sig. (2-tailed) .030
N 59
What is your organisation’s average annual sales growth rate over the last 5 years?
Pearson’s Correlation .159
Sig. (2-tailed) .228
N 59
What is your organisation’s average annual profit to sales ratio over the last 5 years?
Pearson’s Correlation .326*
Sig. (2-tailed) .012
N 59
What is your organisation’s average annual return on investment over the last 5 years?
Pearson’s Correlation .384**
Sig. (2-tailed) .003
N 59
What is your organisation’s debt to equity ratio?
Pearson’s Correlation .037
Sig. (2-tailed) .779
N 59
*Correlation is significant to 0.05 level (2-talied) ** Correlation is significant at the 0.01 level (2-tailed)
199
The relationship between an organisation’s resilience and its cash flow achieved an r
value of .404 which suggests that cash flow explains 16% of the variance of an
organisation’s resilience. The relationship between an organisation’s resilience and its
use of a staff satisfaction survey achieved an r value of .283 which suggests that use of a
staff satisfaction survey explains 8% of the variance of an organisation’s resilience. The
relationship between an organisation’s resilience and its profit to sales ratio achieved an
r value of .326 which suggests that profitability explains 11% of the variance of an
organisation’s resilience. The relationship between an organisation’s resilience and its
return on investment achieved an r value of .384 which suggests that cash flow explains
15% of the variance of an organisation’s resilience.
The r values for these variables are slightly low, but still significant, and the levels of
confidence are very high. It is likely that, given a larger sample, the r values would
increase to further suggest strong links between organisational resilience and cash flow,
profitability and return on investment. This rejects hypothesis 9 and identifies the
indicators of organisational performance, within this sample, that are linked to
organisational resilience. However, it is important to note that all of these relationships
require more investigation to examine the relationship between the r values and sample
size, and that a Pearson’s correlation and its significance do not imply causality.
Alongside the 59 for-profit organisations that took part (1 for-profit organisation failed
to provide results for the organisational performance questions); a further 8 not-for-
profit organisations also took part in the research. Table 6.47 shows the Pearson’s
correlation between organisational resilience and each of the organisational
performance questions that not-for-profit organisations were asked. The shaded row
highlights that there is a very high r value and a high level of confidence for the
relationship between organisational resilience and use of a staff satisfaction survey
within not-for-profit organisations. However, given that only 8 not-for-profit
organisations took part in this study, more research and testing is needed to support an
argument for a significant relationship between organisational resilience and
organisational performance in not-for-profit organisations.
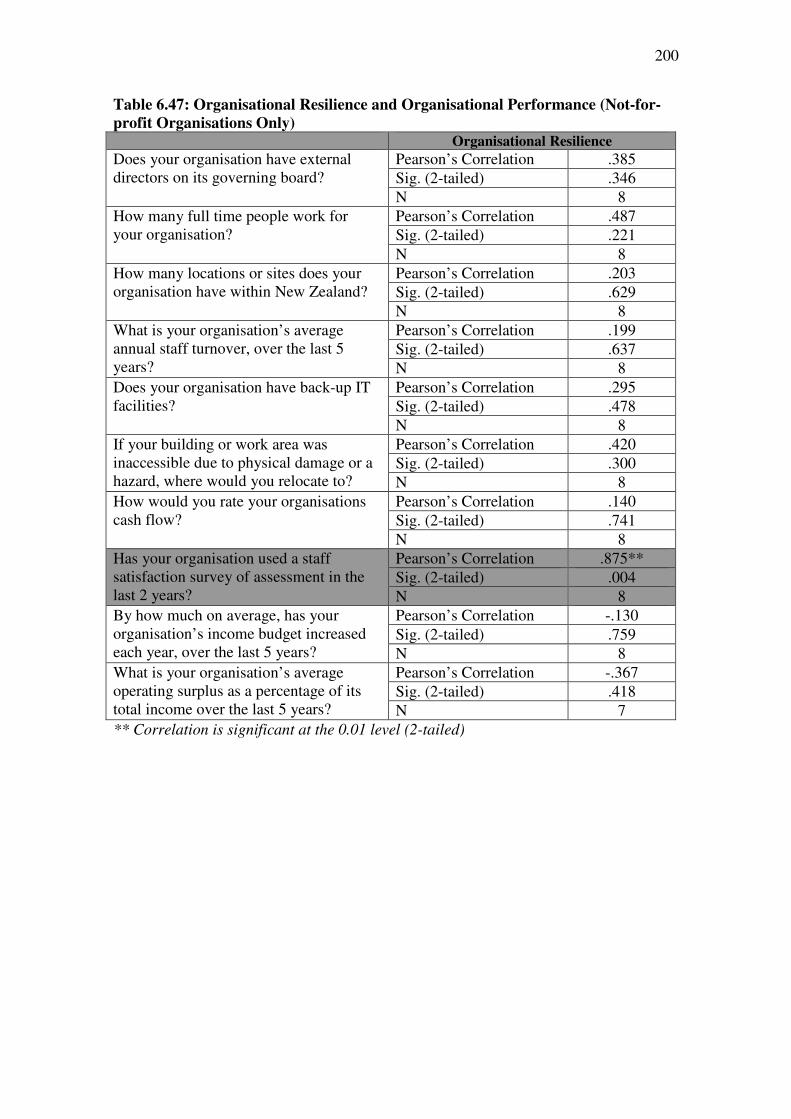
200
Table 6.47: Organisational Resilience and Organisational Performance (Not-for-
profit Organisations Only) Organisational Resilience
Does your organisation have external directors on its governing board?
Pearson’s Correlation .385
Sig. (2-tailed) .346
N 8
How many full time people work for your organisation?
Pearson’s Correlation .487
Sig. (2-tailed) .221
N 8
How many locations or sites does your organisation have within New Zealand?
Pearson’s Correlation .203
Sig. (2-tailed) .629
N 8
What is your organisation’s average annual staff turnover, over the last 5 years?
Pearson’s Correlation .199
Sig. (2-tailed) .637
N 8
Does your organisation have back-up IT facilities?
Pearson’s Correlation .295
Sig. (2-tailed) .478
N 8
If your building or work area was inaccessible due to physical damage or a hazard, where would you relocate to?
Pearson’s Correlation .420
Sig. (2-tailed) .300
N 8
How would you rate your organisations cash flow?
Pearson’s Correlation .140
Sig. (2-tailed) .741
N 8
Has your organisation used a staff satisfaction survey of assessment in the last 2 years?
Pearson’s Correlation .875**
Sig. (2-tailed) .004
N 8
By how much on average, has your organisation’s income budget increased each year, over the last 5 years?
Pearson’s Correlation -.130
Sig. (2-tailed) .759
N 8
What is your organisation’s average operating surplus as a percentage of its total income over the last 5 years?
Pearson’s Correlation -.367
Sig. (2-tailed) .418
N 7
** Correlation is significant at the 0.01 level (2-tailed)
201
Chapter 7 – Evaluating the Resilience of Organisations in
Auckland
This chapter uses the data gathered through the resilience measurement tool to calculate
and evaluate the resilience of the Auckland organisations that took part in the study.
Results are discussed in relation to the resilience of the community of organisations that
took part as a whole, the various industry sectors represented, and the individual
organisations that took part. A discussion of the outputs and usefulness of the tool for
organisations is also included in this chapter.
7.1 Approaches to Resilience
As discussed in Section 6.3 the new model of organisational resilience developed
through this thesis suggests that organisational resilience is comprised of 2 dimensions,
adaptive capacity and planning. Chart 7.3 shows organisations’ approach to resilience
by industry sector, i.e. whether industry sectors focus more heavily on adaptive capacity
or planning. It shows that the majority of industry sectors focus more heavily on their
adaptive capacity than on formal planning activities. The exception to this is the health
and community sector that focus much more heavily on planning than any other sector
and yet still achieve high adaptive capacity scores. Chart 7.4 shows organisations’
approach to resilience by organisation size, i.e. whether different size organisations
focus more heavily on adaptive capacity or planning. It shows that the largest
organisations focus more heavily on planning than smaller organisations.
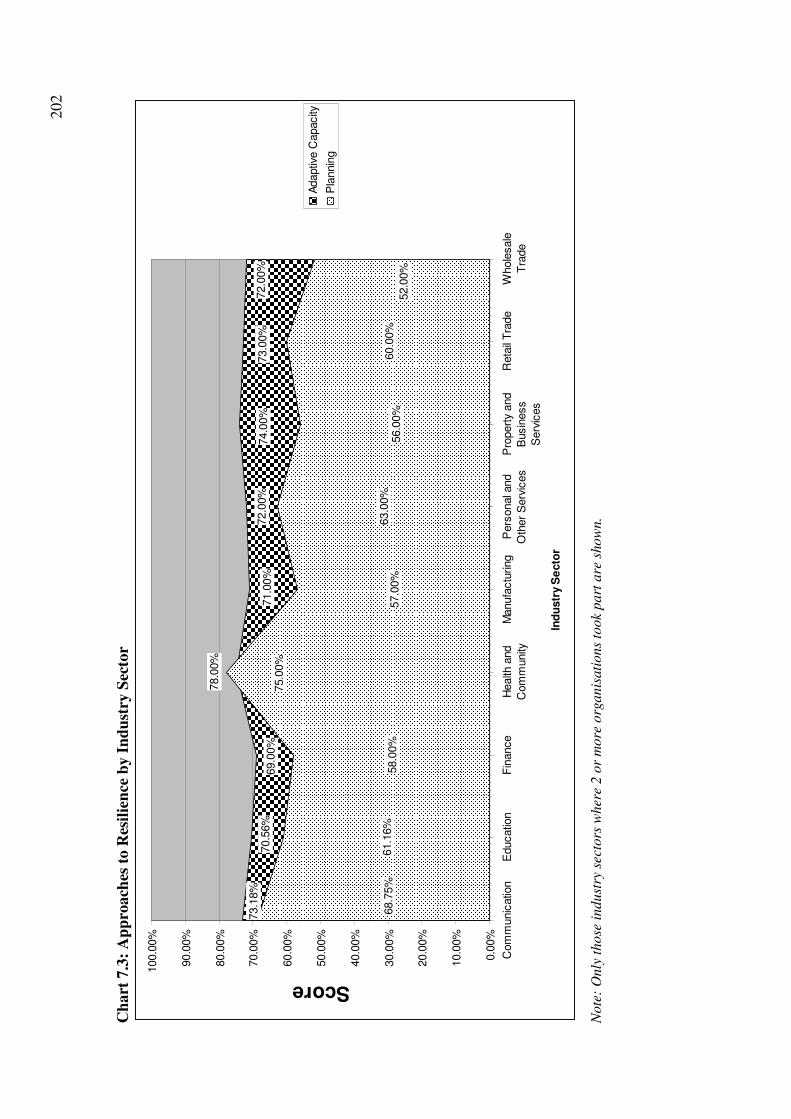
202
Ch
art
7.3
: A
pp
roach
es t
o R
esil
ien
ce b
y I
nd
ust
ry S
ecto
r
58.0
0%
57.0
0%
63.0
0%
56.0
0%
60.0
0%
73.1
8%
70.5
6%
69.0
0%
75.0
0%
71.0
0%
72.0
0%
74.0
0%
73.0
0%
72.0
0%
52.0
0%
61.1
6%
68.7
5%
78.0
0%
0.0
0%
10.0
0%
20.0
0%
30.0
0%
40.0
0%
50.0
0%
60.0
0%
70.0
0%
80.0
0%
90.0
0%
100.0
0%
Com
munic
atio
nE
ducatio
nF
inance
Health
and
Com
munity
Manufa
ctu
ring
Pers
onal a
nd
Oth
er
Serv
ices
Pro
pert
y and
Busin
ess
Serv
ices
Reta
il T
rade
Whole
sale
Tra
de
Ind
ustr
y S
ecto
r
Score
Adaptiv
e C
apacity
Pla
nnin
g
Note
: O
nly
those
indust
ry s
ecto
rs w
her
e 2 o
r m
ore
org
anis
ati
ons
took
part
are
show
n.
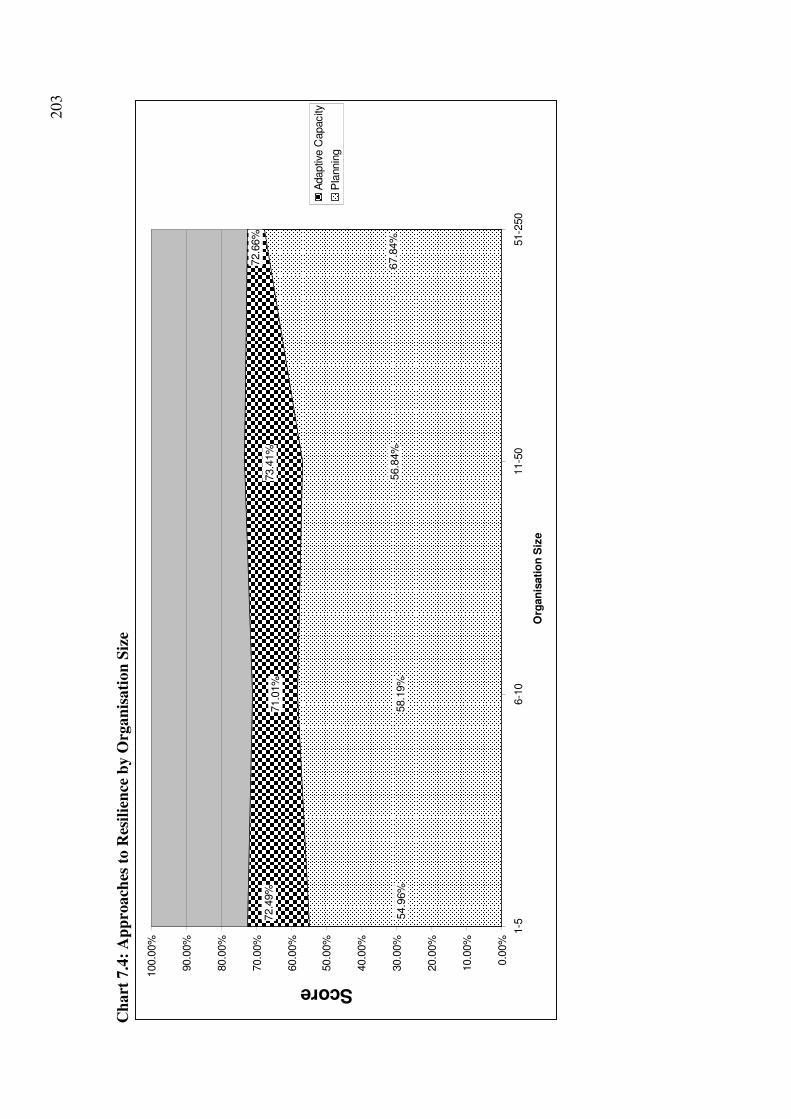
203
Ch
art
7.4
: A
pp
roach
es t
o R
esil
ien
ce b
y O
rgan
isati
on
Siz
e
58.1
9%
72.4
9%
71.0
1%
72.6
6%
73.4
1%
54.9
6%
56.8
4%
67.8
4%
0.0
0%
10.0
0%
20.0
0%
30.0
0%
40.0
0%
50.0
0%
60.0
0%
70.0
0%
80.0
0%
90.0
0%
100.0
0%
1-5
6-1
011-5
051-2
50
Org
an
isati
on
Siz
e
Score
Adaptiv
e C
apacity
Pla
nnin
g
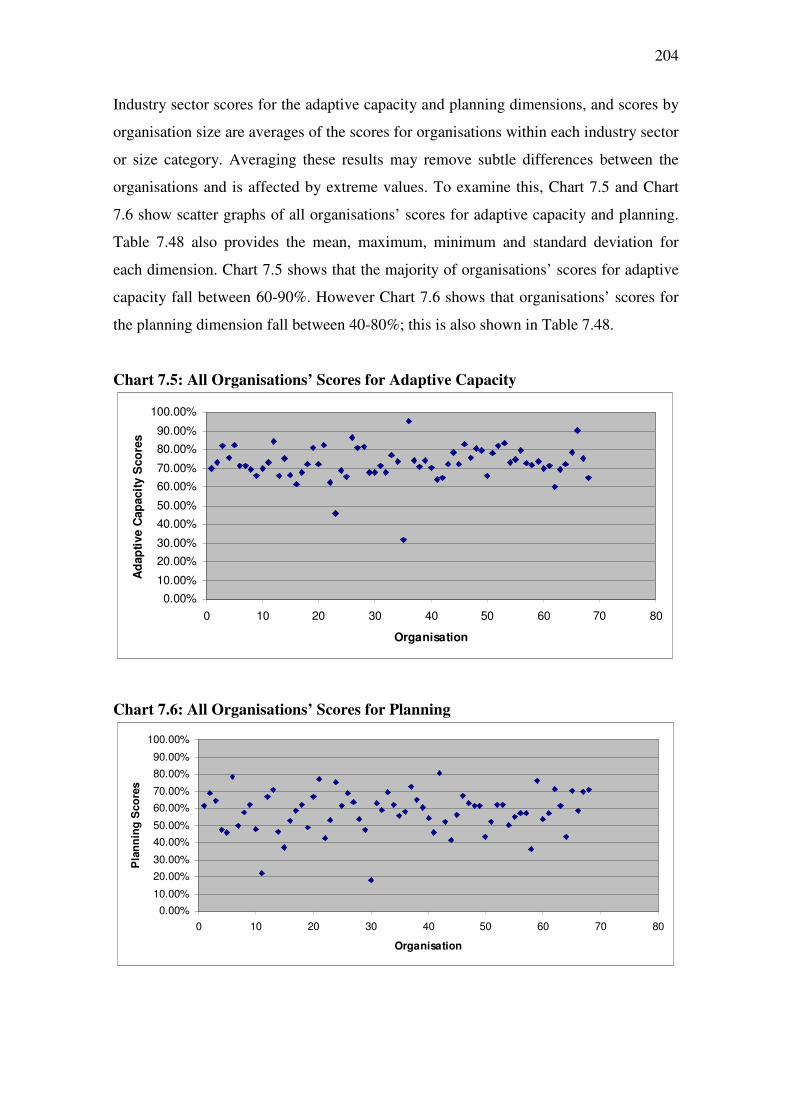
204
Industry sector scores for the adaptive capacity and planning dimensions, and scores by
organisation size are averages of the scores for organisations within each industry sector
or size category. Averaging these results may remove subtle differences between the
organisations and is affected by extreme values. To examine this, Chart 7.5 and Chart
7.6 show scatter graphs of all organisations’ scores for adaptive capacity and planning.
Table 7.48 also provides the mean, maximum, minimum and standard deviation for
each dimension. Chart 7.5 shows that the majority of organisations’ scores for adaptive
capacity fall between 60-90%. However Chart 7.6 shows that organisations’ scores for
the planning dimension fall between 40-80%; this is also shown in Table 7.48.
Chart 7.5: All Organisations’ Scores for Adaptive Capacity
0.00%
10.00%
20.00%
30.00%
40.00%
50.00%
60.00%
70.00%
80.00%
90.00%
100.00%
0 10 20 30 40 50 60 70 80
Organisation
Ad
ap
tive C
ap
acit
y S
co
res
Chart 7.6: All Organisations’ Scores for Planning
0.00%
10.00%
20.00%
30.00%
40.00%
50.00%
60.00%
70.00%
80.00%
90.00%
100.00%
0 10 20 30 40 50 60 70 80
Organisation
Pla
nn
ing
Sco
res
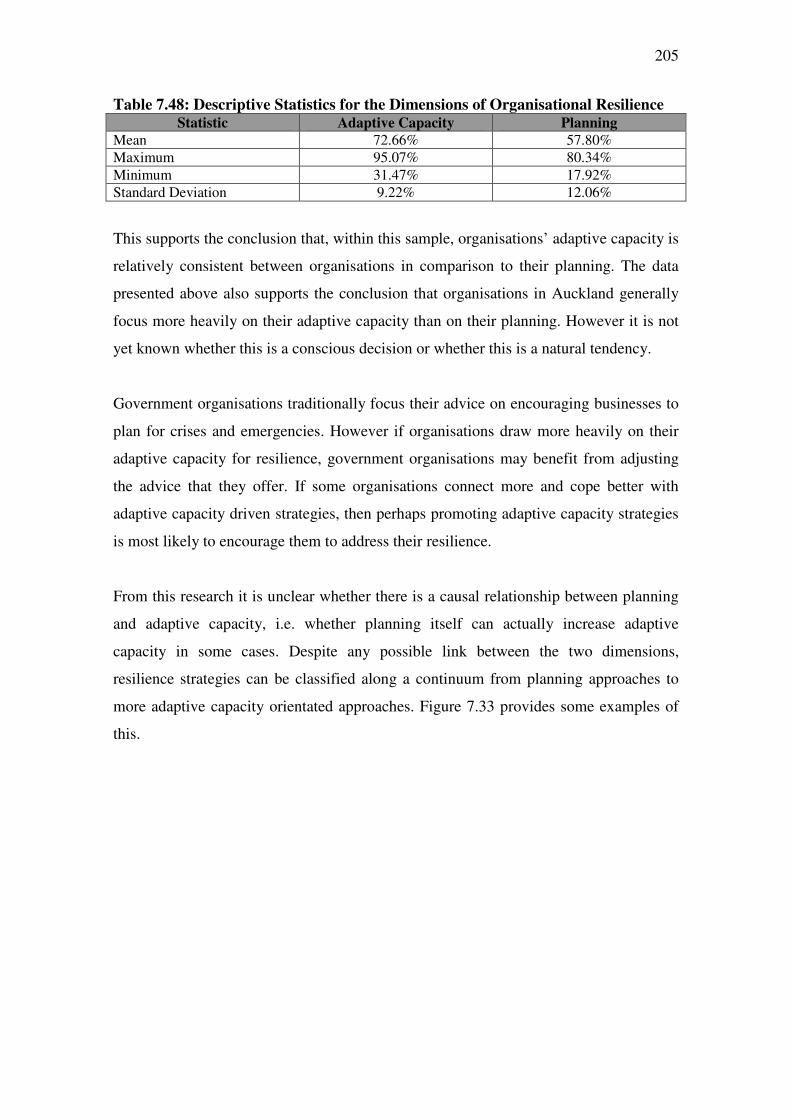
205
Table 7.48: Descriptive Statistics for the Dimensions of Organisational Resilience Statistic Adaptive Capacity Planning
Mean 72.66% 57.80%
Maximum 95.07% 80.34%
Minimum 31.47% 17.92%
Standard Deviation 9.22% 12.06%
This supports the conclusion that, within this sample, organisations’ adaptive capacity is
relatively consistent between organisations in comparison to their planning. The data
presented above also supports the conclusion that organisations in Auckland generally
focus more heavily on their adaptive capacity than on their planning. However it is not
yet known whether this is a conscious decision or whether this is a natural tendency.
Government organisations traditionally focus their advice on encouraging businesses to
plan for crises and emergencies. However if organisations draw more heavily on their
adaptive capacity for resilience, government organisations may benefit from adjusting
the advice that they offer. If some organisations connect more and cope better with
adaptive capacity driven strategies, then perhaps promoting adaptive capacity strategies
is most likely to encourage them to address their resilience.
From this research it is unclear whether there is a causal relationship between planning
and adaptive capacity, i.e. whether planning itself can actually increase adaptive
capacity in some cases. Despite any possible link between the two dimensions,
resilience strategies can be classified along a continuum from planning approaches to
more adaptive capacity orientated approaches. Figure 7.33 provides some examples of
this.
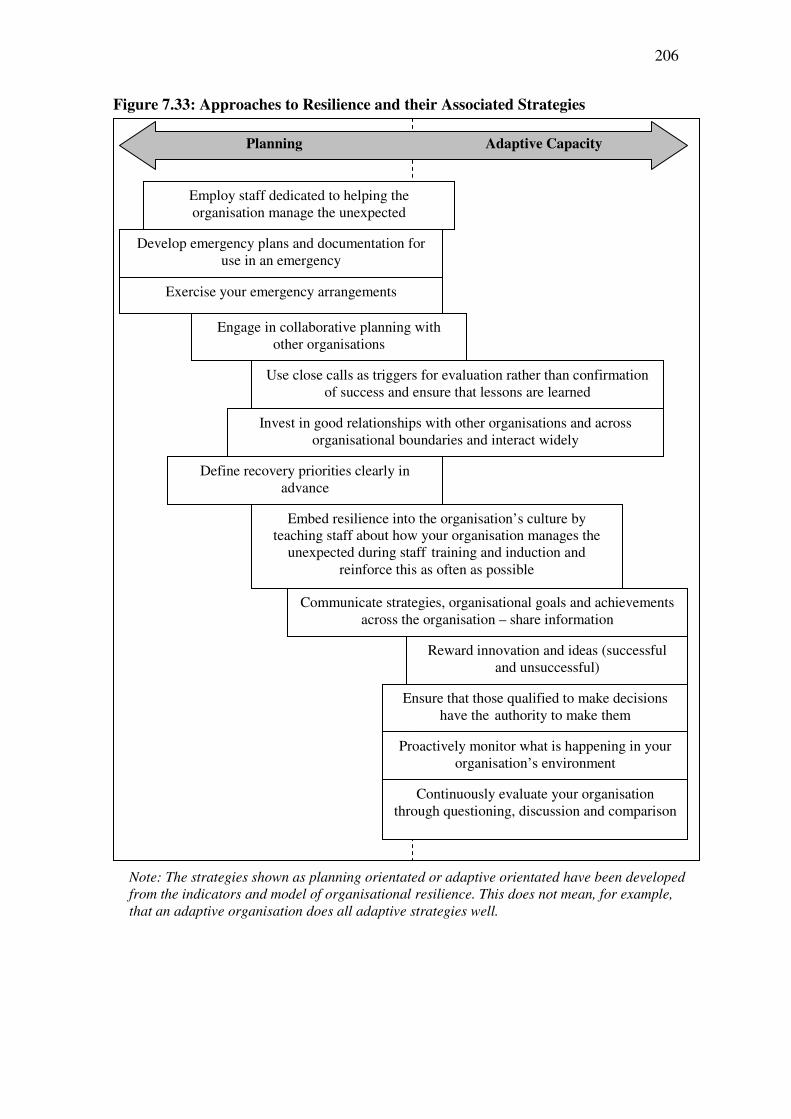
206
Figure 7.33: Approaches to Resilience and their Associated Strategies
Planning Adaptive Capacity
Embed resilience into the organisation’s culture by teaching staff about how your organisation manages the
unexpected during staff training and induction and reinforce this as often as possible
Exercise your emergency arrangements
Employ staff dedicated to helping the organisation manage the unexpected
Develop emergency plans and documentation for use in an emergency
Engage in collaborative planning with other organisations
Use close calls as triggers for evaluation rather than confirmation of success and ensure that lessons are learned
Define recovery priorities clearly in advance
Invest in good relationships with other organisations and across organisational boundaries and interact widely
Note: The strategies shown as planning orientated or adaptive orientated have been developed from the indicators and model of organisational resilience. This does not mean, for example, that an adaptive organisation does all adaptive strategies well.
Communicate strategies, organisational goals and achievements across the organisation – share information
Reward innovation and ideas (successful and unsuccessful)
Ensure that those qualified to make decisions have the authority to make them
Proactively monitor what is happening in your organisation’s environment
Continuously evaluate your organisation through questioning, discussion and comparison
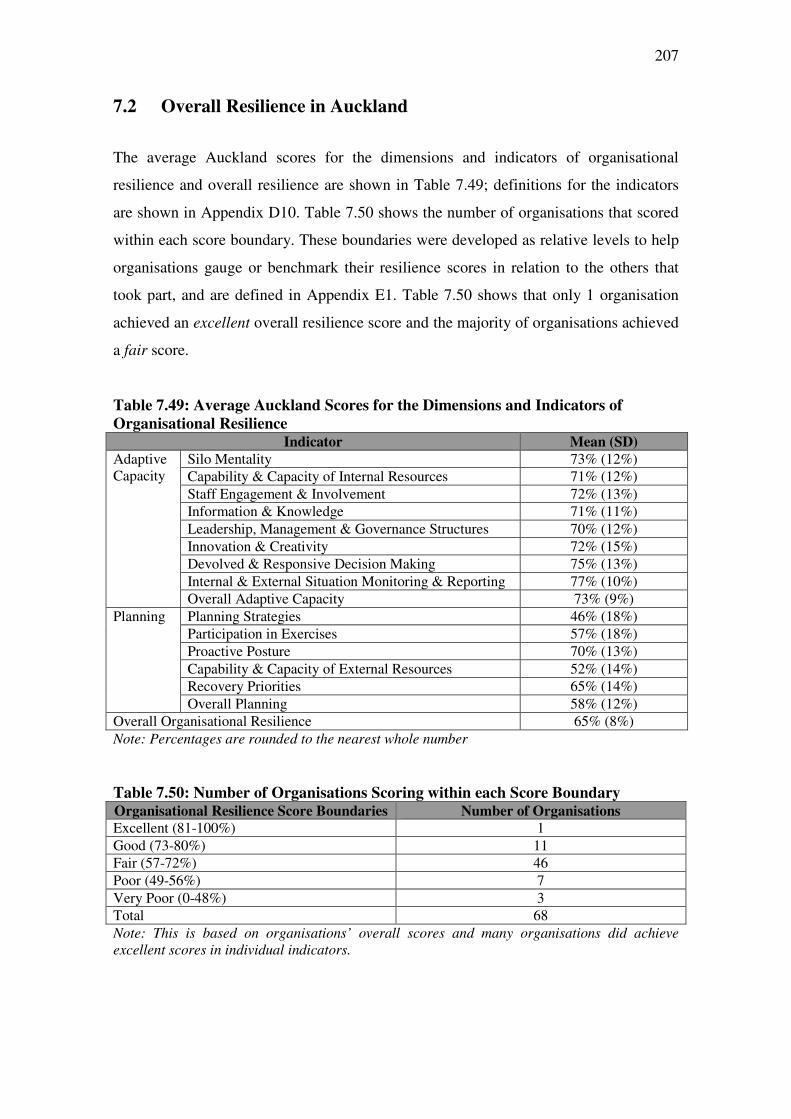
207
7.2 Overall Resilience in Auckland
The average Auckland scores for the dimensions and indicators of organisational
resilience and overall resilience are shown in Table 7.49; definitions for the indicators
are shown in Appendix D10. Table 7.50 shows the number of organisations that scored
within each score boundary. These boundaries were developed as relative levels to help
organisations gauge or benchmark their resilience scores in relation to the others that
took part, and are defined in Appendix E1. Table 7.50 shows that only 1 organisation
achieved an excellent overall resilience score and the majority of organisations achieved
a fair score.
Table 7.49: Average Auckland Scores for the Dimensions and Indicators of
Organisational Resilience Indicator Mean (SD)
Adaptive Capacity
Silo Mentality 73% (12%)
Capability & Capacity of Internal Resources 71% (12%)
Staff Engagement & Involvement 72% (13%)
Information & Knowledge 71% (11%)
Leadership, Management & Governance Structures 70% (12%)
Innovation & Creativity 72% (15%)
Devolved & Responsive Decision Making 75% (13%)
Internal & External Situation Monitoring & Reporting 77% (10%)
Overall Adaptive Capacity 73% (9%)
Planning Planning Strategies 46% (18%)
Participation in Exercises 57% (18%)
Proactive Posture 70% (13%)
Capability & Capacity of External Resources 52% (14%)
Recovery Priorities 65% (14%)
Overall Planning 58% (12%)
Overall Organisational Resilience 65% (8%)
Note: Percentages are rounded to the nearest whole number
Table 7.50: Number of Organisations Scoring within each Score Boundary Organisational Resilience Score Boundaries Number of Organisations
Excellent (81-100%) 1
Good (73-80%) 11
Fair (57-72%) 46
Poor (49-56%) 7
Very Poor (0-48%) 3
Total 68
Note: This is based on organisations’ overall scores and many organisations did achieve excellent scores in individual indicators.
208
7.2.1 Resilience Strengths in Auckland
Two particular strengths which came out in the overall Auckland results were internal
and external situation monitoring and reporting (77%), and devolved and responsive
decision making (75%).
The internal and external situation monitoring and reporting indicator is designed
to measure how an organisation learns about the world around it. This could include
market research, evaluation of competitors, political and regulatory awareness, and
financial trends. Through monitoring internal and external environments, organisations
can pick up on weak signals. Weak signals are the early warning signals that occur as a
crisis begins to evolve. The signals are referred to as weak because they can often be
misinterpreted or overlooked. These signals are often picked up by ‘front line’ staff but
are rarely reported and this can lead to a crisis developing undetected. Mitroff (2001, p.
102) describes this and notes,
“…in many cases, the signals are weak and filled with noise. Nonetheless,
it usually turns out that there is at least one person in every organisation
who knows about an impending crisis. The problem is that those who often
know most about it are the ones who have the least power to bring it to the
attention of the organisation”.
Here Mitroff emphasises not only the importance of detecting the signals but also of
importance of enabling the organisation to distribute and share that information. Within
the Auckland organisations taking part in this study, the ability to monitor the business
environment and report critical information is a particular strength. To maintain this
strength it is important that organisations prioritise environmental and business
landscape scanning and that all staff are encouraged (and rewarded) to report potentially
critical information.
The devolved and responsive decision making indicator is designed to measure how
flexible the decision making structure and process is within an organisation. This
flexibility and responsiveness plays a key role in the organisations adaptive capacity.
Weick and Sutcliffe (2007) refer to this as deference to expertise and argue that the
209
person most qualified to make a decision should make it regardless of seniority. Bigley
and Roberts (2001) discuss a fire department and describe how an incident command
structure enables firemen to oscillate between pre-planned and improvised responses
during crisis situations. Devolved and responsive decision making that is applicable to
both crisis and business-as-usual situations works in the same way. During business-as-
usual, controls on decision making may be more centralised and hierarchical. However
once the organisation moves into ‘crisis mode’ the decision making structure should
morph into one which clarifies which ‘experts’ (this could include front line staff)
should be involved in that decision making based on expertise and knowledge rather
than rank. This flexible decision making structure is then a tool which the organisation
can use under a variety of different circumstances such as responding to rapid market
changes, or addressing systemic problems in organisations’ customer relations.
7.2.2 Resilience Weaknesses in Auckland
Two particular weaknesses which came out in the overall Auckland results were
planning strategies (46%) and capability and capacity of external resources (52%).
Of the 68 organisations that took part in this study, 53 scored poorly or very poorly on
the planning strategies indicator; the Auckland average for this indicator is 46% (very
poor). The planning strategies indicator is designed to measure how an organisation
plans for crises and the approach taken to this planning. Questions relating to this
indicator focus on whether or not organisations have an emergency, crisis or business
continuity plan and the quality of plans, as well as their general approach to planning.
Organisations also scored poorly on capability and capacity of external resources
with only 3 organisations scoring good or excellent. This indicator is designed to
measure organisations’ ability to access and mobilise resources from outside of their
organisation in the event of a crisis. Questions relating to this indicator focus on the
ability of staff to access external resources, whether or not the organisation has
agreements in place which will facilitate access or sharing of resources between
organisations, and whether or not an organisation sees itself as a source of resources for
the community during and immediately after a crisis.
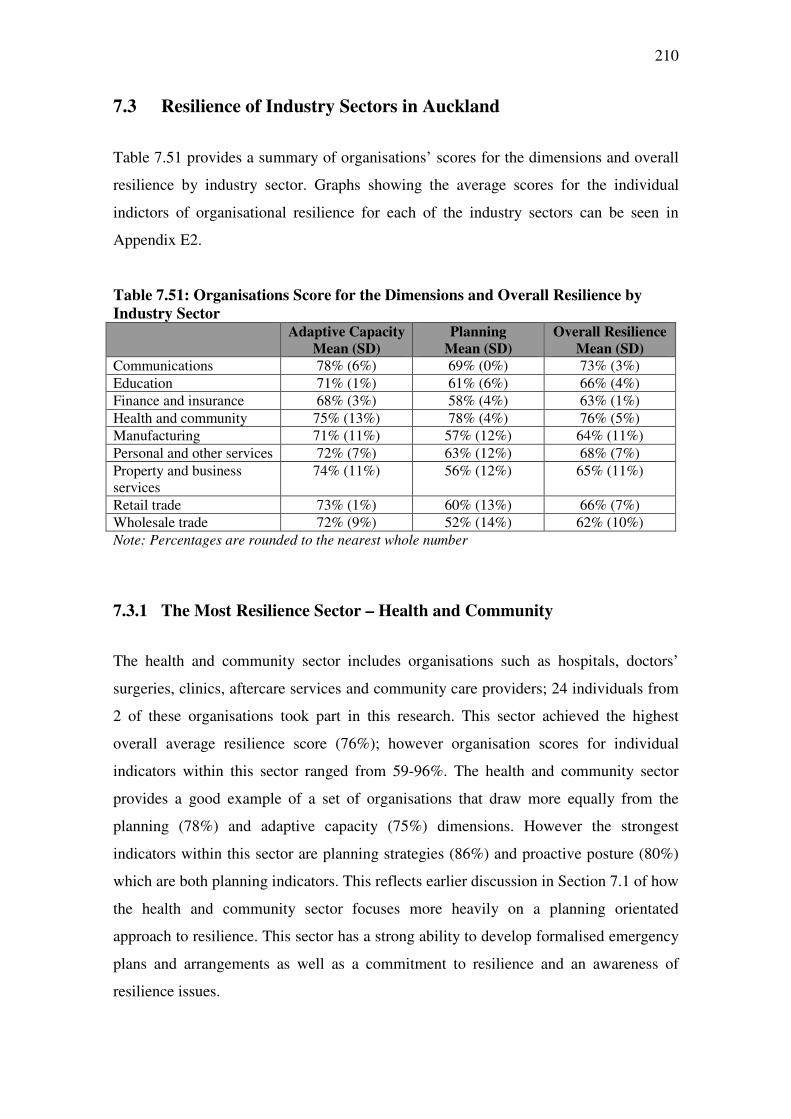
210
7.3 Resilience of Industry Sectors in Auckland
Table 7.51 provides a summary of organisations’ scores for the dimensions and overall
resilience by industry sector. Graphs showing the average scores for the individual
indictors of organisational resilience for each of the industry sectors can be seen in
Appendix E2.
Table 7.51: Organisations Score for the Dimensions and Overall Resilience by
Industry Sector Adaptive Capacity
Mean (SD) Planning
Mean (SD) Overall Resilience
Mean (SD) Communications 78% (6%) 69% (0%) 73% (3%)
Education 71% (1%) 61% (6%) 66% (4%)
Finance and insurance 68% (3%) 58% (4%) 63% (1%)
Health and community 75% (13%) 78% (4%) 76% (5%)
Manufacturing 71% (11%) 57% (12%) 64% (11%)
Personal and other services 72% (7%) 63% (12%) 68% (7%)
Property and business services
74% (11%) 56% (12%) 65% (11%)
Retail trade 73% (1%) 60% (13%) 66% (7%)
Wholesale trade 72% (9%) 52% (14%) 62% (10%)
Note: Percentages are rounded to the nearest whole number
7.3.1 The Most Resilience Sector – Health and Community
The health and community sector includes organisations such as hospitals, doctors’
surgeries, clinics, aftercare services and community care providers; 24 individuals from
2 of these organisations took part in this research. This sector achieved the highest
overall average resilience score (76%); however organisation scores for individual
indicators within this sector ranged from 59-96%. The health and community sector
provides a good example of a set of organisations that draw more equally from the
planning (78%) and adaptive capacity (75%) dimensions. However the strongest
indicators within this sector are planning strategies (86%) and proactive posture (80%)
which are both planning indicators. This reflects earlier discussion in Section 7.1 of how
the health and community sector focuses more heavily on a planning orientated
approach to resilience. This sector has a strong ability to develop formalised emergency
plans and arrangements as well as a commitment to resilience and an awareness of
resilience issues.
211
The weakest indicators for the health and community sector are capability and capacity
of external resources (69%) and innovation and creativity (72%). Despite these being
the lowest scores for this sector they are still rated as fair. The capability and capacity of
external resources indicator is designed to measure how well an organisation can access
external resources during a crisis. One of the characteristics of an organisational crisis is
being overwhelmed and having a lack of resources; this makes the ability to access
external resources critical for response and recovery. Innovation and creativity is also an
important factor in navigating challenges during the response. This could include
developing new ways of working at short notice to achieve objectives such as cutting
through red tape to access resources, thinking of new solutions to existing problems,
and developing ways to apply existing processes to new situations.
7.3.2 The Least Resilient Sector – Wholesale Trade
The wholesale trade sector can include organisations such as wholesale commercial
premises and warehouses; 55 individuals from 9 of these organisations took part in this
research. This sector achieved the lowest overall resilience score (62%); however
organisations scores for individual indicators within this sector ranged from 8-100%.
The wholesale trade sector provides a good example of a set of organisations that show
a very sharp contrast between their planning (52%) and adaptive capacity (72%)
indicators. The strongest indicators within this sector are internal and external situation
monitoring and reporting (78%) and devolved and responsive decision making (77%)
which are both indicators of adaptive capacity. This means that they are relatively good
at scanning their business environment for signals of potential crises and distributing
this knowledge across the organisation. This is a significant strength as it should help to
ensure that organisations are able to deal with problems before they escalate into crises.
The weakest indicators within this sector are planning strategies (43%) and capability
and capacity of external resources (46%) which are both indicators of planning. Overall
the planning dimension represents a significant weakness for the wholesale trade sector
and they should be encouraged to engage in collaborative planning and to assess their
supply chain resilience and interdependencies.
212
7.3.3 The Property and Business Services Sector
The property and business sector includes organisations such as computer repairs and
servicing, real estate, internet service providers and other corporate services; 82
individuals from 25 of these organisations took part in this research. Results for this
sector are discussed in this section because they achieved the highest response rate (25
organisations); it is also the largest industry sector in Auckland (Statistics New Zealand,
2009).
In general this sector focuses more heavily on its adaptive capacity than its planning.
This was reflected in the sectors’ results which are shown in Appendix E2; however
they also achieved a better balance between the two dimensions than other sectors such
as wholesale trade. The strongest indicators within this sector are internal and external
situation monitoring and reporting (78%), minimisation of silo mentality (76%), and
devolved and responsive decision making (76%) which are all adaptive capacity
indicators. This means that the property and business services sector are relatively good
at developing and maintaining situation awareness across their business environment
and are able to use and share the information to make decisions responsively.
The weakest indicators within this sector are planning strategies (44%) and capability
and capacity of external resources (50%) which are both planning indicators. This
means that although organisations in the sector may have thought about the resources
they might need to access during a crisis they have not yet planned to ensure that access
is available. This sector also lacks clear planning strategies because existing planning
arrangements have not been properly formalised or validated.
7.4 Resilience of Organisations
This section presents the resilience profile of the most and least resilience organisations
to take part in the Auckland study.
213
The Most Resilient
The most resilient organisation (referred to as MR) was a branch of a property and
business services organisation employing 20 full-time staff. They were the only
organisation to achieve an excellent overall resilience score; Figure 7.34 shows their
scores for each of the indicators of organisational resilience. MR achieved high scores
across the full range of indicators demonstrating that they take a broad holistic approach
to resilience.
MR is a highly adaptive organisation which relies on engaged and skilled staff to
develop its resilience capabilities. The organisation’s resource allocation processes can
be adapted to crisis situations and this makes the organisation more agile and
responsive. Staff develop innovative solutions to complex problems based on their
expertise and creativity. This enables the organisation to respond more effectively to
crises and could also help the organisation to remain more competitive during business-
as-usual. The organisation’s decision making structure values expertise and decisions
are made based on knowledge and experience as opposed to hierarchical position. This
means that MR staff are more likely to address problems before they escalate, however
it is important to ensure that all staff have an appreciation of other decision making
criteria such as business goals, mission and values. Staff are also able to communicate
across organisational, social and cultural barriers, or silos. This is important because it
means that the organisation can work more effectively, that information is shared more
equally, and that the organisation’s culture is an asset for the organisation.
MR’s weaknesses stem from a relative lack of formal planning, including the
development and documentation of response arrangements. While MR’s planning is still
classified as good, the organisation should further involve staff in developing and
documenting response arrangements and workarounds. This can provide benefits
including integrating existing response arrangements across the organisation, and
identifying potential gaps, conflicts and key dependencies. The organisation does not
test or exercise its response arrangements. This means that staff do not have the
opportunity to practice their response to crises and that the organisation’s plans are not
evaluated in the context of lessons learned. This could mean that the organisation’s
existing response arrangements are not ‘fit for purpose’ or that staff have not received
the necessary training to action existing response arrangements.
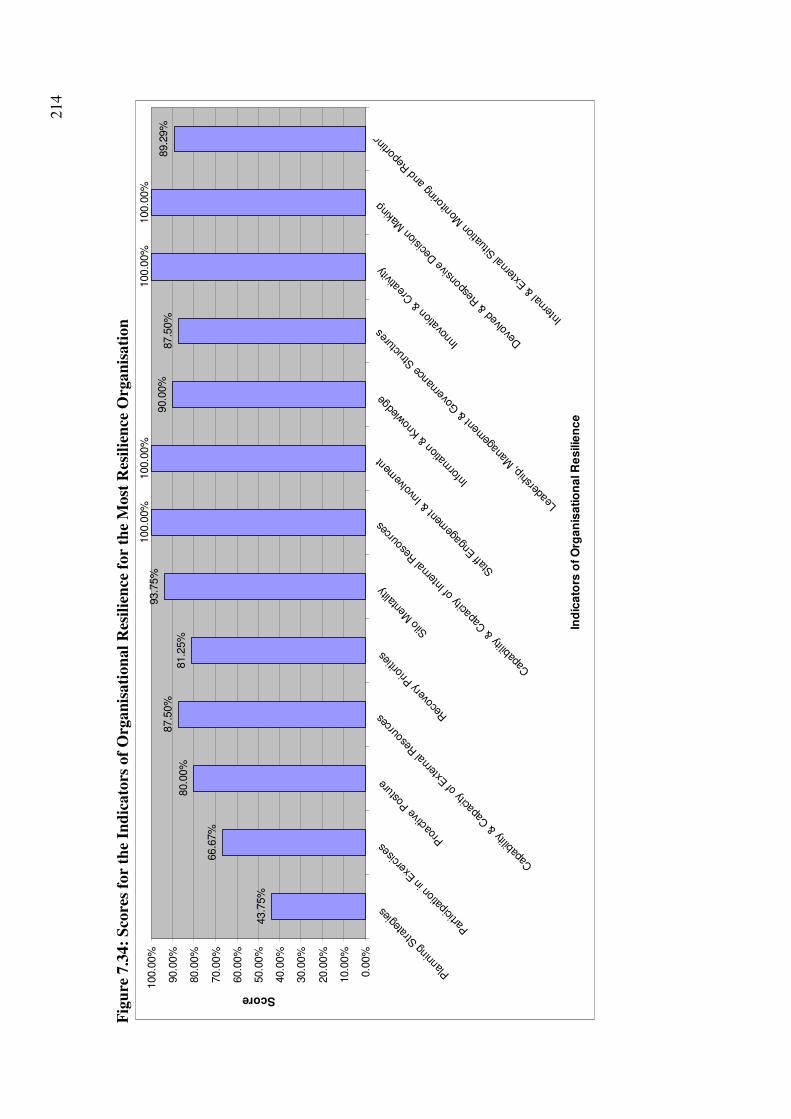
214
Fig
ure
7.3
4:
Sco
res
for
the
Ind
icato
rs o
f O
rgan
isati
on
al
Res
ilie
nce
for
the
Most
Res
ilie
nce
Organ
isati
on
43.7
5%
66.6
7%
80.0
0%
87.5
0%
81.2
5%
93.7
5%
100.0
0%
100.0
0%
90.0
0%
87.5
0%
100.0
0%
100.0
0%
89.2
9%
0.0
0%
10.0
0%
20.0
0%
30.0
0%
40.0
0%
50.0
0%
60.0
0%
70.0
0%
80.0
0%
90.0
0%
100.0
0%
Plann
ing
Strate
gies
Partic
ipat
ion
in E
xerc
ises
Proact
ive
Postu
re
Cap
abilit
y & C
apac
ity o
f Ext
ernal
Res
ourc
esR
ecov
ery P
riorit
ies
Silo M
enta
lity
Cap
abilit
y & C
apac
ity o
f Inte
rnal
Res
ourc
es
Staff
Engag
emen
t & In
volve
ment
Info
rmat
ion
& Know
ledge
Lead
ershi
p, M
anag
emen
t & G
over
nanc
e Stru
ctur
esIn
nova
tion
& Cre
ativ
ity
Dev
olve
d & R
espon
sive
Dec
isio
n Makin
g
Inte
rnal &
Ext
ernal
Situ
ation M
onito
ring a
nd R
epor
ting
Ind
ica
tors
of
Org
an
isa
tio
na
l R
es
ilie
nc
e
Score
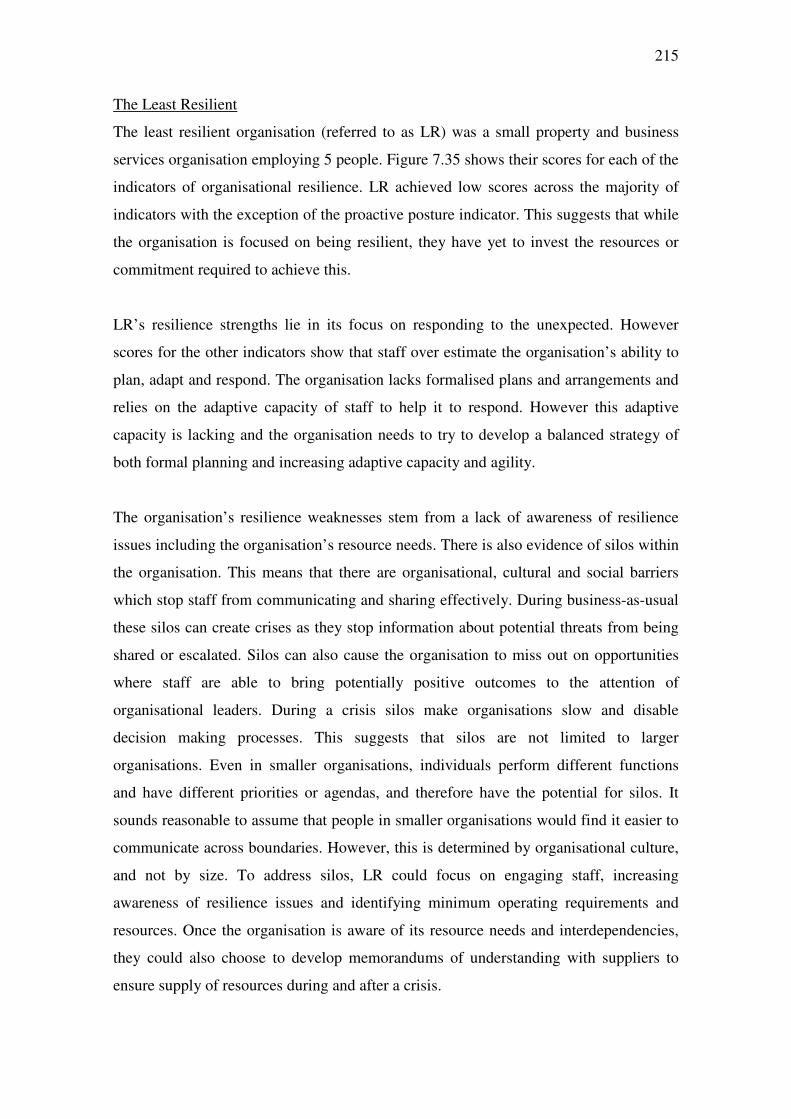
215
The Least Resilient
The least resilient organisation (referred to as LR) was a small property and business
services organisation employing 5 people. Figure 7.35 shows their scores for each of the
indicators of organisational resilience. LR achieved low scores across the majority of
indicators with the exception of the proactive posture indicator. This suggests that while
the organisation is focused on being resilient, they have yet to invest the resources or
commitment required to achieve this.
LR’s resilience strengths lie in its focus on responding to the unexpected. However
scores for the other indicators show that staff over estimate the organisation’s ability to
plan, adapt and respond. The organisation lacks formalised plans and arrangements and
relies on the adaptive capacity of staff to help it to respond. However this adaptive
capacity is lacking and the organisation needs to try to develop a balanced strategy of
both formal planning and increasing adaptive capacity and agility.
The organisation’s resilience weaknesses stem from a lack of awareness of resilience
issues including the organisation’s resource needs. There is also evidence of silos within
the organisation. This means that there are organisational, cultural and social barriers
which stop staff from communicating and sharing effectively. During business-as-usual
these silos can create crises as they stop information about potential threats from being
shared or escalated. Silos can also cause the organisation to miss out on opportunities
where staff are able to bring potentially positive outcomes to the attention of
organisational leaders. During a crisis silos make organisations slow and disable
decision making processes. This suggests that silos are not limited to larger
organisations. Even in smaller organisations, individuals perform different functions
and have different priorities or agendas, and therefore have the potential for silos. It
sounds reasonable to assume that people in smaller organisations would find it easier to
communicate across boundaries. However, this is determined by organisational culture,
and not by size. To address silos, LR could focus on engaging staff, increasing
awareness of resilience issues and identifying minimum operating requirements and
resources. Once the organisation is aware of its resource needs and interdependencies,
they could also choose to develop memorandums of understanding with suppliers to
ensure supply of resources during and after a crisis.
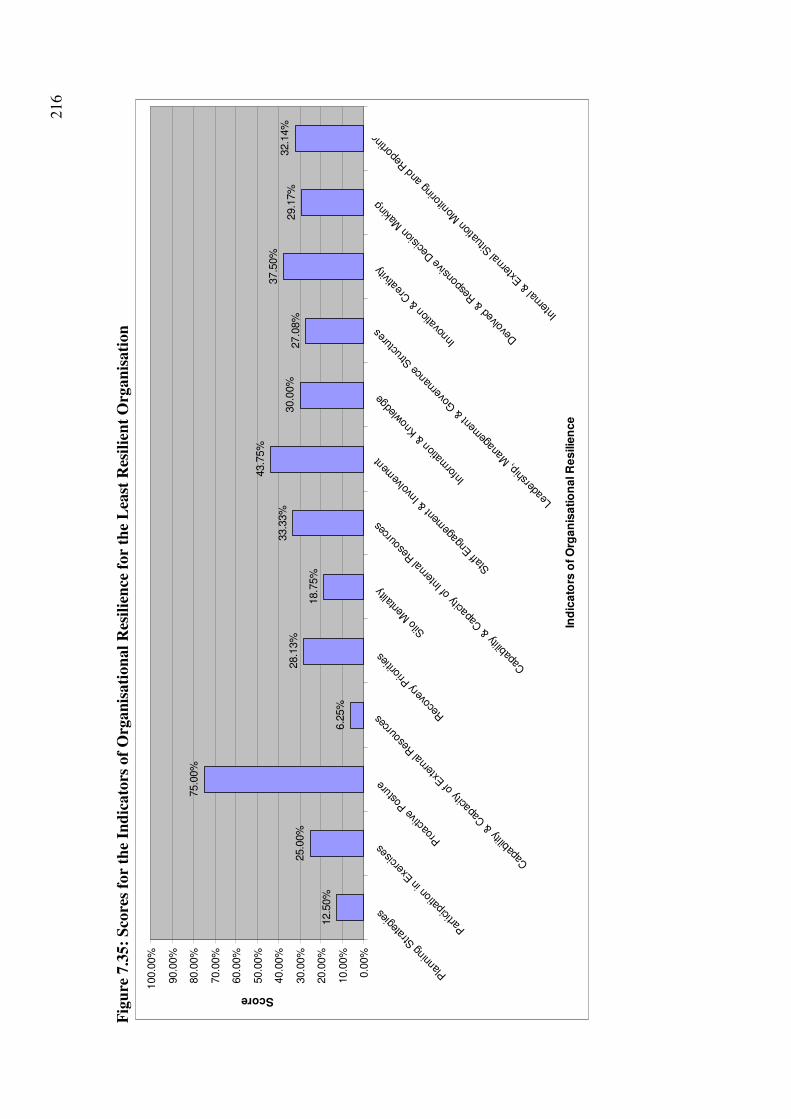
216
Fig
ure
7.3
5:
Sco
res
for
the
Ind
icato
rs o
f O
rgan
isati
on
al
Res
ilie
nce
for
the
Lea
st R
esil
ien
t O
rgan
isati
on
12.5
0%
25.0
0%
75.0
0%
6.2
5%
28.1
3%
18.7
5%
33.3
3%
43.7
5%
30.0
0%
27.0
8%
37.5
0%
29.1
7%
32.1
4%
0.0
0%
10.0
0%
20.0
0%
30.0
0%
40.0
0%
50.0
0%
60.0
0%
70.0
0%
80.0
0%
90.0
0%
100.0
0%
Plann
ing
Strate
gies
Partic
ipat
ion
in E
xerc
ises
Proact
ive
Postu
re
Cap
abilit
y & C
apac
ity o
f Ext
erna
l Res
ourc
esR
ecov
ery P
riorit
ies
Silo M
enta
lity
Cap
abilit
y & C
apac
ity o
f Int
erna
l Res
ourc
es
Staff
Engag
emen
t & In
volve
ment
Info
rmat
ion
& Kno
wle
dge
Lead
ershi
p, M
anag
emen
t & G
over
nanc
e Stru
ctur
esIn
nova
tion
& Cre
ativ
ity
Dev
olve
d & R
espo
nsiv
e D
ecis
ion M
aking
Inte
rnal &
Ext
ernal
Situ
ation M
onito
ring a
nd R
epor
ting
Ind
ica
tors
of O
rga
nis
ati
on
al R
esilie
nce
Score
217
7.5 Crises in Auckland over the Last 5 Years
The resilience measurement tool also asks individuals whether their organisation has
experienced a crisis within the last 5 years. Employees from 28 (41%) of organisations
said that their organisation had experienced a crisis within the last 5 years. The types of
crisis experienced are shown in Figure 7.36 which shows that most crises experienced
were critical infrastructure failures, namely power cuts. Perhaps more surprisingly,
major accidents and fires were also identified.
Figure 7.36: Types of Crises Experienced
Types of Crises Experienced
4.0%
11.4%14.1%
1.3%
36.2%
1.3%3.4%
0.0%
8.7%
2.0% 2.0%
0.0%
5.0%
10.0%
15.0%
20.0%
25.0%
30.0%
35.0%
40.0%
Nat
ural H
azard
s
Finan
cial C
risis
Major
Acc
ident
or F
ire
Pande
mic
Loss
of C
ritical S
ervices
Rep
utatio
n Dam
age
Fraud
Reg
ulato
ry C
hanges
Staffing
Issu
es
Failure
of a
Key
Sup
plie
r or C
usto
mer
Oth
er
Crisis
Pere
nta
ge o
f R
esp
on
den
ts
Note: Some organisations had experienced more than 1 crisis over the last 5 years – this is
included in this figure.
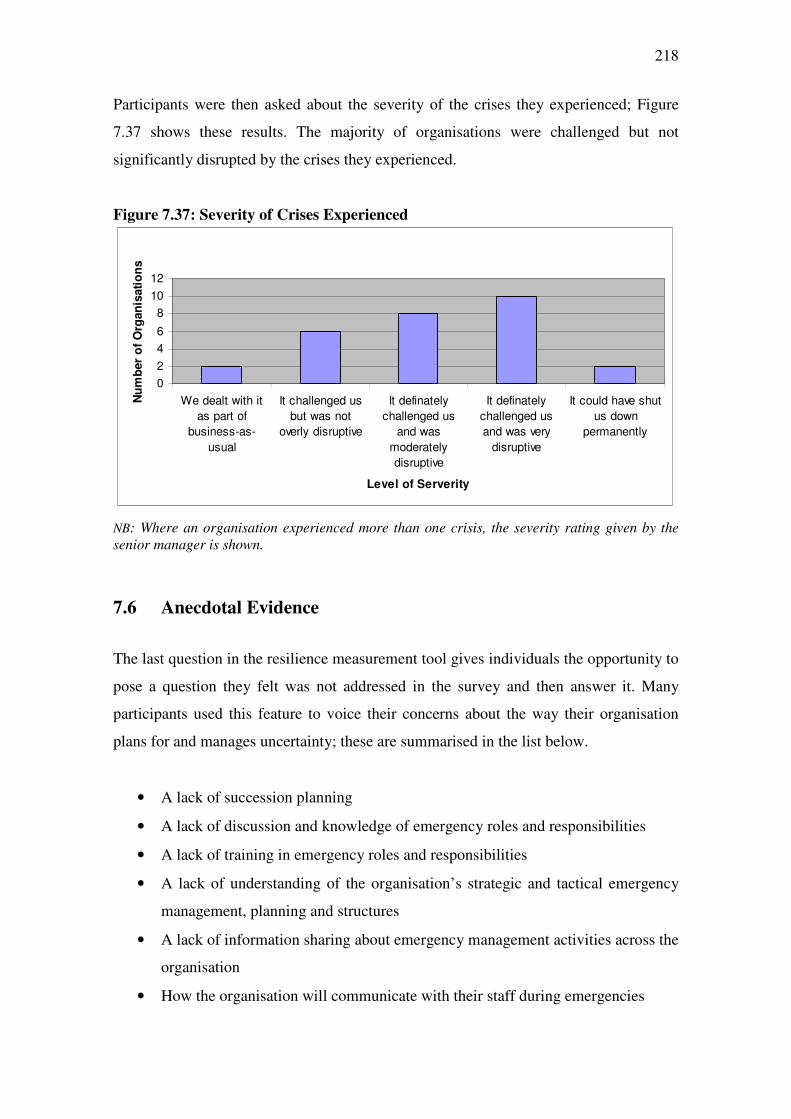
218
Participants were then asked about the severity of the crises they experienced; Figure
7.37 shows these results. The majority of organisations were challenged but not
significantly disrupted by the crises they experienced.
Figure 7.37: Severity of Crises Experienced
0
2
4
6
8
10
12
We dealt with it
as part of
business-as-
usual
It challenged us
but was not
overly disruptive
It definately
challenged us
and was
moderately
disruptive
It definately
challenged us
and was very
disruptive
It could have shut
us down
permanently
Level of Serverity
Nu
mb
er
of
Org
an
isati
on
s
NB: Where an organisation experienced more than one crisis, the severity rating given by the senior manager is shown.
7.6 Anecdotal Evidence
The last question in the resilience measurement tool gives individuals the opportunity to
pose a question they felt was not addressed in the survey and then answer it. Many
participants used this feature to voice their concerns about the way their organisation
plans for and manages uncertainty; these are summarised in the list below.
• A lack of succession planning
• A lack of discussion and knowledge of emergency roles and responsibilities
• A lack of training in emergency roles and responsibilities
• A lack of understanding of the organisation’s strategic and tactical emergency
management, planning and structures
• A lack of information sharing about emergency management activities across the
organisation
• How the organisation will communicate with their staff during emergencies
219
• How the organisation will communicate with other organisations (e.g.
customers, suppliers, Government) during emergencies
• Job security during and after crisis
• Lack of consultation on emergency management issues – a top down approach
• What would happen in our community in an emergency – what would they want
from us?
• If we had to relocate, where would we go?
• Role conflict in an emergency
• Lack of access, for general staff members, to emergency plans and arrangements
– we’ve been told they exist but nobody has shown them to us
7.7 Improving Resilience in Auckland
Organisations play a critical role in communities planning for, responding to and
recovering from disasters. Without resilient organisations, communities are less
resilient.
The differences in approaches to resilience between organisations should be considered
when developing resilience advice. The results of this research indicate that the majority
of organisations in this study draw more heavily on adaptive capacity for their
resilience. This is important because the majority of organisations approached through
this research had difficulty prioritising resilience or allocating resources to addressing
resilience issues. Given these different adaptive capacity and planning focused
approaches, organisations’ motivation for addressing resilience is also likely to be
driven by these different orientations.
For organisations that do not have a legal duty to plan for emergencies, making a
business case for resilience and understanding how resilience issues relate to business-
as-usual is critical. Communicating with organisations about resilience should focus on
what resilience is, why it is important, and what organisations of all types and sizes can
do to address their resilience. This information should be tailored according to whether
an organisation is likely to be planning orientated or adaptive capacity orientated.
220
While a focus on formalised planning and exercising should be maintained, the
Auckland Civil Defence Emergency Management (CDEM) Group should also
encourage organisations to leverage their adaptive capacity strengths. There are eight
indicators of adaptive capacity as shown in Table 6.26 which are defined in Appendix
D10. Although adaptive capacity often goes unnoticed within an organisation, it is not
necessarily effortless, easy or natural. It is therefore important that organisations address
their adaptive capacity proactively.
When identifying whether or not their organisation had an emergency plan, participants
in this study often disagreed. This indicates silo mentality which means that many staff
and managers are not aware that their organisation has plans, or that staff believe that
their organisation has plans when it does not. Silo mentality is a social phenomenon
than can affect individuals, communities, business units, teams or functions within any
group or organisation. It can be created by geographical distance, by being spatially far
away from something or someone, but it can also occur between people or groups that
share the same office space. Silos are created when physical, cultural, social, or
communication barriers isolate or separate people, processes or information in a way
that prohibits effective working. In a disaster or crisis situation these barriers rarely
disappear as we might hope, but are more often magnified and can cause significant
problems (Seville, et al., 2006). Silos cause organisations to lose control and awareness,
and they can make organisations slower to respond to information. It is important for
organisations to address silos because they significantly impact an organisation’s
adaptive capacity. While many organisations may have experienced the effect of silos,
they may not understand how these could become part of the generation of crises within
their organisation.
Many organisations taking part in this study rely on a small group of people with very
specific knowledge to ‘get the job done’ .This is especially true in smaller organisations.
Many organisations rely on arrangements developed to manage business-as-usual or
small disruptions for also managing larger scale problems and crises. They often assume
that their arrangements will scale up and will be applicable to any problem; however
this is not necessarily true. Quarantelli (2005) argues that routine emergencies, disasters
and catastrophes are qualitatively different. Quarantelli (2005, p. 1) goes on to identify
four differences between routine emergencies and disasters at the organisation level:
221
• In disasters compared to everyday emergencies, organisations have to quickly
relate to and communicate with a wider variety of individuals, organisations and
groups within a short space of time.
• Organisations have to adjust to a new decision making process, either because
they are required to make decisions faster using less information, or because
they loose some of their autonomy and control.
• Crisis and disaster situations require faster, more efficient performance. An
example of this could be the difference between treating an injury during
business-as-usual compared with treating injuries following an earthquake.
• The links between organisations for mobilisation of resources are expected to be
quicker in crises and disasters. Organisational stakeholder and the public will
expect the organisation to make their response to the crisis or disaster their top
priority regardless of what was planned for that day.
Organisations should be encouraged to think about how their business-as-usual coping
methods would work during a large scale emergency, or during a crisis that lasted
longer than expected. The financial crisis is a good example of this situation for many
organisations.
Organisations in Auckland should also be encouraged to recognise their place as part of
a network of organisations. No organisation can operate in isolation; each will need
suppliers, customers, consumers, service users etc. This includes not only investigating
their interdependencies but also increasing and improving their level of collaborative
planning. In particular each industry sector needs to be aware of the role it could play in
helping communities and the economy to recover in local, regional and national
emergencies. This is not only limited to those organisations traditionally seen as
contributing to the response such as emergency services, transport and governance, but
includes all organisations as employers and providers of goods and services which is
what will really enable communities to recover.
222
7.7.1 Leveraging Strengths in Auckland
The Auckland organisations taking part in this research scored particularly well in the
internal and external situation monitoring and reporting, and devolved and responsive
decision making indicators. It is important that organisations not only focus on
addressing their weaknesses but also leverage off of their strengths in order to maintain
and increase their resilience.
As the economic and population centre of New Zealand, organisations in Auckland are
well placed to be proactive about managing emergencies and crises. However
organisations’ experience of crises in the last 5 years indicates that the majority of
organisations have little recent experience of anything other than financial turmoil, and
power cuts. While this bodes well for organisations’ ability to avoid crises where
possible, it does mean that organisations in this area do not have much experience of
what a large scale disaster or crisis, such as a natural disaster, would mean for them.
Internal and External Situation Monitoring and Reporting
The ability of organisations in Auckland to monitor their internal and external
environment for signals of opportunities and potential threats is critical given this lack
of experience. Although a volcanic eruption or earthquake, for example, may be
difficult to miss, there are a host of secondary consequences for organisations from any
crisis. One example is how an organisation could significantly grow their market share
if they were positioned correctly to provide their product or service quicker and more
effectively than anyone else following a disaster. A resilient organisation would also be
able to see opportunities to transform their organisation to better suit a new
environment.
To make the most of this strength, Auckland organisations need to make sure that they
monitor the internal and external environment and that their reporting and information
sharing practises are continuously reviewed. It is also critical that organisations
recognise that ‘near misses’, (where an organisation either succeeds or gets by, but only
just) is not confirmation of their abilities or of success, but is a signal for them to review
their practices. Organisations should always aim to learn lessons, not only from crises,
but near misses as well (Weick & Sutcliffe, 2007).
223
Devolved and Responsive Decision Making
Devolved and responsive decision making, how flexible organisations’ decision making
structures and processes are, is critical for adaptive capacity. This often involves a
culture where autonomy and authority to make decisions, including allocation of
resources, adjusts depending on the situation. This is important for situations where top
management may be unavailable or where middle managers may need to purchase extra
equipment or authorise overtime to enable continuity of operations and minimise
disruption.
Many organisations may have these arrangements in place on an informal basis however
it is essential that everyone in the organisation understands these procedures, what
triggers them and exactly what they can and cannot do. This scaling of authority and
processes also extends to other duties such as communicating with the media, opening
or closing sites, locations or facilities, and how and when to communicate sensitive
information.
For some organisations, for example those operating in hazardous environments, some
processes such as health and safety checks may be changed during periods of stress or
crises in order to prevent accidents. This too needs to be addressed in advance of a crisis
so that proper training and information can be provided. Far from only relying on
predetermined arrangements, discussion of these problems will not only enable
creativity and innovation during the response but will also highlight existing problems
and contradictions.
7.7.2 Addressing Weaknesses in Auckland
Planning Strategies
The Auckland organisations taking part in this study scored poorly on the planning
strategies indicator. This is in part due to the silo mentality discussed earlier, where not
every member of the organisation is aware of the organisation’s emergency
arrangements. However this in itself is not necessarily an indication of poor resilience.
It is not always necessary for every member of the organisation to know the emergency
arrangements in depth, however it should be recommended that every member of staff is
224
introduced to the arrangements and involved in arrangements which directly link with
either their role or something on which their role directly relies or reports to. It should
be emphasised that this is applicable to all organisations regardless of their industry
sector or size.
Despite the different approaches to resilience previously discussed, it is important for
organisations to engage in formal planning. The production of an emergency plan does
not necessarily increase an organisations’ resilience however the lessons learned from
the planning process should feed into the culture of the organisation. Formal planning
also increases the organisations awareness of the risks in its business environment,
including interdependencies. Collaborative planning, planning done in conjunction with
other organisations, can also be very useful in enabling organisations to increase their
resilience.
Capability and Capacity of External Resources
Auckland organisations scored poorly on capability and capacity of external resources.
This indicator measures how well organisations can access resources from outside of
their organisation during a crisis. This could include existing contracts for rented
vehicles, plant and equipment as well as temporary or contract staff.
To address this, organisations should complete an analysis of existing contracts to
identify dependencies e.g. suppliers, temporary contract staff, rented vehicles and plant
etc. They can then use memorandums of understanding (MOUs) to make arrangement
to ensure continuity of supply. Multi-agency exercises would help organisations to
familiarise themselves with the needs of their sector. They should also identify
maximum tolerable periods of disruption given current resources.
225
7.8 Conclusions about the Resilience of Organisations in the Auckland
Region
The purpose of this section is to answer research question 3:
What conclusions can be drawn from the data about the resilience of organisations in
the Auckland Region?
All of the organisations that took part in this research received a results report. Reports
included a summary of their results, discussion of their strongest and weakest resilience
indicators, and a comparison between their scores and the average scores for their
industry sector and Auckland as a whole. For these organisations this represents a real
opportunity to assess their resilience so that they can identify how resilient they are and
then map a path to becoming more resilience which is efficient and effective for them.
As discussed in Section 6.1 the sample for this research is relatively small. This means
that conclusions on the resilience of the organisations that took part in this research
cannot be generalised to Auckland as a whole. However, together with the reasons for
non-response, they do provide an indication of trends likely to be evident across
Auckland which can be investigated further.
While a random sample of organisations was necessary for this study and will be
necessary for confirmatory studies, future research using the tool need not necessarily
be constrained by this. All organisations participating in this research provided positive
feedback on the tool and the results provided. This indicates that the main challenge is
convincing organisations that their resilience is worth investigating. Once they have the
results they are then empowered to take action, however longitudinal study is required
to assess how organisations are using the results, if at all.

226
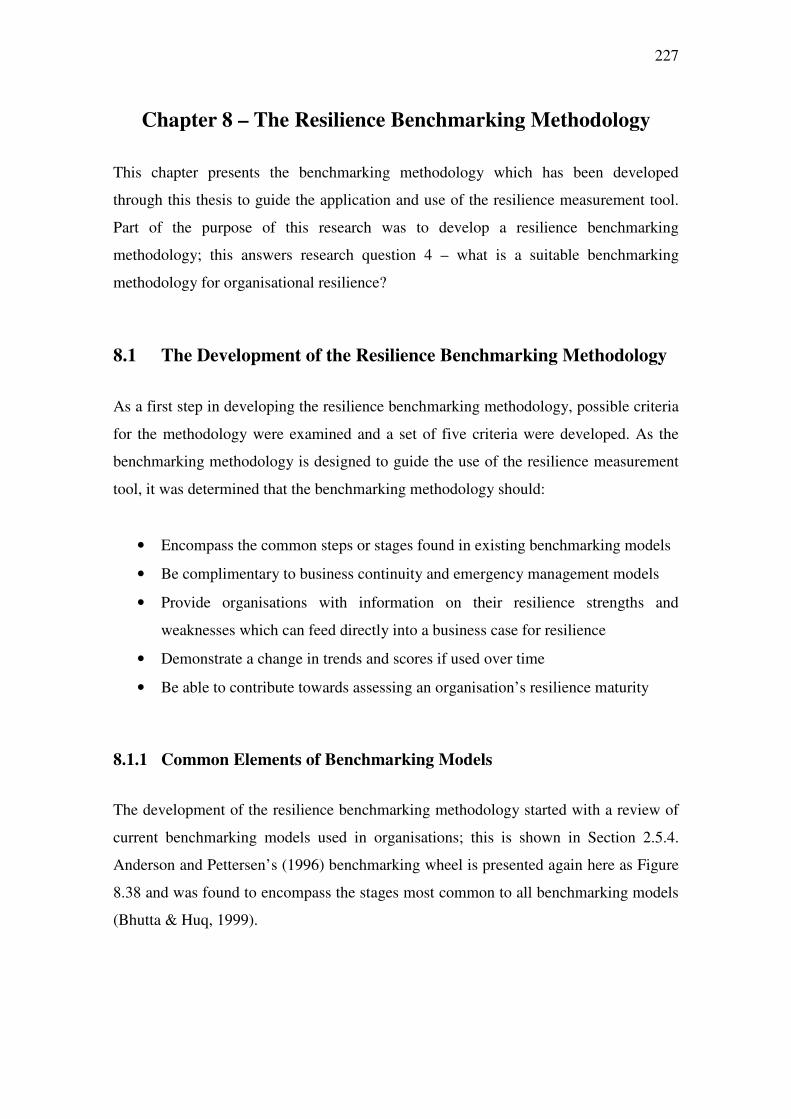
227
Chapter 8 – The Resilience Benchmarking Methodology
This chapter presents the benchmarking methodology which has been developed
through this thesis to guide the application and use of the resilience measurement tool.
Part of the purpose of this research was to develop a resilience benchmarking
methodology; this answers research question 4 – what is a suitable benchmarking
methodology for organisational resilience?
8.1 The Development of the Resilience Benchmarking Methodology
As a first step in developing the resilience benchmarking methodology, possible criteria
for the methodology were examined and a set of five criteria were developed. As the
benchmarking methodology is designed to guide the use of the resilience measurement
tool, it was determined that the benchmarking methodology should:
• Encompass the common steps or stages found in existing benchmarking models
• Be complimentary to business continuity and emergency management models
• Provide organisations with information on their resilience strengths and
weaknesses which can feed directly into a business case for resilience
• Demonstrate a change in trends and scores if used over time
• Be able to contribute towards assessing an organisation’s resilience maturity
8.1.1 Common Elements of Benchmarking Models
The development of the resilience benchmarking methodology started with a review of
current benchmarking models used in organisations; this is shown in Section 2.5.4.
Anderson and Pettersen’s (1996) benchmarking wheel is presented again here as Figure
8.38 and was found to encompass the stages most common to all benchmarking models
(Bhutta & Huq, 1999).
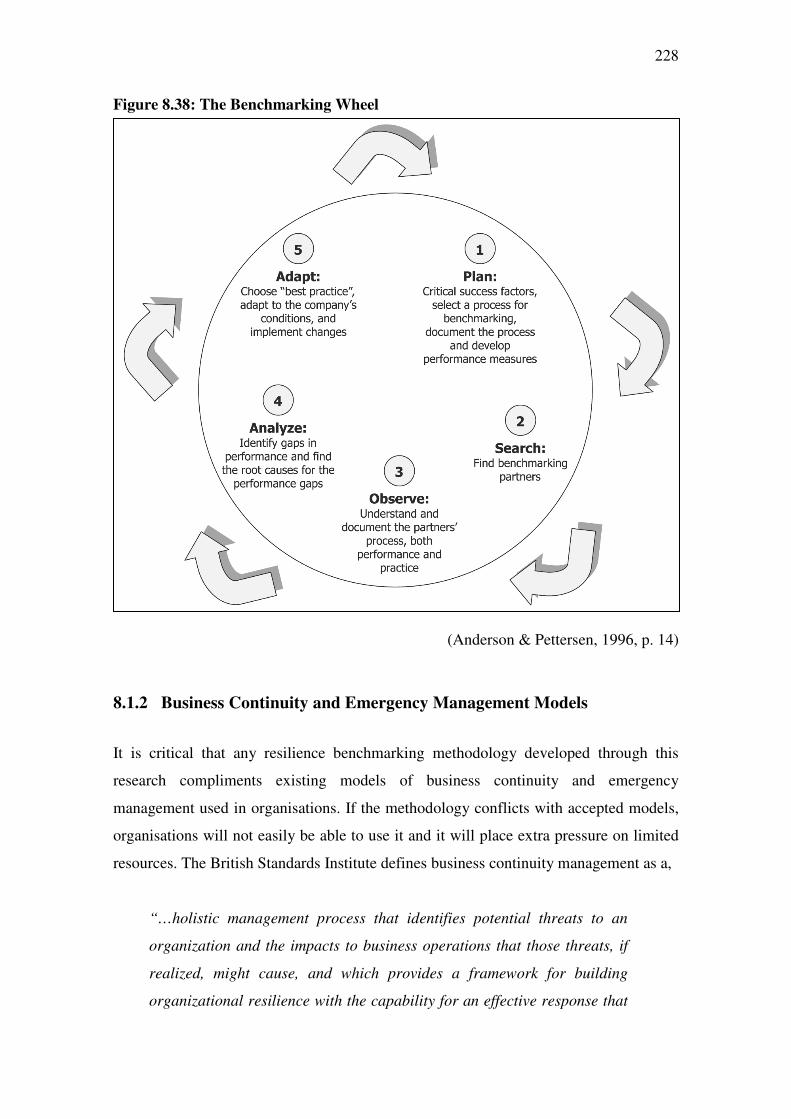
228
Figure 8.38: The Benchmarking Wheel
(Anderson & Pettersen, 1996, p. 14)
8.1.2 Business Continuity and Emergency Management Models
It is critical that any resilience benchmarking methodology developed through this
research compliments existing models of business continuity and emergency
management used in organisations. If the methodology conflicts with accepted models,
organisations will not easily be able to use it and it will place extra pressure on limited
resources. The British Standards Institute defines business continuity management as a,
“…holistic management process that identifies potential threats to an
organization and the impacts to business operations that those threats, if
realized, might cause, and which provides a framework for building
organizational resilience with the capability for an effective response that
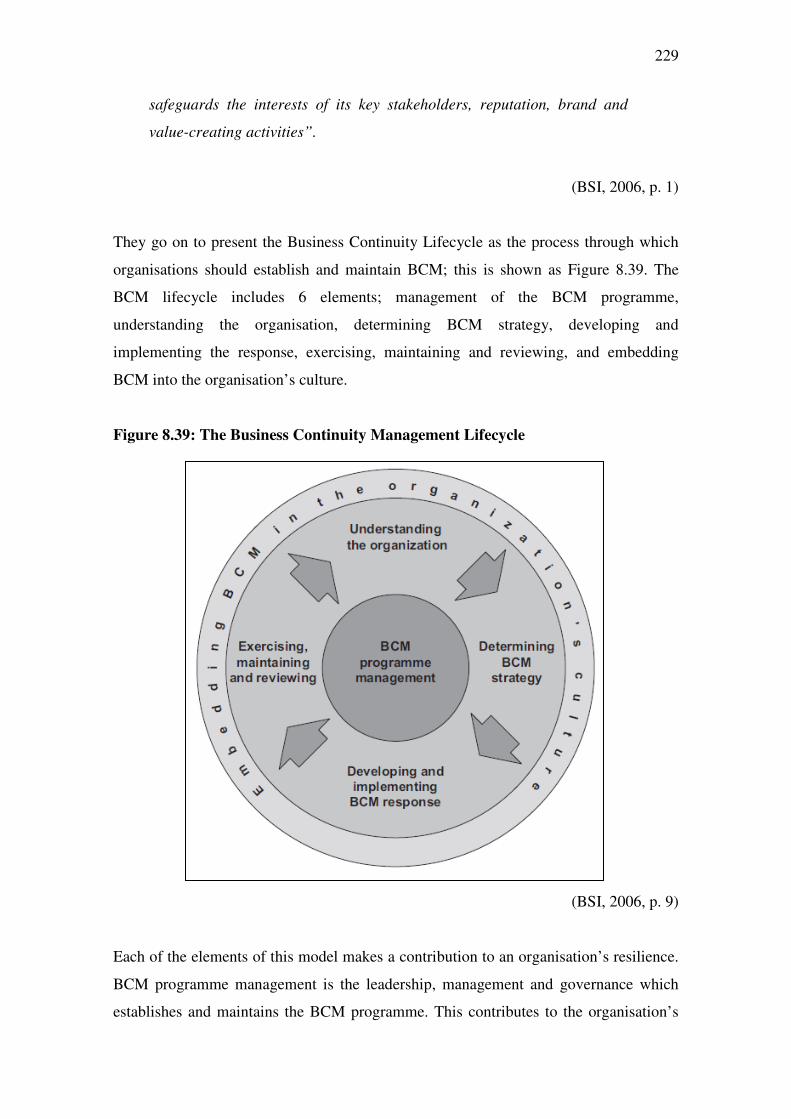
229
safeguards the interests of its key stakeholders, reputation, brand and
value-creating activities”.
(BSI, 2006, p. 1)
They go on to present the Business Continuity Lifecycle as the process through which
organisations should establish and maintain BCM; this is shown as Figure 8.39. The
BCM lifecycle includes 6 elements; management of the BCM programme,
understanding the organisation, determining BCM strategy, developing and
implementing the response, exercising, maintaining and reviewing, and embedding
BCM into the organisation’s culture.
Figure 8.39: The Business Continuity Management Lifecycle
(BSI, 2006, p. 9)
Each of the elements of this model makes a contribution to an organisation’s resilience.
BCM programme management is the leadership, management and governance which
establishes and maintains the BCM programme. This contributes to the organisation’s
230
resilience by prioritising resilience as a goal, establishing leadership commitment to
resilience, and ensuring continuing evaluation of resilience management activities.
Understanding the organisation involves developing the BCM programme within the
context of the organisation, its core business functions and its operating environment.
This element also takes into account an understanding of the organisation’s social and
cultural characteristics. This enables the organisation to prioritise products, services and
resources and to identify the organisation’s minimum operating requirements. This
feeds directly into the development of BCM strategies to ensure continuity of
operations. The development and implementation of a BCM response involves taking
actions, as directed by the strategies, and addressing organisational strengths and
weakness; this includes developing response and recovery plans.
All of these stages are also reflected in emergency management and disaster models
such as the Disaster Cycle (planning/preparedness, mitigation, response, and recovery)
and the 4R’s used in New Zealand (reduction, readiness, response and recovery). Each
of these models broadly encompasses the plan, do, check, act process (Bhutta & Huq,
1999, p. 257). In the context of developing a resilience benchmarking methodology,
each of the elements should be considered.
8.1.3 Information for the Business Case for Resilience
To invest in resilience, organisations need to be able to demonstrate a business case for
resilience and also for specific resilience investments that is stronger than the case made
for other initiatives such as new staff or new equipment. To achieve this it is necessary
to investigate the information required to make a good business case and to make sure
that the resilience benchmarking methodology can provide as much of this information
as possible.
Epstein and Westbrook (2001) discuss the links between customer satisfaction and
profit. Through their discussion they present a case study of the Canadian Imperial Bank
of Commerce (CBIC) who developed the Action-Profit Linkage (APL) model to help
articulate and measure the causal relationships between actions and profit which could
inform a business case. This model is based on the belief that profit is driven by
231
customer behaviour, and links the drivers of customer loyalty to measurable customer
loyalty variables. As an example,
“The model helped CIBC managers identify key relationships…they found
a 1-point increase in any of the loyalty-behaviour elements increases
profits by $0.60 per month per customer. They also found that a 5%
increase in employee commitment yields a 2% increase in customer
loyalty, which increases profitability by $72 million annually”.
(Epstein & Westbrook, 2001, p. 42)
The link between actions and profit is echoed by Collins and Porras (2000) who provide
examples of visionary companies who have focused on customer service or
organisational culture to increase profitability.
The literature on making a business case specifically for resilience is sparse; however
more attention has been paid to making a business case for sustainability. Schaltegger
and Wagner (2006) argue that it is possible to create a business case for sustainability.
Spirig (2006) argues that competitive advantage can be achieved by communicating
social performance, this means that if organisations do not communicate their progress
towards becoming more sustainable or resilient, they will not achieve any competitive
advantage as a result.
Epstein and Roy (2003) examine 20 corporate sustainability reports to investigate
whether companies have the information they need to make a business case for
sustainability. They go on to discuss a framework to help guide managers in making this
business case which provides ideas useful for resilience. Epstein and Roy emphasise the
importance of being able to measure the drivers of sustainability performance and
argue, “…managers must quantify how one variable drives another until the link to
ultimate corporate financial performance is clear” (Epstein & Roy, 2003, p. 83). This
not only emphasises the importance of measurement, but also of developing a casual
model of sustainability that explains the relationships between the drivers and the
critical paths within that model to creating greater sustainability. This is also an
important consideration for a business case for resilience; a causal model of resilience
232
would increase understanding of the critical path between resilience investments and
resilience performance.
Positioning the drivers of sustainability as inputs to their framework, Epstein and Roy
(2003) describe the outputs and make a distinction between intermediate results e.g.
improved sustainability, and financial outcomes. Alongside intermediate results and
financial outcomes, they also argue that stakeholder reactions should be evaluated as an
outcome of investment. Having identified the inputs (the drivers of sustainability) and
the outputs (intermediate results, financial outcomes and stakeholder reactions), Epstein
and Roy (2003) argue that a feedback process, equivalent to organisational learning and
sensemaking, is also a fundamental aspect of their framework. This reflects many
models of crisis management which also include the notion of feedback which helps to
build situation awareness (Smith, 1990).
In the context of developing a business case for resilience the principles of measuring
drivers, evaluating intermediate results, measuring financial outcomes, and evaluating
stakeholder reactions, outlined above are useful and are incorporated into the resilience
benchmarking methodology. The drivers of resilience and the intermediate results
(improvements in resilience) can both be measured using the resilience measurement
tool developed through this thesis.
In addition to a general business case for resilience, it is also important for managers to
be able to demonstrate a business case for proposed resilience investments. The business
case for resilience must be better than the business case for new equipment or new staff.
Gambles (2009, p. 1) defines a business case as,
“…a recommendation to decision makers to take a particular course of
action for the organisation, supported by an analysis of its benefits, costs
and risks compared to the realistic alternatives, with an explanation of
how it can best be implemented”.
Gambles (2009) goes on to identify two broad purposes of a business case – decision
making and mobilising support. Within each of these he also identifies sub-categories:
233
• Decision making
o Enable decision making
o Meet compliance requirements
o Secure funding
• Mobilising support
o Provide a baseline or success criteria for measuring the project
o Mobilise support
o Provide a platform for managing the project
Gambles (2009) goes on to present a process for developing business cases to enable
decision making and mobilise support which consists of 12 interrelated and overlapping
steps.
The IT Toolkit, a website for IT managers and professionals, provides many articles
based on practitioner experience, on how to structure a business case. In general they
suggest a much simpler process consisting of four key steps; identify the business
problem, identify alternative solutions, recommend the preferred solution, and describe
the implementation approach (Toolbox for IT, 2006). Step 1, identify the business
problem is often neglected when discussing resilience. Although many organisations
will agree that they ‘should’ invest in their resilience, they often label it as a luxury
(Mitroff, et al., 1989) and have not identified a specific need for resilience investment
and so the business case lacks commitment and cost/benefit information. In the context
of resilience, business problems could include:
• Unknown level of organisational resilience creating vulnerability and masking
potential threats, opportunities, strengths and weaknesses
• Low level of organisational resilience signalling the organisation’s vulnerability
to crises
• Known gaps in organisational resilience signalling the organisation’s
vulnerability to crises
• A high level of organisational resilience that is not being utilised as a business
opportunity
234
Step 2, identify alternative solutions, involves identifying all possible solutions to the
business problems and seeking information on the appropriateness and feasibility of
each solution. Step 3, recommend preferred solution, involves presenting the case for
the recommended investment to decision makers. This involves actually writing the
business case and includes all of the information gathered about the preferred option
during Step 2 as well as:
• An overview of the strategy or solution
• A statement of assumptions
• A statement of the feasibility
• Cost benefit information – this can be qualitative and quantitative but should
draw on financial data where possible (e.g. costs of previous or likely crises,
costs of business disruption, resources required to implement the strategy or
solution)
• Identify critical success factors
• Timescale or possible schedule
• Level of commitment required
• Ownership and responsibility
Step 4, describe the implementation approach, involves describing four elements; how
the project will be initiated, planned and managed, executed, and evaluated. Initiation
involves listing the steps required in initiating the project such as raising awareness and
forming a project team. Planning and management involves describing who will manage
the project and the budget. Execution involves outlining the actual process or
methodology that will be used to deliver increased resilience and financial performance.
Evaluation involves describing how the success of the investment will be measured e.g.
by re-assessing the organisation’s resilience and financial performance after the project
and comparing the results. From this discussion the information required to make a
business case for resilience can be identified; this is shown in Table 8.52.
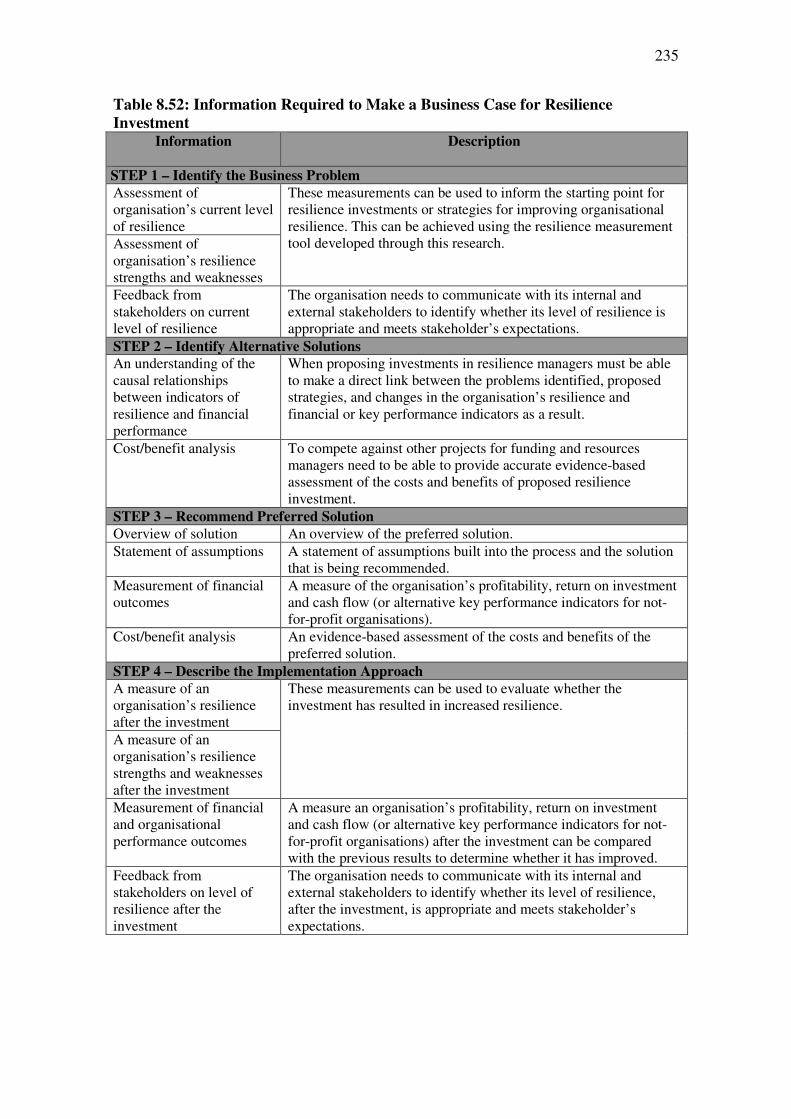
235
Table 8.52: Information Required to Make a Business Case for Resilience
Investment Information Description
STEP 1 – Identify the Business Problem
Assessment of organisation’s current level of resilience
These measurements can be used to inform the starting point for resilience investments or strategies for improving organisational resilience. This can be achieved using the resilience measurement tool developed through this research. Assessment of
organisation’s resilience strengths and weaknesses
Feedback from stakeholders on current level of resilience
The organisation needs to communicate with its internal and external stakeholders to identify whether its level of resilience is appropriate and meets stakeholder’s expectations.
STEP 2 – Identify Alternative Solutions
An understanding of the causal relationships between indicators of resilience and financial performance
When proposing investments in resilience managers must be able to make a direct link between the problems identified, proposed strategies, and changes in the organisation’s resilience and financial or key performance indicators as a result.
Cost/benefit analysis To compete against other projects for funding and resources managers need to be able to provide accurate evidence-based assessment of the costs and benefits of proposed resilience investment.
STEP 3 – Recommend Preferred Solution
Overview of solution An overview of the preferred solution.
Statement of assumptions A statement of assumptions built into the process and the solution that is being recommended.
Measurement of financial outcomes
A measure of the organisation’s profitability, return on investment and cash flow (or alternative key performance indicators for not-for-profit organisations).
Cost/benefit analysis An evidence-based assessment of the costs and benefits of the preferred solution.
STEP 4 – Describe the Implementation Approach
A measure of an organisation’s resilience after the investment
These measurements can be used to evaluate whether the investment has resulted in increased resilience.
A measure of an organisation’s resilience strengths and weaknesses after the investment
Measurement of financial and organisational performance outcomes
A measure an organisation’s profitability, return on investment and cash flow (or alternative key performance indicators for not-for-profit organisations) after the investment can be compared with the previous results to determine whether it has improved.
Feedback from stakeholders on level of resilience after the investment
The organisation needs to communicate with its internal and external stakeholders to identify whether its level of resilience, after the investment, is appropriate and meets stakeholder’s expectations.
236
8.1.4 Changes in Resilience and Resilience Maturity
In order to create a business case for resilience is it important to understand how the
organisation’s resilience changes over time. This will enable organisations to
demonstrate improvements in resilience from one investment cycle to the next. One
example of a very simple way for an organisation to track their resilience over time is
shown in Appendix F1. This resilience tracker is a chart on which organisations can
mark their scores for each iteration of the tool and then review their progress.
Duffy (2001) discusses maturity as a key consideration in organisation management in a
continuously evolving environment. She goes on to emphasise the need for information
and understanding and argues,
“…it is essential for organisation’s leaders to understand where they are
coming from, where they are going and what challenges they can expect in
moving from one stage to another, as maturity evolves”.
(Duffy, 2001, p. 20)
Gibson and Tarrant (2010) discuss resilience as an outcome which can be observed
along a continuum from vulnerable to resilient that demonstrates an organisation’s
resilience maturity. They go on to present a model of the progression of resilience
maturity which is shown as Figure 8.40. In this model, organisations progress through
three broad levels of resilience; reactive, prepared and adaptive. This reflects the two
dimensions of organisational resilience identified in this research (planning and adaptive
capacity). This model appears to present the three stages as linear so that a prepared
organisation is less resilient then an adaptive organisation. However it is more likely
that the stages are cumulative – a resilient organisation will have reactive, prepared and
adaptive capabilities. This research would support a cumulative progression because it
suggests that organisations must be both planned and adaptive. However as discussed in
Chapter 7, some of the organisations that took part in the Auckland study were highly
adaptive and did not focus on planning. This would suggest that organisations can start
at any stage on Figure 8.40 but that to be resilient they must achieve capabilities from
all three stages. A possible resilience maturity model is provided in Appendix F2.
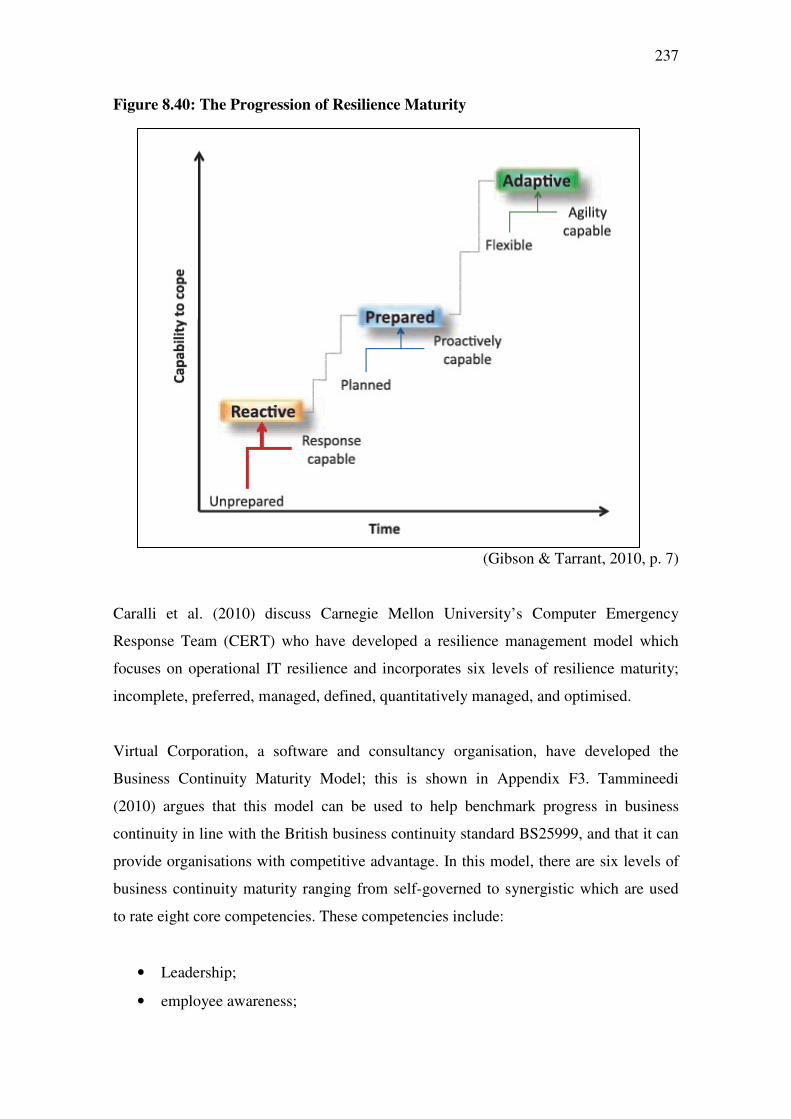
237
Figure 8.40: The Progression of Resilience Maturity
(Gibson & Tarrant, 2010, p. 7)
Caralli et al. (2010) discuss Carnegie Mellon University’s Computer Emergency
Response Team (CERT) who have developed a resilience management model which
focuses on operational IT resilience and incorporates six levels of resilience maturity;
incomplete, preferred, managed, defined, quantitatively managed, and optimised.
Virtual Corporation, a software and consultancy organisation, have developed the
Business Continuity Maturity Model; this is shown in Appendix F3. Tammineedi
(2010) argues that this model can be used to help benchmark progress in business
continuity in line with the British business continuity standard BS25999, and that it can
provide organisations with competitive advantage. In this model, there are six levels of
business continuity maturity ranging from self-governed to synergistic which are used
to rate eight core competencies. These competencies include:
• Leadership;
• employee awareness;
238
• business continuity program structure;
• program pervasiveness;
• metrics;
• resource commitment;
• external coordination; and
• business continuity program content.
A particularly useful part of this model is the use of the athlete analogy where each level
of maturity is related to a level of athletic performance. In this analogy the least resilient
organisations are able to crawl and the most resilient organisations are Olympic runners
(Virtual Corporation, 2005).
Duffy (2001, p. 20) discusses how maturity models are applied and argues that
“Immaturity in one area can affect success in another”. Gibson and Tarrant (2010, p. 7)
expand on this in the context of resilience and argue,
“Such a spectrum of resilience can be observed amongst different
organisations facing the same event; within a single organisation
experiencing different types of events, or over different periods of time; or
internally amongst different functions within an organisation”.
This is also important in the application of the resilience measurement tool developed
through this thesis. The tool can be used to compare resilience between departments,
functions, organisations, industry sectors or geographic areas, and can compare
resilience scores, benchmarks or levels of maturity.
8.2 A Methodology for Benchmarking Organisational Resilience
The purpose of this section is to answer research question 4:
What is a suitable benchmarking methodology for organisational resilience?
Figure 8.41 shows the resilience benchmarking methodology developed through this
thesis. The methodology consists of the resilience drivers (inputs), the benchmarking
239
process, the intermediate and financial outcomes, and stakeholder reactions (outputs),
and resilience maturity.
The resilience drivers are shown as the inputs to the benchmarking model. During this
stage organisations identify the business problem or unmet need. In this methodology,
the business problem identified plays a critical role because it provides the context for
the benchmarking exercise. Examples of business problems relating to organisational
resilience are discussed in section 8.1.3. These business problems provide the impetus
behind investments in resilience and provide a basis for the benefit side of a cost/benefit
analysis. For example, an organisation that took part in the Auckland study had recently
been restructured and merged with another organisation. As a result two separate
cultures, organisational identities and levels of resilience had also been restructured and
merged. The business problem in this case is an unknown and potentially uneven
resilience across the new organisational structure. In this example a measurement and
understanding of the organisation’s resilience strengths and weaknesses, and the
distribution of these across organisational departments and hierarchies, would be the
benefit achieved and this would be evaluated against the cost of using the measurement
tool.
The benchmarking process itself consists of 4 stages; plan, measure, analyse and adapt.
During the planning stage organisations use the business problem they have identified
to define the scope of their benchmarking exercise. This includes identifying specific
questions that they would like to answer, such how many of their staff are aware of the
organisation’s emergency plan. The planning stage also addresses the level and scale of
comparison included in the benchmarking. For example, organisations can compare
themselves against other organisations in their industry or geographic area, other
organisations under their parent company, or between departments or functions within
the organisation.
The measure stage involves the use of the resilience measurement tool developed
through this thesis to collect data about the organisation’s resilience which answers the
questions identified and addresses the business problem. During this stage staff are
asked to answer questions about the organisation’s resilience. This provides data on
each of the indicators of organisational resilience which is then analysed.
240
The analyse stage involves the calculation of resilience scores, strengths and
weaknesses and the calculation of the comparative resilience benchmark. This is a
percentage which tells an organisation which percentile their resilience score falls
within. An organisation with a resilience benchmark of 70% will be in the 70th
percentile which means that 69% of organisations achieved a lower resilience score and
30% of organisations scored a higher resilience score. This type of benchmark is only
meaningful when organisations are measured as a block e.g. in an annual survey of
resilience across an industry sector or geographic area. For organisations measuring
their resilience more frequently or outside of block measurements, the resilience scores
and scores for each of the indicators are more valuable. However once a base line of
data has been established through successive confirmatory studies (testing the tool
across cultures and a wider population of organisations), organisations could benchmark
their resilience more robustly against the baseline data.
The adapt stage involves the identification of possible solutions and the development
of resilience strategies which are aligned to the organisation’s business objectives.
Resilience strategies will usually represent a balance between addressing the strengths
and weaknesses identified stakeholders’ reactions to the results, and available resources.
The organisation then creates work programmes, assigns responsibilities and resources,
and takes actions to improve their resilience.
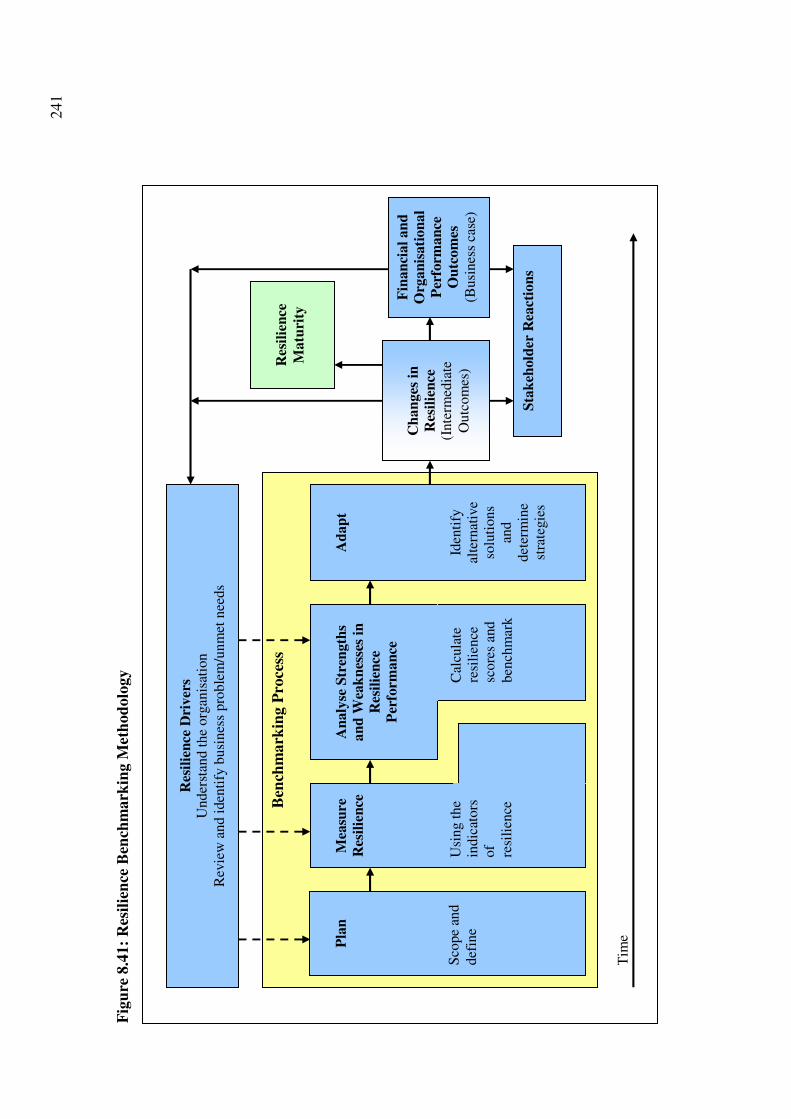
241
Fig
ure
8.4
1:
Res
ilie
nce
Ben
chm
ark
ing M
eth
od
olo
gy
Ben
chm
ark
ing P
roce
ss
Tim
e
P
lan
Sco
pe
and
def
ine
M
easu
re
Res
ilie
nce
U
sing t
he
indic
ators
of
resi
lien
ce
A
naly
se S
tren
gth
s
an
d W
eak
nes
ses
in
Res
ilie
nce
Per
form
an
ce
Cal
cula
te
resi
lien
ce
score
s an
d
ben
chm
ark
A
dap
t
Iden
tify
al
tern
ativ
e so
luti
ons
and
det
erm
ine
stra
tegie
s
Res
ilie
nce
Dri
ver
s U
nder
stan
d t
he
org
anis
atio
n
Rev
iew
and i
den
tify
busi
nes
s pro
ble
m/u
nm
et n
eeds
Sta
keh
old
er R
eact
ion
s
Fin
an
cial
an
d
Org
an
isati
on
al
Per
form
an
ce
Ou
tcom
es
(Busi
nes
s ca
se)
C
han
ges
in
Res
ilie
nce
(I
nte
rmed
iate
Outc
om
es)
R
esil
ien
ce
Matu
rity
242
The outputs of the tool are changes in resilience (intermediate outcomes), financial and
organisational performance outcomes, and stakeholder reactions. Changes in resilience
over time provide important information for the business case for resilience and for
evaluating the success of investments in resilience; this is discussed in Section 8.1.4.
Changes in resilience and financial and organisational performance outcomes then
feed back into the drivers of resilience and future iterations of the benchmarking
process. The links between improved resilience and financial and organisational
performance are discussed in Section 6.8. Once an organisation has measured and
benchmarked their resilience it is important to gauge stakeholder reactions to the
results. In particular any surprises (good or bad) should be discussed. An example
would be where an organisation achieves a very low score for planning indicators
despite continuous investment over the last five years in planning. In this case the
results for the planning indicators and an analysis of the difference in perception
between management and staff could help the organisation to improve their planning
more effectively and efficiently and to learn lessons about what does and does not work
in their organisation.
Resilience maturity is included in the model as a result of changes in resilience over
time. Further research is required to define robust levels of maturity; however in this
initial version five levels of resilience maturity are defined. In addition an example of a
resilience maturity model has been developed and can be seen in Appendix F2.
243
Chapter 9 – Conclusion
This chapter summarises the research findings, identifies the limitations of the research,
and discusses direction for future research in this area. The research findings are
presented in relation to the aims, objectives and research questions of this thesis.
9.1 Research Findings
The aim of this research was to:
1. Quantitatively test existing organisational resilience theory derived from
qualitative case study research against a wider population of organisations in
New Zealand.
2. To develop a survey tool to measure and benchmark organisations’ resilience.
The objectives of this research were to:
1. To review McManus’s (2007) definition and indicators of organisational
resilience, and propose a model of organisational resilience.
2. To develop metrics and a resilience measurement tool to measure and
benchmark organisations’ resilience.
3. To use the resilience measurement tool to test both McManus’s (2007) definition
and indicators, and the proposed model of organisational resilience.
4. To use the resilience measurement tool to gain a picture of the resilience of
organisations in Auckland, New Zealand.
The research questions for this research included:
1. What social or behavioural factors influence and determine organisations’
resilience?
2. What metrics can be developed to measure the indicators of organisational
resilience?
244
3. What conclusions can be drawn from the data about organisational resilience in
the Auckland region?
4. What is a suitable benchmarking methodology for organisational resilience?
This thesis reviewed McManus’s (2007) definition and indicators of organisational
resilience and developed additional indicators and metrics as part of a survey tool to
measure and benchmark organisational resilience. The survey tool was quantitatively
tested using a random sample of 249 individuals from 68 organisations in Auckland,
New Zealand. Data from this study was then used to test both McManus’s (2007)
definition and indicators, and the proposed model of organisational resilience; this
analysis generated the new model of organisational resilience. The results were
discussed in relation to the resilience of participating organisations, industry sectors and
Auckland as a whole.
9.1.1 A New Model of Organisational Resilience
The new model of organisational resilience developed through this thesis is shown again
as Figure 9.42. In the model, resilience is comprised of two dimensions; adaptive
capacity and planning, which are measured by a suite of thirteen indicators. Figure 9.42
also shows the definition of each indicator and each of the indicators which are
measured using the questions presented in Section 6.3.
This model represents a simplification or restructuring of the concept of organisational
resilience. McManus’s Relative Overall Resilience (ROR) model which was used as the
starting point for this research consisted of three dimensions; situation awareness,
management of keystone vulnerabilities and adaptive capacity, and fifteen indicators.
Other models reviewed in the literature review also had complex structures. Despite the
structure of the new model it still incorporates all of the dimensions of the earlier
models, just within a simpler structure. The new model of organisational resilience is
inclusive and supports literature reviewed by McManus (2007) as well as this thesis.
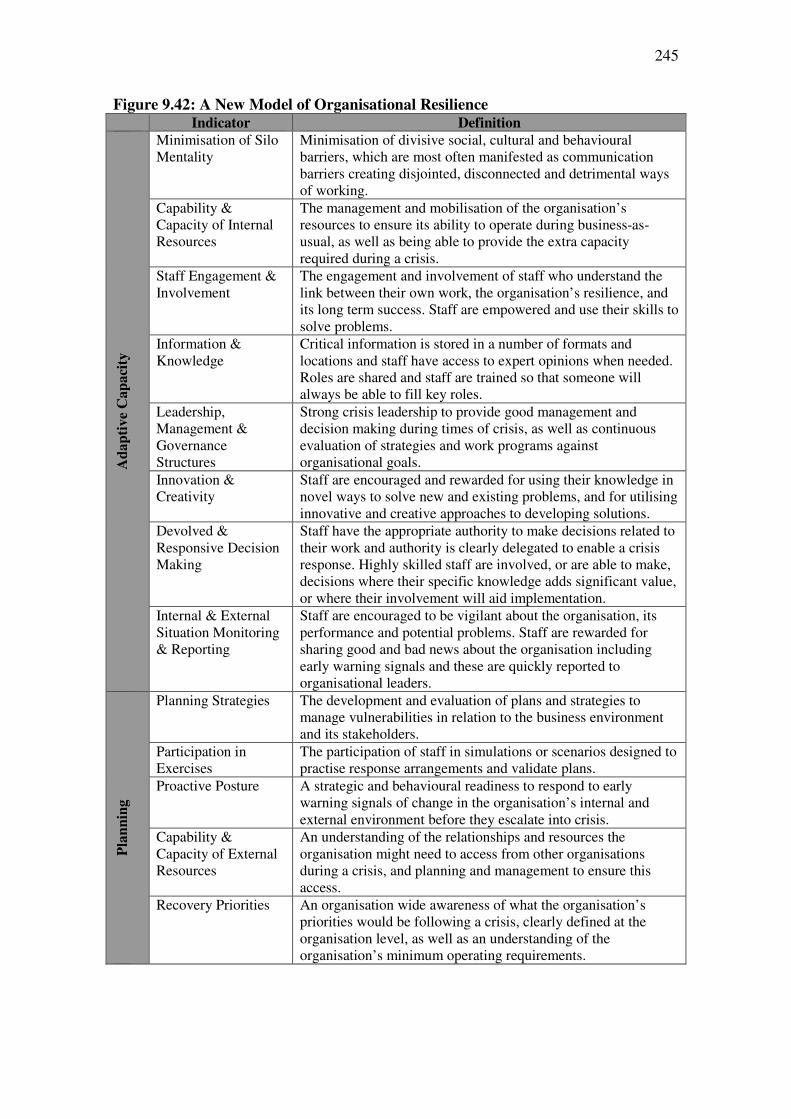
245
Figure 9.42: A New Model of Organisational Resilience Indicator Definition
Ad
ap
tiv
e C
ap
aci
ty
Minimisation of Silo Mentality
Minimisation of divisive social, cultural and behavioural barriers, which are most often manifested as communication barriers creating disjointed, disconnected and detrimental ways of working.
Capability & Capacity of Internal Resources
The management and mobilisation of the organisation’s resources to ensure its ability to operate during business-as-usual, as well as being able to provide the extra capacity required during a crisis.
Staff Engagement & Involvement
The engagement and involvement of staff who understand the link between their own work, the organisation’s resilience, and its long term success. Staff are empowered and use their skills to solve problems.
Information & Knowledge
Critical information is stored in a number of formats and locations and staff have access to expert opinions when needed. Roles are shared and staff are trained so that someone will always be able to fill key roles.
Leadership, Management & Governance Structures
Strong crisis leadership to provide good management and decision making during times of crisis, as well as continuous evaluation of strategies and work programs against organisational goals.
Innovation & Creativity
Staff are encouraged and rewarded for using their knowledge in novel ways to solve new and existing problems, and for utilising innovative and creative approaches to developing solutions.
Devolved & Responsive Decision Making
Staff have the appropriate authority to make decisions related to their work and authority is clearly delegated to enable a crisis response. Highly skilled staff are involved, or are able to make, decisions where their specific knowledge adds significant value, or where their involvement will aid implementation.
Internal & External Situation Monitoring & Reporting
Staff are encouraged to be vigilant about the organisation, its performance and potential problems. Staff are rewarded for sharing good and bad news about the organisation including early warning signals and these are quickly reported to organisational leaders.
Pla
nn
ing
Planning Strategies The development and evaluation of plans and strategies to manage vulnerabilities in relation to the business environment and its stakeholders.
Participation in Exercises
The participation of staff in simulations or scenarios designed to practise response arrangements and validate plans.
Proactive Posture A strategic and behavioural readiness to respond to early warning signals of change in the organisation’s internal and external environment before they escalate into crisis.
Capability & Capacity of External Resources
An understanding of the relationships and resources the organisation might need to access from other organisations during a crisis, and planning and management to ensure this access.
Recovery Priorities An organisation wide awareness of what the organisation’s priorities would be following a crisis, clearly defined at the organisation level, as well as an understanding of the organisation’s minimum operating requirements.
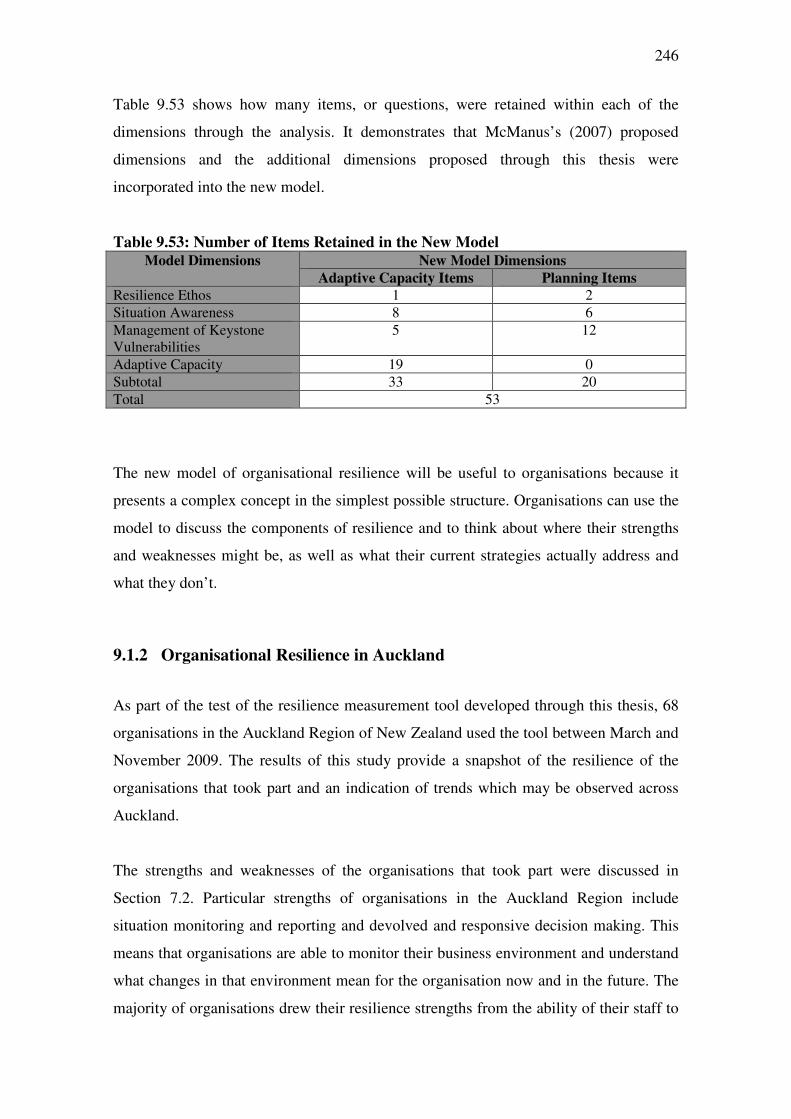
246
Table 9.53 shows how many items, or questions, were retained within each of the
dimensions through the analysis. It demonstrates that McManus’s (2007) proposed
dimensions and the additional dimensions proposed through this thesis were
incorporated into the new model.
Table 9.53: Number of Items Retained in the New Model
Model Dimensions New Model Dimensions
Adaptive Capacity Items Planning Items
Resilience Ethos 1 2
Situation Awareness 8 6
Management of Keystone Vulnerabilities
5 12
Adaptive Capacity 19 0
Subtotal 33 20
Total 53
The new model of organisational resilience will be useful to organisations because it
presents a complex concept in the simplest possible structure. Organisations can use the
model to discuss the components of resilience and to think about where their strengths
and weaknesses might be, as well as what their current strategies actually address and
what they don’t.
9.1.2 Organisational Resilience in Auckland
As part of the test of the resilience measurement tool developed through this thesis, 68
organisations in the Auckland Region of New Zealand used the tool between March and
November 2009. The results of this study provide a snapshot of the resilience of the
organisations that took part and an indication of trends which may be observed across
Auckland.
The strengths and weaknesses of the organisations that took part were discussed in
Section 7.2. Particular strengths of organisations in the Auckland Region include
situation monitoring and reporting and devolved and responsive decision making. This
means that organisations are able to monitor their business environment and understand
what changes in that environment mean for the organisation now and in the future. The
majority of organisations drew their resilience strengths from the ability of their staff to
247
be responsive and adaptive to change. This includes expert decision making based on a
balance between skills, experience and authority. Particular weaknesses of organisations
in the Auckland Region include planning strategies and external resources. Of the
organisations that took part in the study, only 24 (35%) have emergency or crisis
management plans, and of those organisations only 12 (50%) said that their plans were
sufficient to be useful in a crisis. The majority of organisations had not identified
resources that they might need to access from outside of their organisations during a
crisis. This creates vulnerability in crises affecting physical infrastructure or resources
because while many organisations assume that they will be able to access what they
need (e.g. generators at short notice) the availability of these resources is not guaranteed
and has not been investigated.
9.1.3 The Business Case for Organisational Resilience
For organisations to invest in resilience they must be able to make a business case for
resilience investment based on evidence which demonstrates the value added by
resilience. The business case for resilience must be as good as, or better than, the case
for new equipment or a new member of staff. It must be able to compete against other
cases for investment put before the executive or board.
The resilience measurement tool developed through this thesis included a series of
financial and management questions designed to investigate the link between resilience
and organisational performance; this is presented in Section 6.8. This analysis identified
significant relationships between organisations’ resilience scores and their cash flow,
profit to sales ratio and return on investment. This is a significant contribution of this
thesis and while causality cannot yet be determined it provides evidence for the
relationship between organisational resilience and organisational performance which
can be used to form and test future hypotheses.
248
9.2 Research Limitations and Future Research
This section discusses the limitations of the research presented in this thesis and how
each of them could be addressed through future research. The limitations identified
include:
• Sample size
• Different levels of participation within each organisation
• Discontinuities between perceptions of senior managers and staff
• Weaknesses in the planning strategies indicator
• Lack of consideration of physical and infrastructural measures
• Lack of confirmation of the structure of the new model and the indicators
• Lack of knowledge about the relationships between the indicators and possible
causality within the model
• Lack of information validation of the tool and whether organisations achieving a
high score would be more resilient in a crisis
• Measures of organisational performance
• The business case for resilience
9.2.1 Sample Size
The 68 organisations that took part in this research represent a small sample size.
However, they provide a larger sample than many disaster and crisis management
studies. The sample size achieved had several impacts on this thesis and what could be
achieved.
Firstly although the sample of 249 individuals was suitable for factor analysis and a new
model of organisational resilience was developed, the sample was not large enough to
complete a robust multiple regression at organisation level. This means that while the
research identified the indicators of organisational resilience and their structure under
the two dimensions, it was not able to investigate the relationships between the
indicators within the dimensions. The relationships between the indicators of
organisational resilience are important because it is likely that some indicators have
249
more impact on organisational resilience than others. Knowledge of these relationships
and which indicators have the most impact on resilience will enable researchers to
introduce weightings into the calculation of resilience scores and will make the
resilience measurement and benchmarking tool more accurate. This information could
also help organisations to identify the most efficient ways to improve their resilience.
The techniques that were used to encourage organisations to take part in the research
were discussed in Section 6.1. This discussion included giving organisations notice of
the research before they were approached to take part. In this thesis, an invitation letter
was sent ahead of the invitation email to introduce the research, however as discussed in
Section 4.3, this had very little effect. In future research it is suggested that much more
time is spent building up a profile of the research topic and raising awareness among the
sample population. While this may not be practical for Ph.D. research it is possible that
more promotion of the research agenda, in advance of the research, would encourage
more organisations to take part. A further option for achieving a higher response rate,
especially in future administration of the resilience measurement tool to a random
sample, would be to invite senior managers to an event at which the business case for
the research agenda was presented and they were able to take the survey. Staff copies of
the resilient measurement tool could then be emailed or posted to organisations once
senior management buy-in was achieved.
9.2.2 Stratified Samples
In this thesis the researcher asked that as many staff as possible from each organisation
take part in the research. For some organisations this resulted in high internal response
rate, however for others only one member of staff took part. This represents a potential
problem with the representativeness of the sample. This is because in those
organisations where only one member of staff has taken part, the results of their
organisation are based on a single opinion.
As discussed in Section 4.1.1, there is no clear direction for specifying a number or
percentage of staff that should take part and this should be investigated further before
the tool can be used robustly with low levels of internal representation.
250
9.2.3 Differences in Perception of Organisational Resilience between Senior
Managers and Staff
When using the resilience measurement tool individual participants were asked to
specify their hierarchical level within the organisation; senior manager, middle
manager, team leader or supervisor, or staff. During the Auckland study the researcher
observed differences in the answers between senior managers and staff. While this
provides an interesting question for future research it also presents a possible problem.
As discussed above, internal representation is important so that the organisation’s
results accurately reflect the whole organisation as opposed to the opinions and
experience of only one member of staff. If individual participants have different
perceptions and experiences of their organisation’s resilience which are related to their
hierarchical position within the organisation, then perhaps the sample of participants
from each organisation also needs to be stratified to make sure that all hierarchical
levels are represented equally.
Hofstede (1990) took this approach and used a stratified sample within organisations to
achieve representation across the different hierarchical levels. He surveyed
approximately 60 individuals from each of his sample organisations and stratified these
so that roughly 20 individuals were managers, 20 were professionals and 20 were non-
professionals. It is recommended that the benefits of stratifying a sample in this way
should be examined and tested in relation to the resilience measurement tool.
9.2.4 Strengthening the Planning Strategies Indicator
The planning strategies indicator developed through this thesis is designed to measure
whether an organisation develops and evaluates plans and strategies to manage
vulnerabilities in relation to its business environment and stakeholders. The items or
questions used to measure the planning strategies indicator are discussed in Section
6.3.9 and are presented again below in Table 9.54. Together, the items achieve a
Cronbach’s alpha of 0.677 which is just below the minimum of 0.7 suggested by Hinkin
(1998) for a reliable indicator.
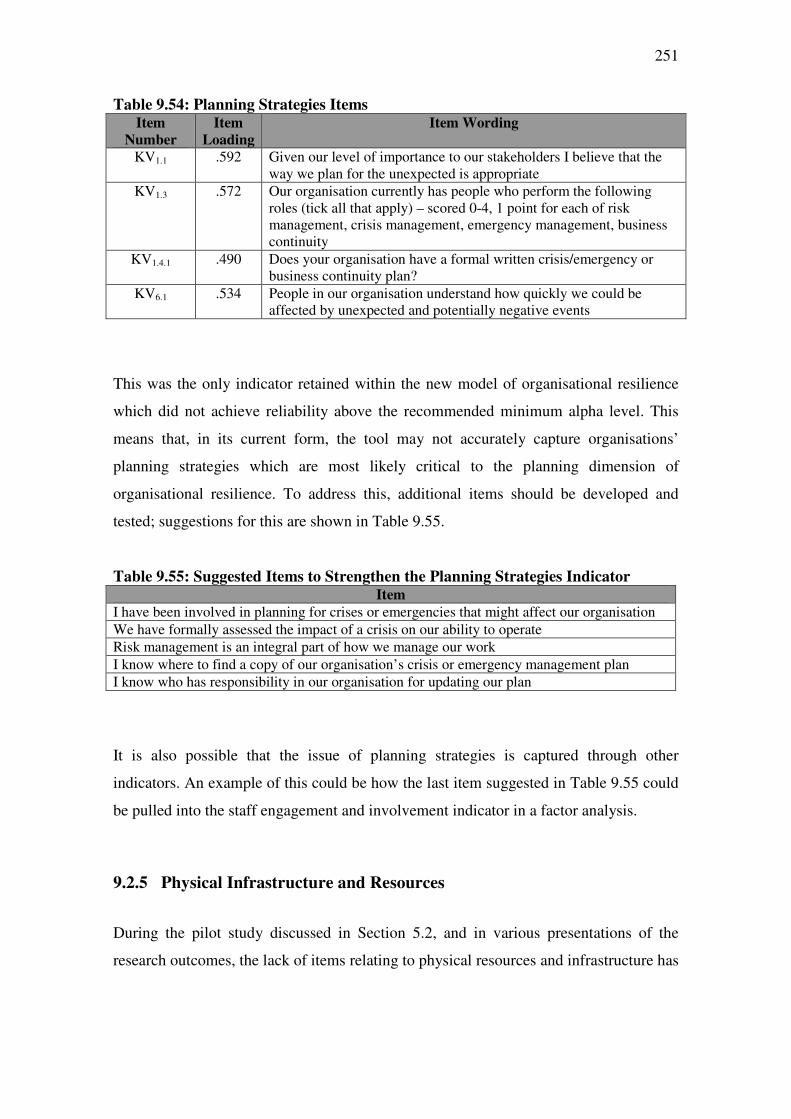
251
Table 9.54: Planning Strategies Items Item
Number
Item
Loading
Item Wording
KV1.1 .592 Given our level of importance to our stakeholders I believe that the way we plan for the unexpected is appropriate
KV1.3 .572 Our organisation currently has people who perform the following roles (tick all that apply) – scored 0-4, 1 point for each of risk management, crisis management, emergency management, business continuity
KV1.4.1 .490 Does your organisation have a formal written crisis/emergency or business continuity plan?
KV6.1 .534 People in our organisation understand how quickly we could be affected by unexpected and potentially negative events
This was the only indicator retained within the new model of organisational resilience
which did not achieve reliability above the recommended minimum alpha level. This
means that, in its current form, the tool may not accurately capture organisations’
planning strategies which are most likely critical to the planning dimension of
organisational resilience. To address this, additional items should be developed and
tested; suggestions for this are shown in Table 9.55.
Table 9.55: Suggested Items to Strengthen the Planning Strategies Indicator Item
I have been involved in planning for crises or emergencies that might affect our organisation
We have formally assessed the impact of a crisis on our ability to operate
Risk management is an integral part of how we manage our work
I know where to find a copy of our organisation’s crisis or emergency management plan
I know who has responsibility in our organisation for updating our plan
It is also possible that the issue of planning strategies is captured through other
indicators. An example of this could be how the last item suggested in Table 9.55 could
be pulled into the staff engagement and involvement indicator in a factor analysis.
9.2.5 Physical Infrastructure and Resources
During the pilot study discussed in Section 5.2, and in various presentations of the
research outcomes, the lack of items relating to physical resources and infrastructure has
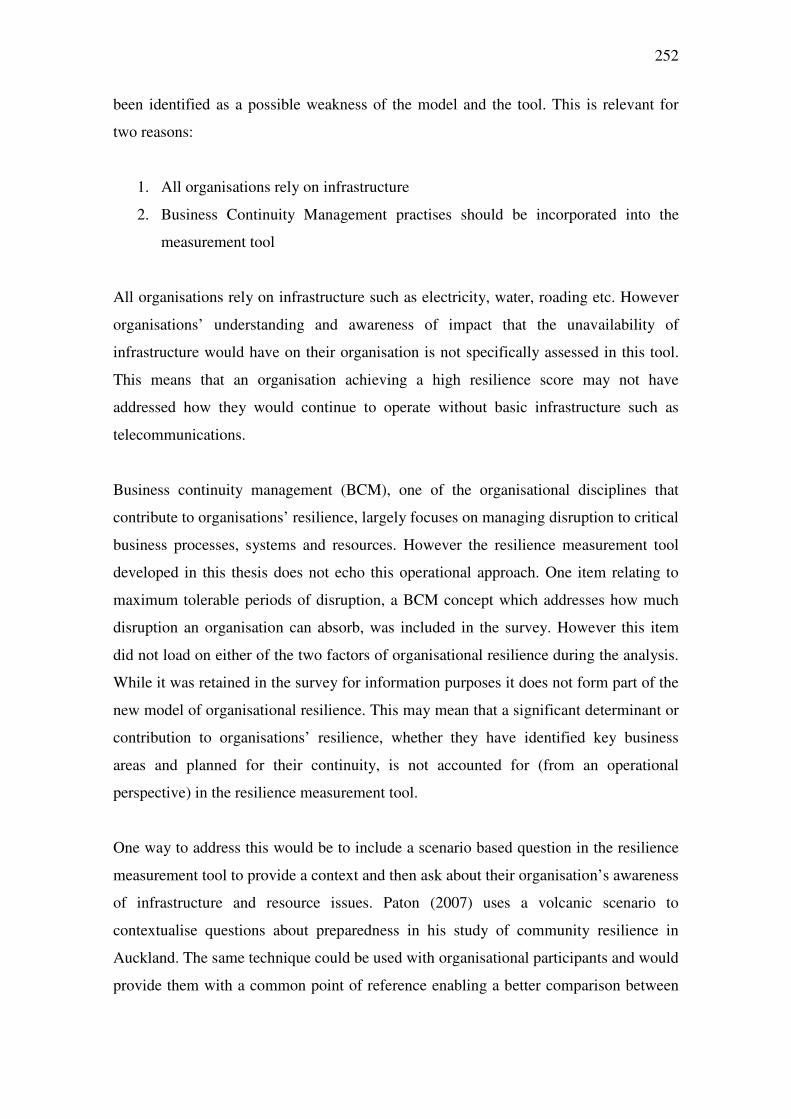
252
been identified as a possible weakness of the model and the tool. This is relevant for
two reasons:
1. All organisations rely on infrastructure
2. Business Continuity Management practises should be incorporated into the
measurement tool
All organisations rely on infrastructure such as electricity, water, roading etc. However
organisations’ understanding and awareness of impact that the unavailability of
infrastructure would have on their organisation is not specifically assessed in this tool.
This means that an organisation achieving a high resilience score may not have
addressed how they would continue to operate without basic infrastructure such as
telecommunications.
Business continuity management (BCM), one of the organisational disciplines that
contribute to organisations’ resilience, largely focuses on managing disruption to critical
business processes, systems and resources. However the resilience measurement tool
developed in this thesis does not echo this operational approach. One item relating to
maximum tolerable periods of disruption, a BCM concept which addresses how much
disruption an organisation can absorb, was included in the survey. However this item
did not load on either of the two factors of organisational resilience during the analysis.
While it was retained in the survey for information purposes it does not form part of the
new model of organisational resilience. This may mean that a significant determinant or
contribution to organisations’ resilience, whether they have identified key business
areas and planned for their continuity, is not accounted for (from an operational
perspective) in the resilience measurement tool.
One way to address this would be to include a scenario based question in the resilience
measurement tool to provide a context and then ask about their organisation’s awareness
of infrastructure and resource issues. Paton (2007) uses a volcanic scenario to
contextualise questions about preparedness in his study of community resilience in
Auckland. The same technique could be used with organisational participants and would
provide them with a common point of reference enabling a better comparison between
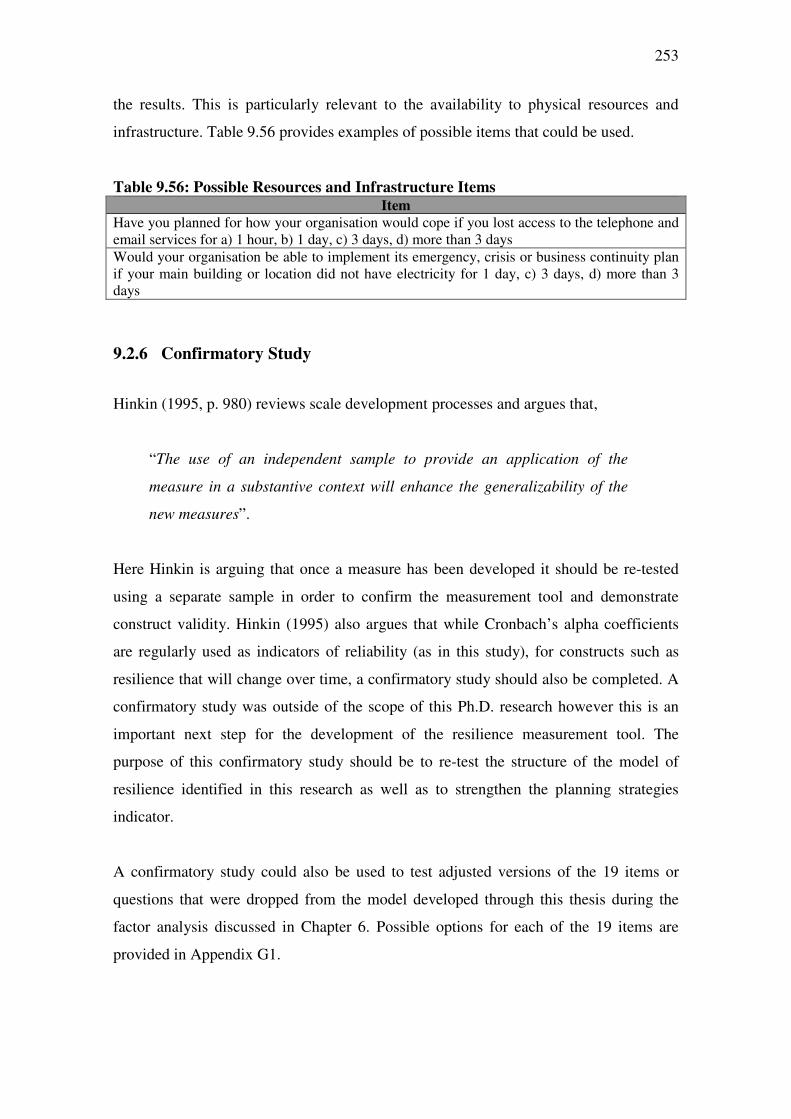
253
the results. This is particularly relevant to the availability to physical resources and
infrastructure. Table 9.56 provides examples of possible items that could be used.
Table 9.56: Possible Resources and Infrastructure Items
Item
Have you planned for how your organisation would cope if you lost access to the telephone and email services for a) 1 hour, b) 1 day, c) 3 days, d) more than 3 days
Would your organisation be able to implement its emergency, crisis or business continuity plan if your main building or location did not have electricity for 1 day, c) 3 days, d) more than 3 days
9.2.6 Confirmatory Study
Hinkin (1995, p. 980) reviews scale development processes and argues that,
“The use of an independent sample to provide an application of the
measure in a substantive context will enhance the generalizability of the
new measures”.
Here Hinkin is arguing that once a measure has been developed it should be re-tested
using a separate sample in order to confirm the measurement tool and demonstrate
construct validity. Hinkin (1995) also argues that while Cronbach’s alpha coefficients
are regularly used as indicators of reliability (as in this study), for constructs such as
resilience that will change over time, a confirmatory study should also be completed. A
confirmatory study was outside of the scope of this Ph.D. research however this is an
important next step for the development of the resilience measurement tool. The
purpose of this confirmatory study should be to re-test the structure of the model of
resilience identified in this research as well as to strengthen the planning strategies
indicator.
A confirmatory study could also be used to test adjusted versions of the 19 items or
questions that were dropped from the model developed through this thesis during the
factor analysis discussed in Chapter 6. Possible options for each of the 19 items are
provided in Appendix G1.
254
9.2.7 Relationships between Indicators
Full investigation of the causal relationships between the indicators of organisational
resilience, was outside of the scope of this Ph.D. thesis. However, an understanding of
the relationships between the indicators is important. The calculation of resilience
scores in this thesis treated all of the indicators as though they contributed equally to
organisations’ resilience in an additive model. In reality, this is unlikely and it may
skew the measurement tool. An understanding of the causal relationships between the
indicators will enable the weighting of indicators, and will help to develop a more
robust measurement tool as it moves to a multiplicative model.
In future research, structural equation modelling (SEM) should be used to investigate
and model the relationships between the dimensions and indicators of organisational
resilience. SEM is also capable of investigating causality between the indicators and
dimensions, and the discussion below can be used as a starting point.
In the planning dimension, it is likely that recovery priorities (P4), proactive posture (P5)
and participation in exercises (P2) have more influence than the other planning
indicators – possibly because they determine the other indicators. As a result, the
recovery priorities, proactive posture and participation in exercises indicators could be
weighted during the calculation of resilience results; this is shown in the example
below.
Planning = ((4x P4) + (3x P5) + (2x P2) + P2+ P3+ P4)
In the adaptive capacity dimension, it is likely that leadership (A1) and innovation and
creativity (A7) have more influence than other adaptive capacity indicators. These too
could be weighted during the calculation of resilience results; this is shown in the
example below.
Adaptive Capacity = ((3x A1) + (2x A7) + A2 + A3 + A4 +A5 + A6 + A8)
255
When considering overall resilience, the literature suggests that a balance between
planning (P) and adaptive capacity (AC) must be achieved; however this need not
necessarily be an equal balance. An example of this is shown below.
Resilience = P + (2 x AC)
9.2.8 Longitudinal and Case Study Research
Part of the rationale for this research is that organisations need information on their
resilience strengths and weaknesses and how these change over time so that they can
evaluate resilience strategies and investments. However this study has not investigated
the use of the resilience measurement tool over time.
This could be achieved through a case study of a small sample of organisations from the
Auckland sample to follow up on how their resilience has changed and whether they
found the results of the study useful. A case study could also significantly contribute to
the business case for resilience by investigating the relationship between investments
made in resilience and changes in organisational resilience over the investment period.
This would enable the investigation of the extent to which investments in resilience
have improved resilience scores within a given time period.
Longitudinal research using the resilience measurement tool would also help to evaluate
whether the tool produces accurate measurements of organisations’ resilience. This
would require organisations to use the measurement tool on a regular basis and after
significant crises that affect the organisation. The assumption here is that the tool will
be able to track organisations’ resilience over time and that an organisation who
achieves consistently high resilience scores will be resilient.
9.2.9 Measures of Organisational Performance
The analysis of measures of organisational performance in this thesis identified
significant relationships between organisations’ resilience scores and their cash flow,
profit to sales ratio and return on investment for for-profit organisations. However the
256
number of not-for-profit organisations in the sample was not large enough to provide a
robust investigation of performance measures for not-for-profit organisations. This is a
limitation of the tool because it does not yet measure organisational performance
(including measures for not-for-profit organisations) accurately enough.
Future studies should aim to develop this part of the resilience measurement tool and
especially to test possible key performance indicators on a wider sample of
organisations.
9.3.10 The Business Case for Resilience
This thesis represents the first step towards a business case for organisational resilience.
However the research does not yet demonstrate a causal relationship between resilience
and organisational performance. This is a limitation of this research because without a
business case which demonstrates that investments in resilience add as much, if not
more value, than other investments, organisations will not be encouraged to allocate
resources to the resilience.
Once the tool has been confirmed and refined through confirmatory study with a larger
sample of organisations and measures of organisational performance (in relation to
resilience) have been refined, the business case for resilience will be stronger.
9.3 Thesis Summary
The purpose of this thesis was to development a methodology and tool to measure and
benchmark organisational resilience. To achieve this, organisational resilience theory
derived from qualitative case study research has been empirically tested against a
random sample of Auckland organisations. Three significant contributions this research
include the new model of organisational resilience, the organisational resilience
measurement tool, and the resilience benchmarking methodology.
The new model of organisational resilience presented in Section 6.3 and discussed again
in Section 9.1.1, suggests that resilience is comprised of two dimensions; adaptive
257
capacity and planning. In turn these dimensions are measured using thirteen indicators
of organisational resilience. The new model reflects a simpler structure than the
literature on measuring organisational resilience would suggest, however it supports the
central theme of anticipation vs. resilience, which runs throughout the disaster and crisis
management literature.
The organisational resilience measurement tool operationalises the new model of
organisational resilience developed through this thesis and enables organisations to
actually use the model. The tool consists of 14 demographic and background questions,
53 resilience measurement questions, and 15 organisational performance questions. The
adaptive capacity and planning dimensions, and the overall measurement tool, achieve
acceptable alpha scores indicating that the resilience measurement tool is reliable and
has good internal consistency.
The resilience benchmarking methodology presented in Chapter 8 was developed to
guide organisations in using the tool as part of a continuous cycle of resilience
management or improvement. The methodology is the result of the literature review and
the researcher’s experience of the administration and use of the tool. It provides
organisations with a process which they can use to make sure that the resilience
measurement tool produces useful results for their organisation. This is important not
only for the continued use of the tool but also to provide information for the business
case for organisational resilience.
Through the development of the resilience measurement tool and the benchmarking
methodology this thesis has satisfied the four research objectives identified in Sections
1.3 and 9.1 and has also answered the four research questions presented in Sections 2.6
and 9.1. It has reviewed literature, identified indicators, developed metrics, tested the
tool and presented a picture of the resilience of Auckland organisations, and has also
presented a resilience benchmarking methodology.

258
259
References Adger, W. N., Hughes, T. P., Folke, C., Carpenter, S., & Rockstrom, J. (2005). Social-
Ecological Resilience to Coastal Disasters. Science, 309(5737), 1036-1039. Alesch, D. J., & Holly, J. N. (1998). Small Business Failure, Survival and Recovery:
Lessons from the January 1994 Northridge Earthquake. Paper presented at the NEHRP Conference and Workshop on Research on the Northridge, California Earthquake of January 17th 1994.
Alexander, D. (2000). Scenario Methodology for Teaching Principles of Emergency Management. Disaster Prevention and Management, 9(2), 89-97.
Alexander, D. (2002). Principles of Emergency Planning and Management. New York: Oxford University Press.
Alexander, D. (2005). Towards the Development of a Standard in Emergency Planning. Disaster Prevention and Management, 14(2), 158-175.
Anderson, B., & Pettersen, P.-G. (1996). The Benchmarking Handbook: Step-by-Step Instructions. London: Chapman and Hall.
Anderson, N. R., & West, M. A. (1998). Measuring Climate for Work Group Innovation: Development and Validation of the Team Climate Inventory Journal of Organizational Behavior, 19(3).
Anderson, P. (1999). Complexity Theory and Organization Science. Organization Science, 10(3), 216-232.
ANSI (2009). Organizational Resilience: Security, Preparedness, and Continuity Management Systems - Requirements with Guidance for Use: American National Standards Institute.
Antonsen, S. (2009). Safety Culture Assessment: A Mission Impossible? Journal of Contingencies and Crisis Management, 14(4), 242-254.
Appiah, K. O., & Abor, J. (2009). Predicting Corporate Failure: Some Empirical Evidence from the UK. Benchmarking: An International Journal, 16(3), 432-444.
AS/NZ (2004). Risk Management 4360:2004: Standards New Zealand & Standards Australia.
AS/NZ (2010). 5050:2010 Business Continuity - Managing Disruption Related Risk: Australian New Zealand Standards.
Ashkanasy, N. M., Wilderom, C. P. M., & Peterson, M. F. (Eds.). (2000). Handbook of Organizational Culture and Climate. USA: Sage Publications.
Auckland Civil Defence Emergency Management Group (2008). Area Covered by the Auckland Region CDEM Group Retrieved 30th January 2009, 2009, from http://www.auckland.cdemg.org.nz/about.htm
Baird, D. ( 1987). Exploratory Factor Analysis, Instruments and the Logic of Discovery. The British Journal for the Philosophy of Science, 38(3), 319-337.
BCI (2006). Business Continuity Management, Part 1: Code of Practice: Business Standards Institute.
BCI (2007). BCI Benchmark Retrieved 5th March 2007, 2007, from http://www.thebci.org/bcibenchmark.html
Bello, D., Claussen, L., Greene, M. V., & Morrison, K. W. (2007). Gao Challenges Fema to Improve Disaster Preparedness. Safety & Health, 176(3), 14.
Benini, A. A. (1999). Network without Centre? A Case Study of an Organizational Network Responding to an Earthquake. Journal of Contingencies and Crisis Management, 7(1), 38-47.
260
Beunza, D., & Stark, D. (2004). Survival and Sensemaking: Organizational Resilience in a Wall Street Trading Room after 9/11. Barcelona, Spain: Universat Pomeu Fabra, Department of Economics and Business.
Bhutta, K. S., & Huq, F. (1999). Benchmarking - Best Practices: An Integrated Approach. Benchmarking: An International Journal, 6(3), 254-268.
Bigley, G. A., & Roberts, K. H. (2001). The Incident Command System: High Reliability Organizing for Complex and Volatile Task Environments. Academy of Management Journal, 44(6), 1281-1299.
Birkland, T. A. (2009). Disasters, Lessons Learned, and Fantasy Documents. Journal of Contingencies and Crisis Management, 17(3), 146-156.
Blythe, B. T. (2010). Strategic Crisis Leadership, a Paper Presented at the 20th World Conference on Disaster Management, 6-9th June 2010. Toronto, Canada.
Boin, A., & Lagadec, P. (2000). Preparing for the Future: Critical Challenges in Crisis Management. Journal of Contingencies and Crisis Management, 8(4), 185-191.
Boin, A., & McConnell, A. (2007). Preparing for Critical Infrastructure Breakdowns: The Limits of Crisis Management and the Need for Resilience. Journal of Contingencies and Crisis Management, 15(1), 50-59.
Borgatti, S. P., & Foster, P. C. (2003). The Network Paradigm in Organizational Research: A Review and Typology. Journal of Management, 29(6), 991-1013.
Borodzicz, E., & van Haperen, K. (2002). Individual and Group Learning in Crisis Simulations. Journal of Contingencies and Crisis Management, 10(3), 139-147.
Bourque, L. B., Shoaf, K. I., & Nguyen, L. H. (2002). Survey Research. In R. A. Stallings (Ed.), Methods of Disaster Research (pp. 157-193): Xlibris Corporation.
Brown, S. L., & Eisenhardt, K. M. (1997). The Art of Continuous Change: Linking Complexity Theory and Time-Paced Evolution in Relentlessly Shifting Organisations. Administrative Science Quarterly, 42(1), 1-34.
Bryman, A., & Bell, E. (2007). Business Research Methods (2nd ed.). New York: Oxford University Press.
BSI (2006). Business Continuity Management, Part 1: Code of Practice: British Standards Institute.
Buchanan, M. (2004). Power Laws and the New Science of Complexity Management. Strategy and Business, 34, 2-10.
Buckle, P. (2006). Assessing Social Resilience. In D. Paton & D. Johnston (Eds.), Disaster Resilience: An Integrated Approach: Charles C. Thomas.
Bunderson, J. S., Lofstrom, S. M., & Van de Ven, A. H. (2000). Conceptualizing and Measuring Professional and Administrative Models of Organizing. Organizational Research Methods, 3(4), 366-391.
Business Continuity Institute (2010). The Business Case for BCM. London: Business Continuity Institute.
Caralli, R. A., Allen, J. H., Curtis, P. D., White, D. W., & Young, L. R. (2010). CERT® Resilience Management Model, Version 1.0 Improving Operational Resilience Processes. Hanscom AFB, MA: Carnegie Mellon University and The Software Engineering Institute.
Carmeli, A., & Schaubroeck, J. (2008). Organisational Crisis- Preparedness: The Importance of Learning from Failures. Long Range Planning, 41(2), 177-196.
Carpenter, S., Walker, B., Anderies, J. M., & Abel, N. (2001). From Metaphor to Measurement: Resilience of What to What? Ecosystems, 4(8), 765-781.
261
Carroll, J. S. (1998). Organisational Learning Activities in High-Hazard Industries: The Logics Underlying Self-Analysis. Journal of Management Studies, 35(6), 699-717.
Carthey, J., de Leval, M. R., & Reason, J. T. (2001). Institutional Resilience in Healthcare Systems. Quality in Healthcare, 10, 29-32.
Carton, R. B., & Hofer, C. W. (2006). Measuring Organizational Performance: Metrics for Entrepreneurship and Strategic Management Research. Cheltnam, UK: Edward Elgar.
Casey, C., & Bartczak, N. (1985). Using Operating Cash Flow Data to Predict Financial Distress: Some Extensions Journal of Accounting Research 23(1), 384-401.
Castillo, C. (2004). Disaster Preparedness and Business Continuity Planning at Boeing: An Integrated Model. Journal of Facilities Management, 3(1), 8.
Cerullo, V., & Cerullo, M. J. (2004). Business Continuity Planning: A Comprehensive Approach. Information Systems Management.
Chakravarthy, B. S. (1982). Adaptation: A Promising Metaphor for Strategic Management. The Academy of Management Review, 7, 35-44.
Chang, S. E., & Chamberlin, C. (2003). Assessing the Role of Lifeline Systems in Community Disaster Resilience. Buffalo: NY: MCEER.
Chang, S. E., & Falit-Baiamonte, A. (2003). Disaster Vulnerability of Businesses in the 2001 Nisqually Earthquake. Environmental Hazards, 2-3, 59-71.
Charitou, A., Neophytou, E., & Charalambous, C. (2004). Predicting Corporate Failure: Empirical Evidence for the UK. European Accounting Review, 13(3), 465-497.
Cho, C. W. (1996). The Knowing Organization: How Organizations Use Information to Construct Meaning, Create Knowledge and Make Decisions. International Journal of Information Management, 16(5), 329-340.
Cho, S., Mathiassen, L., & Robey, D. (2006). The Dialectics of Resilience: A Multilevel Analysis of a Telehealth Innovation In B. Donnellan, et al. (Eds.), The Transfer and Diffusion of Information Technology for Organizational Resilience (Vol. 206). Boston: Springer Boston.
Chow, W. S. (2000). Success Factors for IS Disaster Recovery Planning in Hong Kong. InformationManagement & Computer Security, 8(2), 80-86.
Christopher, M., & Peck, H. (2004). Building the Resilient Supply Chain. The International Journal of Logistics Management, 15(2), 1-14.
Civil Contingencies Act (2004). Civil Contingencies Secretariat (2010). Emergency Response and Recovery. Retrieved
7th July 2010. from http://www.cabinetoffice.gov.uk/media/353478/err-guidance-050410.pdf.
Clarke, L. B. (1999). Mission Improbable: Using Fantasy Documents to Tame Disaster. Chicago: University of Chicago Press.
Codling, S. (1996). Best Practise Benchmarking an International Perspective: Gulf Publishing.
Coleman, L. (2004). The Frequency and Cost of Corporate Crises. Journal of Contingencies and Crisis Management, 12(1), 2013.
Coles, E. (2003). A Systems Perspective on United Kingdom National Vulnerability: The Policy Agenda.
Coles, E., & Buckle, P. (2004). Developing Community Resilience as a Foundation for Effective Disaster Recovery. The Australian Journal of Emergency Management, 19(4), 6-15.
Collins, J. C., & Porras, J. I. (2000). Built to Last Successful Habits of Visionary Companies (3rd ed.). Chatham, UK: Random House Publishing.
262
Comfort, L. K. (1994). Self-Organisation in Complex Systems. Journal of Public Administration Research and Theory, 4(3), 393-410.
Comfort, L. K., Sungu, Y., Johnson, D., & Dunn, M. (2001). Complex Systems in Crisis: Anticipation and Resilience in Dynamic Environments. Journal of Contingencies and Crisis Management, 9(3), 144-158.
Conger, J. A., & Kanungo, R. N. (1994). Charismatic Leadership in Organizations: Perceived Behavioral Attributes and Their Measurement. Journal of Organizational Behavior, 12, 439-452.
Coombs, W. T., & Holladay, S. J. (2002). Helping Crisis Managers Protect Reputational Assets. Management Communication Quarterly, 16(2), 165-186.
Cotton, E. A. (1993). Crisis! Lessons from the L.A. Riots One Year Later. Public Utilities Fortnightly, 131(7), 20.
Coutu, D. (2002). How Resilience Works. Harvard Business Review, 80(5), 46-50. Crichton, M. T., Lauche, K., & Flin, R. (2005). Incident Command Skills in the
Management of an Oil Industry Drilling Incident: A Case Study. Journal of Contingencies and Crisis Management, 13(3), 116-128.
Crichton, M. T., Ramsay, C. G., & Kelly, T. (2009). Enhancing Organizational Resilience through Emergency Planning: Learnings from Cross-Sectoral Lessons. Journal of Contingencies and Crisis Management, 17(1), 24-37.
Dalziell, E., & McManus, S. (2004). Resilience, Vulnerability and Adaptive Capacity: Implications for System Performance. Paper presented at the International Forum for Engineering Decision Making.
Dawes, S. S., Cresswell, A. M., & Cahan, B. B. (2004). Learning from Crisis: Lessons in Human and Information Infrastructure from the World Trade Center Response. Social Science Computer Review, 22(1), 52-66.
De Pree, M. (1998). What Is Leadership? In G. R. Hickman (Ed.), Leading Organizations Perspectives for a New Era. Thousand Oaks, California: Sage.
Dekker, S. (2006). Resilience Engineering: Chronicling the Emergence of Confused Consensus In E. Hollnagel, et al. (Eds.), Resilience Engineering: Precepts and Concepts (pp. 77-92). Burlington, Vt.: Ashgate.
Dervitsiotis, K. N. (2003). The Pursuit of Sustainable Business Excellence: Guiding Transformation for Effective Organisational Change. Total Quality Management, 14(3), 251-267.
Doyle, J. C. (1996). Improving Performance in Emergency Management. Disaster Prevention and Management, 5(3), 32-46.
Duffy, J. (2001). Maturity Models Blueprints for E-Volution. Strategy and Leadership, 29(6), 19-26.
Durkin, M. E. (1984). The Economic Recovery of Small Businesses after Earthquakes: The Coalinga Experience. Paper presented at the International Conference on Natural Hazards Mitigation Research and Practice.
Durodie, B. (2003). Is Real Resilience Attainable? The Monitor, 2(6), 15-19. Dynes, R. R. (1986). The Concept of Role in Disaster Research. In R. R. Dynes & C.
Pelanda (Eds.), Sociology of Disaster: Contributions of Sociology to Disaster Research. Milan, Italy: Franco Angeli.
Dynes, R. R., & Quarantelli, E. L. (1968). Group Behaviour under Stress: A Required Convergence of Organisational and Collective Behaviour Perspectives. Sociology and Social Research, 52, 416-429.
Dynes, R. R., & Quarantelli, E. L. (1986). Role Simplification in Disaster. Paper presented at the Workshop sponsored by the National Institute of Mental Health and the Federal Emergency Management Agency, Washington D. C.
263
Dziuban, C. D., & Shirkey, E. C. (1974). When Is a Correlation Matrix Appropriate for Factor Analysis? Some Decision Rules. Psychological Bulletin, 81(6), 358-361.
Egan, M. J. (2007). Anticipating Future Vulnerability: Defining Characteristics of Increasingly Critical Infrastructure-Like Systems. Journal of Contingencies and Crisis Management, 15(1), 4.
Ehrhardt, G. C. M. A., Marsili, M., & Vega-Redondon, F. (2008). Emergence and Resilience of Social Networks: A General Framework. Annales D'Economie et de Statistique, 86(Apr-Jun), 1-13.
Eisenhardt, K. M., & Zbaracki, M. J. (1992). Strategic Decision Making. Strategic Management Journal, 13, 17-37.
Elwood, A. (2009). Using the Disaster Crunch/Release Model in Building Organisational Resilience. Journal of Business Continuity and Emergency Planning, 3(3), 241-247.
Endsley, M. R. (1995). Toward a Theory of Situation Awareness in Dynamic Systems. Human Factors, 37(1), 32-64.
Endsley, M. R., Bolte, B., & Jones, D. G. (2003). Designing for Situation Awareness an Approach to User-Centred Design. London: Taylor & Francis.
Engle, P. L., Castle, S., & Menon, P. (1996). Child Development: Vulnerability and Resilience. Social Science & Medicine, 43(5), 621-635.
Epstein, M. J., & Roy, M.-J. (2003). Making the Business Case for Sustainability: Linking Social and Environmental Actions to Financial Performance. The Journal of Corporate Citizenship(9), 79-96.
Epstein, M. J., & Westbrook, R. A. (2001). Linking Actions to Profits in Strategic Decision Making. MIT Sloan Management Review, 39-49.
Etkin, D., Haque, E., Bellisario, L., & Burton, I. (2004). An Assessment of Natural Hazards and Disasters in Canada. The Canadian Natural Hazards Assessment Project. Public Safety and Emergency Preparedness. Ottawa: Canada and environment Canada.
Ezell, B. C. (2007). Infrastructure Vulnerability Assessment Model (I-Vam). Risk Analysis, 27(3), 571-583.
Fenwick, T., Seville, E., & Brunsdon, D. (2009). Reducing the Impact of Organisational Silos on Resilience: A Report on the Impact of Silos on Resilience and How the Impacts Might Be Reduced. Christchurch: Resilient Organisations Research Programme.
Financial Services Authority (2005). Resilience Benchmarking Project. London: FSA. Financial Services Authority (2006). Feedback Statement on the Resilience
Benchmarking Project Discussion Paper. London: FSA. Financial Services Authority (2010). Resilience Benchmarking - Insurance Sector.
London: FSA. Fletcher, C. S., & Hilbert, D. W. (2007). Resilience in Landscape Exploitation Systems.
Ecological Modelling, 201(3/4), 440-452. Flin, R., Mearns, K., P., O. C., & Bryden, R. (2000). Measuring Safety Climate:
Identifying the Common Features. Safety Science, 34, 177-192. Ford, C. M., & Gioia, D. A. (2000). Factors Influencing Creativity in the Domain of
Managerial Decision Making. Journal of Management, 26(4), 705-732. Ford, J. K., MacCallum, R. C., & Tait, M. (1986). The Application of Exploratory
Factor Analysis in Applied Psychology: A Critical Review and Analysis. Personnel Psychology, 39, 291-313.
Fowler, K. L., Kling, N. D., & Larson, M. D. (2007). Organisational Preparedness for Coping with a Major Crisis or Disaster. Business & Society, 46(1), 88-103.
264
Fratus, J. M. (2006). Running Ahead: High Reliability Organization Theory. San Bernardino: San Bernardino City CA Fire Department.
Friedman, M. (2005). Organisational Resilience. Accountancy SA, 24-27. Gales, L. M., & Kesner, I. F. (1994). An Analysis of Board of Director Size and
Composition in Bankrupt Organizations. Journal of Business Research, 30(3), 271-282.
Gambles, I. (2009). Making the Business Case: Proposals That Succeed for Projects That Work Available from http://reader.eblib.com.au.ezproxy.canterbury.ac.nz/Reader.aspx?p=438667&o=150&u=m6iu%2b%2b2qlOQ%3d&t=1280134730&h=DCDEEC10E4B06FB8924D34CC59D0350DBF0CAA8E&s=3331002&ut=460&pg=14&r=img&pat=n#
Gardener, W. L., & Avolio, B. J. (1998). The Charismatic Relationship: A Dramaturgical Perspective. The Academy of Management Review, 23(1), 32-58.
Gibson, C. A., & Tarrant, M. (2010). A Conceptual Models' Approach to Organisation Resilience. Australian Journal of Emergency Management, 25(2), 6-12.
Gittell, J. H., Cameron, K., Lim, S., & Rivas, V. (2005). Relationships, Layoffs and Organisational Resilience: Airline Industry Responses to September 11th Brussels, Belgium: Economics and Econometrics Research Institute.
Gittell, J. H., Cameron, K., Lim, S., & Rivas, V. (2006). Relationships, Layoffs and Organizational Resilience: Airline Industry Responses to September 11. Journal of Applied Behavioral Science, 43(2), 300-329.
Goh, S. C. (2002). Managing Effective Knowledge Transfer: An Integrative Framework and Some Practice Implications. Journal of Knowledge Management, 6(1), 23-30.
Gown, J. G. (1991). Entrepreneurial Versus Conservative Firms: A Comparison of Strategies and Performance. Journal of Management Studies, 28(5), 439-462.
Grabowski, M., & Roberts, K. H. (1999). Risk Mitigation in Virtual Organizations. Organization Science, 10(6), 704-721.
Graham, L. T. (2007). Permanently Failing Organizations? Small Business Recovery after September 11, 2001. Economic Development Quarterly, 21, 299-314.
Granatt, M., & Paré-Chamontin, A. (2006). Cooperative Structures and Critical Functions to Deliver Resilience within Network Society. International Journal of Emergency Management, 3(1), 52-57.
Groves, K. S. (2005). Linking Leader Skills, Follower Attributes, and Contextual Variables Via an Integrated Model of Charismatic Leadership. Journal of Management, 31(2), 255-277.
Guelke, C. (2005). A Strategic Approach to Disaster Preparedness. Paper presented at the Engineering Management Conference, 2005. Proceedings. 2005 IEEE International.
Guimaraes, T., & Langley, K. (1994). Developing Innovation Benchmarks: An Empirical Study. Benchmarking for Quality Management and Technology, 1(3), 3-20.
Hale, A., Guldenmund, F., & Goossens, L. (2006). Auditing Resilience in Risk Control and Safety Management Systems. In E. Hollnagel, et al. (Eds.), Resilience Engineering Concepts and Precepts. Aldershot, UK: Ashgate.
Hamel, G., & Välikangas, L. (2003). The Quest for Resilience. Harvard Business Review, 81(9), 52-63.
Harland, L., Harrison, W., Jones, J. R., & Reiter-Palmon, R. (2005). Leadership Behaviors and Subordinate Resilience. Journal of Leadership and Organizational Studies, 11(2), 2-14.
265
Henson, R. (2001). Understanding Internal Consistency Reliability Estimates: A Conceptual Primer on Coefficient Alpha. Measurement and Evaluation in Counseling and Development, 34(3), 177-189.
Herbane, B. (2010). Small Business Research: Time for a Crisis-Based View. International Small Business Journal, 28(1), 43-64.
Herrmann, D. S. (2007). Complete Guide to Security and Privacy Metrics: Measuring Regulatory Compliance, Operational Resilience and Roi. Boca Raton, Florida: Auerbach Publications, Taylor & Francis Group.
Hickman, J. R., & Crandall, W. (1997). Before Disaster Hits: A Multifaceted Approach to Crisis Management. Business Horizons, 40(2), 75-79.
Hiles, A. (Ed.). (2008). The Definitive Handbook of Business Continuity Management (2nd ed.). Milton: John Wiley & Sons.
Hill, E. W., Wial, H., & Wolman, H. (2008). Exploring Regional Economic Resilience. Paper presented at the Annual Meeting of the Urban Affairs Association. Retrieved 2nd June 2010, from http://www.escholarship.org/uc/item/7fq4n2cv?display=all
Hills, A. (2000). Revisiting Institutional Resilience as a Tool in Crisis Management. Journal of Contingencies and Crisis Management, 8(2), 109-118.
Hinkin, T. (1995). A Review of Scale Development Practises in the Study of Organisations. Journal of Management, 21(5), 967-988.
Hinkin, T. (1998). A Brief Tutorial on the Development of Measures for Use in Survey Questionnaires. Organizational Research Methods, 1(1), 104-121.
Hofstede, G. (1990). Measuring Organizational Cultures: A Qualitative and Quantitative Study across Twenty Cases Administrative Science Quarterly, 35(2), 286-316.
Holling, C. S. (1973). Resilience and Stability of Ecological Systems. Annual Review of Ecology and Systematics, 4, 1-23.
Holling, C. S. (1996). Engineering Resilience Versus Ecological Resilience. In P. C. Schulze (Ed.), Engineering within Ecological Constraints (pp. 31-35). Washington DC: National Academy of Engineering.
Hollnagel, E., Nemeth, C. P., & Dekker, S. (Eds.). (2008). Remaining Sensitive to the Possibility of Failure (Vol. 1). Cornwall, Great Britain: Ashgate.
Horne, J. F., & Orr, J. E. (1998). Assessing Behaviors That Create Resilient Organizations. Employment Relations Today, 24(4), 29-39.
House, R. J. (1977). A 1976 Theory of Charismatic Leadership. In J. G. Hunt & L. L. Larson (Eds.), Leadership: The Cutting Edge (pp. 189-207). Carbondale: Southern Illinois University Press.
Huber, G. P., & McDaniel, R. R. (1986). The Decision-Making Paradigm of Organizational Design. Management Science, 23(5), 572-589.
Hurley-Hanson, A. E. (2006). Organizational Responses and Adaptations after 9-11. Management Research News, 29(8), 480.
Hwang, P., & Lichtenthal, J. D. (2000). Anatomy of Organisational Crises. Journal of Contingencies and Crisis Management, 8(3), 129-140.
ISO (2009). Iso31000: Risk Management - Principles and Guidelines: International Standards Organization.
Jordan, E., & Musson, D. (1998). Strategic Systems? Only When They Work! Australian Journal of Information Systems, 6(1), 27-38.
Kaiser, H. F. (1970). A Second Generation Little Jiffy. Psychometrika, 35(4), 401-415. Kasperson, J. X., & Kasperson, R. E. (2005). Risk Analysis, Corporations, and the
Globalisation of Risk (Vol. 2): Earthscan.
266
Kauffman, S. A. (1995). At Home in the Universe: The Search for Laws of Self-Organisation and Complexity. New York: Oxford University Press.
Kay, R. (2010). Engaging Stakeholders in the Pursuit of Resilience: Why Won’t People Listen?, a Paper Presented at the 20th World Conference on Disaster Management, 6-9th June 2010. Toronto, Canada.
Kendra, J. M., & Wachtendorf, T. (2003a). Creativity in Emergency Response to the World Trade Centre Disaster Beyond September 11th: An Account of Post-Disaster Research (Vol. Special Publication 39, pp. 21): Natural Hazards Research and Information Centre, University of Colorado.
Kendra, J. M., & Wachtendorf, T. (2003b). Elements of Resilience after the World Trade Center Disaster: Reconstituting New York City’s Emergency Operations Centre. Disasters, 27(1), 37-53.
Knight, R. F., & Pretty, D. J. (1997). The Impact of Catastrophes on Shareholder Value. Oxford: National Retail Federation, A research report sponsored by Sedgwick Group.
Kroll, C. A., Landis, J. D., Shen, Q., & Stryker, S. (1990, 1991). Economic Impacts of the Loma Prieta Earthquake: A Focus on Small Businesses. Paper presented at the Fourth International Research and Training Seminar on Regional Development Planning for Disaster Prevention, Nagoya, Japan.
La Porte, T. R. (1996). High Reliability Organizations: Unlikely, Demanding and at Risk. Journal of Contingencies and Crisis Management, 4(2), 60-71.
Larwood, L., Falbe, C. M., Miesing, P., & Kriger, M. P. (1995). Structure and Meaning of Organizational Vision. Academy of Management Journal, 38(3), 740-769.
Laye, J. E., & Torre-Enciso, M. I. M. (2001). Strategies to Reduce the Impacts of Disasters on Business Processes: The Case of Business Continuity. International Journal of Risk Assessment and Management, 3,4, 319.
Lecoze, J., & Capo, S. (2006). A Conceptual and Methodological Comparison with the Field of Child Resilience. Paper presented at the 2nd Symposium on Resilience Engineering. Retrieved 15th April 2008,
Lengnick-Hall, C. A., & Beck, T. E. (2005). Adaptive Fit Versus Robust Transformation: How Organisations Respond to Environmental Change. Journal of Management, 31(5), 738-757.
Luthans, F., Avey, J. B., Avolio, B. J., Norman, S. M., & Combs, G. M. (2006). Psychological Capital Development: Toward a Micro-Intervention. Journal of Organizational Behavior, 27, 387-393.
Mallak, L. (1998a). Putting Organizational Resilience to Work. Industrial Management, 40(6), 8.
Mallak, L. A. (1998b). Measuring Resilience in Health Care Provider Organisations. Health Manpower Management, 24(4), 148-152.
Mallak, L. A. (1999). Toward a Theory of Organisational Resilience. Paper presented at the Portland International Conference on Management of Engineering and Technology (PICMET) Portland.
Manoj, B. S., & Baker, A. H. (2007). Communication Challenges in Emergency Response. Communications of the Association for Computing Machinery, 50(3), 51-53.
Manyena, S. B. (2006). The Concepts of Resilience Revisited. Disasters, 30(4), 434-450.
Martin, R. A. (2001). Managing Vulnerabilities in Networked Systems. IEEE Computer Magazine, 34(11), 32-37.
267
Mason, R. O. (2004). Lessons in Organizational Ethics from the Columbia Disaster: Can a Culture Be Lethal? Organizational Dynamics, 33(2), 128-142.
Masys, A. J. (2005). A Systemic Perspective of Situation Awareness an Analysis of the 2002 Mid-Air Collision over U ¨Berlingen, Germany. Disaster Prevention and Management, 14(4), 548-557.
Matheus, C. J., Kokar, M. M., & Baclawski, K. (2003, July 2003). A Core Ontology for Situation Awareness. Paper presented at the Sixth International Conference on Information Fusion, Cairns, Queensland, Australia.
McCormack, M. (1999). Break Down the Silo Walls. New Zealand Management, 46(3), 15.
McDavid, J. C., & Hawthorn, L. R. L. (2006). Program Evaluation & Measurement: An Introduction to Practice. London: Sage Publications.
MCDEM (2004). Resilient New Zealand National Civil Defence Emergency Management Strategy 2003-2006.
MCDEM (2006). The Guide to the National Civil Defence Emergency Management Plan. Wellington: Ministry of Civil Defence Emergency Management.
McEntire, D. A. (2005). Why Vulnerability Matters: Exploring the Merit of an Inclusive Disaster Reduction Concept. Disaster Prevention and Management, 14(2), 206-222.
McManus, S. (2007). Organisational Resilience in New Zealand. Unpublished Doctor of Philosophy, University of Canterbury, Christchurch.
McManus, S., Seville, E., Brunsdon, D., & Vargo, J. (2007). Resilience Management: A Framework for Assessing and Improving the Resilience of Organisations (No. 2007/01): Resilient Organisations.
McManus, S., Seville, E., Vargo, J., & Brunsdon, D. (2008). A Facilitated Process for Improving Organizational Resilience. Natural Hazards Review, 9(2), 81-90.
Miller, D. (1983). The Correlates of Entrepreneurship in Three Types of Firms Management Science, 29(7), 770-791.
Miller, K. D. (1993). Industry and Country Effects on Managers' Perceptions of Environmental Uncertainties Journal of International Business Studies 24(4), 693-714.
Mintzberg, H. (1973). Strategy-Making in Three Modes. California Management Review, 16(2), 44-53.
Mishra, A. K. (1996). Organizational Responses to Crisis: The Centrality of Trust. In R. M. Kramer & T. Thomas (Eds.), Trust in Organizations (pp. 261-287). Newbury Park: Sage.
Mitroff, I. I. (2001). Managing Crises before They Happen: What Every Executive and Manager Needs to Know About Crisis Management. New York: ANACOM.
Mitroff, I. I. (2005). From My Perspective: Lessons from 9/11 Are Companies Better Prepared Today? Technological Forecasting & Social Change, 72(3), 375-376.
Mitroff, I. I., Pauchant, T. C., Finney, M., & Pearson, C. (1989). Do (Some) Organisations Cause Their Own Crises? The Cultural Profiles of Crisis-Prone Vs. Crisis-Prepared Organisations. Industrial Crisis Quarterly, 3(4), 269-283.
Mobley, W. H. (1977). Intermediate Linkages in the Relationship between Job Staisfaction and Employee Turnover. Journal of Applied Psychology, 62(2), 237-240.
Newlove, L., Stern, E., & Svedin, L. (2003). Auckland Unplugged: Coping with Critical Infrastructure Failure. Oxford: Lexington Books.
Newman, M. E. J. (2005). Power Laws, Pareto Distributions and Zipf’s Law. Contemporary Physics, 46(5), 323-351.
268
NFPA (2007). Standard on Disaster/Emergency Management and Business Continuity Programs (pp. 57). Quincy: MA: National Fire Protection Association.
Ng, I. (1991). Predictors of Strike Voting Behavior: The Case of University Faculty. Journal of Labor Research, 12(2), 123-134.
Nicholson Jr., P. J., & Goh, S. C. (1983). The Relationship of Organization Structure and Interpersonal Attitudes to Role Conflict and Ambiguity in Different Work Environments. The Academy of Management Journal 26(1), 148-155.
Nigg, J. M. (1993). Disaster Recovery: A Social Process. Paper presented at the United States-Former Soviet Union Seminar on Social Science Research on Mitigation for & Recovery from Disasters & Large Scale Hazards, Newark, DE.
O’Sullivan, T. L., Amaratunga, C., Phillips, K. P., Corneil, W., O’Connor, E., Lemyre, L., et al. (2009). If Schools Are Closed, Who Will Watch Our Kids? Family Caregiving and Other Sources of Role Conflict among Nurses During Large
Scale Outbreaks. Prehospital and Disaster Medicine, 24(4), 321-325. Pallant, J. (2007). SPSS Survival Manual: A Step by Step Guide to Data Analysis (3rd
ed.): Open University Press. Pariès, J. (2006). Complexity, Emergence, Resilience... In E. Hollnagel, et al. (Eds.),
Resilience Engineering: Concepts and Precepts (pp. 43-53). Burlington, Vt.: Ashgate.
Parsons, D. (2007). National Organisational Resilience Framework Workshop: The Outcomes, National Organisational Resilience Framework Workshop, 5-7th December 2007, Mt. Macedon, Victoria, Australia (pp. 15). http://www.tisn.gov.au/www/tisn/rwpattach.nsf/VAP/(9A5D88DBA63D32A661E6369859739356)~FINAL+Workshop.pdf/$file/FINAL+Workshop.pdf: Trusted Information Sharing Network.
Paton, D. (2007). Measuring and Monitoring Resilience in Auckland. Auckland: GNS Science.
Paton, D., & Johnston, D. (2001). Disasters and Communities: Vulnerability, Resilience and Preparedness. Disaster Prevention and Management, 10(4), 270-277.
Pearson, C., & Mitroff, I. I. (1993). From Crisis Prone to Crisis Prepared: A Framework for Crisis Management. The Academy of Management Executive, 7(1), 48-59.
Pearson, C. M., & Clair, J. A. (1998). Reframing Crisis Management. The Academy of Management Review, 23(1), 59-76.
Penrose, J. M. (2000). The Role of Perception in Crisis Planning. Public Relations Review, 26(2), 155-165.
Perrow, C. (1984). Normal Accidents: Living with High Risk Technologies (2nd ed.). New York: Basic Books.
Perrow, C. (1999). Normal Accidents: Living with High Risk Technologies (2nd ed.). New York: Basic Books.
Peterson, D. M., & Perry, R. W. (1999). The Impacts of Disaster Exercises on Participants. Disaster Prevention and Management, 8(4), 241-254.
Petterson, J. (1999). A Review of the Literature and Programs on Local Recovery from Disaster, Working Paper 102. Fairfax, VA: Natural Hazards Research and Applications Information Center Institute of Behavioral Science University of Colorado.
Pfeffer, J. (1978). Organizational Design. Arlington Heights, IL: Harlan Davidson. Plant, R., & Murrell, S. (1997). The Agile Organisation: Technology and Innovation.
Paper presented at the Using AI in Electronic Commerce. Retrieved 2nd April 2008, from http://www.usc.edu/schools/business/atisp/AI/AI-Bus/AI-Meetings/aaai1997/paper.doc
269
Powers, V. (2004). Creating a Collaborative Government. KM World, 13(4), 12. Quarantelli, E. L. (1995). Emergent Behavior and Groups in the Crisis Time of
Disasters (Preliminary Papers 226). Newark, Delaware, USA: University of Delaware, Disaster Research Center.
Quarantelli, E. L. (1996). The Future Is Not the Past Repeated: Projecting Disasters in the 21st Century from Current Trends. Journal of Contingencies and Crisis Management, 4(4), 228-240.
Quarantelli, E. L. (2005). Catastrophes Are Different from Disasters: Some Implications for Crisis Planning and Managing Drawn from Katrina: Disaster Research Center (DRC) University of Delaware.
Reason, J. (2000). Education and Debate, Human Errors: Models and Management. British Medical Journal, 320, 768-770.
Reason, J., Carthey, J., & de Leval, M. R. (2001). Diagnosing “Vulnerable System Syndrome”: An Essential Prerequisite to Effective Risk Management. Quality in Healthcare, 10, ii21-ii25.
Richardson, B. (1994). Crisis Management and Management Strategy - Time to "Loop the Loop"? Disaster Prevention and Management, 3(3), 59-80.
Richardson, B., Nwankwo, S., & Richardson, S. (1994). Understanding the Causes of Business Failure Crises: Generic Failure Types: Boiled Frogs, Drowned Frogs, Bullfrogs and Tadpoles. Management Decision, 32(4), 9-22.
Rijmpa, J. A. (1997). Complexity, Tight-Coupling and Reliability: Connecting Normal Accidents Theory and High Reliability Theory. Journal of Contingencies and Crisis Management, 5(1), 15-23.
Riolli, L., & Savicki, V. (2003). Information System Organisational Resilience. Omega The International Journal of Management Science, 31(3), 227-223.
Robbins, S. P., Millet, B., Cacioppe, R., & Waters-Marsh, T. (2003). Organisational Behaviour, Leading and Managing in Australia and New Zealand (3rd ed.): Pearson Education Australia.
Roberts, K. H. (1990). Managing High Reliability Organisations. California Management Review, 32(4), 101-113.
Rogelberg, S. G., & Stanton, J. M. (2007). Introduction: Understanding and Dealing with Organizational Survey Nonresponse. Organizational Research Methods, 10(2), 195-209.
Roth, E. M., Multer, J., & Raslear, T. (2006). Shared Situation Awareness as a Contributor to High Reliability Performance in Railroad Operations. Organization Studies, 27(7), 967.
Runyan, R. C. (2006). Small Business in the Face of Crisis: Identifying Barriers to Recovery from a Natural Disaster. Journal of Contingencies and Crisis Management, 14(1), 12-26.
Schaltegger, S., & Wagner, M. (2006). Managing and Measuring the Business Case for Sustainability. In S. Schaltegger & M. Wagner (Eds.), Managing the Business Case for Sustainability: The Integration of Social, Environmental and Economic Performance. Sheffield, UK: Greenleaf Publishing.
Scheaffer, R. L., Mendenhall, W., & Ott, R. L. (1995). Elementary Survey Sampling (5th ed.). Belmont: CA: Wadsworth Publishing Company.
Schein, E. H. (1996). The Three Cultures of Management: Implications for Organizational Learning. Sloan Management Review, 38, 9-20.
Seashore, S. E., & Taber, T. D. (1975). Job Satisfaction Indicators and Their Correlates. American Behavioral Scientist, 18(3), 333-368.
270
Senge, P. M. (2006). The Fifth Discipline the Art & Practice of the Learning Organisation (2nd ed.). London: Random House Books.
Seville, E., Brunsdon, D., Dantas, A., Le Masurier, J., Wilkinson, S., & Vargo, J. (2006). Building Organisational Resilience: A Summary of Key Research Findings (Research Report): Resilient Organisations.
Seville, E., Brunsdon, D., Dantas, A., Le Masurier, J., Wilkinson, S., & Vargo, J. (2008). Organisational Resilience: Researching the Reality of New Zealand Organisations. Journal of Business Continuity and Emergency Management, 2(2), 258-266.
Shamir, B., House, R. J., & Arthur, M. B. (1993). The Motivational Effects of Charismatic Leadership: A Self-Concept Based Theory. Organization Science, 4(4), 577-594.
Sheaffer, Z., & Mano-Negrin, R. (2003). Executives’ Orientations as Indicators of Crisis Management Policies and Practices. Journal of Management Studies, 40(2), 573-606.
Shrivastava, P., Mitroff, I. M., Miller, D., & Miglani, A. (1988). Understanding Industrial Crises. The Journal of Management Studies, 25(4), 283-303.
Simon, H. A. (1957). Models of Man: Social and Rational. Oxford, UK: Wiley. Simsek, Z., & Veiga, J. F. (2000). The Electronic Survey Technique: An Integration and
Assessment. Organizational Research Methods, 3(1), 93-115. Simsek, Z., & Veiga, J. F. (2001). A Primer on Internet Organizational Surveys.
Organizational Research Methods, 4(3), 218-235. Singer, S. J., Gaba, D. M., Geppert, J. J., Sinaiko, A. D., Howard, S. K., & Park, K. C.
(2003). The Culture of Safety: Results of an Organization-Wide Survey in 15 California Hospitals. Quality and Safety in Health Care, 12(2), 112.
Smallman, C. (1996). Risk and Organizational Behaviour: A Research Model. Disaster Prevention and Management, 5(2), 12-26.
Smart, C., & Vertinsky, I. (1977). Designs for Crisis Decision Units. Administrative Science Quarterly, 24(4), 640-657.
Smith, C., Jennings, C., & Castro, N. (2005). Model for Assessing Adaptive Effectiveness Development. Journal of Contingencies and Crisis Management, 13(3), 129-137.
Smith, D. (1990). Beyond Contingency Planning: Towards a Model of Crisis Management. Industrial Crisis Quarterly, 4(4), 263-275.
Smith, D. (2005). Business (Not) as Usual: Crisis Management, Service Recovery and the Vulnerability of Organisations. Journal of Services Marketing, 19(5), 309-320.
Smith, D. (2006). Beyond Contingency Planning: Towards a Model of Crisis Management. In D. Smith & D. Elliot (Eds.), Key Readings in Crisis Management, Systems and Structures for Prevention and Recovery. New York: Routledge.
Smith, D., & Sipika, C. (1993). Back from the Brink, Management Post-Crisis. Long Range Planning, 26(1), 28-38.
Smits, S. J., & Ally, N. E. (2003). Thinking the Unthinkable - Leadership's Role in Creating Behavioral Readiness for Crisis Management. [Theoretical]. Competitiveness Review, 13(1), 1-23.
Somers, S. (2007). Building Organisational Resilience Potential: An Adaptive Strategy for Operational Continuity in Crisis. Unpublished Doctoral, Arizona State University, Arizona.
271
Somers, S. (2009). Measuring Resilience Potential: An Adaptive Strategy for Organisational Crisis Planning. Journal of Contingencies and Crisis Management, 17(1), 12-23.
Spillan, J., & Hough, M. (2003). Crisis Planning in Small Businesses: Importance, Impetus and Indifference. European Management Journal, 21(3), 398.
Spirig, K. (2006). Social Performance and Competitiveness. In S. Schaltegger & M. Wagner (Eds.), Managing the Business Case for Sustainability: The Integration of Social, Environmental and Economic Performance. Sheffield, UK: Greenleaf Publishing.
Stallings, R. A. (Ed.). (2002). Methods of Disaster Research: Xlibris. Starr, R., Newfrock, J., & Delurey, M. (2003a). Enterprise Resilience: Managing Risk
in the Networked Economy. Strategy and Business (30), 2-10. Starr, R., Newfrock, J., & Delurey, M. (2003b). Enterprise Resilience: Managing Risk
in the Networked Economy. Strategy and Business(30), 2-10. Statistics New Zealand (2009). Detailed Industry by Region Retrieved 9th July, 2010 Stead, E., & Smallman, C. (1999). Understanding Business Failure: Learning and
Unlearning Lessons from Industrial Crises. Journal of Contingencies and Crisis Management, 7(1), 1-18.
Stephenson, A. V., Vargo, J., & Seville, E. (2010). Measuring and Comparing Organisational Resilience. Australian Journal of Emergency Management, 25(2), 27-32.
Stern, E. (1997). Crisis and Learning: A Conceptual Balance Sheet. Journal of Contingencies and Crisis Management, 5(2), 69-86.
Stone, F. (2004). Deconstructing Silos and Supporting Collaboration. Employment Relations Today, 31(1), 11.
Stout, R. J., & Salas, E. (1998). What Do We Know About Training Situational Awareness? Paper presented at the Annual Meeting of the Human Factors and Ergonomics Society, Santa Monica, CA.
Sundström, G. A., & Hollnagel, E. (2006). Learning How to Create Resilience in Business Systems In E. Hollnagel, et al. (Eds.), Resilience Engineering: Concepts and Precepts. Aldershot, UK: Ashgate.
t' Hart, P. (1997). Preparing Policy Makers for Crisis Management: The Role of Simulations. Journal of Contingencies and Crisis Management, 5(4), 207-215.
Tammineedi, R. L. (2010). Business Continuity Management: A Standards-Based Approach. Information Security Journal: A Global Perspective, 19(1), 36-50.
Tarn, J. M., Wen, H. J., & Shih, S. C. (2008). A Theoretical Perspective of Man-Made System Disasters: Social-Technical Analysis and Design. Disaster Prevention and Management, 17(2), 256-280.
Testa, M. R. (1999). Satisfaction with Organizational Vision, Job Satisfaction and Service Efforts: An Empirical Investigation. Leadership & Organization Development Journal, 20(3), 154.
Tierney, K. (2003). Conceptualising and Measuring Organizational and Community Resilience: Lessons from the Emergency Response Following the September 11, 2001 Attack on the World Trade Center, Preliminary paper 329. Newark: University of Delaware.
Tierney, K., & Bruneau, M. (2007, May-June 2007). Conceptualising and Measuring Resilience a Key to Disaster Loss Reduction. TR News, All Hazards, Preparedness, Response and Recovery, 250.
Toolbox for IT (2006). Creating a Business Case in 4 Easy Steps. http://hosteddocs.ittoolbox.com/jw11.02.06.II.pdf.
272
Turner, B. A. (1976). The Organisational and Inter-Organisational Development of Disasters. Administrative Science Quarterly, 21(3), 378-397.
Turner, B. A. (1978). Man-Made Disasters. London: Wykeham Science Press. Turner, B. A., & Toft, B. (2006). Organisational Learning from Disasters. In D. Smith
& D. Elliot (Eds.), Key Readings in Crisis Management: Systems and Structures for Prevention and Recovery. Great Britain: Routledge.
UNISDR (2005). Hyogo Framework for Action 2005-2015: Building the Resilience of Nations and Communities to Disasters: United Nations.
Valle, M. (1999). Crisis, Culture and Charisma: The New Leaders Work in Public Organizations. Public Personnel Management, 28(2), 245-257.
Van der Vegt, G. S., & Janssen, O. (2003). Joint Impact of Interdependence and Group Diversity on Innovation. Journal of Management, 29, 729-751.
Vargo, J., & Seville, E. (2010). Resilient Organisations: Trying to Thrive When You Are Struggling to Survive, a Paper Presented at the 4th Annual Business Continuity Summit 2010 Resilience over Uncertainty, 24-25th March 2010, Sydney, Australia.
Vargo, J., & Stephenson, A. V. (2010). Measuring Organizational Resilience, a Paper Presented at the 20th World Conference on Disaster Management, 6-9th June 2010. Toronto, Canada.
Vecchio, R. P. (2000). Organisational Behavior Core Concepts (4th ed.): The Dryden Press.
Venkatraman, N., & Ramanujam, V. (1987). Measurement of Business Economic Performance: An Examination of Method Convergence. Journal of Management, 13(1), 109-122.
Virtual Corporation (2005). The Complete Public Domain Model Business Continuity Maturity Model: Virtual Corporation.
Vogus, T. J., & Sutcliffe, K. M. (2008). Organizational Resilience: Towards a Theory and Research Agenda. Paper presented at the IEEE International Conference on Systems, Man and Cybernetics. Retrieved 17th December 2008, from http://ieeexplore.ieee.org.ezproxy.canterbury.ac.nz/stamp/stamp.jsp?arnumber=4414160&isnumber=4413561
Webb, G. R. (1999). Individual and Organisational Response to Natural Disasters and Other Crisis Events: The Continued Value of the DRC Typology. Paper presented at the Annual meeting of the Eastern Sociological Society.
Webb, G. R., Tierney, K. J., & Dahlhamer, J. M. (2002). Predicting Long-Term Business Recovery from Disaster: A Comparison of the Loma Prieta Earthquake and Hurricane Andrew. Environmental Hazards, 4, 45-58.
Weick, K. E. (1976). Educational Organisations as Loosely Coupled Systems. Administrative Science Quarterly, 21(1), 1-19.
Weick, K. E. (1987). Organizational Culture as a Source of High Reliability. California Management Review, 29(2), 112.
Weick, K. E. (1993). The Collapse of Sensemaking in Organizations: The Mann Gulch Disaster. Administrative Science Quarterly, 38(4), 628.
Weick, K. E., & Sutcliffe, K. M. (2001). Managing the Unexpected. San Francisco: Jossey-Bass.
Weick, K. E., & Sutcliffe, K. M. (2007). Managing the Unexpected: Resilient Performance in an Age of Uncertainty (2nd ed.). San Francisco, CA: Jossey-Bass.
Weick, K. E., Sutcliffe, K. M., & Obstfeld, D. (2005). Organizing and the Process of Sensemaking. Organization Science, 16(4), 1526-5455.
273
Weir, D. (2002). When Will They Ever Learn? The Conditions for Failure in Publically Funded High Technology Projects: Ro1 and the Challenger Disasters Compared. Disaster Prevention and Management, 11(4), 299-307.
Westrum, R. (2006). A Typology of Resilience Situations. In E. Hollnagel, et al. (Eds.), Resilience Engineering: Concepts and Precepts (pp. 56-65). Burlington, Vt.: Ashgate.
Wildavsky, A. (1998). Searching for Safety. New Brunswick, N.J.: Transaction Books. Williams, D. E., & Treadaway, G. (1992). Exxon and the Valdez Accident: A Failure in
Crisis Communication. Communication Studies, 43(1), 56-64. Williams, G., Batho, S., & Russell, L. (2000). Responding to Urban Crisis: The
Emergency Planning Response to the Bombing of Manchester City Centre. Cities, 17(4), 293-304.
Wisner, B., Blaikie, P. M., Cannon, T., & Davis, I. (2004). At Risk (2nd ed.). New York: Routledge.
Woods, D. D. (2004). Creating Foresight: Lessons for Enhancing Resilience from Columbia, Draft to Appear. In B. Starbuck & M. Farjoun (Eds.), Learning from the Columbia Accident.
Woods, D. D., & Wreathall, J. (2008). Stress-Strain Plots as a Basis for Assessing System Resilience. In E. Hollnagel, et al. (Eds.), Remaining Sensitive to the Possibility of Failure (Vol. 1, pp. 143-158). Padstow: Ashgate.
Wreathall, J. (2006). Properties of Resilience Organizations: An Initial View. In E. Hollnagel, et al. (Eds.), Resilience Engineering: Concepts and Precepts (pp. 275-286). Aldershot: Ashgate.
Yaffee, R. A. (2003). Common Correlation and Reliability Analysis with SPSS for Windows Retrieved 12th June, 2011, from http://www.nyu.edu/its/statistics/Docs/correlate.html
Zhichang, Z. (2007). Complexity Science, Systems Thinking and Pragmatic Sensibility. Systems Research and Behavioral Science, 24(4), 445-464.
Zimmerman, M. A., & Arunkumar, R. (1994). Resiliency Research: Implications for Schools and Policy. Social Policy Report, 8(4), 1-17.

274
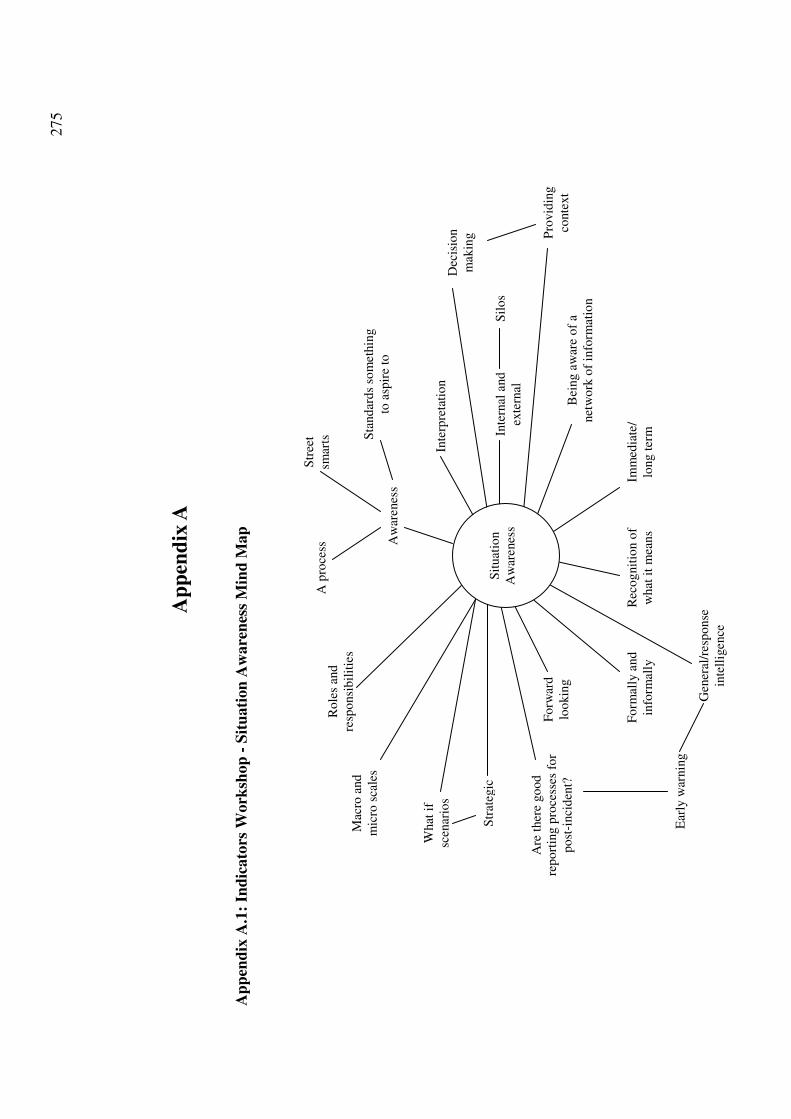
275
Ap
pen
dix
A
Ap
pen
dix
A.1
: In
dic
ato
rs W
ork
shop
- S
itu
ati
on
Aw
are
nes
s M
ind
Map
S
ituat
ion
Aw
aren
ess
Mac
ro a
nd
m
icro
sca
les
Ro
les
and
re
spo
nsi
bil
itie
s
A p
roce
ss
Str
eet
smar
ts
Aw
aren
ess
Sta
nd
ard
s so
met
hin
g
to a
spir
e to
Inte
rpre
tati
on
Inte
rnal
and
ex
tern
al
Sil
os
Dec
isio
n
mak
ing
Pro
vid
ing
conte
xt
Bei
ng a
war
e o
f a
net
wo
rk o
f in
form
atio
n
Imm
edia
te/
long t
erm
R
eco
gnit
ion o
f w
hat
it
mea
ns
Gen
eral
/res
po
nse
in
tell
igen
ce
Fo
rmal
ly a
nd
in
form
ally
Ear
ly w
arnin
g
Fo
rwar
d
loo
kin
g
Are
ther
e go
od
re
po
rtin
g p
roce
sses
fo
r p
ost
-inci
den
t?
Str
ateg
ic
What
if
scen
ario
s
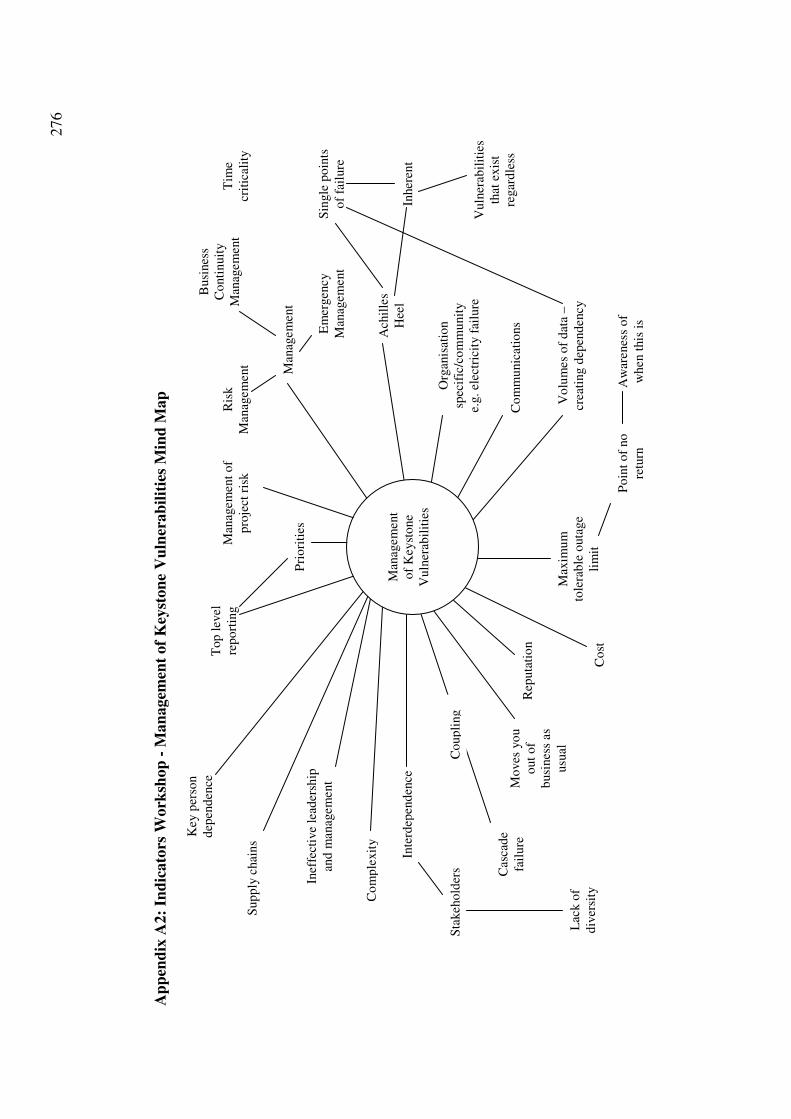
276
Ap
pen
dix
A2:
Ind
icato
rs W
ork
shop
- M
an
agem
ent
of
Key
ston
e V
uln
erab
ilit
ies
Min
d M
ap
Em
ergen
cy
Man
agem
ent
Lac
k o
f
div
ersi
ty
Sta
keh
old
ers
Pri
ori
ties
Man
agem
ent
of
pro
ject
ris
k
Man
agem
ent
Ris
k
Man
agem
ent
Busi
nes
s C
onti
nuit
y
Man
agem
ent
Ach
ille
s
Hee
l
Sin
gle
po
ints
of
fail
ure
Tim
e
crit
ical
ity
Inher
ent
Org
anis
atio
n
spec
ific
/co
mm
unit
y
e.g.
elec
tric
ity f
ailu
re
Vuln
erab
ilit
ies
that
ex
ist
regar
dle
ss
Co
mm
unic
atio
ns
Vo
lum
es o
f d
ata
–
crea
ting d
epen
den
cy
Max
imu
m
tole
rab
le o
uta
ge
lim
it
Po
int
of
no
retu
rn
Aw
aren
ess
of
wh
en t
his
is
Co
st
Rep
uta
tio
n
Mo
ves
yo
u
out
of
busi
nes
s as
usu
al
Cas
cad
e
fail
ure
Inte
rdep
end
ence
Co
mp
lexit
y
Inef
fect
ive
lead
ersh
ip
and
man
agem
ent
Sup
ply
chai
ns
Key
per
son
dep
end
ence
T
op
lev
el
rep
ort
ing
Co
up
ling
M
anag
emen
t o
f K
eyst
one
Vuln
erab
ilit
ies
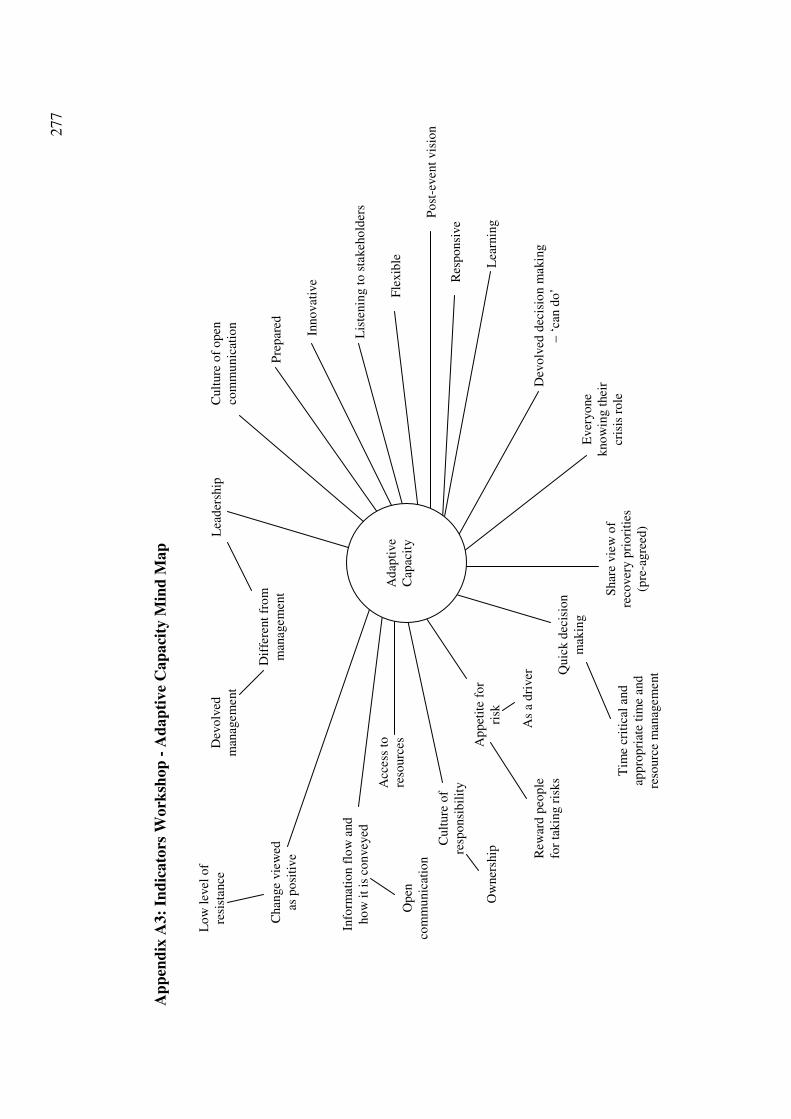
277
Ap
pen
dix
A3:
Ind
icato
rs W
ork
shop
- A
dap
tive
Cap
aci
ty M
ind
Map
Lea
der
ship
Dif
fere
nt
fro
m
man
agem
ent
Dev
olv
ed
man
agem
ent
Cult
ure
of
op
en
com
mu
nic
atio
n
Pre
par
ed
Inno
vat
ive
Lis
tenin
g t
o s
takeh
old
ers
Fle
xib
le
Po
st-e
ven
t vis
ion
Res
po
nsi
ve
Lea
rnin
g
Dev
olv
ed d
ecis
ion m
akin
g
– ‘
can d
o’
Ever
yo
ne
kno
win
g t
hei
r cr
isis
ro
le
Shar
e vie
w o
f re
cover
y p
rio
riti
es
(pre
-agre
ed)
Quic
k d
ecis
ion
mak
ing
Tim
e cr
itic
al a
nd
ap
pro
pri
ate
tim
e an
d
reso
urc
e m
anag
emen
t
Ap
pet
ite
for
risk
As
a d
river
R
ewar
d p
eop
le
for
takin
g r
isk
s
Cult
ure
of
resp
onsi
bil
ity
Ow
ner
ship
Acc
ess
to
reso
urc
es
Info
rmat
ion f
low
and
ho
w i
t is
co
nvey
ed
Op
en
com
mu
nic
atio
n
Chan
ge
vie
wed
as p
osi
tive
Lo
w l
evel
of
resi
stan
ce
A
dap
tive
Cap
acit
y
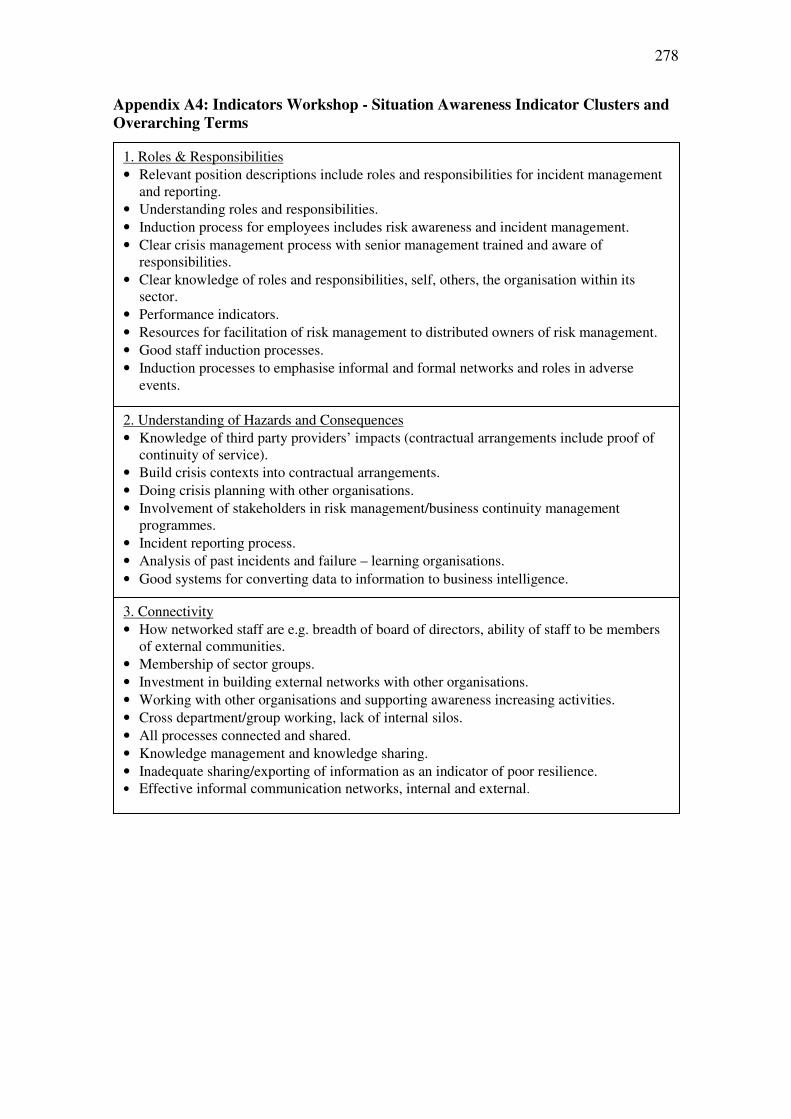
278
Appendix A4: Indicators Workshop - Situation Awareness Indicator Clusters and
Overarching Terms
1. Roles & Responsibilities
• Relevant position descriptions include roles and responsibilities for incident management and reporting.
• Understanding roles and responsibilities.
• Induction process for employees includes risk awareness and incident management.
• Clear crisis management process with senior management trained and aware of responsibilities.
• Clear knowledge of roles and responsibilities, self, others, the organisation within its sector.
• Performance indicators.
• Resources for facilitation of risk management to distributed owners of risk management.
• Good staff induction processes.
• Induction processes to emphasise informal and formal networks and roles in adverse events.
2. Understanding of Hazards and Consequences
• Knowledge of third party providers’ impacts (contractual arrangements include proof of continuity of service).
• Build crisis contexts into contractual arrangements.
• Doing crisis planning with other organisations.
• Involvement of stakeholders in risk management/business continuity management programmes.
• Incident reporting process.
• Analysis of past incidents and failure – learning organisations.
• Good systems for converting data to information to business intelligence.
3. Connectivity
• How networked staff are e.g. breadth of board of directors, ability of staff to be members of external communities.
• Membership of sector groups.
• Investment in building external networks with other organisations.
• Working with other organisations and supporting awareness increasing activities.
• Cross department/group working, lack of internal silos.
• All processes connected and shared.
• Knowledge management and knowledge sharing.
• Inadequate sharing/exporting of information as an indicator of poor resilience. • Effective informal communication networks, internal and external.
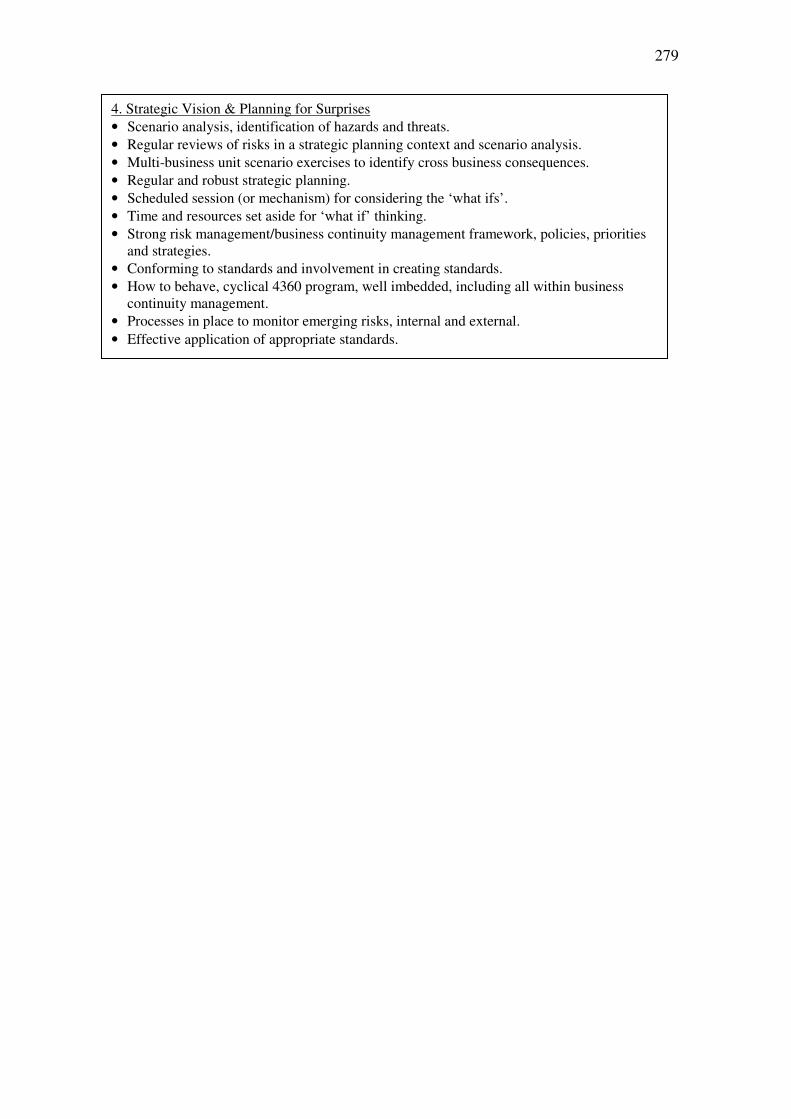
279
4. Strategic Vision & Planning for Surprises
• Scenario analysis, identification of hazards and threats.
• Regular reviews of risks in a strategic planning context and scenario analysis.
• Multi-business unit scenario exercises to identify cross business consequences.
• Regular and robust strategic planning.
• Scheduled session (or mechanism) for considering the ‘what ifs’.
• Time and resources set aside for ‘what if’ thinking.
• Strong risk management/business continuity management framework, policies, priorities and strategies.
• Conforming to standards and involvement in creating standards.
• How to behave, cyclical 4360 program, well imbedded, including all within business continuity management.
• Processes in place to monitor emerging risks, internal and external.
• Effective application of appropriate standards.
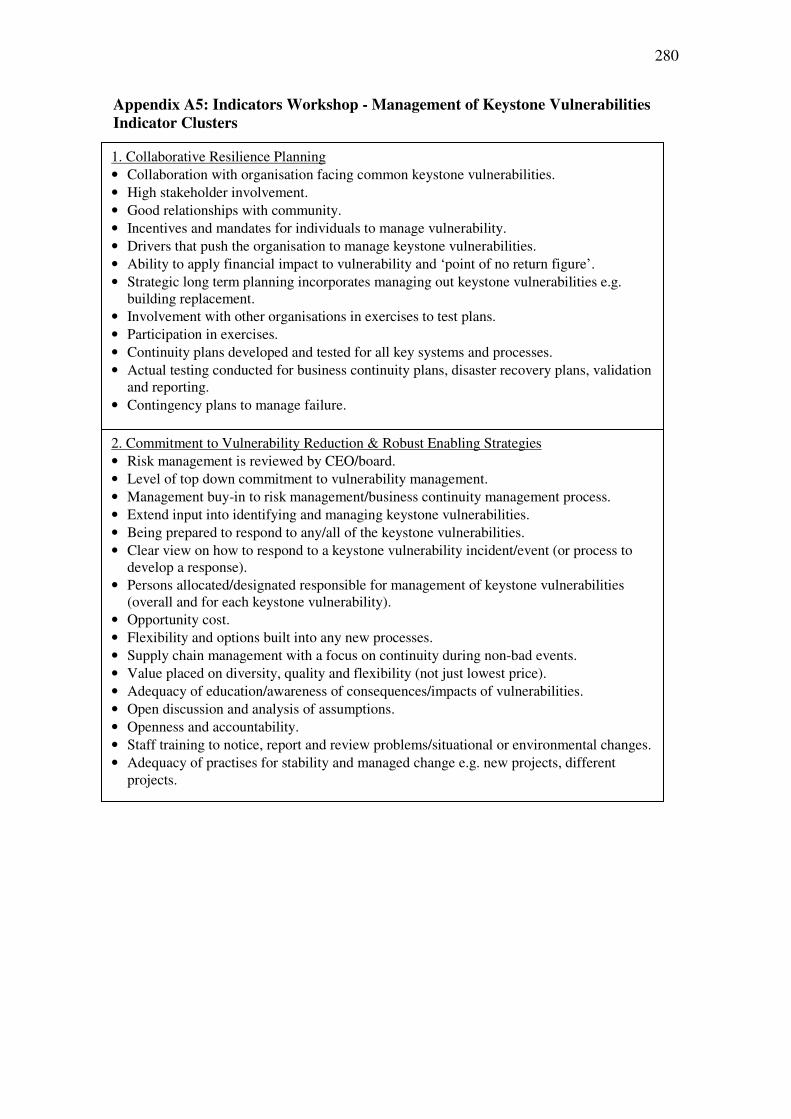
280
Appendix A5: Indicators Workshop - Management of Keystone Vulnerabilities
Indicator Clusters
1. Collaborative Resilience Planning
• Collaboration with organisation facing common keystone vulnerabilities.
• High stakeholder involvement.
• Good relationships with community.
• Incentives and mandates for individuals to manage vulnerability.
• Drivers that push the organisation to manage keystone vulnerabilities.
• Ability to apply financial impact to vulnerability and ‘point of no return figure’.
• Strategic long term planning incorporates managing out keystone vulnerabilities e.g. building replacement.
• Involvement with other organisations in exercises to test plans.
• Participation in exercises.
• Continuity plans developed and tested for all key systems and processes.
• Actual testing conducted for business continuity plans, disaster recovery plans, validation and reporting.
• Contingency plans to manage failure.
2. Commitment to Vulnerability Reduction & Robust Enabling Strategies
• Risk management is reviewed by CEO/board.
• Level of top down commitment to vulnerability management.
• Management buy-in to risk management/business continuity management process.
• Extend input into identifying and managing keystone vulnerabilities.
• Being prepared to respond to any/all of the keystone vulnerabilities.
• Clear view on how to respond to a keystone vulnerability incident/event (or process to develop a response).
• Persons allocated/designated responsible for management of keystone vulnerabilities (overall and for each keystone vulnerability).
• Opportunity cost.
• Flexibility and options built into any new processes.
• Supply chain management with a focus on continuity during non-bad events.
• Value placed on diversity, quality and flexibility (not just lowest price).
• Adequacy of education/awareness of consequences/impacts of vulnerabilities.
• Open discussion and analysis of assumptions.
• Openness and accountability.
• Staff training to notice, report and review problems/situational or environmental changes.
• Adequacy of practises for stability and managed change e.g. new projects, different projects.
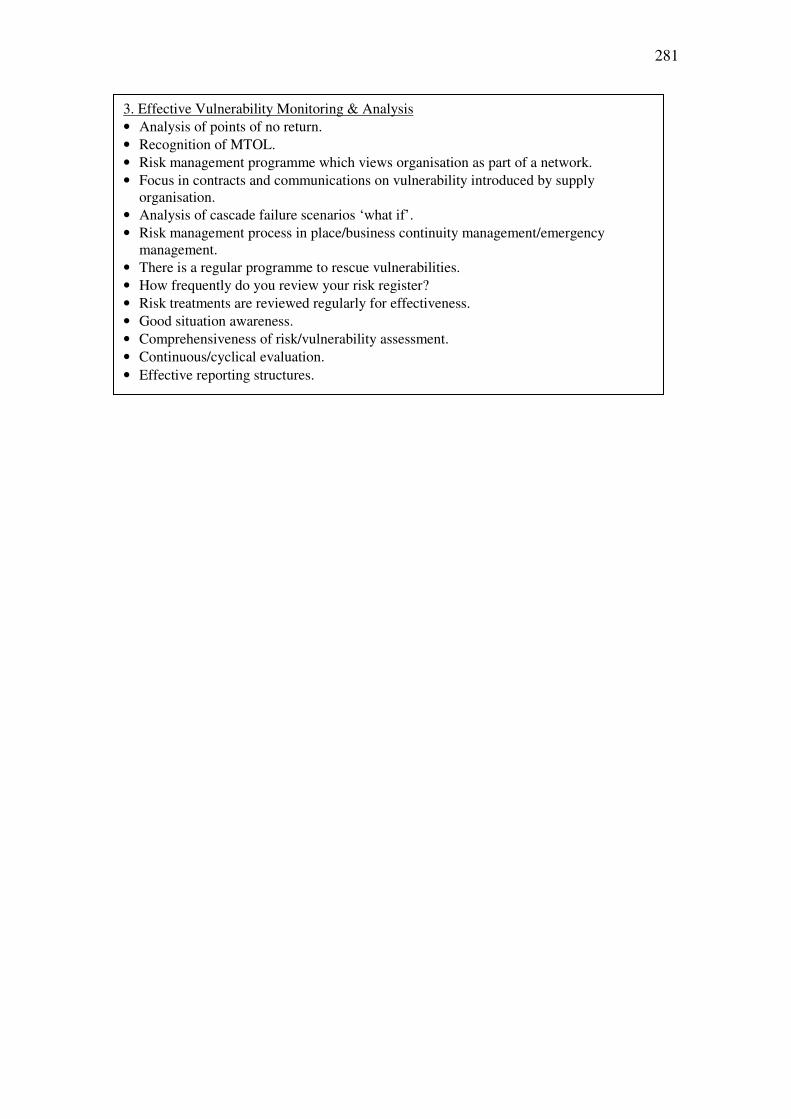
281
3. Effective Vulnerability Monitoring & Analysis
• Analysis of points of no return.
• Recognition of MTOL.
• Risk management programme which views organisation as part of a network.
• Focus in contracts and communications on vulnerability introduced by supply organisation.
• Analysis of cascade failure scenarios ‘what if’.
• Risk management process in place/business continuity management/emergency management.
• There is a regular programme to rescue vulnerabilities.
• How frequently do you review your risk register?
• Risk treatments are reviewed regularly for effectiveness.
• Good situation awareness.
• Comprehensiveness of risk/vulnerability assessment.
• Continuous/cyclical evaluation.
• Effective reporting structures.
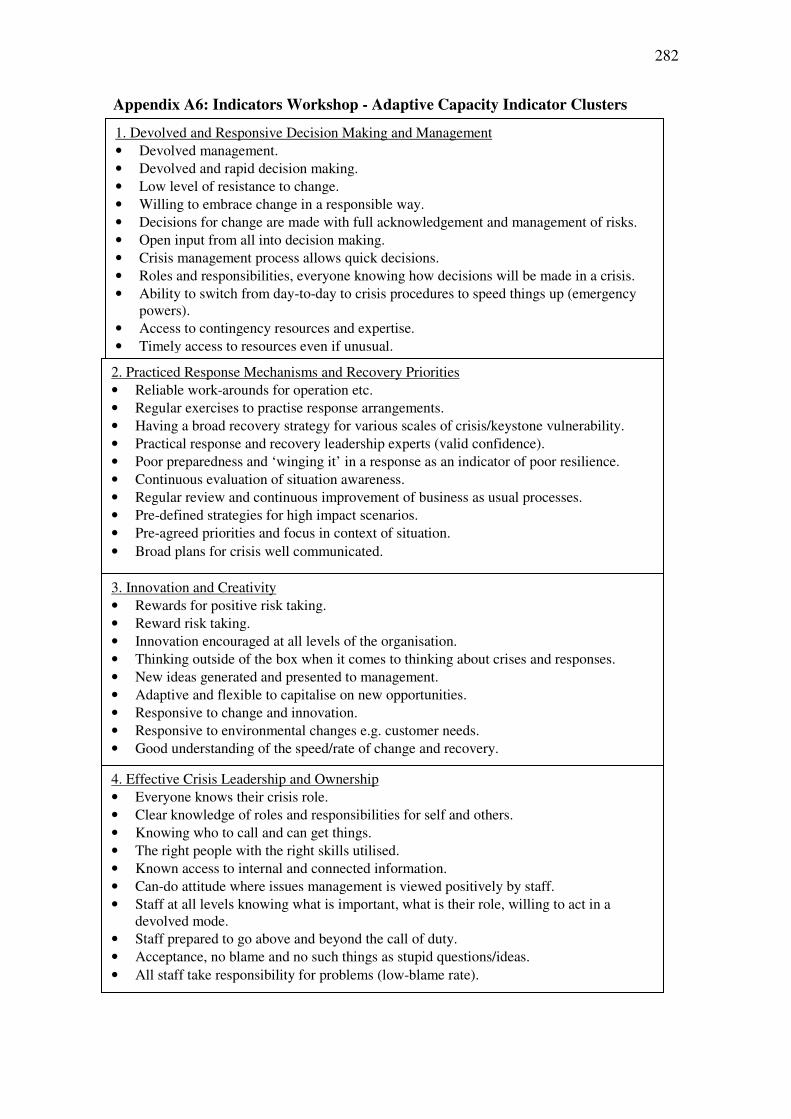
282
Appendix A6: Indicators Workshop - Adaptive Capacity Indicator Clusters
1. Devolved and Responsive Decision Making and Management
• Devolved management.
• Devolved and rapid decision making.
• Low level of resistance to change.
• Willing to embrace change in a responsible way.
• Decisions for change are made with full acknowledgement and management of risks.
• Open input from all into decision making.
• Crisis management process allows quick decisions.
• Roles and responsibilities, everyone knowing how decisions will be made in a crisis.
• Ability to switch from day-to-day to crisis procedures to speed things up (emergency powers).
• Access to contingency resources and expertise.
• Timely access to resources even if unusual.
2. Practiced Response Mechanisms and Recovery Priorities
• Reliable work-arounds for operation etc.
• Regular exercises to practise response arrangements.
• Having a broad recovery strategy for various scales of crisis/keystone vulnerability.
• Practical response and recovery leadership experts (valid confidence).
• Poor preparedness and ‘winging it’ in a response as an indicator of poor resilience.
• Continuous evaluation of situation awareness.
• Regular review and continuous improvement of business as usual processes.
• Pre-defined strategies for high impact scenarios.
• Pre-agreed priorities and focus in context of situation.
• Broad plans for crisis well communicated.
3. Innovation and Creativity
• Rewards for positive risk taking.
• Reward risk taking.
• Innovation encouraged at all levels of the organisation.
• Thinking outside of the box when it comes to thinking about crises and responses.
• New ideas generated and presented to management.
• Adaptive and flexible to capitalise on new opportunities.
• Responsive to change and innovation.
• Responsive to environmental changes e.g. customer needs.
• Good understanding of the speed/rate of change and recovery.
4. Effective Crisis Leadership and Ownership
• Everyone knows their crisis role.
• Clear knowledge of roles and responsibilities for self and others.
• Knowing who to call and can get things.
• The right people with the right skills utilised.
• Known access to internal and connected information.
• Can-do attitude where issues management is viewed positively by staff.
• Staff at all levels knowing what is important, what is their role, willing to act in a devolved mode.
• Staff prepared to go above and beyond the call of duty.
• Acceptance, no blame and no such things as stupid questions/ideas.
• All staff take responsibility for problems (low-blame rate).
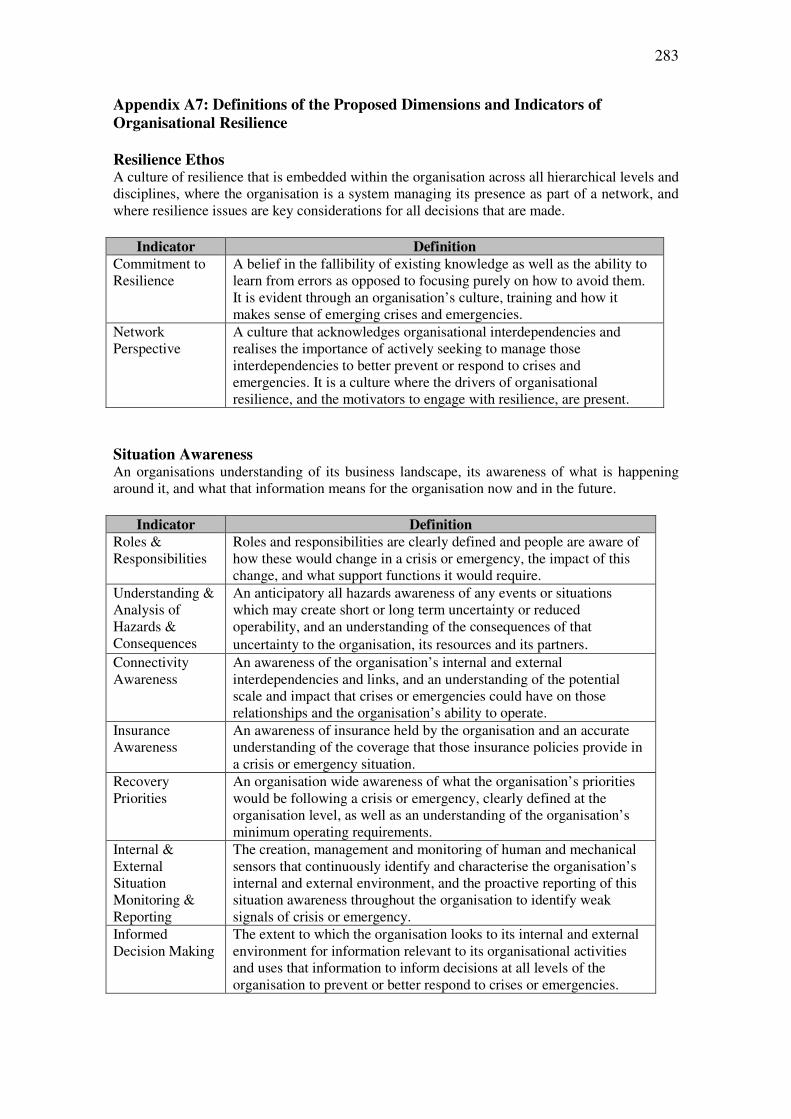
283
Appendix A7: Definitions of the Proposed Dimensions and Indicators of
Organisational Resilience
Resilience Ethos A culture of resilience that is embedded within the organisation across all hierarchical levels and disciplines, where the organisation is a system managing its presence as part of a network, and where resilience issues are key considerations for all decisions that are made.
Indicator Definition
Commitment to Resilience
A belief in the fallibility of existing knowledge as well as the ability to learn from errors as opposed to focusing purely on how to avoid them. It is evident through an organisation’s culture, training and how it makes sense of emerging crises and emergencies.
Network Perspective
A culture that acknowledges organisational interdependencies and realises the importance of actively seeking to manage those interdependencies to better prevent or respond to crises and emergencies. It is a culture where the drivers of organisational resilience, and the motivators to engage with resilience, are present.
Situation Awareness An organisations understanding of its business landscape, its awareness of what is happening around it, and what that information means for the organisation now and in the future.
Indicator Definition
Roles & Responsibilities
Roles and responsibilities are clearly defined and people are aware of how these would change in a crisis or emergency, the impact of this change, and what support functions it would require.
Understanding & Analysis of Hazards & Consequences
An anticipatory all hazards awareness of any events or situations which may create short or long term uncertainty or reduced operability, and an understanding of the consequences of that
uncertainty to the organisation, its resources and its partners. Connectivity Awareness
An awareness of the organisation’s internal and external interdependencies and links, and an understanding of the potential scale and impact that crises or emergencies could have on those relationships and the organisation’s ability to operate.
Insurance Awareness
An awareness of insurance held by the organisation and an accurate understanding of the coverage that those insurance policies provide in a crisis or emergency situation.
Recovery Priorities
An organisation wide awareness of what the organisation’s priorities would be following a crisis or emergency, clearly defined at the organisation level, as well as an understanding of the organisation’s minimum operating requirements.
Internal & External Situation Monitoring & Reporting
The creation, management and monitoring of human and mechanical sensors that continuously identify and characterise the organisation’s internal and external environment, and the proactive reporting of this situation awareness throughout the organisation to identify weak signals of crisis or emergency.
Informed Decision Making
The extent to which the organisation looks to its internal and external environment for information relevant to its organisational activities and uses that information to inform decisions at all levels of the organisation to prevent or better respond to crises or emergencies.
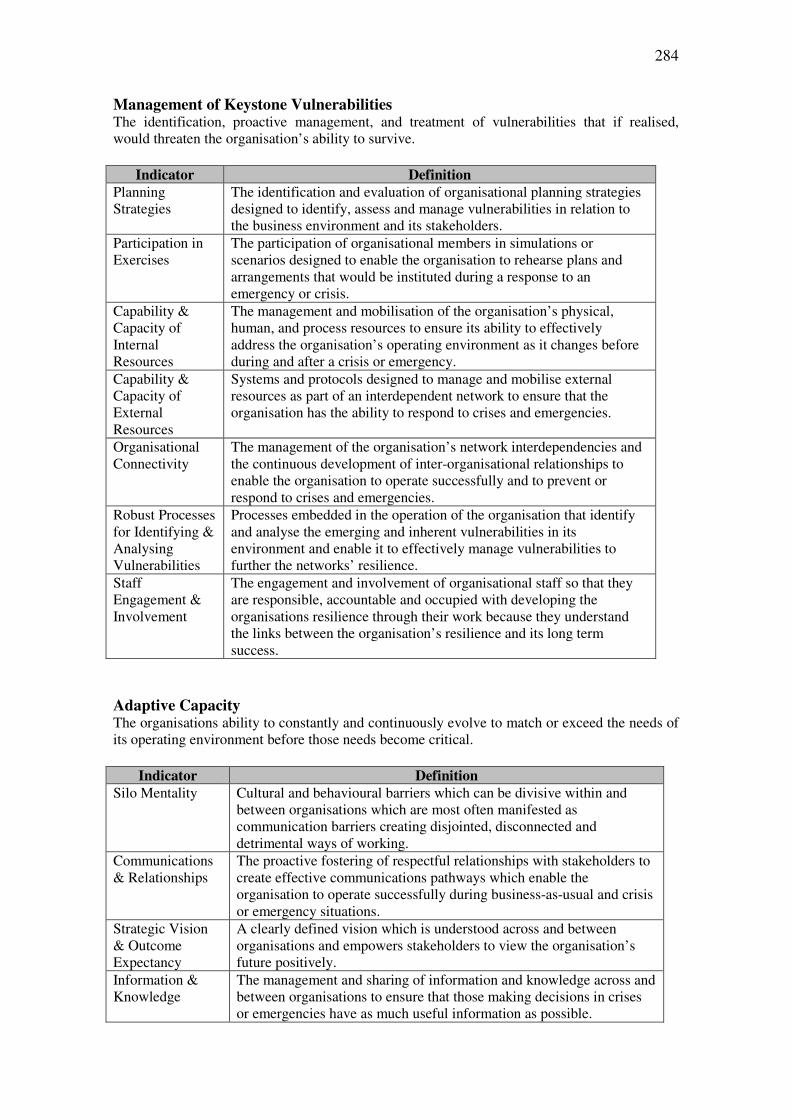
284
Management of Keystone Vulnerabilities The identification, proactive management, and treatment of vulnerabilities that if realised, would threaten the organisation’s ability to survive.
Indicator Definition
Planning Strategies
The identification and evaluation of organisational planning strategies designed to identify, assess and manage vulnerabilities in relation to the business environment and its stakeholders.
Participation in Exercises
The participation of organisational members in simulations or scenarios designed to enable the organisation to rehearse plans and arrangements that would be instituted during a response to an emergency or crisis.
Capability & Capacity of Internal Resources
The management and mobilisation of the organisation’s physical, human, and process resources to ensure its ability to effectively address the organisation’s operating environment as it changes before during and after a crisis or emergency.
Capability & Capacity of External Resources
Systems and protocols designed to manage and mobilise external resources as part of an interdependent network to ensure that the organisation has the ability to respond to crises and emergencies.
Organisational Connectivity
The management of the organisation’s network interdependencies and the continuous development of inter-organisational relationships to enable the organisation to operate successfully and to prevent or respond to crises and emergencies.
Robust Processes for Identifying & Analysing Vulnerabilities
Processes embedded in the operation of the organisation that identify and analyse the emerging and inherent vulnerabilities in its environment and enable it to effectively manage vulnerabilities to further the networks’ resilience.
Staff Engagement & Involvement
The engagement and involvement of organisational staff so that they are responsible, accountable and occupied with developing the organisations resilience through their work because they understand the links between the organisation’s resilience and its long term success.
Adaptive Capacity The organisations ability to constantly and continuously evolve to match or exceed the needs of its operating environment before those needs become critical.
Indicator Definition
Silo Mentality Cultural and behavioural barriers which can be divisive within and between organisations which are most often manifested as communication barriers creating disjointed, disconnected and detrimental ways of working.
Communications & Relationships
The proactive fostering of respectful relationships with stakeholders to create effective communications pathways which enable the organisation to operate successfully during business-as-usual and crisis or emergency situations.
Strategic Vision & Outcome Expectancy
A clearly defined vision which is understood across and between organisations and empowers stakeholders to view the organisation’s future positively.
Information & Knowledge
The management and sharing of information and knowledge across and between organisations to ensure that those making decisions in crises or emergencies have as much useful information as possible.

285
Leadership, Management & Governance Structures
Inspirational organisational leadership which successfully balances the needs of internal and external stakeholders and business priorities, and which would be able to provide good management and decision making during times of crisis.
Innovation & Creativity
An organisational system where innovation and creativity are consistently encouraged and rewarded, and where the generation and evaluation of new ideas is recognised as key to the organisation’s performance during crises or emergencies.
Devolved & Responsive Decision Making
An organisational structure, formal or informal, which evolves during the response to an emergency or crisis, where people have the authority to make decisions directly linked to their work and where, when higher authority is required, this can be obtained quickly and without excessive bureaucracy.

286
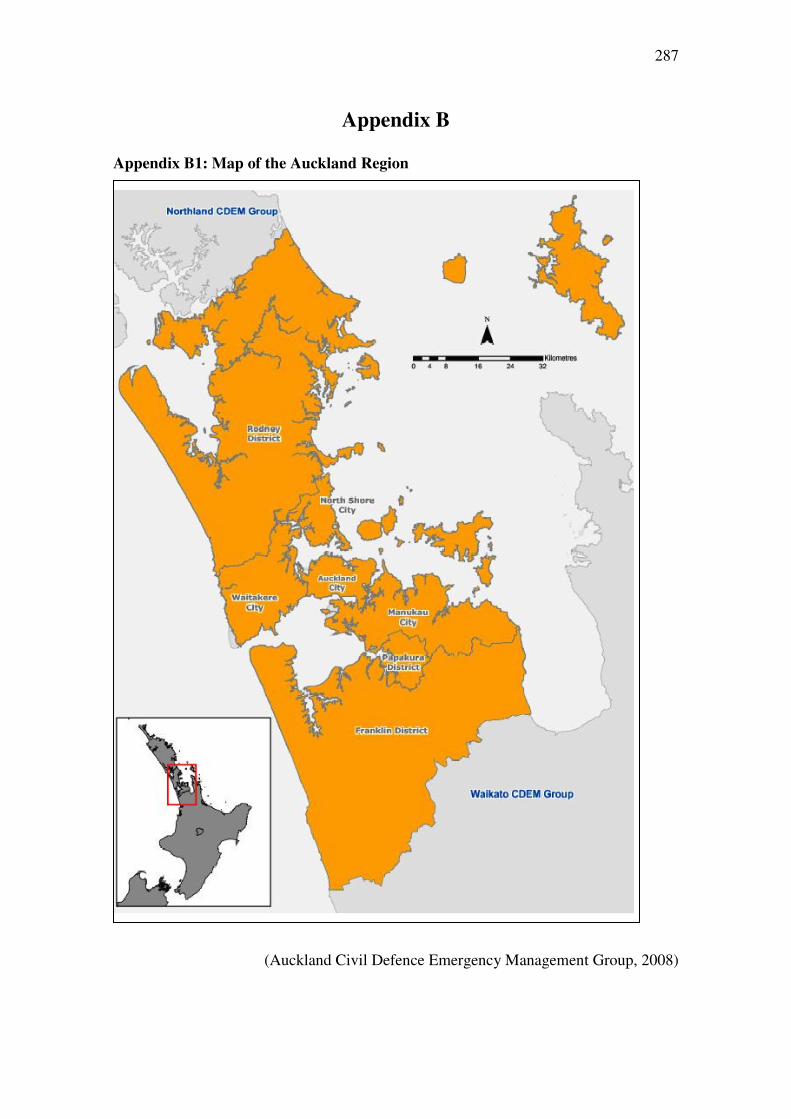
287
Appendix B
Appendix B1: Map of the Auckland Region
(Auckland Civil Defence Emergency Management Group, 2008)
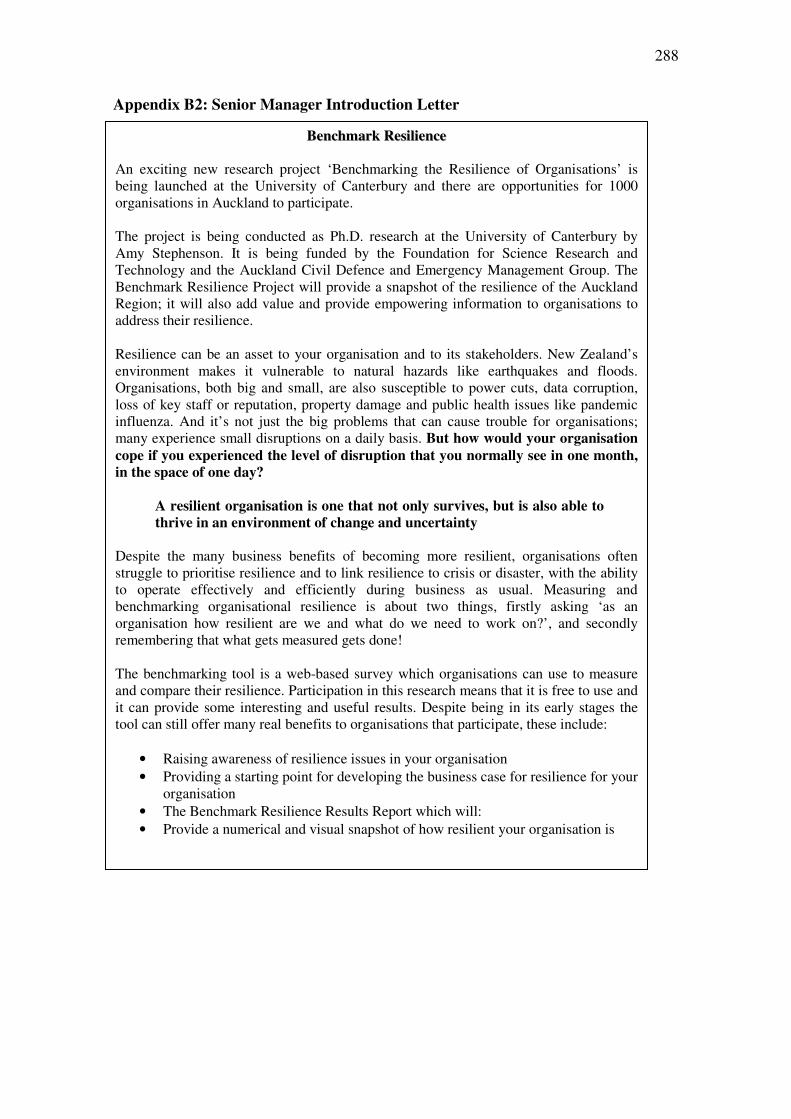
288
Appendix B2: Senior Manager Introduction Letter
BBeenncchhmmaarrkk RReessiilliieennccee An exciting new research project ‘Benchmarking the Resilience of Organisations’ is being launched at the University of Canterbury and there are opportunities for 1000 organisations in Auckland to participate. The project is being conducted as Ph.D. research at the University of Canterbury by Amy Stephenson. It is being funded by the Foundation for Science Research and Technology and the Auckland Civil Defence and Emergency Management Group. The Benchmark Resilience Project will provide a snapshot of the resilience of the Auckland Region; it will also add value and provide empowering information to organisations to address their resilience. Resilience can be an asset to your organisation and to its stakeholders. New Zealand’s environment makes it vulnerable to natural hazards like earthquakes and floods. Organisations, both big and small, are also susceptible to power cuts, data corruption, loss of key staff or reputation, property damage and public health issues like pandemic influenza. And it’s not just the big problems that can cause trouble for organisations; many experience small disruptions on a daily basis. But how would your organisation
cope if you experienced the level of disruption that you normally see in one month,
in the space of one day?
A resilient organisation is one that not only survives, but is also able to
thrive in an environment of change and uncertainty Despite the many business benefits of becoming more resilient, organisations often struggle to prioritise resilience and to link resilience to crisis or disaster, with the ability to operate effectively and efficiently during business as usual. Measuring and benchmarking organisational resilience is about two things, firstly asking ‘as an organisation how resilient are we and what do we need to work on?’, and secondly remembering that what gets measured gets done! The benchmarking tool is a web-based survey which organisations can use to measure and compare their resilience. Participation in this research means that it is free to use and it can provide some interesting and useful results. Despite being in its early stages the tool can still offer many real benefits to organisations that participate, these include:
• Raising awareness of resilience issues in your organisation
• Providing a starting point for developing the business case for resilience for your organisation
• The Benchmark Resilience Results Report which will:
• Provide a numerical and visual snapshot of how resilient your organisation is
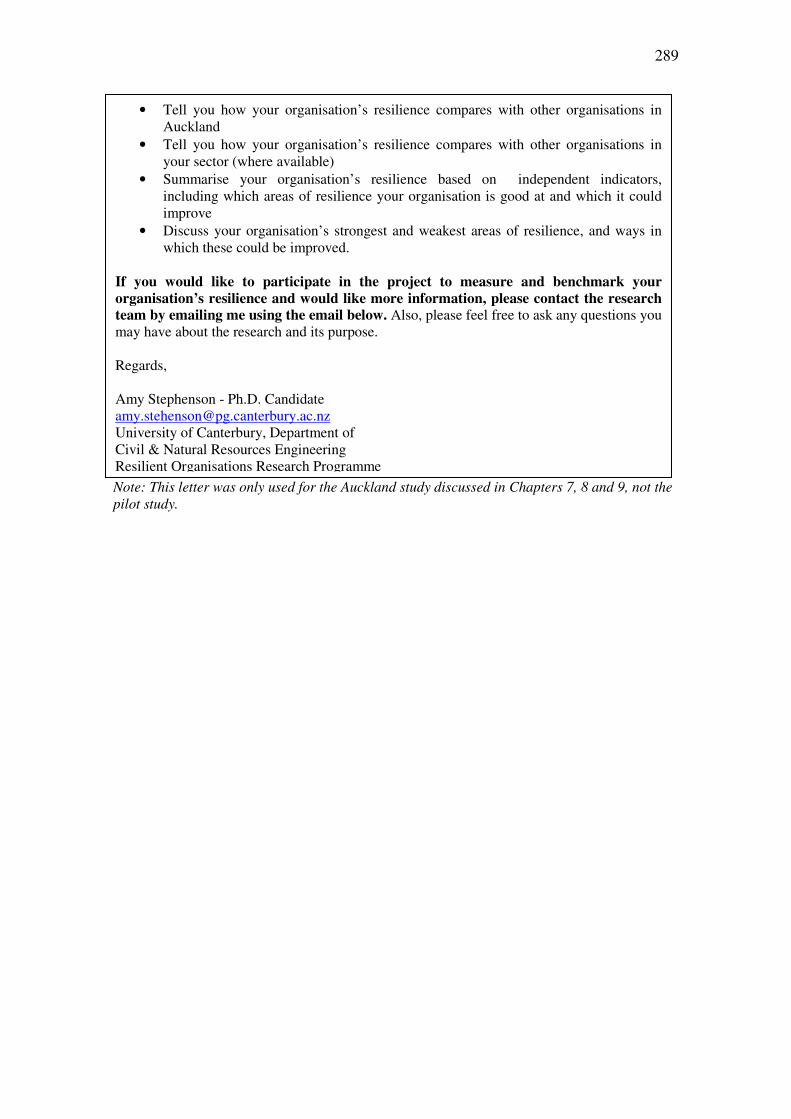
289
Note: This letter was only used for the Auckland study discussed in Chapters 7, 8 and 9, not the pilot study.
• Tell you how your organisation’s resilience compares with other organisations in Auckland
• Tell you how your organisation’s resilience compares with other organisations in your sector (where available)
• Summarise your organisation’s resilience based on independent indicators, including which areas of resilience your organisation is good at and which it could improve
• Discuss your organisation’s strongest and weakest areas of resilience, and ways in which these could be improved.
If you would like to participate in the project to measure and benchmark your
organisation’s resilience and would like more information, please contact the research
team by emailing me using the email below. Also, please feel free to ask any questions you may have about the research and its purpose. Regards, Amy Stephenson - Ph.D. Candidate [email protected] University of Canterbury, Department of Civil & Natural Resources Engineering Resilient Organisations Research Programme
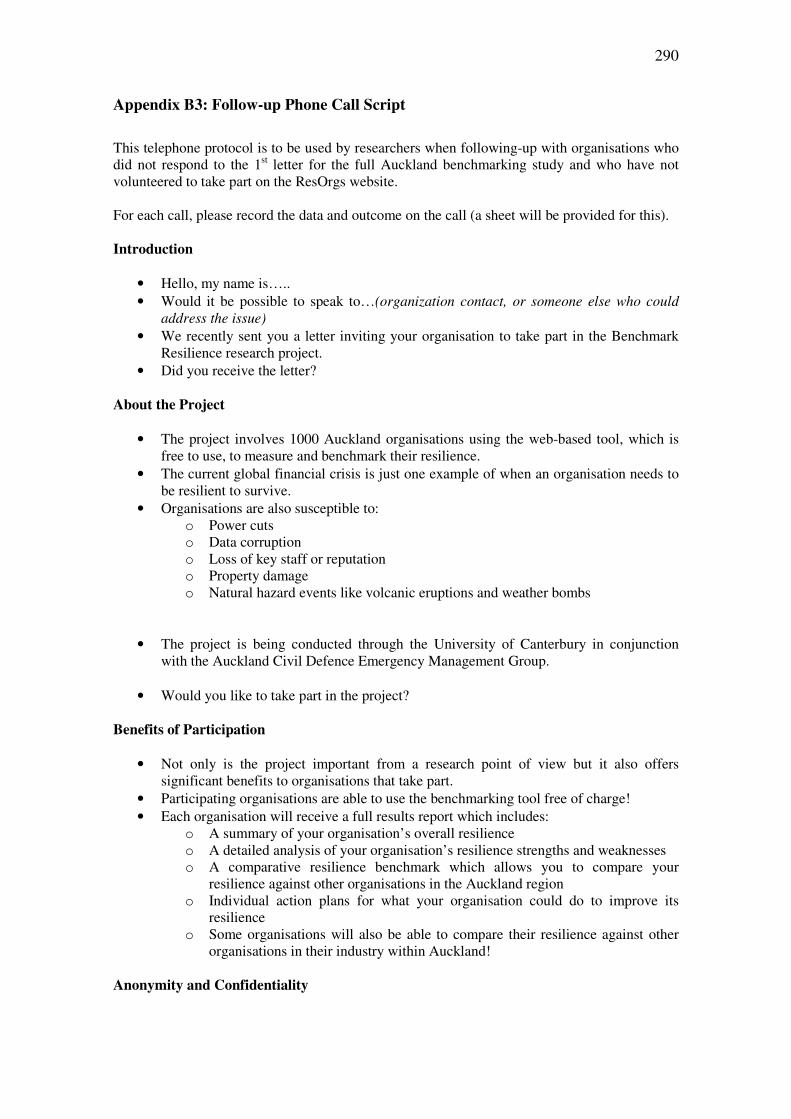
290
Appendix B3: Follow-up Phone Call Script
This telephone protocol is to be used by researchers when following-up with organisations who did not respond to the 1st letter for the full Auckland benchmarking study and who have not volunteered to take part on the ResOrgs website. For each call, please record the data and outcome on the call (a sheet will be provided for this). Introduction
• Hello, my name is…..
• Would it be possible to speak to…(organization contact, or someone else who could address the issue)
• We recently sent you a letter inviting your organisation to take part in the Benchmark Resilience research project.
• Did you receive the letter? About the Project
• The project involves 1000 Auckland organisations using the web-based tool, which is free to use, to measure and benchmark their resilience.
• The current global financial crisis is just one example of when an organisation needs to be resilient to survive.
• Organisations are also susceptible to: o Power cuts o Data corruption o Loss of key staff or reputation o Property damage o Natural hazard events like volcanic eruptions and weather bombs
• The project is being conducted through the University of Canterbury in conjunction with the Auckland Civil Defence Emergency Management Group.
• Would you like to take part in the project? Benefits of Participation
• Not only is the project important from a research point of view but it also offers significant benefits to organisations that take part.
• Participating organisations are able to use the benchmarking tool free of charge!
• Each organisation will receive a full results report which includes: o A summary of your organisation’s overall resilience o A detailed analysis of your organisation’s resilience strengths and weaknesses o A comparative resilience benchmark which allows you to compare your
resilience against other organisations in the Auckland region o Individual action plans for what your organisation could do to improve its
resilience o Some organisations will also be able to compare their resilience against other
organisations in their industry within Auckland! Anonymity and Confidentiality
291
• If your organisation agrees to take part, your results and data are 100% confidential and will not be shared, we do the comparison by aggregating the data so no single individual or organisation can be identified in any way.
• The benchmarking tool and the research as a whole has been reviews and approved by the University of Canterbury Human Ethics Committee.
Reasons Organisations Might Give for Not Taking Part
• Haven’t had time to do it: o The survey only takes 20-25 minutes to do on average; some people have done
in as little as 8 minutes.
• Staff don’t want to do it: o Emphasize that it doesn’t take long, it is anonymous and confidential. o They would be helping their organisation to become more resilient, increased
resilience will prepare them for crisis and make the organisation more likely to survive a crisis or emergency.
o The tool does not measure or evaluate the resilience of individual staff members in any way.
• Staff don’t have access to a computer: o We can send out paper copies, ask staff to return the survey into a box over the
course of one week and then bulk post it back to us (we don’t want to do this for every organisation but if it’s a small business then this is ok).
• We’re only a small business: o Being a small business means that you are that much more sensitive to changes
in your organisation’s environment or conditions. o The survey has been specifically designed to be applicable to small businesses.
• We have our own business performance tools: o This benchmarking tool is unique in that it is actually designed specifically to
measure and compare resilience. o It is free to use and will provide you with useful additional information which
you could use to evaluate and compare with your existing tools. o Business performance is different from resilience.
• We already use benchmarking tools: o As you go through the survey you will recognize many of the themes as things
that you have worked with and used before. This tool is wide ranging and while it cannot provide a full measure it does include things like Return on Investment, culture, staff satisfaction, profit, sales, decision making and leadership.
o It draws them together and relates them to resilience specific indicators.
• We have recently been through a lot of restructuring or change so I don’t think it would be very useful:
o That is perfect, now is the best time for you to use the tool. One of the main purposes of the tool is to allow organisations to answer the question of how resilient are we now? After restructuring or a lot of change everything is new and most organisations are quite unsure of how their new structure will work during business-as-usual, let alone during a crisis.
o One of the most useful things you can do now is to measure your resilience which includes elements of your culture, financial position, your staff skills, knowledge and satisfaction. Then you can use that information to move forward and work out strategies to manage your new structure and increase your resilience at the same time – it’s a more holistic way of managing.
• I don’t really know about this resilience stuff: o You don’t need to; the tool is specifically designed so that it does not measure
how much you know about resilience.
292
o It asks questions about your organisation and then, using indicators and the way the questions are phrased, relates them to your organisation’s overall resilience.
o However through taking part and using the tool, you and your staff will automatically become more aware of resilience issues and learn about how you could become more resilient.
o Your results report will also include specific action plans which are tailored to your organisation and can help your organisation to improve its resilience.
How Does the Tool Work?
• We need as many members of staff from as many different roles and levels of your organisation as possible to take part, the more data we have, the more accurate your results will be.
• Each individual clicks on a link within an email and fills out the online survey (anonymously).
• The results are aggregated (averaged out) and that average is then your organisation’s submission for the tool.
• The results are analysed, and then your results report is written. What to Do Next
• If you would like to take part in the project we just need a few details: o Full name (if not original contact) o Job title (if not original contact) o Email address o Telephone number (if not original contact or we don’t have a direct line)
Process
• We will send you two emails: o 1st Email – Contains a link to the survey which is only to be filled out by one
senior manager at your organisation. This version of the survey contains all of the resilience measurement and benchmarking questions as well as an extra section of financial and management questions. You can choose to either fill this survey out yourself (possibly asking your Chief Financial Officer to be on hand to help if necessary), or you can ask someone else (who would have the necessary financial and management information) to do it on your behalf.
o 2nd Email – Contains a link to the survey which we will ask you to forward through an all staff email (to staff at your Auckland location only). Please also add a sentence at the beginning of this email to let your staff know that you support the project and how important it is to take part.
• We will also send you this information again so that you have it to refer to.
• The web-based tool will remain open until the end of April.
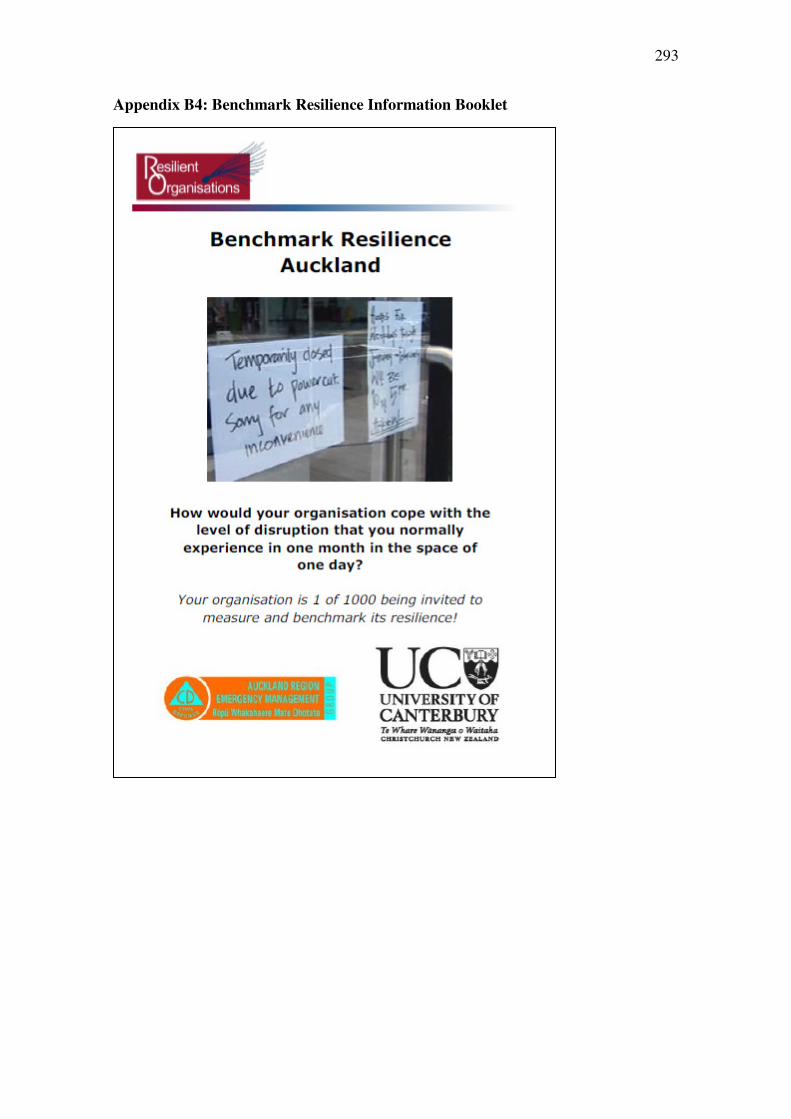
293
Appendix B4: Benchmark Resilience Information Booklet
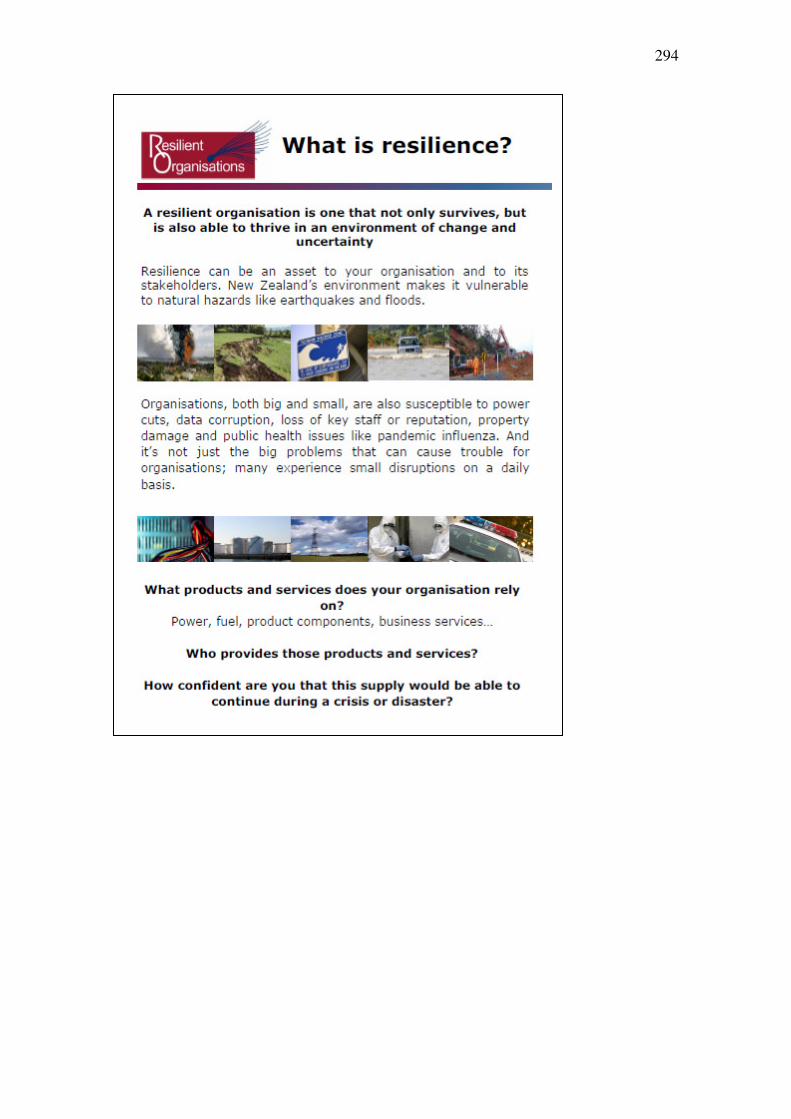
294
295
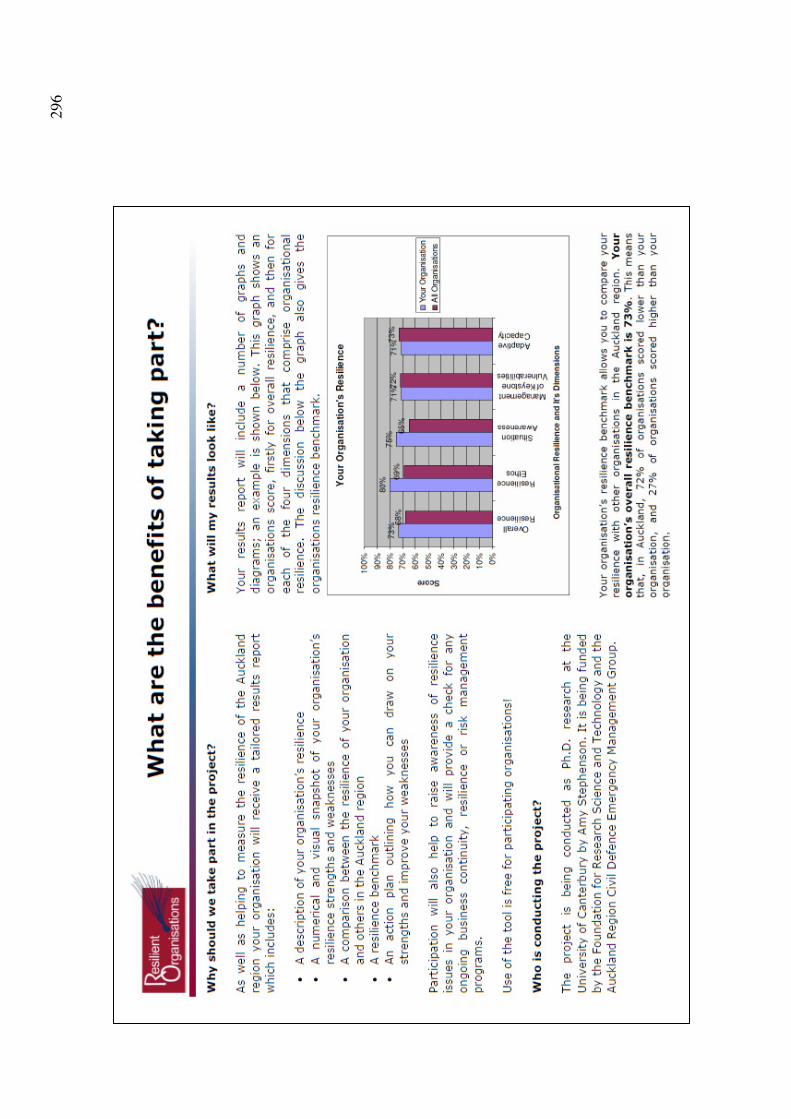
296
297
298
299
300
Appendix B5: Survey Link Email
Hi, Further to our conversation about the Benchmark Resilience research project, please find attached a letter and an example of the results report that participating organisations will receive. Have a read and let me know if you have any questions; if you would like to take part, please see the email below. Hi, Further to your conversation with my colleague Charlotte about the Benchmark Resilience research project, please see attached the original letter that was sent to your organisation, a PDF copy of the survey questions so that you can see what's involved, and an example of the results report that participating organisations will receive. If you decide to take part in the research please see the information below. The research is not only important for me as part of my Ph.D. but is also important for organisations and communities in Auckland. Thank you for participating in the Benchmark Resilience research project. We look forward to providing you with information on the resilience of your organisation. At the end of this study your organisation will receive a fully confidential report that will provide a numerical and visual snapshot of your organisation’s resilience, tell you how your organisation’s resilience compares with others in the Auckland region, identify and discuss your organisation’s resilience strengths and weaknesses and ways in which you can address them. It is important that as many staff as possible from your organisation’s Auckland location take part in the research. The more data we have, the more accurate the results we can provide. Participation is anonymous and confidential and no individual staff member or organisation will be identifiable in any way. You will shortly receive a second email containing instructions and a link to the web-based Benchmark Resilience tool; this should be forwarded to all staff at your organisation’s Auckland location. The link below will take you to a version of the survey that is only to be filled out by one senior manager. This survey contains all of the resilience measurement questions that your staff will answer, as well as an extra section containing financial and management questions. You can use the below link on this email fill out the survey yourself, or you can pass it to another senior manager (such as your Chief Financial Officer) to fill out on your behalf. If you have any questions about the tool or the research please email me at [email protected]. Link As a side note please feel free to add a sentence at the beginning of the all staff email to encourage your staff to take part. Regards,
301
Ap
pen
dix
C
Ap
pen
dix
C1:
Th
e O
rgan
isati
on
al
Res
ilie
nce
Mea
sure
men
t T
ool
that
was
Use
d f
or
the
Pil
ot
Stu
dy
Eth
ics
Sta
tem
ent
Ple
ase
read
the
foll
ow
ing b
efore
com
ple
ting t
he
ques
tionnai
re.
You a
re i
nvit
ed t
o p
arti
cipat
e in
the
rese
arch
pro
ject
‘B
ench
mar
kin
g t
he
Res
ilie
nce
of
Org
anis
atio
ns’
by c
om
ple
ting t
he
foll
ow
ing q
ues
tionnai
re. T
he
aim
of
the
pro
ject
is
to m
easu
re o
rgan
isat
ions
resi
lien
ce a
nd b
ench
mar
k i
t ag
ainst
oth
er o
rgan
isat
ions
in A
uck
land a
nd a
gai
nst
bes
t pra
ctic
e. T
his
ques
tionnai
re f
orm
s th
e pil
ot
study f
or
the
rese
arch
and w
ill
take
30-4
0 m
inute
s to
com
ple
te.
The
pro
ject
is
bei
ng c
arri
ed o
ut
as a
req
uir
emen
t fo
r a
Ph.D
. by A
my S
tephen
son w
ho c
an b
e co
nta
cted
at
02102638187, under
the
super
vis
ion o
f D
r. E
rica
S
evil
le (
Res
earc
h F
ello
w i
n t
he
Dep
artm
ent
of
Civ
il &
Nat
ura
l R
esourc
es E
ngin
eeri
ng a
t th
e U
niv
ersi
ty o
f C
ante
rbury
), w
ho c
an b
e co
nta
cted
at
021456706.
They
wil
l be
ple
ased
to d
iscu
ss a
ny q
ues
tions
you m
ay h
ave
about
par
tici
pat
ion i
n t
he
pro
ject
.
The
ques
tionnai
re i
s not
anonym
ous,
but
it i
s co
nfi
den
tial
. Y
ou w
ill
be
asked
to g
ive
your
nam
e at
the
star
t of
the
surv
ey;
this
is
so t
hat
you c
an w
ithdra
w y
our
par
tici
pat
ion, in
cludin
g w
ithdra
wal
of
any i
nfo
rmat
ion y
ou h
ave
pro
vid
ed, fo
r up t
o t
wo w
eeks
afte
r you h
ave
com
ple
ted t
he
surv
ey. O
nce
you h
ave
com
ple
ted t
he
surv
ey A
my w
ill
ring y
ou w
ithin
1 w
eek t
o d
iscu
ss y
our
exper
ience
of
the
surv
ey. Y
our
det
ails
and a
nsw
ers
are
confi
den
tial
and w
ill
not
be
shar
ed w
ith a
nyone.
T
his
info
rmat
ion i
s av
aila
ble
for
you t
o d
ow
nlo
ad a
nd k
eep f
or
refe
rence
in t
he
PD
F d
ocu
men
t on t
he
Res
ilie
nt
Org
anis
atio
ns
web
site
. I
hav
e re
ad a
nd u
nder
stood t
he
des
crip
tion o
f th
e ab
ove-
nam
ed p
roje
ct. I
under
stan
d t
hat
I m
ay w
ithdra
w f
rom
the
pro
ject
, in
cludin
g w
ithdra
wal
of
any
info
rmat
ion I
hav
e pro
vid
ed f
or
up t
o t
wo w
eeks
afte
r I
hav
e co
mple
ted t
he
surv
ey.
I note
that
the
pro
ject
has
bee
n r
evie
wed
and a
ppro
ved
by t
he
Univ
ersi
ty o
f C
ante
rbury
Hum
an E
thic
s C
om
mit
tee.
On t
his
bas
is I
agre
e to
par
tici
pat
e as
a s
ubje
ct i
n t
he
pro
ject
, an
d I
conse
nt
to t
he
use
of
my a
nsw
ers
wit
h t
he
under
stan
din
g t
hat
my d
ata
wil
l be
confi
den
tial
.
302
Inst
ruct
ion
s T
han
k y
ou f
or
agre
eing t
o t
ake
par
t in
the
Ben
chm
ark R
esil
ience
Pro
ject
.
The
surv
ey r
equir
es n
o s
pec
ial
skil
ls, an
d t
her
e ar
e, n
o r
ight
or
wro
ng a
nsw
ers.
You m
ay n
ot
be
able
to a
nsw
er a
ll o
f th
e ques
tions,
if
you c
an't
answ
er a
ques
tion c
hose
the
'Don
't K
now
' opti
on. M
any o
f th
e ques
tions
refe
r to
'your
org
anis
atio
n',
when
answ
erin
g t
hes
e ques
tions
ple
ase
thin
k a
bout
your
org
anis
atio
n a
t your
loca
tion a
s a
whole
and n
ot
just
your
dep
artm
ent
or
busi
nes
s unit
. T
he
ques
tions
use
your
per
cepti
on a
nd y
our
exper
ience
of
your
org
anis
atio
n t
o m
easu
re a
nd b
ench
mar
k i
ts r
esil
ience
. Q
ues
tions
do n
ot
refl
ect
on, or
judge,
your
ow
n p
erfo
rman
ce o
r re
sili
ence
in a
ny w
ay.
Once
you h
ave
star
ted t
he
surv
ey y
ou c
annot
save
your
pro
gre
ss o
r le
ave
the
surv
ey w
ithout
losi
ng y
our
answ
ers.
Ple
ase
mak
e su
re t
hat
you h
ave
20-3
0
min
ute
s to
com
ple
te t
he
surv
ey.
Y
ou w
ill
see
a pro
gre
ss b
ar a
t th
e to
p o
f your
scre
en. T
his
show
s you h
ow
far
thro
ugh t
he
surv
ey y
ou a
re, an
d i
ndic
ates
how
much
of
the
surv
ey i
s le
ft.
Once
you a
re h
appy w
ith y
our
answ
ers
on a
pag
e, c
lick
the
nex
t at
the
bott
om
of
the
pag
e to
move
on.
If y
ou h
ave
any q
ues
tions
at a
ny t
ime,
or
upon c
om
ple
tion w
ish t
o r
etri
eve
your
dat
a fr
om
the
pro
ject
ple
ase
don’t
hes
itat
e to
cal
l A
my o
n 0
2102638187 o
r E
rica
on 0
21456706.
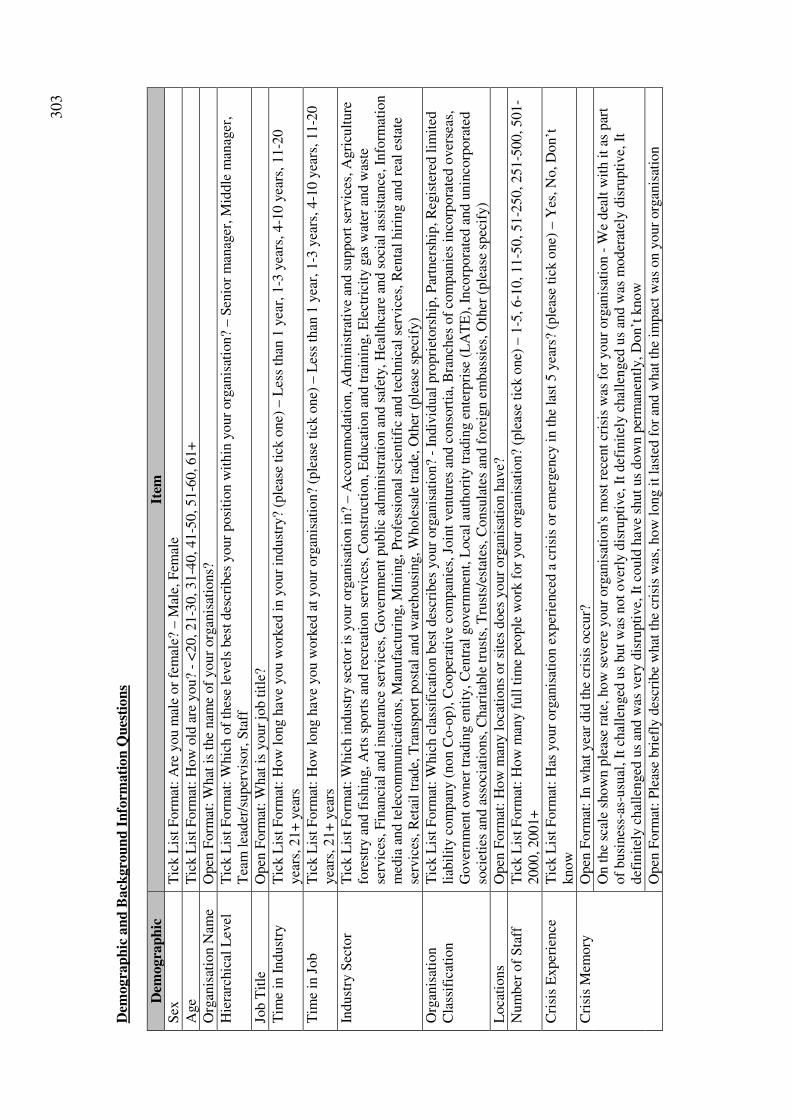
303
Dem
ogra
ph
ic a
nd
Back
gro
un
d I
nfo
rmati
on
Qu
esti
on
s
Dem
ogra
ph
ic
Item
Sex
T
ick L
ist
Form
at:
Are
you m
ale
or
fem
ale?
– M
ale,
Fem
ale
Age
Tic
k L
ist
Form
at:
How
old
are
you?
- <
20, 21-3
0, 31
-40, 41-5
0, 51
-60, 61+
Org
anis
atio
n N
ame
Open
Form
at:
What
is
the
nam
e of
your
org
anis
atio
ns?
Hie
rarc
hic
al L
evel
T
ick L
ist
Form
at:
Whic
h o
f th
ese
level
s bes
t des
crib
es y
our
posi
tion w
ithin
your
org
anis
atio
n?
– S
enio
r m
anag
er, M
iddle
man
ager
, T
eam
lea
der
/super
vis
or,
Sta
ff
Job T
itle
O
pen
Form
at:
What
is
your
job t
itle
?
Tim
e in
Indust
ry
Tic
k L
ist
Form
at:
How
long h
ave
you w
ork
ed i
n y
our
indust
ry?
(ple
ase
tick
one)
– L
ess
than
1 y
ear,
1-3
yea
rs, 4-1
0 y
ears
, 11-2
0
yea
rs, 21+
yea
rs
Tim
e in
Job
Tic
k L
ist
Form
at:
How
long h
ave
you w
ork
ed a
t your
org
anis
atio
n?
(ple
ase
tick
one)
– L
ess
than
1 y
ear,
1-3
yea
rs, 4-1
0 y
ears
, 11-2
0
yea
rs, 21+
yea
rs
Indust
ry S
ecto
r T
ick L
ist
Form
at:
Whic
h i
ndust
ry s
ecto
r is
your
org
anis
atio
n i
n?
– A
ccom
modat
ion, A
dm
inis
trat
ive
and s
upport
ser
vic
es, A
gri
cult
ure
fo
rest
ry a
nd f
ishin
g, A
rts
sport
s an
d r
ecre
atio
n s
ervic
es, C
onst
ruct
ion, E
duca
tion a
nd t
rain
ing, E
lect
rici
ty g
as w
ater
and w
aste
se
rvic
es, F
inan
cial
and i
nsu
rance
ser
vic
es, G
over
nm
ent
publi
c ad
min
istr
atio
n a
nd s
afet
y, H
ealt
hca
re a
nd s
oci
al a
ssis
tance
, In
form
atio
n
med
ia a
nd t
elec
om
munic
atio
ns,
Man
ufa
cturi
ng, M
inin
g, P
rofe
ssio
nal
sci
enti
fic
and t
echnic
al s
ervic
es, R
enta
l hir
ing a
nd r
eal
esta
te
serv
ices
, R
etai
l tr
ade,
Tra
nsp
ort
post
al a
nd w
areh
ousi
ng, W
hole
sale
tra
de,
Oth
er (
ple
ase
spec
ify)
Org
anis
atio
n
Cla
ssif
icat
ion
Tic
k L
ist
Form
at:
Whic
h c
lass
ific
atio
n b
est
des
crib
es y
our
org
anis
atio
n?
- In
div
idual
pro
pri
etors
hip
, P
artn
ersh
ip, R
egis
tere
d l
imit
ed
liab
ilit
y c
om
pan
y (
non C
o-o
p),
Cooper
ativ
e co
mpan
ies,
Join
t ven
ture
s an
d c
onso
rtia
, B
ranch
es o
f co
mpan
ies
inco
rpora
ted o
ver
seas
, G
over
nm
ent
ow
ner
tra
din
g e
nti
ty, C
entr
al g
over
nm
ent,
Loca
l au
thori
ty t
radin
g e
nte
rpri
se (
LA
TE
), I
nco
rpora
ted a
nd u
nin
corp
ora
ted
soci
etie
s an
d a
ssoci
atio
ns,
Char
itab
le t
rust
s, T
rust
s/es
tate
s, C
onsu
late
s an
d f
ore
ign e
mbas
sies
, O
ther
(ple
ase
spec
ify)
Loca
tions
Open
Form
at:
How
man
y l
oca
tions
or
site
s does
your
org
anis
atio
n h
ave?
Num
ber
of
Sta
ff
Tic
k L
ist
Form
at:
How
man
y f
ull
tim
e peo
ple
work
for
your
org
anis
atio
n?
(ple
ase
tick
one)
– 1
-5, 6-1
0, 11
-50, 51-2
50, 251-5
00, 501
-2000, 2001+
Cri
sis
Exper
ience
T
ick L
ist
Form
at:
Has
your
org
anis
atio
n e
xper
ience
d a
cri
sis
or
emer
gen
cy i
n t
he
last
5 y
ears
? (p
leas
e ti
ck o
ne)
– Y
es, N
o, D
on’t
know
Cri
sis
Mem
ory
O
pen
Form
at:
In w
hat
yea
r did
the
cris
is o
ccur?
On t
he
scal
e sh
ow
n p
leas
e ra
te, how
sev
ere
your
org
anis
atio
n's
most
rec
ent
cris
is w
as f
or
your
org
anis
atio
n -
We
dea
lt w
ith i
t as
par
t of
busi
nes
s-as
-usu
al, It
chal
lenged
us
but
was
not
over
ly d
isru
pti
ve,
It
def
init
ely c
hal
lenged
us
and w
as m
oder
atel
y d
isru
pti
ve,
It
def
init
ely c
hal
lenged
us
and w
as v
ery d
isru
pti
ve,
It
could
hav
e sh
ut
us
dow
n p
erm
anen
tly, D
on’t
know
Open
Form
at:
Ple
ase
bri
efly
des
crib
e w
hat
the
cris
is w
as, how
long i
t la
sted
for
and w
hat
the
impac
t w
as o
n y
our
org
anis
atio
n
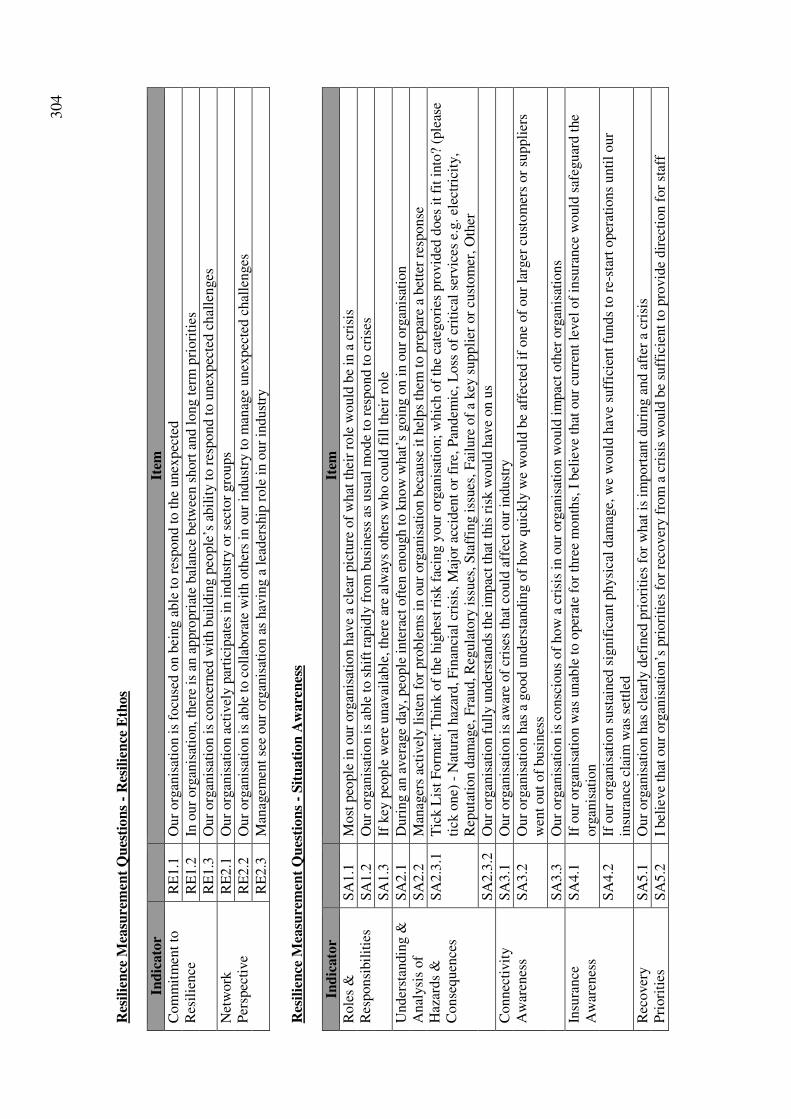
304
Res
ilie
nce
Mea
sure
men
t Q
ues
tion
s -
Res
ilie
nce
Eth
os
Ind
icato
r
Item
Com
mit
men
t to
R
esil
ience
R
E1.1
O
ur
org
anis
atio
n i
s fo
cuse
d o
n b
eing a
ble
to r
espond t
o t
he
unex
pec
ted
RE
1.2
In
our
org
anis
atio
n, th
ere
is a
n a
ppro
pri
ate
bal
ance
bet
wee
n s
hort
and l
ong t
erm
pri
ori
ties
RE
1.3
O
ur
org
anis
atio
n i
s co
nce
rned
wit
h b
uil
din
g p
eople
’s a
bil
ity t
o r
espond t
o u
nex
pec
ted c
hal
lenges
Net
work
P
ersp
ecti
ve
RE
2.1
O
ur
org
anis
atio
n a
ctiv
ely p
arti
cipat
es i
n i
ndust
ry o
r se
ctor
gro
ups
RE
2.2
O
ur
org
anis
atio
n i
s ab
le t
o c
oll
abora
te w
ith o
ther
s in
our
indust
ry t
o m
anag
e unex
pec
ted c
hal
lenges
RE
2.3
M
anag
emen
t se
e our
org
anis
atio
n a
s hav
ing a
lea
der
ship
role
in o
ur
indust
ry
Res
ilie
nce
Mea
sure
men
t Q
ues
tion
s -
Sit
uati
on
Aw
are
nes
s
Ind
icato
r
Item
Role
s &
R
esponsi
bil
itie
s S
A1.1
M
ost
peo
ple
in o
ur
org
anis
atio
n h
ave
a cl
ear
pic
ture
of
what
thei
r ro
le w
ould
be
in a
cri
sis
SA
1.2
O
ur
org
anis
atio
n i
s ab
le t
o s
hif
t ra
pid
ly f
rom
busi
nes
s as
usu
al m
ode
to r
espond t
o c
rise
s
SA
1.3
If
key
peo
ple
wer
e unav
aila
ble
, th
ere
are
alw
ays
oth
ers
who c
ould
fil
l th
eir
role
Under
stan
din
g &
A
nal
ysi
s of
Haz
ards
&
Conse
quen
ces
SA
2.1
D
uri
ng a
n a
ver
age
day
, peo
ple
inte
ract
oft
en e
nough t
o k
now
what
’s g
oin
g o
n i
n o
ur
org
anis
atio
n
SA
2.2
M
anag
ers
acti
vel
y l
iste
n f
or
pro
ble
ms
in o
ur
org
anis
atio
n b
ecau
se i
t hel
ps
them
to p
repar
e a
bet
ter
resp
onse
SA
2.3
.1
Tic
k L
ist
Form
at:
Thin
k o
f th
e hig
hes
t ri
sk f
acin
g y
our
org
anis
atio
n;
whic
h o
f th
e ca
tegori
es p
rovid
ed d
oes
it
fit
into
? (p
leas
e ti
ck o
ne)
- N
atura
l haz
ard, F
inan
cial
cri
sis,
Maj
or
acci
den
t or
fire
, P
andem
ic, L
oss
of
crit
ical
ser
vic
es e
.g. el
ectr
icit
y,
Rep
uta
tion d
amag
e, F
raud, R
egula
tory
iss
ues
, S
taff
ing i
ssues
, F
ailu
re o
f a
key
suppli
er o
r cu
stom
er, O
ther
SA
2.3
.2
Our
org
anis
atio
n f
ull
y u
nder
stan
ds
the
impac
t th
at t
his
ris
k w
ould
hav
e on u
s
Connec
tivit
y
Aw
aren
ess
SA
3.1
O
ur
org
anis
atio
n i
s aw
are
of
cris
es t
hat
could
aff
ect
our
indust
ry
SA
3.2
O
ur
org
anis
atio
n h
as a
good u
nder
stan
din
g o
f how
quic
kly
we
would
be
affe
cted
if
one
of
our
larg
er c
ust
om
ers
or
suppli
ers
wen
t out
of
busi
nes
s
SA
3.3
O
ur
org
anis
atio
n i
s co
nsc
ious
of
how
a c
risi
s in
our
org
anis
atio
n w
ould
im
pac
t oth
er o
rgan
isat
ions
Insu
rance
A
war
enes
s S
A4.1
If
our
org
anis
atio
n w
as u
nab
le t
o o
per
ate
for
thre
e m
onth
s, I
bel
ieve
that
our
curr
ent
level
of
insu
rance
would
saf
eguar
d t
he
org
anis
atio
n
SA
4.2
If
our
org
anis
atio
n s
ust
ained
sig
nif
ican
t physi
cal
dam
age,
we
would
hav
e su
ffic
ient
funds
to r
e-st
art
oper
atio
ns
unti
l our
insu
rance
cla
im w
as s
ettl
ed
Rec
over
y
Pri
ori
ties
S
A5.1
O
ur
org
anis
atio
n h
as c
lear
ly d
efin
ed p
riori
ties
for
what
is
import
ant
duri
ng a
nd a
fter
a c
risi
s
SA
5.2
I
bel
ieve
that
our
org
anis
atio
n’s
pri
ori
ties
for
reco
ver
y f
rom
a c
risi
s w
ould
be
suff
icie
nt
to p
rovid
e dir
ecti
on f
or
staf
f
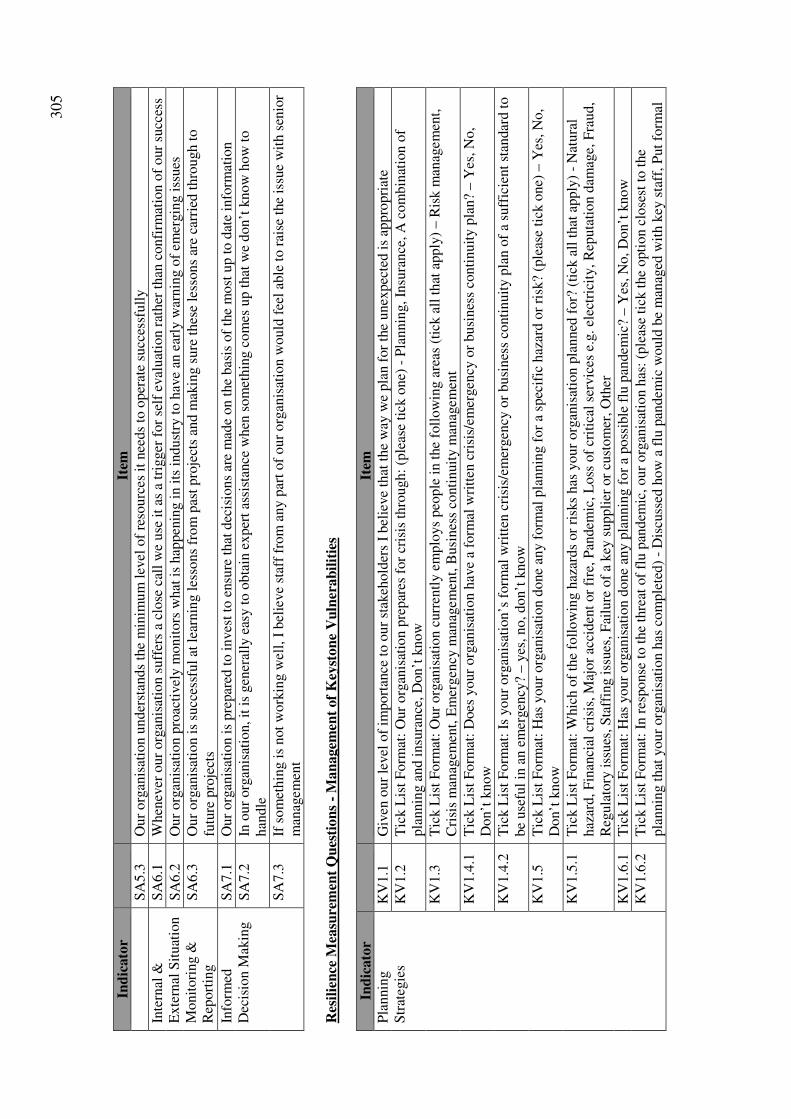
305
Ind
icato
r
Item
SA
5.3
O
ur
org
anis
atio
n u
nder
stan
ds
the
min
imu
m l
evel
of
reso
urc
es i
t nee
ds
to o
per
ate
succ
essf
ull
y
Inte
rnal
&
Exte
rnal
Sit
uat
ion
Monit
ori
ng &
R
eport
ing
SA
6.1
W
hen
ever
our
org
anis
atio
n s
uff
ers
a cl
ose
cal
l w
e use
it
as a
tri
gger
for
self
eval
uat
ion r
ather
than
confi
rmat
ion o
f our
succ
ess
SA
6.2
O
ur
org
anis
atio
n p
roac
tivel
y m
onit
ors
what
is
hap
pen
ing i
n i
ts i
ndust
ry t
o h
ave
an e
arly
war
nin
g o
f em
ergin
g i
ssues
SA
6.3
O
ur
org
anis
atio
n i
s su
cces
sful
at l
earn
ing l
esso
ns
from
pas
t pro
ject
s an
d m
akin
g s
ure
thes
e le
ssons
are
carr
ied t
hro
ugh t
o
futu
re p
roje
cts
Info
rmed
D
ecis
ion M
akin
g
SA
7.1
O
ur
org
anis
atio
n i
s pre
par
ed t
o i
nves
t to
ensu
re t
hat
dec
isio
ns
are
mad
e on t
he
bas
is o
f th
e m
ost
up t
o d
ate
info
rmat
ion
SA
7.2
In
our
org
anis
atio
n, it
is
gen
eral
ly e
asy t
o o
bta
in e
xper
t as
sist
ance
when
som
ethin
g c
om
es u
p t
hat
we
don’t
know
how
to
han
dle
SA
7.3
If
so
met
hin
g i
s not
work
ing w
ell,
I b
elie
ve
staf
f fr
om
any p
art
of
our
org
anis
atio
n w
ould
fee
l ab
le t
o r
aise
the
issu
e w
ith s
enio
r m
anag
emen
t
Res
ilie
nce
Mea
sure
men
t Q
ues
tion
s -
Man
agem
ent
of
Key
ston
e V
uln
erab
ilit
ies
Ind
icato
r
Item
Pla
nnin
g
Str
ateg
ies
KV
1.1
G
iven
our
level
of
import
ance
to o
ur
stak
ehold
ers
I bel
ieve
that
the
way
we
pla
n f
or
the
unex
pec
ted i
s ap
pro
pri
ate
KV
1.2
T
ick L
ist
Form
at:
Our
org
anis
atio
n p
repar
es f
or
cris
is t
hro
ugh:
(ple
ase
tick
one)
- P
lannin
g, In
sura
nce
, A
com
bin
atio
n o
f pla
nnin
g a
nd i
nsu
rance
, D
on’t
know
KV
1.3
T
ick L
ist
Form
at:
Our
org
anis
atio
n c
urr
entl
y e
mplo
ys
peo
ple
in t
he
foll
ow
ing a
reas
(ti
ck a
ll t
hat
apply
) – R
isk m
anag
emen
t,
Cri
sis
man
agem
ent,
Em
ergen
cy m
anag
emen
t, B
usi
nes
s co
nti
nuit
y m
anag
emen
t
KV
1.4
.1
Tic
k L
ist
Form
at:
Does
your
org
anis
atio
n h
ave
a fo
rmal
wri
tten
cri
sis/
emer
gen
cy o
r busi
nes
s co
nti
nuit
y p
lan?
– Y
es, N
o,
Don’t
know
KV
1.4
.2
Tic
k L
ist
Form
at:
Is y
our
org
anis
atio
n’s
form
al w
ritt
en c
risi
s/em
ergen
cy o
r busi
nes
s co
nti
nuit
y p
lan o
f a
suff
icie
nt
stan
dar
d t
o
be
use
ful
in a
n e
mer
gen
cy?
– y
es, no, don’t
know
KV
1.5
T
ick L
ist
Form
at:
Has
your
org
anis
atio
n d
one
any f
orm
al p
lannin
g f
or
a sp
ecif
ic h
azar
d o
r ri
sk?
(ple
ase
tick
one)
– Y
es, N
o,
Don’t
know
KV
1.5
.1
Tic
k L
ist
Form
at:
Whic
h o
f th
e fo
llow
ing h
azar
ds
or
risk
s has
your
org
anis
atio
n p
lanned
for?
(ti
ck a
ll t
hat
apply
) -
Nat
ura
l haz
ard, F
inan
cial
cri
sis,
Maj
or
acci
den
t or
fire
, P
andem
ic, L
oss
of
crit
ical
ser
vic
es e
.g. el
ectr
icit
y, R
eputa
tion d
amag
e, F
raud,
Reg
ula
tory
iss
ues
, S
taff
ing i
ssues
, F
ailu
re o
f a
key
suppli
er o
r cu
stom
er, O
ther
KV
1.6
.1
Tic
k L
ist
Form
at:
Has
your
org
anis
atio
n d
one
any p
lannin
g f
or
a poss
ible
flu
pan
dem
ic?
– Y
es, N
o, D
on’t
know
KV
1.6
.2
Tic
k L
ist
Form
at:
In r
esponse
to t
he
thre
at o
f fl
u p
andem
ic, our
org
anis
atio
n h
as:
(ple
ase
tick
the
opti
on c
lose
st t
o t
he
pla
nnin
g t
hat
your
org
anis
atio
n h
as c
om
ple
ted)
- D
iscu
ssed
how
a f
lu p
andem
ic w
ould
be
man
aged
wit
h k
ey s
taff
, P
ut
form
al
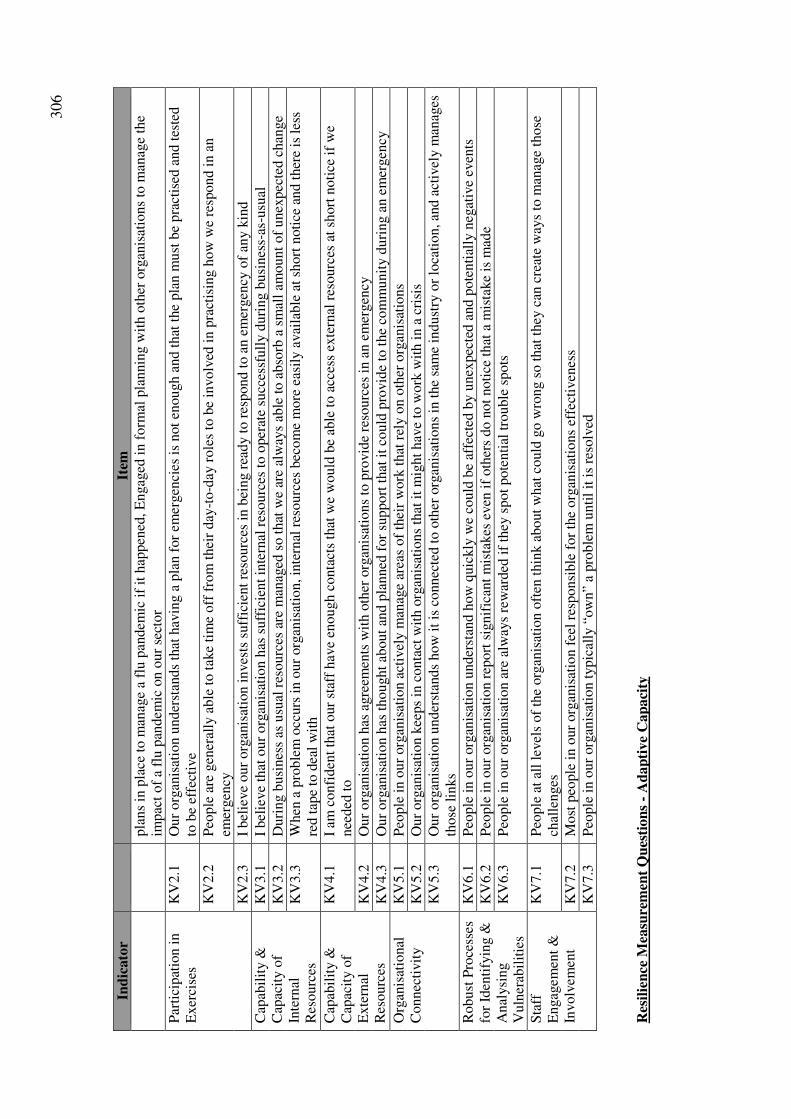
306
Ind
icato
r
Item
pla
ns
in p
lace
to m
anag
e a
flu p
andem
ic i
f it
hap
pen
ed, E
ngag
ed i
n f
orm
al p
lannin
g w
ith o
ther
org
anis
atio
ns
to m
anag
e th
e im
pac
t of
a fl
u p
andem
ic o
n o
ur
sect
or
Par
tici
pat
ion i
n
Exer
cise
s K
V2.1
O
ur
org
anis
atio
n u
nder
stan
ds
that
hav
ing a
pla
n f
or
emer
gen
cies
is
not
enough a
nd t
hat
the
pla
n m
ust
be
pra
ctis
ed a
nd t
este
d
to b
e ef
fect
ive
KV
2.2
P
eople
are
gen
eral
ly a
ble
to t
ake
tim
e off
fro
m t
hei
r day
-to
-day
role
s to
be
involv
ed i
n p
ract
isin
g h
ow
we
resp
ond i
n a
n
emer
gen
cy
KV
2.3
I
bel
ieve
our
org
anis
atio
n i
nves
ts s
uff
icie
nt
reso
urc
es i
n b
eing r
eady t
o r
espond t
o a
n e
mer
gen
cy o
f an
y k
ind
Cap
abil
ity &
C
apac
ity o
f In
tern
al
Res
ourc
es
KV
3.1
I
bel
ieve
that
our
org
anis
atio
n h
as s
uff
icie
nt
inte
rnal
res
ourc
es t
o o
per
ate
succ
essf
ull
y d
uri
ng b
usi
nes
s-as
-usu
al
KV
3.2
D
uri
ng b
usi
nes
s as
usu
al r
esourc
es a
re m
anag
ed s
o t
hat
we
are
alw
ays
able
to a
bso
rb a
sm
all
amount
of
unex
pec
ted c
han
ge
KV
3.3
W
hen
a p
roble
m o
ccurs
in o
ur
org
anis
atio
n, in
tern
al r
esourc
es b
ecom
e m
ore
eas
ily a
vai
lable
at
short
noti
ce a
nd t
her
e is
les
s re
d t
ape
to d
eal
wit
h
Cap
abil
ity &
C
apac
ity o
f E
xte
rnal
R
esourc
es
KV
4.1
I
am c
onfi
den
t th
at o
ur
staf
f hav
e en
ough c
onta
cts
that
we
would
be
able
to a
cces
s ex
tern
al r
esourc
es a
t sh
ort
noti
ce i
f w
e nee
ded
to
KV
4.2
O
ur
org
anis
atio
n h
as a
gre
emen
ts w
ith o
ther
org
anis
atio
ns
to p
rovid
e re
sourc
es i
n a
n e
mer
gen
cy
KV
4.3
O
ur
org
anis
atio
n h
as t
hought
about
and p
lanned
for
support
that
it
could
pro
vid
e to
the
com
munit
y d
uri
ng a
n e
mer
gen
cy
Org
anis
atio
nal
C
onnec
tivit
y
KV
5.1
P
eople
in o
ur
org
anis
atio
n a
ctiv
ely m
anag
e ar
eas
of
thei
r w
ork
that
rel
y o
n o
ther
org
anis
atio
ns
KV
5.2
O
ur
org
anis
atio
n k
eeps
in c
onta
ct w
ith o
rgan
isat
ions
that
it
mig
ht
hav
e to
work
wit
h i
n a
cri
sis
KV
5.3
O
ur
org
anis
atio
n u
nder
stan
ds
how
it
is c
onnec
ted t
o o
ther
org
anis
atio
ns
in t
he
sam
e in
dust
ry o
r lo
cati
on, an
d a
ctiv
ely m
anag
es
those
lin
ks
Robust
Pro
cess
es
for
Iden
tify
ing &
A
nal
ysi
ng
Vuln
erab
ilit
ies
KV
6.1
P
eople
in o
ur
org
anis
atio
n u
nder
stan
d h
ow
quic
kly
we
could
be
affe
cted
by u
nex
pec
ted a
nd p
ote
nti
ally
neg
ativ
e ev
ents
KV
6.2
P
eople
in o
ur
org
anis
atio
n r
eport
sig
nif
ican
t m
ista
kes
even
if
oth
ers
do n
ot
noti
ce t
hat
a m
ista
ke
is m
ade
KV
6.3
P
eople
in o
ur
org
anis
atio
n a
re a
lway
s re
war
ded
if
they
spot
pote
nti
al t
rouble
spots
Sta
ff
Engag
emen
t &
In
volv
emen
t
KV
7.1
P
eople
at
all
level
s of
the
org
anis
atio
n o
ften
thin
k a
bout
what
could
go w
rong s
o t
hat
they
can
cre
ate
way
s to
man
age
those
ch
alle
nges
KV
7.2
M
ost
peo
ple
in o
ur
org
anis
atio
n f
eel
resp
onsi
ble
for
the
org
anis
atio
ns
effe
ctiv
enes
s
KV
7.3
P
eople
in o
ur
org
anis
atio
n t
ypic
ally
“ow
n”
a pro
ble
m u
nti
l it
is
reso
lved
Res
ilie
nce
Mea
sure
men
t Q
ues
tion
s -
Ad
ap
tive
Cap
aci
ty
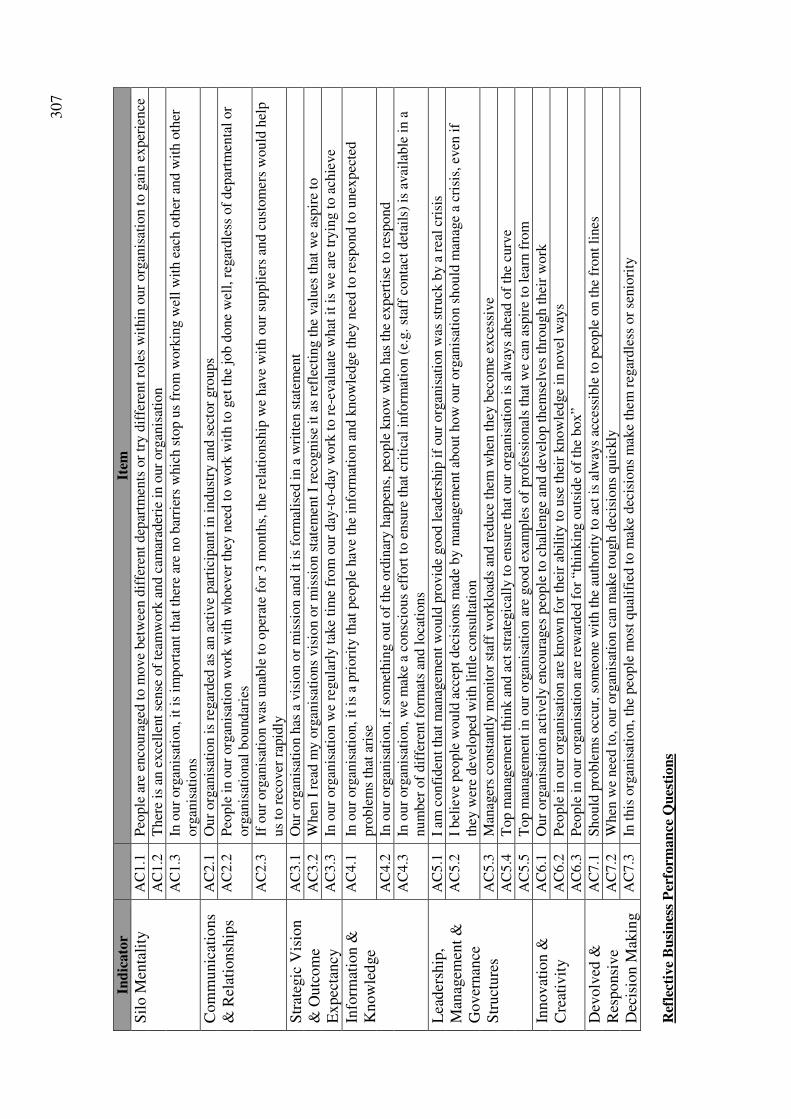
307
Ind
icato
r
Item
Sil
o M
enta
lity
A
C1.1
P
eople
are
enco
ura
ged
to m
ove
bet
wee
n d
iffe
rent
dep
artm
ents
or
try d
iffe
rent
role
s w
ithin
our
org
anis
atio
n t
o g
ain e
xper
ience
AC
1.2
T
her
e is
an e
xce
llen
t se
nse
of
team
work
and c
amar
ader
ie i
n o
ur
org
anis
atio
n
AC
1.3
In
our
org
anis
atio
n, it
is
import
ant
that
ther
e ar
e no b
arri
ers
whic
h s
top u
s fr
om
work
ing w
ell
wit
h e
ach o
ther
and w
ith o
ther
org
anis
atio
ns
Com
munic
atio
ns
& R
elat
ionsh
ips
AC
2.1
O
ur
org
anis
atio
n i
s re
gar
ded
as
an a
ctiv
e par
tici
pan
t in
indust
ry a
nd s
ecto
r gro
ups
AC
2.2
P
eople
in o
ur
org
anis
atio
n w
ork
wit
h w
hoev
er t
hey
nee
d t
o w
ork
wit
h t
o g
et t
he
job d
one
wel
l, r
egar
dle
ss o
f dep
artm
enta
l or
org
anis
atio
nal
boundar
ies
AC
2.3
If
our
org
anis
atio
n w
as u
nab
le t
o o
per
ate
for
3 m
onth
s, t
he
rela
tionsh
ip w
e hav
e w
ith o
ur
suppli
ers
and c
ust
om
ers
would
hel
p
us
to r
ecover
rap
idly
Str
ateg
ic V
isio
n
& O
utc
om
e E
xpec
tancy
AC
3.1
O
ur
org
anis
atio
n h
as a
vis
ion o
r m
issi
on a
nd i
t is
form
alis
ed i
n a
wri
tten
sta
tem
ent
AC
3.2
W
hen
I r
ead m
y o
rgan
isat
ions
vis
ion o
r m
issi
on s
tate
men
t I
reco
gnis
e it
as
refl
ecti
ng t
he
val
ues
that
we
aspir
e to
AC
3.3
In
our
org
anis
atio
n w
e re
gula
rly t
ake
tim
e fr
om
our
day
-to
-day
work
to r
e-ev
aluat
e w
hat
it
is w
e ar
e tr
yin
g t
o a
chie
ve
Info
rmat
ion &
K
now
led
ge
AC
4.1
In
our
org
anis
atio
n, it
is
a pri
ori
ty t
hat
peo
ple
hav
e th
e in
form
atio
n a
nd k
now
ledge
they
nee
d t
o r
espond t
o u
nex
pec
ted
pro
ble
ms
that
ari
se
AC
4.2
In
our
org
anis
atio
n, if
som
ethin
g o
ut
of
the
ord
inar
y h
appen
s, p
eople
know
who h
as t
he
exper
tise
to r
espond
AC
4.3
In
our
org
anis
atio
n, w
e m
ake
a co
nsc
ious
effo
rt t
o e
nsu
re t
hat
cri
tica
l in
form
atio
n (
e.g. st
aff
conta
ct d
etai
ls)
is a
vai
lable
in a
num
ber
of
dif
fere
nt
form
ats
and l
oca
tions
Lea
der
ship
, M
anag
emen
t &
G
over
nan
ce
Str
uct
ure
s
AC
5.1
I
am c
onfi
den
t th
at m
anag
emen
t w
ould
pro
vid
e good l
eader
ship
if
our
org
anis
atio
n w
as s
truck
by a
rea
l cr
isis
AC
5.2
I
bel
ieve
peo
ple
would
acc
ept
dec
isio
ns
mad
e by m
anag
emen
t ab
out
how
our
org
anis
atio
n s
hould
man
age
a cr
isis
, ev
en i
f th
ey w
ere
dev
eloped
wit
h l
ittl
e co
nsu
ltat
ion
AC
5.3
M
anag
ers
const
antl
y m
onit
or
staf
f w
ork
load
s an
d r
educe
them
when
they
bec
om
e ex
cess
ive
AC
5.4
T
op m
anag
emen
t th
ink a
nd a
ct s
trat
egic
ally
to e
nsu
re t
hat
our
org
anis
atio
n i
s al
way
s ah
ead o
f th
e cu
rve
AC
5.5
T
op m
anag
emen
t in
our
org
anis
atio
n a
re g
ood e
xam
ple
s of
pro
fess
ional
s th
at w
e ca
n a
spir
e to
lea
rn f
rom
Innov
atio
n &
C
reat
ivit
y
AC
6.1
O
ur
org
anis
atio
n a
ctiv
ely e
nco
ura
ges
peo
ple
to c
hal
lenge
and d
evel
op t
hem
selv
es t
hro
ugh t
hei
r w
ork
AC
6.2
P
eople
in o
ur
org
anis
atio
n a
re k
now
n f
or
thei
r ab
ilit
y t
o u
se t
hei
r know
ledge
in n
ovel
way
s
AC
6.3
P
eople
in o
ur
org
anis
atio
n a
re r
ewar
ded
for
“thin
kin
g o
uts
ide
of
the
box”
Dev
olv
ed &
R
esponsi
ve
Dec
isio
n M
akin
g
AC
7.1
S
hould
pro
ble
ms
occ
ur,
som
eone
wit
h t
he
auth
ori
ty t
o a
ct i
s al
way
s ac
cess
ible
to p
eople
on t
he
front
lines
AC
7.2
W
hen
we
nee
d t
o, our
org
anis
atio
n c
an m
ake
tough d
ecis
ions
quic
kly
AC
7.3
In
this
org
anis
atio
n, th
e peo
ple
most
qual
ifie
d t
o m
ake
dec
isio
ns
mak
e th
em r
egar
dle
ss o
r se
nio
rity
Ref
lect
ive
Bu
sin
ess
Per
form
an
ce Q
ues
tion
s
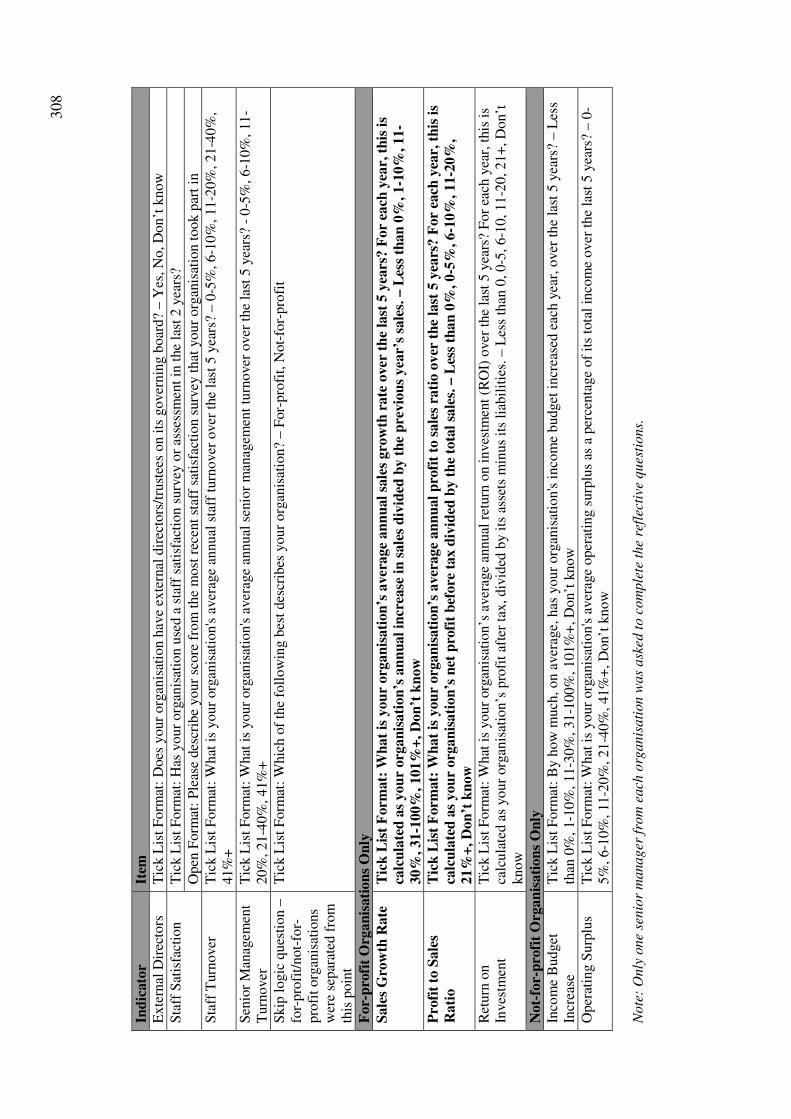
308
Ind
icato
r It
em
Exte
rnal
Dir
ecto
rs
Tic
k L
ist
Form
at:
Does
your
org
anis
atio
n h
ave
exte
rnal
dir
ecto
rs/t
rust
ees
on i
ts g
over
nin
g b
oar
d?
– Y
es, N
o, D
on’t
know
Sta
ff S
atis
fact
ion
Tic
k L
ist
Form
at:
Has
your
org
anis
atio
n u
sed a
sta
ff s
atis
fact
ion s
urv
ey o
r as
sess
men
t in
the
last
2 y
ears
?
Open
Form
at:
Ple
ase
des
crib
e your
score
fro
m t
he
most
rec
ent
staf
f sa
tisf
acti
on s
urv
ey t
hat
your
org
anis
atio
n t
ook p
art
in
Sta
ff T
urn
over
T
ick L
ist
Form
at:
What
is
your
org
anis
atio
n's
aver
age
annual
sta
ff t
urn
over
over
the
last
5 y
ears
? – 0
-5%
, 6-1
0%
, 11-2
0%
, 21-4
0%
, 41%
+
Sen
ior
Man
agem
ent
Turn
over
T
ick L
ist
Form
at:
What
is
your
org
anis
atio
n's
aver
age
annual
sen
ior
man
agem
ent
turn
over
over
the
last
5 y
ears
? -
0-5
%, 6-1
0%
, 11
-20%
, 21-4
0%
, 41%
+
Skip
logic
ques
tion –
fo
r-pro
fit/
not-
for-
pro
fit
org
anis
atio
ns
wer
e se
par
ated
fro
m
this
poin
t
Tic
k L
ist
Form
at:
Whic
h o
f th
e fo
llow
ing b
est
des
crib
es y
our
org
anis
atio
n?
– F
or-
pro
fit,
Not-
for-
pro
fit
For-
pro
fit
Org
an
isati
on
s O
nly
Sale
s G
row
th R
ate
T
ick
Lis
t F
orm
at:
Wh
at
is y
ou
r org
an
isati
on
’s a
ver
age
an
nu
al
sale
s gro
wth
rate
over
th
e la
st 5
yea
rs? F
or
each
yea
r, t
his
is
calc
ula
ted
as
you
r org
an
isati
on
’s a
nn
ual
incr
ease
in
sale
s d
ivid
ed b
y t
he
pre
vio
us
yea
r’s
sale
s. –
Les
s th
an
0%
, 1-1
0%
, 11-
30%
, 31-1
00%
, 101%
+, D
on
’t k
now
Pro
fit
to S
ale
s
Rati
o
Tic
k L
ist
Form
at:
Wh
at
is y
ou
r org
an
isati
on
’s a
ver
age
an
nu
al
pro
fit
to s
ale
s ra
tio o
ver
th
e la
st 5
yea
rs? F
or
each
yea
r, t
his
is
calc
ula
ted
as
you
r org
an
isati
on
’s n
et p
rofi
t b
efore
tax d
ivid
ed b
y t
he
tota
l sa
les.
– L
ess
than
0%
, 0-5
%, 6-1
0%
, 11-2
0%
,
21%
+, D
on
’t k
now
Ret
urn
on
Inves
tmen
t T
ick L
ist
Form
at:
What
is
your
org
anis
atio
n’s
aver
age
annual
ret
urn
on i
nves
tmen
t (R
OI)
over
the
last
5 y
ears
? F
or
each
yea
r, t
his
is
calc
ula
ted a
s your
org
anis
atio
n’s
pro
fit
afte
r ta
x, div
ided
by i
ts a
sset
s m
inus
its
liab
ilit
ies.
– L
ess
than
0, 0-5
, 6-1
0, 11
-20, 21+
, D
on’t
know
Not-
for-
pro
fit
Org
an
isati
on
s O
nly
Inco
me
Budget
In
crea
se
Tic
k L
ist
Form
at:
By h
ow
much
, on a
ver
age,
has
your
org
anis
atio
n's
inco
me
budget
incr
ease
d e
ach y
ear,
over
the
last
5 y
ears
? – L
ess
than
0%
, 1-1
0%
, 11-3
0%
, 31-1
00%
, 101%
+, D
on’t
know
Oper
atin
g S
urp
lus
Tic
k L
ist
Form
at: W
hat
is
your
org
anis
atio
n's
aver
age
oper
atin
g s
urp
lus
as a
per
centa
ge
of
its
tota
l in
com
e over
the
last
5 y
ears
? – 0
-5%
, 6-1
0%
, 11-2
0%
, 21-4
0%
, 41%
+, D
on’t
know
Note
: O
nly
one
senio
r m
anager
fro
m e
ach
org
anis
ati
on w
as
ask
ed t
o c
om
ple
te t
he
refl
ecti
ve q
ues
tions.
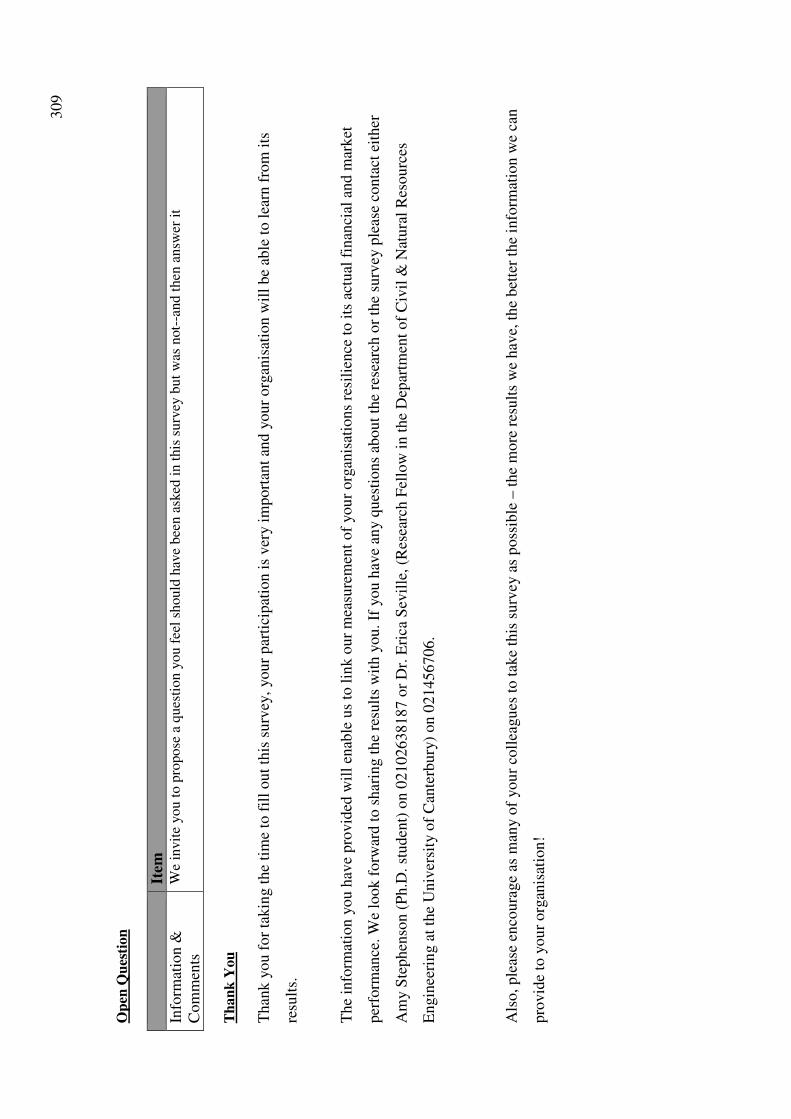
309
Op
en Q
ues
tion
It
em
Info
rmat
ion &
C
om
men
ts
We
invit
e you t
o p
ropose
a q
ues
tion y
ou f
eel
should
hav
e bee
n a
sked
in t
his
surv
ey b
ut
was
not-
-and t
hen
answ
er i
t
Th
an
k Y
ou
Than
k y
ou f
or
takin
g t
he
tim
e to
fil
l out
this
surv
ey,
your
par
tici
pat
ion i
s ver
y i
mport
ant
and y
our
org
anis
atio
n w
ill
be
able
to l
earn
fro
m i
ts
resu
lts.
The
info
rmat
ion y
ou h
ave
pro
vid
ed w
ill
enab
le u
s to
lin
k o
ur
mea
sure
men
t of
you
r org
anis
atio
ns
resi
lien
ce t
o i
ts a
ctual
fin
anci
al a
nd m
ark
et
per
form
ance
. W
e lo
ok f
orw
ard t
o s
har
ing t
he
resu
lts
wit
h y
ou.
If y
ou h
ave
any q
ues
tions
about
the
rese
arch
or
the
surv
ey p
leas
e co
nta
ct e
ither
Am
y S
tephen
son (
Ph.D
. st
uden
t) o
n 0
2102638187 o
r D
r. E
rica
Sev
ille
, (R
esea
rch F
ello
w i
n t
he
Dep
artm
ent
of
Civ
il &
Nat
ura
l R
esourc
es
Engin
eeri
ng a
t th
e U
niv
ersi
ty o
f C
ante
rbury
) on 0
21456706.
Als
o, ple
ase
enco
ura
ge
as m
any o
f you
r co
llea
gu
es t
o t
ake
this
surv
ey a
s p
oss
ible
– t
he
more
res
ult
s w
e hav
e, t
he
bet
ter
the
info
rmat
ion w
e ca
n
pro
vid
e to
you
r org
anis
atio
n!
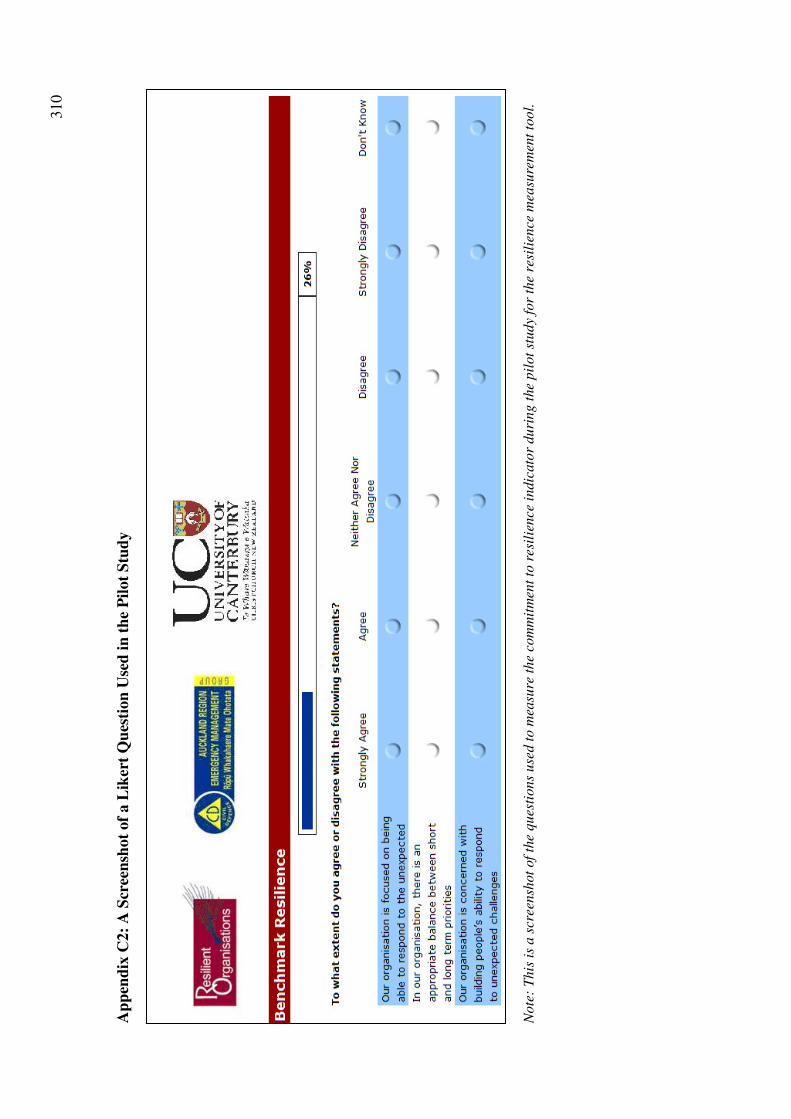
310
Ap
pen
dix
C2:
A S
cree
nsh
ot
of
a L
iker
t Q
ues
tion
Use
d i
n t
he
Pil
ot
Stu
dy
N
ote
: T
his
is
a s
cree
nsh
ot
of
the
ques
tions
use
d t
o m
easu
re t
he
com
mit
men
t to
res
ilie
nce
indic
ato
r duri
ng t
he
pil
ot
study
for
the
resi
lien
ce m
easu
rem
ent
tool.
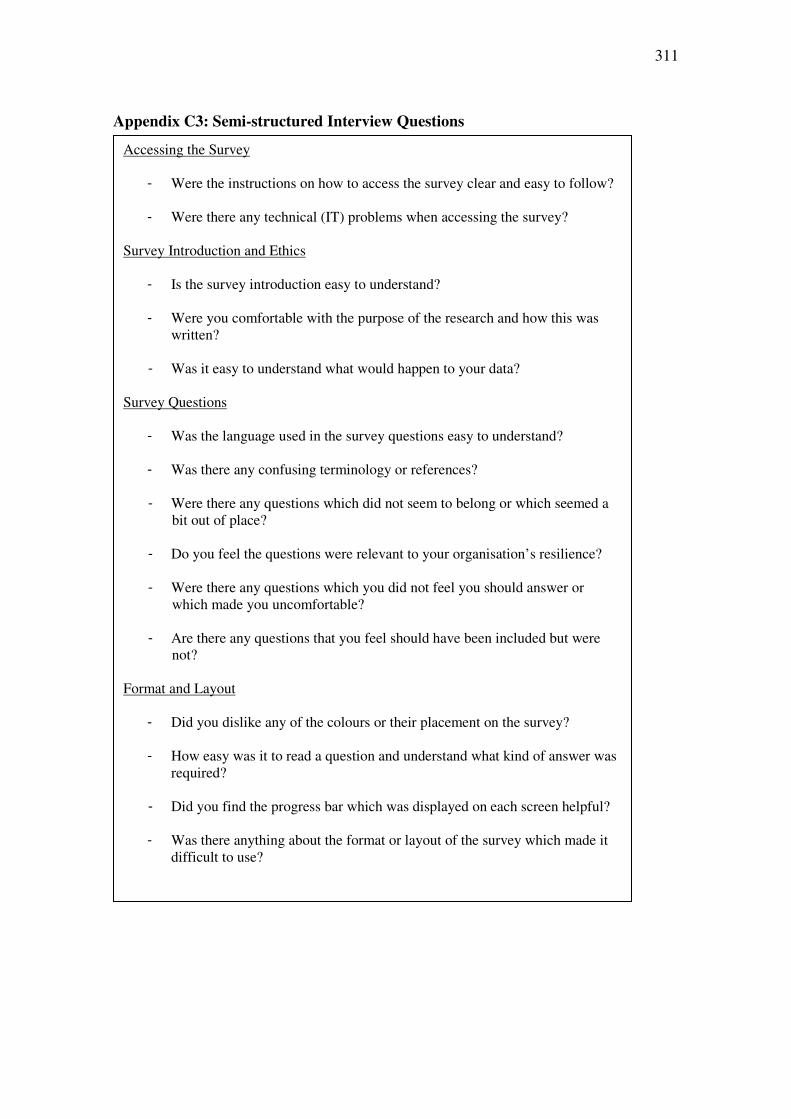
311
Appendix C3: Semi-structured Interview Questions
Accessing the Survey
- Were the instructions on how to access the survey clear and easy to follow?
- Were there any technical (IT) problems when accessing the survey? Survey Introduction and Ethics
- Is the survey introduction easy to understand?
- Were you comfortable with the purpose of the research and how this was written?
- Was it easy to understand what would happen to your data?
Survey Questions
- Was the language used in the survey questions easy to understand?
- Was there any confusing terminology or references?
- Were there any questions which did not seem to belong or which seemed a bit out of place?
- Do you feel the questions were relevant to your organisation’s resilience?
- Were there any questions which you did not feel you should answer or
which made you uncomfortable?
- Are there any questions that you feel should have been included but were not?
Format and Layout
- Did you dislike any of the colours or their placement on the survey?
- How easy was it to read a question and understand what kind of answer was required?
- Did you find the progress bar which was displayed on each screen helpful?
- Was there anything about the format or layout of the survey which made it
difficult to use?
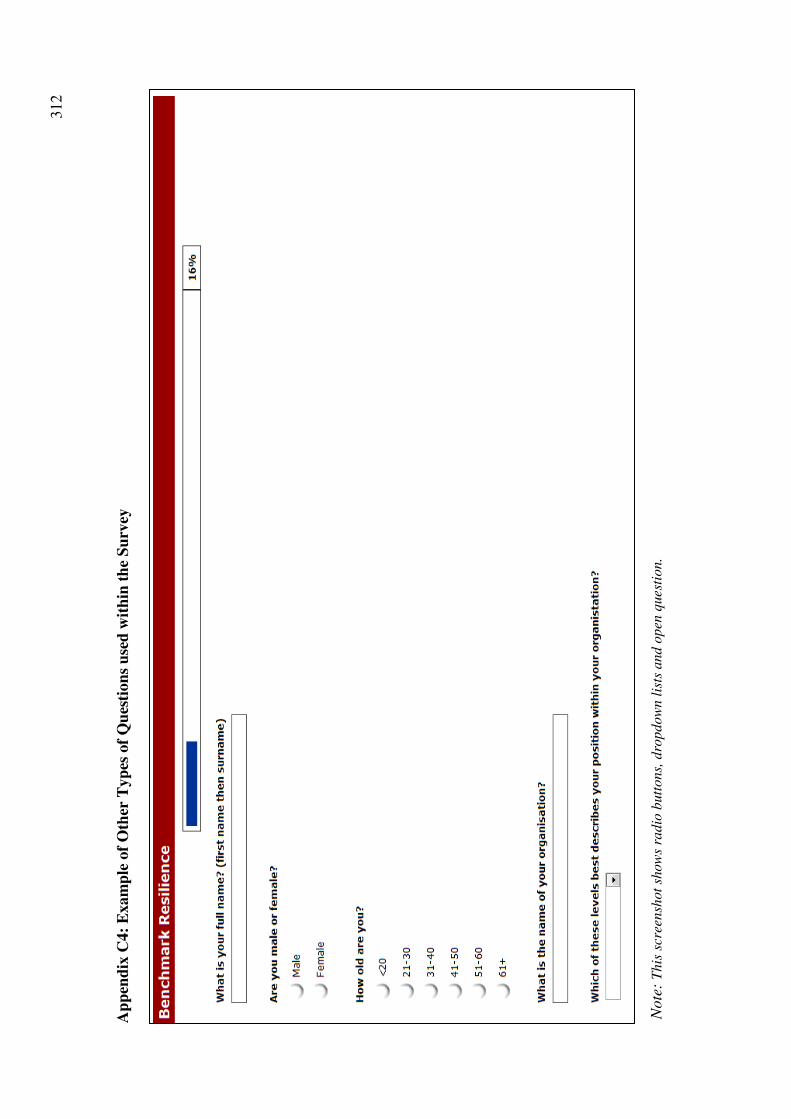
312
Ap
pen
dix
C4:
Exam
ple
of
Oth
er T
yp
es o
f Q
ues
tion
s u
sed
wit
hin
th
e S
urv
ey
N
ote
: T
his
scr
eensh
ot
show
s ra
dio
butt
ons,
dro
pdow
n l
ists
and o
pen
ques
tion.
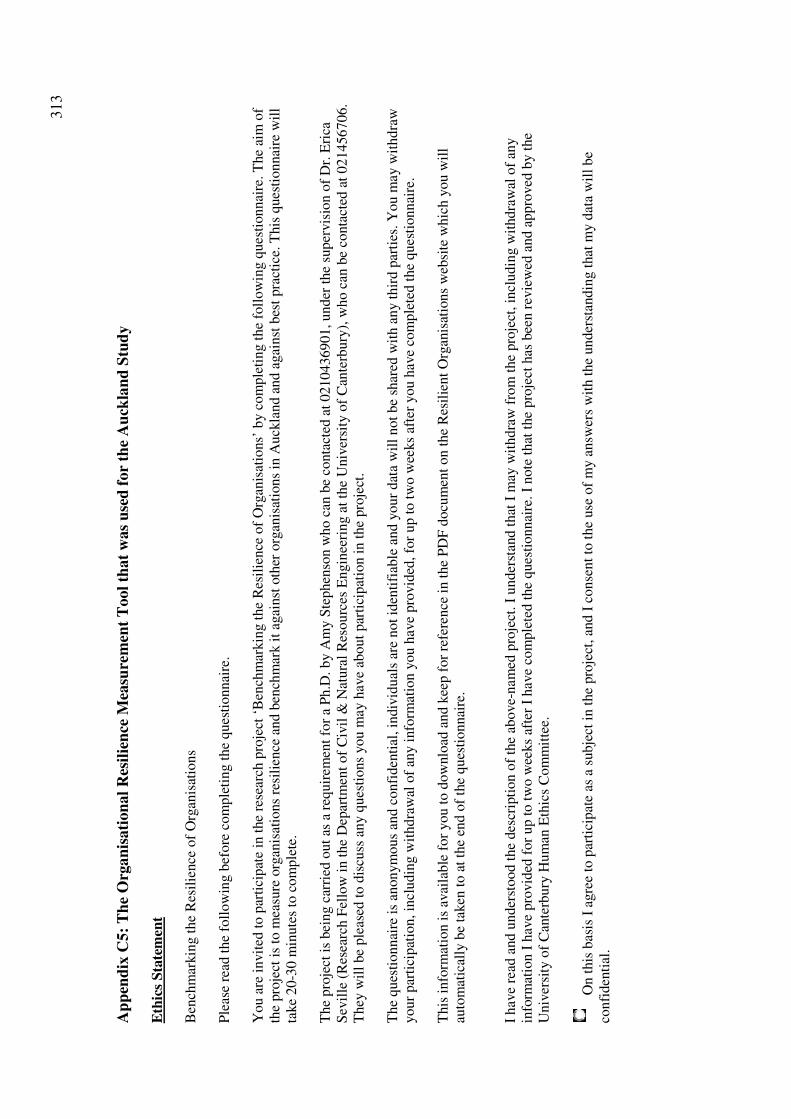
313
Ap
pen
dix
C5:
Th
e O
rgan
isati
on
al
Res
ilie
nce
Mea
sure
men
t T
ool
that
was
use
d f
or
the
Au
ckla
nd
Stu
dy
Eth
ics
Sta
tem
ent
Ben
chm
arkin
g t
he
Res
ilie
nce
of
Org
anis
atio
ns
Ple
ase
read
the
foll
ow
ing b
efore
com
ple
ting t
he
ques
tionnai
re.
You a
re i
nvit
ed t
o p
arti
cipat
e in
the
rese
arch
pro
ject
‘B
ench
mar
kin
g t
he
Res
ilie
nce
of
Org
anis
atio
ns’
by c
om
ple
ting t
he
foll
ow
ing q
ues
tionnai
re. T
he
aim
of
the
pro
ject
is
to m
easu
re o
rgan
isat
ions
resi
lien
ce a
nd b
ench
mar
k i
t ag
ainst
oth
er o
rgan
isat
ions
in A
uck
land a
nd a
gai
nst
bes
t pra
ctic
e. T
his
ques
tionnai
re w
ill
take
20-3
0 m
inute
s to
com
ple
te.
The
pro
ject
is
bei
ng c
arri
ed o
ut
as a
req
uir
emen
t fo
r a
Ph.D
. by A
my S
tephen
son w
ho c
an b
e co
nta
cted
at
0210436901, under
the
super
vis
ion o
f D
r. E
rica
S
evil
le (
Res
earc
h F
ello
w i
n t
he
Dep
artm
ent
of
Civ
il &
Nat
ura
l R
esourc
es E
ngin
eeri
ng a
t th
e U
niv
ersi
ty o
f C
ante
rbury
), w
ho c
an b
e co
nta
cted
at
021456706.
They
wil
l be
ple
ased
to d
iscu
ss a
ny q
ues
tions
you m
ay h
ave
about
par
tici
pat
ion i
n t
he
pro
ject
.
The
ques
tionnai
re i
s an
onym
ous
and c
onfi
den
tial
, in
div
idual
s ar
e not
iden
tifi
able
and y
our
dat
a w
ill
not
be
shar
ed w
ith a
ny t
hir
d p
arti
es. Y
ou m
ay w
ithdra
w
your
par
tici
pat
ion, in
cludin
g w
ithdra
wal
of
any i
nfo
rmat
ion y
ou h
ave
pro
vid
ed, fo
r up t
o t
wo w
eeks
afte
r you h
ave
com
ple
ted t
he
ques
tionnai
re.
This
info
rmat
ion i
s av
aila
ble
for
you t
o d
ow
nlo
ad a
nd k
eep f
or
refe
rence
in t
he
PD
F d
ocu
men
t on t
he
Res
ilie
nt
Org
anis
atio
ns
web
site
whic
h y
ou w
ill
auto
mat
ical
ly b
e ta
ken
to a
t th
e en
d o
f th
e ques
tionnai
re.
I hav
e re
ad a
nd u
nder
stood t
he
des
crip
tion o
f th
e ab
ove-
nam
ed p
roje
ct. I
under
stan
d t
hat
I m
ay w
ithdra
w f
rom
the
pro
ject
, in
cludin
g w
ithdra
wal
of
any
info
rmat
ion I
hav
e pro
vid
ed f
or
up t
o t
wo w
eeks
afte
r I
hav
e co
mple
ted t
he
ques
tionnai
re. I
note
that
the
pro
ject
has
bee
n r
evie
wed
and a
ppro
ved
by t
he
Univ
ersi
ty o
f C
ante
rbury
Hum
an E
thic
s C
om
mit
tee.
On t
his
bas
is I
agre
e to
par
tici
pat
e as
a s
ubje
ct i
n t
he
pro
ject
, an
d I
conse
nt
to t
he
use
of
my a
nsw
ers
wit
h t
he
under
stan
din
g t
hat
my d
ata
wil
l be
confi
den
tial
.
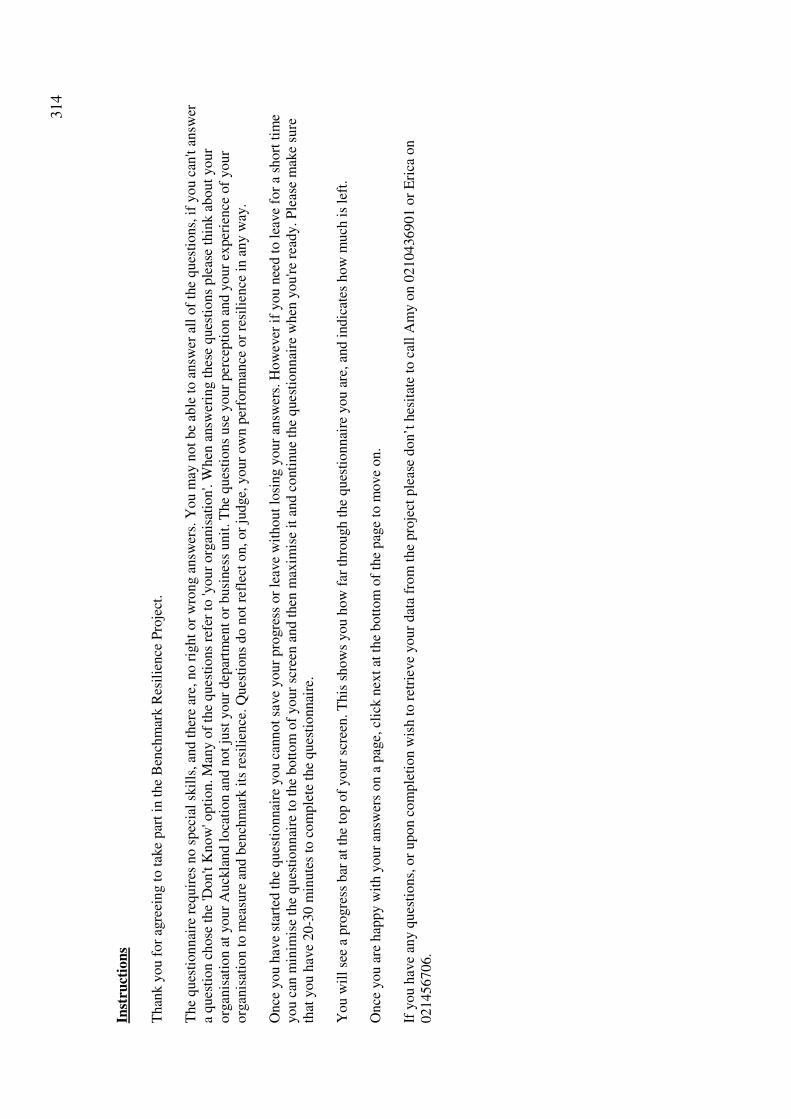
314
Inst
ruct
ion
s T
han
k y
ou f
or
agre
eing t
o t
ake
par
t in
the
Ben
chm
ark R
esil
ience
Pro
ject
. T
he
ques
tionnai
re r
equir
es n
o s
pec
ial
skil
ls, an
d t
her
e ar
e, n
o r
ight
or
wro
ng a
nsw
ers.
You m
ay n
ot
be
able
to a
nsw
er a
ll o
f th
e ques
tions,
if
you c
an't
answ
er
a ques
tion c
hose
the
'Don
't K
now
' opti
on. M
any o
f th
e ques
tions
refe
r to
'your
org
anis
atio
n'.
When
answ
erin
g t
hes
e ques
tions
ple
ase
thin
k a
bout
your
org
anis
atio
n a
t your
Auck
land l
oca
tion a
nd n
ot
just
your
dep
artm
ent
or
busi
nes
s unit
. T
he
ques
tions
use
your
per
cepti
on a
nd y
our
exper
ience
of
your
org
anis
atio
n t
o m
easu
re a
nd b
ench
mar
k i
ts r
esil
ience
. Q
ues
tions
do n
ot
refl
ect
on, or
judge,
your
ow
n p
erfo
rman
ce o
r re
sili
ence
in a
ny w
ay.
Once
you h
ave
star
ted t
he
ques
tionnai
re y
ou c
annot
save
your
pro
gre
ss o
r le
ave
wit
hout
losi
ng y
our
answ
ers.
How
ever
if
you n
eed t
o l
eave
for
a sh
ort
tim
e you c
an m
inim
ise
the
ques
tionnai
re t
o t
he
bott
om
of
your
scre
en a
nd t
hen
max
imis
e it
and c
onti
nue
the
ques
tionnai
re w
hen
you're
read
y. P
leas
e m
ake
sure
th
at y
ou h
ave
20-3
0 m
inute
s to
com
ple
te t
he
ques
tionnai
re.
You w
ill
see
a pro
gre
ss b
ar a
t th
e to
p o
f your
scre
en. T
his
show
s you h
ow
far
thro
ugh t
he
ques
tionnai
re y
ou a
re, an
d i
ndic
ates
how
much
is
left
.
Once
you a
re h
appy w
ith y
our
answ
ers
on a
pag
e, c
lick
nex
t at
the
bott
om
of
the
pag
e to
move
on.
If y
ou h
ave
any q
ues
tions,
or
upon c
om
ple
tion w
ish t
o r
etri
eve
your
dat
a fr
om
the
pro
ject
ple
ase
don’t
hes
itat
e to
cal
l A
my o
n 0
210436901 o
r E
rica
on
021456706.
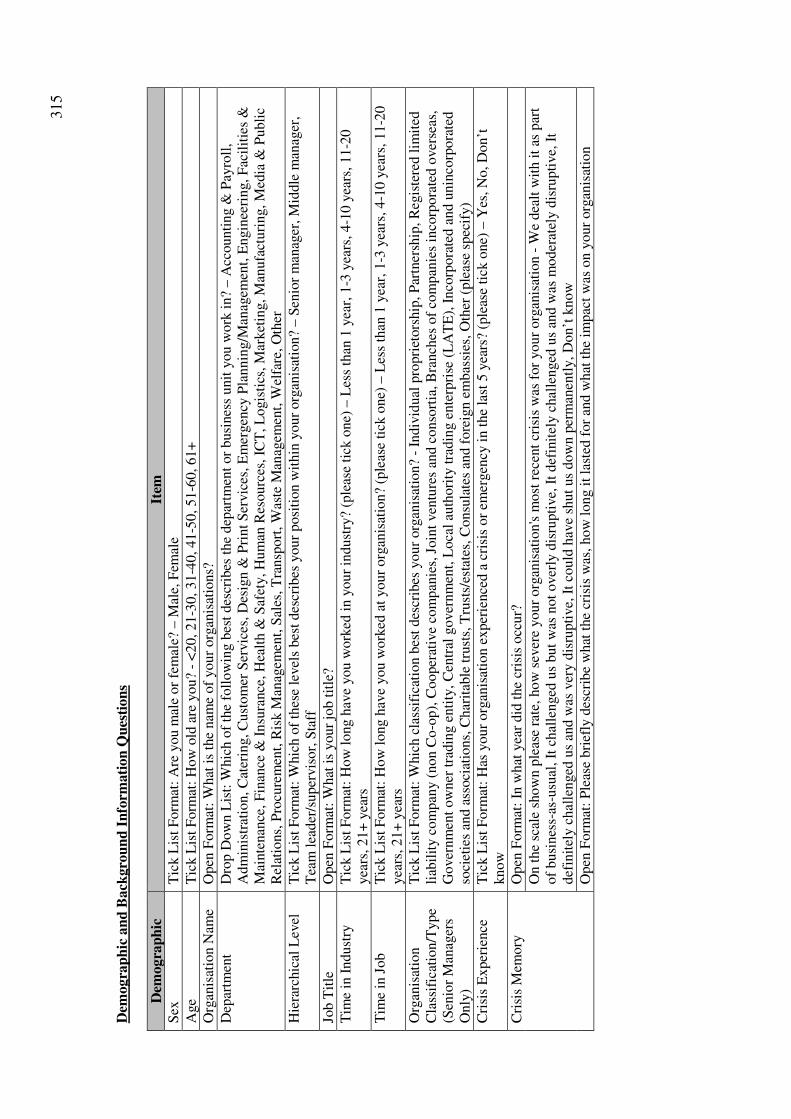
315
Dem
ogra
ph
ic a
nd
Back
gro
un
d I
nfo
rmati
on
Qu
esti
on
s
Dem
ogra
ph
ic
Item
Sex
T
ick L
ist
Form
at:
Are
you m
ale
or
fem
ale?
– M
ale,
Fem
ale
Age
Tic
k L
ist
Form
at:
How
old
are
you?
- <
20, 21-3
0, 31
-40, 41-5
0, 51
-60, 61+
Org
anis
atio
n N
ame
Open
Form
at:
What
is
the
nam
e of
your
org
anis
atio
ns?
Dep
artm
ent
Dro
p D
ow
n L
ist:
Whic
h o
f th
e fo
llow
ing b
est
des
crib
es t
he
dep
artm
ent
or
busi
nes
s unit
you w
ork
in?
– A
ccounti
ng &
Pay
roll
, A
dm
inis
trat
ion, C
ater
ing, C
ust
om
er S
ervic
es, D
esig
n &
Pri
nt
Ser
vic
es, E
mer
gen
cy P
lannin
g/M
anag
emen
t, E
ngin
eeri
ng, F
acil
itie
s &
M
ainte
nan
ce, F
inan
ce &
In
sura
nce
, H
ealt
h &
Saf
ety, H
um
an R
esourc
es, IC
T, L
ogis
tics
, M
arket
ing, M
anufa
cturi
ng, M
edia
& P
ubli
c R
elat
ions,
Pro
cure
men
t, R
isk M
anag
emen
t, S
ales
, T
ransp
ort
, W
aste
Man
agem
ent,
Wel
fare
, O
ther
Hie
rarc
hic
al L
evel
T
ick L
ist
Form
at:
Whic
h o
f th
ese
level
s bes
t des
crib
es y
our
posi
tion w
ithin
your
org
anis
atio
n?
– S
enio
r m
anag
er, M
iddle
man
ager
, T
eam
lea
der
/super
vis
or,
Sta
ff
Job T
itle
O
pen
Form
at:
What
is
your
job t
itle
?
Tim
e in
Indust
ry
Tic
k L
ist
Form
at:
How
long h
ave
you w
ork
ed i
n y
our
indust
ry?
(ple
ase
tick
one)
– L
ess
than
1 y
ear,
1-3
yea
rs, 4-1
0 y
ears
, 11-2
0
yea
rs, 21+
yea
rs
Tim
e in
Job
Tic
k L
ist
Form
at:
How
long h
ave
you w
ork
ed a
t your
org
anis
atio
n?
(ple
ase
tick
one)
– L
ess
than
1 y
ear,
1-3
yea
rs, 4-1
0 y
ears
, 11-2
0
yea
rs, 21+
yea
rs
Org
anis
atio
n
Cla
ssif
icat
ion/T
ype
(Sen
ior
Man
ager
s O
nly
)
Tic
k L
ist
Form
at:
Whic
h c
lass
ific
atio
n b
est
des
crib
es y
our
org
anis
atio
n?
- In
div
idual
pro
pri
etors
hip
, P
artn
ersh
ip, R
egis
tere
d l
imit
ed
liab
ilit
y c
om
pan
y (
non C
o-o
p),
Cooper
ativ
e co
mpan
ies,
Join
t ven
ture
s an
d c
onso
rtia
, B
ranch
es o
f co
mpan
ies
inco
rpora
ted o
ver
seas
, G
over
nm
ent
ow
ner
tra
din
g e
nti
ty, C
entr
al g
over
nm
ent,
Loca
l au
thori
ty t
radin
g e
nte
rpri
se (
LA
TE
), I
nco
rpora
ted a
nd u
nin
corp
ora
ted
soci
etie
s an
d a
ssoci
atio
ns,
Char
itab
le t
rust
s, T
rust
s/es
tate
s, C
onsu
late
s an
d f
ore
ign e
mbas
sies
, O
ther
(ple
ase
spec
ify)
Cri
sis
Exper
ience
T
ick L
ist
Form
at:
Has
your
org
anis
atio
n e
xper
ience
d a
cri
sis
or
emer
gen
cy i
n t
he
last
5 y
ears
? (p
leas
e ti
ck o
ne)
– Y
es, N
o, D
on’t
know
Cri
sis
Mem
ory
O
pen
Form
at:
In w
hat
yea
r did
the
cris
is o
ccur?
On t
he
scal
e sh
ow
n p
leas
e ra
te, how
sev
ere
your
org
anis
atio
n's
most
rec
ent
cris
is w
as f
or
your
org
anis
atio
n -
We
dea
lt w
ith i
t as
par
t of
busi
nes
s-as
-usu
al, It
chal
lenged
us
but
was
not
over
ly d
isru
pti
ve,
It
def
init
ely c
hal
lenged
us
and w
as m
oder
atel
y d
isru
pti
ve,
It
def
init
ely c
hal
lenged
us
and w
as v
ery d
isru
pti
ve,
It
could
hav
e sh
ut
us
dow
n p
erm
anen
tly, D
on’t
know
Open
Form
at:
Ple
ase
bri
efly
des
crib
e w
hat
the
cris
is w
as, how
long i
t la
sted
for
and w
hat
the
impac
t w
as o
n y
our
org
anis
atio
n
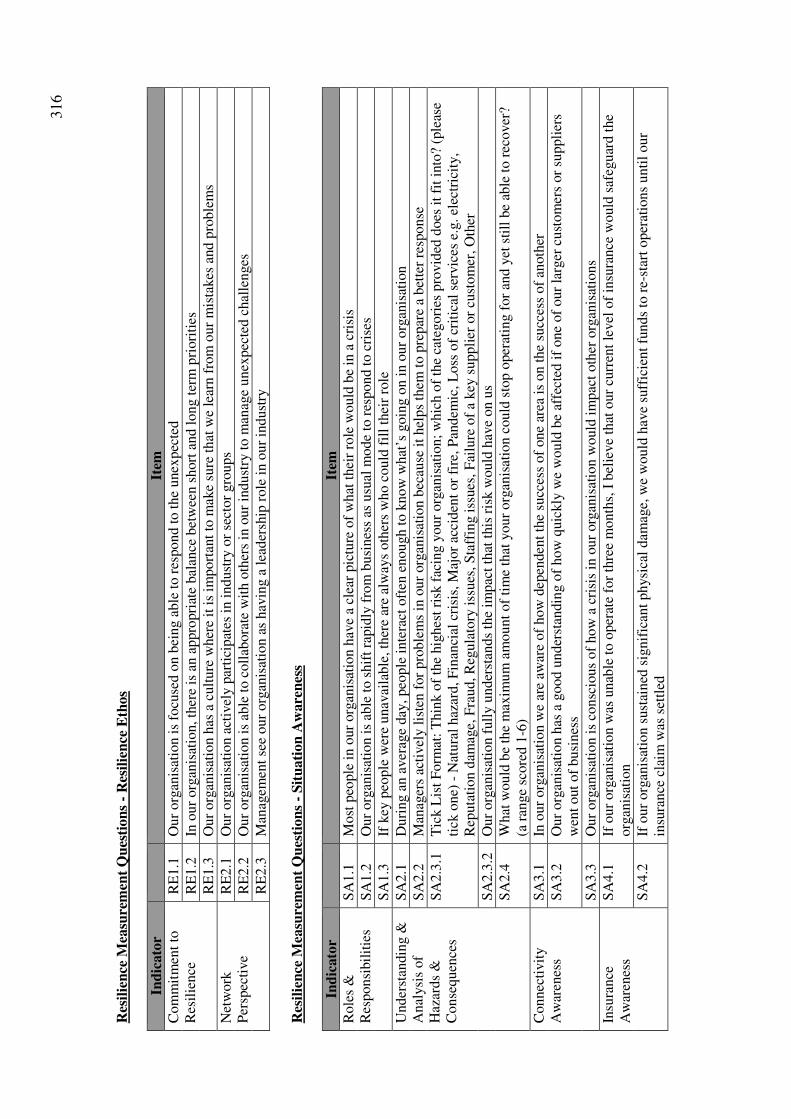
316
Res
ilie
nce
Mea
sure
men
t Q
ues
tion
s -
Res
ilie
nce
Eth
os
Ind
icato
r
Item
Com
mit
men
t to
R
esil
ience
R
E1.1
O
ur
org
anis
atio
n i
s fo
cuse
d o
n b
eing a
ble
to r
espond t
o t
he
unex
pec
ted
RE
1.2
In
our
org
anis
atio
n, th
ere
is a
n a
ppro
pri
ate
bal
ance
bet
wee
n s
hort
and l
ong t
erm
pri
ori
ties
RE
1.3
O
ur
org
anis
atio
n h
as a
cult
ure
wher
e it
is
import
ant
to m
ake
sure
that
we
lear
n f
rom
our
mis
takes
and p
roble
ms
Net
work
P
ersp
ecti
ve
RE
2.1
O
ur
org
anis
atio
n a
ctiv
ely p
arti
cipat
es i
n i
ndust
ry o
r se
ctor
gro
ups
RE
2.2
O
ur
org
anis
atio
n i
s ab
le t
o c
oll
abora
te w
ith o
ther
s in
our
indust
ry t
o m
anag
e unex
pec
ted c
hal
lenges
RE
2.3
M
anag
emen
t se
e our
org
anis
atio
n a
s hav
ing a
lea
der
ship
role
in o
ur
indust
ry
Res
ilie
nce
Mea
sure
men
t Q
ues
tion
s -
Sit
uati
on
Aw
are
nes
s
Ind
icato
r
Item
Role
s &
R
esponsi
bil
itie
s S
A1.1
M
ost
peo
ple
in o
ur
org
anis
atio
n h
ave
a cl
ear
pic
ture
of
what
thei
r ro
le w
ould
be
in a
cri
sis
SA
1.2
O
ur
org
anis
atio
n i
s ab
le t
o s
hif
t ra
pid
ly f
rom
busi
nes
s as
usu
al m
ode
to r
espond t
o c
rise
s
SA
1.3
If
key
peo
ple
wer
e unav
aila
ble
, th
ere
are
alw
ays
oth
ers
who c
ould
fil
l th
eir
role
Under
stan
din
g &
A
nal
ysi
s of
Haz
ards
&
Conse
quen
ces
SA
2.1
D
uri
ng a
n a
ver
age
day
, peo
ple
inte
ract
oft
en e
nough t
o k
now
what
’s g
oin
g o
n i
n o
ur
org
anis
atio
n
SA
2.2
M
anag
ers
acti
vel
y l
iste
n f
or
pro
ble
ms
in o
ur
org
anis
atio
n b
ecau
se i
t hel
ps
them
to p
repar
e a
bet
ter
resp
onse
SA
2.3
.1
Tic
k L
ist
Form
at:
Thin
k o
f th
e hig
hes
t ri
sk f
acin
g y
our
org
anis
atio
n;
whic
h o
f th
e ca
tegori
es p
rovid
ed d
oes
it
fit
into
? (p
leas
e ti
ck o
ne)
- N
atura
l haz
ard, F
inan
cial
cri
sis,
Maj
or
acci
den
t or
fire
, P
andem
ic, L
oss
of
crit
ical
ser
vic
es e
.g. el
ectr
icit
y,
Rep
uta
tion d
amag
e, F
raud, R
egula
tory
iss
ues
, S
taff
ing i
ssues
, F
ailu
re o
f a
key
suppli
er o
r cu
stom
er, O
ther
SA
2.3
.2
Our
org
anis
atio
n f
ull
y u
nder
stan
ds
the
impac
t th
at t
his
ris
k w
ould
hav
e on u
s
SA
2.4
W
hat
would
be
the
max
imum
am
ount
of
tim
e th
at y
our
org
anis
atio
n c
ould
sto
p o
per
atin
g f
or
and y
et s
till
be
able
to r
ecover
? (a
ran
ge
score
d 1
-6)
Connec
tivit
y
Aw
aren
ess
SA
3.1
In
our
org
anis
atio
n w
e ar
e aw
are
of
how
dep
enden
t th
e su
cces
s of
one
area
is
on t
he
succ
ess
of
anoth
er
SA
3.2
O
ur
org
anis
atio
n h
as a
good u
nder
stan
din
g o
f how
quic
kly
we
would
be
affe
cted
if
one
of
our
larg
er c
ust
om
ers
or
suppli
ers
wen
t out
of
busi
nes
s
SA
3.3
O
ur
org
anis
atio
n i
s co
nsc
ious
of
how
a c
risi
s in
our
org
anis
atio
n w
ould
im
pac
t oth
er o
rgan
isat
ions
Insu
rance
A
war
enes
s S
A4.1
If
our
org
anis
atio
n w
as u
nab
le t
o o
per
ate
for
thre
e m
onth
s, I
bel
ieve
that
our
curr
ent
level
of
insu
rance
would
saf
eguar
d t
he
org
anis
atio
n
SA
4.2
If
our
org
anis
atio
n s
ust
ained
sig
nif
ican
t physi
cal
dam
age,
we
would
hav
e su
ffic
ient
funds
to r
e-st
art
oper
atio
ns
unti
l our
insu
rance
cla
im w
as s
ettl
ed
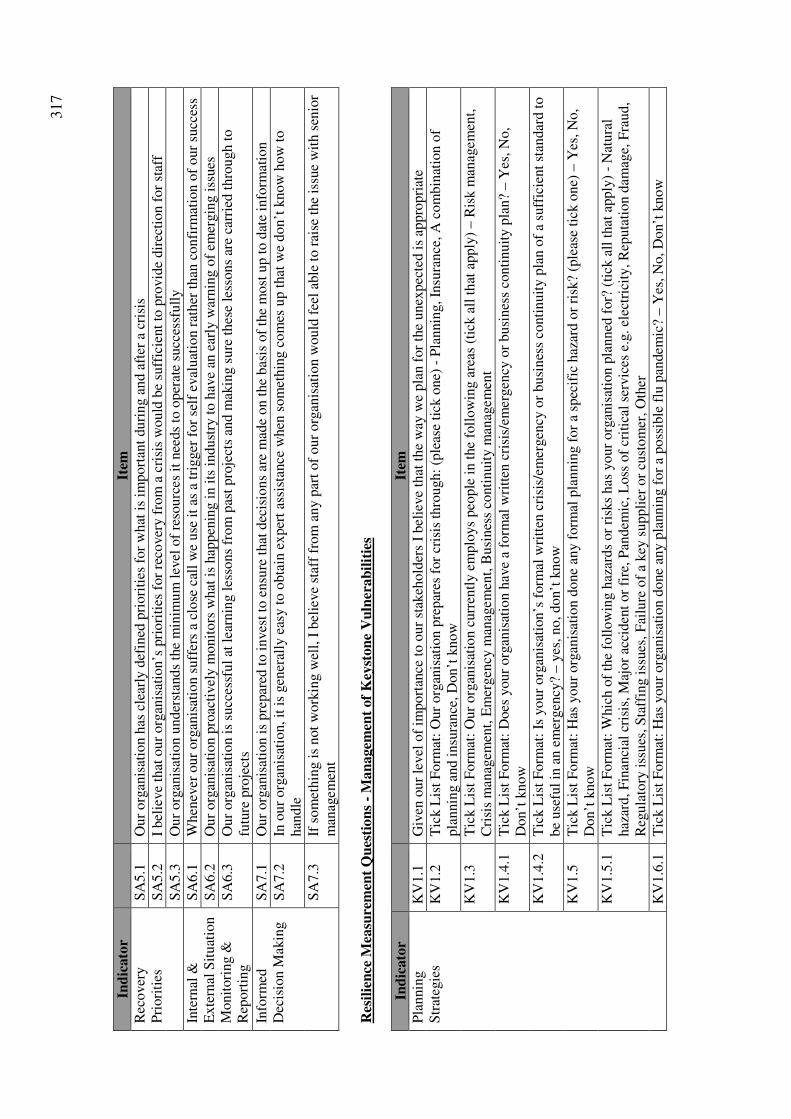
317
Ind
icato
r
Item
Rec
over
y
Pri
ori
ties
S
A5.1
O
ur
org
anis
atio
n h
as c
lear
ly d
efin
ed p
riori
ties
for
what
is
import
ant
duri
ng a
nd a
fter
a c
risi
s
SA
5.2
I
bel
ieve
that
our
org
anis
atio
n’s
pri
ori
ties
for
reco
ver
y f
rom
a c
risi
s w
ould
be
suff
icie
nt
to p
rovid
e dir
ecti
on f
or
staf
f
SA
5.3
O
ur
org
anis
atio
n u
nder
stan
ds
the
min
imu
m l
evel
of
reso
urc
es i
t nee
ds
to o
per
ate
succ
essf
ull
y
Inte
rnal
&
Exte
rnal
Sit
uat
ion
Monit
ori
ng &
R
eport
ing
SA
6.1
W
hen
ever
our
org
anis
atio
n s
uff
ers
a cl
ose
cal
l w
e use
it
as a
tri
gger
for
self
eval
uat
ion r
ather
than
confi
rmat
ion o
f our
succ
ess
SA
6.2
O
ur
org
anis
atio
n p
roac
tivel
y m
onit
ors
what
is
hap
pen
ing i
n i
ts i
ndust
ry t
o h
ave
an e
arly
war
nin
g o
f em
ergin
g i
ssues
SA
6.3
O
ur
org
anis
atio
n i
s su
cces
sful
at l
earn
ing l
esso
ns
from
pas
t pro
ject
s an
d m
akin
g s
ure
thes
e le
ssons
are
carr
ied t
hro
ugh t
o
futu
re p
roje
cts
Info
rmed
D
ecis
ion M
akin
g
SA
7.1
O
ur
org
anis
atio
n i
s pre
par
ed t
o i
nves
t to
ensu
re t
hat
dec
isio
ns
are
mad
e on t
he
bas
is o
f th
e m
ost
up t
o d
ate
info
rmat
ion
SA
7.2
In
our
org
anis
atio
n, it
is
gen
eral
ly e
asy t
o o
bta
in e
xper
t as
sist
ance
when
som
ethin
g c
om
es u
p t
hat
we
don’t
know
how
to
han
dle
SA
7.3
If
so
met
hin
g i
s not
work
ing w
ell,
I b
elie
ve
staf
f fr
om
any p
art
of
our
org
anis
atio
n w
ould
fee
l ab
le t
o r
aise
the
issu
e w
ith s
enio
r m
anag
emen
t
Res
ilie
nce
Mea
sure
men
t Q
ues
tion
s -
Man
agem
ent
of
Key
ston
e V
uln
erab
ilit
ies
Ind
icato
r
Item
Pla
nnin
g
Str
ateg
ies
KV
1.1
G
iven
our
level
of
import
ance
to o
ur
stak
ehold
ers
I bel
ieve
that
the
way
we
pla
n f
or
the
unex
pec
ted i
s ap
pro
pri
ate
KV
1.2
T
ick L
ist
Form
at:
Our
org
anis
atio
n p
repar
es f
or
cris
is t
hro
ugh:
(ple
ase
tick
one)
- P
lannin
g, In
sura
nce
, A
com
bin
atio
n o
f pla
nnin
g a
nd i
nsu
rance
, D
on’t
know
KV
1.3
T
ick L
ist
Form
at:
Our
org
anis
atio
n c
urr
entl
y e
mplo
ys
peo
ple
in t
he
foll
ow
ing a
reas
(ti
ck a
ll t
hat
apply
) – R
isk m
anag
emen
t,
Cri
sis
man
agem
ent,
Em
ergen
cy m
anag
emen
t, B
usi
nes
s co
nti
nuit
y m
anag
emen
t
KV
1.4
.1
Tic
k L
ist
Form
at:
Does
your
org
anis
atio
n h
ave
a fo
rmal
wri
tten
cri
sis/
emer
gen
cy o
r busi
nes
s co
nti
nuit
y p
lan?
– Y
es, N
o,
Don’t
know
KV
1.4
.2
Tic
k L
ist
Form
at:
Is y
our
org
anis
atio
n’s
form
al w
ritt
en c
risi
s/em
ergen
cy o
r busi
nes
s co
nti
nuit
y p
lan o
f a
suff
icie
nt
stan
dar
d t
o
be
use
ful
in a
n e
mer
gen
cy?
– y
es, no, don’t
know
KV
1.5
T
ick L
ist
Form
at:
Has
your
org
anis
atio
n d
one
any f
orm
al p
lannin
g f
or
a sp
ecif
ic h
azar
d o
r ri
sk?
(ple
ase
tick
one)
– Y
es, N
o,
Don’t
know
KV
1.5
.1
Tic
k L
ist
Form
at:
Whic
h o
f th
e fo
llow
ing h
azar
ds
or
risk
s has
your
org
anis
atio
n p
lanned
for?
(ti
ck a
ll t
hat
apply
) -
Nat
ura
l haz
ard, F
inan
cial
cri
sis,
Maj
or
acci
den
t or
fire
, P
andem
ic, L
oss
of
crit
ical
ser
vic
es e
.g. el
ectr
icit
y, R
eputa
tion d
amag
e, F
raud,
Reg
ula
tory
iss
ues
, S
taff
ing i
ssues
, F
ailu
re o
f a
key
suppli
er o
r cu
stom
er, O
ther
KV
1.6
.1
Tic
k L
ist
Form
at:
Has
your
org
anis
atio
n d
one
any p
lannin
g f
or
a poss
ible
flu
pan
dem
ic?
– Y
es, N
o, D
on’t
know
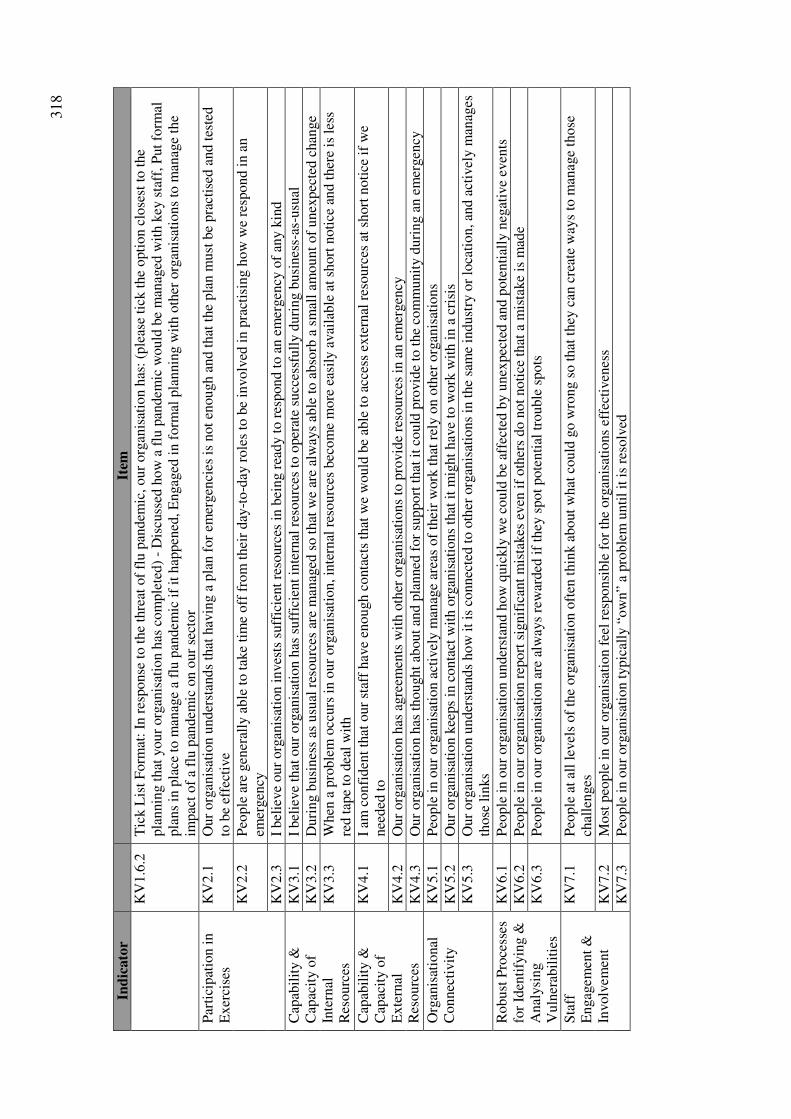
318
Ind
icato
r
Item
KV
1.6
.2
Tic
k L
ist
Form
at:
In r
esponse
to t
he
thre
at o
f fl
u p
andem
ic, our
org
anis
atio
n h
as:
(ple
ase
tick
the
opti
on c
lose
st t
o t
he
pla
nnin
g t
hat
your
org
anis
atio
n h
as c
om
ple
ted)
- D
iscu
ssed
how
a f
lu p
andem
ic w
ould
be
man
aged
wit
h k
ey s
taff
, P
ut
form
al
pla
ns
in p
lace
to m
anag
e a
flu p
andem
ic i
f it
hap
pen
ed, E
ngag
ed i
n f
orm
al p
lannin
g w
ith o
ther
org
anis
atio
ns
to m
anag
e th
e im
pac
t of
a fl
u p
andem
ic o
n o
ur
sect
or
Par
tici
pat
ion i
n
Exer
cise
s K
V2.1
O
ur
org
anis
atio
n u
nder
stan
ds
that
hav
ing a
pla
n f
or
emer
gen
cies
is
not
enough a
nd t
hat
the
pla
n m
ust
be
pra
ctis
ed a
nd t
este
d
to b
e ef
fect
ive
KV
2.2
P
eople
are
gen
eral
ly a
ble
to t
ake
tim
e off
fro
m t
hei
r day
-to
-day
role
s to
be
involv
ed i
n p
ract
isin
g h
ow
we
resp
ond i
n a
n
emer
gen
cy
KV
2.3
I
bel
ieve
our
org
anis
atio
n i
nves
ts s
uff
icie
nt
reso
urc
es i
n b
eing r
eady t
o r
espond t
o a
n e
mer
gen
cy o
f an
y k
ind
Cap
abil
ity &
C
apac
ity o
f In
tern
al
Res
ourc
es
KV
3.1
I
bel
ieve
that
our
org
anis
atio
n h
as s
uff
icie
nt
inte
rnal
res
ourc
es t
o o
per
ate
succ
essf
ull
y d
uri
ng b
usi
nes
s-as
-usu
al
KV
3.2
D
uri
ng b
usi
nes
s as
usu
al r
esourc
es a
re m
anag
ed s
o t
hat
we
are
alw
ays
able
to a
bso
rb a
sm
all
amount
of
unex
pec
ted c
han
ge
KV
3.3
W
hen
a p
roble
m o
ccurs
in o
ur
org
anis
atio
n, in
tern
al r
esourc
es b
ecom
e m
ore
eas
ily a
vai
lable
at
short
noti
ce a
nd t
her
e is
les
s re
d t
ape
to d
eal
wit
h
Cap
abil
ity &
C
apac
ity o
f E
xte
rnal
R
esourc
es
KV
4.1
I
am c
onfi
den
t th
at o
ur
staf
f hav
e en
ough c
onta
cts
that
we
would
be
able
to a
cces
s ex
tern
al r
esourc
es a
t sh
ort
noti
ce i
f w
e nee
ded
to
KV
4.2
O
ur
org
anis
atio
n h
as a
gre
emen
ts w
ith o
ther
org
anis
atio
ns
to p
rovid
e re
sourc
es i
n a
n e
mer
gen
cy
KV
4.3
O
ur
org
anis
atio
n h
as t
hought
about
and p
lanned
for
support
that
it
could
pro
vid
e to
the
com
munit
y d
uri
ng a
n e
mer
gen
cy
Org
anis
atio
nal
C
onnec
tivit
y
KV
5.1
P
eople
in o
ur
org
anis
atio
n a
ctiv
ely m
anag
e ar
eas
of
thei
r w
ork
that
rel
y o
n o
ther
org
anis
atio
ns
KV
5.2
O
ur
org
anis
atio
n k
eeps
in c
onta
ct w
ith o
rgan
isat
ions
that
it
mig
ht
hav
e to
work
wit
h i
n a
cri
sis
KV
5.3
O
ur
org
anis
atio
n u
nder
stan
ds
how
it
is c
onnec
ted t
o o
ther
org
anis
atio
ns
in t
he
sam
e in
dust
ry o
r lo
cati
on, an
d a
ctiv
ely m
anag
es
those
lin
ks
Robust
Pro
cess
es
for
Iden
tify
ing &
A
nal
ysi
ng
Vuln
erab
ilit
ies
KV
6.1
P
eople
in o
ur
org
anis
atio
n u
nder
stan
d h
ow
quic
kly
we
could
be
affe
cted
by u
nex
pec
ted a
nd p
ote
nti
ally
neg
ativ
e ev
ents
KV
6.2
P
eople
in o
ur
org
anis
atio
n r
eport
sig
nif
ican
t m
ista
kes
even
if
oth
ers
do n
ot
noti
ce t
hat
a m
ista
ke
is m
ade
KV
6.3
P
eople
in o
ur
org
anis
atio
n a
re a
lway
s re
war
ded
if
they
spot
pote
nti
al t
rouble
spots
Sta
ff
Engag
emen
t &
In
volv
emen
t
KV
7.1
P
eople
at
all
level
s of
the
org
anis
atio
n o
ften
thin
k a
bout
what
could
go w
rong s
o t
hat
they
can
cre
ate
way
s to
man
age
those
ch
alle
nges
KV
7.2
M
ost
peo
ple
in o
ur
org
anis
atio
n f
eel
resp
onsi
ble
for
the
org
anis
atio
ns
effe
ctiv
enes
s
KV
7.3
P
eople
in o
ur
org
anis
atio
n t
ypic
ally
“ow
n”
a pro
ble
m u
nti
l it
is
reso
lved
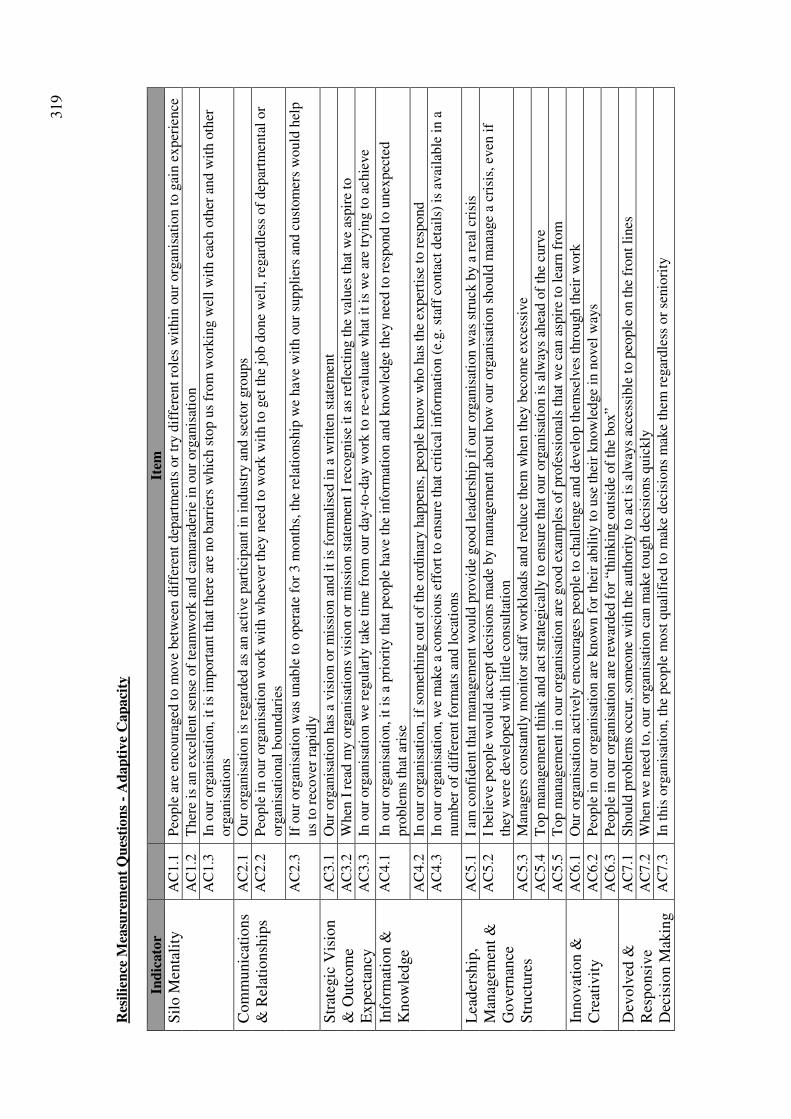
319
Res
ilie
nce
Mea
sure
men
t Q
ues
tion
s -
Ad
ap
tive
Cap
aci
ty
Ind
icato
r
Item
Sil
o M
enta
lity
A
C1.1
P
eople
are
enco
ura
ged
to m
ove
bet
wee
n d
iffe
rent
dep
artm
ents
or
try d
iffe
rent
role
s w
ithin
our
org
anis
atio
n t
o g
ain e
xper
ience
AC
1.2
T
her
e is
an e
xce
llen
t se
nse
of
team
work
and c
amar
ader
ie i
n o
ur
org
anis
atio
n
AC
1.3
In
our
org
anis
atio
n, it
is
import
ant
that
ther
e ar
e no b
arri
ers
whic
h s
top u
s fr
om
work
ing w
ell
wit
h e
ach o
ther
and w
ith o
ther
org
anis
atio
ns
Com
munic
atio
ns
& R
elat
ionsh
ips
AC
2.1
O
ur
org
anis
atio
n i
s re
gar
ded
as
an a
ctiv
e par
tici
pan
t in
indust
ry a
nd s
ecto
r gro
ups
AC
2.2
P
eople
in o
ur
org
anis
atio
n w
ork
wit
h w
hoev
er t
hey
nee
d t
o w
ork
wit
h t
o g
et t
he
job d
one
wel
l, r
egar
dle
ss o
f dep
artm
enta
l or
org
anis
atio
nal
boundar
ies
AC
2.3
If
our
org
anis
atio
n w
as u
nab
le t
o o
per
ate
for
3 m
onth
s, t
he
rela
tionsh
ip w
e hav
e w
ith o
ur
suppli
ers
and c
ust
om
ers
would
hel
p
us
to r
ecover
rap
idly
Str
ateg
ic V
isio
n
& O
utc
om
e E
xpec
tancy
AC
3.1
O
ur
org
anis
atio
n h
as a
vis
ion o
r m
issi
on a
nd i
t is
form
alis
ed i
n a
wri
tten
sta
tem
ent
AC
3.2
W
hen
I r
ead m
y o
rgan
isat
ions
vis
ion o
r m
issi
on s
tate
men
t I
reco
gnis
e it
as
refl
ecti
ng t
he
val
ues
that
we
aspir
e to
AC
3.3
In
our
org
anis
atio
n w
e re
gula
rly t
ake
tim
e fr
om
our
day
-to
-day
work
to r
e-ev
aluat
e w
hat
it
is w
e ar
e tr
yin
g t
o a
chie
ve
Info
rmat
ion &
K
now
led
ge
AC
4.1
In
our
org
anis
atio
n, it
is
a pri
ori
ty t
hat
peo
ple
hav
e th
e in
form
atio
n a
nd k
now
ledge
they
nee
d t
o r
espond t
o u
nex
pec
ted
pro
ble
ms
that
ari
se
AC
4.2
In
our
org
anis
atio
n, if
som
ethin
g o
ut
of
the
ord
inar
y h
appen
s, p
eople
know
who h
as t
he
exper
tise
to r
espond
AC
4.3
In
our
org
anis
atio
n, w
e m
ake
a co
nsc
ious
effo
rt t
o e
nsu
re t
hat
cri
tica
l in
form
atio
n (
e.g. st
aff
conta
ct d
etai
ls)
is a
vai
lable
in a
num
ber
of
dif
fere
nt
form
ats
and l
oca
tions
Lea
der
ship
, M
anag
emen
t &
G
over
nan
ce
Str
uct
ure
s
AC
5.1
I
am c
onfi
den
t th
at m
anag
emen
t w
ould
pro
vid
e good l
eader
ship
if
our
org
anis
atio
n w
as s
truck
by a
rea
l cr
isis
AC
5.2
I
bel
ieve
peo
ple
would
acc
ept
dec
isio
ns
mad
e by m
anag
emen
t ab
out
how
our
org
anis
atio
n s
hould
man
age
a cr
isis
, ev
en i
f th
ey w
ere
dev
eloped
wit
h l
ittl
e co
nsu
ltat
ion
AC
5.3
M
anag
ers
const
antl
y m
onit
or
staf
f w
ork
load
s an
d r
educe
them
when
they
bec
om
e ex
cess
ive
AC
5.4
T
op m
anag
emen
t th
ink a
nd a
ct s
trat
egic
ally
to e
nsu
re t
hat
our
org
anis
atio
n i
s al
way
s ah
ead o
f th
e cu
rve
AC
5.5
T
op m
anag
emen
t in
our
org
anis
atio
n a
re g
ood e
xam
ple
s of
pro
fess
ional
s th
at w
e ca
n a
spir
e to
lea
rn f
rom
Innov
atio
n &
C
reat
ivit
y
AC
6.1
O
ur
org
anis
atio
n a
ctiv
ely e
nco
ura
ges
peo
ple
to c
hal
lenge
and d
evel
op t
hem
selv
es t
hro
ugh t
hei
r w
ork
AC
6.2
P
eople
in o
ur
org
anis
atio
n a
re k
now
n f
or
thei
r ab
ilit
y t
o u
se t
hei
r know
ledge
in n
ovel
way
s
AC
6.3
P
eople
in o
ur
org
anis
atio
n a
re r
ewar
ded
for
“thin
kin
g o
uts
ide
of
the
box”
Dev
olv
ed &
R
esponsi
ve
Dec
isio
n M
akin
g
AC
7.1
S
hould
pro
ble
ms
occ
ur,
som
eone
wit
h t
he
auth
ori
ty t
o a
ct i
s al
way
s ac
cess
ible
to p
eople
on t
he
front
lines
AC
7.2
W
hen
we
nee
d t
o, our
org
anis
atio
n c
an m
ake
tough d
ecis
ions
quic
kly
AC
7.3
In
this
org
anis
atio
n, th
e peo
ple
most
qual
ifie
d t
o m
ake
dec
isio
ns
mak
e th
em r
egar
dle
ss o
r se
nio
rity
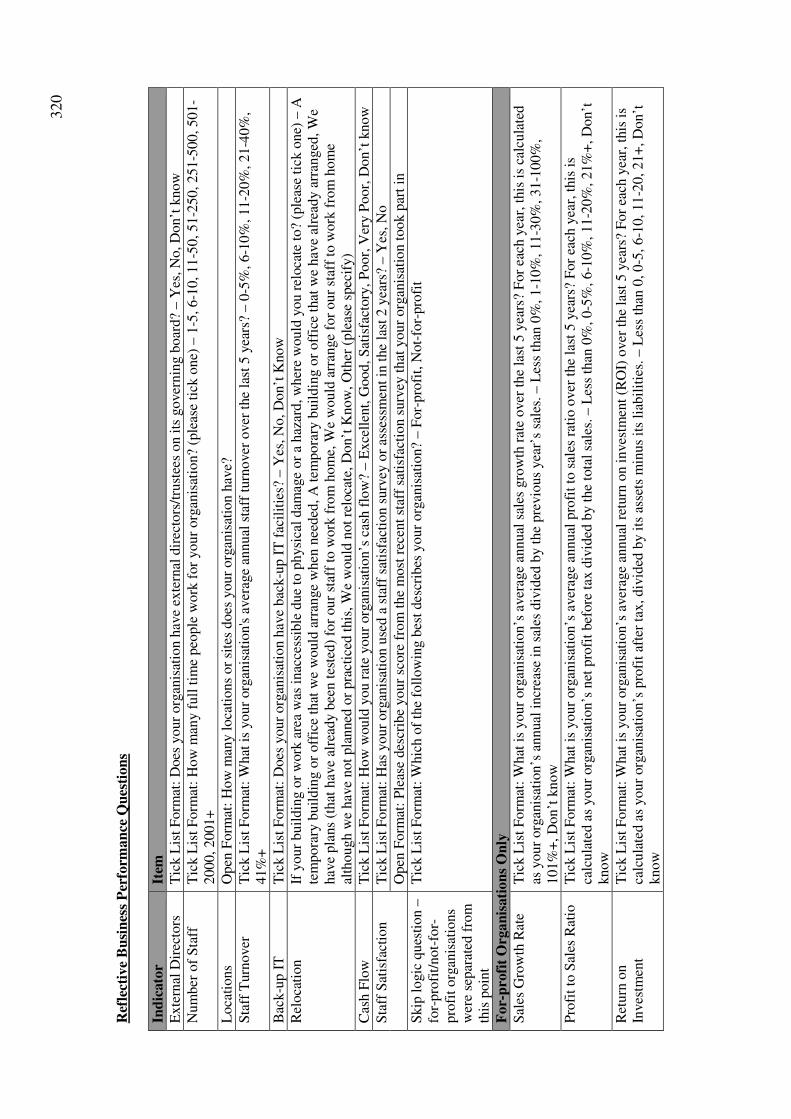
320
Ref
lect
ive
Bu
sin
ess
Per
form
an
ce Q
ues
tion
s
Ind
icato
r It
em
Exte
rnal
Dir
ecto
rs
Tic
k L
ist
Form
at:
Does
your
org
anis
atio
n h
ave
exte
rnal
dir
ecto
rs/t
rust
ees
on i
ts g
over
nin
g b
oar
d?
– Y
es, N
o, D
on’t
know
Num
ber
of
Sta
ff
Tic
k L
ist
Form
at:
How
man
y f
ull
tim
e peo
ple
work
for
your
org
anis
atio
n?
(ple
ase
tick
one)
– 1
-5, 6-1
0, 11
-50, 51-2
50, 251-5
00, 501
-2000, 2001+
Loca
tions
O
pen
Form
at:
How
man
y l
oca
tions
or
site
s does
your
org
anis
atio
n h
ave?
Sta
ff T
urn
over
T
ick L
ist
Form
at:
What
is
your
org
anis
atio
n's
aver
age
annual
sta
ff t
urn
over
over
the
last
5 y
ears
? – 0
-5%
, 6-1
0%
, 11-2
0%
, 21-4
0%
, 41%
+
Bac
k-u
p I
T
Tic
k L
ist
Form
at:
Does
your
org
anis
atio
n h
ave
bac
k-u
p I
T f
acil
itie
s? –
Yes
, N
o, D
on’t
Know
Rel
oca
tion
If y
our
buil
din
g o
r w
ork
are
a w
as i
nac
cess
ible
due
to p
hysi
cal
dam
age
or
a haz
ard, w
her
e w
ould
you r
eloca
te t
o?
(ple
ase
tick
one)
– A
te
mpora
ry b
uil
din
g o
r off
ice
that
we
would
arr
ange
when
nee
ded
, A
tem
pora
ry b
uil
din
g o
r off
ice
that
we
hav
e al
read
y a
rran
ged
, W
e hav
e pla
ns
(that
hav
e al
read
y b
een t
este
d)
for
our
staf
f to
work
fro
m h
om
e, W
e w
ould
arr
ange
for
our
staf
f to
work
fro
m h
om
e al
though w
e hav
e not
pla
nned
or
pra
ctic
ed t
his
, W
e w
ould
not
relo
cate
, D
on’t
Know
, O
ther
(ple
ase
spec
ify)
Cas
h F
low
T
ick L
ist
Form
at:
How
would
you r
ate
your
org
anis
atio
n’s
cas
h f
low
? – E
xce
llen
t, G
ood, S
atis
fact
ory
, P
oor,
Ver
y P
oor,
Don’t
know
Sta
ff S
atis
fact
ion
Tic
k L
ist
Form
at:
Has
your
org
anis
atio
n u
sed a
sta
ff s
atis
fact
ion s
urv
ey o
r as
sess
men
t in
the
last
2 y
ears
? – Y
es, N
o
Open
Form
at:
Ple
ase
des
crib
e your
score
fro
m t
he
most
rec
ent
staf
f sa
tisf
acti
on s
urv
ey t
hat
your
org
anis
atio
n t
ook p
art
in
Skip
logic
ques
tion –
fo
r-pro
fit/
not-
for-
pro
fit
org
anis
atio
ns
wer
e se
par
ated
fro
m
this
poin
t
Tic
k L
ist
Form
at:
Whic
h o
f th
e fo
llow
ing b
est
des
crib
es y
our
org
anis
atio
n?
– F
or-
pro
fit,
Not-
for-
pro
fit
For-
pro
fit
Org
an
isati
on
s O
nly
Sal
es G
row
th R
ate
Tic
k L
ist
Form
at:
What
is
your
org
anis
atio
n’s
aver
age
annual
sal
es g
row
th r
ate
over
the
last
5 y
ears
? F
or
each
yea
r, t
his
is
calc
ula
ted
as y
our
org
anis
atio
n’s
annual
incr
ease
in s
ales
div
ided
by t
he
pre
vio
us
yea
r’s
sale
s. –
Les
s th
an 0
%, 1-1
0%
, 11-3
0%
, 31-1
00%
, 101%
+, D
on’t
know
Pro
fit
to S
ales
Rat
io
Tic
k L
ist
Form
at:
What
is
your
org
anis
atio
n’s
aver
age
annual
pro
fit
to s
ales
rat
io o
ver
the
last
5 y
ears
? F
or
each
yea
r, t
his
is
calc
ula
ted a
s your
org
anis
atio
n’s
net
pro
fit
bef
ore
tax
div
ided
by t
he
tota
l sa
les.
– L
ess
than
0%
, 0-5
%, 6-1
0%
, 11-2
0%
, 21%
+, D
on’t
know
Ret
urn
on
Inves
tmen
t T
ick L
ist
Form
at:
What
is
your
org
anis
atio
n’s
aver
age
annual
ret
urn
on i
nves
tmen
t (R
OI)
over
the
last
5 y
ears
? F
or
each
yea
r, t
his
is
calc
ula
ted a
s your
org
anis
atio
n’s
pro
fit
afte
r ta
x, div
ided
by i
ts a
sset
s m
inus
its
liab
ilit
ies.
– L
ess
than
0, 0-5
, 6-1
0, 11
-20, 21+
, D
on’t
know
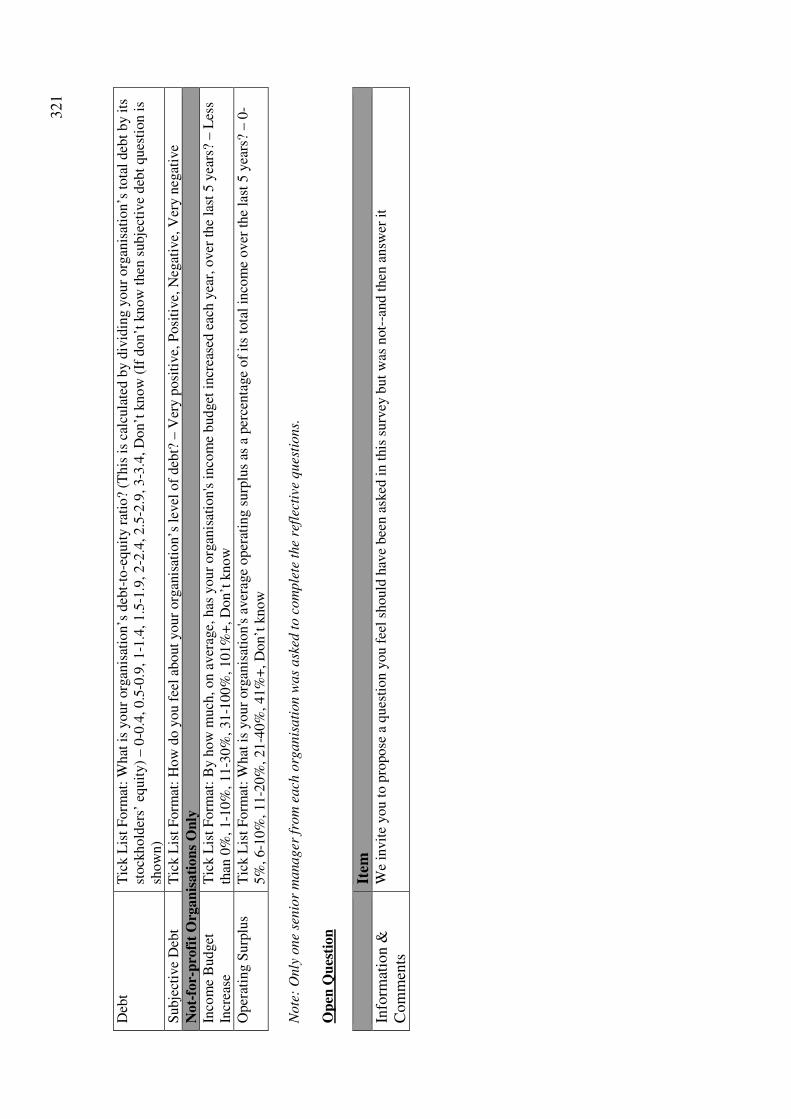
321
Deb
t T
ick L
ist
Form
at:
What
is
your
org
anis
atio
n’s
deb
t-to
-equit
y r
atio
? (T
his
is
calc
ula
ted b
y d
ivid
ing y
our
org
anis
atio
n’s
tota
l deb
t by i
ts
stock
hold
ers’
equit
y)
– 0
-0.4
, 0.5
-0.9
, 1
-1.4
, 1.5
-1.9
, 2
-2.4
, 2.5
-2.9
, 3-3
.4, D
on’t
know
(If
don’t
know
then
subje
ctiv
e deb
t ques
tion i
s sh
ow
n)
Subje
ctiv
e D
ebt
Tic
k L
ist
Form
at:
How
do y
ou f
eel
about
your
org
anis
atio
n’s
lev
el o
f deb
t? –
Ver
y p
osi
tive,
Posi
tive,
Neg
ativ
e, V
ery n
egat
ive
Not-
for-
pro
fit
Org
an
isati
on
s O
nly
Inco
me
Budget
In
crea
se
Tic
k L
ist
Form
at:
By h
ow
much
, on a
ver
age,
has
your
org
anis
atio
n's
inco
me
budget
incr
ease
d e
ach y
ear,
over
the
last
5 y
ears
? – L
ess
than
0%
, 1-1
0%
, 11-3
0%
, 31-1
00%
, 101%
+, D
on’t
know
Oper
atin
g S
urp
lus
Tic
k L
ist
Form
at: W
hat
is
your
org
anis
atio
n's
aver
age
oper
atin
g s
urp
lus
as a
per
centa
ge
of
its
tota
l in
com
e over
the
last
5 y
ears
? – 0
-5%
, 6-1
0%
, 11-2
0%
, 21-4
0%
, 41%
+, D
on’t
know
Note
: O
nly
one
senio
r m
anager
fro
m e
ach
org
anis
ati
on w
as
ask
ed t
o c
om
ple
te t
he
refl
ecti
ve q
ues
tions.
O
pen
Qu
esti
on
It
em
Info
rmat
ion &
C
om
men
ts
We
invit
e you t
o p
ropose
a q
ues
tion y
ou f
eel
should
hav
e bee
n a
sked
in t
his
surv
ey b
ut
was
not-
-and t
hen
answ
er i
t
322
Th
an
k Y
ou
T
han
k y
ou f
or
takin
g t
he
tim
e to
fil
l out
this
ques
tionnai
re, your
par
tici
pat
ion i
s ver
y i
mport
ant
and y
our
org
anis
atio
n w
ill
be
able
to l
earn
fro
m i
ts r
esult
s.
As
a re
min
der
, you m
ay w
ithdra
w y
our
par
tici
pat
ion, in
cludin
g w
ithdra
wal
of
any i
nfo
rmat
ion y
ou h
ave
pro
vid
ed, fo
r tw
o w
eeks
from
the
tim
e you
com
ple
ted t
his
ques
tionnai
re.
This
ques
tionnai
re m
easu
res
the
resi
lien
ce o
f your
org
anis
atio
n. T
he
indiv
idual
res
ult
s su
bm
itte
d b
y s
taff
wil
l be
coll
ated
toget
her
to r
epre
sent
your
org
anis
atio
n. Y
our
org
anis
atio
n’s
res
ult
s ca
n t
hen
be
com
par
ed a
gai
nst
the
resu
lts
of
oth
ers
to s
ee w
her
e your
org
anis
atio
n i
s al
read
y s
trong a
nd i
n w
hat
are
as
it c
ould
im
pro
ve.
W
e lo
ok f
orw
ard t
o s
har
ing t
he
resu
lts
wit
h y
ou. If
you
hav
e an
y q
ues
tions
about
the
rese
arch
or
the
ques
tionnai
re p
leas
e co
nta
ct e
ither
Am
y S
tephen
son
(Ph.D
. st
uden
t) o
n 0
2102638187 o
r D
r. E
rica
Sev
ille
, (R
esea
rch F
ello
w i
n t
he
Dep
artm
ent
of
Civ
il &
Nat
ura
l R
esourc
es E
ngin
eeri
ng a
t th
e U
niv
ersi
ty o
f C
ante
rbury
) on 0
21456706.
Als
o, ple
ase
enco
ura
ge
as m
any o
f your
coll
eagues
to t
ake
this
ques
tionnai
re a
s poss
ible
– t
he
more
res
ult
s w
e hav
e, t
he
bet
ter
the
info
rmat
ion w
e ca
n p
rovid
e to
your
org
anis
atio
n!
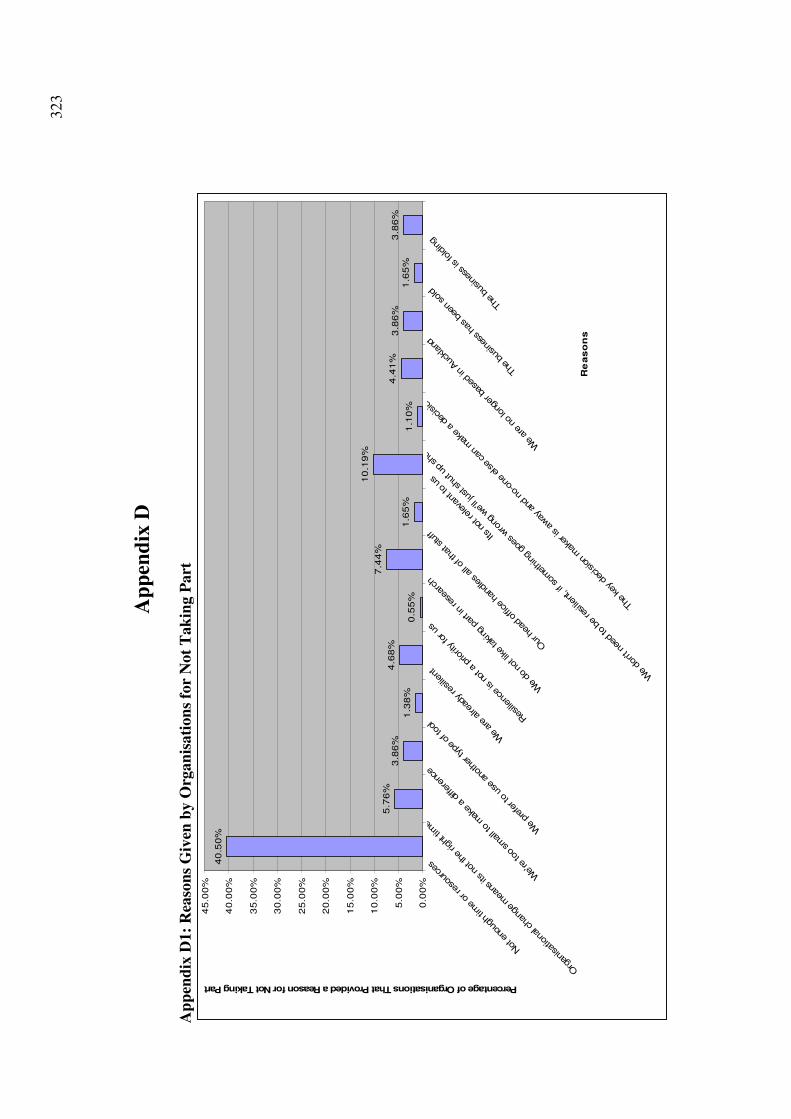
323
Ap
pen
dix
D
Ap
pen
dix
D1:
Rea
son
s G
iven
by O
rgan
isati
on
s fo
r N
ot
Tak
ing P
art
40
.50
%
5.7
6%
3.8
6%
1.3
8%
4.6
8%
0.5
5%
7.4
4%
1.6
5%
10
.19
%
1.1
0%
4.4
1%
3.8
6%
1.6
5%
3.8
6%
0.0
0%
5.0
0%
10
.00
%
15
.00
%
20
.00
%
25
.00
%
30
.00
%
35
.00
%
40
.00
%
45
.00
%
Not
eno
ugh
time
or r
esou
rces
Org
anis
atio
nal c
hang
e m
eans
its
not t
he r
ight
tim
e
We'
re to
o sm
all t
o m
ake
a di
ffere
nce
We
pref
er to
use
ano
ther
type
of t
ool
We
are
alre
ady
resi
lient
Res
ilien
ce is
not
a p
riorit
y fo
r us
We
do n
ot li
ke ta
king
par
t in
rese
arch
Our
hea
d of
fice
hand
les
all o
f tha
t stu
ff Its n
ot r
elev
ant t
o us
We
don'
t nee
d to
be
resi
lient
, if s
omet
hing
goe
s w
rong
we'
ll ju
st s
hut u
p sh
op
The
key
dec
isio
n m
aker
is a
way
and
no-
one
else
can
mak
e a
deci
sion
We
are
no lo
nger
bas
ed in
Auc
klan
d
The
bus
ines
s ha
s be
en s
old
The
bus
ines
s is
fold
ing
Re
as
on
s
Percentage of Organisations That Provided a Reason for Not Taking Part
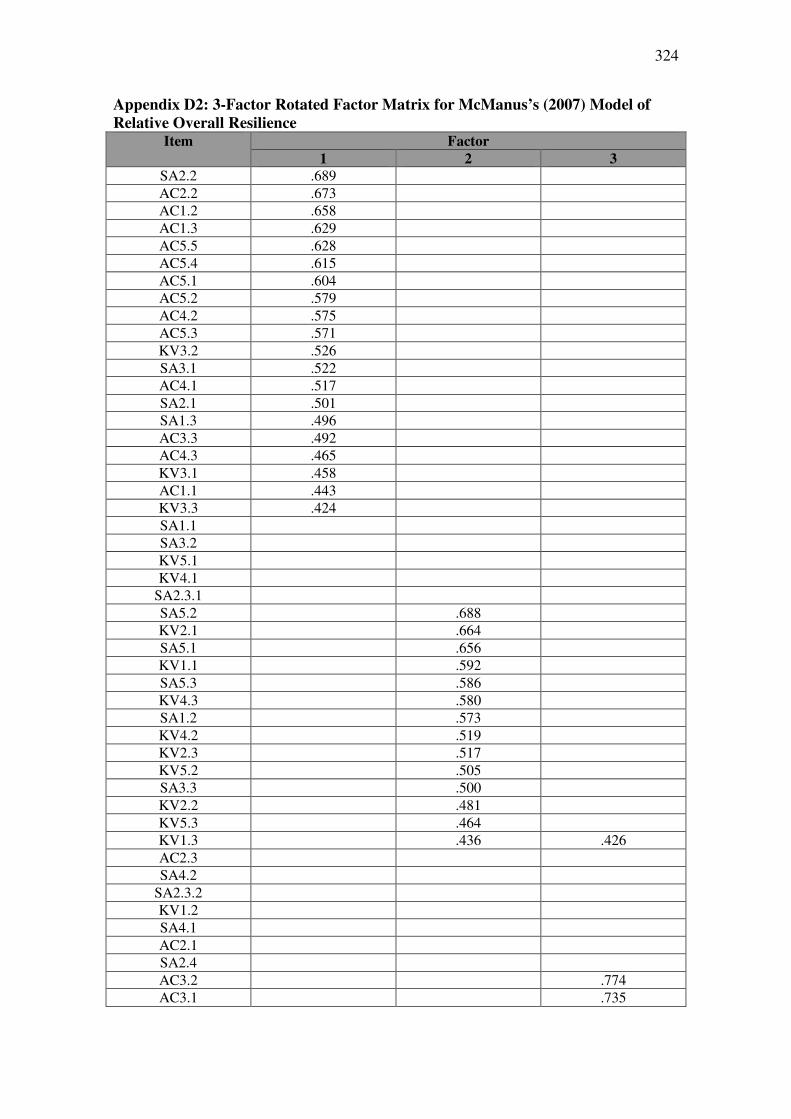
324
Appendix D2: 3-Factor Rotated Factor Matrix for McManus’s (2007) Model of
Relative Overall Resilience Item Factor
1 2 3
SA2.2 .689
AC2.2 .673
AC1.2 .658
AC1.3 .629
AC5.5 .628
AC5.4 .615
AC5.1 .604
AC5.2 .579
AC4.2 .575
AC5.3 .571
KV3.2 .526
SA3.1 .522
AC4.1 .517
SA2.1 .501
SA1.3 .496
AC3.3 .492
AC4.3 .465
KV3.1 .458
AC1.1 .443
KV3.3 .424
SA1.1
SA3.2
KV5.1
KV4.1
SA2.3.1
SA5.2 .688
KV2.1 .664
SA5.1 .656
KV1.1 .592
SA5.3 .586
KV4.3 .580
SA1.2 .573
KV4.2 .519
KV2.3 .517
KV5.2 .505
SA3.3 .500
KV2.2 .481
KV5.3 .464
KV1.3 .436 .426
AC2.3
SA4.2
SA2.3.2
KV1.2
SA4.1
AC2.1
SA2.4
AC3.2 .774
AC3.1 .735

325
KV1.4.1 .441
Note: Items references are shown next to the relevant items in Appendix C1.
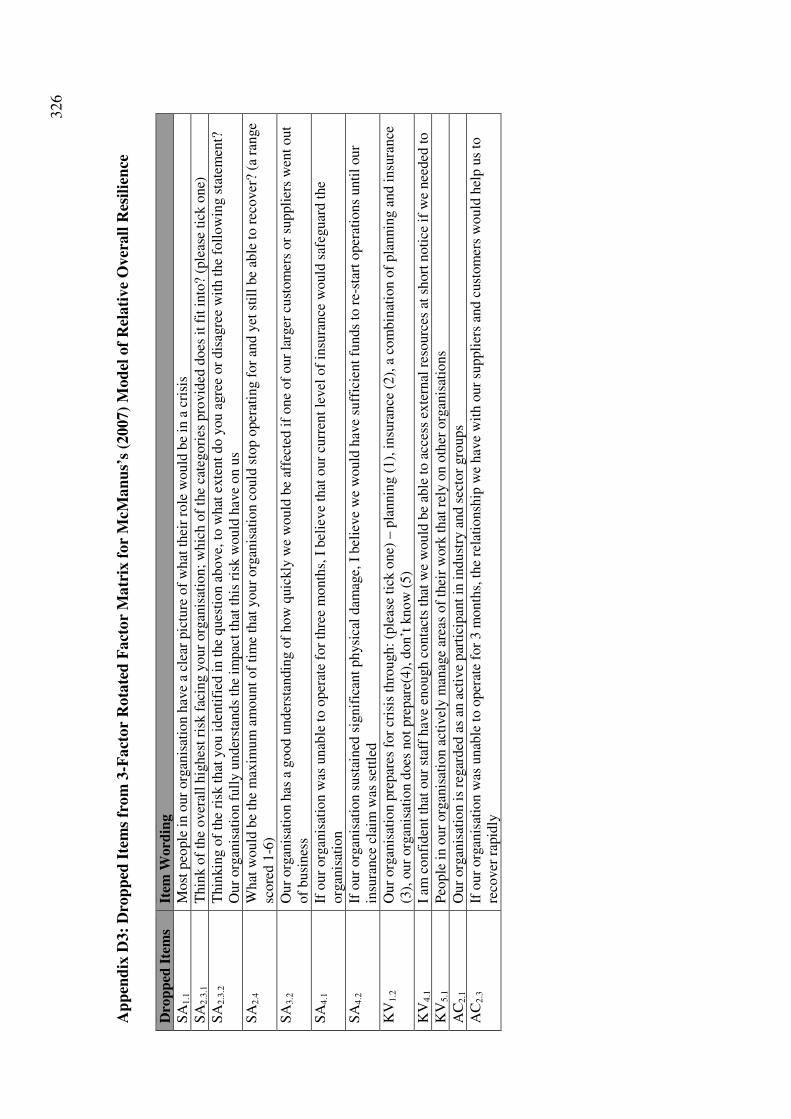
326
Ap
pen
dix
D3:
Dro
pp
ed I
tem
s fr
om
3-F
act
or
Rota
ted
Fact
or
Ma
trix
for
McM
an
us’
s (2
007)
Mod
el o
f R
elati
ve
Over
all
Res
ilie
nce
Dro
pp
ed I
tem
s It
em W
ord
ing
SA
1.1
M
ost
peo
ple
in o
ur
org
anis
atio
n h
ave
a cl
ear
pic
ture
of
what
thei
r ro
le w
ould
be
in a
cri
sis
SA
2.3
.1
Thin
k o
f th
e over
all
hig
hes
t ri
sk f
acin
g y
our
org
anis
atio
n;
whic
h o
f th
e ca
tegori
es p
rovid
ed d
oes
it
fit
into
? (p
leas
e ti
ck o
ne)
SA
2.3
.2
Thin
kin
g o
f th
e ri
sk t
hat
you i
den
tifi
ed i
n t
he
ques
tion a
bove,
to w
hat
exte
nt
do y
ou a
gre
e or
dis
agre
e w
ith t
he
foll
ow
ing s
tate
men
t?
Our
org
anis
atio
n f
ull
y u
nder
stan
ds
the
impac
t th
at t
his
ris
k w
ould
hav
e on u
s
SA
2.4
What
would
be
the
max
imum
am
ount
of
tim
e th
at y
our
org
anis
atio
n c
ould
sto
p o
per
atin
g f
or
and y
et s
till
be
able
to r
ecover
? (a
ran
ge
score
d 1
-6)
SA
3.2
Our
org
anis
atio
n h
as a
good u
nder
stan
din
g o
f how
quic
kly
we
would
be
affe
cted
if
one
of
our
larg
er c
ust
om
ers
or
suppli
ers
wen
t out
of
busi
nes
s
SA
4.1
If o
ur
org
anis
atio
n w
as u
nab
le t
o o
per
ate
for
thre
e m
onth
s, I
bel
ieve
that
our
curr
ent
level
of
insu
rance
would
saf
eguar
d t
he
org
anis
atio
n
SA
4.2
If o
ur
org
anis
atio
n s
ust
ained
sig
nif
ican
t physi
cal
dam
age,
I b
elie
ve
we
would
hav
e su
ffic
ient
funds
to r
e-st
art
oper
atio
ns
unti
l our
insu
rance
cla
im w
as s
ettl
ed
KV
1.2
Our
org
anis
atio
n p
repar
es f
or
cris
is t
hro
ugh:
(ple
ase
tick
one)
– p
lannin
g (
1),
insu
rance
(2),
a c
om
bin
atio
n o
f pla
nnin
g a
nd i
nsu
rance
(3
), o
ur
org
anis
atio
n d
oes
not
pre
par
e(4),
don’t
know
(5)
KV
4.1
I am
confi
den
t th
at o
ur
staf
f hav
e en
ough c
onta
cts
that
we
would
be
able
to a
cces
s ex
tern
al r
esourc
es a
t sh
ort
noti
ce i
f w
e nee
ded
to
KV
5.1
Peo
ple
in o
ur
org
anis
atio
n a
ctiv
ely m
anag
e ar
eas
of
thei
r w
ork
that
rel
y o
n o
ther
org
anis
atio
ns
AC
2.1
Our
org
anis
atio
n i
s re
gar
ded
as
an a
ctiv
e par
tici
pan
t in
indust
ry a
nd s
ecto
r gro
ups
AC
2.3
If o
ur
org
anis
atio
n w
as u
nab
le t
o o
per
ate
for
3 m
onth
s, t
he
rela
tionsh
ip w
e hav
e w
ith o
ur
suppli
ers
and c
ust
om
ers
would
hel
p u
s to
re
cover
rap
idly
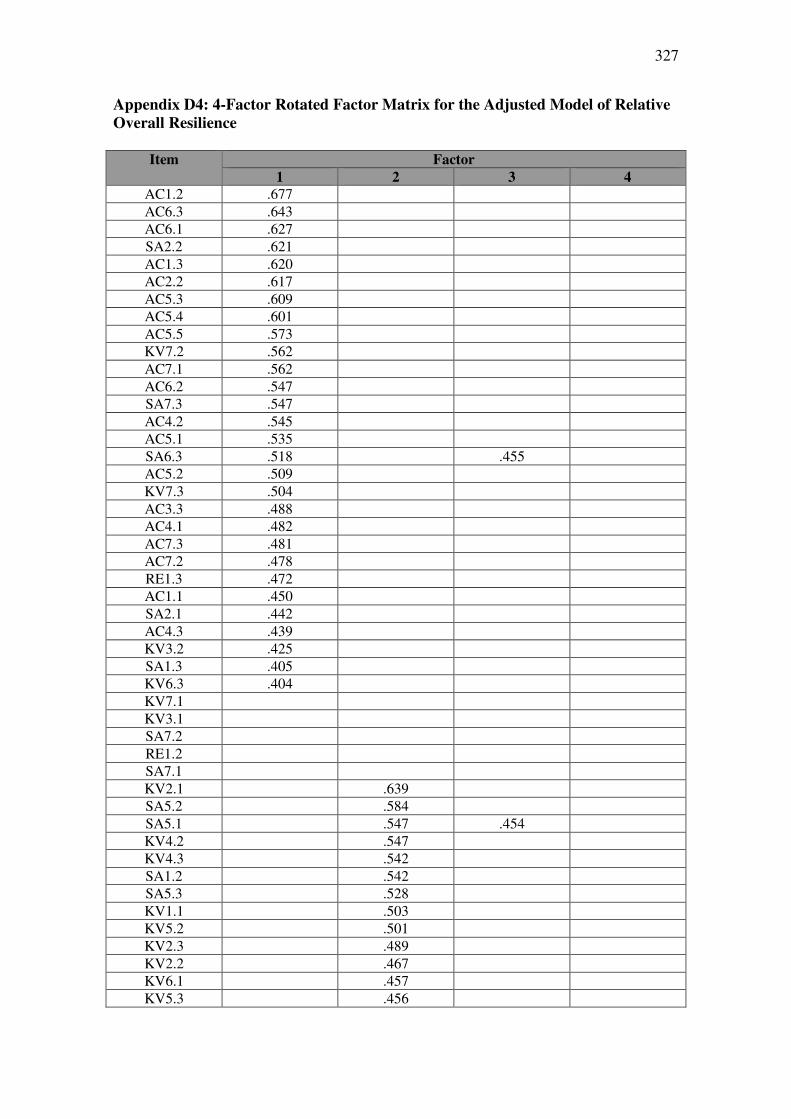
327
Appendix D4: 4-Factor Rotated Factor Matrix for the Adjusted Model of Relative
Overall Resilience
Item Factor
1 2 3 4
AC1.2 .677
AC6.3 .643
AC6.1 .627
SA2.2 .621
AC1.3 .620
AC2.2 .617
AC5.3 .609
AC5.4 .601
AC5.5 .573
KV7.2 .562
AC7.1 .562
AC6.2 .547
SA7.3 .547
AC4.2 .545
AC5.1 .535
SA6.3 .518 .455
AC5.2 .509
KV7.3 .504
AC3.3 .488
AC4.1 .482
AC7.3 .481
AC7.2 .478
RE1.3 .472
AC1.1 .450
SA2.1 .442
AC4.3 .439
KV3.2 .425
SA1.3 .405
KV6.3 .404
KV7.1
KV3.1
SA7.2
RE1.2
SA7.1
KV2.1 .639
SA5.2 .584
SA5.1 .547 .454
KV4.2 .547
KV4.3 .542
SA1.2 .542
SA5.3 .528
KV1.1 .503
KV5.2 .501
KV2.3 .489
KV2.2 .467
KV6.1 .457
KV5.3 .456
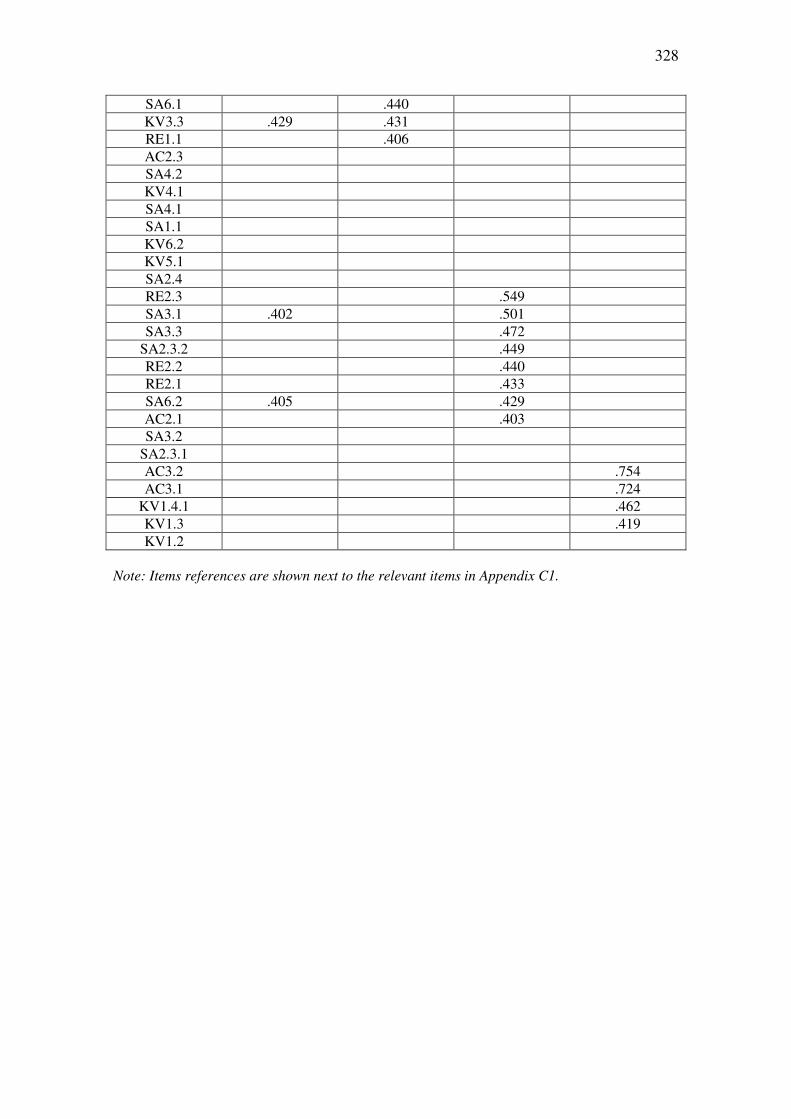
328
SA6.1 .440
KV3.3 .429 .431
RE1.1 .406
AC2.3
SA4.2
KV4.1
SA4.1
SA1.1
KV6.2
KV5.1
SA2.4
RE2.3 .549
SA3.1 .402 .501
SA3.3 .472
SA2.3.2 .449
RE2.2 .440
RE2.1 .433
SA6.2 .405 .429
AC2.1 .403
SA3.2
SA2.3.1
AC3.2 .754
AC3.1 .724
KV1.4.1 .462
KV1.3 .419
KV1.2
Note: Items references are shown next to the relevant items in Appendix C1.
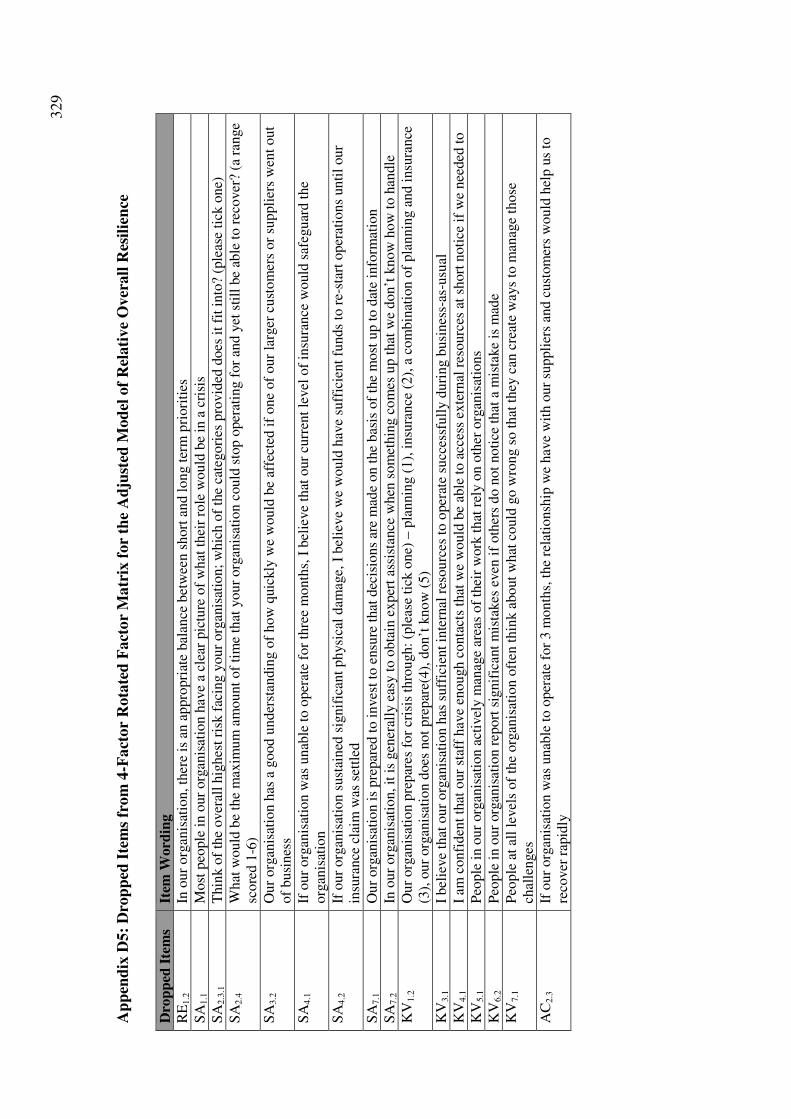
329
Ap
pen
dix
D5:
Dro
pp
ed I
tem
s fr
om
4-F
act
or
Rota
ted
Fact
or
Ma
trix
for
the
Ad
just
ed M
od
el o
f R
elati
ve
Over
all
Res
ilie
nce
Dro
pp
ed I
tem
s It
em W
ord
ing
RE
1.2
In o
ur
org
anis
atio
n, th
ere
is a
n a
ppro
pri
ate
bal
ance
bet
wee
n s
hort
and l
ong t
erm
pri
ori
ties
SA
1.1
Most
peo
ple
in o
ur
org
anis
atio
n h
ave
a cl
ear
pic
ture
of
what
thei
r ro
le w
ould
be
in a
cri
sis
SA
2.3
.1
Thin
k o
f th
e over
all
hig
hes
t ri
sk f
acin
g y
our
org
anis
atio
n;
whic
h o
f th
e ca
tegori
es p
rovid
ed d
oes
it
fit
into
? (p
leas
e ti
ck o
ne)
SA
2.4
What
would
be
the
max
imum
am
ount
of
tim
e th
at y
our
org
anis
atio
n c
ould
sto
p o
per
atin
g f
or
and y
et s
till
be
able
to r
ecover
? (a
ran
ge
score
d 1
-6)
SA
3.2
Our
org
anis
atio
n h
as a
good u
nder
stan
din
g o
f how
quic
kly
we
would
be
affe
cted
if
one
of
our
larg
er c
ust
om
ers
or
suppli
ers
wen
t out
of
busi
nes
s
SA
4.1
If o
ur
org
anis
atio
n w
as u
nab
le t
o o
per
ate
for
thre
e m
onth
s, I
bel
ieve
that
our
curr
ent
level
of
insu
rance
would
saf
eguar
d t
he
org
anis
atio
n
SA
4.2
If o
ur
org
anis
atio
n s
ust
ained
sig
nif
ican
t physi
cal
dam
age,
I b
elie
ve
we
would
hav
e su
ffic
ient
funds
to r
e-st
art
oper
atio
ns
unti
l our
insu
rance
cla
im w
as s
ettl
ed
SA
7.1
Our
org
anis
atio
n i
s pre
par
ed t
o i
nves
t to
ensu
re t
hat
dec
isio
ns
are
mad
e on t
he
bas
is o
f th
e m
ost
up t
o d
ate
info
rmat
ion
SA
7.2
In o
ur
org
anis
atio
n, it
is
gen
eral
ly e
asy t
o o
bta
in e
xper
t as
sist
ance
when
som
ethin
g c
om
es u
p t
hat
we
don’t
know
how
to h
andle
KV
1.2
Our
org
anis
atio
n p
repar
es f
or
cris
is t
hro
ugh:
(ple
ase
tick
one)
– p
lannin
g (
1),
insu
rance
(2),
a c
om
bin
atio
n o
f pla
nnin
g a
nd i
nsu
rance
(3
), o
ur
org
anis
atio
n d
oes
not
pre
par
e(4),
don’t
know
(5)
KV
3.1
I bel
ieve
that
our
org
anis
atio
n h
as s
uff
icie
nt
inte
rnal
res
ourc
es t
o o
per
ate
succ
essf
ull
y d
uri
ng b
usi
nes
s-as
-usu
al
KV
4.1
I am
confi
den
t th
at o
ur
staf
f hav
e en
ough c
onta
cts
that
we
would
be
able
to a
cces
s ex
tern
al r
esourc
es a
t sh
ort
noti
ce i
f w
e nee
ded
to
KV
5.1
Peo
ple
in o
ur
org
anis
atio
n a
ctiv
ely m
anag
e ar
eas
of
thei
r w
ork
that
rel
y o
n o
ther
org
anis
atio
ns
KV
6.2
Peo
ple
in o
ur
org
anis
atio
n r
eport
sig
nif
ican
t m
ista
kes
even
if
oth
ers
do n
ot
noti
ce t
hat
a m
ista
ke
is m
ade
KV
7.1
Peo
ple
at
all
level
s of
the
org
anis
atio
n o
ften
thin
k a
bout
what
could
go w
rong s
o t
hat
they
can
cre
ate
way
s to
man
age
those
ch
alle
nges
AC
2.3
If o
ur
org
anis
atio
n w
as u
nab
le t
o o
per
ate
for
3 m
onth
s, t
he
rela
tionsh
ip w
e hav
e w
ith o
ur
suppli
ers
and c
ust
om
ers
would
hel
p u
s to
re
cover
rap
idly
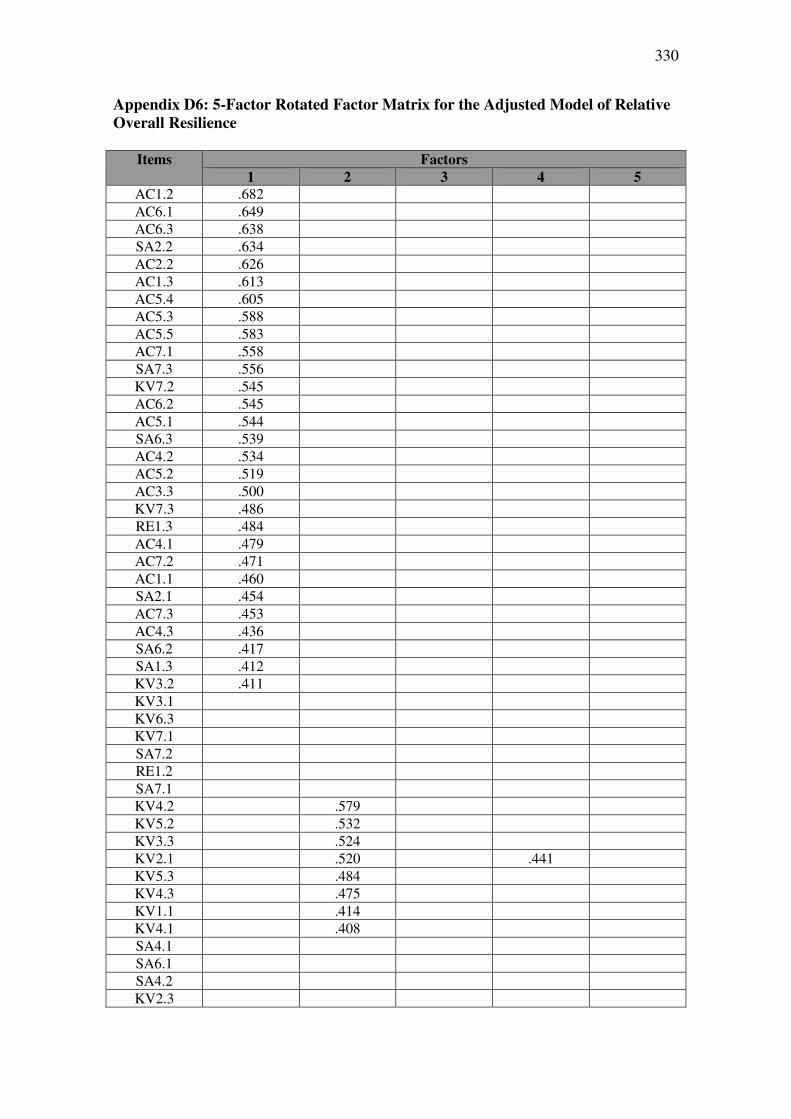
330
Appendix D6: 5-Factor Rotated Factor Matrix for the Adjusted Model of Relative
Overall Resilience
Items Factors
1 2 3 4 5
AC1.2 .682
AC6.1 .649
AC6.3 .638
SA2.2 .634
AC2.2 .626
AC1.3 .613
AC5.4 .605
AC5.3 .588
AC5.5 .583
AC7.1 .558
SA7.3 .556
KV7.2 .545
AC6.2 .545
AC5.1 .544
SA6.3 .539
AC4.2 .534
AC5.2 .519
AC3.3 .500
KV7.3 .486
RE1.3 .484
AC4.1 .479
AC7.2 .471
AC1.1 .460
SA2.1 .454
AC7.3 .453
AC4.3 .436
SA6.2 .417
SA1.3 .412
KV3.2 .411
KV3.1
KV6.3
KV7.1
SA7.2
RE1.2
SA7.1
KV4.2 .579
KV5.2 .532
KV3.3 .524
KV2.1 .520 .441
KV5.3 .484
KV4.3 .475
KV1.1 .414
KV4.1 .408
SA4.1
SA6.1
SA4.2
KV2.3
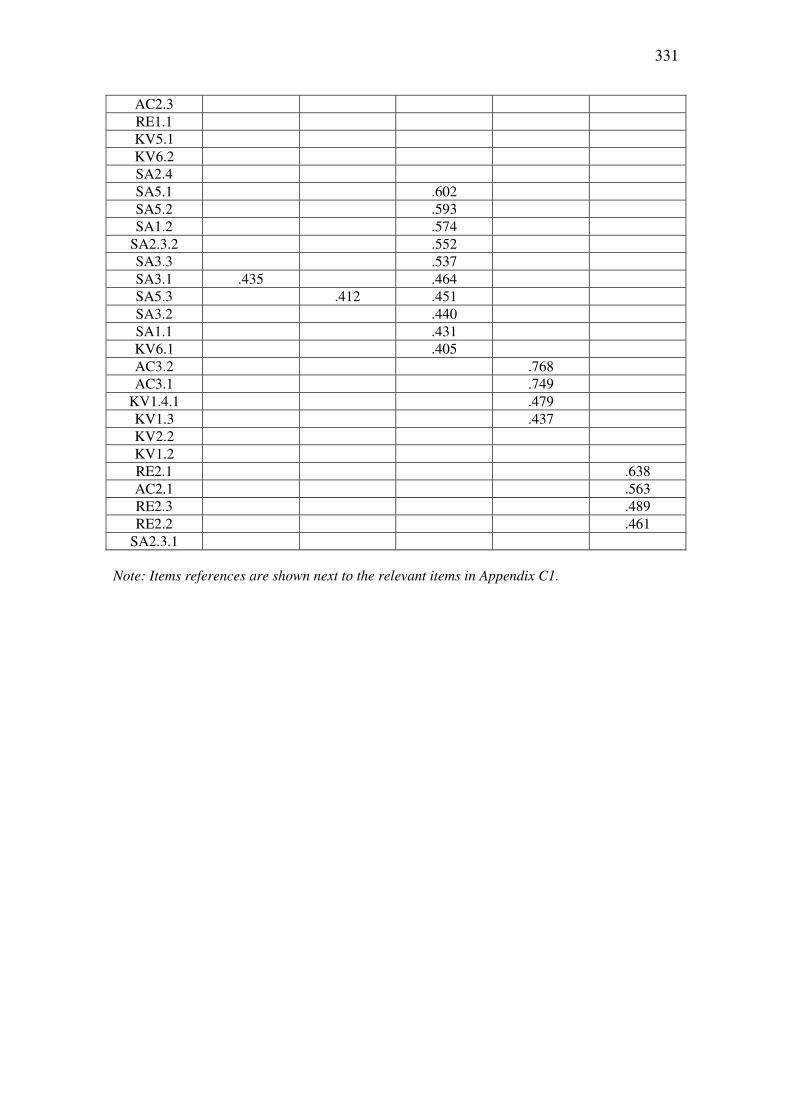
331
AC2.3
RE1.1
KV5.1
KV6.2
SA2.4
SA5.1 .602
SA5.2 .593
SA1.2 .574
SA2.3.2 .552
SA3.3 .537
SA3.1 .435 .464
SA5.3 .412 .451
SA3.2 .440
SA1.1 .431
KV6.1 .405
AC3.2 .768
AC3.1 .749
KV1.4.1 .479
KV1.3 .437
KV2.2
KV1.2
RE2.1 .638
AC2.1 .563
RE2.3 .489
RE2.2 .461
SA2.3.1
Note: Items references are shown next to the relevant items in Appendix C1.
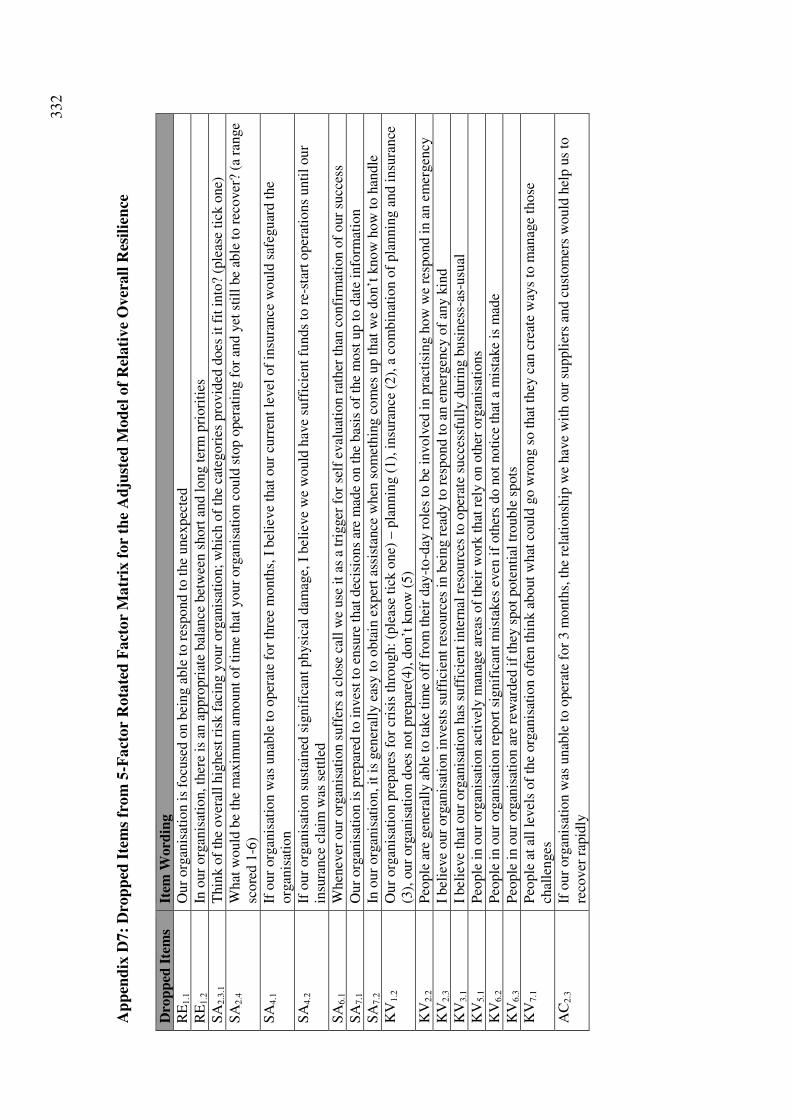
332
Ap
pen
dix
D7:
Dro
pp
ed I
tem
s fr
om
5-F
act
or
Rota
ted
Fact
or
Ma
trix
for
the
Ad
just
ed M
od
el o
f R
elati
ve
Over
all
Res
ilie
nce
Dro
pp
ed I
tem
s It
em W
ord
ing
RE
1.1
Our
org
anis
atio
n i
s fo
cuse
d o
n b
eing a
ble
to r
espond t
o t
he
unex
pec
ted
RE
1.2
In o
ur
org
anis
atio
n, th
ere
is a
n a
ppro
pri
ate
bal
ance
bet
wee
n s
hort
and l
ong t
erm
pri
ori
ties
SA
2.3
.1
Thin
k o
f th
e over
all
hig
hes
t ri
sk f
acin
g y
our
org
anis
atio
n;
whic
h o
f th
e ca
tegori
es p
rovid
ed d
oes
it
fit
into
? (p
leas
e ti
ck o
ne)
SA
2.4
What
would
be
the
max
imum
am
ount
of
tim
e th
at y
our
org
anis
atio
n c
ould
sto
p o
per
atin
g f
or
and y
et s
till
be
able
to r
ecover
? (a
ran
ge
score
d 1
-6)
SA
4.1
If o
ur
org
anis
atio
n w
as u
nab
le t
o o
per
ate
for
thre
e m
onth
s, I
bel
ieve
that
our
curr
ent
level
of
insu
rance
would
saf
eguar
d t
he
org
anis
atio
n
SA
4.2
If o
ur
org
anis
atio
n s
ust
ained
sig
nif
ican
t physi
cal
dam
age,
I b
elie
ve
we
would
hav
e su
ffic
ient
funds
to r
e-st
art
oper
atio
ns
unti
l our
insu
rance
cla
im w
as s
ettl
ed
SA
6.1
When
ever
our
org
anis
atio
n s
uff
ers
a cl
ose
cal
l w
e use
it
as a
tri
gger
for
self
eval
uat
ion r
ather
than
confi
rmat
ion o
f our
succ
ess
SA
7.1
Our
org
anis
atio
n i
s pre
par
ed t
o i
nves
t to
ensu
re t
hat
dec
isio
ns
are
mad
e on t
he
bas
is o
f th
e m
ost
up t
o d
ate
info
rmat
ion
SA
7.2
In o
ur
org
anis
atio
n, it
is
gen
eral
ly e
asy t
o o
bta
in e
xper
t as
sist
ance
when
som
ethin
g c
om
es u
p t
hat
we
don’t
know
how
to h
andle
KV
1.2
Our
org
anis
atio
n p
repar
es f
or
cris
is t
hro
ugh:
(ple
ase
tick
one)
– p
lannin
g (
1),
insu
rance
(2),
a c
om
bin
atio
n o
f pla
nnin
g a
nd i
nsu
rance
(3
), o
ur
org
anis
atio
n d
oes
not
pre
par
e(4),
don’t
know
(5)
KV
2.2
Peo
ple
are
gen
eral
ly a
ble
to t
ake
tim
e off
fro
m t
hei
r day
-to
-day
role
s to
be
involv
ed i
n p
ract
isin
g h
ow
we
resp
ond i
n a
n e
mer
gen
cy
KV
2.3
I bel
ieve
our
org
anis
atio
n i
nves
ts s
uff
icie
nt
reso
urc
es i
n b
eing r
eady t
o r
espond t
o a
n e
mer
gen
cy o
f an
y k
ind
KV
3.1
I bel
ieve
that
our
org
anis
atio
n h
as s
uff
icie
nt
inte
rnal
res
ourc
es t
o o
per
ate
succ
essf
ull
y d
uri
ng b
usi
nes
s-as
-usu
al
KV
5.1
Peo
ple
in o
ur
org
anis
atio
n a
ctiv
ely m
anag
e ar
eas
of
thei
r w
ork
that
rel
y o
n o
ther
org
anis
atio
ns
KV
6.2
Peo
ple
in o
ur
org
anis
atio
n r
eport
sig
nif
ican
t m
ista
kes
even
if
oth
ers
do n
ot
noti
ce t
hat
a m
ista
ke
is m
ade
KV
6.3
Peo
ple
in o
ur
org
anis
atio
n a
re r
ewar
ded
if
they
spot
pote
nti
al t
rouble
spots
KV
7.1
Peo
ple
at
all
level
s of
the
org
anis
atio
n o
ften
thin
k a
bout
what
could
go w
rong s
o t
hat
they
can
cre
ate
way
s to
man
age
those
ch
alle
nges
AC
2.3
If o
ur
org
anis
atio
n w
as u
nab
le t
o o
per
ate
for
3 m
onth
s, t
he
rela
tionsh
ip w
e hav
e w
ith o
ur
suppli
ers
and c
ust
om
ers
would
hel
p u
s to
re
cover
rap
idly
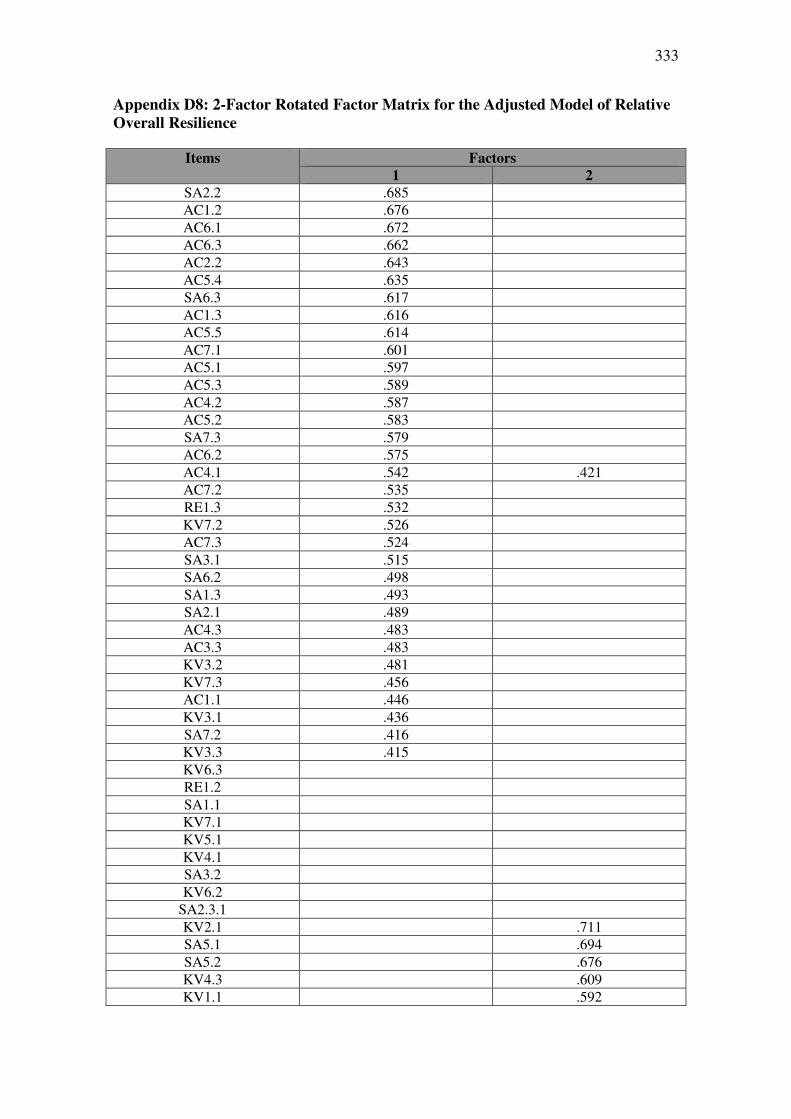
333
Appendix D8: 2-Factor Rotated Factor Matrix for the Adjusted Model of Relative
Overall Resilience
Items Factors
1 2
SA2.2 .685
AC1.2 .676
AC6.1 .672
AC6.3 .662
AC2.2 .643
AC5.4 .635
SA6.3 .617
AC1.3 .616
AC5.5 .614
AC7.1 .601
AC5.1 .597
AC5.3 .589
AC4.2 .587
AC5.2 .583
SA7.3 .579
AC6.2 .575
AC4.1 .542 .421
AC7.2 .535
RE1.3 .532
KV7.2 .526
AC7.3 .524
SA3.1 .515
SA6.2 .498
SA1.3 .493
SA2.1 .489
AC4.3 .483
AC3.3 .483
KV3.2 .481
KV7.3 .456
AC1.1 .446
KV3.1 .436
SA7.2 .416
KV3.3 .415
KV6.3
RE1.2
SA1.1
KV7.1
KV5.1
KV4.1
SA3.2
KV6.2
SA2.3.1
KV2.1 .711
SA5.1 .694
SA5.2 .676
KV4.3 .609
KV1.1 .592
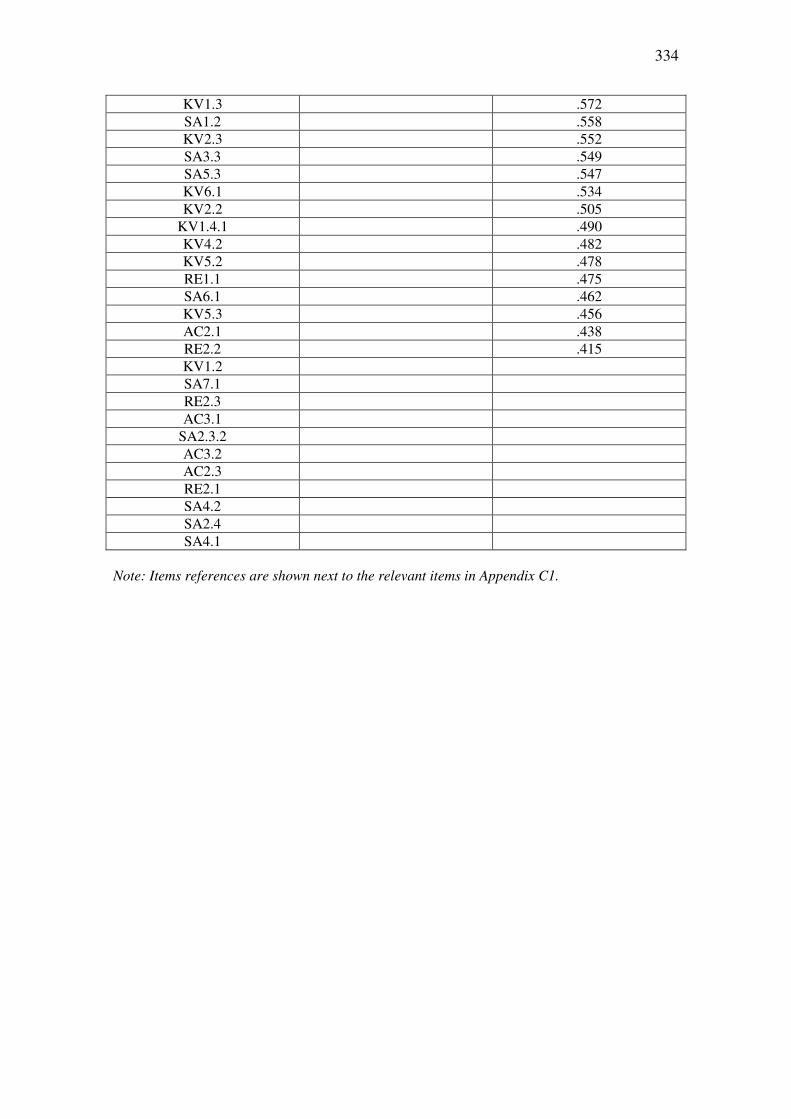
334
KV1.3 .572
SA1.2 .558
KV2.3 .552
SA3.3 .549
SA5.3 .547
KV6.1 .534
KV2.2 .505
KV1.4.1 .490
KV4.2 .482
KV5.2 .478
RE1.1 .475
SA6.1 .462
KV5.3 .456
AC2.1 .438
RE2.2 .415
KV1.2
SA7.1
RE2.3
AC3.1
SA2.3.2
AC3.2
AC2.3
RE2.1
SA4.2
SA2.4
SA4.1
Note: Items references are shown next to the relevant items in Appendix C1.
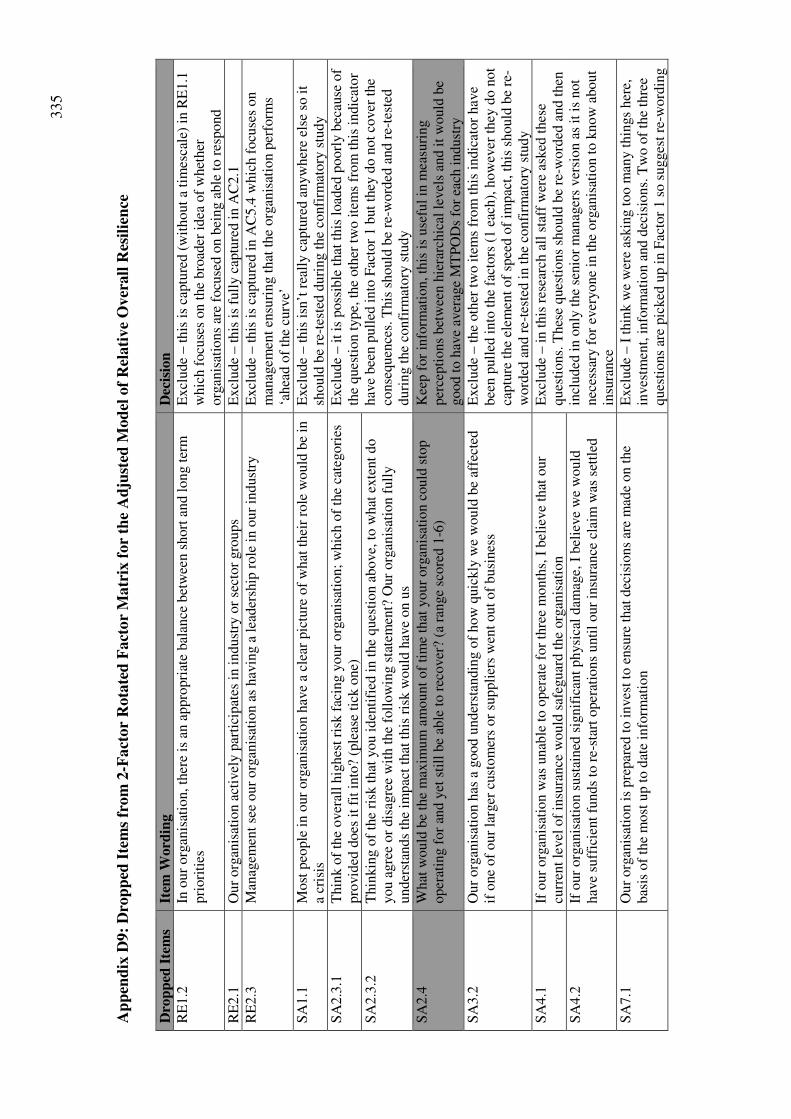
335
Ap
pen
dix
D9:
Dro
pp
ed I
tem
s fr
om
2-F
act
or
Rota
ted
Fact
or
Ma
trix
for
the
Ad
just
ed M
od
el o
f R
elati
ve
Over
all
Res
ilie
nce
Dro
pp
ed I
tem
s It
em W
ord
ing
Dec
isio
n
RE
1.2
In
our
org
anis
atio
n, th
ere
is a
n a
ppro
pri
ate
bal
ance
bet
wee
n s
hort
and l
ong t
erm
pri
ori
ties
E
xcl
ude
– t
his
is
captu
red (
wit
hout
a ti
mes
cale
) in
RE
1.1
w
hic
h f
ocu
ses
on t
he
bro
ader
idea
of
whet
her
org
anis
atio
ns
are
focu
sed o
n b
eing a
ble
to r
espond
RE
2.1
O
ur
org
anis
atio
n a
ctiv
ely p
arti
cipat
es i
n i
ndust
ry o
r se
ctor
gro
ups
Excl
ude
– t
his
is
full
y c
aptu
red i
n A
C2.1
RE
2.3
M
anag
emen
t se
e our
org
anis
atio
n a
s hav
ing a
lea
der
ship
role
in o
ur
indust
ry
Excl
ude
– t
his
is
captu
red i
n A
C5.4
whic
h f
ocu
ses
on
man
agem
ent
ensu
ring t
hat
the
org
anis
atio
n p
erfo
rms
‘ahea
d o
f th
e cu
rve’
SA
1.1
M
ost
peo
ple
in o
ur
org
anis
atio
n h
ave
a cl
ear
pic
ture
of
what
thei
r ro
le w
ould
be
in
a cr
isis
E
xcl
ude
– t
his
isn
’t r
eall
y c
aptu
red a
nyw
her
e el
se s
o i
t sh
ould
be
re-t
este
d d
uri
ng t
he
confi
rmat
ory
stu
dy
SA
2.3
.1
Thin
k o
f th
e over
all
hig
hes
t ri
sk f
acin
g y
our
org
anis
atio
n;
whic
h o
f th
e ca
tegori
es
pro
vid
ed d
oes
it
fit
into
? (p
leas
e ti
ck o
ne)
E
xcl
ude
– i
t is
poss
ible
that
this
load
ed p
oorl
y b
ecau
se o
f th
e ques
tion t
ype,
the
oth
er t
wo i
tem
s fr
om
this
indic
ator
hav
e bee
n p
ull
ed i
nto
Fac
tor
1 b
ut
they
do n
ot
cover
the
conse
quen
ces.
This
should
be
re-w
ord
ed a
nd r
e-te
sted
duri
ng t
he
confi
rmat
ory
stu
dy
SA
2.3
.2
Thin
kin
g o
f th
e ri
sk t
hat
you i
den
tifi
ed i
n t
he
ques
tion a
bove,
to w
hat
exte
nt
do
you a
gre
e or
dis
agre
e w
ith t
he
foll
ow
ing s
tate
men
t? O
ur
org
anis
atio
n f
ull
y
under
stan
ds
the
impac
t th
at t
his
ris
k w
ould
hav
e on u
s
SA
2.4
W
hat
would
be
the
max
imum
am
ount
of
tim
e th
at y
our
org
anis
atio
n c
ould
sto
p
oper
atin
g f
or
and y
et s
till
be
able
to r
ecover
? (a
ran
ge
score
d 1
-6)
Kee
p f
or
info
rmat
ion, th
is i
s use
ful
in m
easu
ring
per
cepti
ons
bet
wee
n h
iera
rchic
al l
evel
s an
d i
t w
ould
be
good t
o h
ave
aver
age
MT
PO
Ds
for
each
indust
ry
SA
3.2
O
ur
org
anis
atio
n h
as a
good u
nder
stan
din
g o
f how
quic
kly
we
would
be
affe
cted
if
one
of
our
larg
er c
ust
om
ers
or
suppli
ers
wen
t out
of
busi
nes
s E
xcl
ude
– t
he
oth
er t
wo i
tem
s fr
om
this
indic
ator
hav
e bee
n p
ull
ed i
nto
the
fact
ors
(1 e
ach),
how
ever
they
do n
ot
captu
re t
he
elem
ent
of
spee
d o
f im
pac
t, t
his
should
be
re-
word
ed a
nd r
e-te
sted
in t
he
confi
rmat
ory
stu
dy
SA
4.1
If
our
org
anis
atio
n w
as u
nab
le t
o o
per
ate
for
thre
e m
onth
s, I
bel
ieve
that
our
curr
ent
level
of
insu
rance
would
saf
eguar
d t
he
org
anis
atio
n
Excl
ude
– i
n t
his
res
earc
h a
ll s
taff
wer
e as
ked
thes
e ques
tions.
Thes
e ques
tions
should
be
re-w
ord
ed a
nd t
hen
in
cluded
in o
nly
the
senio
r m
anag
ers
ver
sion a
s it
is
not
nec
essa
ry f
or
ever
yone
in t
he
org
anis
atio
n t
o k
now
about
insu
rance
SA
4.2
If
our
org
anis
atio
n s
ust
ained
sig
nif
ican
t physi
cal
dam
age,
I b
elie
ve
we
would
hav
e su
ffic
ient
funds
to r
e-st
art
oper
atio
ns
unti
l our
insu
rance
cla
im w
as s
ettl
ed
SA
7.1
O
ur
org
anis
atio
n i
s pre
par
ed t
o i
nves
t to
ensu
re t
hat
dec
isio
ns
are
mad
e on t
he
bas
is o
f th
e m
ost
up t
o d
ate
info
rmat
ion
Excl
ude
– I
thin
k w
e w
ere
askin
g t
oo m
any t
hin
gs
her
e,
inves
tmen
t, i
nfo
rmat
ion a
nd d
ecis
ions.
Tw
o o
f th
e th
ree
ques
tions
are
pic
ked
up i
n F
acto
r 1 s
o s
ugges
t re
-word
ing
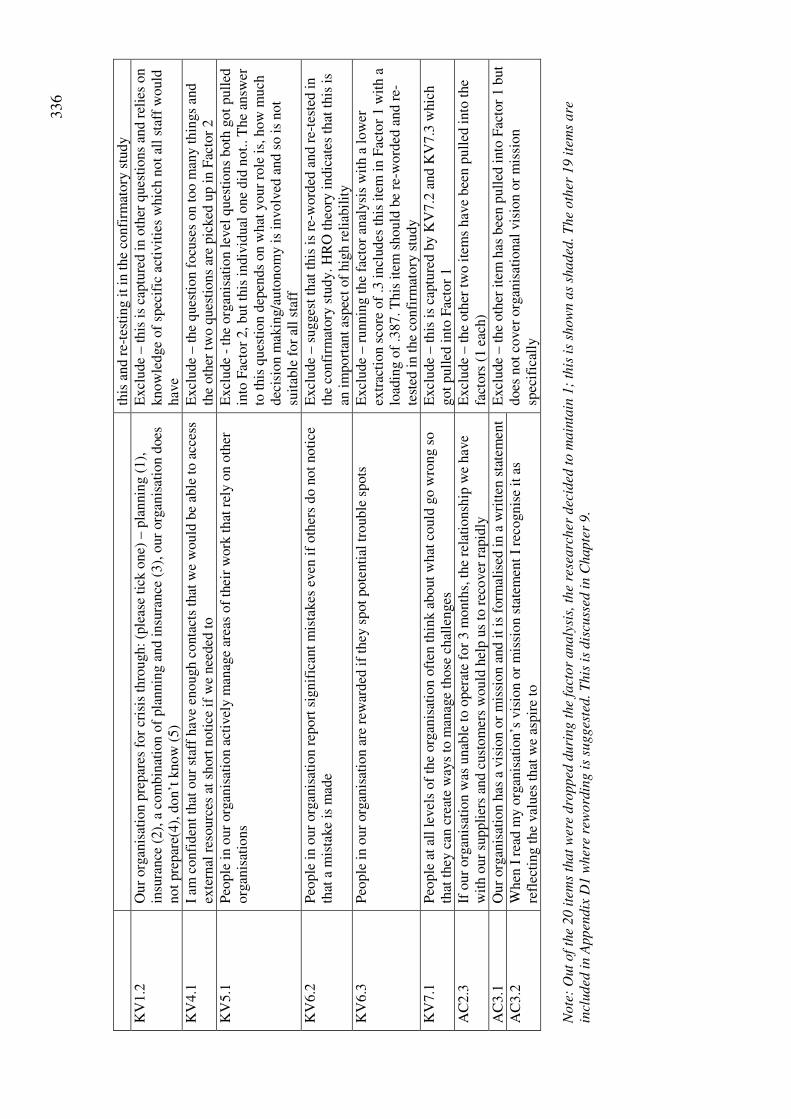
336
Note
: O
ut
of
the
20 i
tem
s th
at
wer
e dro
pped
duri
ng t
he
fact
or
analy
sis,
the
rese
arc
her
dec
ided
to m
ain
tain
1;
this
is
show
n a
s sh
aded
. T
he
oth
er 1
9 i
tem
s are
in
cluded
in A
ppen
dix
D1 w
her
e re
word
ing i
s su
gges
ted. T
his
is
dis
cuss
ed i
n C
hapte
r 9.
this
and r
e-te
stin
g i
t in
the
confi
rmat
ory
stu
dy
KV
1.2
O
ur
org
anis
atio
n p
repar
es f
or
cris
is t
hro
ugh:
(ple
ase
tick
one)
– p
lannin
g (
1),
in
sura
nce
(2),
a c
om
bin
atio
n o
f pla
nnin
g a
nd i
nsu
rance
(3),
our
org
anis
atio
n d
oes
not
pre
par
e(4),
don’t
know
(5)
Excl
ude
– t
his
is
captu
red i
n o
ther
ques
tions
and r
elie
s on
know
ledge
of
spec
ific
act
ivit
ies
whic
h n
ot
all
staf
f w
ould
hav
e
KV
4.1
I
am c
onfi
den
t th
at o
ur
staf
f hav
e en
ough c
onta
cts
that
we
would
be
able
to a
cces
s ex
tern
al r
esourc
es a
t sh
ort
noti
ce i
f w
e nee
ded
to
Excl
ude
– t
he
ques
tion f
ocu
ses
on t
oo m
any t
hin
gs
and
the
oth
er t
wo q
ues
tions
are
pic
ked
up i
n F
acto
r 2
KV
5.1
P
eople
in o
ur
org
anis
atio
n a
ctiv
ely m
anag
e ar
eas
of
thei
r w
ork
that
rel
y o
n o
ther
org
anis
atio
ns
Excl
ude
- th
e org
anis
atio
n l
evel
ques
tions
both
got
pull
ed
into
Fac
tor
2, but
this
indiv
idual
one
did
not.
. T
he
answ
er
to t
his
ques
tion d
epen
ds
on w
hat
your
role
is,
how
much
dec
isio
n m
akin
g/a
uto
nom
y i
s in
volv
ed a
nd s
o i
s not
suit
able
for
all
staf
f
KV
6.2
P
eople
in o
ur
org
anis
atio
n r
eport
sig
nif
ican
t m
ista
kes
even
if
oth
ers
do n
ot
noti
ce
that
a m
ista
ke
is m
ade
Excl
ude
– s
ugges
t th
at t
his
is
re-w
ord
ed a
nd r
e-te
sted
in
the
confi
rmat
ory
stu
dy. H
RO
theo
ry i
ndic
ates
that
this
is
an i
mport
ant
aspec
t of
hig
h r
elia
bil
ity
KV
6.3
P
eople
in o
ur
org
anis
atio
n a
re r
ewar
ded
if
they
spot
pote
nti
al t
rouble
spots
E
xcl
ude
– r
unnin
g t
he
fact
or
anal
ysi
s w
ith a
low
er
extr
acti
on s
core
of
.3 i
ncl
udes
this
ite
m i
n F
acto
r 1 w
ith a
lo
adin
g o
f .3
87. T
his
ite
m s
hould
be
re-w
ord
ed a
nd r
e-te
sted
in t
he
confi
rmat
ory
stu
dy
KV
7.1
P
eople
at
all
level
s of
the
org
anis
atio
n o
ften
thin
k a
bout
what
could
go w
rong s
o
that
they
can
cre
ate
way
s to
man
age
those
chal
lenges
E
xcl
ude
– t
his
is
captu
red b
y K
V7.2
and K
V7.3
whic
h
got
pull
ed i
nto
Fac
tor
1
AC
2.3
If
our
org
anis
atio
n w
as u
nab
le t
o o
per
ate
for
3 m
onth
s, t
he
rela
tionsh
ip w
e hav
e w
ith o
ur
suppli
ers
and c
ust
om
ers
would
hel
p u
s to
rec
over
rap
idly
E
xcl
ude
– t
he
oth
er t
wo i
tem
s hav
e bee
n p
ull
ed i
nto
the
fact
ors
(1 e
ach)
AC
3.1
O
ur
org
anis
atio
n h
as a
vis
ion o
r m
issi
on a
nd i
t is
form
alis
ed i
n a
wri
tten
sta
tem
ent
Excl
ude
– t
he
oth
er i
tem
has
bee
n p
ull
ed i
nto
Fac
tor
1 b
ut
does
not
cover
org
anis
atio
nal
vis
ion o
r m
issi
on
spec
ific
ally
A
C3.2
W
hen
I r
ead m
y o
rgan
isat
ion’s
vis
ion o
r m
issi
on s
tate
men
t I
reco
gnis
e it
as
refl
ecti
ng t
he
val
ues
that
we
aspir
e to
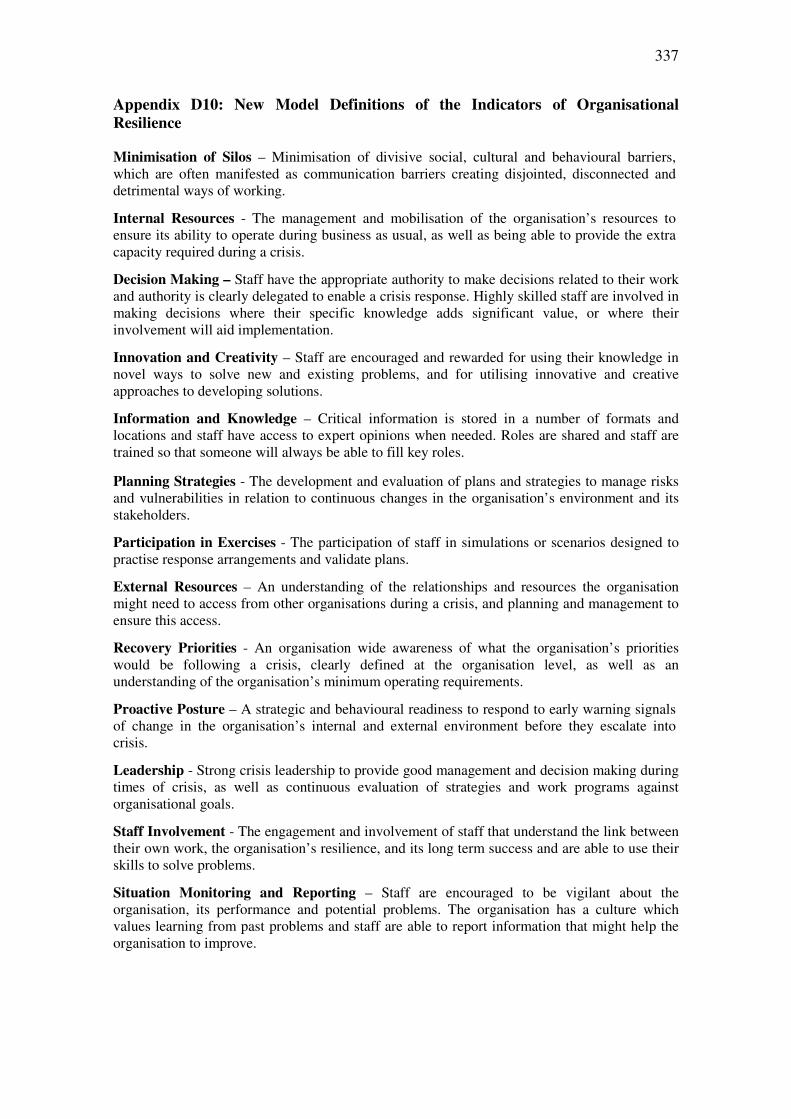
337
Appendix D10: New Model Definitions of the Indicators of Organisational
Resilience Minimisation of Silos – Minimisation of divisive social, cultural and behavioural barriers, which are often manifested as communication barriers creating disjointed, disconnected and detrimental ways of working.
Internal Resources - The management and mobilisation of the organisation’s resources to ensure its ability to operate during business as usual, as well as being able to provide the extra capacity required during a crisis.
Decision Making – Staff have the appropriate authority to make decisions related to their work and authority is clearly delegated to enable a crisis response. Highly skilled staff are involved in making decisions where their specific knowledge adds significant value, or where their involvement will aid implementation.
Innovation and Creativity – Staff are encouraged and rewarded for using their knowledge in novel ways to solve new and existing problems, and for utilising innovative and creative approaches to developing solutions.
Information and Knowledge – Critical information is stored in a number of formats and locations and staff have access to expert opinions when needed. Roles are shared and staff are trained so that someone will always be able to fill key roles.
Planning Strategies - The development and evaluation of plans and strategies to manage risks and vulnerabilities in relation to continuous changes in the organisation’s environment and its stakeholders.
Participation in Exercises - The participation of staff in simulations or scenarios designed to practise response arrangements and validate plans.
External Resources – An understanding of the relationships and resources the organisation might need to access from other organisations during a crisis, and planning and management to ensure this access.
Recovery Priorities - An organisation wide awareness of what the organisation’s priorities would be following a crisis, clearly defined at the organisation level, as well as an understanding of the organisation’s minimum operating requirements.
Proactive Posture – A strategic and behavioural readiness to respond to early warning signals of change in the organisation’s internal and external environment before they escalate into crisis.
Leadership - Strong crisis leadership to provide good management and decision making during times of crisis, as well as continuous evaluation of strategies and work programs against organisational goals.
Staff Involvement - The engagement and involvement of staff that understand the link between their own work, the organisation’s resilience, and its long term success and are able to use their skills to solve problems.
Situation Monitoring and Reporting – Staff are encouraged to be vigilant about the organisation, its performance and potential problems. The organisation has a culture which values learning from past problems and staff are able to report information that might help the organisation to improve.

338
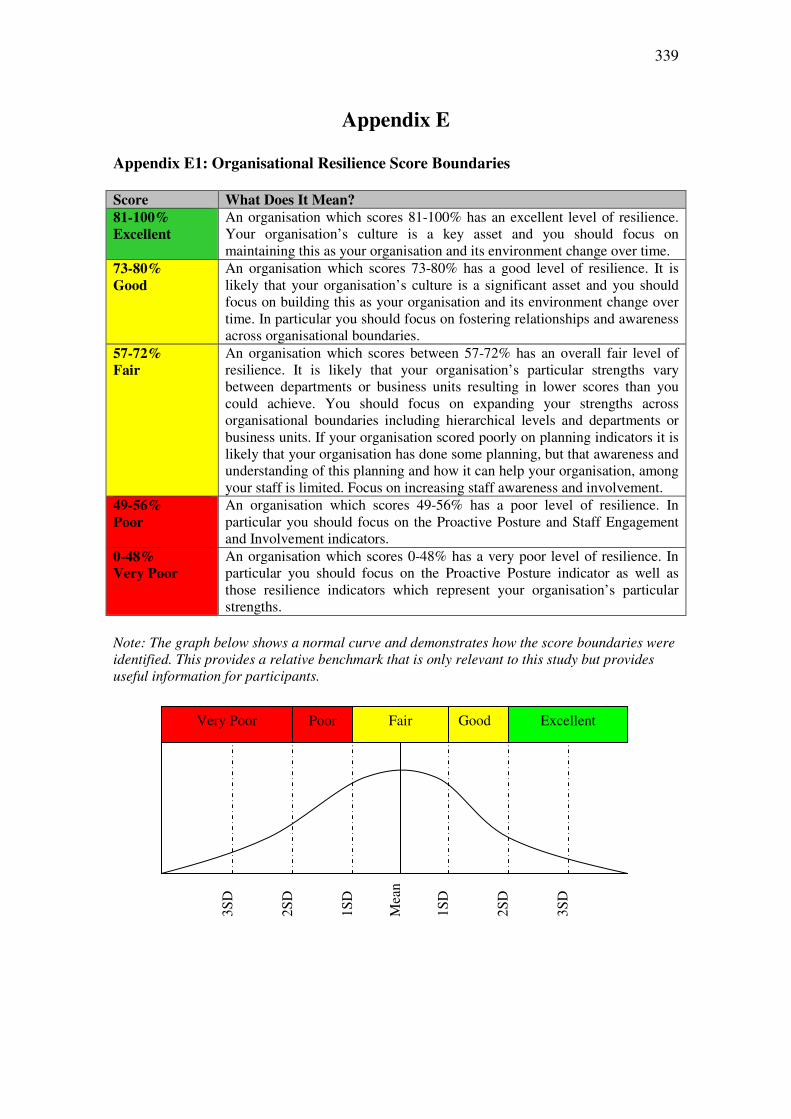
339
Appendix E Appendix E1: Organisational Resilience Score Boundaries
Score What Does It Mean?
81-100%
Excellent
An organisation which scores 81-100% has an excellent level of resilience. Your organisation’s culture is a key asset and you should focus on maintaining this as your organisation and its environment change over time.
73-80%
Good
An organisation which scores 73-80% has a good level of resilience. It is likely that your organisation’s culture is a significant asset and you should focus on building this as your organisation and its environment change over time. In particular you should focus on fostering relationships and awareness across organisational boundaries.
57-72%
Fair
An organisation which scores between 57-72% has an overall fair level of resilience. It is likely that your organisation’s particular strengths vary between departments or business units resulting in lower scores than you could achieve. You should focus on expanding your strengths across organisational boundaries including hierarchical levels and departments or business units. If your organisation scored poorly on planning indicators it is likely that your organisation has done some planning, but that awareness and understanding of this planning and how it can help your organisation, among your staff is limited. Focus on increasing staff awareness and involvement.
49-56%
Poor
An organisation which scores 49-56% has a poor level of resilience. In particular you should focus on the Proactive Posture and Staff Engagement and Involvement indicators.
0-48%
Very Poor
An organisation which scores 0-48% has a very poor level of resilience. In particular you should focus on the Proactive Posture indicator as well as those resilience indicators which represent your organisation’s particular strengths.
Note: The graph below shows a normal curve and demonstrates how the score boundaries were identified. This provides a relative benchmark that is only relevant to this study but provides useful information for participants.
Fair Good Excellent Poor Very Poor
Mea
n
1S
D
1S
D
2S
D
2S
D
3S
D
3S
D
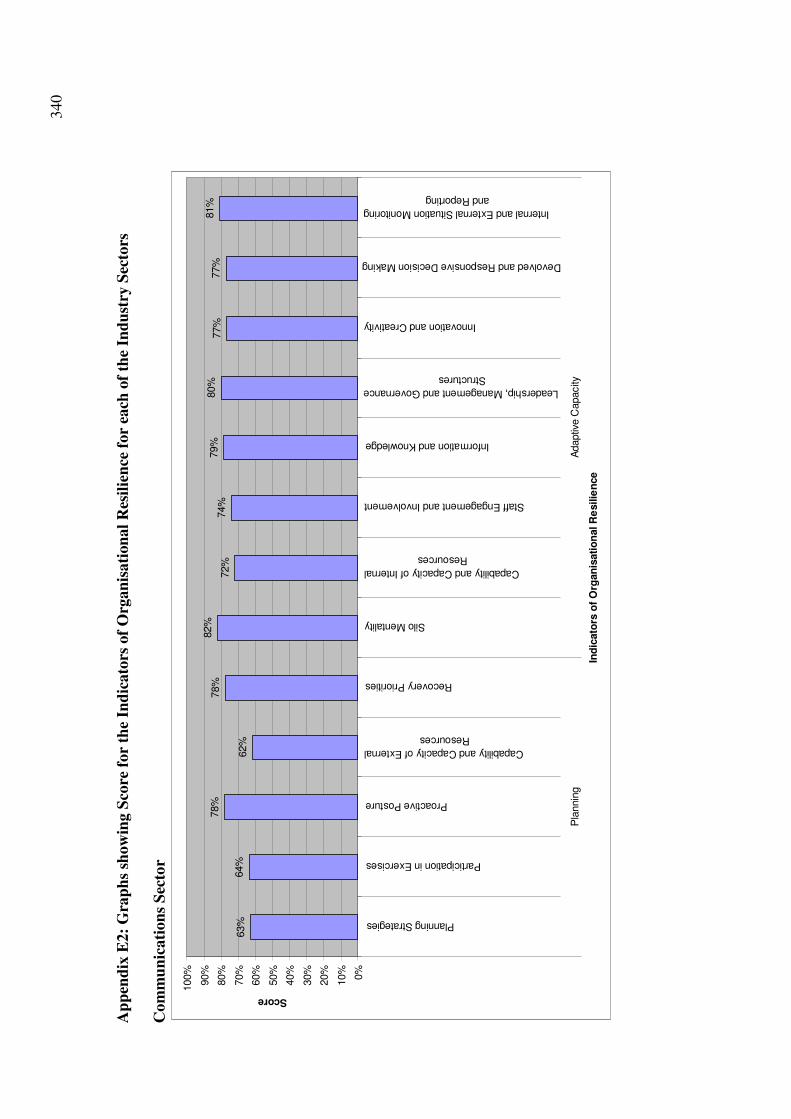
340
Ap
pen
dix
E2:
Gra
ph
s sh
ow
ing S
core
for
the
Ind
icato
rs o
f O
rgan
isati
on
al
Res
ilie
nce
for
each
of
the
Ind
ust
ry S
ecto
rs
Co
mm
un
icati
on
s S
ecto
r
63%
64%
78%
62%
78%
82%
72%
74%
79%
80%
77%
77%
81%
0%
10%
20%
30%
40%
50%
60%
70%
80%
90%
100%
Planning Strategies
Participation in Exercises
Proactive Posture
Capability and Capacity of External
Resources
Recovery Priorities
Silo Mentality
Capability and Capacity of Internal
Resources
Staff Engagement and Involvement
Information and Knowledge
Leadership, Management and Governance
Structures
Innovation and Creativity
Devolved and Responsive Decision Making
Internal and External Situation Monitoring
and Reporting
Pla
nnin
gA
daptiv
e C
apacity
Ind
icato
rs o
f O
rgan
isati
on
al R
esilie
nce
Score
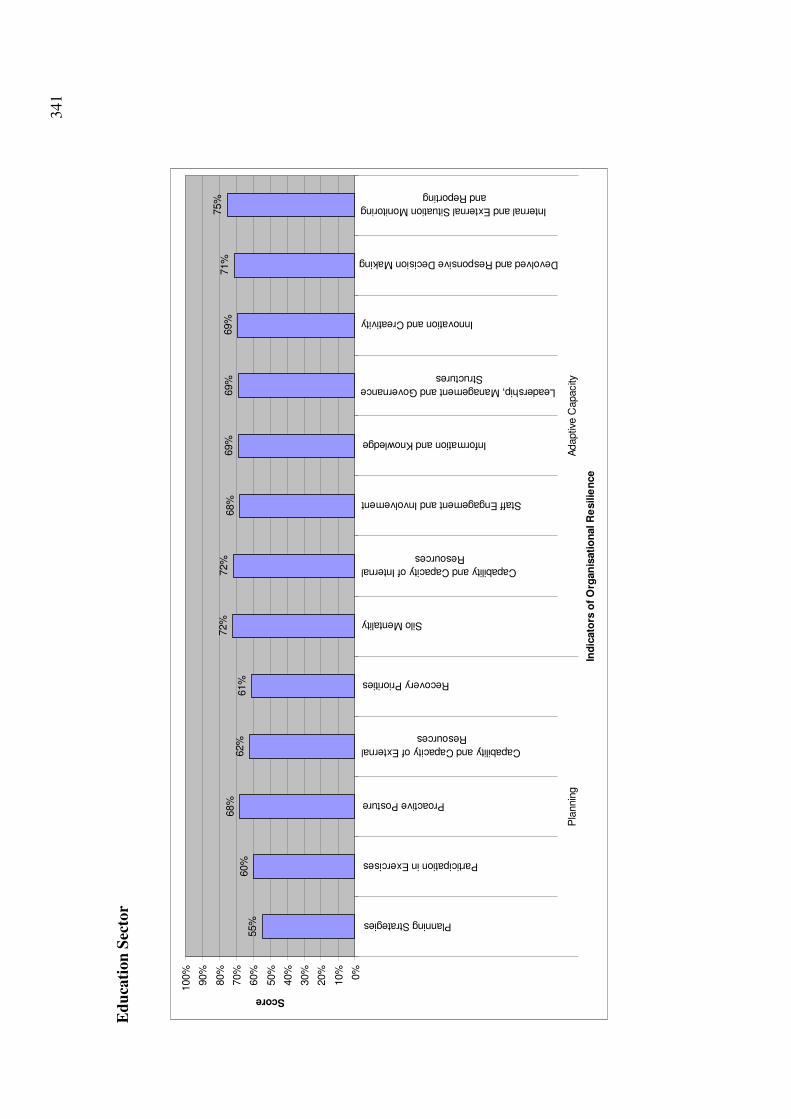
341
Ed
uca
tion
Sec
tor
55%
60%
68%
62%
61%
72%
72%
68%
69%
69%
69%
71%
75%
0%
10%
20%
30%
40%
50%
60%
70%
80%
90%
100%
Planning Strategies
Participation in Exercises
Proactive Posture
Capability and Capacity of External
Resources
Recovery Priorities
Silo Mentality
Capability and Capacity of Internal
Resources
Staff Engagement and Involvement
Information and Knowledge
Leadership, Management and Governance
Structures
Innovation and Creativity
Devolved and Responsive Decision Making
Internal and External Situation Monitoring
and Reporting
Pla
nnin
gA
daptiv
e C
apacity
Ind
icato
rs o
f O
rgan
isati
on
al R
esilie
nce
Score
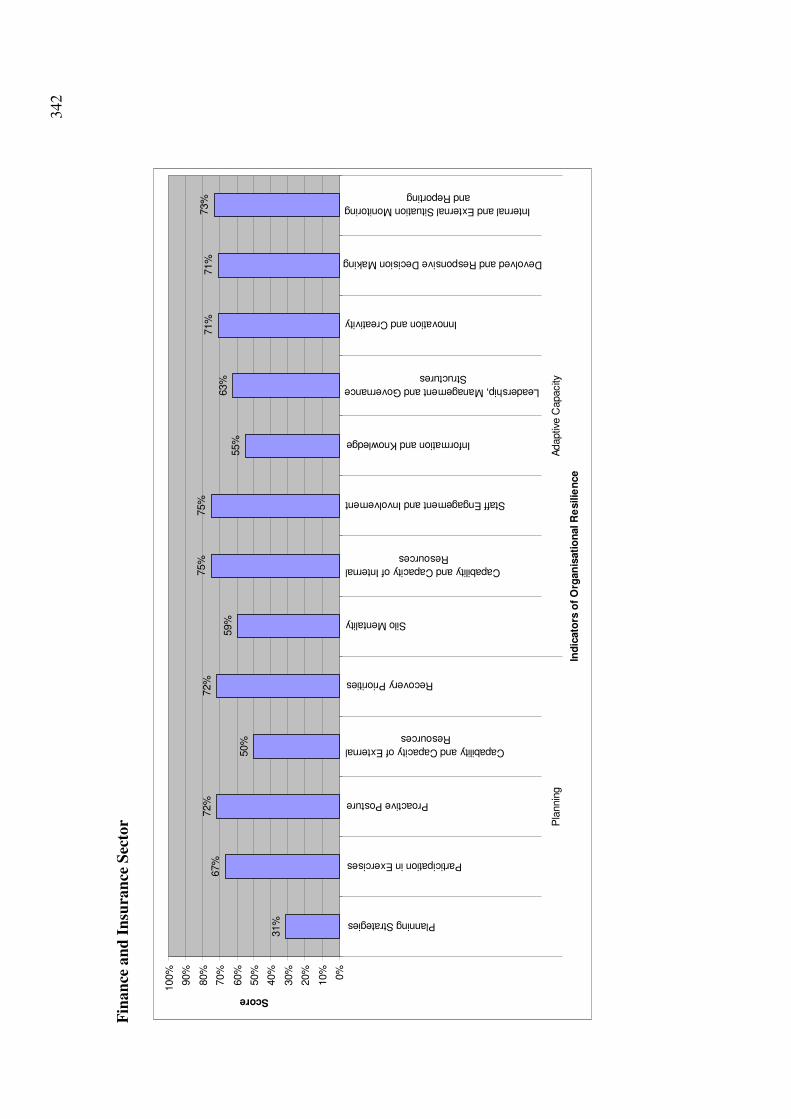
342
Fin
an
ce a
nd
In
sura
nce
Sec
tor
31%
67%
72%
50%
72%
59%
75%
75%
55%
63%
71%
71%
73%
0%
10%
20%
30%
40%
50%
60%
70%
80%
90%
100%
Planning Strategies
Participation in Exercises
Proactive Posture
Capability and Capacity of External
Resources
Recovery Priorities
Silo Mentality
Capability and Capacity of Internal
Resources
Staff Engagement and Involvement
Information and Knowledge
Leadership, Management and Governance
Structures
Innovation and Creativity
Devolved and Responsive Decision Making
Internal and External Situation Monitoring
and Reporting
Pla
nnin
gA
daptiv
e C
apacity
Ind
icato
rs o
f O
rgan
isati
on
al R
esilie
nce
Score
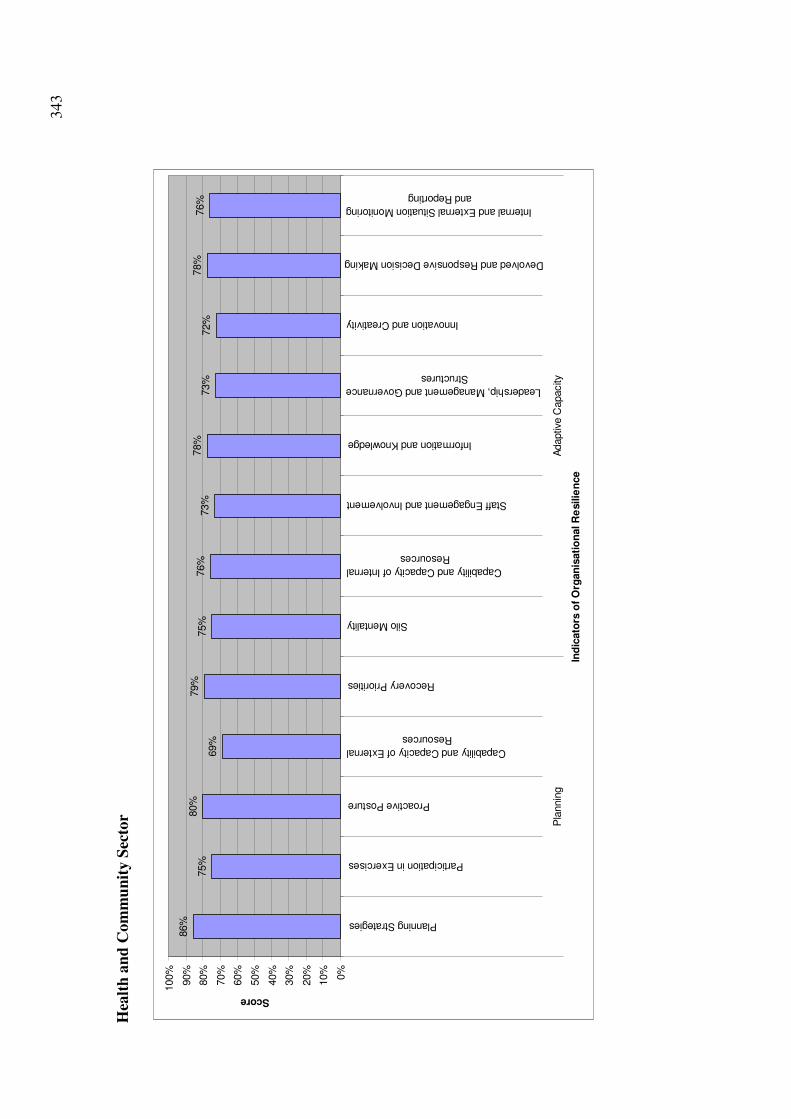
343
Hea
lth
an
d C
om
mu
nit
y S
ecto
r
86%
75%
80%
69%
79%
75%
76%
73%
78%
73%
72%
78%
76%
0%
10%
20%
30%
40%
50%
60%
70%
80%
90%
100%
Planning Strategies
Participation in Exercises
Proactive Posture
Capability and Capacity of External
Resources
Recovery Priorities
Silo Mentality
Capability and Capacity of Internal
Resources
Staff Engagement and Involvement
Information and Knowledge
Leadership, Management and Governance
Structures
Innovation and Creativity
Devolved and Responsive Decision Making
Internal and External Situation Monitoring
and Reporting
Pla
nnin
gA
daptiv
e C
apacity
Ind
icato
rs o
f O
rgan
isati
on
al R
esilie
nce
Score
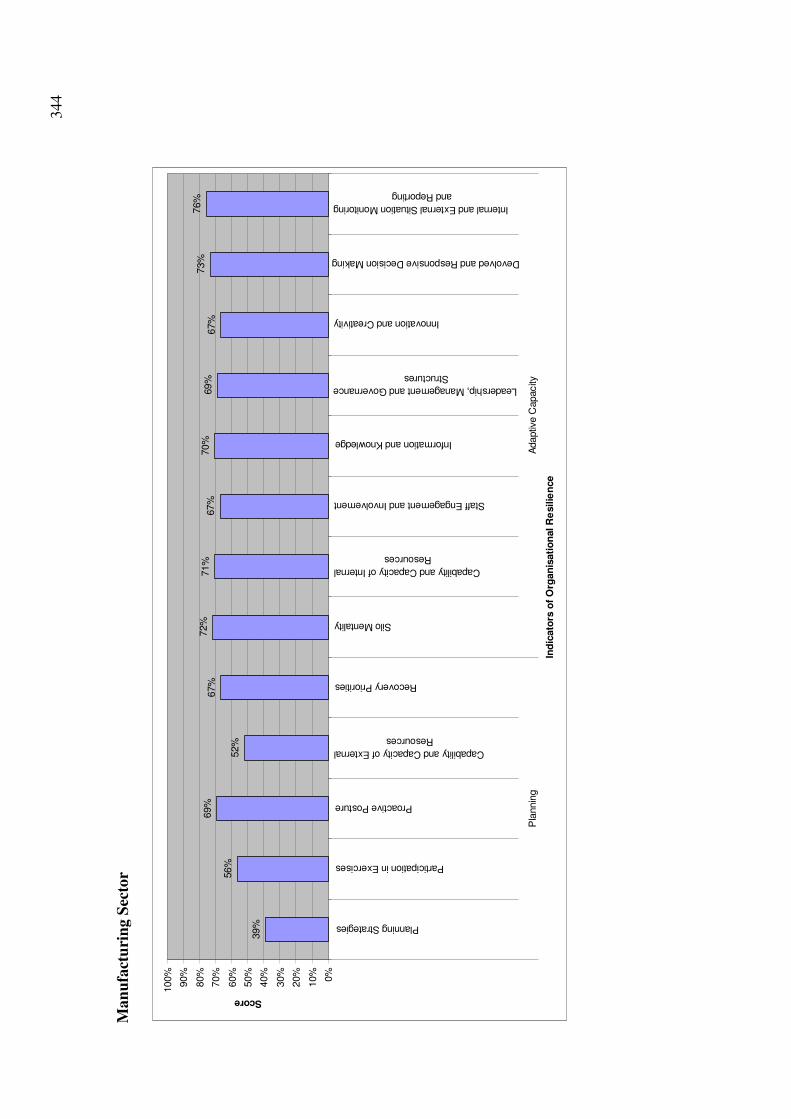
344
Man
ufa
ctu
rin
g S
ecto
r
39%
56%
69%
52%
67%
72%
71%
67%
70%
69%
67%
73%
76%
0%
10%
20%
30%
40%
50%
60%
70%
80%
90%
100%
Planning Strategies
Participation in Exercises
Proactive Posture
Capability and Capacity of External
Resources
Recovery Priorities
Silo Mentality
Capability and Capacity of Internal
Resources
Staff Engagement and Involvement
Information and Knowledge
Leadership, Management and Governance
Structures
Innovation and Creativity
Devolved and Responsive Decision Making
Internal and External Situation Monitoring
and Reporting
Pla
nnin
gA
daptiv
e C
apacity
Ind
icato
rs o
f O
rgan
isati
on
al R
esilie
nce
Score
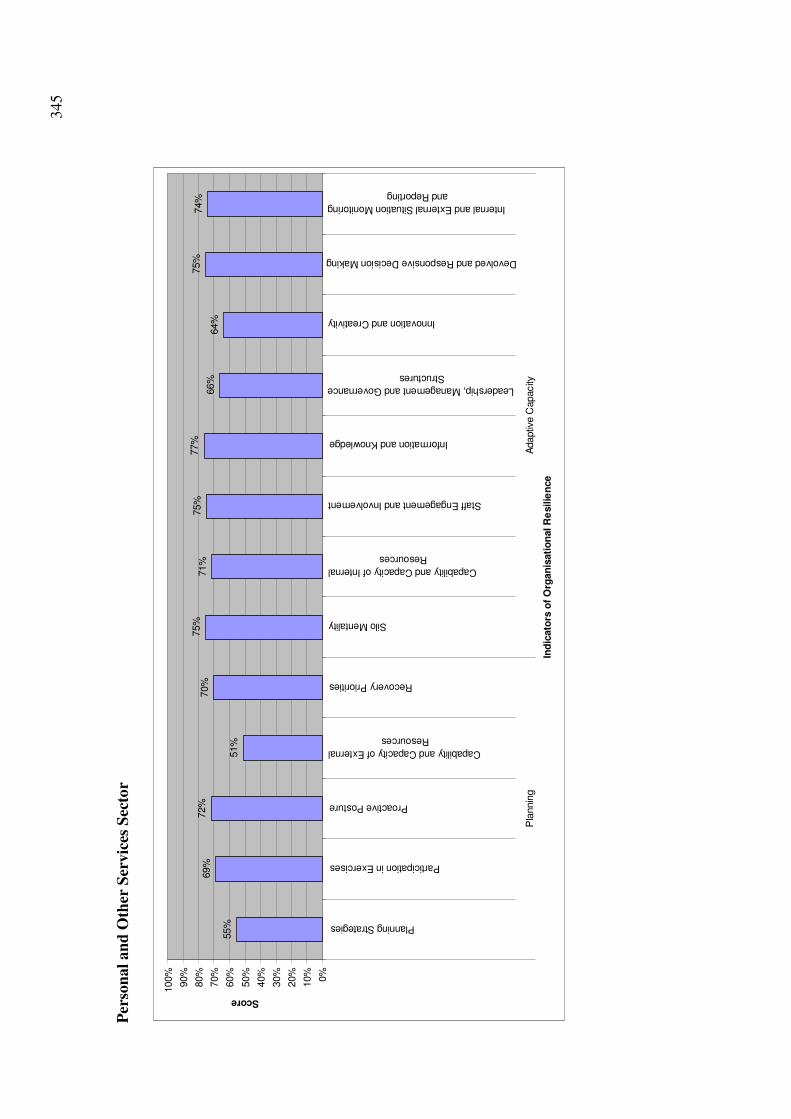
345
Per
son
al
an
d O
ther
Ser
vic
es S
ecto
r
55%
69%
72%
51%
70%
75%
71%
75%
77%
66%
64%
75%
74%
0%
10%
20%
30%
40%
50%
60%
70%
80%
90%
100%
Planning Strategies
Participation in Exercises
Proactive Posture
Capability and Capacity of External
Resources
Recovery Priorities
Silo Mentality
Capability and Capacity of Internal
Resources
Staff Engagement and Involvement
Information and Knowledge
Leadership, Management and Governance
Structures
Innovation and Creativity
Devolved and Responsive Decision Making
Internal and External Situation Monitoring
and Reporting
Pla
nnin
gA
daptiv
e C
apacity
Ind
icato
rs o
f O
rgan
isati
on
al R
esilie
nce
Score
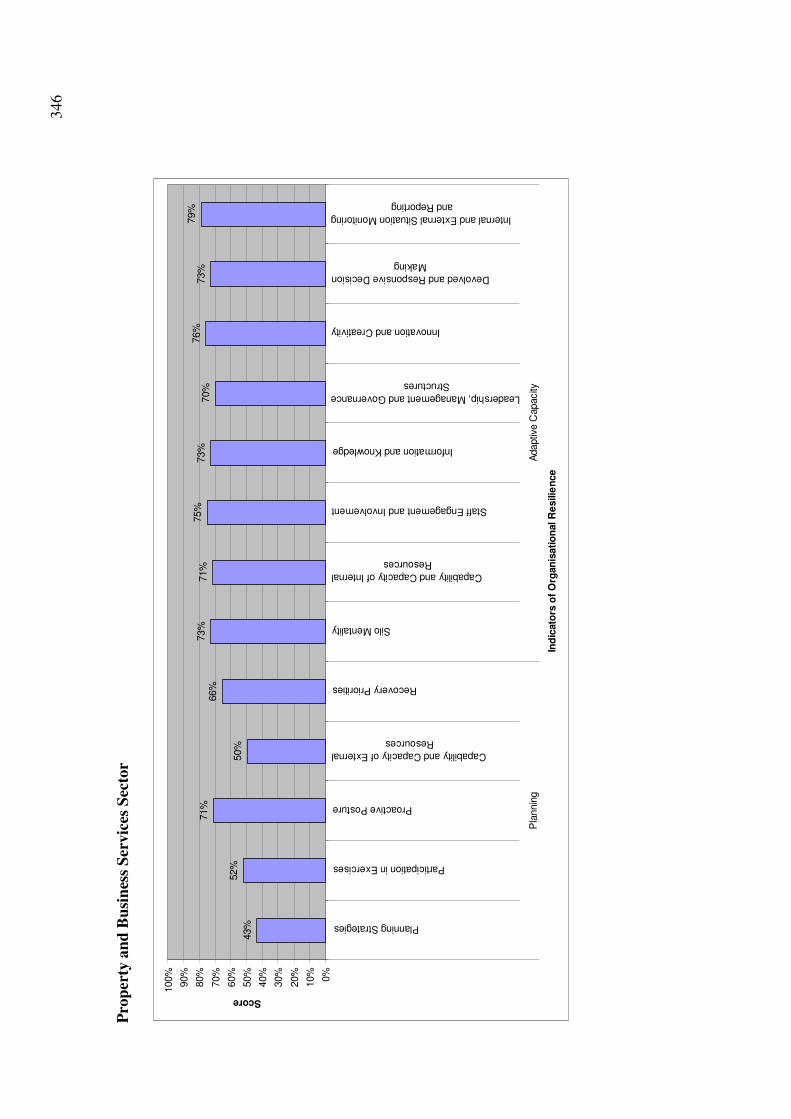
346
Pro
per
ty a
nd
Bu
sin
ess
Ser
vic
es S
ecto
r
43%
52%
71%
50%
66%
73%
71%
75%
73%
70%
76%
73%
79%
0%
10%
20%
30%
40%
50%
60%
70%
80%
90%
100%
Planning Strategies
Participation in Exercises
Proactive Posture
Capability and Capacity of External
Resources
Recovery Priorities
Silo Mentality
Capability and Capacity of Internal
Resources
Staff Engagement and Involvement
Information and Knowledge
Leadership, Management and Governance
Structures
Innovation and Creativity
Devolved and Responsive Decision
Making
Internal and External Situation Monitoring
and Reporting
Pla
nnin
gA
daptiv
e C
apacity
Ind
icato
rs o
f O
rgan
isati
on
al R
esilie
nce
Score
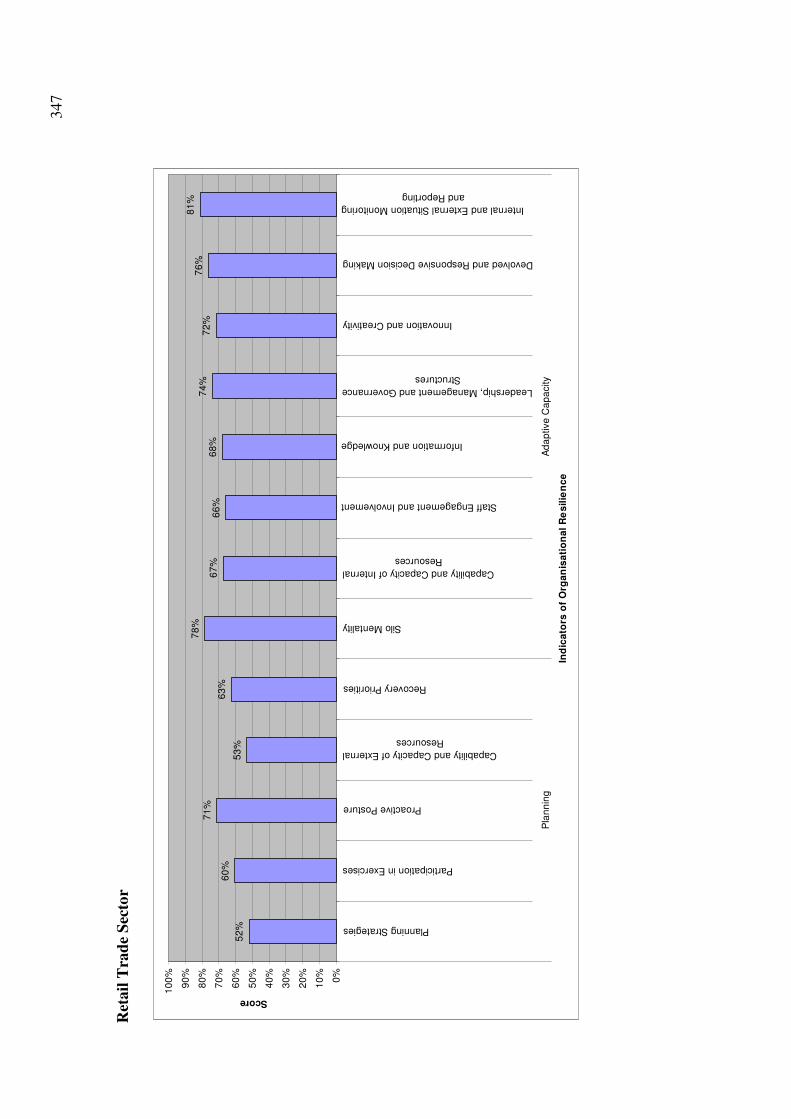
347
Ret
ail
Tra
de
Sec
tor
52
%
60
%
71
%
53
%
63
%
78
%
67
%6
6%
68
%7
4%
72
%7
6%
81
%
0%
10
%
20
%
30
%
40
%
50
%
60
%
70
%
80
%
90
%
10
0%
Planning Strategies
Participation in Exercises
Proactive Posture
Capability and Capacity of External
Resources
Recovery Priorities
Silo Mentality
Capability and Capacity of Internal
Resources
Staff Engagement and Involvement
Information and Knowledge
Leadership, Management and Governance
Structures
Innovation and Creativity
Devolved and Responsive Decision Making
Internal and External Situation Monitoring
and Reporting
Pla
nn
ing
Ad
ap
tive
Ca
pa
city
Ind
ica
tors
of
Org
an
isa
tio
na
l R
es
ilie
nc
e
Score

348
Wh
ole
sale
Tra
de
Sec
tor
43%
55%
61%
46%
56%
76%
70%
71%
70%
68%
70%
77%
78%
0%
10%
20%
30%
40%
50%
60%
70%
80%
90%
100%
Planning Strategies
Participation in Exercises
Proactive Posture
Capability and Capacity of External
Resources
Recovery Priorities
Silo Mentality
Capability and Capacity of Internal
Resources
Staff Engagement and Involvement
Information and Knowledge
Leadership, Management and Governance
Structures
Innovation and Creativity
Devolved and Responsive Decision
Making
Internal and External Situation Monitoring
and Reporting
Pla
nnin
gA
daptiv
e C
apacity
Ind
icato
rs o
f O
rgan
isati
on
al R
esilie
nce
Score
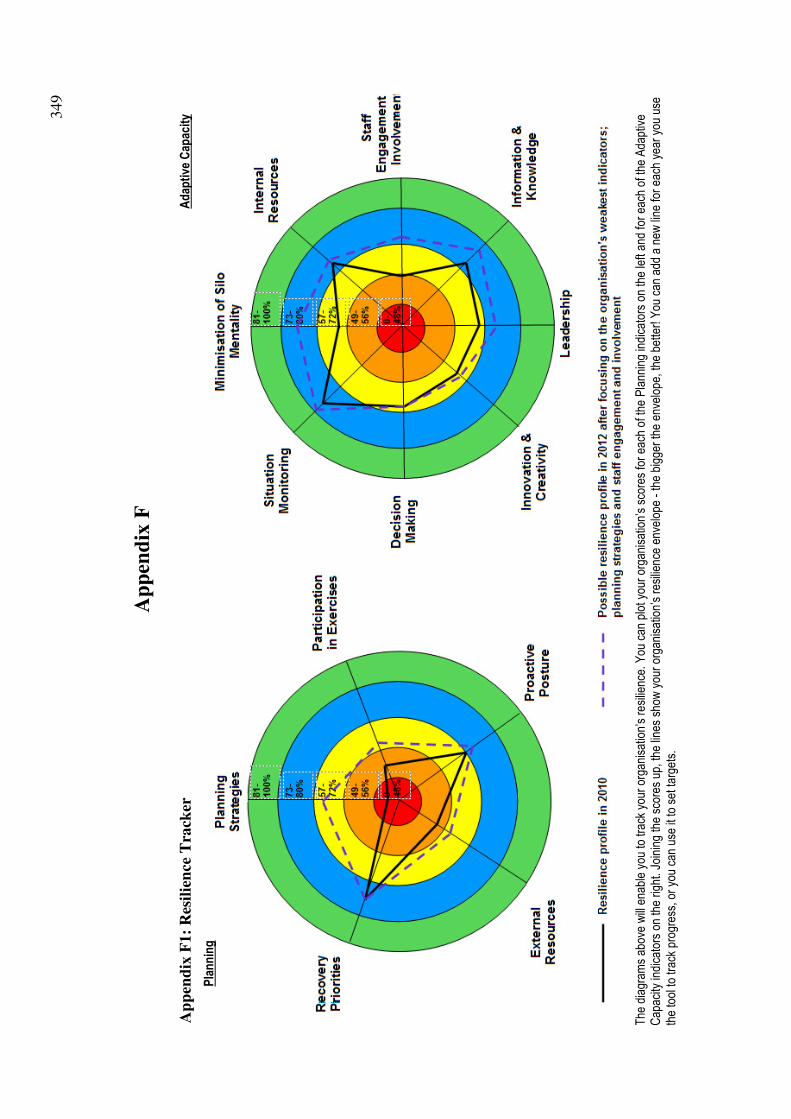
349
Ap
pen
dix
F
Ap
pen
dix
F1:
Res
ilie
nce
Tra
cker
The
dia
gram
s ab
ove
will
ena
ble
you
to tr
ack
your
org
anis
atio
n’s
resi
lienc
e. Y
ou c
an p
lot y
our
orga
nisa
tion’
s sc
ores
for
each
of t
he P
lann
ing
indi
cato
rs o
n th
e le
ft an
d fo
r ea
ch o
f the
Ada
ptiv
e C
apac
ity in
dica
tors
on
the
right
. Jo
inin
g th
e sc
ores
up,
the
lines
sh
ow y
our
orga
nisa
tion’
s re
silie
nce
env
elop
e -
the
bigg
er th
e en
velo
pe,
the
bette
r! Y
ou c
an a
dd a
new
line
for
each
yea
r yo
u us
e th
e to
ol to
trac
k pr
ogre
ss, o
r yo
u ca
n us
e it
to s
et ta
rget
s.
Pla
nn
ing
Ad
apti
ve C
apac
ity
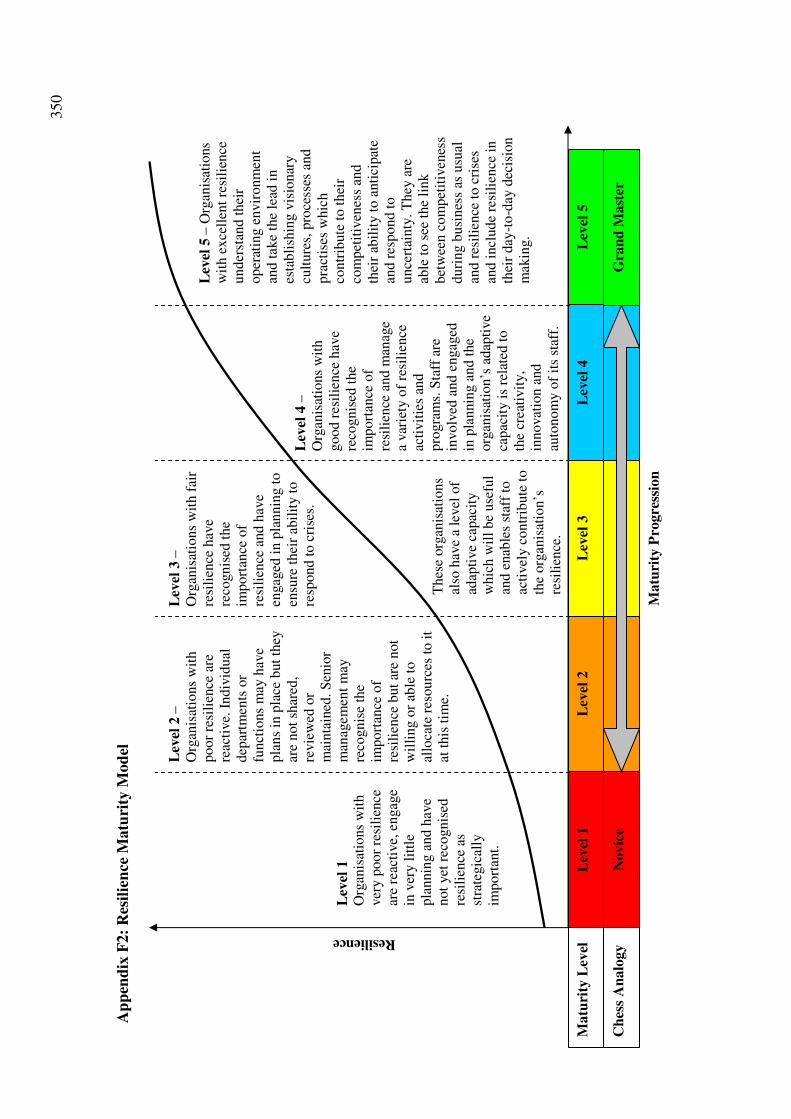
350
Ap
pen
dix
F2:
Res
ilie
nce
Matu
rity
Mod
el
C
hes
s A
nalo
gy
Novic
e
Gra
nd
Mast
er
Matu
rity
Pro
gre
ssio
n
Lev
el 1
L
evel
2
Lev
el 3
L
evel
4
Lev
el 5
M
atu
rity
Lev
el
Lev
el 1
O
rgan
isat
ions
wit
h
ver
y p
oor
resi
lien
ce
are
reac
tive,
engag
e in
ver
y l
ittl
e pla
nnin
g a
nd h
ave
not
yet
rec
ognis
ed
resi
lien
ce a
s st
rate
gic
ally
im
port
ant.
Lev
el 2
–
Org
anis
atio
ns
wit
h
poor
resi
lien
ce a
re
reac
tive.
Indiv
idual
dep
artm
ents
or
funct
ions
may
hav
e pla
ns
in p
lace
but
they
ar
e not
shar
ed,
revie
wed
or
mai
nta
ined
. S
enio
r m
anag
emen
t m
ay
reco
gnis
e th
e im
port
ance
of
resi
lien
ce b
ut
are
not
wil
ling o
r ab
le t
o
allo
cate
res
ourc
es t
o i
t at
this
tim
e.
Lev
el 3
–
Org
anis
atio
ns
wit
h f
air
resi
lien
ce h
ave
reco
gnis
ed t
he
import
ance
of
resi
lien
ce a
nd h
ave
engag
ed i
n p
lannin
g t
o
ensu
re t
hei
r ab
ilit
y t
o
resp
ond t
o c
rise
s.
Lev
el 4
–
Org
anis
atio
ns
wit
h
good r
esil
ience
hav
e re
cognis
ed t
he
import
ance
of
resi
lien
ce a
nd m
anag
e a
var
iety
of
resi
lien
ce
acti
vit
ies
and
pro
gra
ms.
Sta
ff a
re
involv
ed a
nd e
ngag
ed
in p
lannin
g a
nd t
he
org
anis
atio
n’s
adap
tive
capac
ity i
s re
late
d t
o
the
crea
tivit
y,
innovat
ion a
nd
auto
nom
y o
f it
s st
aff.
Lev
el 5
– O
rgan
isat
ions
wit
h e
xce
llen
t re
sili
ence
under
stan
d t
hei
r oper
atin
g e
nvir
onm
ent
and t
ake
the
lead
in
esta
bli
shin
g v
isio
nar
y
cult
ure
s, p
roce
sses
and
pra
ctis
es w
hic
h
contr
ibute
to t
hei
r co
mpet
itiv
enes
s an
d
thei
r ab
ilit
y t
o a
nti
cipat
e an
d r
espond t
o
unce
rtai
nty
. T
hey
are
ab
le t
o s
ee t
he
link
bet
wee
n c
om
pet
itiv
enes
s duri
ng b
usi
nes
s as
usu
al
and r
esil
ience
to c
rise
s an
d i
ncl
ude
resi
lien
ce i
n
thei
r day
-to
-day
dec
isio
n
mak
ing.
Thes
e org
anis
atio
ns
also
hav
e a
level
of
adap
tive
capac
ity
whic
h w
ill
be
use
ful
and e
nab
les
staf
f to
ac
tivel
y c
ontr
ibute
to
the
org
anis
atio
n’s
re
sili
ence
.
Resilience
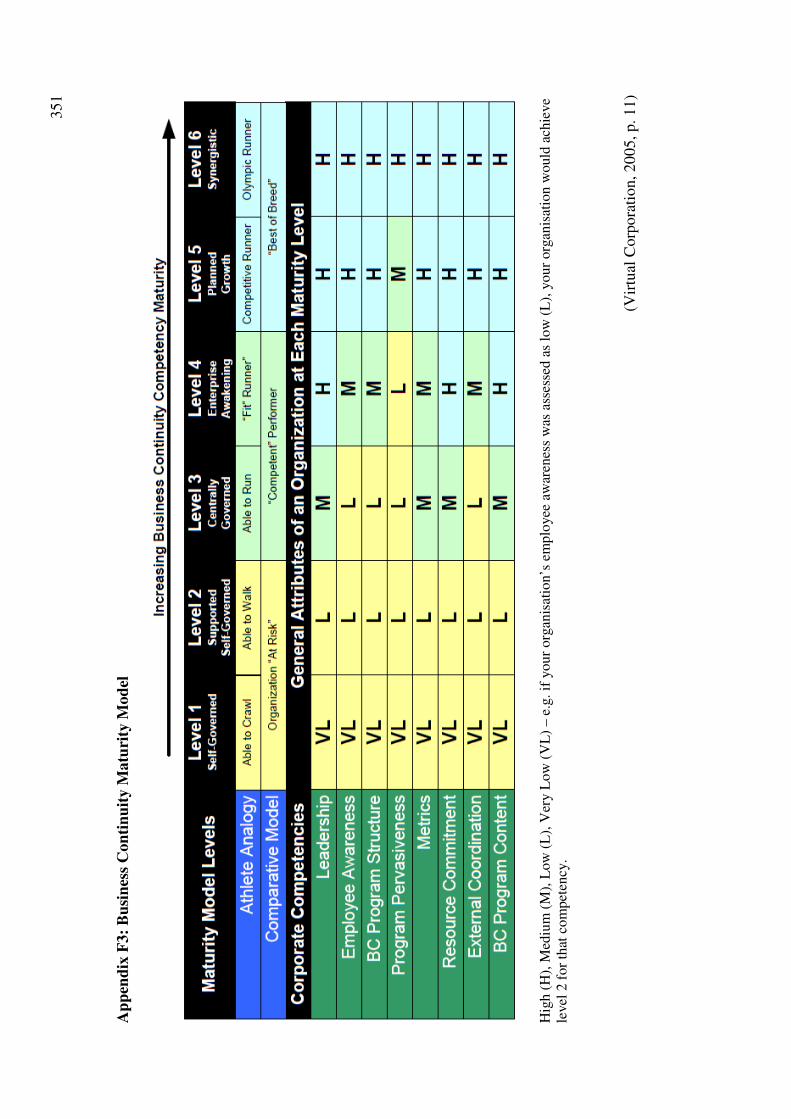
351
Ap
pen
dix
F3:
Bu
sin
ess
Con
tin
uit
y M
atu
rity
Mod
el
H
igh (
H),
Med
ium
(M
), L
ow
(L
), V
ery L
ow
(V
L)
– e
.g. if
your
org
anis
atio
n’s
em
plo
yee
aw
aren
ess
was
ass
esse
d a
s lo
w (
L),
your
org
anis
atio
n w
ould
ach
ieve
level
2 f
or
that
com
pet
ency
.
(Vir
tual
Corp
ora
tion, 20
05, p. 11)
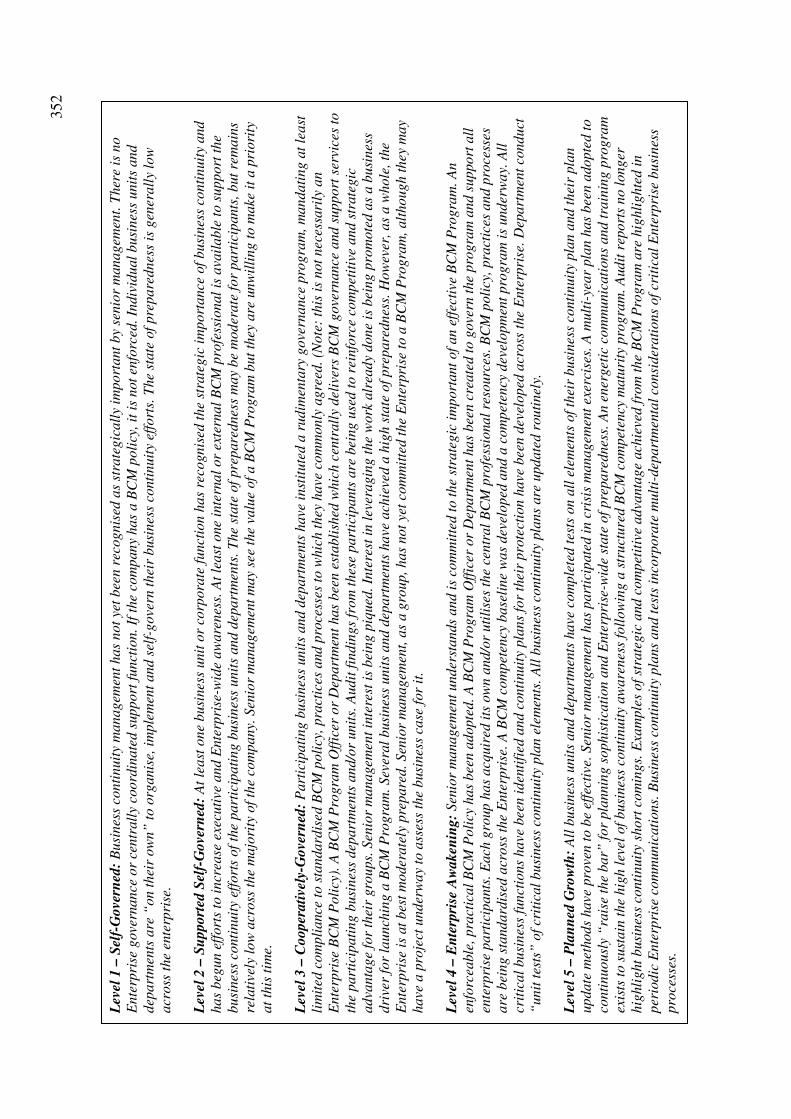
352
Lev
el 1
– S
elf-
Gove
rned
: B
usi
nes
s co
nti
nuit
y m
anagem
ent
has
not
yet
bee
n r
ecognis
ed a
s st
rate
gic
all
y im
port
ant
by
senio
r m
anagem
ent.
Ther
e is
no
Ente
rpri
se g
ove
rnance
or
centr
all
y co
ord
inate
d s
upport
funct
ion. If
the
com
pany
has
a B
CM
poli
cy, it
is
not
enfo
rced
. In
div
idual
busi
nes
s unit
s and
dep
art
men
ts a
re “
on t
hei
r ow
n”
to o
rganis
e, i
mple
men
t and s
elf-
gove
rn t
hei
r busi
nes
s co
nti
nuit
y ef
fort
s. T
he
state
of
pre
pare
dnes
s is
gen
erall
y lo
w
acr
oss
the
ente
rpri
se.
Lev
el 2
– S
upport
ed S
elf-
Gove
rned
: A
t le
ast
one
busi
nes
s unit
or
corp
ora
te f
unct
ion h
as
reco
gnis
ed t
he
stra
tegic
im
port
ance
of
busi
nes
s co
nti
nuit
y and
has
beg
un e
ffort
s to
incr
ease
exe
cuti
ve a
nd E
nte
rpri
se-w
ide
aw
are
nes
s. A
t le
ast
one
inte
rnal
or
exte
rnal
BC
M p
rofe
ssio
nal
is a
vail
able
to s
upport
the
busi
nes
s co
nti
nuit
y ef
fort
s of
the
part
icip
ati
ng b
usi
nes
s unit
s and d
epart
men
ts. T
he
state
of
pre
pare
dnes
s m
ay
be
moder
ate
for
part
icip
ants
, but
rem
ain
s re
lati
vely
low
acr
oss
the
majo
rity
of
the
com
pany.
Sen
ior
managem
ent
may
see
the
valu
e of
a B
CM
Pro
gra
m b
ut
they
are
unw
illi
ng t
o m
ake
it
a p
riori
ty
at
this
tim
e.
Lev
el 3
– C
ooper
ati
vely
-Gove
rned
: P
art
icip
ati
ng b
usi
nes
s unit
s and d
epart
men
ts h
ave
inst
itute
d a
rudim
enta
ry g
ove
rnance
pro
gra
m, m
andati
ng a
t le
ast
li
mit
ed c
om
pli
ance
to s
tandard
ised
BC
M p
oli
cy, pra
ctic
es a
nd p
roce
sses
to w
hic
h t
hey
have
com
monly
agre
ed. (N
ote
: th
is i
s not
nec
essa
rily
an
Ente
rpri
se B
CM
Poli
cy).
A B
CM
Pro
gra
m O
ffic
er o
r D
epart
men
t has
bee
n e
stabli
shed
whic
h c
entr
all
y del
iver
s B
CM
gove
rnance
and s
upport
ser
vice
s to
th
e part
icip
ati
ng b
usi
nes
s dep
art
men
ts a
nd/o
r unit
s. A
udit
fin
din
gs
from
thes
e part
icip
ants
are
bei
ng u
sed t
o r
einfo
rce
com
pet
itiv
e and s
trate
gic
adva
nta
ge
for
thei
r gro
ups.
Sen
ior
managem
ent
inte
rest
is
bei
ng p
iqued
. In
tere
st i
n l
ever
agin
g t
he
work
alr
eady
done
is b
eing p
rom
ote
d a
s a b
usi
nes
s dri
ver
for
launch
ing a
BC
M P
rogra
m. Sev
eral
busi
nes
s unit
s and d
epart
men
ts h
ave
ach
ieve
d a
hig
h s
tate
of
pre
pare
dnes
s. H
ow
ever
, as
a w
hole
, th
e E
nte
rpri
se i
s at
bes
t m
oder
ate
ly p
repare
d. Sen
ior
managem
ent,
as
a g
roup, has
not
yet
com
mit
ted t
he
Ente
rpri
se t
o a
BC
M P
rogra
m, alt
hough t
hey
may
have
a p
roje
ct u
nder
way
to a
sses
s th
e busi
nes
s ca
se f
or
it.
Lev
el 4
– E
nte
rpri
se A
waken
ing:
Sen
ior
managem
ent
under
stands
and i
s co
mm
itte
d t
o t
he
stra
tegic
im
port
ant
of
an e
ffec
tive
BC
M P
rogra
m. A
n
enfo
rcea
ble
, pra
ctic
al
BC
M P
oli
cy h
as
bee
n a
dopte
d. A
BC
M P
rogra
m O
ffic
er o
r D
epart
men
t has
bee
n c
reate
d t
o g
ove
rn t
he
pro
gra
m a
nd s
upport
all
en
terp
rise
part
icip
ants
. E
ach
gro
up h
as
acq
uir
ed i
ts o
wn a
nd/o
r uti
lise
s th
e ce
ntr
al
BC
M p
rofe
ssio
nal
reso
urc
es. B
CM
poli
cy, pra
ctic
es a
nd p
roce
sses
are
bei
ng s
tandard
ised
acr
oss
the
Ente
rpri
se. A
BC
M c
om
pet
ency
base
line
was
dev
eloped
and a
com
pet
ency
dev
elopm
ent
pro
gra
m i
s under
way.
All
cr
itic
al
busi
nes
s fu
nct
ions
have
bee
n i
den
tifi
ed a
nd c
onti
nuit
y pla
ns
for
thei
r pro
tect
ion h
ave
bee
n d
evel
oped
acr
oss
the
Ente
rpri
se. D
epart
men
t co
nduct
“
unit
tes
ts”
of
crit
ical
busi
nes
s co
nti
nuit
y pla
n e
lem
ents
. A
ll b
usi
nes
s co
nti
nuit
y pla
ns
are
update
d r
outi
nel
y.
Lev
el 5
– P
lan
ned
Gro
wth
: A
ll b
usi
nes
s unit
s and d
epart
men
ts h
ave
com
ple
ted t
ests
on a
ll e
lem
ents
of
thei
r busi
nes
s co
nti
nuit
y pla
n a
nd t
hei
r pla
n
update
met
hods
have
pro
ven t
o b
e ef
fect
ive.
Sen
ior
managem
ent
has
part
icip
ate
d i
n c
risi
s m
anagem
ent
exer
cise
s. A
mult
i-ye
ar
pla
n h
as
bee
n a
dopte
d t
o
conti
nuousl
y “
rais
e th
e bar”
for
pla
nnin
g s
ophis
tica
tion a
nd E
nte
rpri
se-w
ide
state
of
pre
pare
dnes
s. A
n e
ner
get
ic c
om
munic
ati
ons
and t
rain
ing p
rogra
m
exis
ts t
o s
ust
ain
the
hig
h l
evel
of
busi
nes
s co
nti
nuit
y aw
are
nes
s fo
llow
ing a
str
uct
ure
d B
CM
com
pet
ency
matu
rity
pro
gra
m. A
udit
rep
ort
s no l
onger
hig
hli
ght
busi
nes
s co
nti
nuit
y sh
ort
com
ings.
Exa
mple
s of
stra
tegic
and c
om
pet
itiv
e adva
nta
ge
ach
ieve
d f
rom
the
BC
M P
rogra
m a
re h
ighli
ghte
d i
n
per
iodic
Ente
rpri
se c
om
munic
ati
ons.
Busi
nes
s co
nti
nuit
y pla
ns
and t
ests
inco
rpora
te m
ult
i-dep
art
men
tal
consi
der
ati
ons
of
crit
ical
Ente
rpri
se b
usi
nes
s
pro
cess
es.
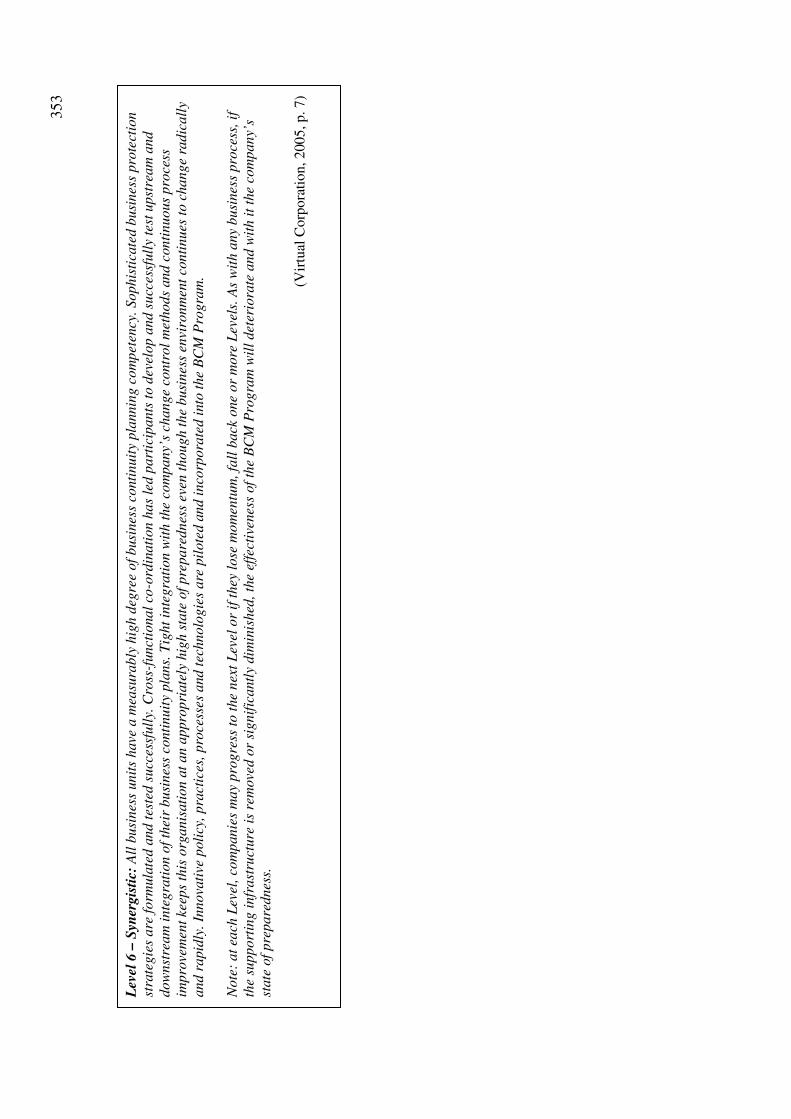
353
Lev
el 6
– S
yner
gis
tic:
All
busi
nes
s unit
s have
a m
easu
rably
hig
h d
egre
e of
busi
nes
s co
nti
nuit
y pla
nnin
g c
om
pet
ency
. Sophis
tica
ted b
usi
nes
s pro
tect
ion
stra
tegie
s are
form
ula
ted a
nd t
este
d s
ucc
essf
ull
y. C
ross
-funct
ional
co-o
rdin
ati
on h
as
led p
art
icip
ants
to d
evel
op a
nd s
ucc
essf
ull
y te
st u
pst
ream
and
dow
nst
ream
inte
gra
tion o
f th
eir
busi
nes
s co
nti
nuit
y pla
ns.
Tig
ht
inte
gra
tion w
ith t
he
com
pany’
s ch
ange
contr
ol
met
hods
and c
onti
nuous
pro
cess
im
pro
vem
ent
keep
s th
is o
rganis
ati
on a
t an a
ppro
pri
ate
ly h
igh s
tate
of
pre
pare
dnes
s ev
en t
hough t
he
busi
nes
s en
viro
nm
ent
conti
nues
to c
hange
radic
all
y and r
apid
ly. In
nova
tive
poli
cy, pra
ctic
es, pro
cess
es a
nd t
echnolo
gie
s are
pil
ote
d a
nd i
nco
rpora
ted i
nto
the
BC
M P
rogra
m.
Note
: at
each
Lev
el, co
mpanie
s m
ay
pro
gre
ss t
o t
he
nex
t L
evel
or
if t
hey
lose
mom
entu
m, fa
ll b
ack
one
or
more
Lev
els.
As
wit
h a
ny
busi
nes
s pro
cess
, if
th
e su
pport
ing i
nfr
ast
ruct
ure
is
rem
ove
d o
r si
gnif
icantl
y dim
inis
hed
, th
e ef
fect
iven
ess
of
the
BC
M P
rogra
m w
ill
det
erio
rate
and w
ith i
t th
e co
mpany’
s st
ate
of
pre
pare
dnes
s.
(V
irtu
al C
orp
ora
tion, 2005, p. 7)

354
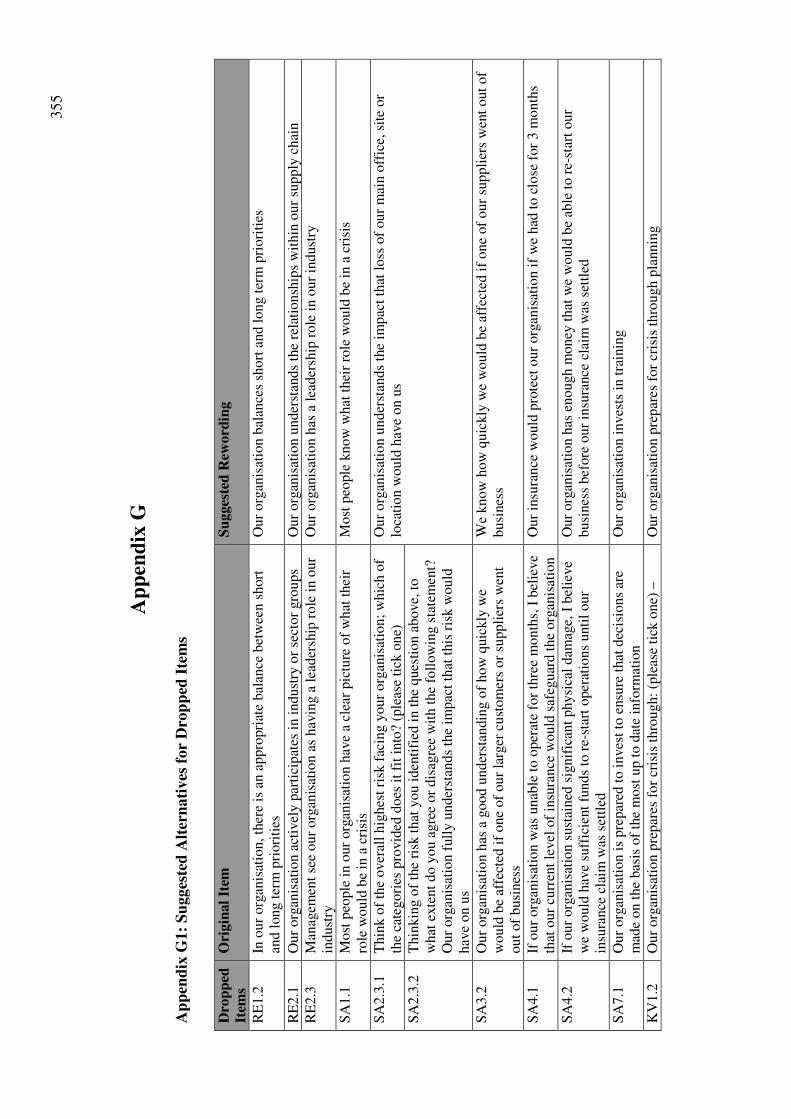
355
Ap
pen
dix
G
Ap
pen
dix
G1:
Su
gges
ted
Alt
ern
ati
ves
for
Dro
pp
ed I
tem
s
Dro
pp
ed
Item
s
Ori
gin
al
Item
S
ugges
ted
Rew
ord
ing
RE
1.2
In
our
org
anis
atio
n, th
ere
is a
n a
ppro
pri
ate
bal
ance
bet
wee
n s
hort
an
d l
ong t
erm
pri
ori
ties
O
ur
org
anis
atio
n b
alan
ces
short
and l
ong t
erm
pri
ori
ties
RE
2.1
O
ur
org
anis
atio
n a
ctiv
ely p
arti
cipat
es i
n i
ndust
ry o
r se
ctor
gro
ups
Our
org
anis
atio
n u
nder
stan
ds
the
rela
tionsh
ips
wit
hin
our
supply
chai
n
RE
2.3
M
anag
emen
t se
e our
org
anis
atio
n a
s hav
ing a
lea
der
ship
role
in o
ur
indust
ry
Our
org
anis
atio
n h
as a
lea
der
ship
role
in o
ur
indust
ry
SA
1.1
M
ost
peo
ple
in o
ur
org
anis
atio
n h
ave
a cl
ear
pic
ture
of
what
thei
r ro
le w
ould
be
in a
cri
sis
Most
peo
ple
know
what
thei
r ro
le w
ould
be
in a
cri
sis
SA
2.3
.1
Thin
k o
f th
e over
all
hig
hes
t ri
sk f
acin
g y
our
org
anis
atio
n;
whic
h o
f th
e ca
tegori
es p
rovid
ed d
oes
it
fit
into
? (p
leas
e ti
ck o
ne)
O
ur
org
anis
atio
n u
nder
stan
ds
the
impac
t th
at l
oss
of
our
mai
n o
ffic
e, s
ite
or
loca
tion w
ould
hav
e on u
s
SA
2.3
.2
Thin
kin
g o
f th
e ri
sk t
hat
you i
den
tifi
ed i
n t
he
ques
tion a
bove,
to
what
exte
nt
do y
ou a
gre
e or
dis
agre
e w
ith t
he
foll
ow
ing s
tate
men
t?
Our
org
anis
atio
n f
ull
y u
nder
stan
ds
the
impac
t th
at t
his
ris
k w
ould
hav
e on u
s
SA
3.2
O
ur
org
anis
atio
n h
as a
good u
nder
stan
din
g o
f how
quic
kly
we
would
be
affe
cted
if
one
of
our
larg
er c
ust
om
ers
or
suppli
ers
wen
t out
of
busi
nes
s
We
know
how
quic
kly
we
would
be
affe
cted
if
one
of
our
suppli
ers
wen
t out
of
busi
nes
s
SA
4.1
If
our
org
anis
atio
n w
as u
nab
le t
o o
per
ate
for
thre
e m
onth
s, I
bel
ieve
that
our
curr
ent
level
of
insu
rance
would
saf
eguar
d t
he
org
anis
atio
n
Our
insu
rance
would
pro
tect
our
org
anis
atio
n i
f w
e had
to c
lose
for
3 m
onth
s
SA
4.2
If
our
org
anis
atio
n s
ust
ained
sig
nif
ican
t physi
cal
dam
age,
I b
elie
ve
we
would
hav
e su
ffic
ient
funds
to r
e-st
art
oper
atio
ns
unti
l our
insu
rance
cla
im w
as s
ettl
ed
Our
org
anis
atio
n h
as e
nough m
oney
that
we
would
be
able
to r
e-st
art
our
busi
nes
s bef
ore
our
insu
rance
cla
im w
as s
ettl
ed
SA
7.1
O
ur
org
anis
atio
n i
s pre
par
ed t
o i
nves
t to
ensu
re t
hat
dec
isio
ns
are
mad
e on t
he
bas
is o
f th
e m
ost
up t
o d
ate
info
rmat
ion
Our
org
anis
atio
n i
nves
ts i
n t
rain
ing
KV
1.2
O
ur
org
anis
atio
n p
repar
es f
or
cris
is t
hro
ugh:
(ple
ase
tick
one)
–
Our
org
anis
atio
n p
repar
es f
or
cris
is t
hro
ugh p
lannin
g
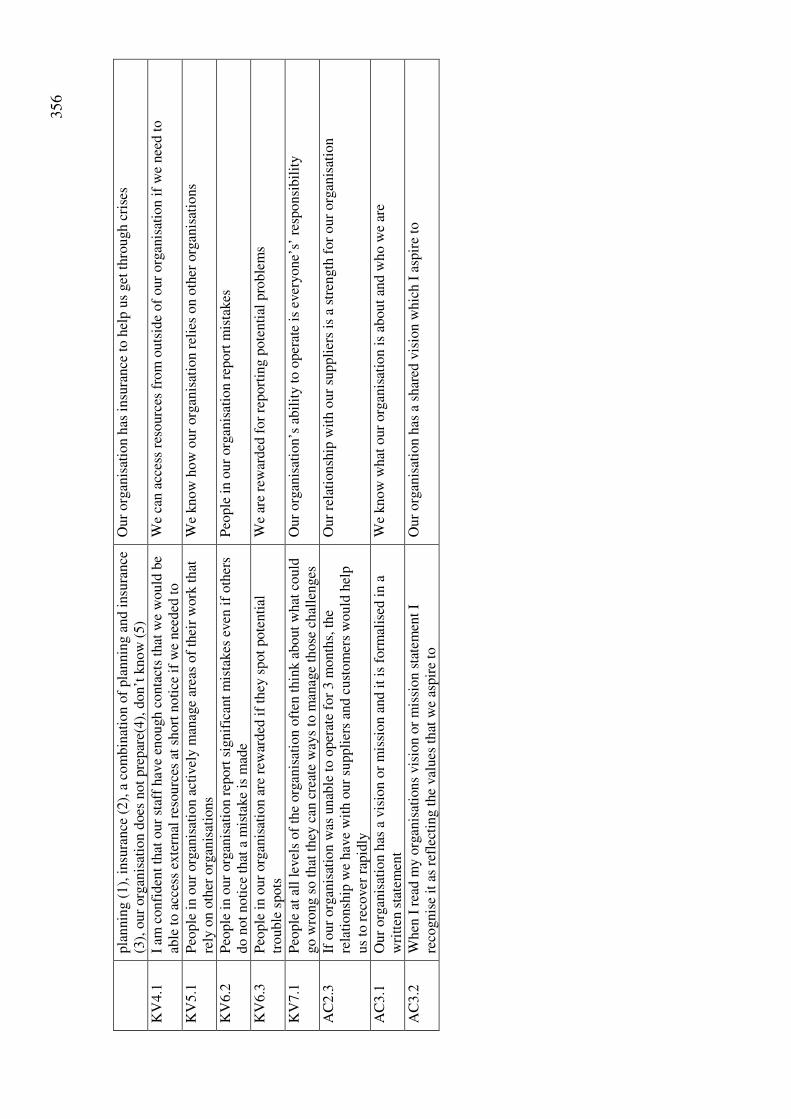
356
pla
nnin
g (
1),
insu
rance
(2),
a c
om
bin
atio
n o
f pla
nnin
g a
nd i
nsu
rance
(3
), o
ur
org
anis
atio
n d
oes
not
pre
par
e(4),
don’t
know
(5)
Our
org
anis
atio
n h
as i
nsu
rance
to h
elp u
s get
thro
ugh c
rise
s
KV
4.1
I
am c
onfi
den
t th
at o
ur
staf
f hav
e en
ough c
onta
cts
that
we
would
be
able
to a
cces
s ex
tern
al r
esourc
es a
t sh
ort
noti
ce i
f w
e nee
ded
to
We
can a
cces
s re
sourc
es f
rom
outs
ide
of
our
org
anis
atio
n i
f w
e nee
d t
o
KV
5.1
P
eople
in o
ur
org
anis
atio
n a
ctiv
ely m
anag
e ar
eas
of
thei
r w
ork
that
re
ly o
n o
ther
org
anis
atio
ns
We
know
how
our
org
anis
atio
n r
elie
s on o
ther
org
anis
atio
ns
KV
6.2
P
eople
in o
ur
org
anis
atio
n r
eport
sig
nif
ican
t m
ista
kes
even
if
oth
ers
do n
ot
noti
ce t
hat
a m
ista
ke
is m
ade
Peo
ple
in o
ur
org
anis
atio
n r
eport
mis
takes
KV
6.3
P
eople
in o
ur
org
anis
atio
n a
re r
ewar
ded
if
they
spot
pote
nti
al
trouble
spots
W
e ar
e re
war
ded
for
report
ing p
ote
nti
al p
roble
ms
KV
7.1
P
eople
at
all
level
s of
the
org
anis
atio
n o
ften
thin
k a
bout
what
could
go w
rong s
o t
hat
they
can
cre
ate
way
s to
man
age
those
chal
lenges
O
ur
org
anis
atio
n’s
abil
ity t
o o
per
ate
is e
ver
yone’
s’ r
esponsi
bil
ity
AC
2.3
If
our
org
anis
atio
n w
as u
nab
le t
o o
per
ate
for
3 m
onth
s, t
he
rela
tionsh
ip w
e hav
e w
ith o
ur
suppli
ers
and c
ust
om
ers
would
hel
p
us
to r
ecover
rap
idly
Our
rela
tionsh
ip w
ith o
ur
suppli
ers
is a
str
ength
for
our
org
anis
atio
n
AC
3.1
O
ur
org
anis
atio
n h
as a
vis
ion o
r m
issi
on a
nd i
t is
form
alis
ed i
n a
w
ritt
en s
tate
men
t W
e know
what
our
org
anis
atio
n i
s ab
out
and w
ho w
e ar
e
AC
3.2
W
hen
I r
ead m
y o
rgan
isat
ions
vis
ion o
r m
issi
on s
tate
men
t I
reco
gnis
e it
as
refl
ecti
ng t
he
val
ues
that
we
aspir
e to
O
ur
org
anis
atio
n h
as a
shar
ed v
isio
n w
hic
h I
asp
ire
to


![Organisational resilience [DOC 231KB] - TISNRes… · Web viewOrganisational Resilience. ... as well as a foundation for the tailoring of these attributes for organisations to consider](https://img.pdfslide.net/doc/110x75/5b36e1f47f8b9a4a728b6749/organisational-resilience-doc-231kb-tisn-res-web-vieworganisational-resilience.jpg)