Embed Size (px)
Citation preview

Benefits and Challenges in Using Physiologically-Based IVIVC for Drugs Undergoing First Pass Metabolism
Shriram Pathak, PhDSimcyp (a Certara Company)
PKUK 2014 Meeting, 6th November 2014

© Copyright 2014 Certara, L.P. All rights reserved.
0
20
40
60
80
100
0 20 40 60 80 100
in v
ivo
% D
isso
lved
in vitro % Dissolved
How to Develop IVIVC?
http://chem4520.wikispaces.com/Absorption+(Laura)

© Copyright 2014 Certara, L.P. All rights reserved.
What is Deconvolution?
Response Input System behaviour
If you know R and S, you can find I
Input is the rate of release/dissolution from administered formulation
System behaviour is how the human body processes the drug (Disposition)
Response is the result (Plasma Concentration-time profile) of what happens (system behaviour) to the drug after a particular input (formulation) is given to the system
What you deconvolute and its quality depends on how you define the system and parameterise it
*
Image courtesy Wikipedia; Ref Date- Oct 2014
© Copyright 2014 Certara, L.P. All rights reserved.
Deconvolution: Limitations of Conventional Methods
Wagner-Nelson and Loo-Riegelman Methods
• Assumes human body (system) as one or two compartments
• Cannot be used for nonlinear elimination
• Deconvolutes systemic input rate which is a composite function of dissolution + GI Transit + Permeation + First Pass
Numerical Methods
• No physiological assumptions but mathematical assumptions: input site is the same for all formulations andinput rate is constant (infusion) between two time points
• Depending on the UIR used, it deconvolutes a composite function of dissolution + GI Transit + Permeation + First Pass
Systemic Circulation
EliminationRate
Input Rate
Distribution
Langenbucher (2003) EJPB 56(3), 429

© Copyright 2014 Certara, L.P. All rights reserved.
SOLID DOSAGE
DISSOLVED DRUGGUT WALL
Mechanistic Deconvolution: e.g. ADAM Model
in vivo dissolution is
deconvoluted separately
from GIT transit,
permeation, gut wall
metabolism and first pass
liver extraction
GastricEmptying
Luminal Transit
LIVER PBPK DISTRIBUTION MODELPortal Vein
Dissolution
AbsorptionEfflux/Influx
MetabolismDegradation
© Copyright 2014 Certara, L.P. All rights reserved.
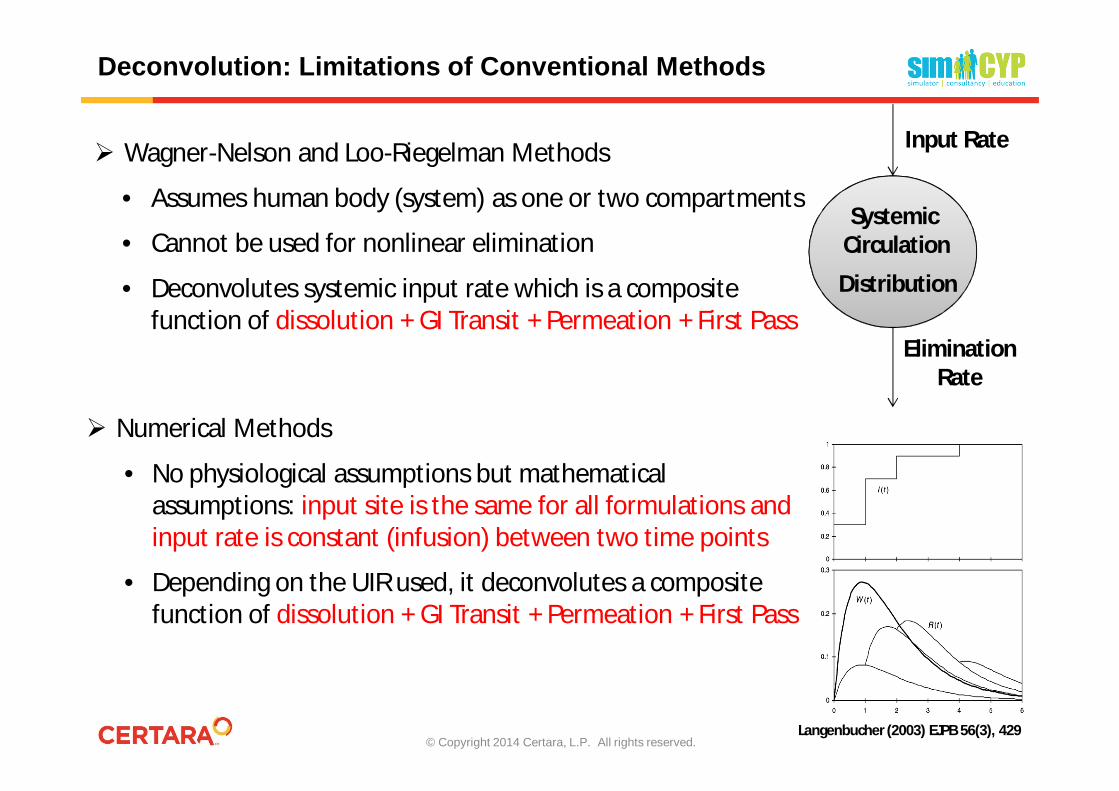
In vitro
ConventionalDeconvolution
Advantages of Physiologically-based IVIVCs
MechanisticDeconvolution
In vitro
In v
ivo
Simple IVIVC Function
In v
ivo
Complex IVIVC Function
In vitro
Simple IVIVCs are easy-to-interpret and
important during formulation optimisation
Dissolution Permeation Systemic Input

© Copyright 2014 Certara, L.P. All rights reserved.
Case study 1: IVIVC for Metoprolol ER formulations
Reported Model 1: Numerical Deconvolution with Oral Solution as UIR
In vitro In vivo
In vitro in vivo correlation
USP II, pH 6.8, 50 RPM USP I, pH 6.8, 150 RPM
Eddington et al. (1998) Pharm Res 15(3) 466

© Copyright 2014 Certara, L.P. All rights reserved.
Metoprolol IVIVC Using a Differential Equation-Based FPE Model
Reported Model 2: FPE Parent / Metabolite Model
USP II, pH 6.8, 150 RPM In vivo Parent and Metabolite Data
In vitro in vivo relationship
Sirisuth and Eddington (2002) EJPS 53, 301
Despite using parent and metabolite data in the IVIVC, prediction errors were equal or higher than ND.

© Copyright 2014 Certara, L.P. All rights reserved.
Two-Stage Sequential Approach using Linear IVIVC
Patel et al. 2014 9th W PBP meeting, Lisbon

© Copyright 2014 Certara, L.P. All rights reserved.
Case Study 2: Diltiazem (BCS I, BDDCS II) CR products
• Complexities involved Gut-wall metabolism
(formulation-dependent non-linearity)
Auto-inhibition of CYP3A4 by DTZ and its metabolite
Sirisuth et al, 2002 Biopharm Drug Dispos
Formulation %PE in AUC %PE in CmaxPB ND* PB ND*
Fast 8.33 94 8.63 77.8Medium -1.04 57.2 12.31 75.9
Slow -13.65 47.5 -5.05 65.9AAPE (%) 7.68 66.3 8.66 73.2
Type of IVIVC Linear (PB) and Non-linear (ND)* When all 3 formulations were used for IVIVC development.

© Copyright 2014 Certara, L.P. All rights reserved.
Diltiazem: Considering auto-inhibition
• Is auto-inhibition clinically significant?
Tsao et al. 1990 “DTZ half-life was 50-100% higher after MD than SD”Abernethy & Montamat 1987 Rowland Yeo et al 2010
Is an IVIVC or bio-equivalence established based upon a single dose valid at steady state for a drug with formulation-dependent first-pass and mechanism-based enzyme auto-
inhibition?

© Copyright 2014 Certara, L.P. All rights reserved.
Multi-dose studies for MR formulations
• The CHMP NfG on Modified Release Oral and transdermal DosageForms requires a multiple dose study for prolonged releaseproducts for drugs expected to show accumulation*
• For Diltiazem, accumulation is expected due to reduced first-passand systemic clearance due to auto-inhibition but the dissolution isnot expected to accumulate for Fast and Medium Releaseformulations
• PBPK models dissolution and absorption as separate processeshence allows simulation of MR formulation at steady statescenario after multi-dosing and estimate accumulation
• Can PB-IVIVC help to simulate such studies?
12
*EUFEPS BABP Network Open Discussion Forum: Revised European Guideline on Pharmacokinetic and Clinical Evaluation of Modified Release Dosage Forms. June 2013. Session III: Specific issues for BE assessment, by Alfredo García Arieta AEMPS, Madrid ES.

© Copyright 2014 Certara, L.P. All rights reserved.
Simulating SS exposure of ER-Diltiazem
• Such IVIVC linked PBPK simulations could help to evaluate exposure at steady state for ER products based upon single dose clinical studies
Formulation AUC Accumulation IndexFast 1.74
Medium 1.61Slow 1.46

© Copyright 2014 Certara, L.P. All rights reserved.
Case study 3: IVIVC for Tramadol ER Formulation
Extended IVIVC model which incorporates time dependent extent of absorption was developed and submitted
In Vitro In Vivo Correlation
Linear Model Time scaled Extended Model
Failed to predict lower bioavailability of slow formulation

© Copyright 2014 Certara, L.P. All rights reserved.
PB-IVIVC: Two-Stage Sequential Approach using Linear IVIVC
Pathak et al, AAPS,2014
Prediction FormulationObs- Med Pred %PE Obs- Med Pred %PE
Dissolution LL Disso Specs 2746.3562 2283.3879 16.86 126.2574 117.1461 7.22UL Disso Specs 2746.3562 2843.2808 -3.53 126.2574 137.0588 -8.56
AUC0-t (ng/mL.h) Cmax (ng/mL)UL & LL Dissolution Specifications
Internal Validation
External Validation
© Copyright 2014 Certara, L.P. All rights reserved.
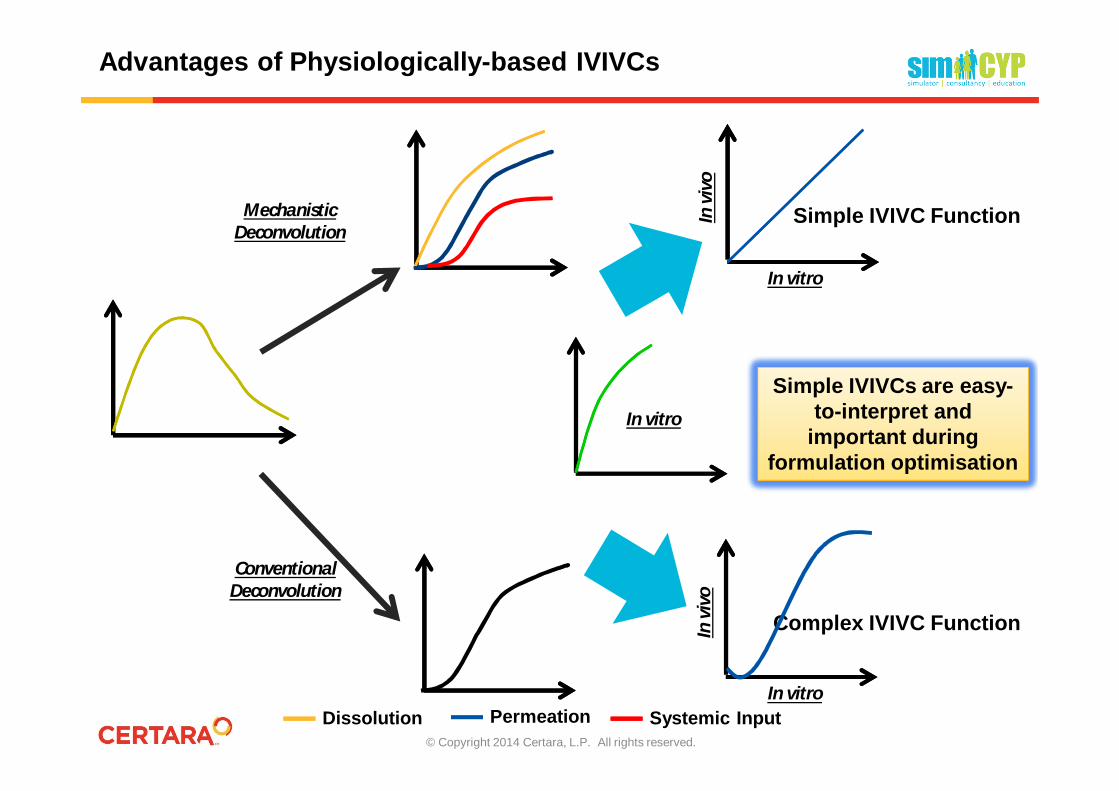
Fast, Target and Slowdissolution profiles ofTramadol ER Formulation
Predicted Plasma profiles in virtualpopulation using SimCYP PBPKModelling
Inter-occasional variabilityincorporated into the PKparameters before subjecting itto BE
Application of Absorption Modelling to Predict Virtual Bioequivalence
Virtual Bioequivalence was determined using Phoenix BE module
0.00
20.00
40.00
60.00
80.00
100.00
0.00 4.00 8.00 12.0016.0020.0024.00 0.00
40.00
80.00
120.00
160.00
200.00
0.00 8.00 16.00 24.00 32.00 40.00 48.00

© Copyright 2014 Certara, L.P. All rights reserved.
Objections to More Mechanistic ModelsObjections to More Mechanistic Models
1 –Data hungry!System vs drug/formulation data?
2- Makes many assumptions!Assumptions are declared; unlike other models
3- It is not transparent!Contradiction with previous item!
4- Does not add too much value!Most of the value is in “internal facilitation” and “informed decisionmaking”
5- Other modelling types can be done too!Other models by their nature cannot go beyond the data which is used todrive them (no extrapolation)
Slide Courtesy - Amin Rostami Hodjegan (Uni Manchester)

© Copyright 2014 Certara, L.P. All rights reserved.
Acknowledgements
• Simcyp– Nikunjkumar Patel– David Turner– Sebastian Polak– Masoud Jamei
• University of Manchester– Amin Rostami-Hodjegan (Seconded at Simcyp)
• Simcyp Consortium Members

© Copyright 2014 Certara, L.P. All rights reserved.
Thank you for your attention