Embed Size (px)
Citation preview
FEASIBILITY OF A NON-INVASIVE WIRELESS BLOOD GLUCOSE MONITOR
By
Benjamin Freer
A Thesis Submitted
In
Partial Fulfillment
Of the
Requirements for the Degree of
MASTER OF SCIENCE
In
Electrical Engineering
Approved by:
PROF. __________________________________________________ (Dr. Jayanti Venkataraman – Advisor)
PROF. __________________________________________________
(Dr. Sohail A. Dianat – Committee Member)
PROF. __________________________________________________ (Dr. Gill Tsouri – Committee Member)
PROF. __________________________________________________
(Dr. Sohail A. Dianat – Department Head)
DEPARTMENT OF ELECTRICAL AND MICROELECTRONIC ENGINEERING
COLLEGE OF ENGINEERING
ROCHESTER INSTITUTE OF TECHNOLOGY
ROCHESTER, NY
MARCH, 2011
ii
Acknowledgements
It is a pleasure to thank those that have made this thesis possible:
Dr. Venkataraman, who has provided years of insight and knowledge. Not only has she
been invaluable in producing this work, but in my graduate education in general.
My committee members, Dr. Tsouri and Dr. Dianat. Their education over the past several
years has helped to challenge me and broaden my horizons.
The entire staff of the Electronic and Microelectronic Engineering department. Patti
Vicari, Jim Stefano, and Ken Snyder have all been instrumental in reaching this point.
My employers over the past 6 years, Harris Corporation and Welch Allyn. Their
flexibility and support have not only allowed me to complete this research, but to grow as
an engineer as well.
My friends at Harris, RIT, and Welch Allyn, all of whom have put up with my venting,
frustration, and excitement over the past few years.
My family, who have provided their unwavering support, not only in this research, but
my entire life.
And finally, my wife Sara, and Lenny. Without their love, support, flexibility, and
welcomed distractions, none of this would be possible.
iii
Thesis Release Permission
DEPARTMENT OF ELECTRICAL AND MICROELECTRONIC ENGINEERING
COLLEGE OF ENGINEERING
ROCHESTER INSTITUTE OF TECHNOLOGY
ROCHESTER, NY 2011
Title of Thesis:
FEASIBILITY OF A NON-INVASIVE WIRELESS BLOOD GLUCOS E MONITOR
I, Benjamin Freer, hereby grant permission to Wallace Memorial Library of the Rochester Institute of Technology to reproduce this thesis in whole or in part. Any
reproduction will not be for commercial use or profit.
Signature___________________________________ Date___________
iv
Abstract
Blood glucose monitors are critical to diabetes management. Many new non-
invasive measurement techniques are being investigated. The present work focuses on the
possibility of a monitor that non-invasively measures blood glucose levels using
electromagnetic waves. The technique is based on relating a monitoring antenna’s
resonant frequency to the permittivity and conductivity of blood which in turn is related
to the glucose levels.
At first a realistic data base for the dielectric properties of blood has been
established through in-vitro measurements performed on blood samples obtained from 20
patients with glucose levels ranging from normal (87 mg/dl) to hyperglycemic (330
mg/dl). Using the Agilent 85070E dielectric probe and an Agilent 8720B network
analyzer the dielectric permittivity and conductivity of the blood samples have been
measured over a frequency range of 1GHz – 10GHz. The Cole-Cole model has been
modified through curve fitting to in-vitro data that includes a factor representing glucose
levels.
Two antennas (wideband and narrowband) have been designed, constructed and
tested in free space. A simulation model of layered tissue and blood together with an
antenna has been created to study the effect of changing glucose levels. It is noted that
the antenna’s resonant frequency increases with increase in glucose levels.
An analytical model for the antenna has been developed, which has been
validated with simulations. The model consists of a lumped-element antenna that
represents a narrowband radiator. The resonant frequency of the radiator is dictated by a
resonant LCR circuit, which is a function of the materials within the antenna’s near-field.
v
A measurement system has been developed to measure the resonant frequency of
the antenna. A frequency synthesizer generates an RF signal over the desired frequency
range. This signal is sent to the antenna through a directional coupler that generates
forward and reflected signals. These voltages are measured and the reflection coefficient
is calculated with a microprocessor.
As an experimental verification, two antennas were strapped one on each leg of a
patient with one antenna connected to the PNA and the other to the measurement system.
As the patient ingested fast acting glucose tablets, the blood glucose level was measured
by a traditional glucose meter. At the same time, a comparison of the resonant frequency
of the antenna measured by the PNA and by the measurement system showed good
agreement. Further, it is seen that the antenna resonant frequency increases as the
glucose level increases, which is consistent with the simulation model.
vi
Table of Contents
Acknowledgements ............................................................................................................. ii
Abstract .............................................................................................................................. iv
List of Figures .................................................................................................................. viii
List of Tables ..................................................................................................................... xi
1. Introduction and Background ..................................................................................... 1
1.1 Diabetes Mellitus.................................................................................................. 1
1.2 Invasive Glucose Monitoring Techniques............................................................ 3
1.3 Non-Invasive Glucose Monitoring Techniques ................................................... 5
1.3.1 Interstitial Fluid Chemical Analysis ............................................................. 5
1.3.2 Breath Chemical Analysis............................................................................. 6
1.3.3 Infrared Spectroscopy ................................................................................... 6
1.3.4 Optical Coherence Tomography ................................................................... 7
1.3.5 Temperature-modulated localized reference ................................................. 7
1.3.6 Raman Spectroscopy ..................................................................................... 8
1.3.7 Polarization Change ...................................................................................... 8
1.3.8 Ultrasound ..................................................................................................... 8
1.3.9 Fluorescence ................................................................................................. 8
1.3.10 Thermal Spectroscopy .................................................................................. 9
1.3.11 Ocular Spectroscopy ..................................................................................... 9
1.3.12 Impedance Spectroscopy .............................................................................. 9
1.4 Dielectric Properties of Blood ............................................................................ 17
1.5 Major Contributions of Present Work ................................................................ 21
1.6 Organization of Present Work ............................................................................ 22
2. Dielectric Properties of Blood .................................................................................. 24
2.1 Experimental Blood Measurements ................................................................... 24
2.2 Models for Characterizing Dielectric Properties of Tissue ................................ 25
2.3 Developing a Glucose-Dependent Model .......................................................... 26
3. Simulations for Non-Invasive Blood Glucose Monitoring ....................................... 33
3.1 Design of an Antenna for Glucose Monitoring .................................................. 33
3.2 Human Body Models ......................................................................................... 36
3.3 Antenna Design and Simulations ....................................................................... 37
vii
3.3.1 Design of a Wideband Antenna .................................................................. 37
3.3.2 Design of a Narrowband Antenna............................................................... 40
3.3.3 Analytical Model of Narrowband Antenna ................................................. 42
4. Prototype Non-Invasive Wireless Blood Glucose Monitor ...................................... 46
4.1 Antenna Performance ......................................................................................... 46
4.2 Measurement System Design Details ................................................................. 48
4.3 Evaluation of System Operation and Performance ............................................ 52
4.4 Measurement System Results............................................................................. 57
5. Conclusions and Future Work .................................................................................. 60
5.1 Future Work ....................................................................................................... 60
References ......................................................................................................................... 62
Appendix A: Measurement System Schematic................................................................. 67
Appendix B: Measurement System Bill of Materials ....................................................... 68
Appendix C: Measurement System Board Layout ........................................................... 71
Appendix D: Measurement System Board Errata ............................................................. 73
viii
List of Figures
Figure 1: Typical blood glucose control system. [27] ........................................................ 1 Figure 2: Simplified glucose measurement method. [8] ..................................................... 4 Figure 3: Lifescan OneTouch Ultra glucose meter[9] (left), and Medtronics CGMS [10](right). ........................................................................................................................... 5 Figure 4: Simple electrical model of skin sensor used by Pendragon device. [26] .......... 10
Figure 5: Block diagram of Pendragon blood glucose sensing system. [26] .................... 11 Figure 6: Experimental data of Pendragon blood glucose monitoring system, showing sensor signal, blood glucose concentration (measured invasively) and interstitial fluid glucose concentration. [26] ............................................................................................... 12 Figure 7: Clarke error grid from a study of the Pendragon blood glucose monitor. [25] . 13 Figure 8: Resonant spiral transmission line developed by Baylor University research team, and S21 measurements during “soda” test. [27] ..................................................... 14
Figure 9: Frequency change in S21 response of device developed by Baylor University. [27] .................................................................................................................................... 14
Figure 10: Resonant spiral glucose measurement device without (left) and with thumb guide (right). [28] .............................................................................................................. 15 Figure 11: Serpentine antenna (left) embedded in human tissue (right) [44]. .................. 16
Figure 12: Serpentine antenna in air and in mimicking gel [44]. ..................................... 16
Figure 13: Time varying permittivity (a) and blood glucose concentration (b) of hamster tails, measured invasively. [33] ........................................................................................ 19 Figure 14: Fischer projection of biologically active D-Glucose and the biologically inactive isomer L-Glucose. [34] ....................................................................................... 19 Figure 15: Permittivity of erythrocytes as a function of frequency and D-glucose concentrations [34]............................................................................................................ 20 Figure 16: Hypothetical model of the effect triggered by increasing glucose concentrations. [34]........................................................................................................... 21 Figure 17: Agilent 85070E high temperature dielectric probe. [36] ................................. 24
ix
Figure 18: Collected and measured data of permittivity (solid) and conductivity (dashed) of human blood. [31]......................................................................................................... 25 Figure 19: Average permittivity of collected data from study and permittivity of established model. ............................................................................................................. 27 Figure 20: Average conductivity of collected data from study and conductivity of established model. ............................................................................................................. 27 Figure 21: Collected data permittivity (left) and conductivity (right) as a function of blood glucose at 1 GHz (top) and 5 GHz (bottom). .......................................................... 28 Figure 22: Average permittivity of collected data and permittivity of modified model ... 29 Figure 23: Average conductivity of collected data and conductivity of modified model. 30 Figure 24: Collected permittivity and modified model permittivity for various blood glucose concentrations at 1 GHz (top) and 5 GHz (bottom). ........................................... 31
Figure 25: Three samples from study measuring 72 mg/dL(left), 95 mg/dL (center), and 134 mg/dL (right), with modified model. ......................................................................... 32 Figure 26: Conceptual blood glucose measurement form factor. ..................................... 33 Figure 27: Detection of tissue properties through antenna fringing field. ........................ 34 Figure 28: Permittivity of Human Blood. ......................................................................... 35 Figure 29: Penetration depth of human blood................................................................... 35 Figure 30: Ansoft HFSS human body model skeletal (top left), muscular (top right), vascular (bottom left), and "average” tissue (bottom right). ............................................. 36 Figure 31: Tissue layers used for simplified human body model. .................................... 37
Figure 32: Modified UWB antenna with dimensions in mm. ........................................... 38 Figure 33: Modified UWB antenna return loss................................................................. 39 Figure 34: Modified UWB antenna return loss for varying glucose concentrations. ....... 39 Figure 35: Modified NB antenna with dimensions in mm. .............................................. 40 Figure 36: Simulated NB antenna return loss. .................................................................. 41 Figure 37: NB antenna return loss for varying glucose concentrations. ........................... 41
x
Figure 38: Lumped element model of NB antenna. .......................................................... 42
Figure 39: HFSS simulation and analytical model. .......................................................... 43 Figure 40: Analytical model accounting for tissue layers. ............................................... 43 Figure 41: Antenna orientation used to validate model. ................................................... 44 Figure 42: Capacitance of Cp2 for varying dielectrics. .................................................... 44 Figure 43: Manufactured UWB antenna on FR4. ............................................................. 46
Figure 44: Simulated and measured response of UWB antenna....................................... 47 Figure 45: UWB response recorded over time. ................................................................ 48 Figure 46: Block diagram of measurement system........................................................... 49
Figure 47: AD8302 block diagram [41]............................................................................ 50 Figure 48: ADF4350 block diagram [42] ......................................................................... 51 Figure 49: Measurement system with included antenna. .................................................. 52 Figure 50: Output voltages of AD8302. ........................................................................... 53 Figure 51: Output voltages of AD8302 with arm present................................................. 53 Figure 52: Return loss of complete measurement system. ............................................... 54 Figure 53: Return loss of system compared to antenna alone. ......................................... 55
Figure 54: Return loss and phase of complete measurement system. ............................... 56
Figure 55: LabView program used to analyze data. ......................................................... 56 Figure 56: Verification of measurement system response with blood glucose. ............... 57 Figure 57: Measurement system response and blood glucose over time. ......................... 58 Figure 58: Clarke error grid for measurement system. ..................................................... 59
xi
List of Tables
Table 1: Cole-Cole dispersion parameters for various human tissues [32] ...................... 26 Table 2: Parameters of original and modified blood Cole-Cole models. ......................... 29 Table 3: Lumped element values of analytical model. ..................................................... 42
1. Introduction and
1.1 Diabetes Mellitus
Diabetes mellitus, oft
which a person has high blood sugar. This high blood sugar will often cause symptoms of
frequent urination, increased hunger and increased thirst. The two types that affect the
general population are known as Type 1 and Ty
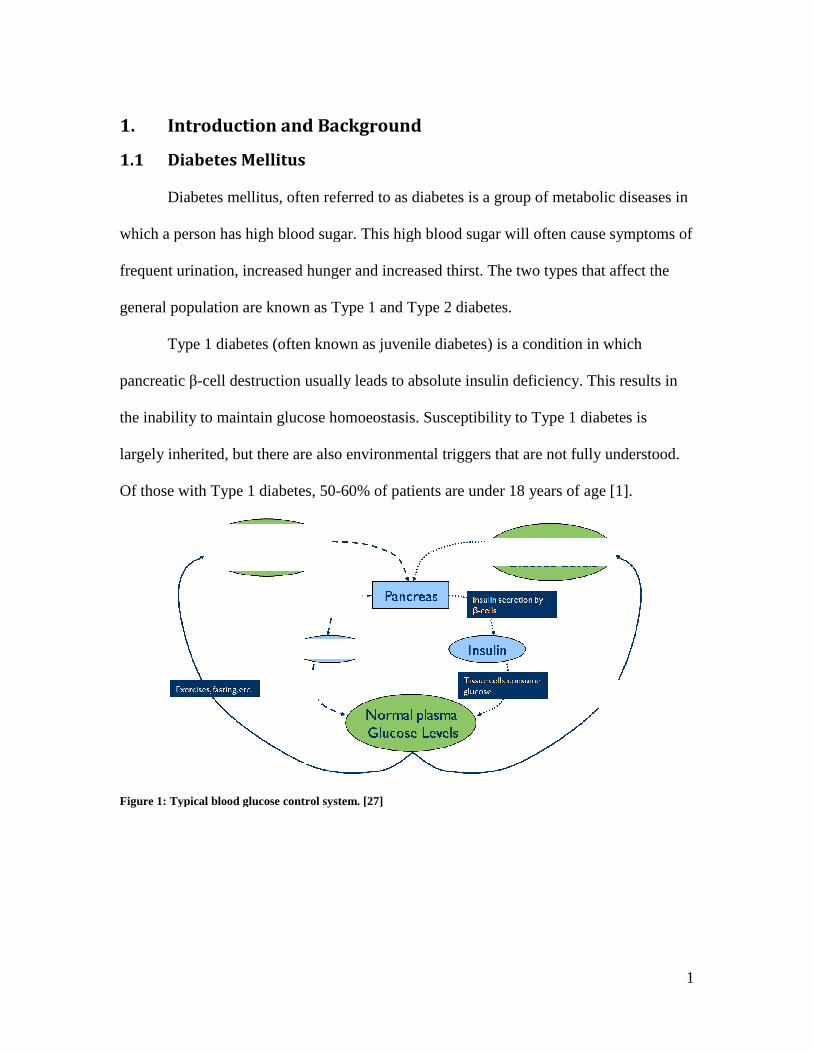
Type 1 diabetes (often known as juvenile diabetes) is a condition in which
pancreatic β-cell destruction usually leads to absolute insulin deficiency. This results in
the inability to maintain glucose homoeostasis. Susceptibility to Type 1
largely inherited, but there are also environmental triggers that are not fully understood.
Of those with Type 1 diabetes, 50
Figure 1: Typical blood glucose control
Introduction and Background
Diabetes Mellitus
Diabetes mellitus, often referred to as diabetes is a group of metabolic diseases in
which a person has high blood sugar. This high blood sugar will often cause symptoms of
frequent urination, increased hunger and increased thirst. The two types that affect the
general population are known as Type 1 and Type 2 diabetes.
Type 1 diabetes (often known as juvenile diabetes) is a condition in which
cell destruction usually leads to absolute insulin deficiency. This results in
the inability to maintain glucose homoeostasis. Susceptibility to Type 1 diabetes is
largely inherited, but there are also environmental triggers that are not fully understood.
Of those with Type 1 diabetes, 50-60% of patients are under 18 years of age
: Typical blood glucose control system. [27]
1
a group of metabolic diseases in
which a person has high blood sugar. This high blood sugar will often cause symptoms of
frequent urination, increased hunger and increased thirst. The two types that affect the
Type 1 diabetes (often known as juvenile diabetes) is a condition in which
cell destruction usually leads to absolute insulin deficiency. This results in
diabetes is
largely inherited, but there are also environmental triggers that are not fully understood.
[1].
2
Type 2 diabetes is characterized by a resistance to insulin, and in some cases
absolute insulin deficiency. Lifestyles are significant factors in acquiring Type 2 diabetes.
In one study, those that had high levels of physical activity, a healthy diet, did not smoke,
consumed alcohol in moderation and were a healthy weight had a 89% lower diabetes
Type 2 rate [2].
Diabetes can result in chronic conditions such as Vascular Disease, Renal
Complications, and a variety of neurological symptoms. In 2003, the cost of treating
diabetes was estimated to be $132 billion. By 2020 it is estimated the number of people
diagnosed with diabetes could rise to over 17 million, costing an estimated $192 billion
[3].
While there is no cure for diabetes, symptoms are controlled through the
regulation of blood glucose levels. There are several types of measurements that can be
used to monitor glucose regulation. Once in the blood stream, glucose combines with
hemoglobin found in red blood cells (erythrocytes) to create glycated hemoglobin
(HBA1C). The hemoglobin will remain glycated for the life of the erythrocyte, typically
90-120 days [4]. This makes HbA1c concentration measurement the best indication of
average blood glucose concentration. While HbA1c measurements are the best method of
long-term control, self monitoring of blood glucose levels is fundamental to diabetes
care. Frequent monitoring avoids hypoglycemia, and aids in determining dietary choices,
physical activity, and insulin doses.
Most at-home monitoring is performed with a blood glucose monitor. While
current blood glucose monitors require small amounts of blood (2-10 µL) and can be used
at sites other than the fingertips, it is still a painful and tedious measurement. Although
3
blood glucose measurements fluctuate much more than HbA1c measurements, there is a
strong correlation between HbA1c measurements and average glucose measurements
taken over the same time period [5]. Continuous monitoring systems also exist, but they
require a subcutaneous injection to be replaced every 3 to 7 days. While it has been
shown that continuous monitoring systems are effective in reducing blood glucose to
recommended levels [6], adolescents and young adults often have difficulty adhering to
this intensive treatment. For this reason non-invasive monitoring systems would be
preferred.
1.2 Invasive Glucose Monitoring Techniques
Current glucose monitoring devices are extremely similar to the devices originally
created in the 1960’s. [7] Aside from the miniaturization, ease of use and the ability to
log data, the measurements fundamentally are the same as the first laboratory sensors. A
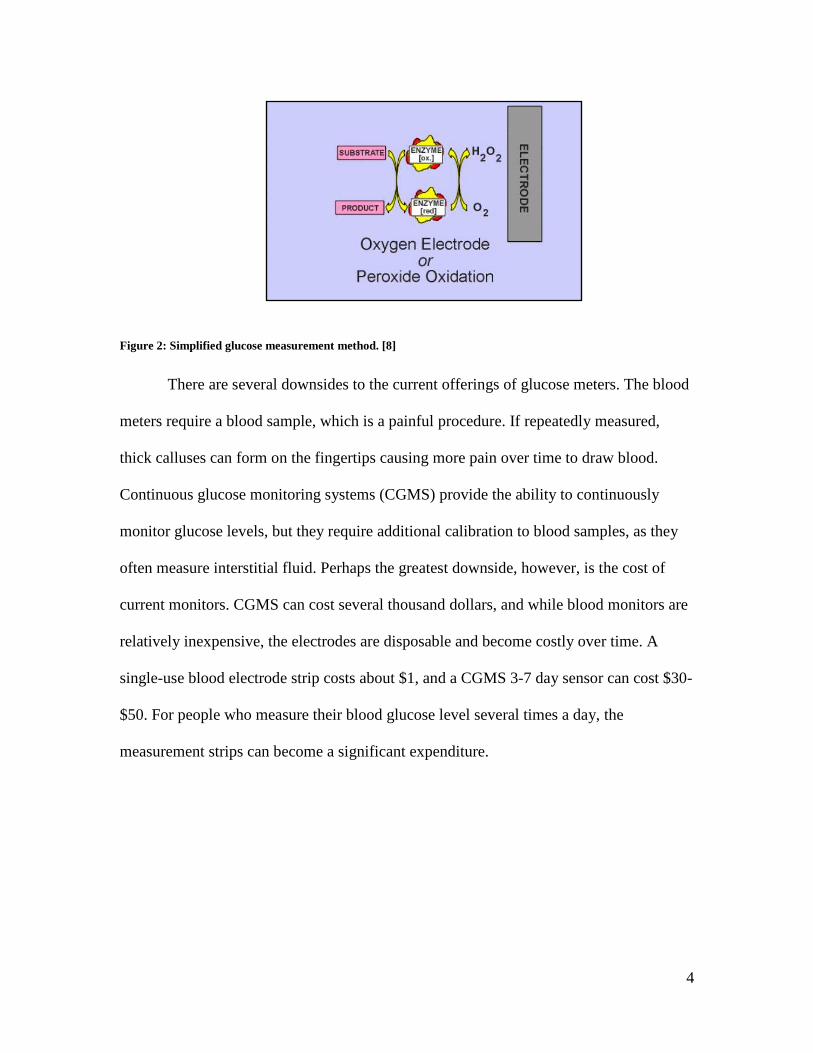
blood sample is placed in contact with an enzyme (typically glucose oxidase) which
produces hydrogen peroxide from glucose and oxygen. The hydrogen peroxide quantity
is then measured amperometrically with a (typically platinum) electrode. The vast
majority of monitoring systems sold today, whether continuous or blood meters, use
enzyme-coated electrodes and amperometric analysis.
4
There are several downsides to the current offerings of glucose meters. The blood
meters require a blood sample, which is a painful procedure. If repeatedly measured,
thick calluses can form on the fingertips causing more pain over time to draw blood.
Continuous glucose monitoring systems (CGMS) provide the ability to continuously
monitor glucose levels, but they require additional calibration to blood samples, as they
often measure interstitial fluid. Perhaps the greatest downside, however, is the cost of
current monitors. CGMS can cost several thousand dollars, and while blood monitors are
relatively inexpensive, the electrodes are disposable and become costly over time. A
single-use blood electrode strip costs about $1, and a CGMS 3-7 day sensor can cost $30-
$50. For people who measure their blood glucose level several times a day, the
measurement strips can become a significant expenditure.
Figure 2: Simplified glucose measurement method. [8]
5
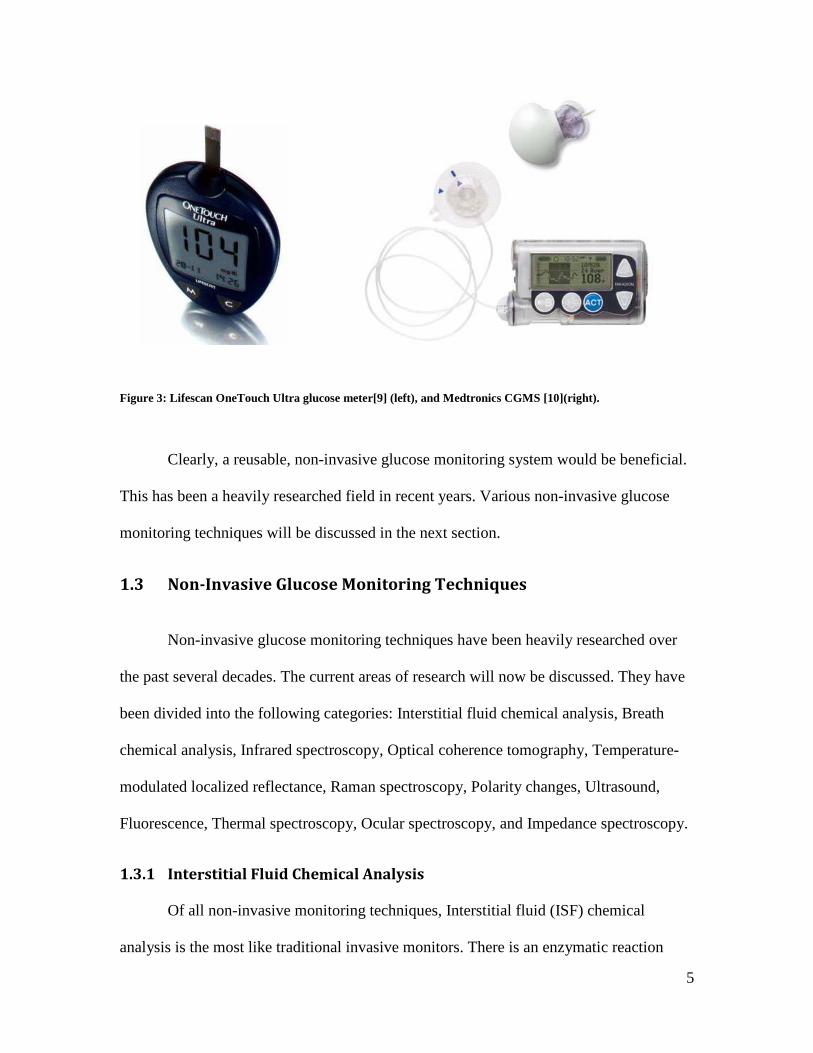
Clearly, a reusable, non-invasive glucose monitoring system would be beneficial.
This has been a heavily researched field in recent years. Various non-invasive glucose
monitoring techniques will be discussed in the next section.
1.3 Non-Invasive Glucose Monitoring Techniques Non-invasive glucose monitoring techniques have been heavily researched over
the past several decades. The current areas of research will now be discussed. They have
been divided into the following categories: Interstitial fluid chemical analysis, Breath
chemical analysis, Infrared spectroscopy, Optical coherence tomography, Temperature-
modulated localized reflectance, Raman spectroscopy, Polarity changes, Ultrasound,
Fluorescence, Thermal spectroscopy, Ocular spectroscopy, and Impedance spectroscopy.
1.3.1 Interstitial Fluid Chemical Analysis
Of all non-invasive monitoring techniques, Interstitial fluid (ISF) chemical
analysis is the most like traditional invasive monitors. There is an enzymatic reaction
Figure 3: Lifescan OneTouch Ultra glucose meter[9] (left), and Medtronics CGMS [10](right).
6
very similar to the one already described, except that the reaction is performed on ISF
that is excreted through the skin. The most significant ISF glucose monitor was called
Glucowatch®, designed by Cygnus inc[11]. The monitor was in a watch form factor,
with a disposable pad pressed against the skin to absorb the ISF. The Glucowatch® has
been shown able to effectively measure blood glucose levels in several clinical trials
[12],[13], and was approved by the FDA in 2001. The company that manufactured it,
however, has been shut down in 2005. It has been suggested that this was caused by a
combination of technical issues and high costs to the user (in addition to a $700 meter,
the cost of the disposable pads was greater than $5000 per year)[14]. It is unknown if
similar techniques are currently being used on new products.
1.3.2 Breath Chemical Analysis
Another chemical analysis technique involves the measurement of acetone in an
exhaled breath. It has been shown that the level of acetone in exhaled breaths sharply
rises in diabetic patients, and increases as a function of blood glucose levels. A system
has been designed which can chemically analyze exhaled air, which can be used to
determine blood glucose levels [15].
1.3.3 Infrared Spectroscopy Infrared spectroscopy can be separated into two categories, Near-infrared
spectroscopy (NIR) and Mid-Infrared spectroscopy (Mid-IR). NIR is a lower frequency
measurement in which the transmission and reflection of infrared light is used to
characterize blood glucose levels [16]. Some designs provide a depth resolution through
the use of a confocal system [17]. It is typically performed in an area of the body with
7
relatively thin tissue like an earlobe, upper lip, or finger web. Due to the frequency of the
light, this measurement is sensitive to changes in skin structure than can found in subjects
with chronic hyperglycemia. A recent investigation has also been performed into the
possibility of an NIR optical implant [18]. Mid-IR uses essentially the same technique as
NIR, although there is typically not enough light penetration at Mid-IR frequencies for
transmission analysis to be performed. As a result, only reflection analysis is used.
Infrared spectroscopy has not yet been shown to be a reliable measurement technique.
1.3.4 Optical Coherence Tomography Optical coherence tomography (OCT) is a specific form of light scattering
measurement in which the phase component of reflected light is measured. OCT utilizes a
low coherence (wide frequency spectrum) light source, which is sent from an
interferometer to a reference mirror and to the subject (typically an arm)[19]. The
reflected light from both the subject and the mirror are then correlated. By moving the
subject location and the reference mirror location, an image can be generated with both
lateral and in-depth scanning. An increase in ISF glucose levels causes an increase in
refractive index, which can be seen in the generated images.
1.3.5 Temperature-modulated localized reference Temperature-modulated localized reflectance is another form of light scattering
measurement. Tissue have varying refractive index based on temperature, but the
variation is also a factor of glucose concentrations [20]. By modulating skin temperature
between 22 and 38 degrees C, variations in light packets reflected can be used to
determine glucose levels.
8
1.3.6 Raman Spectroscopy Raman spectroscopy is a method in which an oscillation is generated in a fluid
which causes changes in light scattering properties [21]. Specifically, this technique can
be used to measure glucose concentrations in the front of the eye. A laser is used to
stimulate glucose molecules to oscillate in the ocular fluid. The scattered light from the
oscillation is an indicator of the glucose concentration. A negative to this technique is the
potential interference from other molecules.
1.3.7 Polarization Change Another optical technique being investigated in the eye is that of polarization
change. The polarization of a polarized light source will change angle slightly if it is
passed through a solution of chiral molecules, such as glucose [22]. While this technique
is feasible, pH and interfering compounds have prevented high specificity.
1.3.8 Ultrasound A promising technique for monitoring glucose levels exists that utilizes
ultrasound. Several types have been investigated, but they all essentially operate on the
same principles. A short laser burst is used to locally heat a small tissue area, which
causes an ultrasonic pulse to propagate through the tissue. The photoacoustic excitation is
dependent on the laser frequency. As the laser frequency is varied, the concentration of
glucose levels in fluids can be determined from the photoacoustic spectrum [23].
1.3.9 Fluorescence A study has demonstrated that fluorescence can be used as an indicator of glucose
concentrations [16]. By exciting tissue with an ultraviolet laser, the tissue generates
9
fluorescence at 380 nm, the intensity of which is dependent on glucose levels. This has
limited capabilities since the intensity is strongly affected by skin pigment and thickness.
1.3.10 Thermal Spectroscopy Thermal spectroscopy is the measurement of infrared radiation emitting from the
human body. While other factors are significant as well, glucose concentration has been
shown to have an absorptive effect on the quantity of human body infrared emission [11].
1.3.11 Ocular Spectroscopy Ocular spectroscopy is a method through which tears are chemically analyzed to
reveal glucose levels. A contact lens has been designed [24], which reacts with the
glucose in tears. When emitted with a light source, such as a laser, the reflected light
changes wavelength based upon the glucose concentration, which can be measured with a
spectrometer.
1.3.12 Impedance Spectroscopy Impedance spectroscopy is the study of interaction between electromagnetic
radiation and matter as a function of wavelength (λ). While other blood glucose
measurement techniques utilize infrared or visible light spectroscopy, this technique
focuses on the use of radio frequency radiation. This involves the measurement of the
impedance of human tissues in the radio frequency range, which will ultimately be used
to characterize blood glucose levels. While this describes the present work, there have
been other research groups that have investigated the possibility of a radio frequency
impedance spectroscopy system for blood glucose monitoring. They will be discussed at
greater length. The following research is supportive and encouraging to the present work,
10
but there are clear areas that were not investigated fully that are addressed later in this
paper.
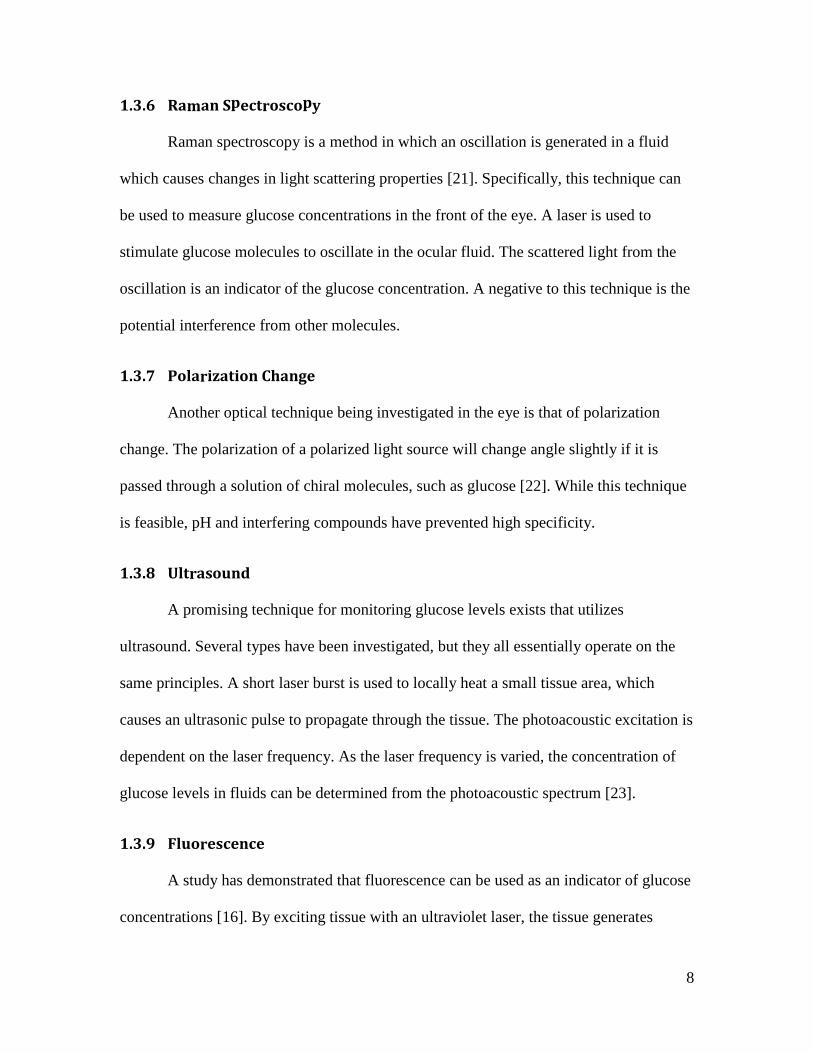
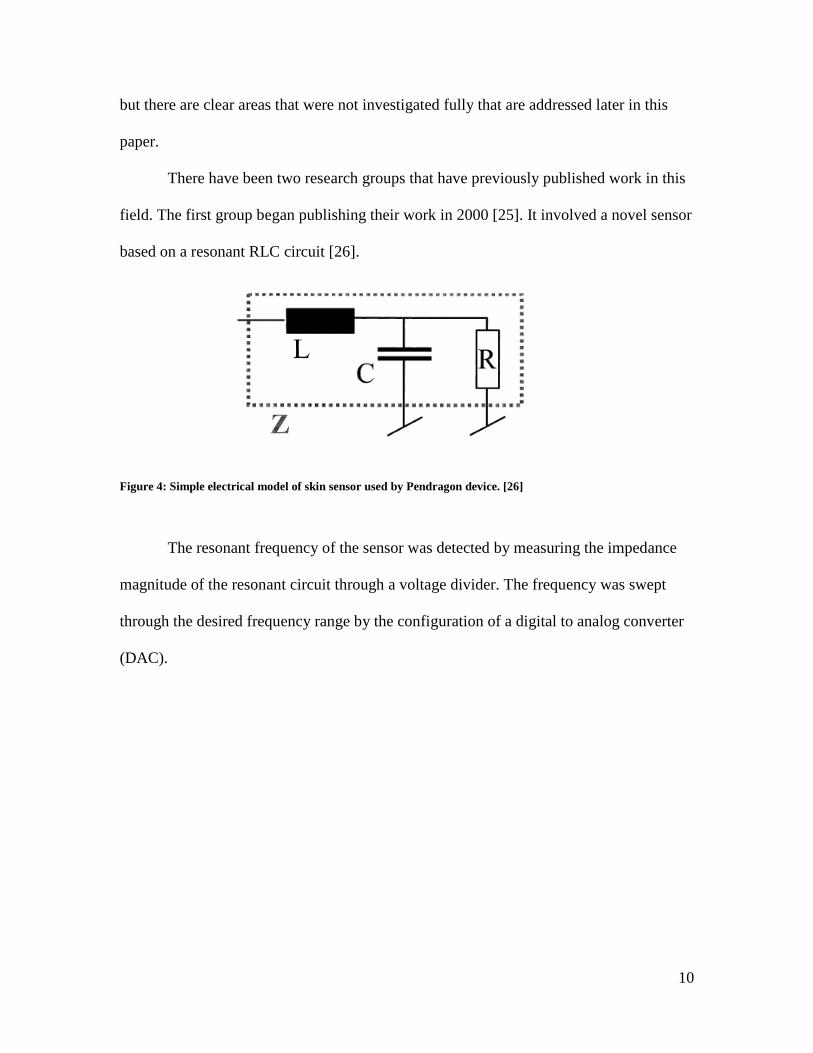
There have been two research groups that have previously published work in this
field. The first group began publishing their work in 2000 [25]. It involved a novel sensor
based on a resonant RLC circuit [26].
The resonant frequency of the sensor was detected by measuring the impedance
magnitude of the resonant circuit through a voltage divider. The frequency was swept
through the desired frequency range by the configuration of a digital to analog converter
(DAC).
Figure 4: Simple electrical model of skin sensor used by Pendragon device. [26]
11
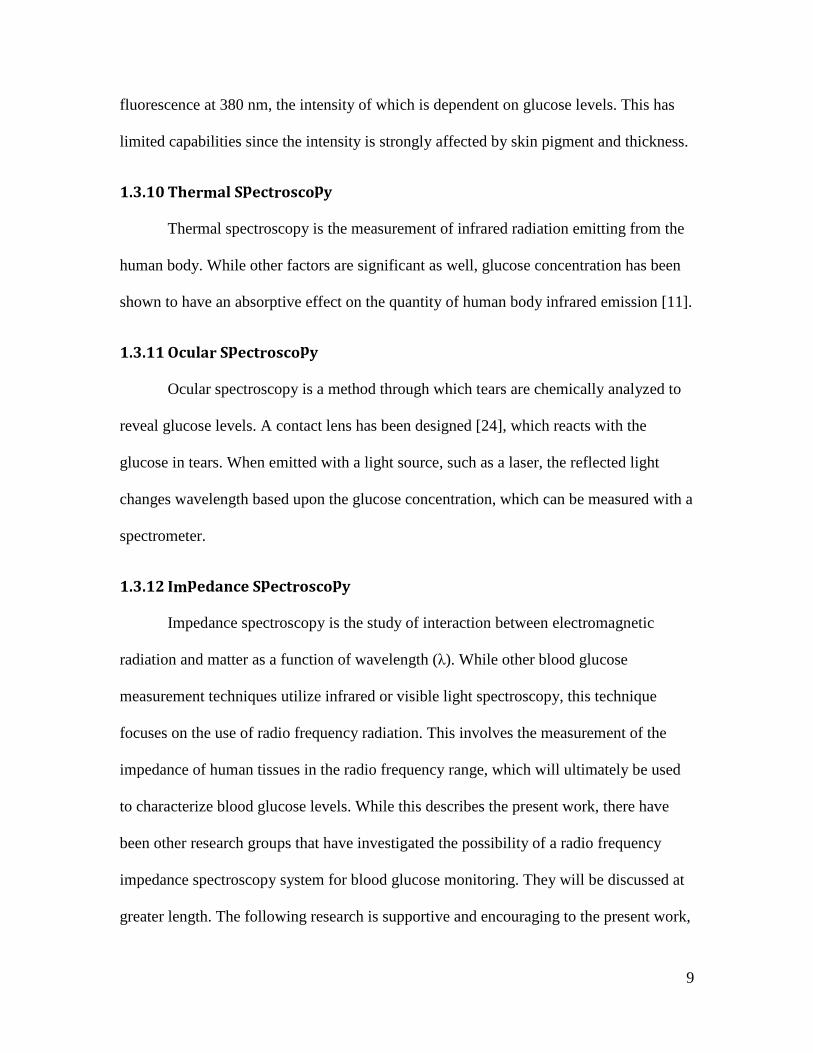
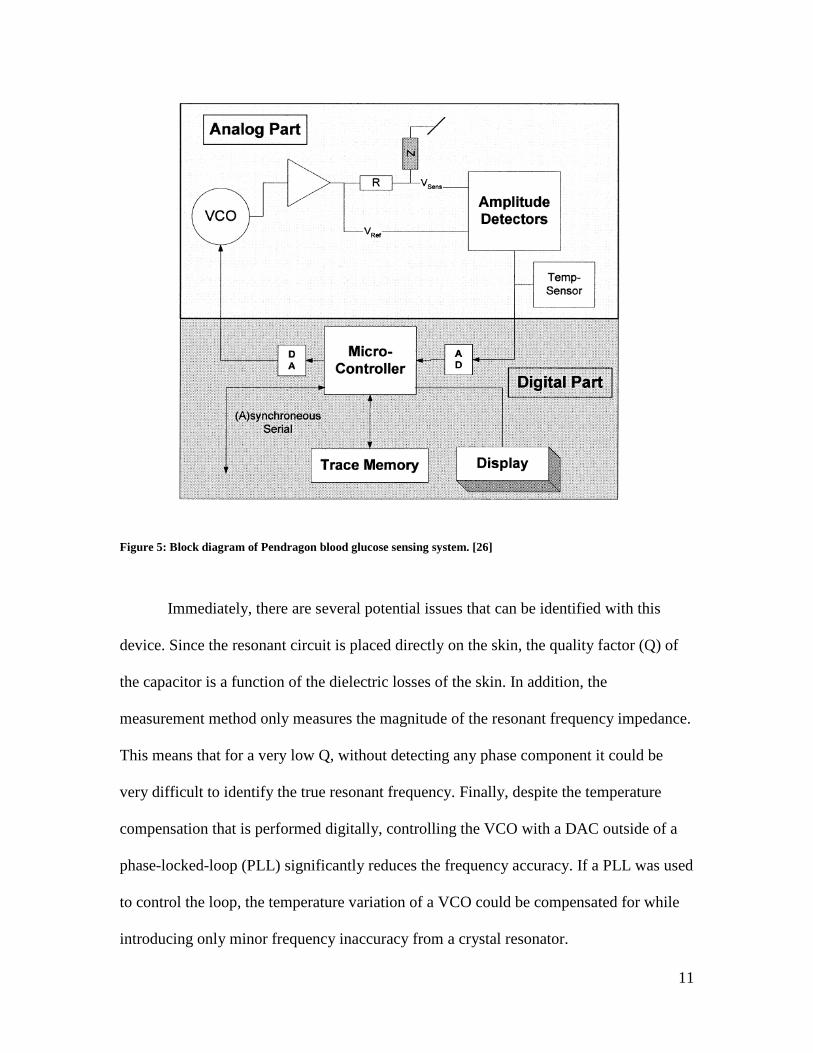
Immediately, there are several potential issues that can be identified with this
device. Since the resonant circuit is placed directly on the skin, the quality factor (Q) of
the capacitor is a function of the dielectric losses of the skin. In addition, the
measurement method only measures the magnitude of the resonant frequency impedance.
This means that for a very low Q, without detecting any phase component it could be
very difficult to identify the true resonant frequency. Finally, despite the temperature
compensation that is performed digitally, controlling the VCO with a DAC outside of a
phase-locked-loop (PLL) significantly reduces the frequency accuracy. If a PLL was used
to control the loop, the temperature variation of a VCO could be compensated for while
introducing only minor frequency inaccuracy from a crystal resonator.
Figure 5: Block diagram of Pendragon blood glucose sensing system. [26]
12
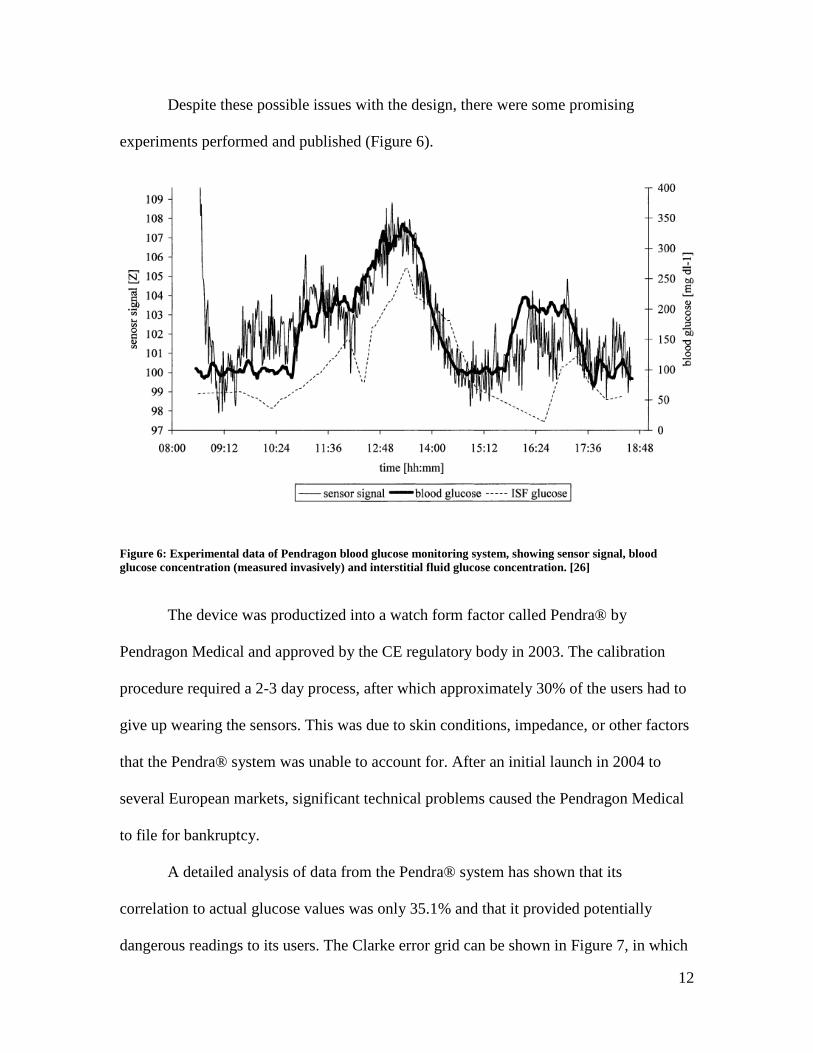
Despite these possible issues with the design, there were some promising
experiments performed and published (Figure 6).
The device was productized into a watch form factor called Pendra® by
Pendragon Medical and approved by the CE regulatory body in 2003. The calibration
procedure required a 2-3 day process, after which approximately 30% of the users had to
give up wearing the sensors. This was due to skin conditions, impedance, or other factors
that the Pendra® system was unable to account for. After an initial launch in 2004 to
several European markets, significant technical problems caused the Pendragon Medical
to file for bankruptcy.
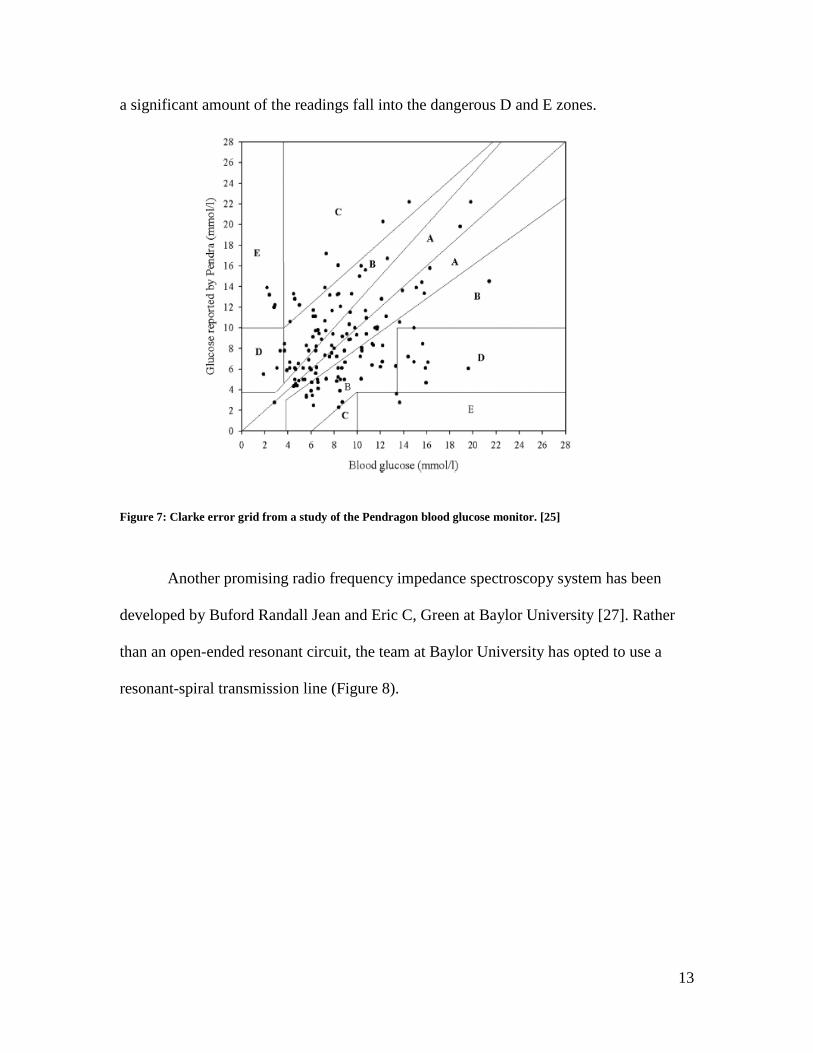
A detailed analysis of data from the Pendra® system has shown that its
correlation to actual glucose values was only 35.1% and that it provided potentially
dangerous readings to its users. The Clarke error grid can be shown in Figure 7, in which
Figure 6: Experimental data of Pendragon blood glucose monitoring system, showing sensor signal, blood glucose concentration (measured invasively) and interstitial fluid glucose concentration. [26]
13
a significant amount of the readings fall into the dangerous D and E zones.
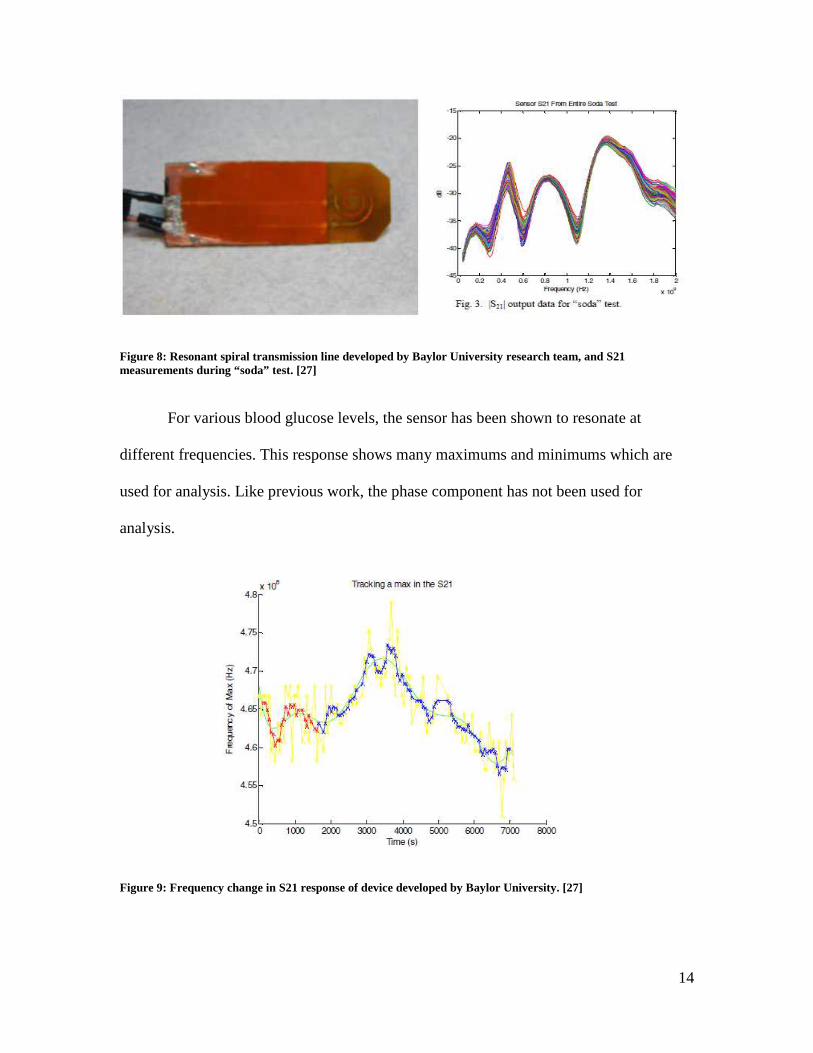
Another promising radio frequency impedance spectroscopy system has been
developed by Buford Randall Jean and Eric C, Green at Baylor University [27]. Rather
than an open-ended resonant circuit, the team at Baylor University has opted to use a
resonant-spiral transmission line (Figure 8).
Figure 7: Clarke error grid from a study of the Pendragon blood glucose monitor. [25]
14
For various blood glucose levels, the sensor has been shown to resonate at
different frequencies. This response shows many maximums and minimums which are
used for analysis. Like previous work, the phase component has not been used for
analysis.
Figure 9: Frequency change in S21 response of device developed by Baylor University. [27]
Figure 8: Resonant spiral transmission line developed by Baylor University research team, and S21 measurements during “soda” test. [27]
15
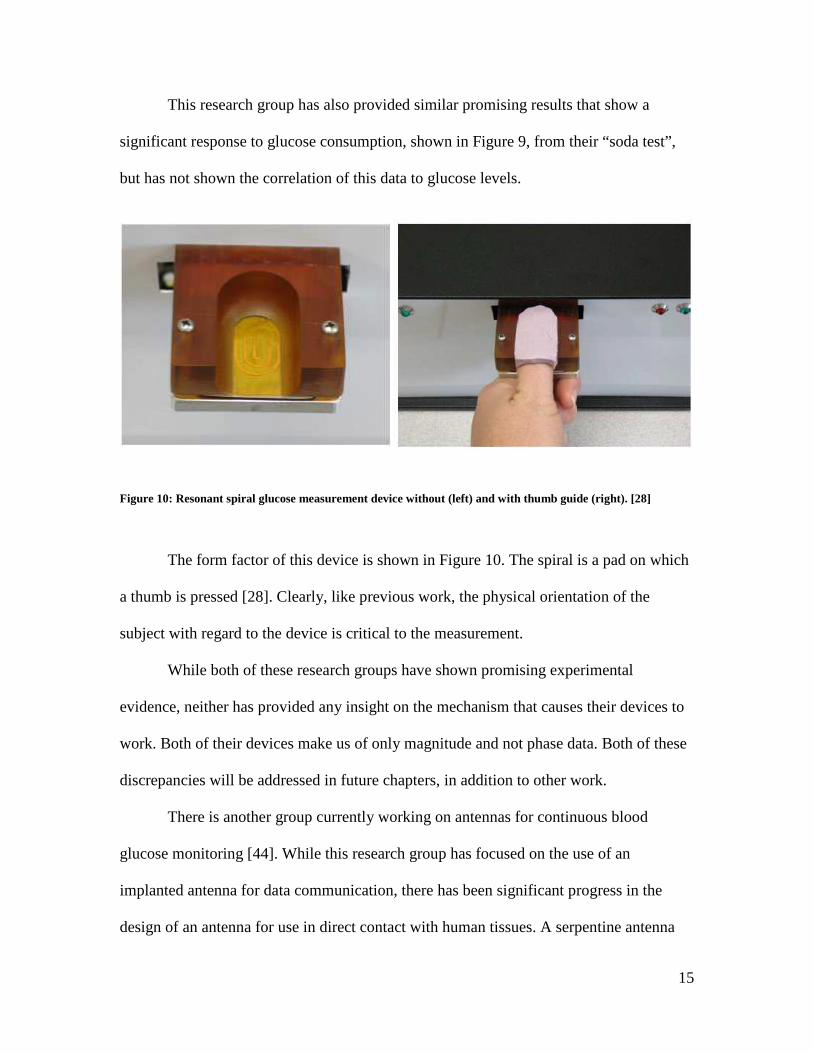
This research group has also provided similar promising results that show a
significant response to glucose consumption, shown in Figure 9, from their “soda test”,
but has not shown the correlation of this data to glucose levels.
The form factor of this device is shown in Figure 10. The spiral is a pad on which
a thumb is pressed [28]. Clearly, like previous work, the physical orientation of the
subject with regard to the device is critical to the measurement.
While both of these research groups have shown promising experimental
evidence, neither has provided any insight on the mechanism that causes their devices to
work. Both of their devices make us of only magnitude and not phase data. Both of these
discrepancies will be addressed in future chapters, in addition to other work.
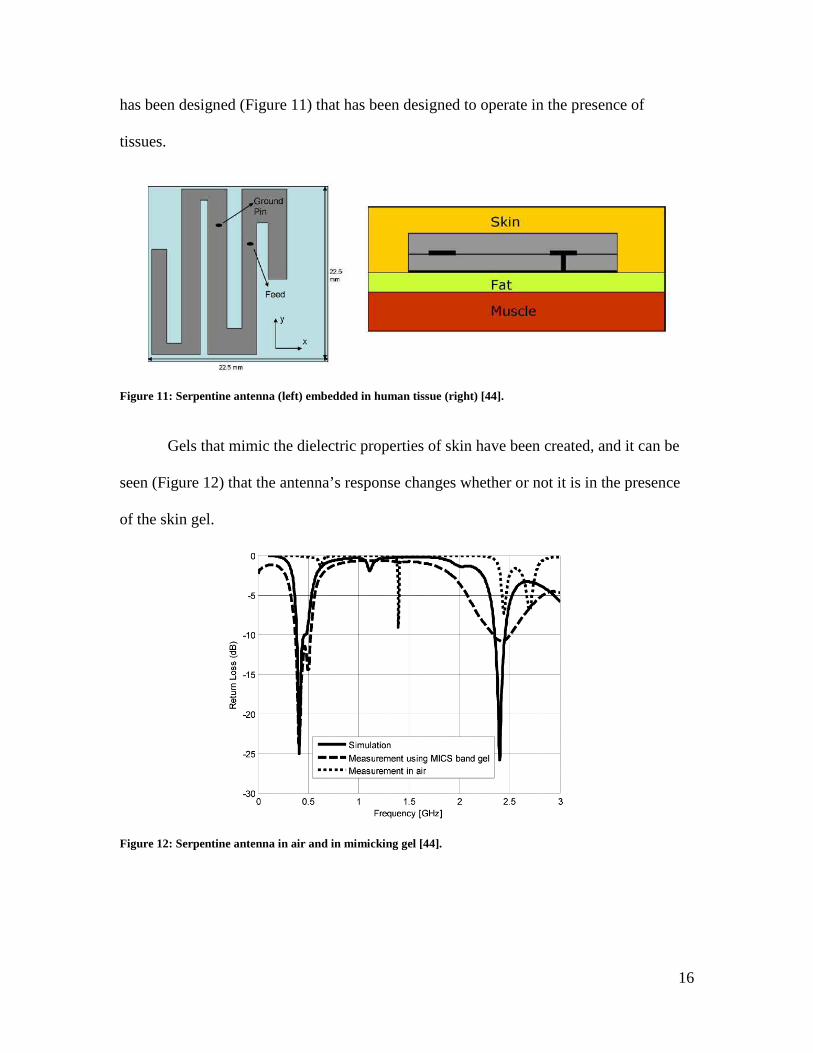
There is another group currently working on antennas for continuous blood
glucose monitoring [44]. While this research group has focused on the use of an
implanted antenna for data communication, there has been significant progress in the
design of an antenna for use in direct contact with human tissues. A serpentine antenna
Figure 10: Resonant spiral glucose measurement device without (left) and with thumb guide (right). [28]
16
has been designed (Figure 11) that has been designed to operate in the presence of
tissues.
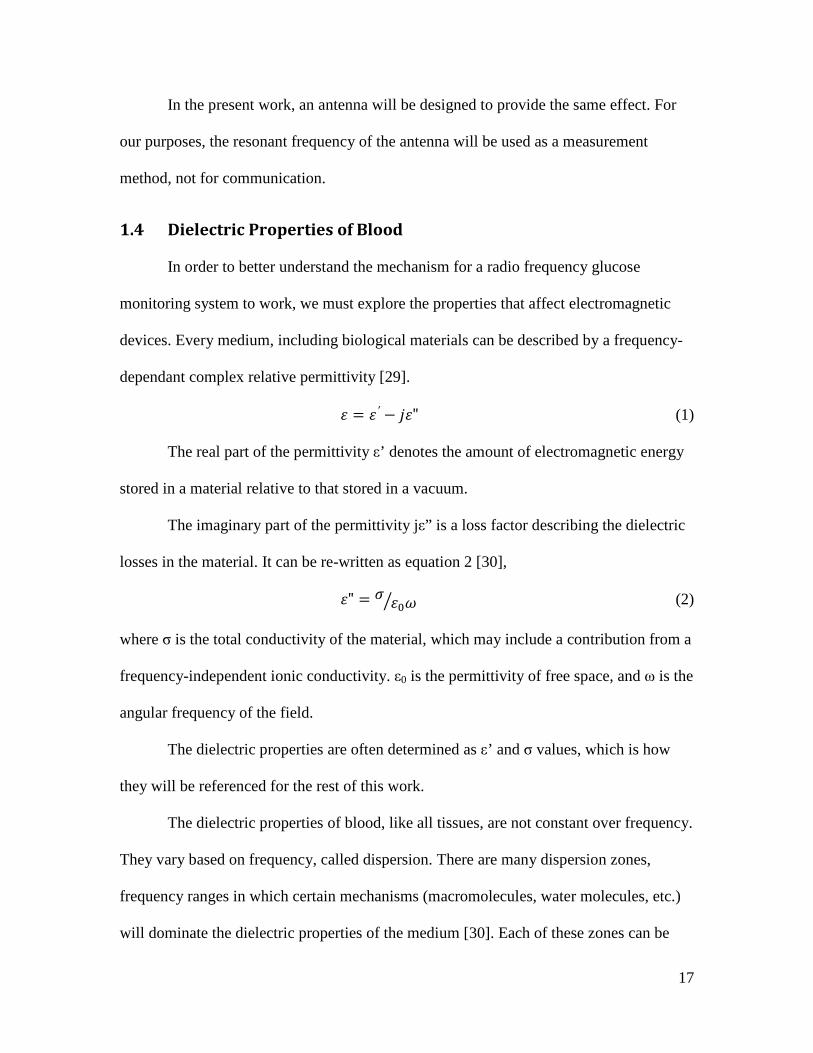
Gels that mimic the dielectric properties of skin have been created, and it can be
seen (Figure 12) that the antenna’s response changes whether or not it is in the presence
of the skin gel.
Figure 11: Serpentine antenna (left) embedded in human tissue (right) [44].
Figure 12: Serpentine antenna in air and in mimicking gel [44].
17
In the present work, an antenna will be designed to provide the same effect. For
our purposes, the resonant frequency of the antenna will be used as a measurement
method, not for communication.
1.4 Dielectric Properties of Blood
In order to better understand the mechanism for a radio frequency glucose
monitoring system to work, we must explore the properties that affect electromagnetic
devices. Every medium, including biological materials can be described by a frequency-
dependant complex relative permittivity [29].
′ " (1)
The real part of the permittivity ε’ denotes the amount of electromagnetic energy
stored in a material relative to that stored in a vacuum.
The imaginary part of the permittivity jε” is a loss factor describing the dielectric
losses in the material. It can be re-written as equation 2 [30],
" (2)
where σ is the total conductivity of the material, which may include a contribution from a
frequency-independent ionic conductivity. ε0 is the permittivity of free space, and ω is the
angular frequency of the field.
The dielectric properties are often determined as ε’ and σ values, which is how
they will be referenced for the rest of this work.
The dielectric properties of blood, like all tissues, are not constant over frequency.
They vary based on frequency, called dispersion. There are many dispersion zones,
frequency ranges in which certain mechanisms (macromolecules, water molecules, etc.)
will dominate the dielectric properties of the medium [30]. Each of these zones can be
18
modeled with separate term of a Debye or Cole-Cole Model. Both of these models have
multiple terms that can be used to describe the dielectric properties of a medium
accurately. These models have already been used extensively by research groups to
characterize blood, as well as other human tissues. They will be discussed later in greater
detail.
There has already been extensive characterization of blood dielectric properties
[31]. In 1996, a research group from King’s College published a thorough series of
papers in which blood and 16 other types of human tissue were measured with an
impedance analyzer and modeled [32]. This information has been modeled and compiled
into a database which has served as a reference for human tissue dielectric properties.
While human tissue dielectric properties have been characterized, there is little
information present regarding the effect of blood glucose levels on blood dielectric
properties in the radio frequency range. What little studies have been performed will now
be discussed.
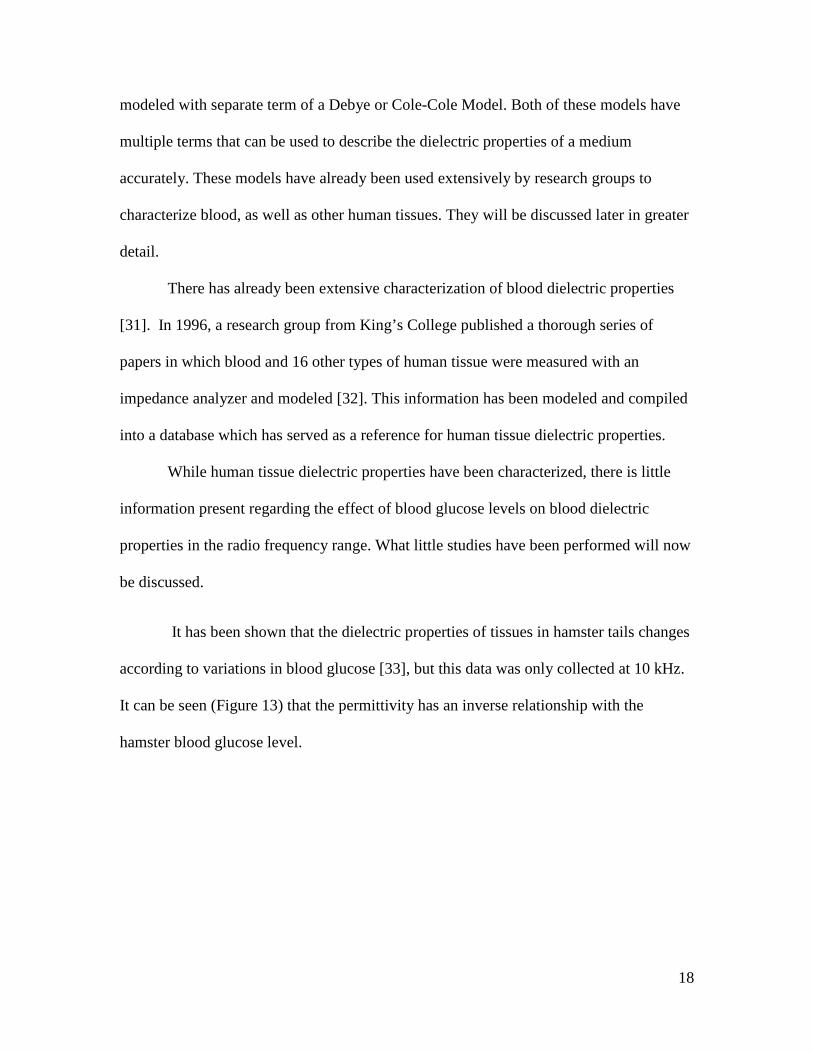
It has been shown that the dielectric properties of tissues in hamster tails changes
according to variations in blood glucose [33], but this data was only collected at 10 kHz.
It can be seen (Figure 13) that the permittivity has an inverse relationship with the
hamster blood glucose level.
19
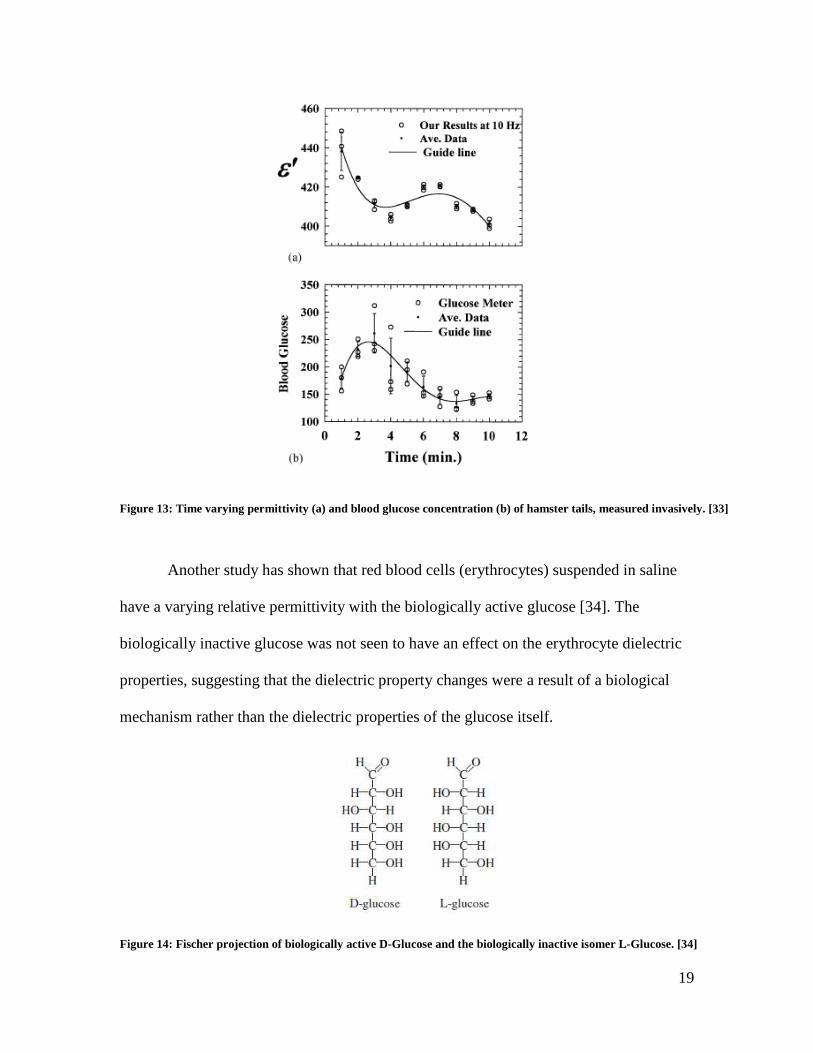
Another study has shown that red blood cells (erythrocytes) suspended in saline
have a varying relative permittivity with the biologically active glucose [34]. The
biologically inactive glucose was not seen to have an effect on the erythrocyte dielectric
properties, suggesting that the dielectric property changes were a result of a biological
mechanism rather than the dielectric properties of the glucose itself.
Figure 14: Fischer projection of biologically active D-Glucose and the biologically inactive isomer L-Glucose. [34]
Figure 13: Time varying permittivity (a) and blood glucose concentration (b) of hamster tails, measured invasively. [33]
20
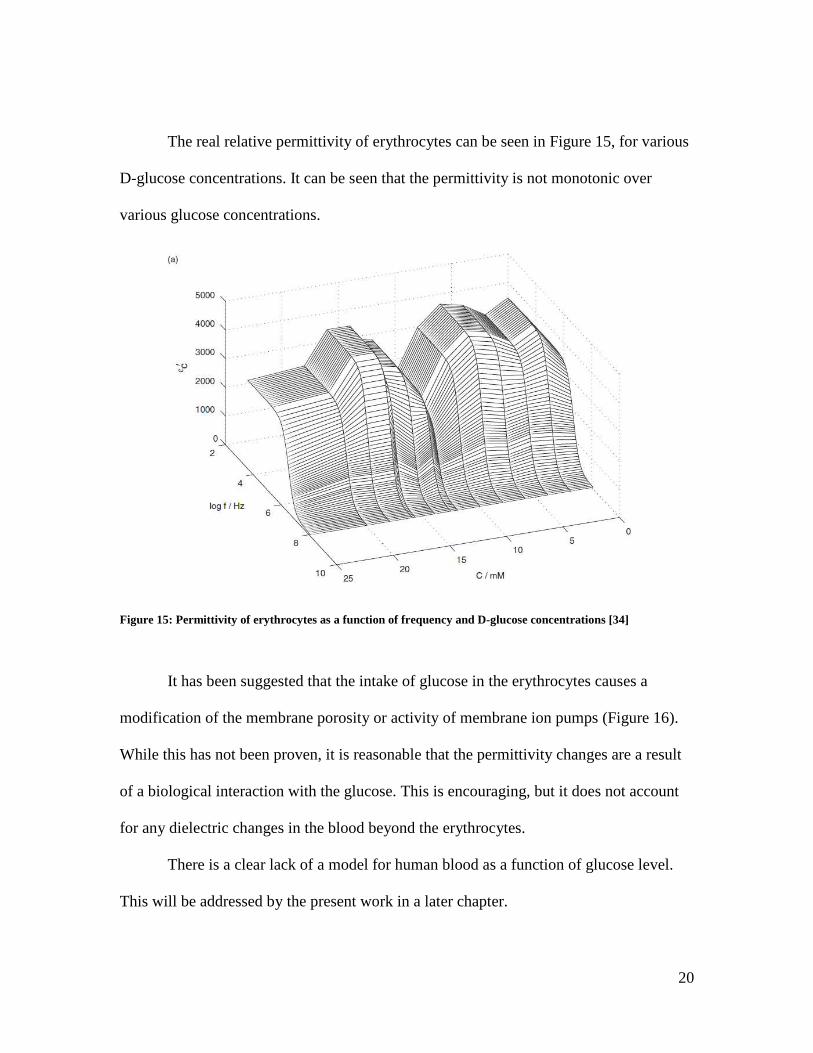
The real relative permittivity of erythrocytes can be seen in Figure 15, for various
D-glucose concentrations. It can be seen that the permittivity is not monotonic over
various glucose concentrations.
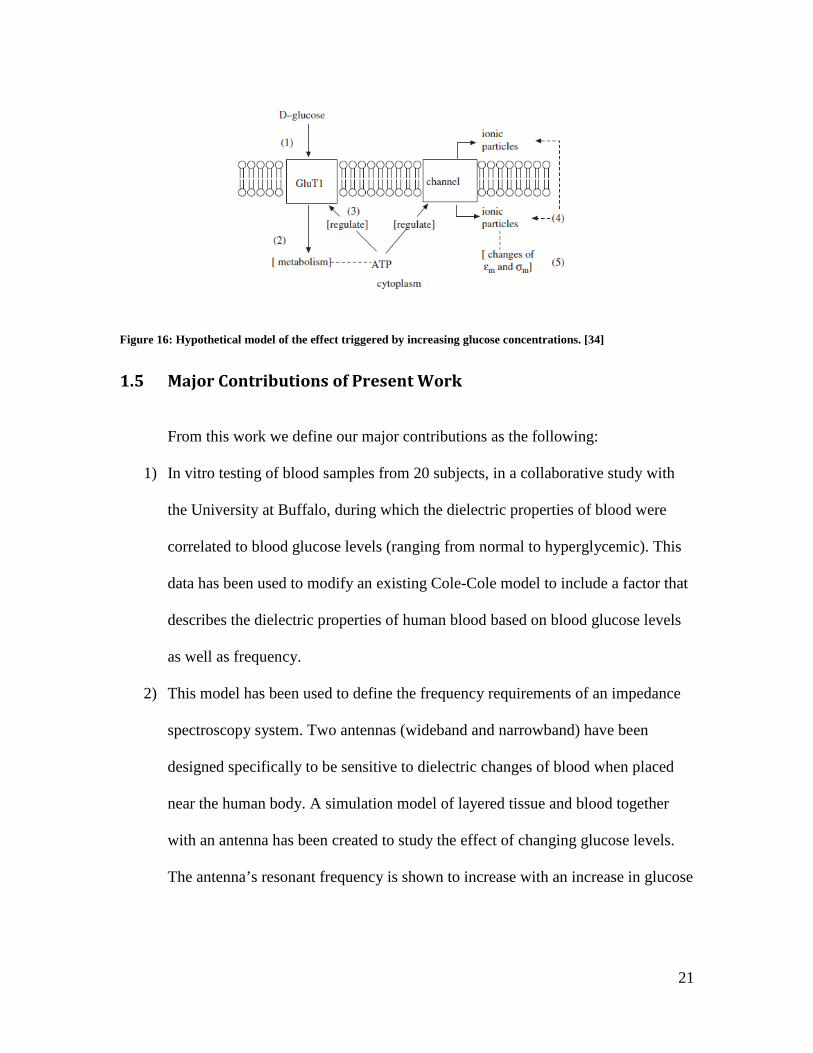
It has been suggested that the intake of glucose in the erythrocytes causes a
modification of the membrane porosity or activity of membrane ion pumps (Figure 16).
While this has not been proven, it is reasonable that the permittivity changes are a result
of a biological interaction with the glucose. This is encouraging, but it does not account
for any dielectric changes in the blood beyond the erythrocytes.
There is a clear lack of a model for human blood as a function of glucose level.
This will be addressed by the present work in a later chapter.
Figure 15: Permittivity of erythrocytes as a function of frequency and D-glucose concentrations [34]
21
1.5 Major Contributions of Present Work
From this work we define our major contributions as the following:
1) In vitro testing of blood samples from 20 subjects, in a collaborative study with
the University at Buffalo, during which the dielectric properties of blood were
correlated to blood glucose levels (ranging from normal to hyperglycemic). This
data has been used to modify an existing Cole-Cole model to include a factor that
describes the dielectric properties of human blood based on blood glucose levels
as well as frequency.
2) This model has been used to define the frequency requirements of an impedance
spectroscopy system. Two antennas (wideband and narrowband) have been
designed specifically to be sensitive to dielectric changes of blood when placed
near the human body. A simulation model of layered tissue and blood together
with an antenna has been created to study the effect of changing glucose levels.
The antenna’s resonant frequency is shown to increase with an increase in glucose
Figure 16: Hypothetical model of the effect triggered by increasing glucose concentrations. [34]
22
levels. An analytical model for the narrowband antenna has been developed,
which has been validated with simulations.
3) A measurement system has been developed to measure the resonant frequency of
the antenna. Through the use of a frequency synthesizer, directional coupler, log
amp and a microprocessor, the board is able to calculate the antenna’s reflection
coefficient and determine the resonant frequency. An experimental verification
has been performed, in which an antenna and measurement system were strapped
(one on each leg) to a patient. The antenna’s resonant frequency was measured by
a PNA, and the measurement system recorded data as the patient ingested fast
acting glucose tablets. A comparison of the resonant frequency of the antenna
measured by the PNA and by the measurement system showed good agreement. It
is also shown that the antenna’s resonant frequencies increases as the glucose
level increases, which is consistent with the simulation model.
1.6 Organization of Present Work Chapter 1 serves to present the previous work that has been done up to this point,
in the field of non-invasive blood glucose monitoring and blood dielectric properties, as
well as presenting the major contributions to the field as provided by this paper.
Chapter 2 will address the dielectric properties of blood in more detail.
Specifically, this will involve in vitro measurements of blood samples, from which a
realistic model will be created that is a function of frequency and blood glucose
concentrations. This model will be compared to accepted models of previous work.
Chapter 3 will present a feasibility study for non-invasive blood glucose
monitoring through simulation. Utilizing the derived model, an antenna will be designed
23
that will be shown to effectively measure changed in blood glucose levels. Simulated
results will be presented.
Chapter 4 will present a prototype of a non-invasive blood glucose monitoring
system. The system will be manufactured and shown to operate as intended, while
achieving a body-worn form factor. Experimental measurements of the antenna will be
presented and shown to agree well with the measurement system.
Chapter 5 will conclude this work by discussing results, reiterating the major
contributions of the present work, and describing future possible work in the field.
24
2. Dielectric Properties of Blood
2.1 Experimental Blood Measurements
Previous work has shown that there is a relationship between the dielectric
properties of blood and the glucose concentration. This relationship, while highly
referenced, has had very little research. One of the major contributions of the present
work is to provide a model that could be used for future research in this field.
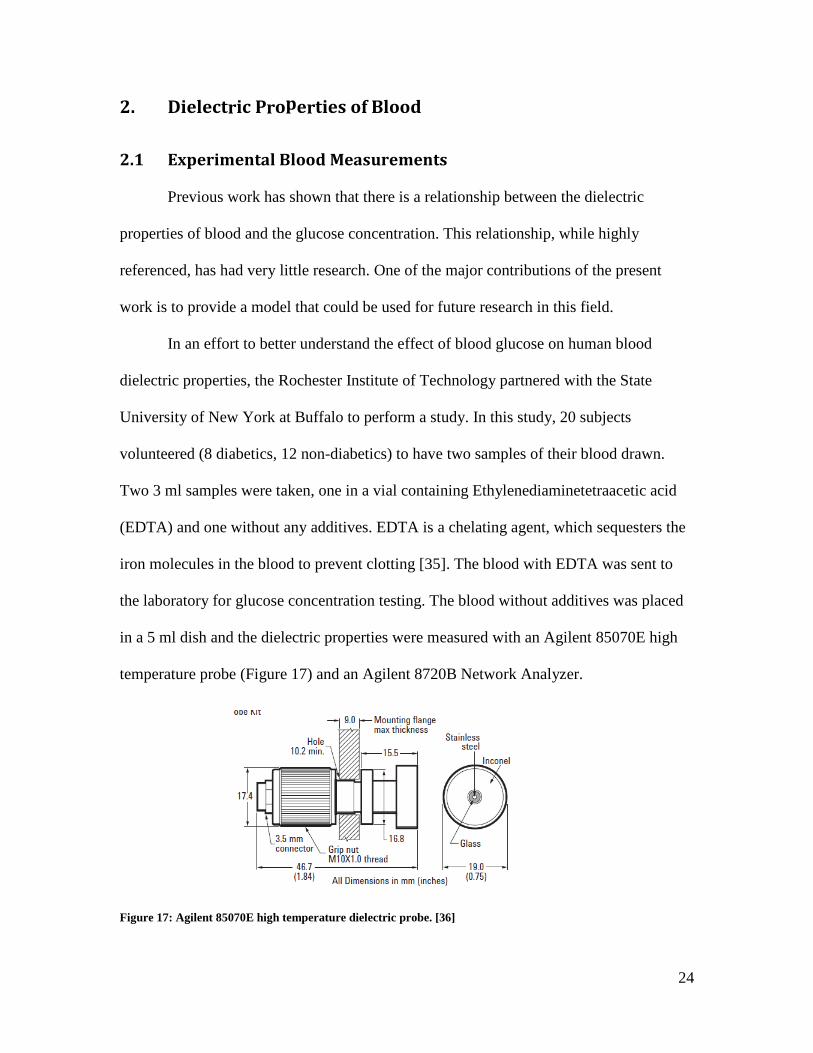
In an effort to better understand the effect of blood glucose on human blood
dielectric properties, the Rochester Institute of Technology partnered with the State
University of New York at Buffalo to perform a study. In this study, 20 subjects
volunteered (8 diabetics, 12 non-diabetics) to have two samples of their blood drawn.
Two 3 ml samples were taken, one in a vial containing Ethylenediaminetetraacetic acid
(EDTA) and one without any additives. EDTA is a chelating agent, which sequesters the
iron molecules in the blood to prevent clotting [35]. The blood with EDTA was sent to
the laboratory for glucose concentration testing. The blood without additives was placed
in a 5 ml dish and the dielectric properties were measured with an Agilent 85070E high
temperature probe (Figure 17) and an Agilent 8720B Network Analyzer.
Figure 17: Agilent 85070E high temperature dielectric probe. [36]
25
2.2 Models for Characterizing Dielectric Properties of Tissue
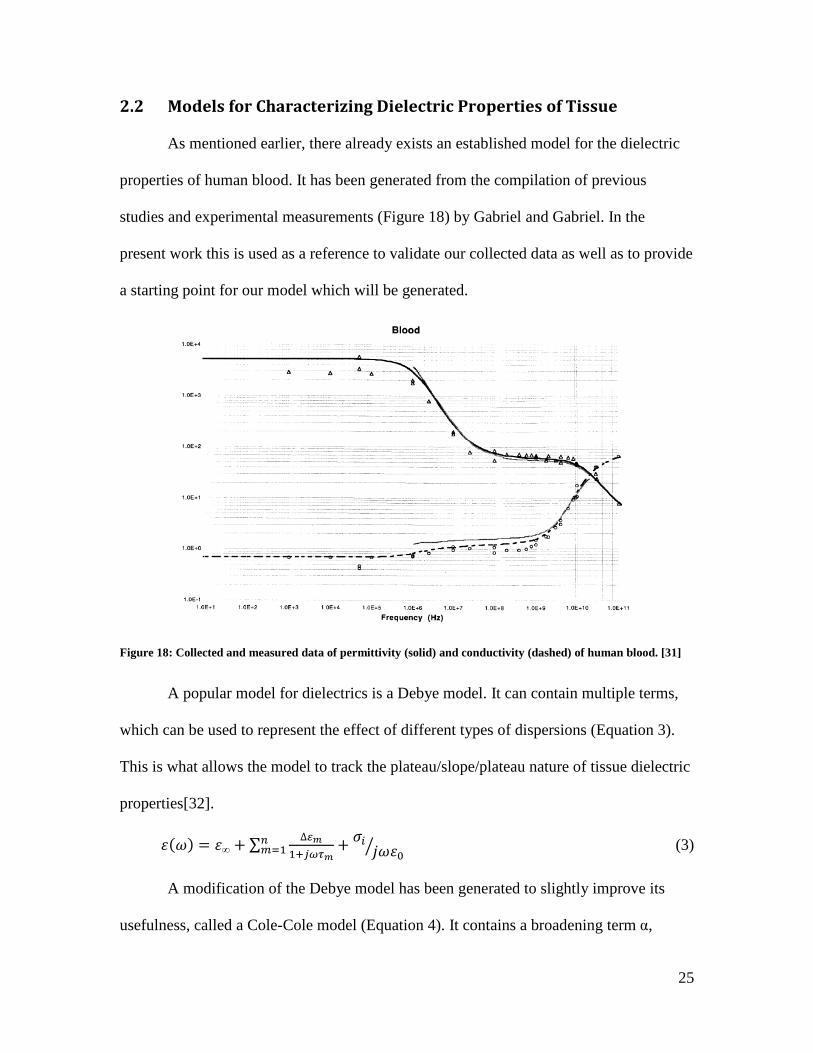
As mentioned earlier, there already exists an established model for the dielectric
properties of human blood. It has been generated from the compilation of previous
studies and experimental measurements (Figure 18) by Gabriel and Gabriel. In the
present work this is used as a reference to validate our collected data as well as to provide
a starting point for our model which will be generated.
A popular model for dielectrics is a Debye model. It can contain multiple terms,
which can be used to represent the effect of different types of dispersions (Equation 3).
This is what allows the model to track the plateau/slope/plateau nature of tissue dielectric
properties[32].
∞ ∑ ∆
(3)
A modification of the Debye model has been generated to slightly improve its
usefulness, called a Cole-Cole model (Equation 4). It contains a broadening term α,
Figure 18: Collected and measured data of permittivity (solid) and conductivity (dashed) of human blood. [31]
26
which can be used to set the frequency range over which each term will dominate the
equation[32].
∞ ∑ ∆
(4)
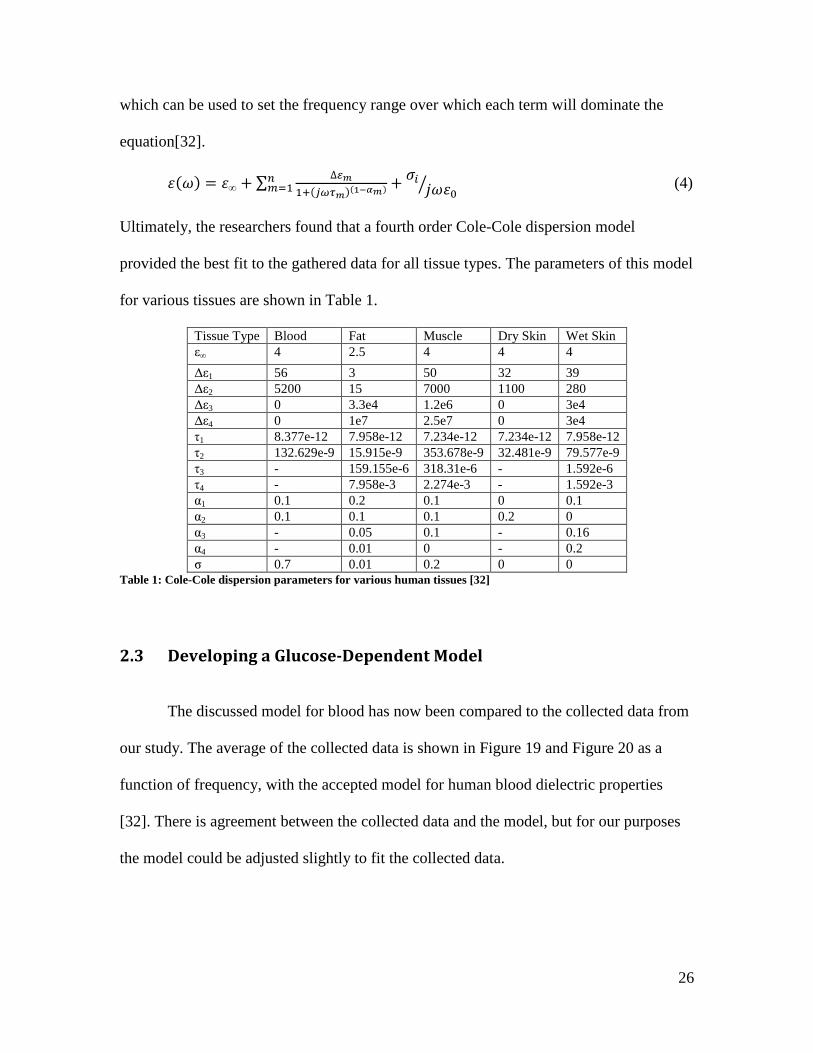
Ultimately, the researchers found that a fourth order Cole-Cole dispersion model
provided the best fit to the gathered data for all tissue types. The parameters of this model
for various tissues are shown in Table 1.
Tissue Type Blood Fat Muscle Dry Skin Wet Skin ε∞ 4 2.5 4 4 4
∆ε1 56 3 50 32 39 ∆ε2 5200 15 7000 1100 280 ∆ε3 0 3.3e4 1.2e6 0 3e4 ∆ε4 0 1e7 2.5e7 0 3e4 τ1 8.377e-12 7.958e-12 7.234e-12 7.234e-12 7.958e-12 τ2 132.629e-9 15.915e-9 353.678e-9 32.481e-9 79.577e-9 τ3 - 159.155e-6 318.31e-6 - 1.592e-6 τ4 - 7.958e-3 2.274e-3 - 1.592e-3 α1 0.1 0.2 0.1 0 0.1 α2 0.1 0.1 0.1 0.2 0 α3 - 0.05 0.1 - 0.16 α4 - 0.01 0 - 0.2 σ 0.7 0.01 0.2 0 0
Table 1: Cole-Cole dispersion parameters for various human tissues [32]
2.3 Developing a Glucose-Dependent Model
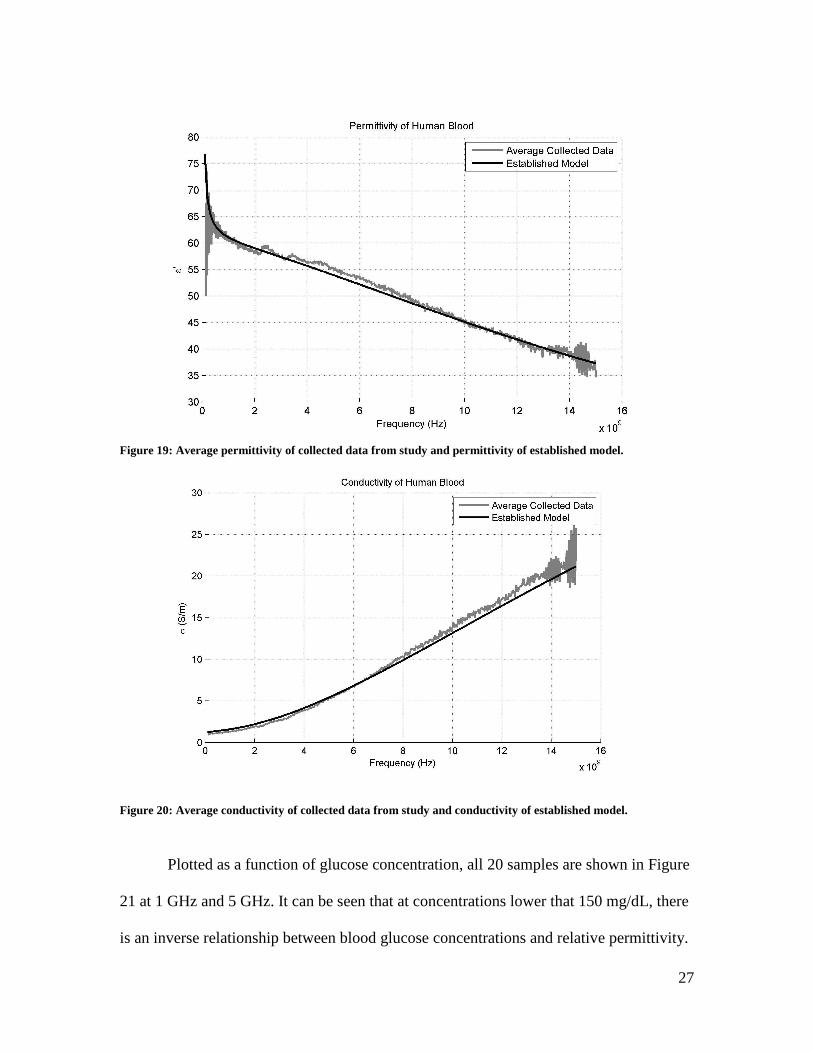
The discussed model for blood has now been compared to the collected data from
our study. The average of the collected data is shown in Figure 19 and Figure 20 as a
function of frequency, with the accepted model for human blood dielectric properties
[32]. There is agreement between the collected data and the model, but for our purposes
the model could be adjusted slightly to fit the collected data.
27
Figure 19: Average permittivity of collected data from study and permittivity of established model.
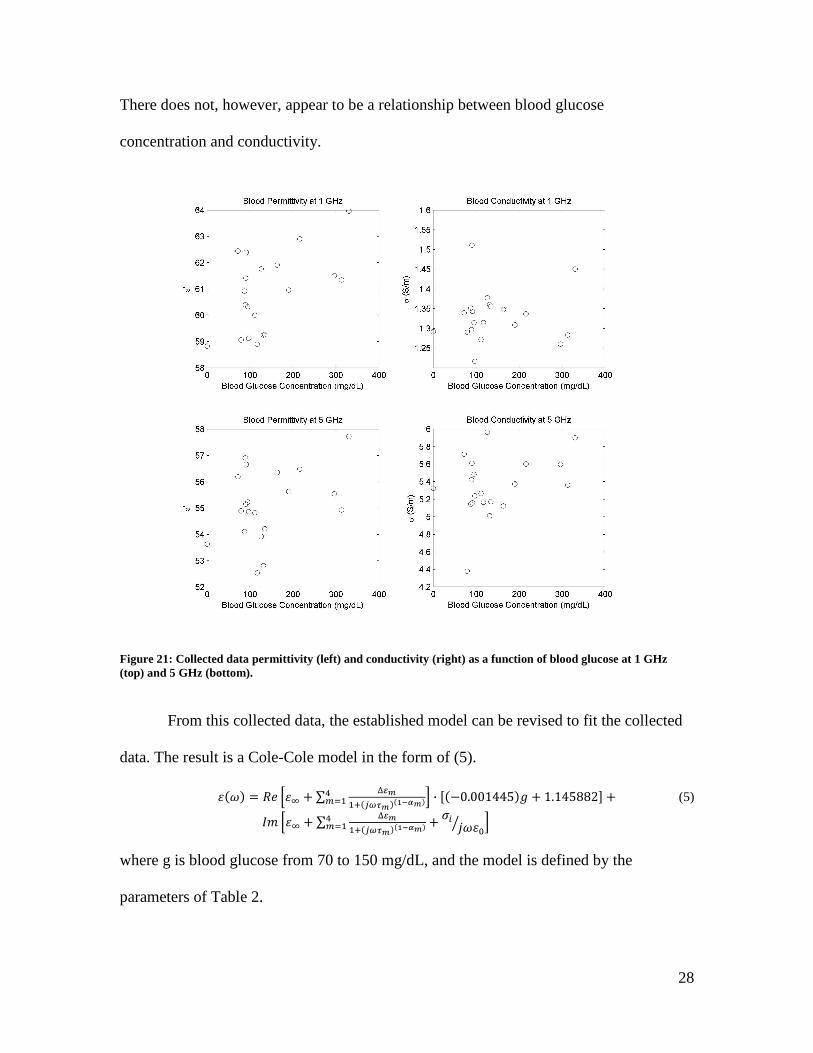
Plotted as a function of glucose concentration, all 20 samples are shown in Figure
21 at 1 GHz and 5 GHz. It can be seen that at concentrations lower that 150 mg/dL, there
is an inverse relationship between blood glucose concentrations and relative permittivity.
Figure 20: Average conductivity of collected data from study and conductivity of established model.
28
There does not, however, appear to be a relationship between blood glucose
concentration and conductivity.
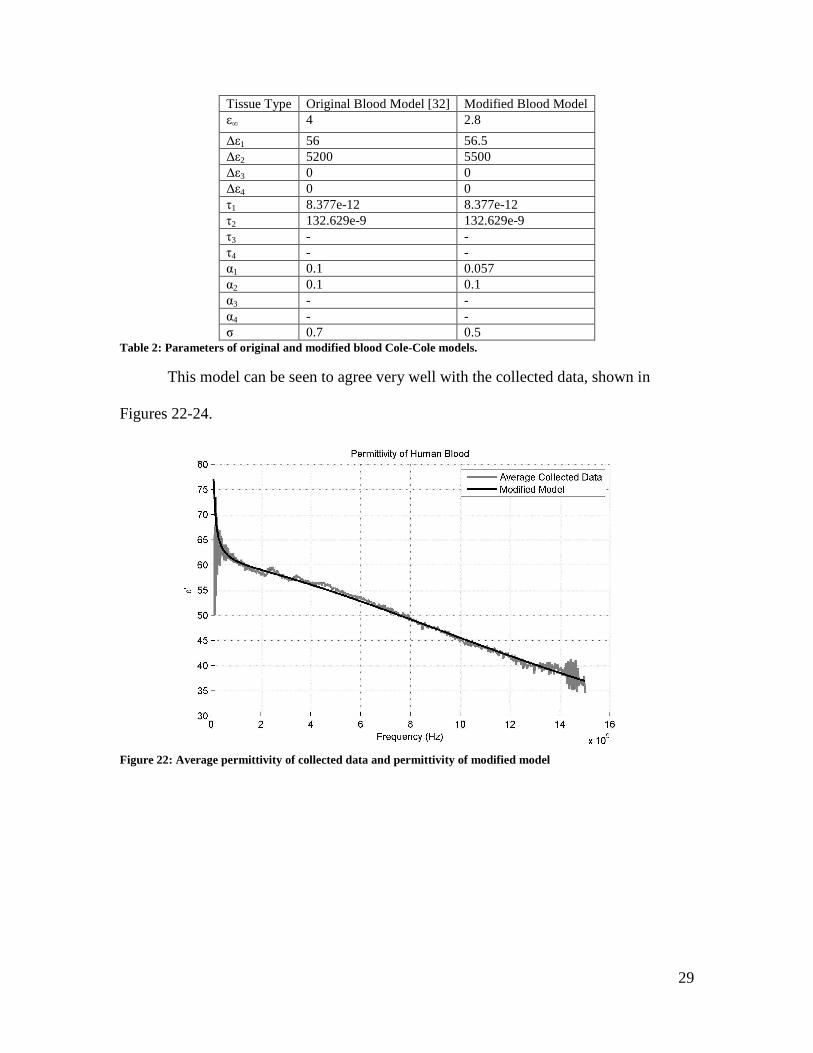
From this collected data, the established model can be revised to fit the collected
data. The result is a Cole-Cole model in the form of (5).
∑ ∆
· 0.001445 1.145882 (5)
∑ ∆
where g is blood glucose from 70 to 150 mg/dL, and the model is defined by the
parameters of Table 2.
Figure 21: Collected data permittivity (left) and conductivity (right) as a function of blood glucose at 1 GHz (top) and 5 GHz (bottom).
29
Tissue Type Original Blood Model [32] Modified Blood Model ε∞ 4 2.8
∆ε1 56 56.5 ∆ε2 5200 5500 ∆ε3 0 0 ∆ε4 0 0 τ1 8.377e-12 8.377e-12 τ2 132.629e-9 132.629e-9 τ3 - - τ4 - - α1 0.1 0.057 α2 0.1 0.1 α3 - - α4 - - σ 0.7 0.5
Table 2: Parameters of original and modified blood Cole-Cole models.
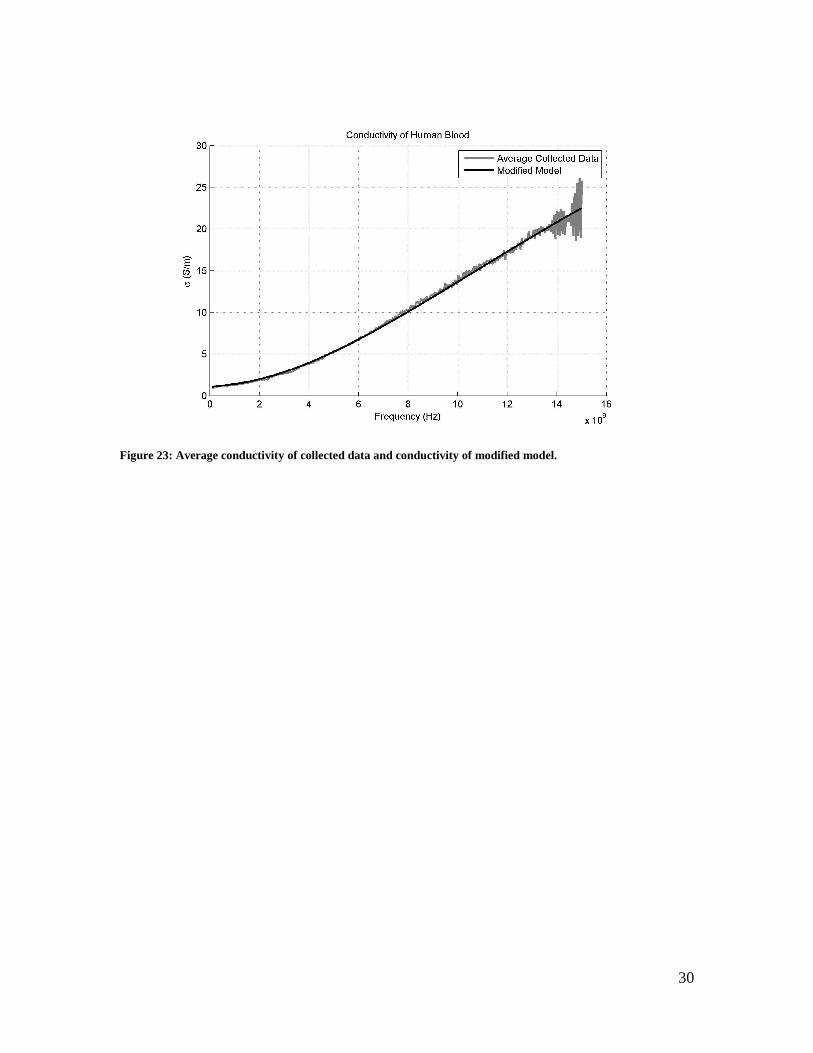
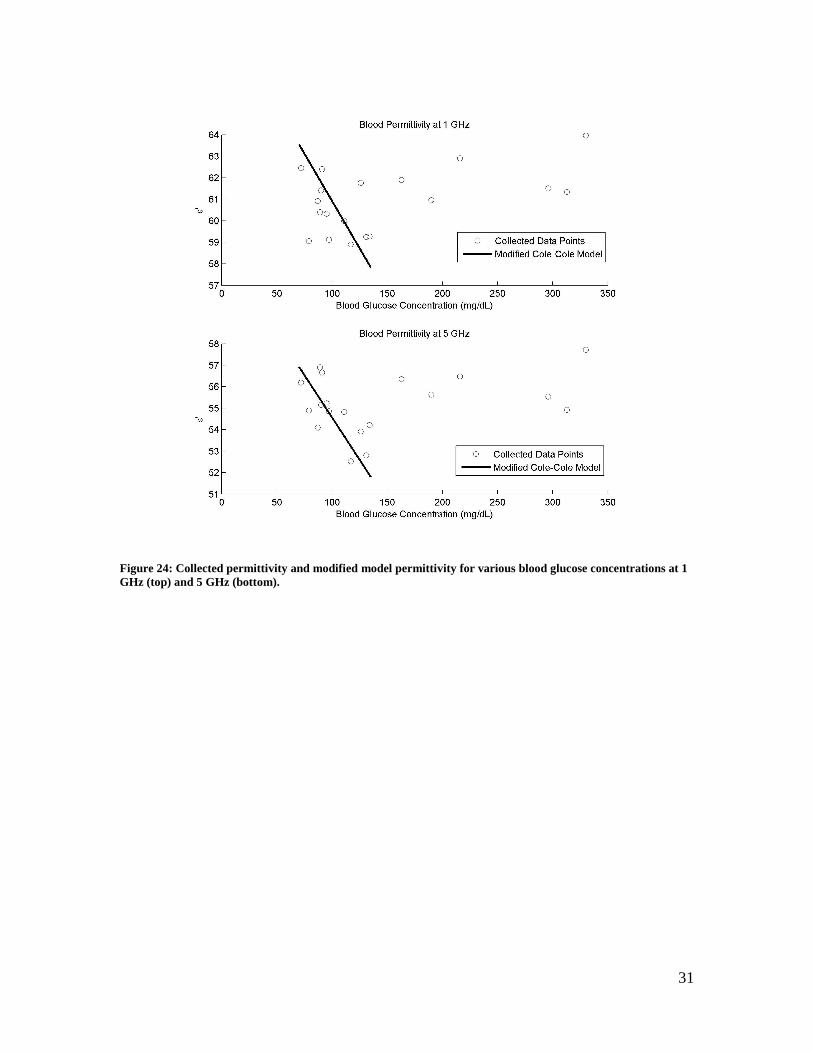
This model can be seen to agree very well with the collected data, shown in
Figures 22-24.
Figure 22: Average permittivity of collected data and permittivity of modified model
30
Figure 23: Average conductivity of collected data and conductivity of modified model.
31
Figure 24: Collected permittivity and modified model permittivity for various blood glucose concentrations at 1 GHz (top) and 5 GHz (bottom).
32
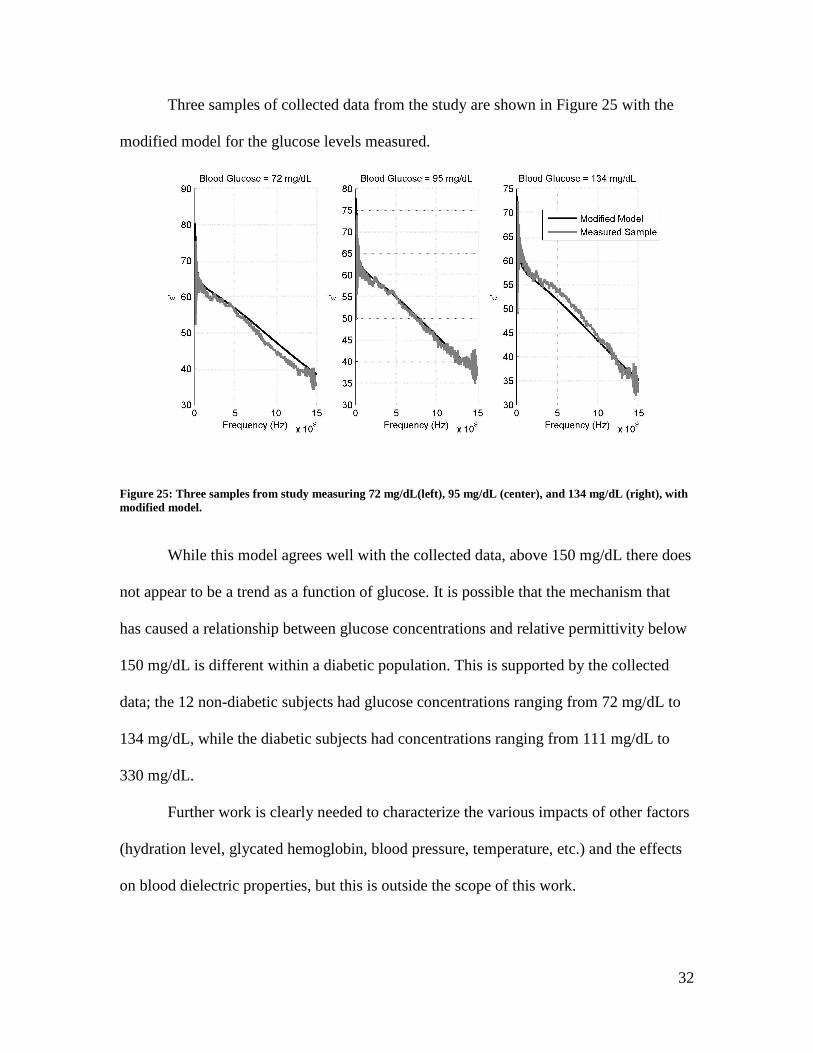
Three samples of collected data from the study are shown in Figure 25 with the
modified model for the glucose levels measured.
While this model agrees well with the collected data, above 150 mg/dL there does
not appear to be a trend as a function of glucose. It is possible that the mechanism that
has caused a relationship between glucose concentrations and relative permittivity below
150 mg/dL is different within a diabetic population. This is supported by the collected
data; the 12 non-diabetic subjects had glucose concentrations ranging from 72 mg/dL to
134 mg/dL, while the diabetic subjects had concentrations ranging from 111 mg/dL to
330 mg/dL.
Further work is clearly needed to characterize the various impacts of other factors
(hydration level, glycated hemoglobin, blood pressure, temperature, etc.) and the effects
on blood dielectric properties, but this is outside the scope of this work.
Figure 25: Three samples from study measuring 72 mg/dL(left), 95 mg/dL (center), and 134 mg/dL (right), with modified model.
33
3. Simulations for Non-Invasive Blood Glucose Monitoring
3.1 Design of an Antenna for Glucose Monitoring
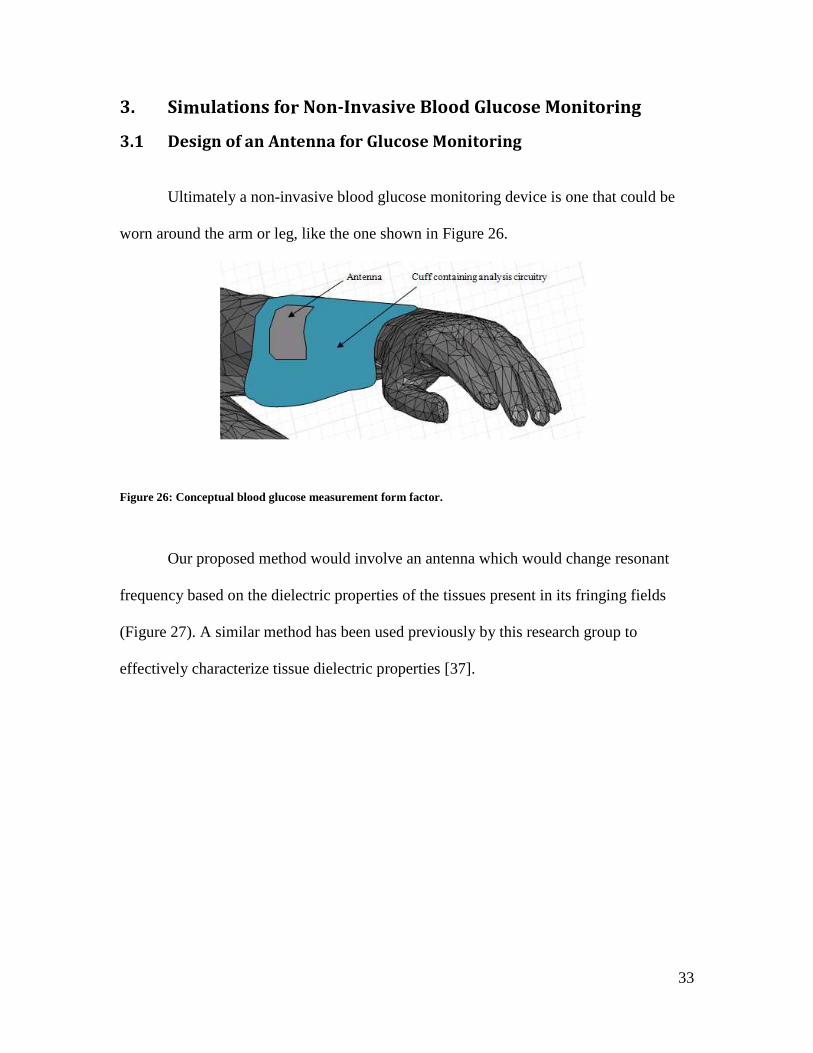
Ultimately a non-invasive blood glucose monitoring device is one that could be
worn around the arm or leg, like the one shown in Figure 26.
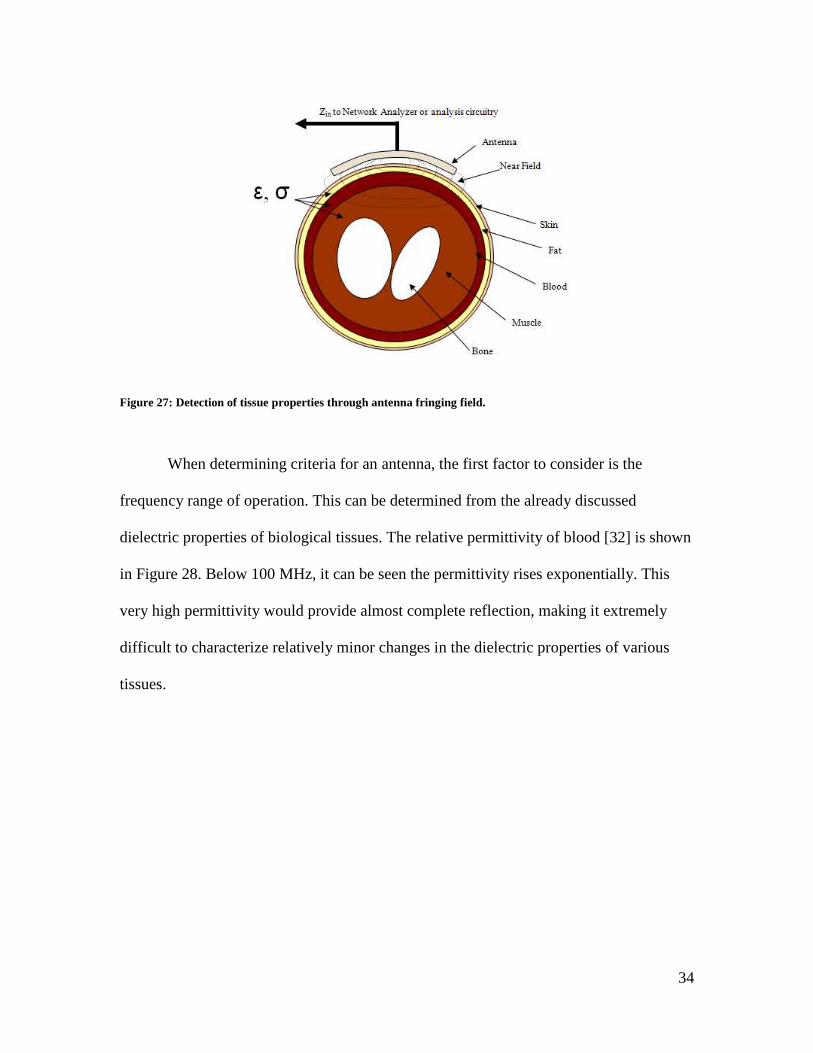
Our proposed method would involve an antenna which would change resonant
frequency based on the dielectric properties of the tissues present in its fringing fields
(Figure 27). A similar method has been used previously by this research group to
effectively characterize tissue dielectric properties [37].
Figure 26: Conceptual blood glucose measurement form factor.
34
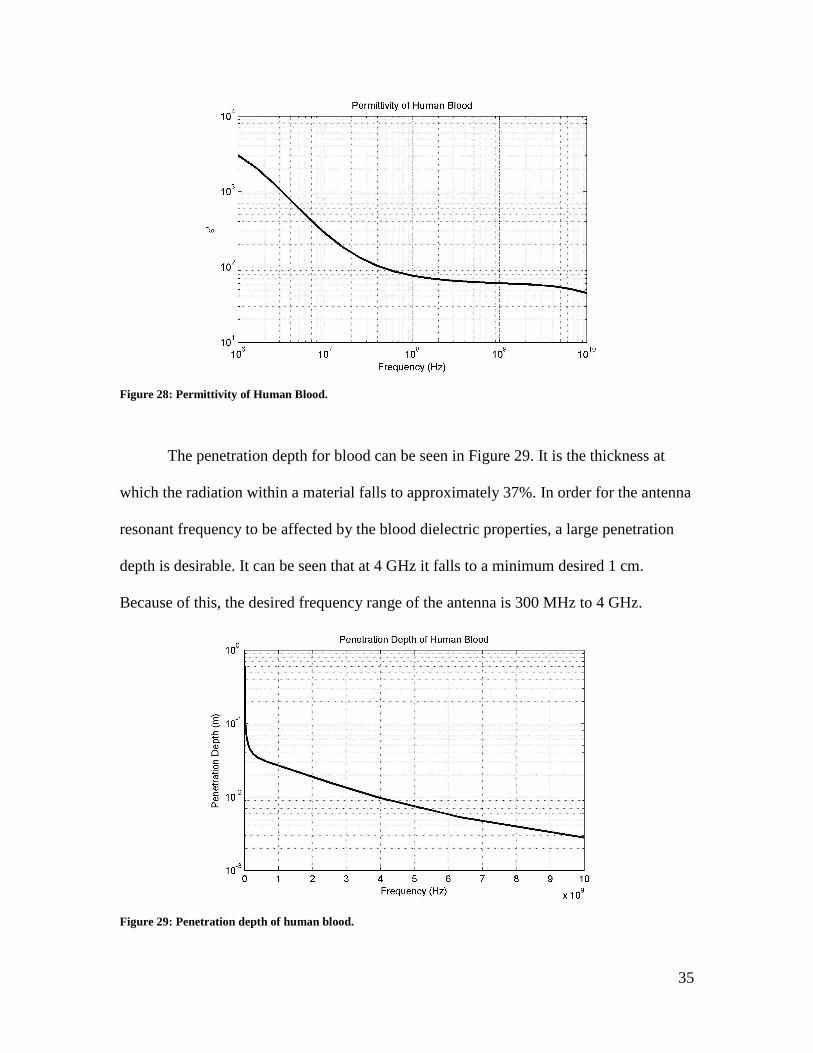
When determining criteria for an antenna, the first factor to consider is the
frequency range of operation. This can be determined from the already discussed
dielectric properties of biological tissues. The relative permittivity of blood [32] is shown
in Figure 28. Below 100 MHz, it can be seen the permittivity rises exponentially. This
very high permittivity would provide almost complete reflection, making it extremely
difficult to characterize relatively minor changes in the dielectric properties of various
tissues.
Figure 27: Detection of tissue properties through antenna fringing field.
35
The penetration depth for blood can be seen in Figure 29. It is the thickness at
which the radiation within a material falls to approximately 37%. In order for the antenna
resonant frequency to be affected by the blood dielectric properties, a large penetration
depth is desirable. It can be seen that at 4 GHz it falls to a minimum desired 1 cm.
Because of this, the desired frequency range of the antenna is 300 MHz to 4 GHz.
Figure 29: Penetration depth of human blood.
Figure 28: Permittivity of Human Blood.
36
3.2 Human Body Models
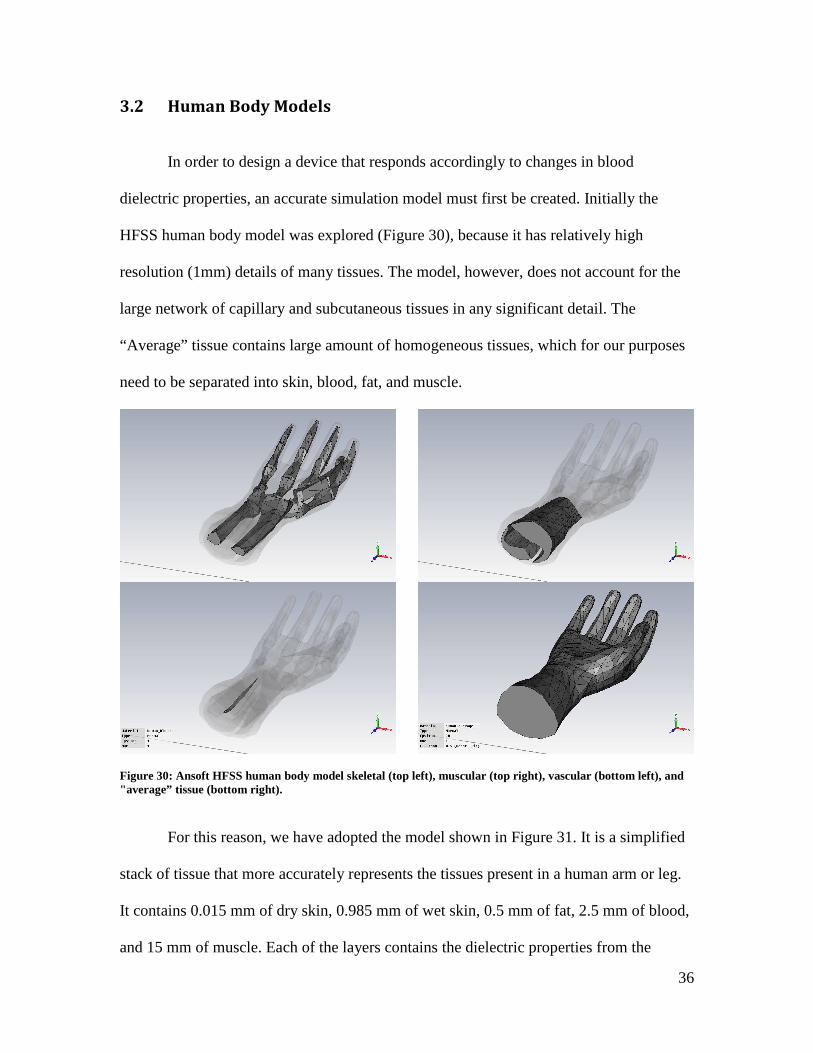
In order to design a device that responds accordingly to changes in blood
dielectric properties, an accurate simulation model must first be created. Initially the
HFSS human body model was explored (Figure 30), because it has relatively high
resolution (1mm) details of many tissues. The model, however, does not account for the
large network of capillary and subcutaneous tissues in any significant detail. The
“Average” tissue contains large amount of homogeneous tissues, which for our purposes
need to be separated into skin, blood, fat, and muscle.
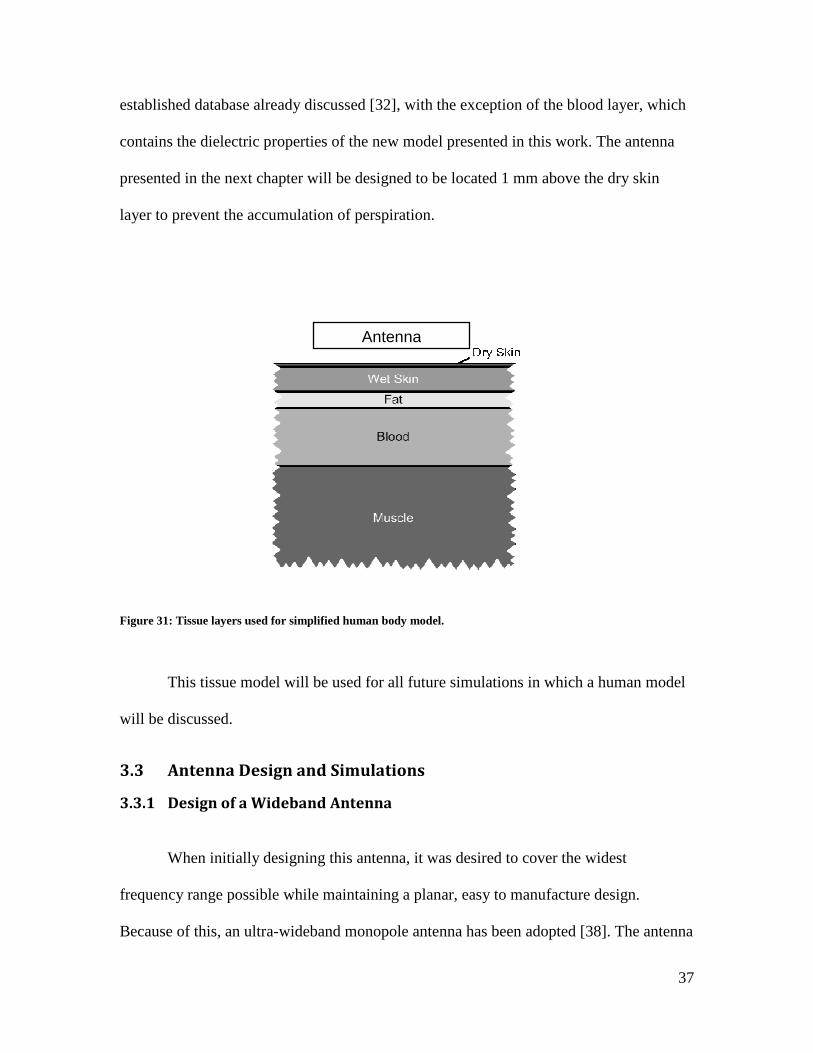
For this reason, we have adopted the model shown in Figure 31. It is a simplified
stack of tissue that more accurately represents the tissues present in a human arm or leg.
It contains 0.015 mm of dry skin, 0.985 mm of wet skin, 0.5 mm of fat, 2.5 mm of blood,
and 15 mm of muscle. Each of the layers contains the dielectric properties from the
Figure 30: Ansoft HFSS human body model skeletal (top left), muscular (top right), vascular (bottom left), and "average” tissue (bottom right).
37
established database already discussed [32], with the exception of the blood layer, which
contains the dielectric properties of the new model presented in this work. The antenna
presented in the next chapter will be designed to be located 1 mm above the dry skin
layer to prevent the accumulation of perspiration.
This tissue model will be used for all future simulations in which a human model
will be discussed.
3.3 Antenna Design and Simulations
3.3.1 Design of a Wideband Antenna
When initially designing this antenna, it was desired to cover the widest
frequency range possible while maintaining a planar, easy to manufacture design.
Because of this, an ultra-wideband monopole antenna has been adopted [38]. The antenna
Figure 31: Tissue layers used for simplified human body model.
Antenna
38
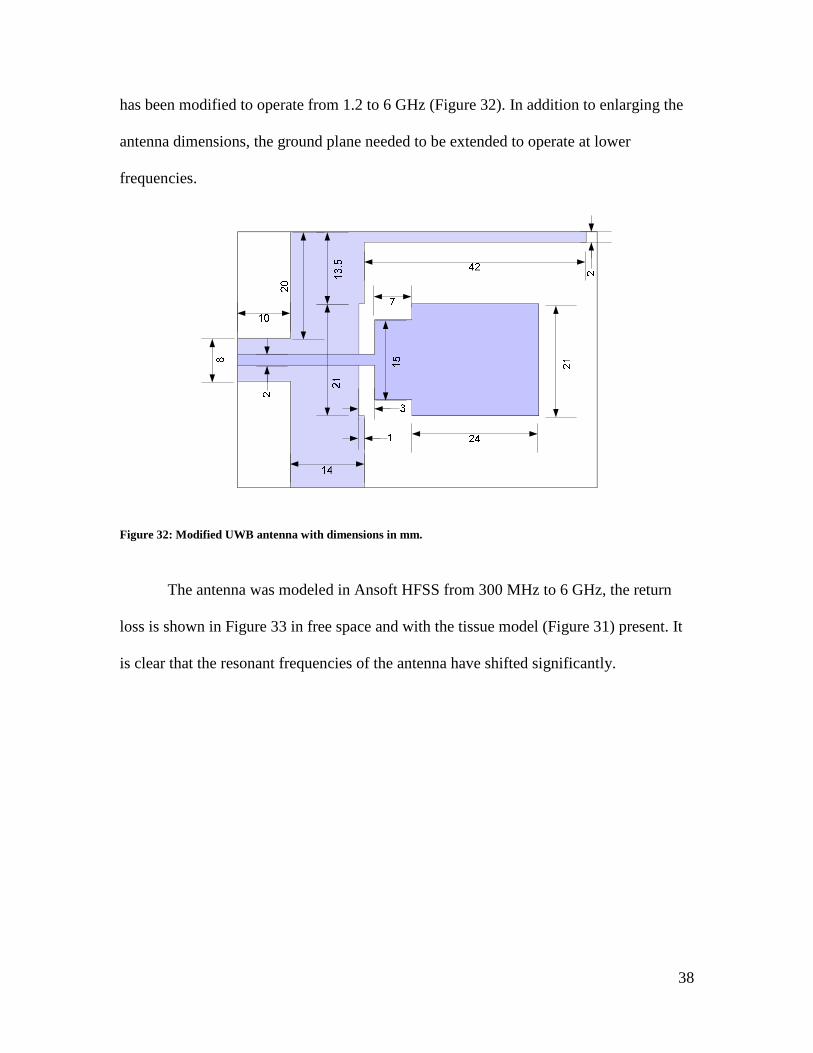
has been modified to operate from 1.2 to 6 GHz (Figure 32). In addition to enlarging the
antenna dimensions, the ground plane needed to be extended to operate at lower
frequencies.
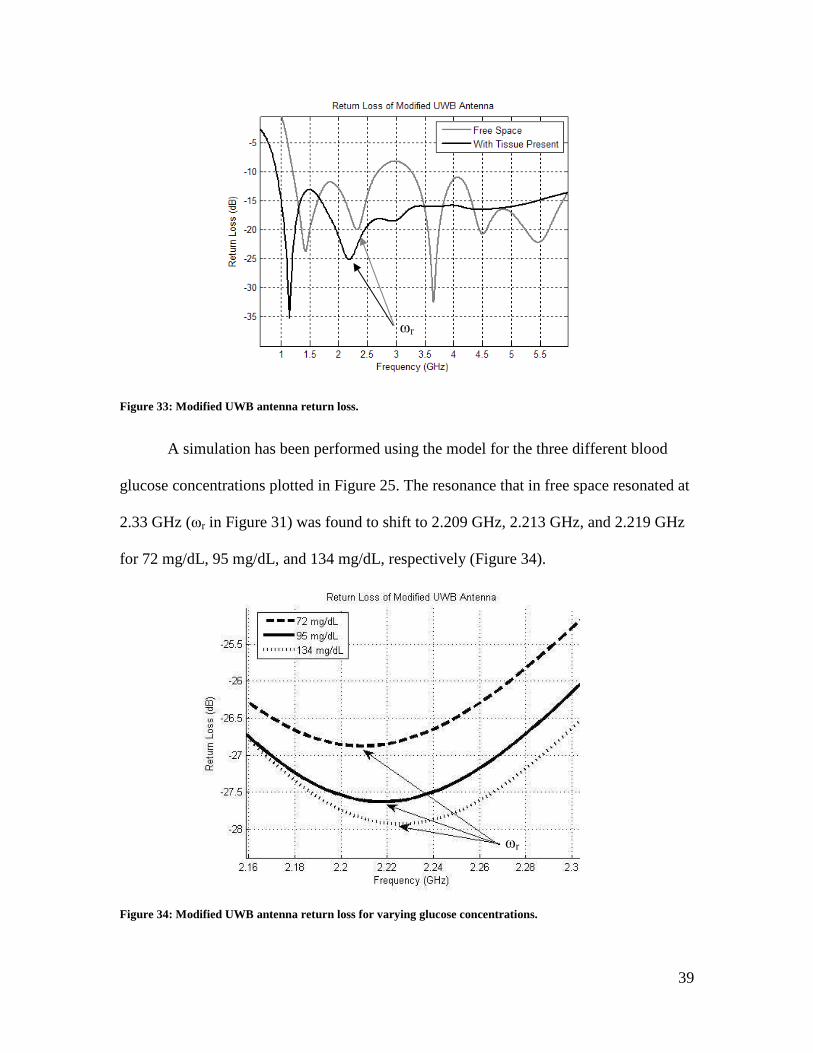
The antenna was modeled in Ansoft HFSS from 300 MHz to 6 GHz, the return
loss is shown in Figure 33 in free space and with the tissue model (Figure 31) present. It
is clear that the resonant frequencies of the antenna have shifted significantly.
Figure 32: Modified UWB antenna with dimensions in mm.
39
A simulation has been performed using the model for the three different blood
glucose concentrations plotted in Figure 25. The resonance that in free space resonated at
2.33 GHz (ωr in Figure 31) was found to shift to 2.209 GHz, 2.213 GHz, and 2.219 GHz
for 72 mg/dL, 95 mg/dL, and 134 mg/dL, respectively (Figure 34).
Figure 33: Modified UWB antenna return loss.
ωr
ωr
Figure 34: Modified UWB antenna return loss for varying glucose concentrations.
40
These results, while encouraging, were difficult to analyze due to the broad
response of the UWB antenna. Work has been done to determine the equivalent model of
an UWB antenna [39], but performing similar analysis on the collected and simulated
data was not found to be beneficial.
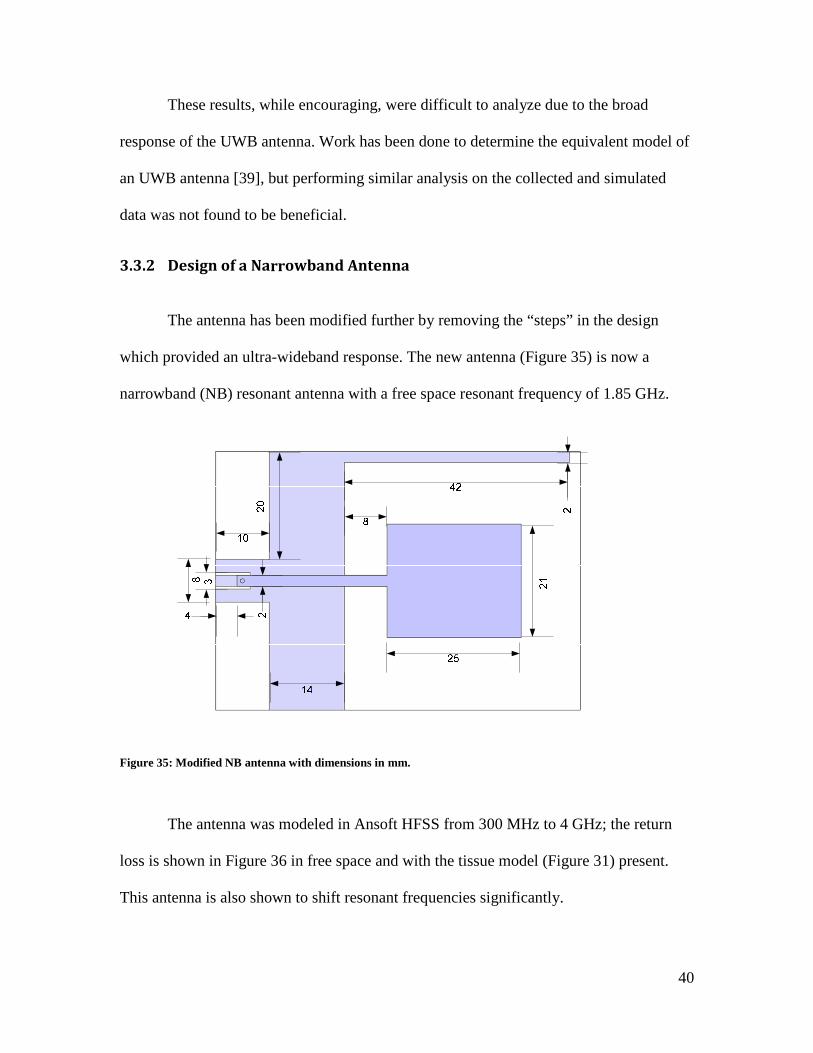
3.3.2 Design of a Narrowband Antenna
The antenna has been modified further by removing the “steps” in the design
which provided an ultra-wideband response. The new antenna (Figure 35) is now a
narrowband (NB) resonant antenna with a free space resonant frequency of 1.85 GHz.
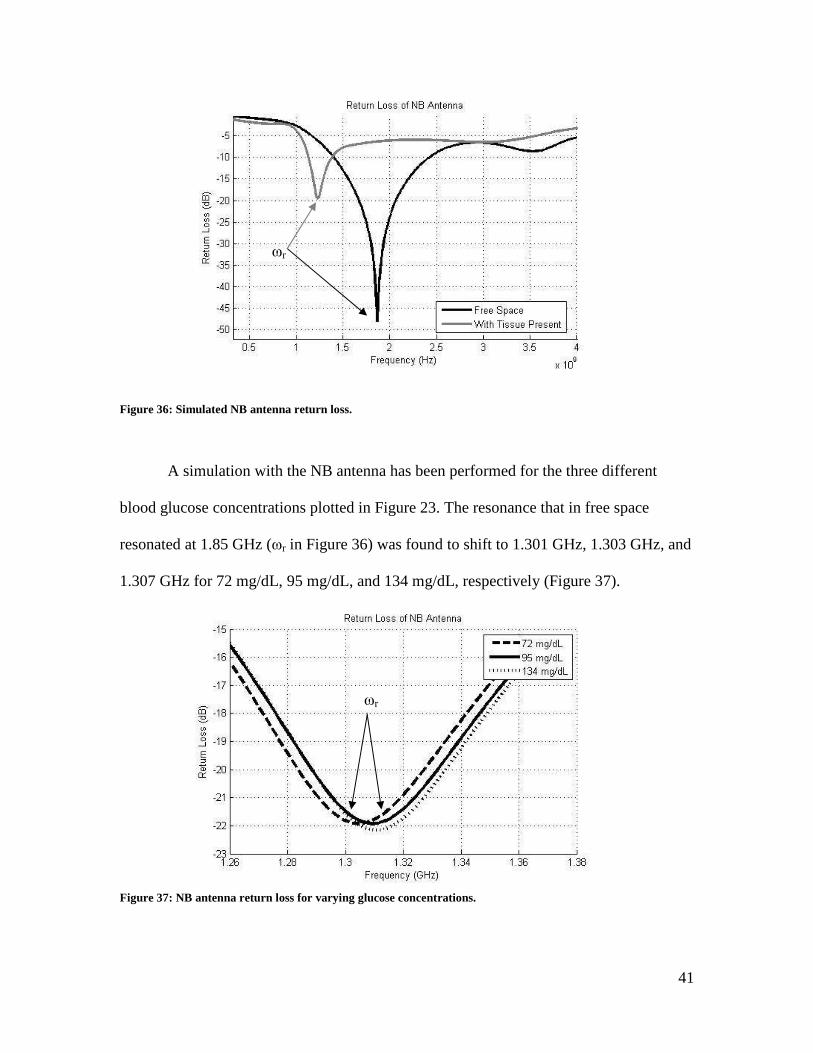
The antenna was modeled in Ansoft HFSS from 300 MHz to 4 GHz; the return
loss is shown in Figure 36 in free space and with the tissue model (Figure 31) present.
This antenna is also shown to shift resonant frequencies significantly.
Figure 35: Modified NB antenna with dimensions in mm.
41
A simulation with the NB antenna has been performed for the three different
blood glucose concentrations plotted in Figure 23. The resonance that in free space
resonated at 1.85 GHz (ωr in Figure 36) was found to shift to 1.301 GHz, 1.303 GHz, and
1.307 GHz for 72 mg/dL, 95 mg/dL, and 134 mg/dL, respectively (Figure 37).
Figure 36: Simulated NB antenna return loss.
ωr
ωr
ωr
Figure 37: NB antenna return loss for varying glucose concentrations.
42
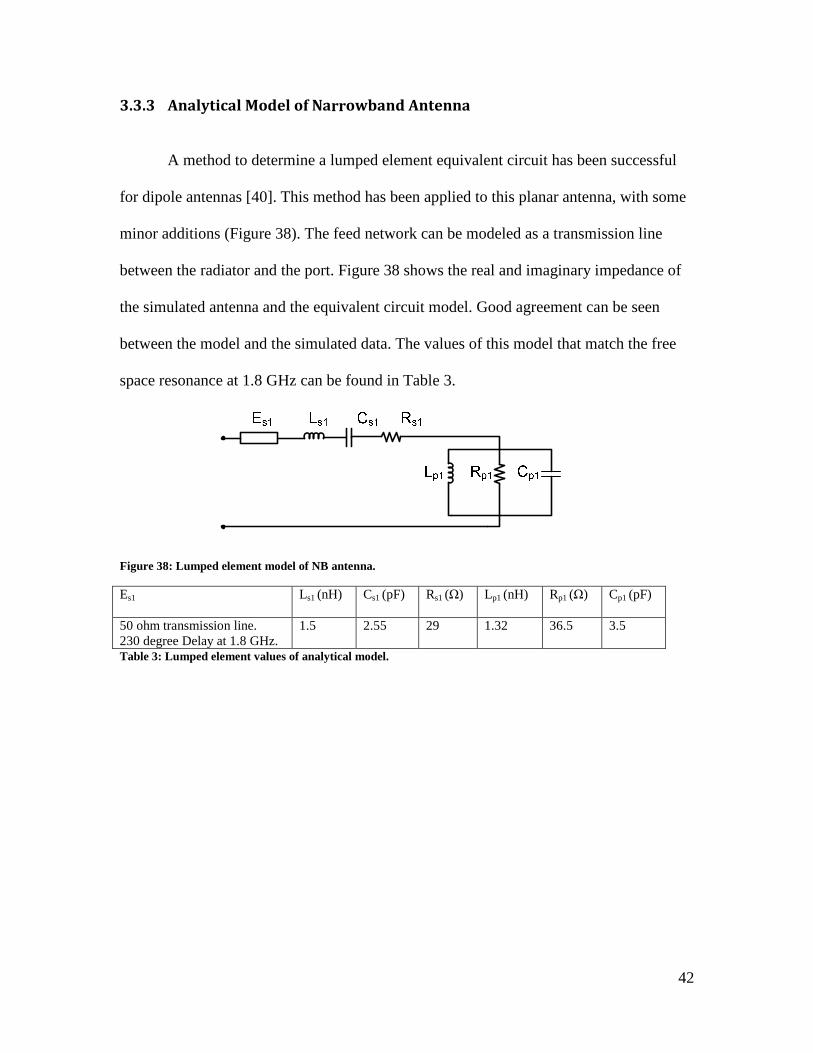
3.3.3 Analytical Model of Narrowband Antenna
A method to determine a lumped element equivalent circuit has been successful
for dipole antennas [40]. This method has been applied to this planar antenna, with some
minor additions (Figure 38). The feed network can be modeled as a transmission line
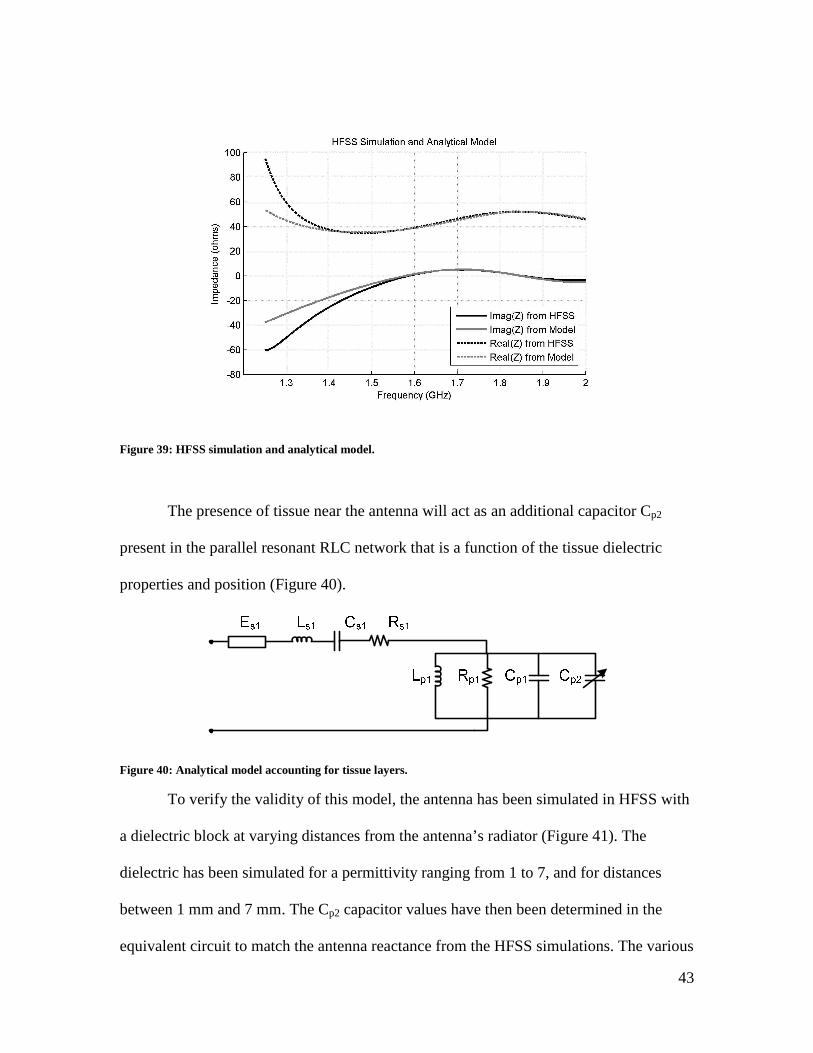
between the radiator and the port. Figure 38 shows the real and imaginary impedance of
the simulated antenna and the equivalent circuit model. Good agreement can be seen
between the model and the simulated data. The values of this model that match the free
space resonance at 1.8 GHz can be found in Table 3.
Figure 38: Lumped element model of NB antenna.
Es1 Ls1 (nH) Cs1 (pF) Rs1 (Ω) Lp1 (nH) Rp1 (Ω) Cp1 (pF)
50 ohm transmission line. 230 degree Delay at 1.8 GHz.
1.5 2.55 29 1.32 36.5 3.5
Table 3: Lumped element values of analytical model.
43
The presence of tissue near the antenna will act as an additional capacitor Cp2
present in the parallel resonant RLC network that is a function of the tissue dielectric
properties and position (Figure 40).
Figure 40: Analytical model accounting for tissue layers.
To verify the validity of this model, the antenna has been simulated in HFSS with
a dielectric block at varying distances from the antenna’s radiator (Figure 41). The
dielectric has been simulated for a permittivity ranging from 1 to 7, and for distances
between 1 mm and 7 mm. The Cp2 capacitor values have then been determined in the
equivalent circuit to match the antenna reactance from the HFSS simulations. The various
Figure 39: HFSS simulation and analytical model.
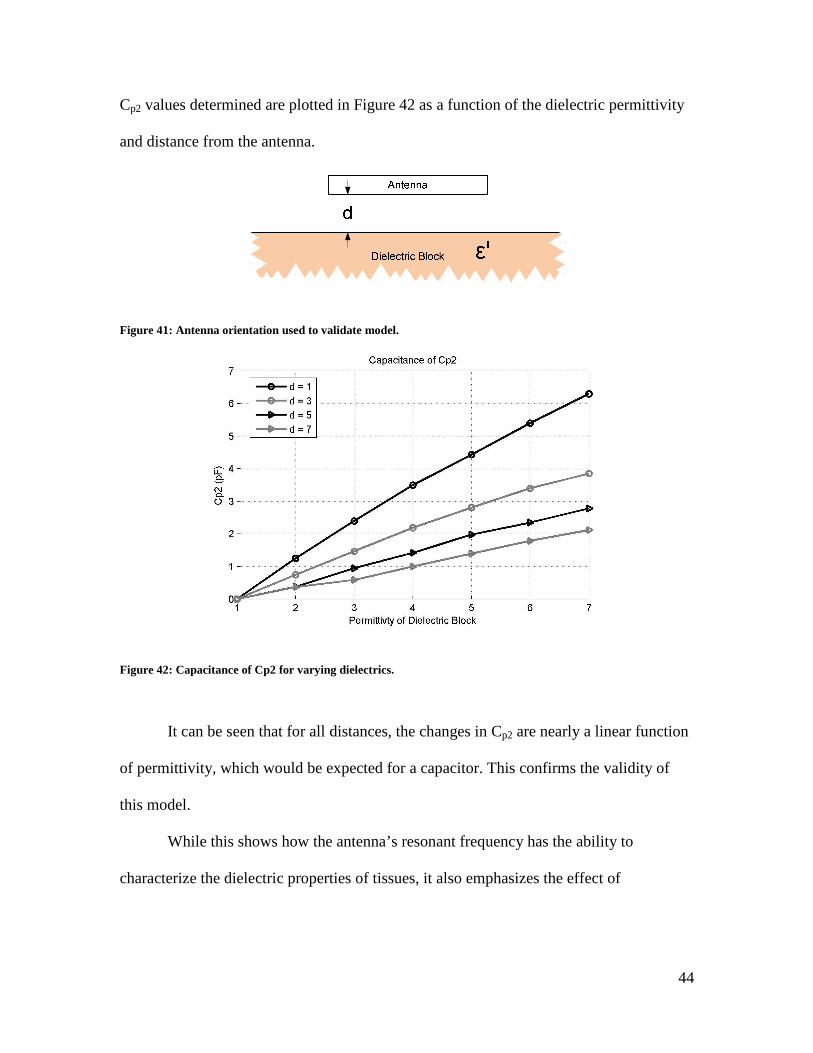
44
Cp2 values determined are plotted in Figure 42 as a function of the dielectric permittivity
and distance from the antenna.
Figure 41: Antenna orientation used to validate model.
It can be seen that for all distances, the changes in Cp2 are nearly a linear function
of permittivity, which would be expected for a capacitor. This confirms the validity of
this model.
While this shows how the antenna’s resonant frequency has the ability to
characterize the dielectric properties of tissues, it also emphasizes the effect of
Figure 42: Capacitance of Cp2 for varying dielectrics.
45
positioning on the antenna response. If a consistent position is not maintained with the
antenna, the proximity of the antenna to human tissues could provide unwanted variation.
46
4. Prototype Non-Invasive Wireless Blood Glucose Monitor
4.1 Antenna Performance
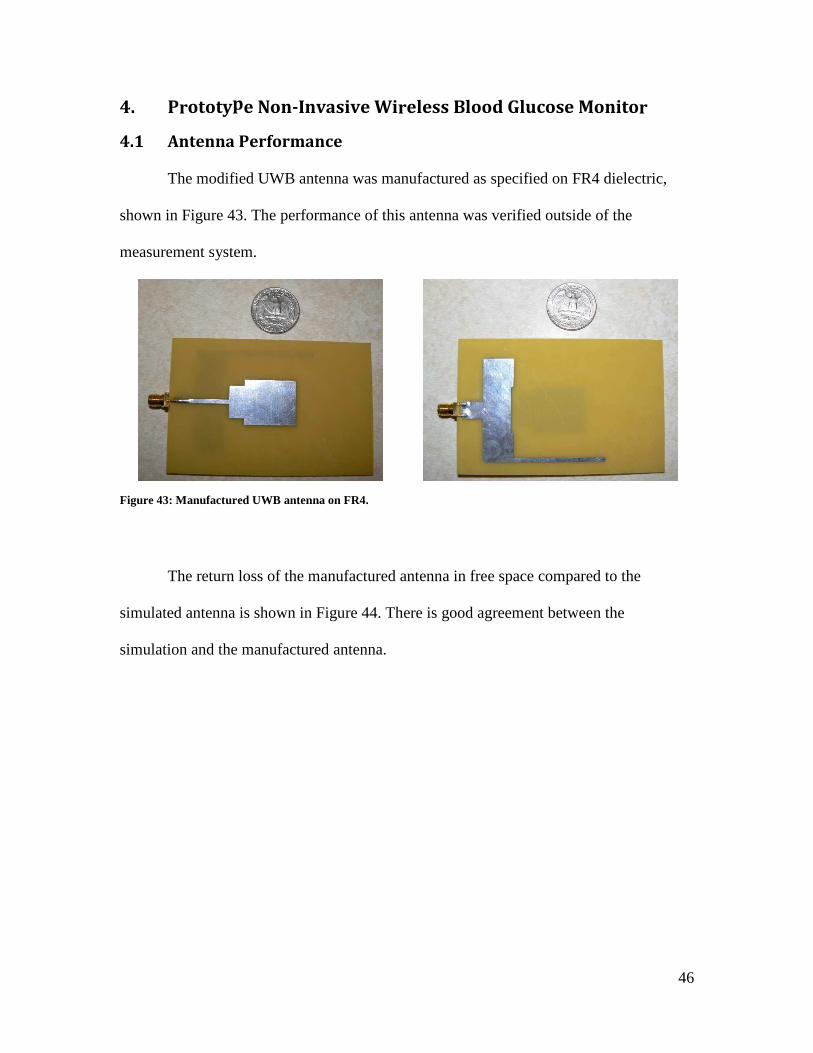
The modified UWB antenna was manufactured as specified on FR4 dielectric,
shown in Figure 43. The performance of this antenna was verified outside of the
measurement system.
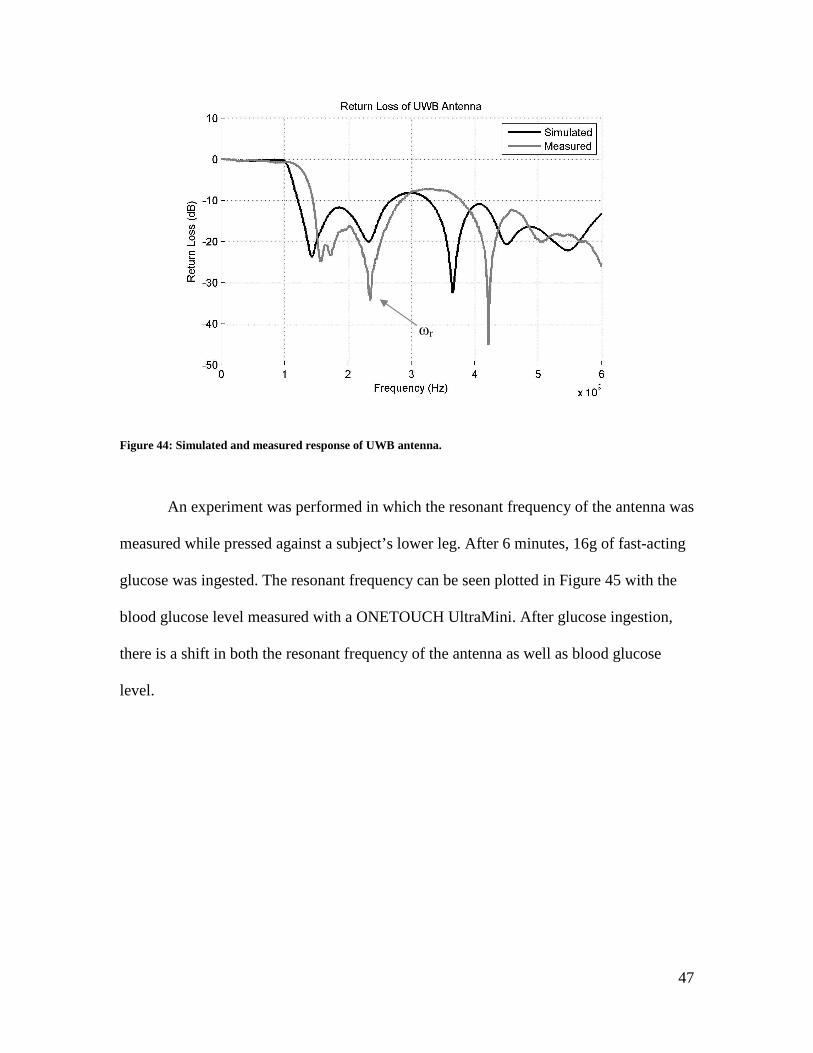
The return loss of the manufactured antenna in free space compared to the
simulated antenna is shown in Figure 44. There is good agreement between the
simulation and the manufactured antenna.
Figure 43: Manufactured UWB antenna on FR4.
47
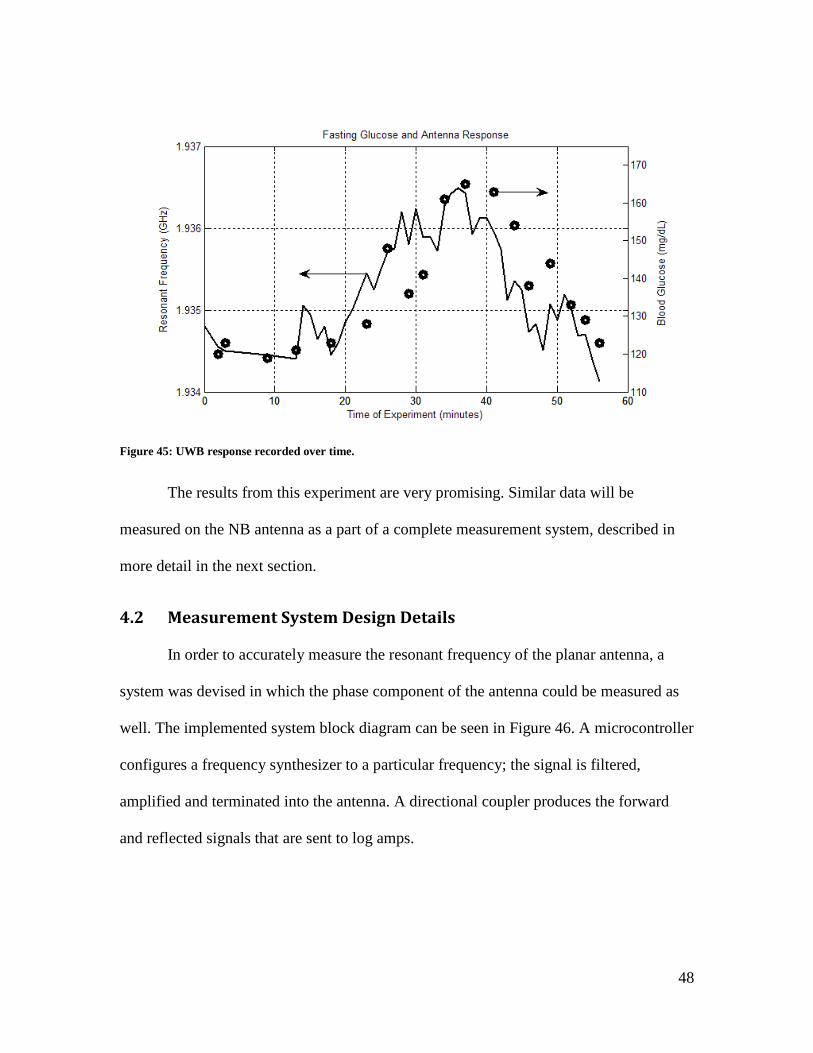
An experiment was performed in which the resonant frequency of the antenna was
measured while pressed against a subject’s lower leg. After 6 minutes, 16g of fast-acting
glucose was ingested. The resonant frequency can be seen plotted in Figure 45 with the
blood glucose level measured with a ONETOUCH UltraMini. After glucose ingestion,
there is a shift in both the resonant frequency of the antenna as well as blood glucose
level.
Figure 44: Simulated and measured response of UWB antenna.
ωr
48
The results from this experiment are very promising. Similar data will be
measured on the NB antenna as a part of a complete measurement system, described in
more detail in the next section.
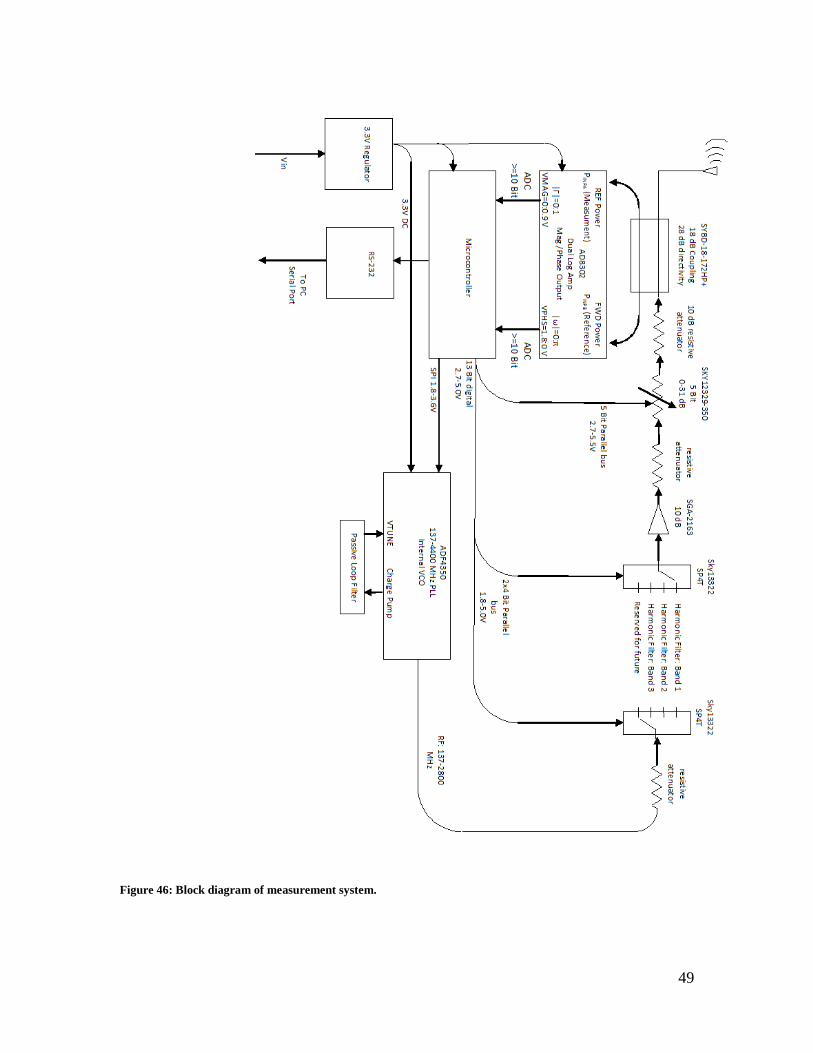
4.2 Measurement System Design Details
In order to accurately measure the resonant frequency of the planar antenna, a
system was devised in which the phase component of the antenna could be measured as
well. The implemented system block diagram can be seen in Figure 46. A microcontroller
configures a frequency synthesizer to a particular frequency; the signal is filtered,
amplified and terminated into the antenna. A directional coupler produces the forward
and reflected signals that are sent to log amps.
Figure 45: UWB response recorded over time.
49
Figure 46: Block diagram of measurement system.
50
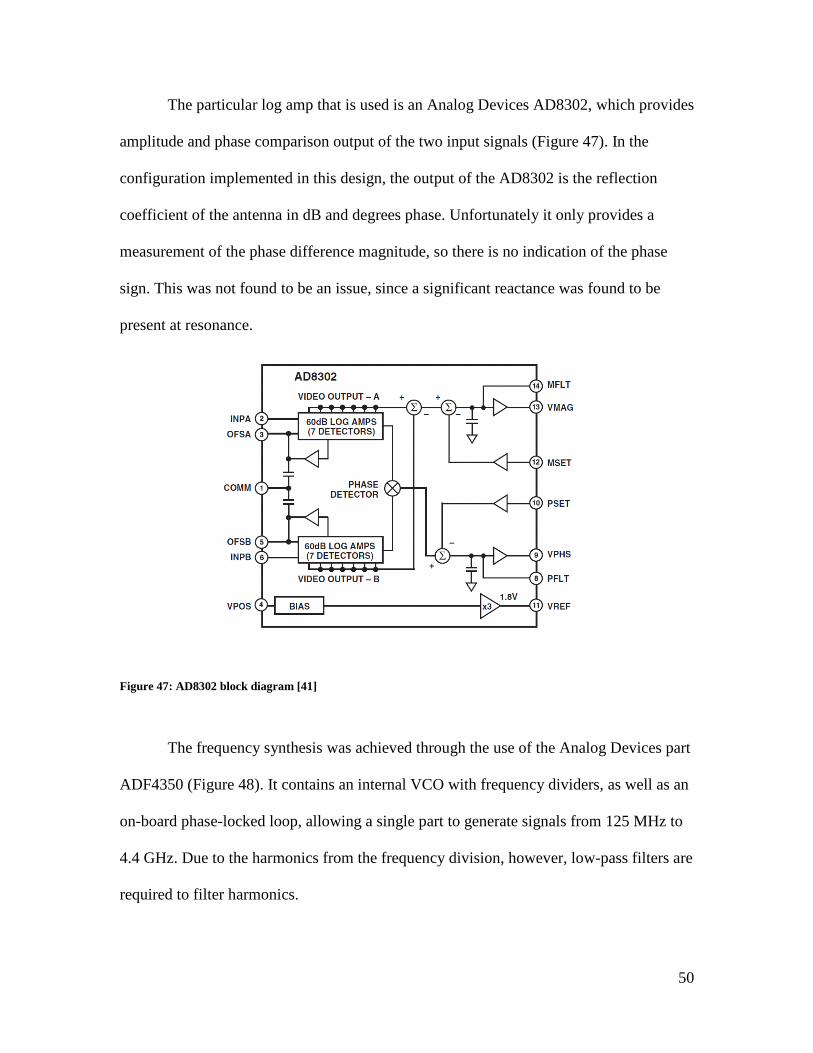
The particular log amp that is used is an Analog Devices AD8302, which provides
amplitude and phase comparison output of the two input signals (Figure 47). In the
configuration implemented in this design, the output of the AD8302 is the reflection
coefficient of the antenna in dB and degrees phase. Unfortunately it only provides a
measurement of the phase difference magnitude, so there is no indication of the phase
sign. This was not found to be an issue, since a significant reactance was found to be
present at resonance.
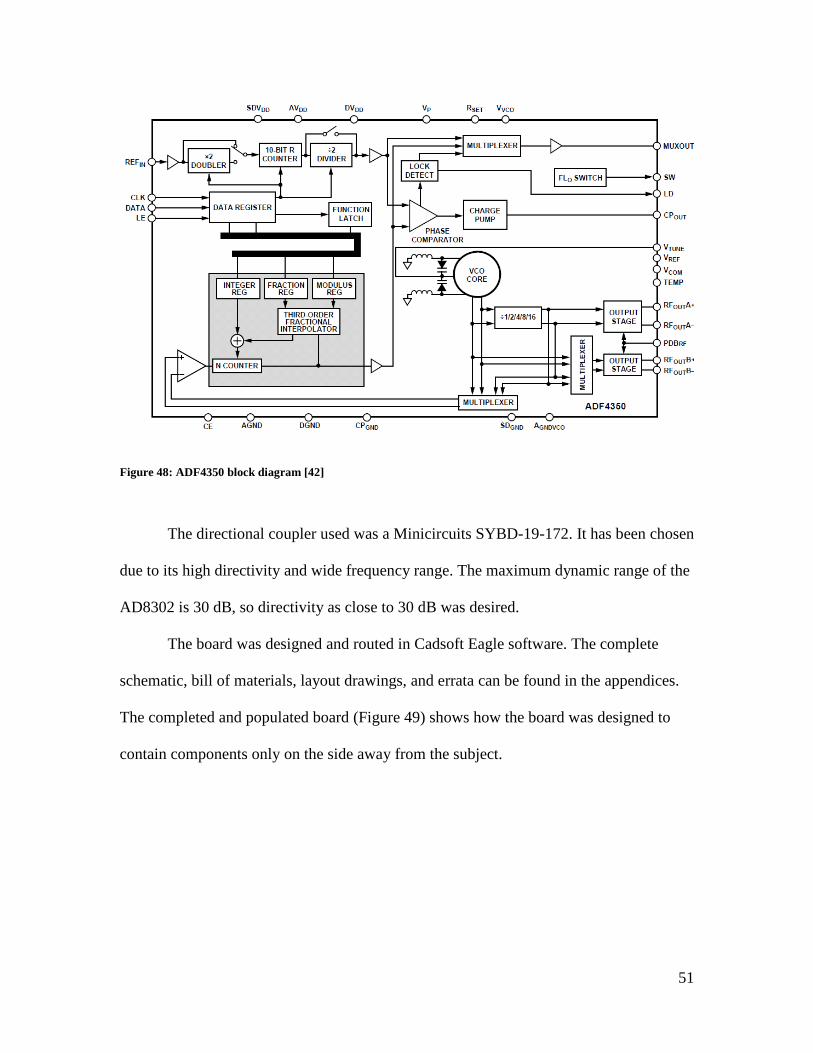
The frequency synthesis was achieved through the use of the Analog Devices part
ADF4350 (Figure 48). It contains an internal VCO with frequency dividers, as well as an
on-board phase-locked loop, allowing a single part to generate signals from 125 MHz to
4.4 GHz. Due to the harmonics from the frequency division, however, low-pass filters are
required to filter harmonics.
Figure 47: AD8302 block diagram [41]
51
The directional coupler used was a Minicircuits SYBD-19-172. It has been chosen
due to its high directivity and wide frequency range. The maximum dynamic range of the
AD8302 is 30 dB, so directivity as close to 30 dB was desired.
The board was designed and routed in Cadsoft Eagle software. The complete
schematic, bill of materials, layout drawings, and errata can be found in the appendices.
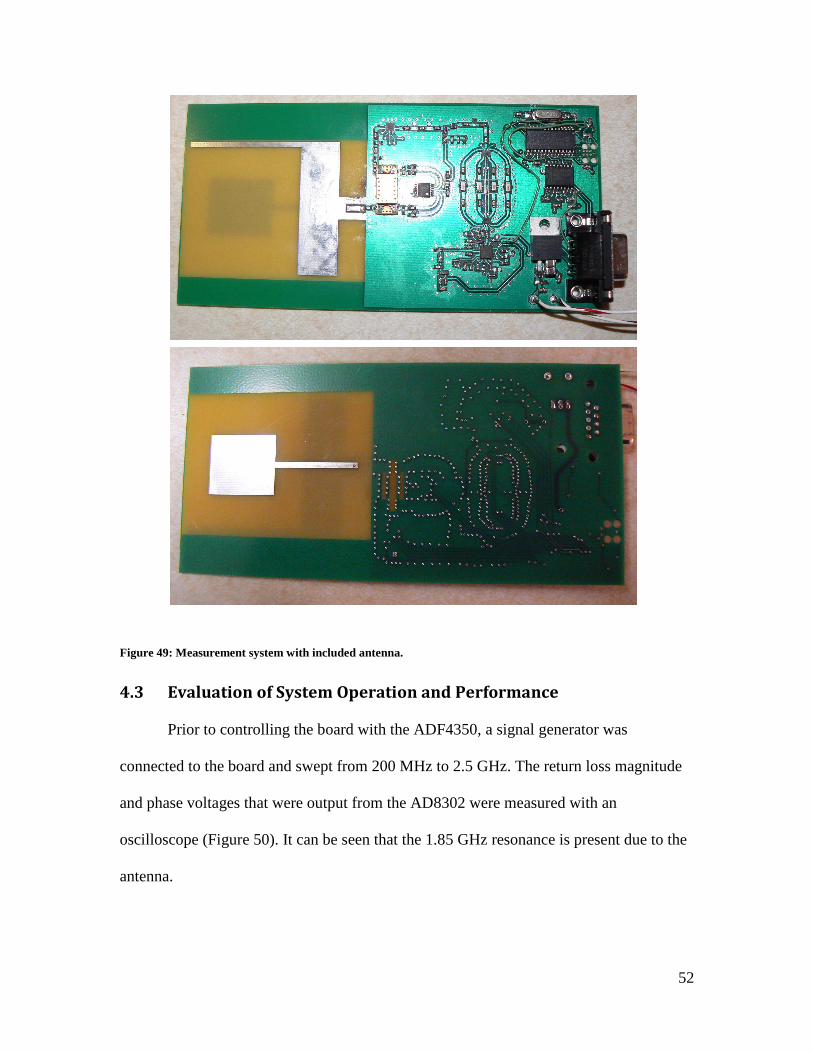
The completed and populated board (Figure 49) shows how the board was designed to
contain components only on the side away from the subject.
Figure 48: ADF4350 block diagram [42]
52
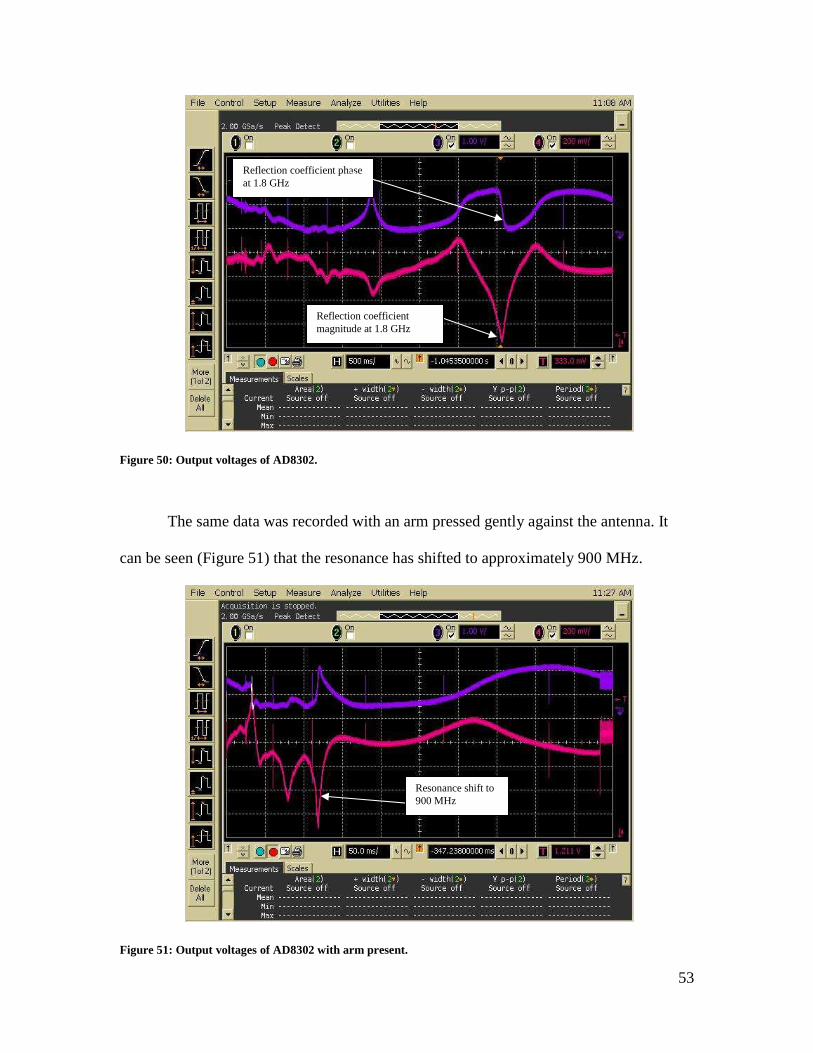
4.3 Evaluation of System Operation and Performance
Prior to controlling the board with the ADF4350, a signal generator was
connected to the board and swept from 200 MHz to 2.5 GHz. The return loss magnitude
and phase voltages that were output from the AD8302 were measured with an
oscilloscope (Figure 50). It can be seen that the 1.85 GHz resonance is present due to the
antenna.
Figure 49: Measurement system with included antenna.
53
The same data was recorded with an arm pressed gently against the antenna. It
can be seen (Figure 51) that the resonance has shifted to approximately 900 MHz.
Figure 51: Output voltages of AD8302 with arm present.
Resonance shift to 900 MHz
Figure 50: Output voltages of AD8302.
Reflection coefficient magnitude at 1.8 GHz
Reflection coefficient phase at 1.8 GHz
54
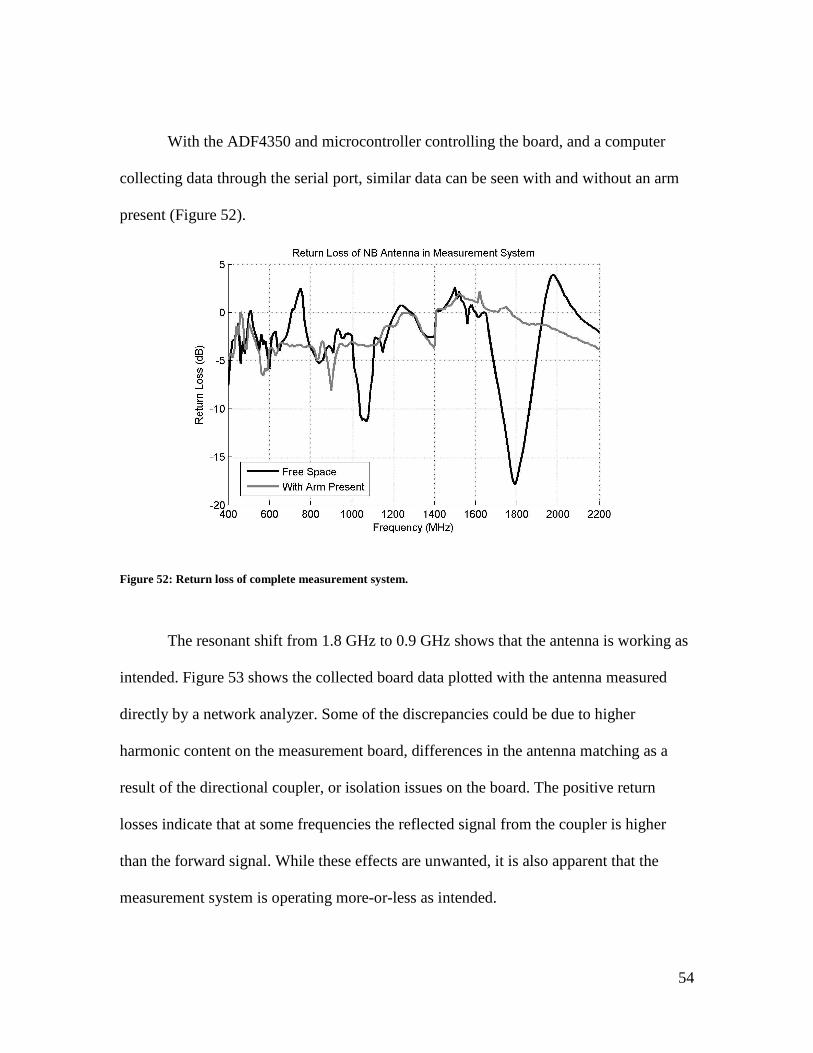
With the ADF4350 and microcontroller controlling the board, and a computer
collecting data through the serial port, similar data can be seen with and without an arm
present (Figure 52).
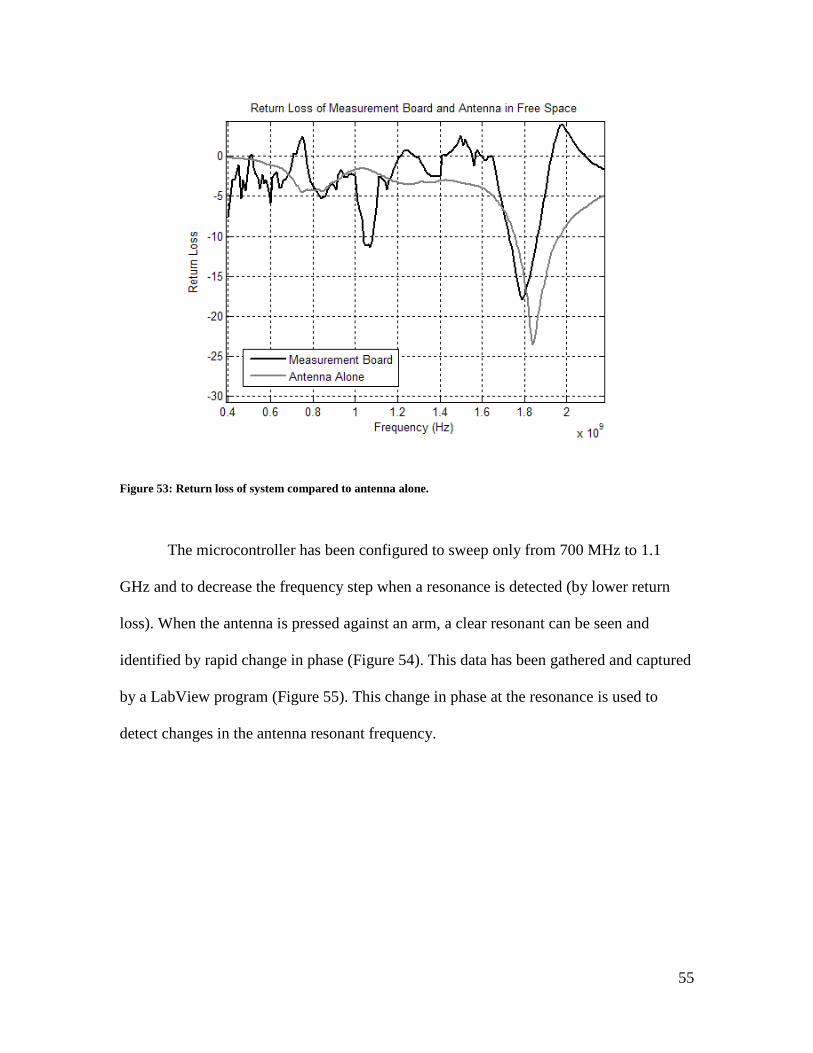
The resonant shift from 1.8 GHz to 0.9 GHz shows that the antenna is working as
intended. Figure 53 shows the collected board data plotted with the antenna measured
directly by a network analyzer. Some of the discrepancies could be due to higher
harmonic content on the measurement board, differences in the antenna matching as a
result of the directional coupler, or isolation issues on the board. The positive return
losses indicate that at some frequencies the reflected signal from the coupler is higher
than the forward signal. While these effects are unwanted, it is also apparent that the
measurement system is operating more-or-less as intended.
Figure 52: Return loss of complete measurement system.
55
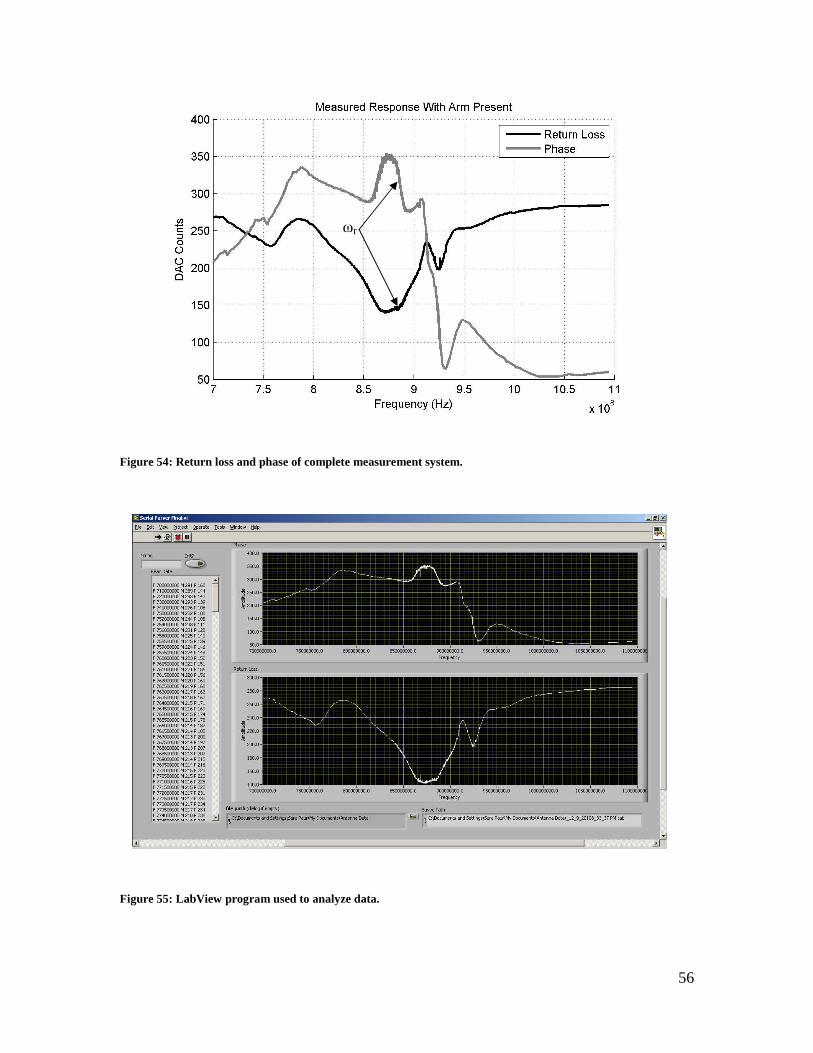
The microcontroller has been configured to sweep only from 700 MHz to 1.1
GHz and to decrease the frequency step when a resonance is detected (by lower return
loss). When the antenna is pressed against an arm, a clear resonant can be seen and
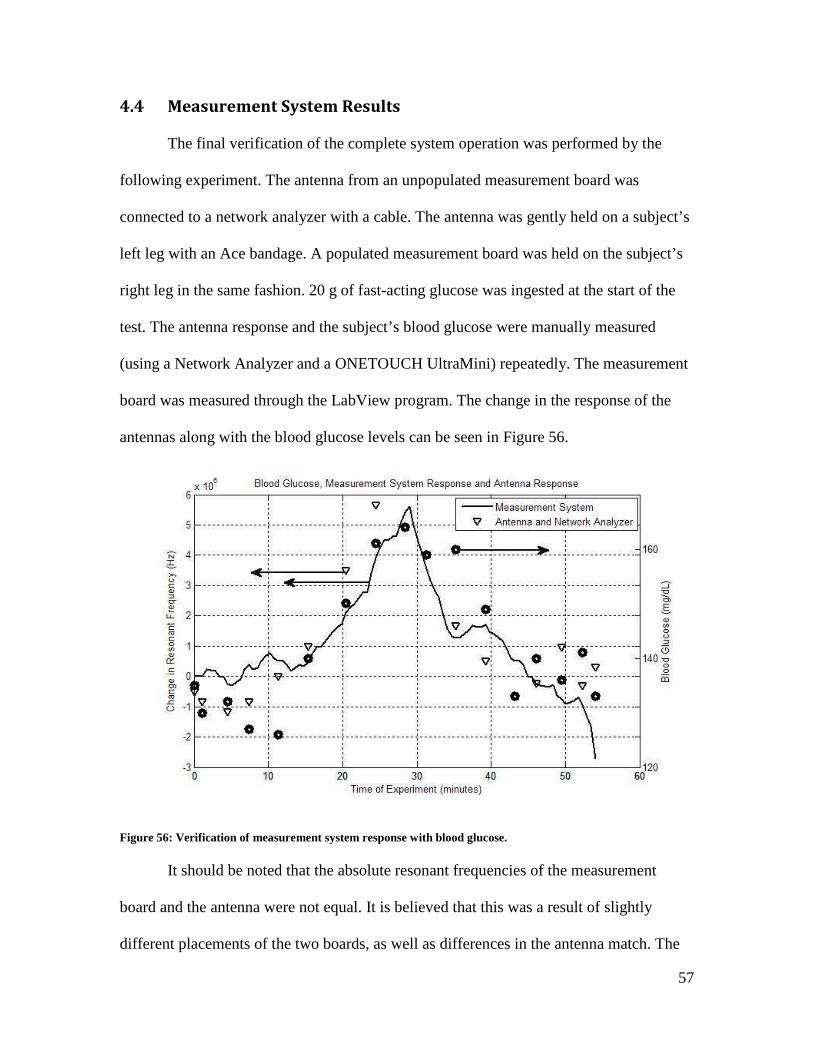
identified by rapid change in phase (Figure 54). This data has been gathered and captured
by a LabView program (Figure 55). This change in phase at the resonance is used to
detect changes in the antenna resonant frequency.
Figure 53: Return loss of system compared to antenna alone.
56
Figure 55: LabView program used to analyze data.
Figure 54: Return loss and phase of complete measurement system.
ωr
57
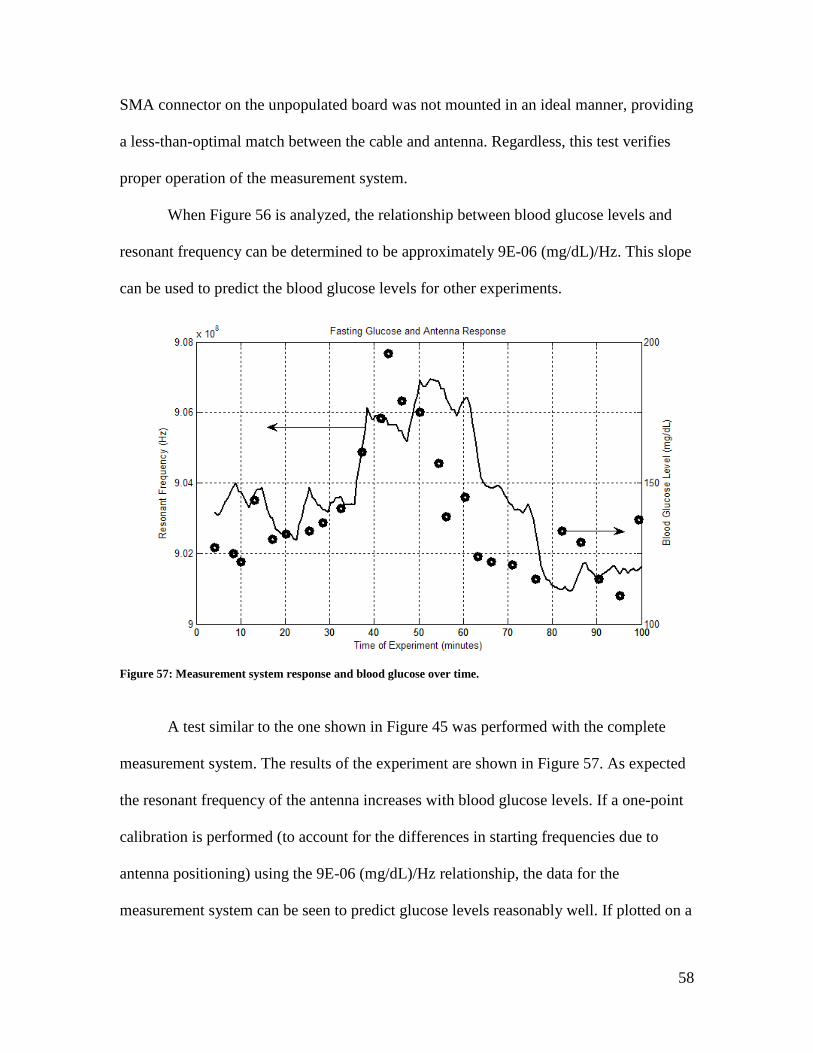
Figure 56: Verification of measurement system response with blood glucose.
4.4 Measurement System Results
The final verification of the complete system operation was performed by the
following experiment. The antenna from an unpopulated measurement board was
connected to a network analyzer with a cable. The antenna was gently held on a subject’s
left leg with an Ace bandage. A populated measurement board was held on the subject’s
right leg in the same fashion. 20 g of fast-acting glucose was ingested at the start of the
test. The antenna response and the subject’s blood glucose were manually measured
(using a Network Analyzer and a ONETOUCH UltraMini) repeatedly. The measurement
board was measured through the LabView program. The change in the response of the
antennas along with the blood glucose levels can be seen in Figure 56.
It should be noted that the absolute resonant frequencies of the measurement
board and the antenna were not equal. It is believed that this was a result of slightly
different placements of the two boards, as well as differences in the antenna match. The
58
SMA connector on the unpopulated board was not mounted in an ideal manner, providing
a less-than-optimal match between the cable and antenna. Regardless, this test verifies
proper operation of the measurement system.
When Figure 56 is analyzed, the relationship between blood glucose levels and
resonant frequency can be determined to be approximately 9E-06 (mg/dL)/Hz. This slope
can be used to predict the blood glucose levels for other experiments.
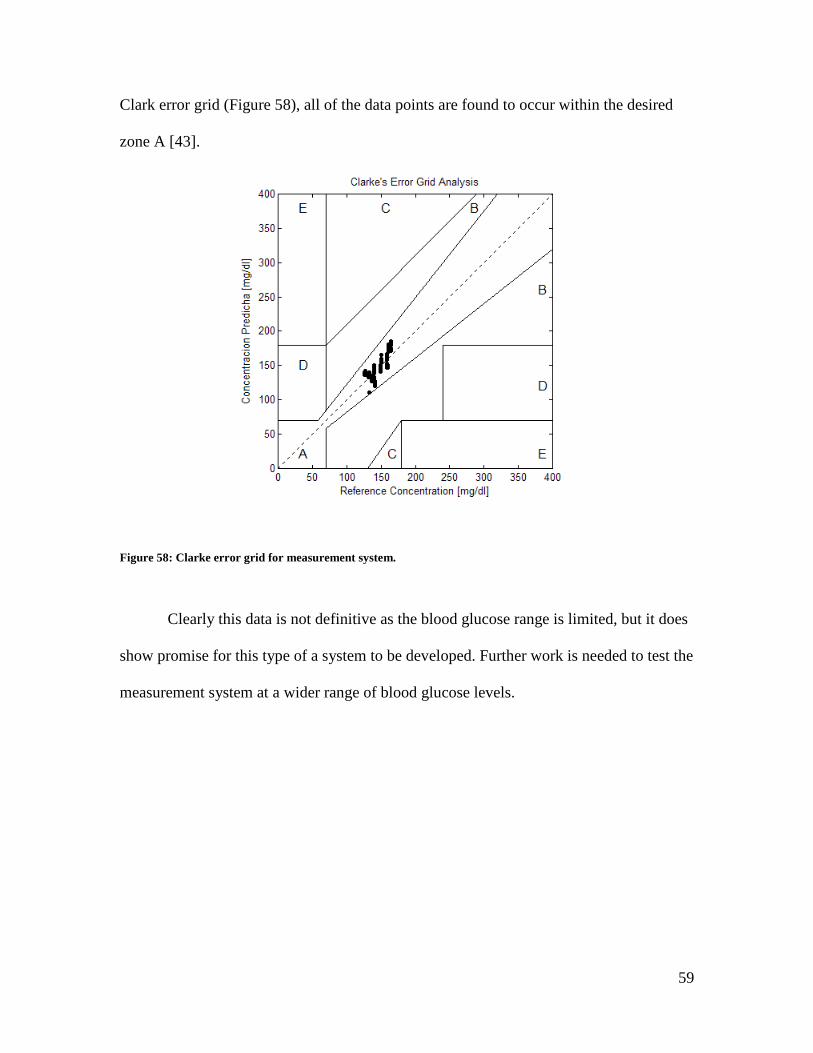
A test similar to the one shown in Figure 45 was performed with the complete
measurement system. The results of the experiment are shown in Figure 57. As expected
the resonant frequency of the antenna increases with blood glucose levels. If a one-point
calibration is performed (to account for the differences in starting frequencies due to
antenna positioning) using the 9E-06 (mg/dL)/Hz relationship, the data for the
measurement system can be seen to predict glucose levels reasonably well. If plotted on a
Figure 57: Measurement system response and blood glucose over time.
59
Clark error grid (Figure 58), all of the data points are found to occur within the desired
zone A [43].
Clearly this data is not definitive as the blood glucose range is limited, but it does
show promise for this type of a system to be developed. Further work is needed to test the
measurement system at a wider range of blood glucose levels.
Figure 58: Clarke error grid for measurement system.
60
5. Conclusions and Future Work
In conclusion, the present work has made the following contributions to the
research of non-invasive blood glucose monitoring. A study was performed, during
which the in vitro testing of blood samples has been able to correlate the dielectric
properties of blood to blood glucose levels. This data has been used to modify the Cole-
Cole model which describes the dielectric properties of blood based on blood glucose
levels and frequency.
The model has been used to determine the frequency range best suited for an
impedance spectroscopy system. Two antennas have been designed in this frequency
range to be sensitive to dielectric changes in blood when placed next to the human body.
These antennas, along with a simulation model of layered tissue and blood, has been
created to study the effects of various blood glucose levels. In simulations, the antennas’
resonant frequency has been shown to increase with blood glucose levels.
These simulated results have been supported by experimental evidence. An
antenna, measured by a PNA, has been strapped to the leg of a patient. After ingesting
fast-acting glucose tablets, the resonant frequency of the antenna increases with the
patient’s blood glucose level. An embedded measurement system, designed in this work,
was simultaneously strapped to the patient’s other leg. The resonant frequency of the
antenna in the measurement system was also seen to increase with blood glucose level.
The measurement system and the antenna both have shown promising results that agree
with the simulations.
5.1 Future Work
Future work in this field can be defined as the following:
61
1. Further in-vitro clinical studies need to be done on diabetic patients with different
blood glucose levels, using an antenna and measuring the shift in its resonant
frequency. This data can be used to develop the relationship between dielectric
properties of blood, glucose levels, and the antenna response.
2. An accurate analytical model to measure blood glucose levels through dielectric
properties needs to be developed. There are many factors involved in this
measurement and understanding them is critical to creating a model.
3. With multiple receive antennas, diversity techniques could be developed to
improve the accuracy of the estimation of the glucose levels.
62
References
1. Daneman, Denis. "Type 1 diabetes." The Lancet 367, no. 9513 (March 2006): 846-858.
2. Ogden, C, C Engelga, A A Hedley, M S Eberhardt, and S H Saydah. "Prevalence of Overweight and Obesity Among Adults with Diagnosed Diabetes --- United States, 1988--1994 and 1999--2002." Morbidity and Mortality Weekly Report, November 19, 2004: 1066-1068.
3. Hogan, Paul, Tim Dall, and Plamen Nikolov. "Economic Costs of Diabetes in the U.S." Diabetes Care (American Diabetes Association) 26 (2003): 917-932.
4. "Executive Summary: Standards of Medical Care in Diabetes—2010." Diabetes Care (American Diabetes Association) 33 (2010): S4-S10.
5. Nathan, David M, Judith Kuenen, Borg Rikke, Hui Zeng, David Schoenfeld, and Robert J Heine. "Translating the A1C Assay Into Estimated." Diabetes Care (American Diabetes Association), no. 31 (2008): 1-6.
6. Kaufman, Francine R, Leena C Gibson, Mary Halvorson, Sue Carpenter, Lynda K Fisher, and Pisit Pitukcheewanont. "A Pilot Study of the Continuous Glucose Monitoring System." Diabetes Care (American Diabetes Association) 24 (2001): 2030-2034.
7. Clark, Leland C, and Champ Lyons. "Electrode systems for continuous monitoring in cardiovascular surgery." Annals of the New York Academy of Sciences, 1962: 1749-6632.
8. Newman, Jeffrey D, and Anthony P F Turner. "Home Blood Glucose Biosensors: A Commercial." Biosensors and Bioelectronics, 20, no. 12 (June 2005): 2435-2453.
9. LifeScan OneTouch Ultra Blood Glucose Meter. January 7, 2011. http://www.lifescan.com/products/meters/ultra/ (accessed January 7, 2011).
10. The Guardian REAL-Time Continuous Glucose Monitoring System. January 7, 2011. http://www.minimed.com/products/guardian/index.html (accessed January 7, 2011).
11. Tura, Andrea, Alberto Maran, and Giovanni Pacini. "Non-invasive glucose monitoring: Assessment of technologies and devices according to quantitative criteria." Diabetes Research and Clinical Practice, no. 77 (2007): 16-40.
63
12. Tamada, Janet, Satish Garg, Lois Jovanovic, Kenneth R. Pitzer, Steve Fermi, Russell O. Potts, “ Noninvasive glucose monitoring: comprehensive clinical results”. Cygnus Research Team, JAMA 282, (1999): 1839–1844.
13. The Diabetes in Children Network Study Group. "Accuracy of the glucowatch g2 biographer and the continuous glucose monitoring system during hypoglycemia." Diabetes Care (American Diabetes Association) 27, no. 3 (2004): 722-726.
14. The Glucowatch Biographer, By David Mendosa. October 31, 2007. http://www.mendosa.com/glucowatch.htm (accessed February 7, 2011).
15. Gou, Dongman, David Zhang. "Monitor blood glucose levels via breath analysis system and sparse representation approach." IEEE Sensors 2010 Conference. Waikoloa, HI, 2010.
16. Khalil, Omar, “Non-invasive glucose measurement technologies: an update from 1999 to the dawn of the new millennium.” Diabetes Technology and Therapeutics, no. 6 (2004): 660-697.
17. Miyauchi, Yuki, Takuro Horiguchi, Hiroaki Ishizawa, Shin-ichirou Tezuka, Hitoshi Hara. “Basis examination for development of noninvasive blood glucose measuring instrument by near-infrared confocal optical system.” SICE Annual Conference 2010. Taipei, Taiwan, 2010.
18. Trabelsi, Abdelaziz, Mounir Boukadoum, Christian Fayomi, El Mostapha Aboulhamid. “Blood glucose optical bio-implant: preliminary design guidelines.” IEEE International Conference on Microelectronics. Cairo, Egypt, 2010.
19. Larin, Kirill, Mohsen Eledrisi, Massoud Motamedi, Rinat Esenaliev. “Noninvasive blood glucose monitoring with optical coherence tomography: a pilot study in human subjects.” Diabetes Care (American Diabetes Association) 25, no. 12 (2002): 2263-2267.
20. Yeh, Shu-Jen, Chrales Hanna, Omar Khalil. “Monitoring blood glucose changes in cutaneous tissue by temperature-modulated localized reflectance measurements.” Clinical Chemistry, vol. 49, no. 6 (2003): 924-934.
21. Hanlon, E B, R Manoharan, T-W Koo, K E Shafer, J T Motz, M Fitzmaurice, J R Kramer, I Itzkan, R R Dasari, M S Feld. “Prospects for in vivo raman spectroscopy.” Physics in Medicine and Biology, vol. 45, no. 1, R1-R59.
22. Waynant, R W, V M Chenault, Overview of non-invasive fluid glucose measurement using optical techniques to maintain glucose control in diabetes mellitus. April 1998. http://www.ieee.org/organizations/pubs/newsletters/leos/apr98/overview.htm
64
(accessed February 7, 2011).
23. Shen, Yaochun, Zuhong Lu, Stephen Spiers, Hugh MacKenzie, Helen Ashton, John Hannigan, Scott Freeborn, John Lindberg. “Measurement of the optical absorption coefficient of a liquid by use of a time-resolved photoacoustic technique.” Applied Optics, vol. 39, no. 22 (2000): 4007-4012.
24. Domschke, Angelika, Satyamoorthy Kabilan, Rita Anand, Molly Caines, David Fetter, Pat Griffith, Karen James, Njeri Karangu, Dawn Smith, Marian Vargas, Jimmy Zeng, Abid Hussain, Xiaoping Yang, Jeff Blyth, Achim Mueller, Peter Herbrechtsmeier, Christopher Lowe. “Holographic sensors in contact lenses for minimally-invasive glucose measurements.” IEEE Sensors, vol. 3 (2004): 1320-1323.
25. DeVries, J H, I M Wentholt, A Zwart, and J B Hoekstra. "Pendra goes Dutch; lessons for the CE mark in Europe." Diabetes Research and Clinical Practice 74, no. S2 (2006): S93-S96.
26. Caduff, A, E Hirt, Yu Feldman, Z Ali, and L Heinemann. "First human experiments with a novel non-invasive, non-optical continuous glucose monitoring system." Biosensors and Bioelectronics 19, no. 3 (2003): 209-217.
27. Green, Eric C, and Randall Jean. "Design of a Microwave Sensor for Non-Invasive Determination of Blood-Glucose Concentration." Master's Thesis, Engineering and Computer Science, Baylor University, 2005.
28. Jean, Buford Randall, Eric C Green, and Melanie J McClung. "A Microwave Frequency Sensor for Non-Invasive Blood-Glucose." IEEE Sensors Applications Symposium. Atlanta, GA, 2008.
29. IEEE Standards Board. "IEEE Standard Definition of Terms for Radio Wave Propagation." The Institute of Electrical and Electronics Engineers, Inc., New York, NY, 1997.
30. Gabriel, C, S Gabriel, and E Corthout. "The dielectric properties of biological tissues: I. Literature survey." Physics in Medicine and Biology 41, no. 11 (1996): 2231.
31. Gabriel, S, R W Lau, and C Gabriel. "The dielectric properties of biological tissues: II. Measurements in the frequency range 10 Hz to 20 GHz." Physics in Medicine and Biology 41, no. 11 (1996): 2251.
32. Gabriel, S, R W Lau, and C Gabriel. "The dielectric properties of biological tissues: III. Parametric models for the dielectric spectrum of tissues." Physics in Medicine and Biology 41, no. 11 (1996): 2271.
65
33. Park, J H, C S Kim, B C Choi, and K Y Ham. "The correlation of the complex dielectric constant and blood glucose at low frequency." Biosensors and Bioelectronics 19, no. 4 (2003): 321-324.
34. Hayashi, Yoshihito, Leonids Livshits, Andreas Caduff, and Yuri Feldman. "Dielectric spectroscopy study of specific glucose influence on human erythrocyte membranes." Journal of Physics D: Applied Physics 36, no. 4 (2003): 369-374.
35. Oviedo, Claudia, and Jaime Rodriguez. "EDTA: The chelating agent under environmental scrutiny." Quimica Nova 26, no. 6 (2003): 901-905.
36. "Agilent 85070E Dielectric Probe Kit: Technical Overview." Agilent Technologies. March 28, 2008. http://cp.literature.agilent.com/litweb/pdf/5989-0222EN.pdf (accessed Januray 7, 2011).
37. Yvanoff, M, and J Venkataraman. "A Feasibility Study of Tissue Characterization Using LC Sensors." IEEE Transactions on Antennas and Propagation 57, no. 4 (2009): 885-893.
38. Jung, Jihak, Wooyoung Choi, and Jaehoon Choi. "A Small Wideband Microstrip-fed Monopole Antenna." IEEE Microwave and Wireless Component Letters 15, no. 10 (2005): 705-703.
39. Wang, Y, J Z Li, and L X Ran. "An equivalent circuit modeling method for ultra-wideband antennas." Progress in Electromagnetics Research 82 (2008): 433-445.
40. Hamid, Michael, and Rumsey Hamid. "Equivalent Circuit of Dipole Antenna of Arbitrary Length." IEEE Transactions on Antennas and Propagation 45, no. 11 (1997): 1695-1696.
41. "AD8302 Data Sheet Rev. A." Analog Devices. 2002. http://www.analog.com/static/imported-files/data_sheets/AD8302.pdf (accessed January 7, 2011).
42. "ADF4350 Data Sheet Rev. 0." Analog Devices. 2008. http://www.analog.com/static/imported-files/data_sheets/ADF4350.pdf (accessed January 7, 2011).
43. Poirier, Jean Yves, Nadine Le Prieur, Loic Campion, Isabelle Guilhem, Hubert Allannic, and Didier Maugendre. "Clinical and Statistical Evaluation of Self-Monitoring Blood Glucose Meters." Diabetes Care (American Diabetes Association) 21, no. 11 (Novembet 1998): 1919-1924.
44. Karacolak, Tutku, Aaron Hood, and Erdem Topsakal. "Design of a dual-band implantable antenna and development of skin mimicking gels for continuous
66
glucose monitoring." IEEE Transactions on Microwave Theory and Techniques 56, no. 4 (2008): 1001-1008.
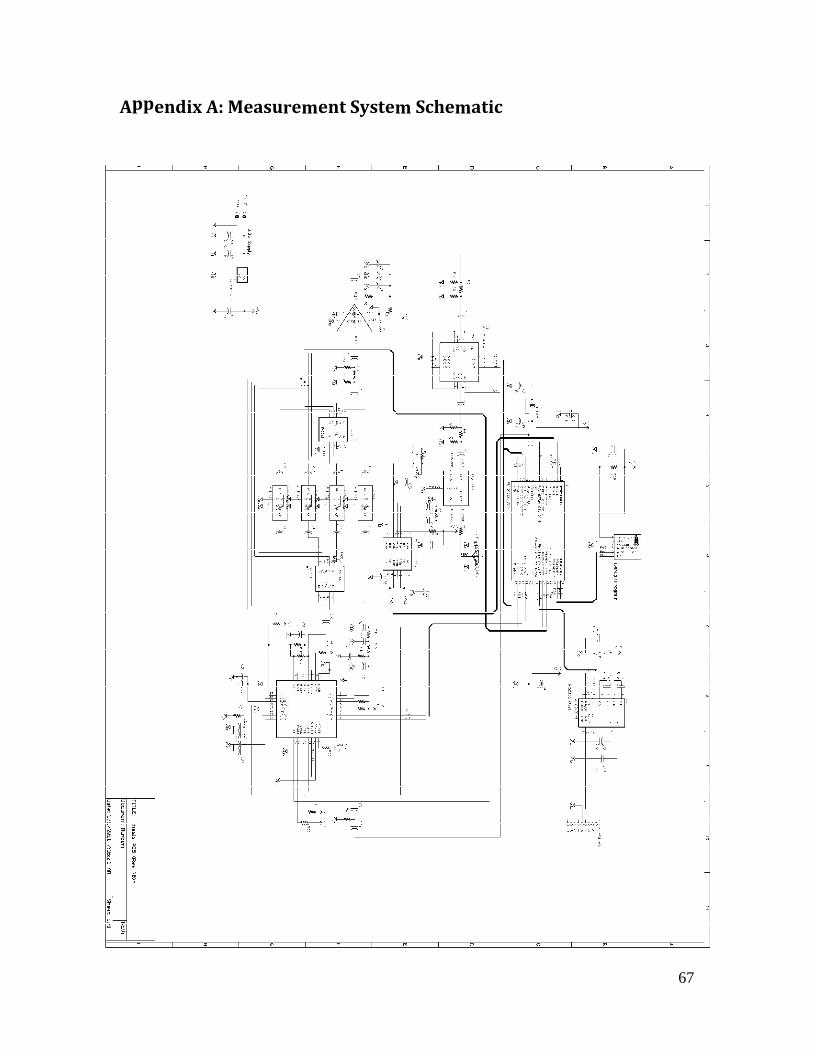
67
Appendix A: Measurement System Schematic
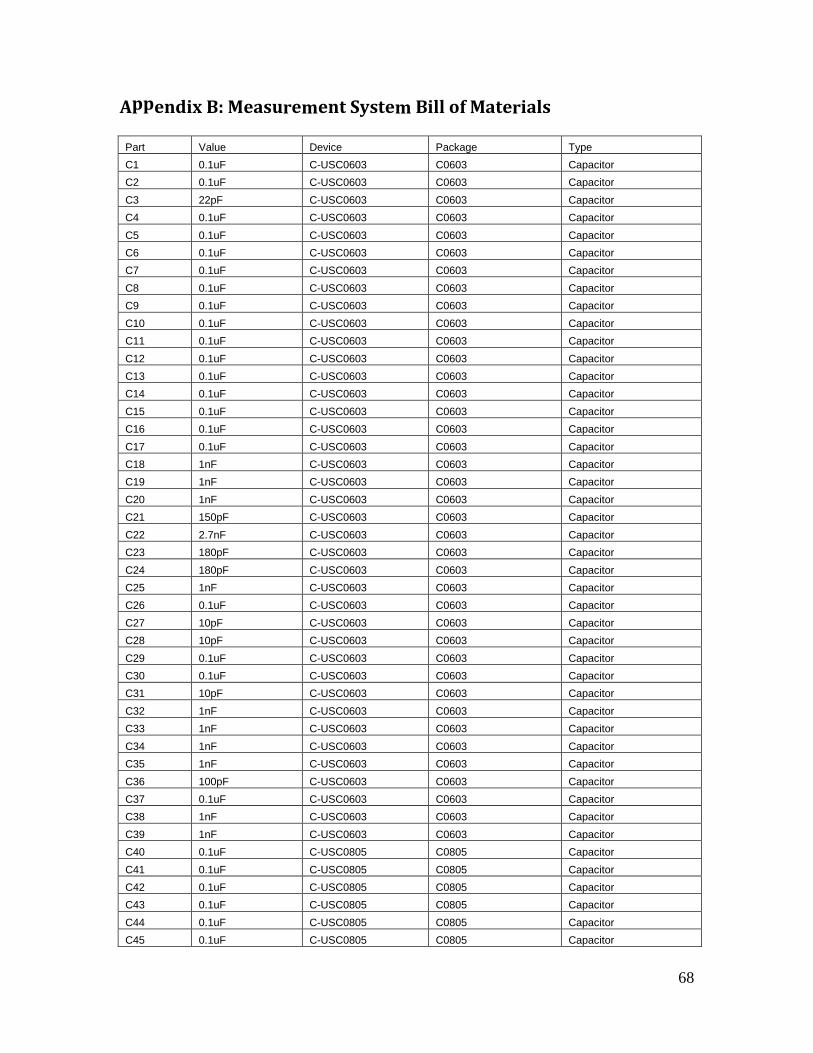
68
Appendix B: Measurement System Bill of Materials Part Value Device Package Type
C1 0.1uF C-USC0603 C0603 Capacitor
C2 0.1uF C-USC0603 C0603 Capacitor
C3 22pF C-USC0603 C0603 Capacitor
C4 0.1uF C-USC0603 C0603 Capacitor
C5 0.1uF C-USC0603 C0603 Capacitor
C6 0.1uF C-USC0603 C0603 Capacitor
C7 0.1uF C-USC0603 C0603 Capacitor
C8 0.1uF C-USC0603 C0603 Capacitor
C9 0.1uF C-USC0603 C0603 Capacitor
C10 0.1uF C-USC0603 C0603 Capacitor
C11 0.1uF C-USC0603 C0603 Capacitor
C12 0.1uF C-USC0603 C0603 Capacitor
C13 0.1uF C-USC0603 C0603 Capacitor
C14 0.1uF C-USC0603 C0603 Capacitor
C15 0.1uF C-USC0603 C0603 Capacitor
C16 0.1uF C-USC0603 C0603 Capacitor
C17 0.1uF C-USC0603 C0603 Capacitor
C18 1nF C-USC0603 C0603 Capacitor
C19 1nF C-USC0603 C0603 Capacitor
C20 1nF C-USC0603 C0603 Capacitor
C21 150pF C-USC0603 C0603 Capacitor
C22 2.7nF C-USC0603 C0603 Capacitor
C23 180pF C-USC0603 C0603 Capacitor
C24 180pF C-USC0603 C0603 Capacitor
C25 1nF C-USC0603 C0603 Capacitor
C26 0.1uF C-USC0603 C0603 Capacitor
C27 10pF C-USC0603 C0603 Capacitor
C28 10pF C-USC0603 C0603 Capacitor
C29 0.1uF C-USC0603 C0603 Capacitor
C30 0.1uF C-USC0603 C0603 Capacitor
C31 10pF C-USC0603 C0603 Capacitor
C32 1nF C-USC0603 C0603 Capacitor
C33 1nF C-USC0603 C0603 Capacitor
C34 1nF C-USC0603 C0603 Capacitor
C35 1nF C-USC0603 C0603 Capacitor
C36 100pF C-USC0603 C0603 Capacitor
C37 0.1uF C-USC0603 C0603 Capacitor
C38 1nF C-USC0603 C0603 Capacitor
C39 1nF C-USC0603 C0603 Capacitor
C40 0.1uF C-USC0805 C0805 Capacitor
C41 0.1uF C-USC0805 C0805 Capacitor
C42 0.1uF C-USC0805 C0805 Capacitor
C43 0.1uF C-USC0805 C0805 Capacitor
C44 0.1uF C-USC0805 C0805 Capacitor
C45 0.1uF C-USC0805 C0805 Capacitor
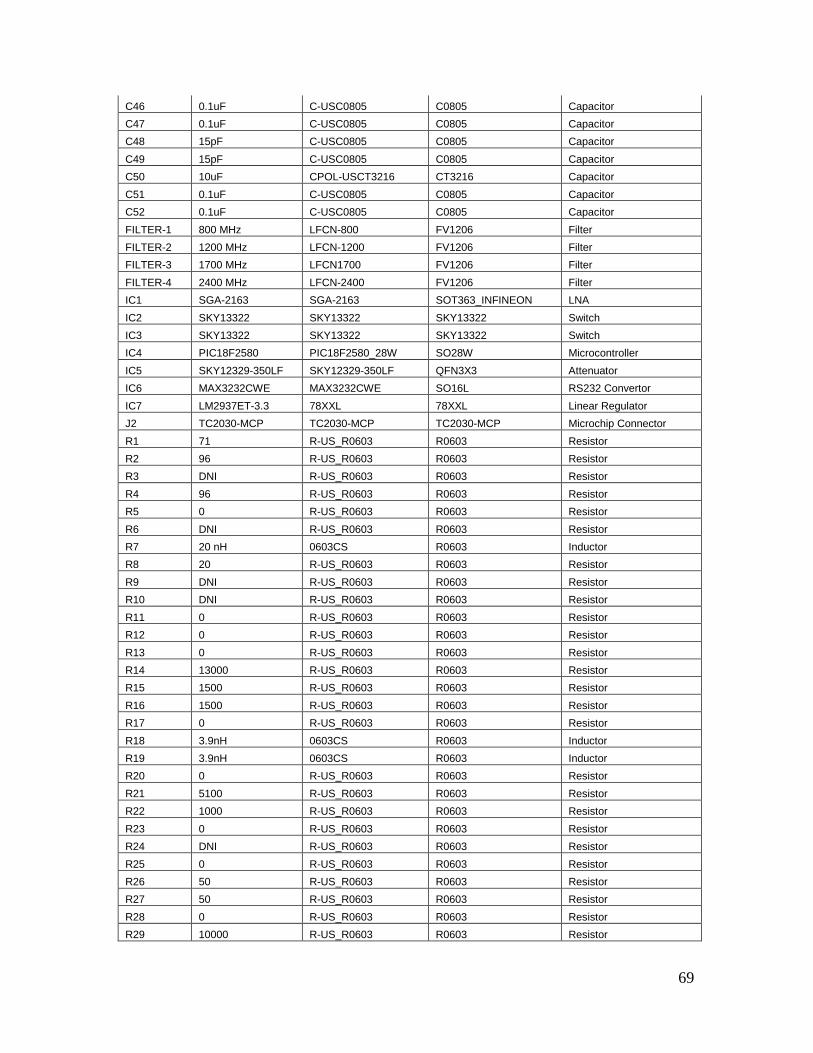
69
C46 0.1uF C-USC0805 C0805 Capacitor
C47 0.1uF C-USC0805 C0805 Capacitor
C48 15pF C-USC0805 C0805 Capacitor
C49 15pF C-USC0805 C0805 Capacitor
C50 10uF CPOL-USCT3216 CT3216 Capacitor
C51 0.1uF C-USC0805 C0805 Capacitor
C52 0.1uF C-USC0805 C0805 Capacitor
FILTER-1 800 MHz LFCN-800 FV1206 Filter
FILTER-2 1200 MHz LFCN-1200 FV1206 Filter
FILTER-3 1700 MHz LFCN1700 FV1206 Filter
FILTER-4 2400 MHz LFCN-2400 FV1206 Filter
IC1 SGA-2163 SGA-2163 SOT363_INFINEON LNA
IC2 SKY13322 SKY13322 SKY13322 Switch
IC3 SKY13322 SKY13322 SKY13322 Switch
IC4 PIC18F2580 PIC18F2580_28W SO28W Microcontroller
IC5 SKY12329-350LF SKY12329-350LF QFN3X3 Attenuator
IC6 MAX3232CWE MAX3232CWE SO16L RS232 Convertor
IC7 LM2937ET-3.3 78XXL 78XXL Linear Regulator
J2 TC2030-MCP TC2030-MCP TC2030-MCP Microchip Connector
R1 71 R-US_R0603 R0603 Resistor
R2 96 R-US_R0603 R0603 Resistor
R3 DNI R-US_R0603 R0603 Resistor
R4 96 R-US_R0603 R0603 Resistor
R5 0 R-US_R0603 R0603 Resistor
R6 DNI R-US_R0603 R0603 Resistor
R7 20 nH 0603CS R0603 Inductor
R8 20 R-US_R0603 R0603 Resistor
R9 DNI R-US_R0603 R0603 Resistor
R10 DNI R-US_R0603 R0603 Resistor
R11 0 R-US_R0603 R0603 Resistor
R12 0 R-US_R0603 R0603 Resistor
R13 0 R-US_R0603 R0603 Resistor
R14 13000 R-US_R0603 R0603 Resistor
R15 1500 R-US_R0603 R0603 Resistor
R16 1500 R-US_R0603 R0603 Resistor
R17 0 R-US_R0603 R0603 Resistor
R18 3.9nH 0603CS R0603 Inductor
R19 3.9nH 0603CS R0603 Inductor
R20 0 R-US_R0603 R0603 Resistor
R21 5100 R-US_R0603 R0603 Resistor
R22 1000 R-US_R0603 R0603 Resistor
R23 0 R-US_R0603 R0603 Resistor
R24 DNI R-US_R0603 R0603 Resistor
R25 0 R-US_R0603 R0603 Resistor
R26 50 R-US_R0603 R0603 Resistor
R27 50 R-US_R0603 R0603 Resistor
R28 0 R-US_R0603 R0603 Resistor
R29 10000 R-US_R0603 R0603 Resistor
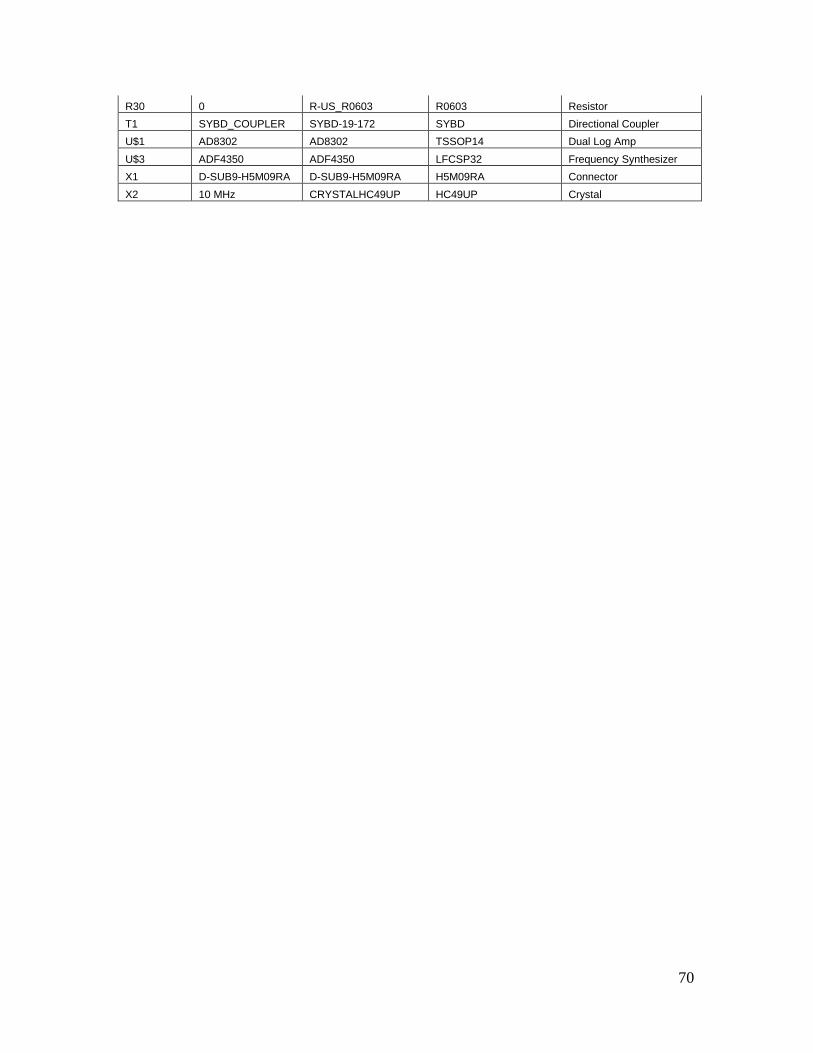
70
R30 0 R-US_R0603 R0603 Resistor
T1 SYBD_COUPLER SYBD-19-172 SYBD Directional Coupler
U$1 AD8302 AD8302 TSSOP14 Dual Log Amp
U$3 ADF4350 ADF4350 LFCSP32 Frequency Synthesizer
X1 D-SUB9-H5M09RA D-SUB9-H5M09RA H5M09RA Connector
X2 10 MHz CRYSTALHC49UP HC49UP Crystal
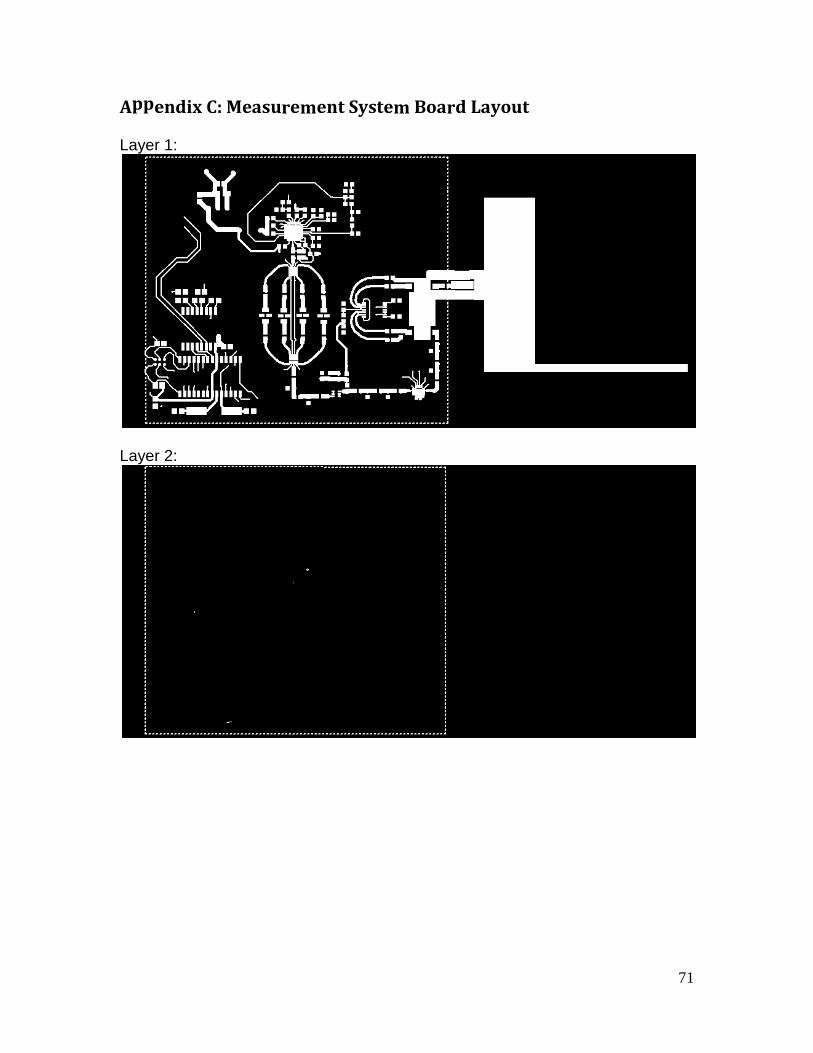
71
Appendix C: Measurement System Board Layout Layer 1:
Layer 2:
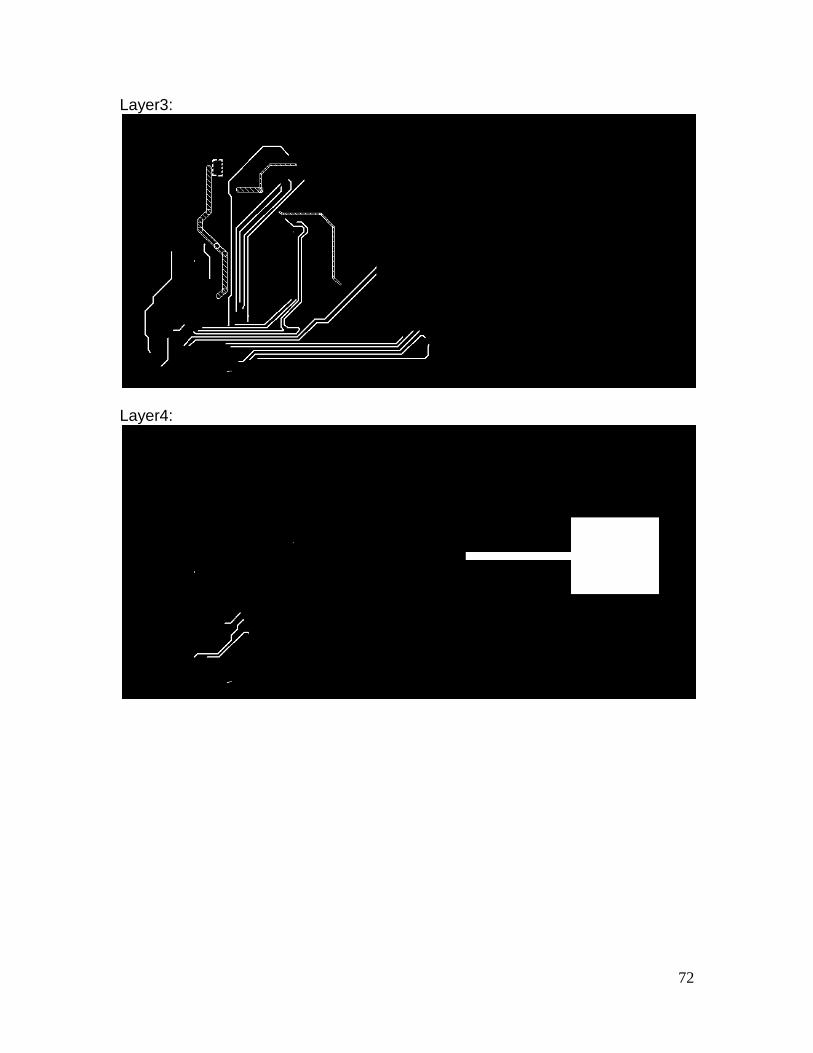
72
Layer3:
Layer4:
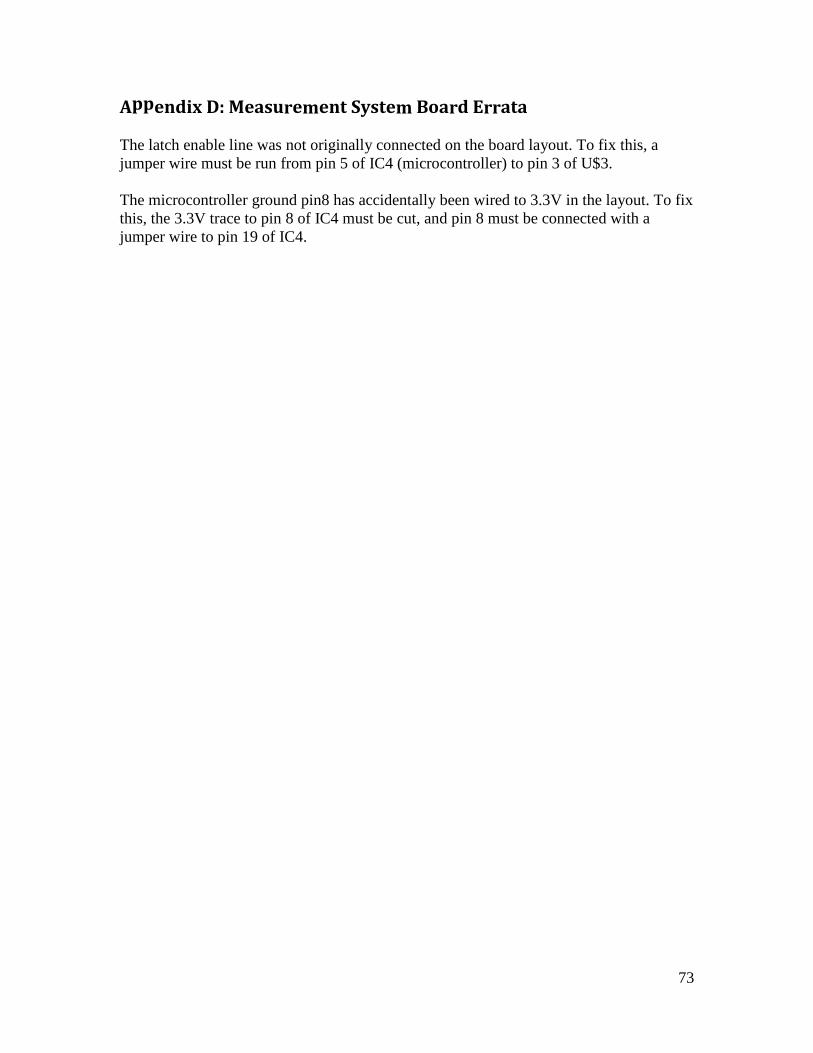
73
Appendix D: Measurement System Board Errata The latch enable line was not originally connected on the board layout. To fix this, a jumper wire must be run from pin 5 of IC4 (microcontroller) to pin 3 of U$3. The microcontroller ground pin8 has accidentally been wired to 3.3V in the layout. To fix this, the 3.3V trace to pin 8 of IC4 must be cut, and pin 8 must be connected with a jumper wire to pin 19 of IC4.