Embed Size (px)
Citation preview

1
Analysis of a Runaway Reaction
Submitted to the Faculty of the
Chemical Engineering Department
Worcester Polytechnic Institute
Worcester, MA, 01609
Faculty Advisor: Stephen J. Kmiotek
May 18th, 2020
Benson Colella ________________________________
Benson Colella
Nicholas Roschewsk _________________________________
Nicholas Roschewsk
Christopher Tracy _________________________________
Christopher Tracy
This report represents work of WPI undergraduate students submitted to the faculty as evidence
of a degree requirement. WPI routinely publishes these reports on its web site without editorial
or peer review. For more information about the projects program at WPI, see
http://www.wpi.edu/Academics/Projects.

2
Abstract Safety is of utmost importance in the chemical industry. Inspired by an industrial accident
that occurred in 2010, we explored the exothermic acid-catalyzed polymerization of furfuryl
alcohol. In the accident, methanesulfonic acid entered a drum of furfuryl alcohol and caused an
explosion due to a runaway reaction. In our investigation, we completed experiments to find the
heat of reaction of furfuryl alcohol, heat capacity of polyfurfuryl alcohol, and overall heat
transfer coefficient of furfuryl alcohol. We produced a model in Mathcad that can predict
reaction temperature overtime and estimate the time for a runaway reaction to occur. We also
investigated how mass and heat transfer can limit the reaction rate. Finally, we included the
limitations of our experiments as well as safety recommendations for industry and future
research.

3
Acknowledgements We thank Professor Stephen Kmiotek of Worcester Polytechnic Institute (WPI) for the
opportunity to work on this project. Professor Kmiotek provided constant feedback, support, and
enthusiasm about our project over the course of the year.
We thank Professor James Dittami of WPI. Professor Dittami aided in our literature
review early on in our project when we were looking for an approach to our complex problem.
We also thank Professor Christopher Lambert of WPI. Professor Lambert gave us guidance on
the techniques to gather data on our reaction, such as to inexpensively measure the heat of
reaction by ice calorimetry.
Additionally, we thank Tom Partington and Doug White, Managers of WPI’s Goddard
Hall Unit Operations Lab. Both Tom and Doug helped us with creating our apparatuses for
experimentation.
Finally, we thank Leslie Brodeur and Tiffany Royal of the WPI Chemical Engineering
Department. Leslie and Tiffany helped us to gather the materials we needed to successfully
experiment.

4
Table of Contents
Title Page 1
Abstract 1
Acknowledgements 3
Table of Contents 4
Table of Figures 5
1.0 Introduction 7
2.0 Background 8
2.1 Chemical Storage Practices and Hazards 8
2.1.1 Potential Safety Hazards 8
2.1.2 How to Handle Chemicals Safely 9
2.1.3 How to Store Chemicals 9
2.2 Incident Under Investigation 10
2.3 Applicable Codes 12
2.4 Overview of Reactants 14
2.4.1 Furfuryl Alcohol 14
2.4.2 Poly Furfuryl Alcohol 15
2.4.3 Methanesulfonic Acid 16
2.4.4 Hydrochloric acid 16
2.5 Reaction Kinetics 17
2.5.1 Rate Laws 17
2.5.2 Kinetics of the Polymerization of Furfuryl Alcohol 17
2.6 Reactor Scale Up 18
2.6.1 Energy Balance 18
2.6.2 Mass Balance 19
2.7 Previous Experimentation 20
3.0 Methodology 21
3.1 Initial Experimentation 21
3.2 Ice Calorimetry 21
3.2.1 Determining Heat of Reaction 21
3.2.2 Determining Heat Capacity 23
3.3 Transfer Limiting Experimentation 24
3.4 Overall Heat Transfer Coefficient 25
3.5 Mathcad Model to Predict Thermal Runaway 26
3.5.1 Overview of the Model 26
3.5.2 Simplifying Assumptions 26
3.5.3 Experiments to Inform the Model 27
3.6 Final Experimentation to Validate Mathcad Model 27
3.7 Analysis of Industrial Accident 28
4.0 Results and Discussion 29
4.1 Initial Experimentation of Open Beaker Reactions 29
4.2 Ice Calorimetry 33
4.2.1 Determining Heat of Reaction 33
4.2.2 Determining Heat Capacity of Polyfurfuryl Alcohol 35
4.3 Mass and Heat Transfer Limiting Experimentation 38

5
4.4 Overall Heat Transfer Coefficient for Glassware and Plastic Containers 42
4.5 Mathcad Model to Predict Thermal Runaway 43
4.5.1 Fit to Experimental Data 43
4.5.2 Capabilities 44
4.6 Final Experimentation to Validate Mathcad Model 44
4.7 Analysis of Industrial Accident 46
5.0 Conclusions and Recommendations 48
5.1 Mathcad Modeling 48
5.2 Process Safety Concerns 48
5.3 Future Experimentation 49
References 52
Appendices 55
Appendix A: Sample Mathcad Model 55
Appendix B: Experiments to Inform and Compare to the Mathcad Model 58
Appendix C: Sample Calculations to Determine Heat of Reaction 61
Appendix D: Sample Calculations to Determine Heat Capacity 63
Appendix E: Overall Heat Transfer Coefficient Data 66
Appendix F: Sample Calculations to Determine the Overall Heat Transfer Coefficient 83
Appendix G: Mathcad Models and their Informing Experiments 85
Appendix H: MaCAD Predictions with Comparison Experiments 90
Appendix I: Mathcad Model of Industrial Incident 95

6
Table of Figures 1. Hole caused from explosion of drum. 10
2. Overpressurized and overheated drum aftermath 10
3. The area of the plant where the accident occurred. 11
4. RCRA Subsection C Flow Diagram. 13
5. Furfuryl alcohol. 14
6. Reaction paths of polymerization of FA. 15
7. Methane sulfonic acid. 16
8. Basic IC Setup. 22
9. Initial open beaker experimental setup, 50mL beaker, 22mL of FA, 0.7mL of MSA. 29
10. Temperature profile: 50mL beaker, 22mL of FA, 0.7mL of MSA. 30
11. Profile of the exotherm: 50mL beaker, 22mL of FA, 0.7mL of MSA. 30
12. Mixed and unmixed reaction experimental setup. 31
13. Mixed and unmixed runaway comparison, unmixed runaway (left). 32
14. Mixed and unmixed reaction comparison test, PFA spill-over in mixed beaker (right). 32
15. Heat of reaction setup. 33
16. Heat of reaction Trial 8, volume vs. time graph, 0.365mL of HCl and 5mL of FA. 34
17. IC apparatus setup for determining heat capacity. 35
18. Heat capacity Trial 6, volume vs. time graph. 36
19. Theoretical heat capacity with exaggerated slopes. 37
20. Experimental set up for changing the stir rate. 38
21. Temperature profiles: 20mL beaker, 10mL recycled FA, 0.2mL of HCl. 43
22. Temperature profiles: 20mL beaker, 10mL recycled FA, 0.2mL of HCl. 45
23. Temperature profiles: 50mL beaker, 30mL FA, 0.1mL HCl. 45
24. Temperature profiles: 100mL beaker, 50mL, 0.2mL HCl. 46

7
1.0 Introduction Safety is of utmost importance in the chemical industry. According to the AIChE code of
ethics of a chemical engineer, a chemical engineer is to “hold paramount” the safety of both
people and the environment (AIChE, 2015). When conditions are unsafe, a chemical engineer is
required to take action.
We explored a chemical accident that resulted in an explosion in industry in 2010.
Catalyzed furfuryl alcohol blew up a drum spraying an unknown black polymer. Luckily, no one
was in the area of the explosion, but the environmental impact of this black polymer was
unknown. An incident investigation team was formed to figure out the cause of the accident.
Unknowingly, methanesulfonic acid entered a partly filled drum of furfuryl alcohol causing the
exothermic reaction that resulted in the explosion. The incident investigation team was baffled at
the lack of research on the polymerization of furfuryl alcohol. Our goal was to fill this gap by
researching the acid catalyzed polymerization of furfuryl alcohol into polyfurfuryl alcohol.
To model the incident, we used the engineering software Mathcad. In our model, the
parameters of vessel size, vessel material of construction, volume of furfuryl alcohol added,
volume of acid added, and initial temperature of the reaction as the input variables. These
independent variables can be manipulated to see if and when the polymerization of furfuryl
alcohol will run away thus potentially causing unsafe conditions. The output of our model is a
temperature versus time curve where an exotherm is noticeable if it occurs.
The goal of this research was to better understand the kinetics of the polymerization
reaction which we did by creating a model to predict thermal runaway. With our model, in case
there is contamination in the future, engineers can predict how long prior to the reaction and the
severity of the reaction that is about to occur. We also developed safety recommendations that
are applicable to prevent similar industrial situations from happening again in the future.
Additionally, we have recommendations for how researchers can more safely handle our
reactants to prevent any exposure throughout the course of further research.
All experimentation and data collection ceased on March 6, 2020 by WPI and
governmental mandates due to the rapid spread of pandemic caused by the COVID-19 virus.
This paper includes experimentation up to that date and a description of the activities that we had
hoped to conduct after that date.

8
2.0 Background
2.1 Chemical Storage Practices and Hazards
2.1.1 Potential Safety Hazards
Handling chemicals in a safe manner is the responsibility of every employee in the
chemical industry. Not only is it the job of the Safety Engineer to set and enforce policies, it is
the responsibility of every operator, maintenance technician, and engineer to follow these
policies and understand their importance. Even with complete cooperation, accidents have the
potential of happening and this chance increases with a lack of cooperation. According to Dugas
(2018), the four main causes of accidents in chemical plants are human error, improper training,
manufacturing defects and improper maintenance. In 2017, 5,147 deaths in the United States
occurred due to industrial accidents (US Bureau of Labor, 2018). This number correlates with a
fatal injury rate of 3.5 per 100, 000 full-time workers (US Bureau of Labor, 2018). In order to
reduce it to zero deaths in the chemical industry per year, it is critical to understand how
accidents occur in order to prevent similar accidents from happening again in the future.
Human error causes the majority of industrial accidents (Dugas, 2018). Most human error
accidents fault the worker who failed to follow the safety precautions of a procedure correctly.
An example of a catastrophe resulting from human error is the explosion of the BP offshore
drilling rig Deepwater Horizon. According to the Chemical Safety Board, if procedures were
followed during the time of the upset, manual controls should have been reset which would have
diverted fluids returning from the well instead of storing them onboard. This means the
flammable gases would have never found an ignition source (McLeod, 2017). The Deepwater
Horizon accident is evidence that emergency procedures are just as important as day-to-day
procedures.
Without the proper training, there would be no purpose of having written procedures to
promote safety. Employees, even those with ample experience, may not know how to respond to
chemical spills. It is critical to assume this when training an employee of any skill level (Nichols,
2018). Training can include looking through standard operating procedures as well as hands-on
training in the field. For example, in 2013 fires broke out on a barge in Mobile, Alabama due to
workers not being trained on how to keep gas storing tanks clean. These tanks leaked and once
an ignition source was present, a fire occurred. An intervention as simple as a presentation on the
importance of clean storage tanks may have prevented this incident which left three people
injured (Maritime Injury Center, n.d.).
Mechanical integrity of all pieces of equipment in a plant prevents any surprises from
happening. It is best practice to follow the manufacturer’s recommendation for scheduled
intervals of maintenance (Dugas, 2018). Without proper maintenance the operators that are
closest to these pieces of equipment are at the highest risk of injury. Chevron fell victim to an
incident due to inadequate mechanical integrity in an oil refinery in Richmond, California in
2012. Corrosion in a carbon steel pipe resulted in the vaporization of a highly flammable
hydrocarbon process fluid (Chemical Safety and Hazard Investigation Board, n.d.). This accident
could have been avoided if there was a preventative maintenance schedule that would have
checked the pipes for levels of corrosion. Additionally, a pipe of a thicker or less corrosive
material could have been used, but that pipe too would require maintenance just less frequent.
Mechanical integrity is a balance between economic capital and the risk presented as proper
maintenance per the manufacturer’s recommendation is not always feasible.

9
2.1.2 How to Handle Chemicals Safely
Handling chemicals is an important part of a chemical process as it is when an operator
could come in direct contact with a chemical. For this reason, the safest approach to handling
chemicals is documented on a Safety Data Sheet (SDS). According to the OSHA Hazard
Communication Standard in 2012, it is required that every chemical manufacturer, distributor, or
importer provide a SDS for each downstream user to have available (U.S. Department of Labor,
n.d.). An SDS communicates the hazards of each chemical and the recommended safety
measures needed to limit its hazard potential.
One major aspect of handling chemicals in Personal Protective Equipment (PPE). An
SDS will recommend what amount of PPE is required per chemical in order to minimize
exposure to any chemical. Just like wearing PPE, it is equally important that an employee knows
how to properly wear any equipment. For example, if an operator is not trained on how to use an
air-purifying respirator, it is possible that air-containing the toxic chemical will be inhaled. For
this reason, OSHA recommends that each employee is required to know the following about any
potential PPE that is to be worn.
I. When is it necessary?
II. What kind in particular is necessary?
III. How to properly wear, adjust, and take it off?
IV. What are the limitations of the equipment?
V. What is the proper care, maintenance required, life span, and intended disposal of the
equipment (U.S. Department of Labor, n.d.)?
Information to answer these questions should be found in an SDS.
2.1.3 How to Store Chemicals
The storage of chemicals is a key component to safety in the chemical industry.
Improperly storing chemicals can create hazardous conditions. For this reason, it is best practice
to follow the rules of storage listed below.
I. Label all chemicals, in both primary and secondary containers.
II. Physically separate incompatible chemicals. Incompatible chemicals are ones that react
or create dangerous conditions when mixed.
III. Separate chemicals by hazard class.
IV. Date all chemicals when received and opened. Have expiration date clearly labeled on
container. Never ignore a chemicals expiration date.
V. Keep chemicals out of direct sunlight for a prolonged period of time.
VI. Keep emergency exits and walkways free from stored materials (Geary, n.d.).
VII. Keep up-to-date inventory of all chemicals on-site.
VIII. Store chemicals at or below eye level for easy access
IX. Ventilate any storage areas that require it (UCDavis Safety Service, 2018).
An SDS should provide details on how to properly store any chemical.

10
2.2 Incident Under Investigation
The reaction that this project is modeled after is an actual incident that happened at a
local chemical company in Marlborough, MA on December 14th, 2010. On that day, a 55-gallon
HDPE drum, partially filled with furfuryl alcohol, became over pressurized and exploded.
Unknown to the engineers, some contaminant made its way into the drum which resulted in an
exothermic reaction causing the drum to deform, shown in Figures 1 & 2. The heat produced by
the reaction combined with the over pressurization caused the explosion. The drum was located
in the “material preparation” or storage area of the plant, seen in Figure 3.
Figure 1. Hole caused from explosion of drum.
Figure 2. Over pressurized and overheated drum aftermath

11
Figure 3. The area of the plant where the accident occurred.
An incident of this magnitude resulted in a flurry of research and questions surrounding
current operations and procedures for the plant. At the time of rupture, the drum was propelled
35 feet into the air where it hit the ceiling. A sticky black resin was sprayed in the immediate
area of the accident. Thankfully, no people were hurt. Production in the plant was put on hold so
a proper investigation could be conducted to find the root cause of the accident. The fire
department was called to ensure the facility was safe.
The investigation revealed that a hand-pump was contaminated with trace amounts of
methanesulfonic acid. This acid reacted with the furfuryl alcohol. A timeline of events was
created by Prof. Stephen Kmiotek, who participated in the immediate accident investigation.

12
Table 1: Timeline of events the day of the accident (Kmiotek, n.d.).
Time Event Description
12:00 Quantity of alcohol pumped into new, unused, clean drum for later use in a
batch using previously used hand pump labeled “furfuryl alcohol.”
13:40 Drum ruptured; building evacuated. Fire Department arrives.
At this time, the identity of the material is not known.
14:10 Entry teams (Level A) enter the area, collect air samples, take pictures. Identify
the material. FD provides back-up. Team determines conditions are stable and
the area is safe.
15:10 Building reopened and FD departed. Incident Commander established clean-up
procedures. Teams re-enter, wash all affected areas with water. Ruptured drum
isolated and bagged for future study. Contaminated disposable equipment
discarded. Walls and major equipment brush-cleaned.
15:30 Operators in the general area interviewed.
19:00 All areas cleaned and the building turned back over to production.
2.3 Applicable Codes Safety regulations were implemented into production and storage facilities to keep both
citizens and employees safe. Safety codes and regulations all aim to minimize chances of
hazardous situations. The main organizations that have implemented safety measures are the
Environmental Protection Agency (EPA), National Fire Protection Association (NFPA), and the
Occupational Safety and Health Administration (OSHA). Each of these institutions has released
information with regards to storing and protecting hazardous or explosive materials. There are
also specific regulations on furfuryl alcohol.
OSHA sets guidelines and regulations on chemical usage in industry. OSHA says that
furfuryl alcohol is classified as a toxic chemical. Furfuryl alcohol can cause damage if inhaled or
allowed to contact the skin. Repeated or prolonged contact can cause a skin rash, dryness and
redness. Contact with the eyes can severely irritate and burn, leading to eye damage. Inhaling
furfuryl alcohol can irritate the nose, throat and lungs causing coughing, wheezing and/or
shortness of breath. Higher exposure may affect the nervous system causing headache, dizziness,
nausea and even passing out.
OSHA also regulates exposure limits for employees in order to protect long term health.
There are different levels of workspace exposure limits, depending on the amount of time around
furfuryl alcohol. OSHA classifies the legal airborne permissible exposure limit (PEL) to be 50
ppm averaged over an 8-hour work shift. The National Institute for Occupational Safety and
Health (NIOSH) recommends an airborne exposure limit of 10 ppm averaged over a 10-hour
work shift and 15 ppm not to be exceeded during any 15-minute work period.
OSHA has also defined the necessary personal protective equipment (PPE) required
when handling specific chemicals or materials. It is required by law that companies must follow
OSHA guidelines in order to keep the public and their employees safe. 1910.132(a) states that

13
“Protective equipment, including personal protective equipment for eyes, face, head, and
extremities, protective clothing, respiratory devices, and protective shields and barriers, shall be
provided, used, and maintained in a sanitary and reliable condition wherever it is necessary by
reason of hazards of processes or environment, chemical hazards, radiological hazards, or
mechanical irritants encountered in a manner capable of causing injury or impairment in the
function of any part of the body through absorption, inhalation or physical contact.”
The EPA was instituted by the US government with the simple goal of regulating policies
to protect our environment. The EPA has instituted acts for the control and disposal of toxic
substances like furfuryl alcohol. The Toxic Substances Control Act (TSCA) was created by the
EPA in 1976 with the goal of regulating the introduction of new or already existing chemicals.
When the TSCA was created, all existing chemicals were considered to be safe for use and
subsequently grandfathered in. Before a “new chemical” can be utilized in industry, a pre-
manufacturing form must be sent to the EPA for review before use.
The EPA also has a major focus on disposal efforts for hazardous materials, such as
furfuryl alcohol. The EPA classifies a hazardous waste as “waste with properties that make it
dangerous or capable of having a harmful effect on human health or the environment.”
Hazardous wastes are created in various industries and must be properly controlled and disposed
of in order to protect the public.
To protect the public and hold industries accountable, the Resource Conservation and
Recovery Act (RCRA) was created. The RCRA gives EPA the authority to control hazardous
waste from the "cradle-to-grave." This includes the generation, transportation, treatment, storage
and disposal of hazardous waste. To achieve this, EPA develops regulations, guidance and
policies that ensure the safe management and cleanup of solid and hazardous waste, as well as
programs that encourage source reduction and beneficial reuse. Subsection C specifically deals
with hazardous waste. To encourage safe disposal efforts, the EPA created an easy to follow
flow diagram, as shown in Figure 4.
Figure 4. RCRA Subsection C flow diagram.

14
Another group called the National Fire Protection Agency (NFPA) has published a set of
codes and standards to aid in fire suppression and fire safety. The NFPA has released more than
300 codes that are utilized in various industries. Some applicable codes are:
I. NFPA Code 1- Fire Code
II. NFPA Code 3 - Standard for Commissioning of Fire Protection and Life Safety
Systems
III. NFPA Code 30 - Flammable and Combustible Liquids Code
IV. NFPA Code 33 - Standard for Spray Application Using Flammable or
Combustible Materials
V. NFPA Code 45 - Standard on Fire Protection for Laboratories Using Chemicals
VI. NFPA Code 56 - Standard for Fire and Explosion Prevention During Cleaning
and Purging of Flammable Gas Piping Systems
VII. NFPA Code 69 - Standard on Explosion Prevention Systems
VIII. NFPA 400 Code - Hazardous Materials Code
IX. NFPA 495 Code - Explosive Materials Code
A relevant code to this accident is the NFPA Code 69 - Standard on Explosion Prevention
Systems. This code provides basic instructions to engineers, and other applicable personnel, on
operating errors or flaws that could lead to an explosion or other accident. Codes are structured
by chapters in order to make them more organized and easier to read, in turn making compliance
more likely. Code 69 goes into different definitions and types of explosions in the initial
chapters, and later addresses how each can be counteracted in later chapters. The term internal
deflagration (explosion inside a vessel causing an explosion) is noted in Chapter 4, and then
prevention measures are later addressed in Chapter 13.
2.4 Overview of Reactants
2.4.1 Furfuryl Alcohol
Furfuryl alcohol (FA) is a furan substituted with hydroxymethyl. Figure 5 shows the
structure of FA.
Figure 5. Furfuryl alcohol (Structural formula of furfuryl alcohol, n.d.).
At normal temperature and pressure, FA is a clear, colorless liquid. FA boils at 171°C
and melts at -31°C (U.S. National Library of Medicine, n.d.). FA is miscible in water, ethanol,
acetone, and most organic solvents (Kottke, 2005; McKillip & Sherman, 1978). FA is a possible
carcinogen and is naturally present, in very small quantities, in several foods including wine,
pineapple, and coffee (National Coffee Association, n.d.). The largest industrial use for furfuryl
alcohol is as a monomer in the production of furan resins (see “Poly furfuryl alcohol”).

15
FA is typically synthesized by the hydrogenation of furfural. Furfural is typically
produced by the dehydration of pentose sugars from lignocellulosic biomass (i.e., dry plant
matter) (Adams & Voorhees, 1921). By these steps, FA and its polymers can be produced by
“waste” biomass including corn cobs and oat hulls. In fact, Quaker Oats led the charge to
industrially develop FA in the early twentieth century when they began to mass-produce the
chemical from oat hulls (Brownlee & Miner, 1948).
FA is attractive as a monomer, in part, because it is non-petroleum based. FA, sourced
from waste biomass, allows rich, renewable polymer chemistry. See 2.4.1 Poly Furfuryl Alcohol
for uses for polymers of FA.
2.4.2 Poly Furfuryl Alcohol
Polymerized furfuryl alcohol is named, understandably, poly furfuryl alcohol (PFA).
PFA, also called furan resin, is formed by the acid-catalyzed polycondensation of FA. Two
reaction paths are possible, as shown in Figure 6, leading to two different repeating monomer
units.
Figure 6. Reaction paths of polymerization of FA (Übersichtsreaktionen von Veretherung und
Kernkondensation von Furfurylalkohol, n.d.).
Chains of furfuryl alcohol are expected to be colorless, but colorless polymers are not
observed (Choura, Belgacerm, & Gandini 1996). The polymers are colored because they are not
strictly linear but are also crosslinked (Choura, Belgacem, & Gandini, 1996). Crosslinking
occurs when terminal hydroxyl groups react with double bonds outside of furan units. The
polymerization of FA into PFA can be inhibited by the addition of sodium hydroxide; partially
polymerized PFA is a viscous brown liquid. Fully cured PFA is a brittle black solid. PFA is
highly resistant to acids and bases (Biron, 2014). Additionally, PFA has high thermal resistance
and low flammability (Biron, 2014).

16
For its thermal and chemical resistance, PFA has namely two industrial applications.
First, PFA is used as a binding agent for sand in foundry molds. By sand casting, molten metal is
poured into a negative of the object in sand (Falco, Guigo, Vincent, & Sbirrazzuoli, 2018a).
Second, PFA is used to reinforce wood. The low molecular weight of furfuryl alcohol allows it to
penetrate the wood when it cures into PFA (Falco, Guigo, Vincent, & Sbirrazzuoli, 2018a).
Furan NO-BAKE, Furan HOT BOX, and Furan SO2 are brand names for furfuryl alcohol
products to bind foundry sand (IFC, n.d.). Furan NO-BAKE is a furfuryl alcohol-based binder
that uses sulfuric, sulfonic, or phosphoric acids as a catalyst (IFC, n.d.). Furan HOT BOX is like
Furan NO-BAKE but is catalyzed by milder acids under higher temperatures (IFC, n.d.). Furan
SO2 is catalyzed by SO2 gas and is used for the fast production of small molds (IFC, n.d.).
Furfuryl alcohol can be catalyzed by any acid, but few acids are used in practice (Zhang et al.,
2014). P-xylenesulfonic acid is a typical acid catalyst used in Furan NO-BAKE, and Furan NO-
BAKE binders release significant hazardous air pollutants (Zhang et al, 2014). Aromatic
pollutants from Furan No-BAKE binders are thought to originate from the p-xylenesulfonic acid
catalyst itself. For that reason, Zhang et al. explored the use of a nonaromatic sulfonic acid
catalyst in the production of furan resins. The group found they could achieve a polymer of
similar characteristics and fewer hazardous emissions by using methane sulfonic acid as the
catalyst (Zhang et al., 2014).
FA also forms oligomers, chains of PFA only a few units in length. These oligomers form
rather spontaneously (i.e., without the addition of an acid-catalyst). The year-old bottles of FA
left by the previous MQP team were evidence of oligomer formation. While pure FA is clear, our
year-old FA had an amber color, indicative of the presence of oligomer chromophores.
2.4.3 Methanesulfonic Acid
As stated before, PFA is produced by the acid-catalyzed condensation of FA. Methane
sulfonic acid (MSA) does not necessarily have to be the acid-catalyst; any number of acids
would suffice. We studied MSA because it was the acid that catalyzed the runaway reaction of
interest. Figure 7 shows the structure of MSA.
Figure 7. Methane sulfonic acid (Structural formula of methanesulfonic acid, n.d.).
At normal temperature and pressure, MSA is a clear liquid (Lide, 2008). MSA melts at 20°C
(Lide, 2008). MSA is nonvolatile; its boiling point under vacuum (10 mm Hg) is 167°C (Lide,
2008). MSA is soluble in water and ethanol (Lewis, 2007; Lide, 2008). MSA is favored as an
acid-catalyst in organic chemistry due to its low volatility and solubility in organics. Also, MSA
is an acid in which many salts are soluble, which makes its useful in the electroplating of tin-lead
soldiers (Gernon, 1999).
2.4.4 Hydrochloric acid
Hydrochloric acid (HCl) is a strong acid. Anhydrous HCl is a colorless or slightly yellow
gas at room temperature (U.S. National Library of Medicine, n.d.). HCl is completely soluble in

17
water, and solutions of HCl are clear (U.S. National Library of Medicine, n.d.). HCl boils at -
85°C and melts at -114°C (O'Neil, 2013).
HCl is a commodity chemical with many industrial uses. HCl is sold as “muriatic acid”
in hardware stores for general cleaning, swimming pool treatment, and masonry. HCl is also
used to remove rust and scale from steel and as a reagent in organic and inorganic chemical
synthesis.
2.5 Reaction Kinetics
2.5.1 Rate Laws
Reaction kinetics concern the rates at which chemical reactions occur. By the law of mass
action, the rate of a chemical reaction depends only on the concentrations of the substances
involved when temperature is maintained constant (The Rate Law, 2019). Dependence may
include the concentrations of reagents, products, and/or catalysts. A rate law expresses a reaction
rate at a given temperature as the product of a constant and the exponentials of the concentrations
on which the rate depends. In rate law expressions, rates are expressed in dimensions of amount
per unit time per volume, typically: mol/L-s. Concentrations are expressed as mol/L. The
dimensions of the constant, k, depend on the exponents of the concentrations. Equation 1 is a
general rate law.
rate = k [A]a[B]b (1)
For the rate law expressed by Equation 1, the reaction it describes depends on the
concentrations of components A and B; the bracket indicates that the quantity is a molar
concentration. The reaction is said to be in the order of a + b. For instance, if a = 1 and b = 2;
then the reaction is third order. The reaction is said to be in first order with respect to component
A and is in second order with respect to component B.
The rate constant k has dependence on temperature, frequency and orientation of
collisions, and the activation energy of the reaction. Equation 2 is the Arrhenius equation that
defines the rate constant.
𝑘 = 𝐴 × 𝑒−𝐸𝑎𝑅 𝑇 (2)
In Equation 2, A is the frequency factor, a pre-exponential factor that describes the frequency
and orientation of collisions (Clark, 2013). Ea is the activation energy in J/mol. R is the ideal gas
constant in J/(mol-K). T is temperature in K.
2.5.2 Kinetics of the Polymerization of Furfuryl Alcohol
While furfuryl alcohol is regularly polymerized for industrial applications, relatively little
information is available on the kinetics of this reaction. It is possible that producers of furan
resins understand the kinetics very well but protect this information. It is also possible that these
producers have not described the reaction kinetics well but, instead, make resins by heuristics:
they do what works experientially. We told engineer and researcher Abe Noe-Hays that it was
odd that so little information is available on the reaction despite its industrial prevalence. Abe
replied, “They probably just have a recipe.”

18
It is understood that the reaction kinetics vary considerably depending on the type and
strength of acid, presence of water, and temperature (Choura, Belgacem, & Gandini, 1996). It is
also known that those conditions control what reactions occur when FA polymerizes. Choura,
Belgacem and Gandini found that mild conditions may limit cross linking. Falco, Guigo,
Vincent, and Sbirrazzuoli (2018b) found that the presence of isopropyl alcohol or water solvents
favors ring opening, which results in a polymer that is less rigid.
Sun et al. (2017) studied the kinetics of the polymerization of furfuryl alcohol in aqueous
solution. The group isothermally reacted FA with a sulfuric acid catalyst at temperatures between
30°C and 70°C. The group determined that the polymerization in aqueous solution was first
order with respect to hydrogen ions and first order with respect to furfuryl alcohol (Sun et al.,
2017). The group determined an activation energy of 64.2±5.9 kJ/mol and a frequency factor of
4.89 x 10⁹ L/mol-min (Sun et al., 2017). This information together forms a rate law for the
polymerization of FA in aqueous solution with sulfuric acid catalyst, Equation 3.
𝑟𝑎𝑡𝑒 = −(8.15 × 10⁷) 𝑒−7721
𝑇 [𝐻+] [𝐹𝐴] (3)
In Equation 3, r is the rate at which FA is consumed in mol/L-s. This rate law is a function of
temperature. The reaction is exothermic. Some of the heat evolved by the reaction increases its
temperature, and some heat leaves the system into the surroundings.
2.6 Reactor Scale Up To predict the behavior of the reaction in different scales, it was necessary to understand
the equations that describe reaction rate and heat transfer.
2.6.1 Energy Balance
A familiar form of the conservation equation is as follows for our reaction:
Accumulation = In – Out + Generation (4)
Accumulation = – Out + Generation (5)
In the case of the acid-catalyzed polymerization of PFA, the heat of reaction accounts for heat
generation. Normally, the system is at least the same temperature as its surroundings, so there is
no heat transfer from the surroundings into the system. The accumulation term is approximated
by the heat associated with the increase in temperature of the system. Heat moves out of the
system because it is warmer than its surroundings. Heat flux from the system consists of
conduction to the floor/benchtop, convection from the container’s walls and free surface, and the
evaporation of water and PFA from the system.
To describe heat transfer from the system, we used an experimentally determined overall
heat transfer coefficient, U. Heat transfer from the system is as follows in Equation 6.
𝑄𝑙𝑜𝑠𝑠 = 𝑈 𝐴 (𝑇 − 𝑇∞) (6)

19
In Equation 6, Qloss is the heat removed from the system in W; U is the overall heat transfer
coefficient in W/m2-K; A is the surface area available for heat transfer in m2; T is the
temperature of the system in K, and T∞ is the temperature of the surroundings in K.
To describe heat generated by the reaction, the reaction rate, the reaction volume, and the
heat of reaction are multiplied as illustrated in Equation 7.
𝑄𝑔𝑒𝑛 = 𝑟 𝑉 Δ𝐻 (7)
In Equation 7, Qgen is the heat released by the reaction in W; r is the reaction rate in mol/L-s (see
2.5.2); V is the volume of the reaction in L, and is the heat of reaction in J/mol.
The energy accumulated by the system is approximated by its heat capacity as illustrated
in Equation 8.
𝑄𝑎𝑐𝑐𝑢𝑚 = 𝑚 𝑐𝑝 (𝑇 − 𝑇𝑖) (8)
In Equation 8, Qaccum is the heat gained by the system in Joules, m is the mass of furfuryl
alcohol in grams; cp is the heat capacity of the system’s contents (a combination of FA and PFA)
in J/g-K; T is temperature of the system in K, and Ti is the initial temperature of the system in K.
Combining the expressions above, the overall energy balance can be written in the following
differential form, Equation 9:
𝑑𝑇
𝑑𝑡=
𝑉𝛥H 𝑟 − 𝑈𝐴 (𝑇 − 𝑇∞)
𝐶𝑝 𝑚
(9)
2.6.2 Mass Balance
A familiar form of the conservation equation is as follows for our reaction. Equation 10,
shown below, simplifies to Equation 11 as there is no flow of mass into or out of the system for
our batch reaction.
Accumulation = In – Out + Generation (10)
Accumulation = Generation (11)
In the case of the batch acid-catalyzed polymerization of PFA, there is no mass flow into the
system. The mass flow out, due to some evaporation of water and FA, was assumed to be
negligible. The generation term consists of the rate of consumption of FA by the reaction and is
equal to the change in the amount of FA in the system.
To describe the rate of disappearance of FA, the reaction rate and the reaction volume are
multiplied, resulting in Equation 12.
𝑁𝐹𝐴 = −𝑟 𝑉 (12)
Where NFA is the rate of disappearance of FA in mol/s; r is the reaction rate in mol/L-s (see
2.5.2); and V is the volume of the reaction in L.

20
The mass balance on FA can be written in the following differential form, Equation 13.
𝑑𝑛𝐹𝐴
𝑑𝑡= −𝑉𝑟
(13)
2.7 Previous Experimentation In 2019, the chemical incident described above was the subject of investigation by a team
of WPI undergraduate students under the guidance of their advisor, Professor Kmiotek.
Katherine Charla, Christopher Cyr, Sarah McKeage, and Kelly Vodola studied the behavior of
the polymerization of furfuryl alcohol catalyzed by methanesulfonic acid and hydrochloric acid.
The team measured the temperatures and pressures generated by the reaction for the different
acid catalysts and different amounts of acid. Their goal was to better describe the acid catalyzed
polymerization of furfuryl alcohol to improve process safety recommendations for the handling
of furfuryl alcohol in the chemical processing industry.
The team modeled the reaction using the COMSOL modeling software. The simulation
seemed to well-represent the expected mass transfer; high density acid remained sunken at the
bottom of the furfuryl alcohol. The model, however, did not describe heat transfer as well. In the
simulation, furfuryl alcohol far from the acid reached sub-zero Celsius temperatures over the
course of the reaction. The team recognized that this temperature is likely a result of the
temperature of the solution providing the activation energy for the reaction; but the team
understood that these temperatures are unlikely to occur and are not experimentally observed.
In addition to modeling, the team conducted wet experiments. They catalyzed the
reaction in 100mL and 1 L steel vessels capable of maintaining pressure up to 75 psig (before
safely venting). The team observed an induction period, where the reaction very slowly
progressed before thermal runaway occurred. Their experiments show that the reaction is highly
variable. The team observed induction or “incubation periods” ranging from 500 seconds to 2000
seconds for the same amounts of FA and HCl in the same reactor vessel. The team observed a
maximum temperature of 170.5°C and a maximum pressure of greater than 75 psig in these wet
experiments. The 2019 team did a good job of describing the reaction behavior, and suggested,
among other recommendations, that we study the reaction rate to more quantifiably describe
kinetics.

21
3.0 Methodology
3.1 Initial Experimentation Initial experimentation was conducted to become familiar with the reaction, to establish
safety procedures, and to identify aspects of the reaction to explore in future experimentation.
Our first experiments were modeled after some of the tests completed by the previous MQP
group.
To begin, we slowly added MSA in 0.1mL increments to 22mL of FA in a 50mL beaker
until the reaction ran away and FA was rapidly polymerized. We recorded temperature using a
thermometer and took a video of the reaction. We conducted the same experiment with 12 M
HCl in place of MSA. HCl is a more readily available acid than MSA; the previous MQP team
frequently used HCl as a surrogate for MSA. We conducted these experiments to learn the
approximate time before running away for different amounts of acid.
Next, we tested how mixing may affect the reaction. Mixing has the potential to eliminate
inconsistencies within the reaction. We conducted a side-by-side test, comparing mixed and
unmixed reactions of FA and HCl in open beakers. Two 50mL beakers were placed side by side,
each with 22mL of FA. HCl, 12M, was added to each beaker simultaneously. Acid was added in
0.1mL increments.
Our experiments and the work of the previous MQP team show that HCl and MSA,
strong acids, catalyze the reaction at room temperature. Literature reports that any acid can be
used to catalyze the reaction (Zhang et al., 2014). In the interest of safety, we sought to use the
least hazardous reagents in our experiments. We performed an experiment to determine whether
the reaction could be catalyzed by vinegar (i.e., dilute acetic acid) at room temperature. Similar
to the first tests with MSA and HCl, we added 0.1mL increments of PICS 5% acidity white
vinegar to 22mL of FA in an unmixed 50mL beaker.
There is a possibility that a base could cleave hydrogen from the hydroxyl group on FA
and catalyze polymerization (Interview with C. Lambert, 2020). To determine whether a strong
base could catalyze polymerization, we added 12 M NaOH in 0.1mL increments to 22mL FA in
an unmixed 50mL beaker.
3.2 Ice Calorimetry
3.2.1 Determining Heat of Reaction
Ice calorimetry (IC) is an inexpensive and reproducible experiment to determine the heat
of reaction. In IC, the amount of ice melted by a reaction reflects the heat evolved by that
reaction.
In IC, a test tube and graduated pipette are pushed into a rubber stopper, resting in a
beaker filled with ice water. That beaker is then suspended in a larger ice bath. With such a
setup, the internal bottle maintains a temperature of 0°C as the ice and water are in equilibrium.
Heat evolved by an exothermic reaction in the test tube melts ice in the inner beaker. The melting
of ice changes the volume of the ice-water mixture, which causes a change in volume measured
by a graduated pipette pressed into the stopper. Figure 8 shows the general setup for IC.

22
Figure 8. Basic IC Setup.
Total heat released (J) by the reaction can be solved for by using the following
relationship, Equation 14:
𝑄 = 𝛥𝑉 ∗ (𝜌𝑖𝑐𝑒/(1 − 𝜌𝑖𝑐𝑒)) ∗ (𝛥𝐻𝑓𝑢𝑠) (14)
In Equation 14, 𝛥𝑉is the change in volume of the the pipette after ice melts (mL), 𝜌𝑖𝑐𝑒is
the density of ice (g/mL), and Δ𝐻𝑓𝑢𝑠 is the heat of fusion of ice (J/g). Heat of reaction, expressed
in either J/g or J/mol, can then be calculated by dividing the total heat released by either the mass
or the total moles of reactants.
To conduct this experiment, we used a 1500mL beaker as the outermost container. We
chose a glass beaker so we could see inside. Inside of this beaker was a large magnetic stir bar.
This beaker sat on a stir plate and a ring stand. The ring stand was used to suspend the inner
beaker, 100mL Berzelius style. The beaker was kept airtight by a size 11 rubber stopper. Inside
of the beaker was a medium size stir bar. Holes were cut into the rubber beaker for the test tube
(20mL) and the graduated pipette (2mL or 10mL). We initially used a 10mL graduated pipette
but then switched to a 2mL once we realized the size of the volume change. To insert the
glassware into the rubber stopper, we used glycerin as lubricant.
One key component of this experiment is to ensure that there were not air bubbles in the
100mL inner beaker. Air bubbles would affect the change in volume of water as when the escape
it would seem as if more ice melted. To ensure this did not happen, the best way to seal the
beaker was to submerge it completely in ice water. After first ensuring that the stir bar and
sufficient ice was in the beaker, the beaker was inserted into a larger vessel of ice water so that
the top of the beaker was below the water level. The rubber stopper, with the glassware already
inserted in the top, was then pushed onto the beaker creating a seal. A visual inspection after this
process was always completed to ensure that there were not air bubbles in the beaker. If there
were bubbles, the rubber stopper was removed, and this process was completed until it was
successful.
In the test tube, we first inserted 6mL of FA. Once the apparatus was set up, 0.1mL of
HCl was added to catalyze the reaction. Acid addition was intended to be into the center of the
test tube.
During experimentation, we used both larger ice cubes when we could not obtain crushed
ice. We feel as though this variable affected the experimentation and would recommend that any
future group use crushed ice for this experiment.

23
Additionally, to maximize heat transfer into the ice bath and not into the environment, we
used a small stir bar in the 20mL beaker. Based on the distance between the test tube and the stir
plate, we cannot say that the reaction was sufficiently mixed. Additionally, we would insert a
small paper towel into the top of the beaker once the reactants were added. We hoped that the
paper towel would keep heat in the beaker. A word of caution, as the experiment progresses,
pressure builds up and will shoot the paper towel piece out of the beaker.
The starting temperature of the reactants was also taken into consideration. FA was
inserted into the test tube and left in the apparatus until it reached 0oC. HCl was kept on ice until
it was inserted into the test tube. To be absolutely considerate of the starting temperature of the
reactants, we put a micropipette tip in the freezer to ensure that it would not raise the temperature
of the acid before it was inserted. If the starting temperature of the reactants is not 0oC, ice will
melt to bring the temperature to 0oC thus adding error to the heat of reaction.
3.2.2 Determining Heat Capacity
In addition to the heat of reaction of the polymerization of FA, we used IC to determine
the heat capacity of PFA. Except where specified otherwise, the setup and procedure of IC for
heat capacity was the same as the setup for IC for heat of reaction.
The reaction is highly exothermic, so a relatively small volume of FA could cause a
significant amount of ice to melt. Compared to the polymerization, relatively little heat is
released from PFA as it cools. To accommodate this difference and determine the heat capacity
of PFA, a few adjustments were made to the IC setup. These adjustments were made to
maximize the amount of PFA in the inner test tube to release enough heat to measure a
significant volume change of the melting ice.
In place of the 100mL inner beaker, we used a 1000mL Erlenmeyer flask and a large stir
rod. This flask allowed us to press the test tube deeper into the stopper to fit more PFA in contact
with the ice bath. We suspended the Erlenmeyer flask in a large stainless-steel pail.
We crushed samples of approximately five grams PFA using a stone mortar and pestle.
Five grams was the maximum amount of PFA that could fit in the test tube while still sitting
below the rubber stopper. We heated the samples to 100℃ in a drying oven in ceramic crucibles.
Before adding the hot PFA to the test tube in the IC setup, we put approximately 7mL of
chilled salt water in the test tube and allowed it to reach equilibrium (0℃) with the ice baths. The
salt water served to conduct and convect the heat of the PFA to the walls of the test tube.
We added the 100℃ PFA to the test tube and plugged the test tube with a piece of paper
towel to limit heat loss through the top of the test tube. As with IC for the determination of the
heat of reaction, the inner and outer ice baths were stirred by large magnetic stir rods. The test
tube was not stirred as the pieces of PFA would prohibit stirring. We allowed the system to reach
equilibrium.
In order to calculate the heat capacity, the specific heat formula shown in Equation 15
was used:
𝑄 = 𝑚 𝐶𝑝 𝛥𝑇 (15)
In Equation 15, Q is heat (J), m is the mass of the substance (g), Cp is the specific heat
capacity [J/(go*C)], and the 𝛥𝑇is the change in temperature (oC). Q was calculated using
Equation 12 in Section 3.2.1.

24
3.3 Transfer Limiting Experimentation Based on the inconsistencies observed in ice calorimetry, a series of different tests were
conducted in order to better understand our curiosities of the mass and heat transfer within the
reaction. Experiments were conducted that investigated mixing, acid addition technique, and the
surface area to volume ratio of the vessel.
Our goal for conducting various mixing experiments was to see if we could manipulate
mixing speed in order to more accurately predict the reaction time. When conducting
experiments that investigated mixing, we used three different speeds of mixing that were
controlled qualitatively between experiments. The three different speeds were a fast mixing, a
slow mixing, and no mixing. Two separate mixing plates were used, one solely for fast mixing
and one solely for slow mixing. These plates were set at the same rate of mixing every time so
that the slow and fast rates are consistent across all tests.
In these mixing experiments, the amount of reactants added were controlled. Every
experiment used 6mL of FA and 0.1mL of 12M HCl in a 20mL beaker. FA was added using a
graduated pipette and HCl was added using a micropipette to ensure accuracy. Acid was dropped
in the center of the beaker. All tests were conducted at room temperature at least three times. The
no mix reaction was often quicker, so it was completed more. After the experiment, the beakers
were cleaned out using acetone and then reused.
After the reaction, there were visible differences between the PFA that was produced in
the slow mix and fast mix reaction. Because of this, a density test was conducted on both the
slow and fast mix PFA. Density was determined by first taking its mass using a scale. Volume
was found using water displacement since the volume of water is estimated to be 1g/mL. A
100mL beaker was filled to the rim when the PFA was inserted. A tray was around the beaker to
collect the displaced water. The water was then weighed so that we could find the volume of
PFA. Due to the surface tension of water and other areas of inaccuracies in this experiment, it
was completed 10 times each. The same piece of PFA was used for each replicate of the test.
The method of acid addition was also investigated. Previously, acid was added into the
center of the beaker. Still using a 20mL beaker with 6mL of FA and 0.1mL of 12M HCl,
experiments were conducted by adding the acid down the side of the beaker. Acid was dropped
from the micropipette onto the glass right above the FA liquid line. This test was completed for
all three rates of mixing: fast, slow, and no mix.
All reactions were observed for a minimum 60 minutes unless they noticeably reacted
quicker. A noticeable reaction would be due to thermal runaway. If thermal runaway did not
occur, the viscosity of the PFA was measured using the level of mixing in the beaker. Once the
acid was added, the liquid level was measured. As time progressed, the liquid level would
continuously be measured until the 60-minute mark. This was conducted on most tests that did
not react within the 60-minute time frame.
Lastly, tests were done in the 20mL, 50mL, 100mL, and 250mL beakers to investigate
the volume to area ratio. Using the equations for area and volume of a cylinder, area directly
relates to the radius of the beaker to the second power while volume directly relates to the radius
to the third power. As beaker size increases, radius increases, thus the volume to surface area
ratio increases. In each beaker, 6mL of FA and 0.1mL of 12M HCl was added. No mixing
occurred and acid was added in the center of the beaker. Because of the explosiveness of these
reactions, only one test in the 50mL, 100mL, and 250mL beaker were conducted. The 20mL
tests were conducted earlier in duplicate when investigating mixing rates.

25
3.4 Overall Heat Transfer Coefficient For a cooling vessel with no reaction, the rate of heat removal to the surroundings is
equal to the change in energy due to the material’s temperature (i.e., thermal heat capacity).
Equation 16, taken from a WPI Unit Operations Lab experiment, relates the change in
temperature to the overall heat transfer coefficient (DiBiasio, Clark, n.d.):
(𝑇∞ − 𝑇𝑜)
(𝑇∞ − 𝑇)= exp (
𝑈𝐴(𝑡 − 𝑡0)
𝐶𝑝 𝑚)
(16)
In Equation 16, T0 is the initial (high) temperature in K; T∞ is the temperature of the
surrounding air in K; and T is temperature in K. Cp is the heat capacity in J/(g-K); m is mass in
g; A is area available for heat transfer in m2; and t and t0 are time and initial time, respectively, in
seconds. Equation 16 can be rearranged, giving Equation 17 below:
ln ((𝑇∞−𝑇𝑜)
(𝑇∞−𝑇)) = (
𝑈𝐴
𝐶𝑝 𝑚) (𝑡 − 𝑡0) (17)
y = (slope) x
A plot of ln (𝑇∞− 𝑇0
𝑇∞− 𝑇) versus t is linear when plotted against (t – t0) (DiBiasio, Clark,
n.d.). The slope of that line is given by (𝑈𝐴
𝐶𝑝 𝑚); so to divide slope by (
𝐴
𝐶𝑝 𝑚) gives U, the overall
heat transfer coefficient.
To complete the energy balance in our system, we determined the overall heat transfer
coefficient of FA. The overall heat transfer coefficient is the ability of a substance to transfer
heat. In our experiment, the reaction is nearly all FA, so we assume that any acid or water is
negligible.
Experimentally, determining the overall heat transfer coefficient is fairly simplistic. The
only data needed is the change in temperature versus time. We did not want to exceed the boiling
point, or the freezing point but that is less feasible, of FA during our test. To record temperature
data, we used a homemade thermocouple out of an Arduino board. If our thermocouple was not
working that day, we used a thermometer and a stopwatch to record times at a regular interval.
We completed heat transfer coefficient testing for a 20mL, 50mL, 100mL and 250mL
glass beaker to see how the coefficient changed with vessel size. We also tested a 250mL HDPE
(high density polyethylene) bottle as HDPE is a common material used to make drums that are
used in the chemical industry. Each test in the glass beakers were heated until the FA reached
about 110oC on a hot plate. We then moved the beaker to a stir plate at room temperature. We
measured the temperature of the FA for anywhere over 15 minutes so that the temperature would
drop below 60oC, an arbitrary value that we picked. We heated and cooled the same FA each
time and added more when we scaled up to a larger beaker. In the HDPE bottle, we did not want
to melt the plastic, so we heated the FA to about 70oC and then let it cool to below 50oC. Each
test included the same speed of mixing; the stir plate was set at one speed that remained
consistent across all tests. Qualitatively, the speed was similar to the slow speed in the transfer
limiting experiments (Section 3.3). Comparatively, the 20mL beaker had the fastest stir and the
250mL beaker/bottle had the slowest.

26
We completed each vessel’s experiment in triplicate. In the 20mL beaker, we used 15mL
of FA. In the 50mL beaker, we used 40mL of FA. In the 100mL beaker, we used 80mL of FA. In
the 250mL beaker and HDPE bottle, we used 200mL of FA.
The same methodology can be used to determine the overall heat transfer coefficient of
PFA. To conduct this, once the reaction ran away, we measured the rate of cooling of the PFA.
At this point in the reaction, it is assumed that all the FA has converted to PFA. The rate of
cooling is then just for PFA which can then be used to calculate the overall heat transfer
coefficient of PFA.
3.5 Mathcad Model to Predict Thermal Runaway
3.5.1 Overview of the Model
We built a Mathcad document to predict the behavior of a furfuryl alcohol and strong
acid mixture over time. Rather than attempting to arrive at a single equation to predict behavior,
we used Mathcad to simultaneously solve the differential mass and energy balances of the
system. The mass and energy balance equations have a reaction term. Little information is
available on the kinetics of the acid-catalyzed polymerization of FA, so we used the rate law for
FA’s acid-catalyzed polymerization in aqueous solution as the starting point for our reaction
term (Sun et al., 2017).
We wanted to make the model as versatile as possible, so that a user could input different
volumes of FA, volumes and concentrations of strong acid, container dimensions, container
material, and starting temperature. To accomplish this end, the main calculation (i.e., the solving
of the differential equations over a time period) is preceded by some algebra that puts the
variables in a form that can be input into the differential equation. Consider, for instance, the
volume of FA and the dimensions of the container. Heat transfer to the environment occurs over
the area that the FA is in contact with the vessel’s walls, not over the entire area of the vessel.
One equation uses the FA volume, container diameter, and container height to find this area.
The Mathcad document with some sample inputs can be found in Appendix A.
3.5.2 Simplifying Assumptions
We made some simplifying assumptions in our model. We assumed that the reaction rate
was zero-order with respect to FA. Sun et al. (2017) determined a rate law that was first-order in
FA, but the reaction they studied involved low concentrations of FA in aqueous solution. We
decided on a zero-order rate in FA because FA is the bulk of our system. Rate dependence on FA
may be fairly described as pseudo-zero-order where FA concentration is very high so that only
hydrogen ion concentration limits rate.
We also assumed that the system was well-mixed. As previously described, we carried
out some unmixed reactions; but the behavior of these reactions was very inconsistent. A well-
mixed system allowed us to consider average species concentration rather than local species
concentration, eliminating any mass transfer limitations to the reaction. A well-mixed system
also eliminated the need to consider internal heat transfer. The well-mixed system could be
described as an average temperature.
We assumed that heat transfer occurred over the walls of the container and its top surface
by conduction through the walls and convection from the walls. We did not consider evaporation
in our model. Furfuryl alcohol and water (a product of the reaction) have the potential to
evaporate. The evaporation of these species would, of course, reduce the mass of the system.

27
Their evaporation would also remove energy from the system (i.e., evaporative cooling). For
temperatures less than the boiling point of water, very little material evaporates; so the model
will hold up well. We were most interested in studying the reaction up to the point of thermal
runaway (approximately 70°C), so it was reasonable to not consider evaporation.
Lastly, we considered an average heat capacity of furfuryl alcohol. In reality, heat
capacity changes with temperature; and the specific heat capacity of PFA is about half that of
FA. As described in the previous paragraph, however, we can study the reaction fairly accurately
up until thermal runaway. Before thermal runaway, the mixture is mostly FA; and changes in
temperature are not extreme.
3.5.3 Experiments to Inform the Model
We fit our Mathcad model to experimental data to better predict reaction behavior. We
conducted 27 trials of FA and HCl reactions in different amounts of each and in different
containers. We chose highly varied conditions in the hope of producing a robust and versatile
model. We varied FA volume from 10mL to 50mL. For each volume of FA its container, we
experimented with three different amounts of acid in an attempt to create three very different
reactions: a reaction that ran away, a reaction that did not run away, and a third reaction between
the two. We chose those amounts of acid based on some initial experiments and an early iteration
of the model.
We also experimented with “recycled” and fresh FA. Recycled FA was the FA heated
and cooled during heat transfer coefficient experiments. We were initially concerned that the
recycled FA would contain a greater amount of oligomers and less furfuryl alcohol monomer due
to auto polymerization that occurs at high temperatures. Ultimately, we determined that there
was no difference between reactions of fresh and recycled FA, so the two were treated without
distinction in the analysis of experimental results and the construction of the model.
Appendix B contains a table with all experiment conditions. In each trial, we allowed the
reaction to progress until runaway or as long as feasible if runaway did not occur during the
period of observation. We recorded temperature over the course of the reaction using a
thermocouple and Arduino logger.
We fit the model to experimental data using a pre-exponential factor in the rate law. This
preexponential “fudge” factor essentially adjusted the rate law frequency factor, A. To determine
the pre-exponential factor for a set of conditions (e.g., FA volume, vessel size), we entered those
conditions into the Mathcad document. Then we iterated the calculation with different values for
the preexponential factor until the times to runaway (defined as the time to achieve 80°C)
matched for the model and experimental data. We iterated to determine the pre-exponential
factors (on the order of 10) to hundredths decimal point accuracy. If runaway did not occur, we
iterated to match the last recorded temperature.
3.6 Final Experimentation to Validate Mathcad Model As stated in the Introduction, all experimentation and data collection ceased on March 6,
2020 by WPI and governmental mandates due to the rapid spread of pandemic caused by the
COVID-19 virus. Therefore, our team was unable to carry out all the experiments that we had
planned on. We planned on conducting experiments to validate our Mathcad model. We would
first generate a predicted temperature profile of a novel combination of (1) HCl amount and
concentration, (2) FA amount, (3) container size and material, (4) initial temperature. Then we

28
would react FA according to those four parameters and collect temperature data. Lastly, we
would compare our prediction to experimental data to gauge the accuracy of our model.
3.7 Analysis of Industrial Accident We explored conditions akin to those of the industrial accident using our Mathcad model
to gauge the model’s accuracy and to attempt to work out details about the accident. With
Mathcad, we modeled the reaction of FA in a half-full 55-gallon HDPE drum over a 24-hour
period. We input 1 to 10mL of strong acid, the average and the high pre-exponential factors, and
initial temperatures between 20 and 25°C.

29
4.0 Results and Discussion
4.1 Initial Experimentation of Open Beaker Reactions We reacted MSA and FA in an unmixed beaker, as shown in Figure 9.
Figure 9. Initial open beaker experimental setup, 50mL beaker, 22mL of FA, 0.7mL of MSA.
The two goals of this experiment were to learn about the temperature profile of a
runaway reaction, which contained 22mL of FA, and to approximate the amount of acid required
to initiate the runaway reaction (by incrementally adding acid) for the given volume of FA. We
plotted the temperature profile of the reaction, as shown in Figure 10. After the acid was added
at the start of the reaction, the temperature climbed by 1℃ approximately every sixty seconds
from 0 - 1000 seconds. The reaction did not show signs of runaway until 2,500 seconds and
reached a maximum temperature of 120.5℃. The reaction tended to increase by 1℃ every ten
seconds between 2500-3200 seconds. After the maximum temperature was reached, the reaction
began to cool. The reaction tended to decrease by 1℃ every twenty seconds between 3200-3400
seconds.

30
Figure 10. Temperature profile for the following conditions: 50mL beaker, 22mL of FA, 0.7mL
of MSA.
Figure 11 is from the same FA and MSA reaction, but only shows the reaction runaway.
Prior to reaction runaway, we observed that the reaction produces a vapor, some of which
condenses on the walls of the beaker. The condensation (almost certainly water, a reaction
product) became an indicator in future experimentation that the reaction was going to go to
completion. For this individual experiment, 22mL of FA was catalyzed by 0.7mL of MSA and
ran away in approximately 45 minutes. It is important to note that MSA was added in 0.1mL
increments every five minutes. We added acid in 0.1mL increments in order to catalyze the
reaction without overshooting the amount of acid necessary to cause thermal runaway.
Figure 11. Profile of the exotherm for the following conditions: 50mL beaker, 22mL of
FA, 0.7mL of MSA.
The second experiment used HCl as the catalyst. We set up the experiment in the same
way for HCl as we did for MSA, as demonstrated in Figure 9. We observed similar
characteristics in the two reactions. Both experiments had condensation on the side of the
glassware prior to runaway. With both, the reaction increased in temperature over the course of
several minutes, followed by an inflection and rapid increase in temperature to a maximum value
of approximately 120℃. As the reactions cooled from their maximum temperatures, both

31
polymers changed from a highly viscous resin to a brittle solid. One difference was the total
volume of acid used. We used 0.5mL of HCl in experiment two, compared to 0.7mL of MSA in
experiment one. It is important to note that acid was once again added in increments, but this
experiment was not appropriately timed. Acid was added to the reaction at different intervals.
Increasing or decreasing the rate at which these increments are added will impact the rate at
which the reaction runs away. The HCl and FA reaction went to completion in 30 minutes, which
was shorter than the MSA and FA reaction.
Based on inconsistencies in the time to runaway of previous reactions, we experimented
with mixed and unmixed conditions side by side. Figure 12 shows the experimental setup and the
unmixed beaker after it received its first 0.1mL increment of acid.
Figure 12. Mixed and unmixed reaction experimental setup.
We saw a noticeable color difference in the FA after the acid was added. The FA started
as a light amber, and it became a dark amber as it began to polymerize. The unmixed beaker
experienced a runaway at around four minutes, shown in Figure 13.

32
Figure 13. Mixed and unmixed runaway comparison, unmixed runaway (left).
This reaction was very similar to the previously described experiments. The reaction once
again produced a vapor, which condensed on the walls of the beaker. The PFA was very porous
after it solidified in the beaker. The mixed vessel experienced runaway at five minutes. When
this sample erupted during runaway, the viscous PFA spilled over the walls of the beaker and
onto the stir plate, shown in Figure 14. The sample hardened as it cooled.
Figure 14. Mixed and unmixed reaction comparison test, PFA spill-over in mixed beaker (right).
From this experiment, we learned that the reaction of MSA in FA can still be carried out
under mixed conditions. Only one trial was conducted at this point in time. This experiment also
demonstrated that the time to runaway was slower in the mixed beaker. From this single test, we
speculated that the mixed reaction ran away slower because the act of stirring the solution had an
effect on the mass or heat transfer of the reaction This test led to future experimentation on the
rate of reaction for both mixed and unmixed solutions.

33
Any acid can carry out the polymerization of FA (Zhang et al., 2014). Our fourth
experiment used a weak acid (acetic acid) in place of a strong acid (HCl or MSA). This
experiment was conducted to avoid the use of more dangerous and corrosive reagents. We
wanted to determine if a weaker and more dilute acid could still carry out the reaction. The HCl
that we used in our other experiments was highly concentrated, 12 M. The concentration of our
acetic acid was extremely low; we used a store-bought bottle of vinegar, which markets as 5%
acetic acid per volume.
The acetic acid was added in 0.2mL increments to the FA. After several milliliters of
acetic acid were added, we waited approximately 30 minutes and no noticeable reaction
occurred. We concluded that the acetic acid we used was too dilute to carry out the reaction. If
this test were to be replicated, it is recommended that a higher concentration of acetic acid
should be utilized to carry out the reaction.
We attempted to initiate the runaway reaction with a strong base instead of an acid. We
speculated that the base might be able to cleave a hydrogen from the hydroxyl group to promote
polymerization. The addition of 0.1mL increments of 12 M NaOH into 22mL of FA did not
result in runaway. The solution became slightly darker indicating that some polymerization did
occur. Additionally, the beaker did not display any of the indicators of runaway, as demonstrated
in reactions with acid catalysts.
4.2 Ice Calorimetry
4.2.1 Determining Heat of Reaction
Figure 15 shows the setup for the determination of heat of reaction.
Figure 15. Heat of reaction setup.
We conducted several trials for the determination of heat of reaction. All experimental
results are shown in Table 2. Example calculations to determine the experimental heat of
reaction are found in Appendix C.

34
Table 2. Heat of reaction experimental results.
Trial 𝛥𝑉 (change in pipette volume)
[mL]
Heat of Reaction
(unadjusted)
[J/g]
Heat of Reaction
(adjusted)
[J/g]
1 0.83 -540 -772
2 0.56 -365 -521
3 0.292 -190 -272
4 0.84 -547 -781
5 0.57 -371 -530
6 1.45 -944 -1111
7 0.962 -626 -895
8 0.805 -524 -749
9 0.735 -479 -684
Trial 8 is an example of a successful experiment in which all of the FA is polymerized by
a single charge of acid catalyst. Figure 16 gives the profile of the graduated pipette volume
versus time for Trial 8.
Figure 16. Heat of reaction Trial 8, volume vs. time graph, 0.365mL of HCl and 5mL of FA.
Three regions are shown on the graph above. Between 0 and 500 seconds, the volume
slightly increased. It is important to note that as the actual volume in our apparatus decreases, the
measured volume on our pipette increases due to inverted scale. This gradual and consistent
volume change is because ice melted due to heat from the surroundings. This heat was

35
conduction through the rubber stopper and through the test tube. These environmental effects
were difficult to negate with our inexpensive setup.
After the pipette volume maintained a constant upward slope, we began the experiment.
The addition of acid initiated the reaction and the temperature began to increase. Between
approximately 700 and 1000 seconds, we observed the volume readings quickly increased. This
is because the heat generated by the reaction melted more ice. We allowed the test tube contents
to cool to 0℃ after the reaction took place. This reestablished the gradual increase in volume.
The unadjusted heat of reaction values from Table 3 did not account for any heat loss to the
surroundings.
We chose a value of 30% for our estimated heat loss factor. Heat loss is due to
conduction through the stopper, conduction through walls of test tube upward, convection from
uncovered surface of reaction, and evaporation. All trials and adjusted heats of reaction were
assessed individually, to determine if the value was a good representation of the mean.
Trial 3 was an outlier because not all of the FA reacted. Its calculated heat of reaction
was an underestimate. Trials 5 and 6 were also underestimates, but for a different reason from
Trial 3. The capacity of our pipette limited the apparatus’ volume in Trial 5 and 6. The water
level in the pipette fell below the stopper. We recorded the lowest visible graduation, but it
cannot be determined if this was the final volume because the reaction was still occurring. Trials
3, 5, and 6 were omitted from the average calculations.
The average heat of reaction (after corrected for heat loss) of FA was -734 ± 125 J/g. The
limitations of the apparatus, as noted by the estimated heat loss factor, all contributed to heat loss
that could not be accounted for in the heat of reaction equation. Post-accident, the incident
investigation team estimated the heat of reaction for the polycondensation of furfuryl alcohol as -
860 J/g (Kmiotek, personal communication on February 18, 2020). For comparison, the heat of
polymerization of vinyl chloride is -964 J/g (D.E, Robert, Heats of Polymerization, n.d.). The
similarity to FA's heat of polymerization to vinyl chloride leads us to believe that our
experimental value is reasonable.
4.2.2 Determining Heat Capacity of Polyfurfuryl Alcohol
We also used IC to determine the heat capacity of PFA. Figure 17 shows the
experimental setup.
Figure 17. IC apparatus setup for determining heat capacity.

36
Data from all trials are shown Table 3. A sample calculation to determine the
experimental heat capacity of FA is found in Appendix D.
Table 3. Experimental Heat Capacities
Trial 𝛥𝑉 [mL]
PFA Mass
[g]
Q
[J]
Heat Capacity,
(Unadjusted)
[J/(g-℃)]
Heat Capacity,
(Adjusted)
[J/(g-℃)]
1 0.0725 4.2173 267 0.632 0.703
2 0.0413 3.9538 152 0.384 0.427
3 0.1699 4.2075 625 1.486 1.651
4 0.1274 2.7896 469 1.680 1.867
5 0.7597 4.1053 624 1.521 1.690
6 0.0656 3.619 241 0.667 0.741
An example volume versus time graph is shown below as an example. Figure 18 shows
the results of Trial 6.
Figure 18. Heat capacity Trial 6, volume vs. time graph.
The volume was measured as the sample cooled down from 100℃ to 0℃. Just like IC for
heat of reaction, the heat from the PFA sample was transferred to the ice bath which melted ice.
The heat exchanged is much less than the heat of reaction, so the slope is lesser. Between 0-500
seconds, the volume reading slightly increased as ice was melted from the heat of the
surroundings.
The PFA sample was added when the volume interval read 0.075mL. After heated PFA
was added and cooled, ice melted at a higher rate reflected in the greater slope between 500-600

37
seconds. Between 600-1800 seconds, the volume within the pipette began to return to the lesser
slope similar to the start of the experiment. For Trial 6, the final pipette volume was 0.4mL.
The three regions are difficult to see, in comparison to heat of reaction, due to the low
amount of heat exchanged in the experiment. We created Figure 19 to act as a model for the
experiment, with exaggerated slopes to better explain the phenomenon seen during
experimentation.
Figure 19. Theoretical heat capacity with exaggerated slopes.
Figure 19 is broken up into three sections, each with a corresponding color. The red
section is the initial increase in volume found at the start of the experiment. This section has a
very gentle slope because ideally, only a small quantity of ice has melted due to the heat from the
surroundings. If the volume began to sharply decrease during this window of time, there was
likely something wrong with the apparatus. Two common errors are a trapped air bubble within
the inner vessel or that there was not enough ice in the outer vessel. If there is not a sharp
increase in the volume, the experiment can be continued.
The blue section represents the addition of the heated PFA sample to the vessel. The
addition of the sample caused ice to melt at a faster rate. This portion of the graph is exaggerated
to better illustrate the change in slope. When conducted experimentally, this portion of the
experiment lasted a few minutes because the sample was heated to 100℃. The green section is
when the PFA has cooled to equilibrium with the ice (0℃), and the volume increase returns to its
original rate.
We used the linear fits of the initial (red) and final (green) regions to determine the
change in volume caused by the addition of the heated sample. Post experimentation, trend lines
were fitted on to the graph to determine how much ice melted due to heat from the PFA. We
plotted lines for the initial and final regions and subtracted their y-intercepts. This gives us the
change in water volume (𝛥𝑉) in the pipette.
As for the heat of reaction experiments, we accounted for heat loss in our setup. We
approximated 10% heat loss. Heat loss is due to conduction through the stopper, conduction
through walls of test tube upward, convection from uncovered surface of the test tube, and any
heat loss while the sample was transferred from the oven to the test tube.

38
Trial 2 was considered an outlier because of its low heat capacity. There was not enough
salt water to cover the entirety of the PFA sample, which allowed for heat to escape out of the
test tube and into the surroundings. Trial 2 was omitted from the average. It is important to note
that heat capacity is typically a function of temperature, and our calculated value uses a known
change in temperature of 100℃.
The average heat capacity (after adjusting for heat loss) was 1.33 ± 0.56J/(g-℃). We
compared this value against other common plastics to see if our experimentally determined value
was in the right order of magnitude. For comparison, PVC has a heat capacity of 0.88 J/(g-℃) at
0℃, and polyethylene has a heat capacity of 1.55 J/(g-℃) at 0℃ (Engineering ToolBox, 2013).
The similarity of PFA's heat capacity to those of other polymers (approximately 1 J/(g-℃)) lead
us to believe that our approximation is reasonable. The heat capacity of PFA is about half that of
FA, a difference which informs an understanding about the rate of heat transfer in the reaction.
4.3 Mass and Heat Transfer Limiting Experimentation In the first set of experiments, we varied the rate of stirring. We had three different
speeds: fast, slow and no stir. Our setup is shown in Figure 20. The leftmost beaker was used for
no stir and did not contain a stir bar. The middle beaker was the fast stir. The rightmost was the
slow stir. Cardboard was used to contain any violent reaction and minimize the mess that was
left in the lab hood.
Figure 20. Experimental set up for changing the stir rate.
Reaction times from varying the stir rate are found in Table 4. The no stir reaction was
unpredictable. In some cases, the reaction was instantaneous, in others the reaction did not run
away for the hour that we conducted the experiment. The slow mix was the most predictable
experiment. Every test that we conducted reacted to completion between 7 and 19 minutes. A 12-

39
minutes time prediction is far safer if we could estimate this in an industrial setting rather than
having it be unpredictable. We speculate that when acid is added, it immediately catalyzes
polymerization which is an exothermic reaction. When this occurs in the unmixed reaction, the
heat can then speed up an adjacent reaction (increasing the temperature of a reaction will
increase its reaction rate) or transfer into the environment. Heat transfers in the no mix reaction
is unpredictable. In the slow mix, heat is transferred more consistently so the reaction is more
consistent.
Table 4. Time elapsed before thermal runaway based on different stirring rates when acid is
added in the center of the beaker
No Stir Slow Fast
No Runaway 18min, 30sec 12min, 30sec
8min, 15sec 12min, 36sec 13min, 31sec
Immediate Reaction 7min, 45sec No Runaway
15min, 20sec 12min, 0 sec No Runaway
Additionally, we must consider mass transfer in the reaction. Based on our results, we
cannot hypothesize if the reaction is mass or heat transfer limited. Similarly to heat transfer, the
way the acid transfers through the reaction will affect the temperature, based on the rate of
reaction, which will affect the overall reaction rate. If the acid forms a pocket, it may not cause a
reaction as shown in the first trial of the no stir. If the acid diffuses quickly based on the speed of
it entering or the randomness of the reaction, it could react immediately as shown in the third
trial of no mix. Mixing eliminates this randomness.
The fast stir reacted in a way that we did not know was possible. Prior to this experiment,
we knew that some FA would polymerize when it came in contact with air. This is evident is the
darker color of FA. But there was still enough FA present to react violently with acid thus
causing thermal runaway. With a fast mix, the reaction often occurred at a controlled rate. The
reaction did not run away, but after several hours, a hardened product is visible. To qualitatively
measure this, we measured the height of the experiment in the beaker over time. As more
reaction occurs, the mixture becomes more viscous because of the PFA, the height lowers. We
found this result consistent in the two experiments where we measured height.
The method of acid addition may affect the reaction time if the reaction is not stirred. If
the reaction is stirred, the mixing would prevent any inconsistencies with the mass or heat
transfer. We conducted this test three times without mixing as shown in Table 5. In our limited
sample size, none of the trials reacted immediately if acid was added down the side of the
beaker. If it reacted, the time of the reaction is similar to when acid is added in the center of the
beaker, about 12-15 minutes. Adding the acid down the side of the beaker limits how much acid
and heat can transfer which can affect reaction rate. To make a more decisive claim, we could
have conducted more tests adding the acid down the side of the beaker to see if it ever reacted
immediately.

40
Table 5. Time elapsed before thermal runaway based on different stirring rates when acid is
added down the side of the beaker.
No Stir Slow Fast
No Runaway 10min, 40sec No Runaway*
15min, 30sec N/A 13min, 0 sec
12min, 0sec N/A No Runaway*
*Represents that we kept track of height of reaction as time progressed
When the reaction took place in fast mixing and reacted without running away, the PFA
was noticeably denser. There were no pockets for the vapor to escape during thermal runaway.
The results of our quantitative density tests are shown in Table 6. Ten tests for each were
completed because of the potential for error when filling the beakers prior to finding the water
displacement of the PFA. Nevertheless, the experimental results matched what we predicted. The
slow reaction created a PFA that was denser than the PFA that is created through the thermal
runaway reaction. The slow reaction is closer to the density of industrial PFA that is estimated to
have a density of 1.3-1.5 g/mL (Wang, Zheng, Zheng, 2011).

41
Table 6. Density testing of PFA where the slow reaction occurred in the fast mix and the fast
reaction occurred during the slowly mixed sample.
Trial Slow Reaction (solid piece)
Density (g/mL)
Fast Reaction (vapor pockets)
Density (g/mL)
1 1.26 1.065
2 0.903 1.313
3 1.35 0.7732
4 1.69 0.9562
5 0.910 0.78
6 1.15 0.81
7 1.23 0.74
8 1.48 1.041
9 1.38 0.978
10 1.13 0.852
During scale up on the industrial scale, it is dangerous because the rate of heat transferred
into the environment is not linear with the amount of heat generated by the reaction. As vessel
size increases, less heat is transferred into the environment thus cooling the product. This is why
heat exchangers or other cooling options are necessary. This result was found when scaling up
the reaction as shown in Table 7. While both the 50mL and 100mL beaker reactions had the
same amount of reactants, they were qualitatively more violent than the 20mL size. Even though
they reacted immediately, the amount of cracking and the intensity of the vapor bubbles
increased as size increased. The 250mL did not run away because the volume of reaction was not
enough. The 250mL beaker was too large in diameter for the FA to have a thin layer covering the
bottom. Because of this, the acid formed a pocket in the beaker and was not able to mix with
most of the FA in the beaker. We would expect that if it were not limited by this, the 250mL
beaker reaction would have been the most violent.
Table 7. Time Elapsed before thermal runaway while varying glass beaker size. Stirring did not
occur and acid was added in the center of the beaker.
50mL 100mL 250mL
Immediate Reaction Immediate Reaction No Runaway

42
Investigating heat and mass transfer confirmed the inconsistencies of the reaction that we
found earlier. However, it told us that the mixing of the solution matters. If we mix rapidly, we
can slow down the reaction to a rate that will not run away. This was completed in the 20mL
beaker so there should be testing at larger sizes to see if this is feasible to do on the larger scale.
Additionally, a slow mixed reaction would be the most predictable. When building a model to
predict thermal runaway, it will be best to focus on a slowly mixed reaction as it will be the most
accurate to predict.
4.4 Overall Heat Transfer Coefficient for Glassware and Plastic Containers From our experiments conducted in triplicate, the overall heat transfer coefficient (U) of
FA in varying vessel sizes and materials of construction can be found in Table 8. Data recorded
utilized to calculate the overall heat transfer coefficient is found in Appendix E. A sample
calculation is in Appendix F.
Table 8. Overall heat transfer coefficient of FA in glass beakers and a HDPE bottle.
20mL
beaker
50mL
beaker
100mL
beaker
250mL
beaker
250mL HDPE
bottle
Average U [W/(m2*K)]
of FA 17.3 14.9 14.6 14.7 15.5
Standard Deviation
[W/(m2*K)] 0.9 0.2 1.1 0.4 1.0
Our results were precise as they were all around 15 W/(m2-K). This value is in the right
order of magnitude as a liquid to gas overall heat transfer coefficient is estimated to be between
15-70 W/(m2-K) (Engineers Edge, n.d.). Our system is liquid to gas because the heat is
transferring from FA (the liquid) to the air (the gas). Being on the lower end of this range
suggests that FA is not as good as transferring heat as other liquids.
A trend that is apparent in our results is that as the size of the glass beaker increases, the
overall heat transfer coefficient decreases. In the beaker, heat is mostly lost through convective
heat transfer through the glass or to the atmosphere. Additionally, since the mixing speed stayed
the same, the internal velocity of the liquid will be less for the larger beakers. With a lower
velocity, there will be less heat transfer which will result in a lower overall heat transfer
coefficient.
The plastic bottle had a larger overall heat transfer coefficient than the glass beaker. This
indicates that plastic is a better conductor than plastic. However, the plastic in our experiment
was thinner than the glass, resulting in less resistance in plastic despite the higher per-meter
conductivity of glass. In addition, the plastic bottle’s mouth was less than an inch while the glass
beaker’s mouth was over two and one-half inches. Heat will more easily transfer to the air than
through the sides of the vessel. With a bigger mouth we would expect more heat transfer, which
is not what we found. Potentially, this difference could be due to the fact that we could not heat
the FA up as hot in the plastic bottle so that we would not melt the container.
It is important to note that the thickness of our plastic bottle is not the same thickness of a
drum used in industry. Our bottle is used in labs to hold water or acetone. Drums used in industry
are thicker. If we wanted to be more accurate, we could complete more tests with different
thickness HDPE plastic bottles and see how thickness correlates with the overall heat transfer

43
coefficient. We predict that as thickness increases, the overall heat transfer coefficient will
decrease.
4.5 Mathcad Model to Predict Thermal Runaway
4.5.1 Fit to Experimental Data
We determined pre-exponential coefficients between 8.8 and 20.1 when fitting our model
to experimental data. We determined a coefficient for each unique set of HCl amount, FA
amount, and container size. There was no clear relationship between the value of the coefficient
and of HCl amount, FA amount, and container size. Because there was no clear relationship
between the coefficient and these conditions, it was useful to also consider the average
coefficient value in our simulations. The average coefficient was 13.9±3.5. Since this coefficient
is greater than 1 indicates that the frequency factor for the rate law of the polymerization of FA
in bulk is greater than the frequency factor for the rate law of the aqueous polymerization of FA.
Therefore, there are more frequent reaction-favoring collisions of FA in bulk than when FA is
dilute in water, as expected. Appendix G contains a table of experiments, their coefficients, and
their approximated frequency factors.
The fit of our model was remarkably close to the experimental data for the experiments
that informed the fit up until thermal runaway. Figure 21 shows the fit of a modeled reaction
(20mL beaker, 10mL recycled FA, 0.2mL of HCl).
Figure 21. Experimental and calculated fit temperature profile for the following conditions:
20mL beaker, 10mL recycled FA, 0.2mL of HCl.
It should be noted that the graph above is a fit of our model to experimental data; it is not
a prediction. The model’s accuracy breaks down after the temperature reaches 100°C, as is
expected given its assumptions (see section 3.5.2). After 100°C, the calculated temperature

44
sharply increases to approximately 300°C. The model does not demonstrate the “double peak”
observed in experimental temperature profiles. In experiments, temperature did not reach a
single maximum before cooling but, instead, achieved a maximum; slightly decreased; and
increased again to a local maximum temperature as shown above in Figure 21. The reason for
this double peak is unclear.
In reality, evaporative cooling is significant at 100°C and above. The evaporation of
water and FA from the beaker remove heat from the system that the model does not account for.
Additionally, the model includes zero-order dependence on FA. At high FA conversion,
dependence on FA is not zero-order. Nor is the system well-mixed at high FA conversion. At
high conversion, the polymer is viscous; and there are almost certainly differences in temperature
and concentration at different points in the system.
4.5.2 Capabilities
The model requires the following inputs from the user: initial temperature, FA volume,
HCl volume, HCl concentration. The model also requires information on the container. The user
inputs the diameter and height of a cylindrical container, and the user inputs the overall heat
transfer coefficient on the container.
We measured the dimensions of and determined the overall heat transfer coefficients of a
20 L beaker, a 50mL beaker, a 100mL beaker, a 250mL beaker, and a 250mL HDPE bottle (see
section 4.4). This data on the containers are built into the model. To type “U20” indicates to use
the heat transfer coefficient of the 20mL beaker, for instance. The user could also enter the
dimensions and/or heat transfer coefficient numerically to model a situation with a different
container size or material.
Within the Mathcad document, variables are described, and instructions are included in
plaintext (in blue). Arrows (in blue) indicated necessary inputs.
4.6 Final Experimentation to Validate Mathcad Model As noted in 3.6 and the Introduction, all experimentation and data collection ceased on
March 6, 2020 by WPI and governmental mandates due to the rapid spread of pandemic caused
by the COVID-19 virus. We were unable to carry experiments to compare to our model.
However, we conducted most experiments in triplicate and each individual trial tended to have a
unique initial temperature due to day-to-day differences and because the stirring plate was
warmed by preceding experiments. Although not ideal, we used duplicate and triplicate trials to
compare to our prediction. For any set of conditions, the first trial informed the model fit that
determined the pre-exponential coefficient. The second and/or third trial could be compared to a
model determined by the first. Because there was no clear relationship between pre-exponential
coefficient and reaction conditions, we also compared experiments to the model using the
average coefficient.
The model seems to be a fair predictor of reaction behavior for the conditions that we
experimented with on the benchtop-scale. Figure 22 shows the predicted temperature profile of a
reaction (20mL beaker, 10mL recycled FA, 0.2mL of HCl). Figure 22 is our best prediction.

45
Figure 22. Experimental and predicted temperature profile for the following conditions: 20mL
beaker, 10mL recycled FA, 0.2mL of HCl.
Figure 23 is a prediction and shows the predicted temperature profile of a reaction (50mL
beaker, 30mL FA, 0.1mL HCl) that did not run away.
Figure 23. Experimental and predicted temperature profile for the following conditions: 50mL
beaker, 30mL FA, 0.1mL HCl.

46
Figure 24 shows the predicted temperature profile of a reaction (100mL beaker, 50mL,
0.2mL HCl) and is our worst prediction.
Figure 24. Experimental and predicted temperature profile for the following conditions: 100mL
beaker, 50mL, 0.2mL HCl.
All models successfully predicted whether a reaction would or would not run away. For
most models, the average pre-exponential coefficient created a more accurate prediction than the
condition-determined coefficient. In addition to the best and worst predictions shown above, all
comparisons of experimental data to predictions can be found in Appendix H. Please note,
however, that the value of these predictions is limited. As noted in 4.5.1, the model is a good up
to approximately 100°C and is not a good predictor of higher temperatures. Additionally, these
models “predict” the behavior of reactions with sets of conditions nearly identical to those that
generated the model. To carry out reactions with much different conditions (e.g., in a HDPE
bottle rather than a beaker) would be a better measure of the accuracy of our predictions; but the
COVID-19 pandemic resulted in the cessation of all experiments.
4.7 Analysis of Industrial Accident With Mathcad, we modeled the reaction of FA in a half-full 55-gallon HDPE drum over a
24-hour period. We imputed 1 to 10mL of strong acid, the average and the high pre-exponential
factors, and initial temperatures between 20 and 25°C. None of these models indicated thermal
runaway. At most, the modeled temperature increased to approximately 30°C before leveling out
then falling. Appendix I contains a Mathcad simulation for this study.
In reality, of course, the drum of FA reacted resulting in thermal runaway. It seems
highly unlikely that the conditions of the incident were anywhere outside those that we tested

47
(e.g., It is unlikely that more than 10mL strong acid entered the drum); so our model does not
predict such a large scale up accurately. The simplification of our model likely limits its ability
to accurately predict the behavior in the drum. The drum, for instance, was not well-mixed; it
was not mixed at all. There were almost certainly areas of higher temperature where FA was
reacting due to the small amount of acid contaminant. Areas of high temperature may have
induced the auto polymerization of FA (a phenomenon that we observed in lab). Auto
polymerization would generate more heat and propagate the reaction despite the low
concentration and/or localization of acid. As previously noted, non-mixing, auto polymerization,
and other effects are not present in the model. Changes in pressure are an example of one effect
that is not present in the model because pressure has no place in non-gaseous rate expressions.
Anecdotal evidence, however, suggests that the reaction may be sensitive to pressure (Cyr,
Charla, Vodola, & McKeage, 2019). The absence of this effect and others and our simplifying
assumptions limit the accuracy of the model’s predictions for conditions that are very different
from those directly studied by experimentation.

48
5.0 Conclusions and Recommendations
5.1 Mathcad Modeling The Mathcad model is a good predictor for at least reactions with conditions like those
we experimented with. With an average pre-exponential coefficient, we can predict whether a
reaction of up to 50mL FA will run away. As previously mentioned, the model is a good
prediction of reaction temperature up to approximately 100°C.
The model, however, has limitations due to its simplicity. For experiments with thermal
runaway, predicted temperature increases higher than is experimentally observed largely because
the model is of a closed system where no mass leaves. In the model, FA and water do not
evaporate, a process that results in significant cooling in reality. Additionally, we assumed
constant zero-order kinetics with respect to furfuryl alcohol but rate independence on FA is
likely not the case for high conversion. At high conversion, PFA rather than FA dominates the
reaction volume, and the concentration of FA likely limits the reaction rate.
We would be able to say with greater certainty how well our model predicts the behavior
of benchtop reactions if we could conduct more experiments for comparison. These experiments
would inform us on the robustness and versatility of our model. The COVID-19 pandemic,
however, prevented us from conducting very different experiments to evaluate the model.
The Mathcad model also does not seem to be a good predictor of highly scaled up
reactions without mixing. This shortcoming, we suspect, is because temperature and
concentration are uniform throughout the reaction volume in both our model and in our mixed
benchtop experiments. Such uniform concentration and temperature are unlikely to occur in a
large unmixed container, such as a 55-gallon storage drum.
It may be possible to improve the Mathcad model, but changes would not be trivial. To
add terms in the mass and energy balances that involve the vapor pressures of FA and water
would allow for their evaporation to be considered. Vapor pressures are temperature dependent,
of course, and to involve evaporation in the balances would introduce new variables (and
possibly new differential equations) for the program to solve. The model may not survive the
addition of evaporation terms; a few of our calculations could not converge to a solution, and our
model as it seems to be near the upper limit of Mathcad’s number-crunching ability. A wiser
approach may be to use the program COMSOL, which is designed to efficiently perform
calculations involving differential equations that model physical systems. Mass and heat transfer
within the reaction volume may be modeled in COMSOL, eliminating the need to consider only
mixed systems.
5.2 Process Safety Concerns On an industrial scale, the best way to prevent an accident occurring from FA
polymerizing is, of course, to keep it away from any acid or base. Our experiments show just
how explosive and dangerous it can be on the small scale. On an industrial scale, it can only get
worse. When both chemicals are onsite, it is best to inform all operators of the incompatibility of
the reactants. Operators cannot prevent the combination if they do not know the dangers.
Additionally, it is safer as well as more cost effective to use different pieces of equipment. The
reaction occurred in industry previously because of contamination on a hand pump. It is best
practice to use three separate pumps for acids, bases, and FA to avoid the reaction entirely. The

49
effect of rinsing was not investigated, but it is evident that the consequence of not rinsing
thoroughly is dangerous.
If both FA and MSA are used in a batch reactor, it will be necessary to charge them at
separate times through separate piping units. One problem that occurs in batch reactors in
reactant pooling which is when the reaction is not well mixed. If FA and MSA meet, they will
form PFA which will be an unwanted side effect of the reaction. In addition to raising the
temperature of the batch, the PFA will be sticky which could plug up or cause damage to
equipment.
If PFA and a catalyst do end up mixing in a drum, the first step will be to clear the area
around it. The reaction is unpredictable and if the drum is closed, the buildup of pressure is
unknown. If it is safe to do so, for example the contamination of the FA drum just occurred, open
the drum up in a vented area or in a place where respirators are required. FA is not to be breathed
in directly. An open drum will prevent a buildup of pressure which will slow down the reaction.
Next, add mixing to the drum, perhaps using an agitator. Pockets of polymerization form which
spread throughout the drum. Mixing will prevent these pockets from forming. Then, add
temperature tracking capabilities. From our experiments, the temperature rises slowly in the
beginning but once it hits around 50oC, it will be time to clear the area and prepare for an
explosion. As long as the temperature remains below 50oC, it should be safe to continue. Lastly,
remove samples of the mixture to form lab-scale sizes and react them in a lab hood. Expect an
explosive reaction in the hood so use proper PPE and blast shields. Since the drum is already
contaminated, it is best to get rid of it safely by turning it into PFA. PFA can then be sent to a
landfill as it is non-hazardous.
If contamination happens on a smaller scale in a lab, the same steps should be followed.
Based on the size of the vessel, frequent checks with a temperature probe can be performed
initially to make sure that thermal runaway is not occurring. Best practices are assuming the
worst and being prepared for an explosion. If the vessel is glass, switching to a plastic bottle if
the reaction is stable is recommended. To reiterate, the best way to avoid an explosive reaction is
to keep the reactants separated in storage, usage, and disposal.
5.3 Future Experimentation Overall, we explored many different aspects of this reaction, but there are still more areas
that we could have pursued. We listed some key observations and recommendations that could
be implemented into future projects.
Stopping the reaction: A safety instrument or chemical that could safely stop or detect an
accident of this nature would be extremely beneficial to the chemical processing industry. From
our experiments, we learned that volume and concentration of acid as well as reaction
temperature play a key role in this reaction going to completion. If an HCl and FA reaction
reached above 60℃, it began to rapidly heat up and run away Thus, further experimentation on
the potential of stopping the reaction once it passes a certain temperature could be beneficial. If
a device could detect this temperature and “pull an emergency switch”, it would prevent an
accident. We recommend first doing research on different chemicals that could prohibit further
polymerization and then trying it in the small-scale in the lab.
Experimenting with weaker, or more dilute, acids: Although it was attempted in the
beginning, we never fully explored the effects of weaker acids on FA. From our testing, only

50
strong acids, like MSA and HCl, had the ability to make the reaction runaway. We tried a dilute
acetic acid to initiate the reaction, but it did not work. One experiment could be using acetic acid
at a similar molarity (12.5M) to what we used with HCl. Additionally, the concentration of HCl
was not changed in any of our experiments. It would be safer to work with a less concentrated
acid so that can be explored.
Go large scale (go big or go home): Our model has not been validated at larger volumes or
vessels. In fact, due to COVID-19 we did not get to validate it at all. It would be exciting to do
some larger scale tests to see if the model holds up. We made assumptions when building this
model and are curious if they are accurate on a larger scale. Our largest volume ever tested
against the model is a 100mL beaker. In this recommendation, the proper safety precautions are
necessary. Since we have not conducted these larger scale tests, we do not know the volatility of
the reaction. When we scaled up, the bursting vapor bubbles were powerful to make the beaker
“jump” and have the potential to crack. A plastic bottle has the potential to melt similar to the
drum in industry. Scale up should be down slowly and in a manner where a blast is a dangerous
yet feasible option. In our testing, we used cardboard as a blast shield. Regardless of scale, we
recommend using cardboard if not something sturdier in order to limit splatter after the reaction.
Invest in a thermocouple: When validating the accuracy of our model, we constructed a
thermocouple because we could not find one in the lab and they were too expensive to purchase.
We recommend that future experimentation needing to log temperature vs. time data is done with
a different thermocouple. Our homemade thermocouple was a great temporary tool, but it was
not compatible for every laptop. Once calibrated, it did now stay calibrated based on which
laptop it was plugged in to. Only the laptop that it was calibrated on showed the correct
temperature. Other laptops were off by at least 7oC or it was not compatible with Apple products.
Investigate the method of acid insertion: We experimented with inserting acid into the center
and into the side of a beaker. We could not replicate the hand pump that contained the drum in
industry. Potentially, future experimentation can investigate inserting acid into the middle of the
beaker rather than the top. One method could be a pill capsule. Another method is to try and
recreate the ineffective rinse of the hand pump that happened in industry.
Explore kinetics of reaction using GC or UV Spec: One potential path that we chose not to
take is to use chromatography or spectroscopy to better understand kinetics. The basis of these
experiments would be looking at the concentration of FA throughout the course of a runaway
reaction. We modeled the reaction in terms of temperature, but it could also be modeled in terms
of amount of reactant. One area of concern here is that PFA is a very sticky polymer and can
cause problems in a machine such as GC. An aqueous reaction can be used to limit the
stickiness. Still, it is best to consult a chemist with more experience before potentially causing
damage to expensive equipment.
Catalyze monomers similar to FA: The actual chemistry behind the polymerization is not
known. We predict the acid strips off the hydroxyl group (-OH) to create a polymer. We believe
that the polymer chains are not long and are oligomers. Then, since there are bonding
opportunities on the furan ring where there are double bonds, cross linking occurs between the
oligomers. After polymerization, there are two available carbon atoms that can be used in cross-

51
linking. We have not tested this hypothesis. To test it, additionally methyl (-CH3) chains can be
added on to the furan ring to the two available carbon atoms; this would no longer be FA.
Chemical analysis on the product or a liquid product of a different color would prove that cross-
linking is required to produce the solid PFA. Additionally, three methyl groups can be added to
the FA to see if any reaction occurs. One limitation of this experiment is the chemical stability of
these atoms. These chemicals are not common and may be expensive or not possible to purchase.

52
References Adams, R., Voorhees, V. (1921). Furfural. Organic Synthesis, 1(49). DOI:
10.15227/orgsyn.001.0049
AIChE. (2015, November). Code of Ethics. Retrieved March 24, 2020, from
https://www.aiche.org/about/code-ethics
Biron, M. (2014). Thermosets and composites: material selection, applications, manufacturing,
and cost analysis. (pp. 257–259.) Elsevier, Amsterdam.
Brownlee, H. J., Miner, C. S. (1948). Industrial Development of Furfural. Industrial &
Engineering Chemistry, 40(2), 201-204. DOI: 10.1021/ie50458a005
CDC - NIOSH Pocket Guide to Chemical Hazards - Furfuryl alcohol. (2019, October 4).
Retrieved December 13, 2019, from https://www.cdc.gov/niosh/npg/npgd0298.html.
Chemical Safety and Hazard Investigation Board. (n.d.). CSB investigations involving
inadequate mechanical integrity programs. Retrieved December 13, 2019, from
https://www.csb.gov/recommendations/csb-investigations-mechanical-integrity/.
Choura, M., Belgacem, N. M., Gandini, A. (1996). Acid-Catalyzed Polycondensation of Furfuryl
Alcohol: Mechanisms of Chromophore Formation and Cross-Linking. Macromolecules,
29, 3839-3850. Retrieved from https://pubs.acs.org/doi/pdf/10.1021/ma951522f.
Clark, J. (2013). Rate Constants and the Arrhenius Equation. Retrieved from
https://www.chemguide.co.uk/physical/basicrates/arrhenius.html
Cyr, C. L., Charla, K. J., Vodola, K., McKeage, S. L. (2019). The Acid Catalyzed
Polycondensation of Furfuryl Alcohol. Worcester Polytechnic Institute.
D.E, Robert. (1950). Heats of Polymerization. A Summary of Published Values and Their
Relation to Structure, 44(3), 221.
DiBiasio, D., Clark, W. (n.d.). Scale Up of an Exothermic Batch Reaction. Retrieved from
https://canvas.wpi.edu/courses/14730/pages/8-reaction-scale-
up?module_item_id=308175
Dugas, C. (2018, August 10). The 4 Main Causes of Accidents in a Chemical Plant. Retrieved
December 13, 2019, from https://www.claydugas.com/blog/2017/january/the-4-main-
causes-of-accidents-in-a-chemical-pla/.
Engineers Edge. (n.d.). Overall Heat Transfer Coefficient Table Charts and Equation. Retrieved
April 1, 2020, from
https://www.engineersedge.com/thermodynamics/overall_heat_transfer-table.htm
Engineering ToolBox, (2013). Polymers - Specific Heats. Retrieved April 22, 2020, from
https://www.engineeringtoolbox.com/specific-heat-polymers-d_1862.html
Falco, G., Guigo, N., Vincent, L., Sbirrazzuoli, N. (2018a). FA Polymerization Disruption by
Protic Polar Solvents. Polymers, 10(5), 529. DOI:
https://doi.org/10.3390/polym10050529
Falco, G., Guigo, N., Vincent, L., & Sbirrazzuoli, N. (2018b). Opening Furan for Tailoring
Properties of Bio‐based Poly (Furfuryl Alcohol) Thermoset. ChemSusChem, 11(11),
1805-1812.
Geary, D. (n.d.). Chemical Storage Guidelines. Retrieved from
https://www.chem.tamu.edu/rgroup/gladysz/Research Safety Resources/Chemical
Storage Guidelines.pdf.
Gernon, M. (1999)0. Environmental benefits of methanesulfonic acid. Comparative properties
and advantages. Green Chemistry, 1(3), 127-140.

53
International Furan Chemicals (IFC) (n.d.). Applications. Retrieved from
http://www.furan.com/furfuryl_alcohol_applications.html
Kottke, R. H. (2005). Kirk-Othmer Encyclopedia of Chemical Technology, Fifth Edition. NY,
NY: John Wiley & Sons.
Lambert, C. (2020). Ice Calorimeter, 1–2.
Learn the Basics of Hazardous Waste. (2019, April 26). Retrieved December 13, 2019, from
https://www.epa.gov/hw/learn-basics-hazardous-waste.
Lewis, R.J. (2007). Hawley's Condensed Chemical Dictionary, 15th Edition. (pp. 3-326). New
York, NY: John Wiley & Sons, Inc.
Lide, D.R. (2008). CRC Handbook of Chemistry and Physics 88th Edition. Boca Raton, FL:
CRC Press
Maritime Injury Center. (n.d.). Inadequate Training Accidents. Retrieved December 13, 2019,
from https://www.maritimeinjurycenter.com/accidents-and-injuries/inadequate-training/.
McKillip, W. J., Sherman, E. (1978). Kirk-Othmer Encyclopedia of Chemical Technology, Third
Edition. 11:499-527.
McLeod, R. W. (2017). Human factors in barrier management: Hard truths and challenges.
Process Safety and Environmental Protection, 110, 31-42.
National Coffee Association (n.d.). Furfuryl Alcohol: NCA Resource Page. Retrieved from
http://www.ncausa.org/Industry-Resources/Furfuryl-Alcohol
NFPA 1:Fire Code, 2019 Edition. In NFPA National Fire Codes Online. Retrieved from
www.nfpa.org/codes-and-standards
NFPA 3:Standard for Commissioning of Fire Protection and Life Safety Systems, 2019 Edition.
In NFPA National Fire Codes Online. Retrieved from www.nfpa.org/codes-and-standards
NFPA 30:Flammable and Combustible Liquids Code, 2019 Edition. In NFPA National Fire
Codes Online. Retrieved from www.nfpa.org/codes-and-standards
NFPA 33:Standard for Spray Application Using Flammable or Combustible Materials, 2019
Edition. In NFPA National Fire Codes Online. Retrieved from www.nfpa.org/codes-and-
standards
NFPA 45:Standard on Fire Protection for Laboratories Using Chemicals, 2019 Edition. In NFPA
National Fire Codes Online. Retrieved from www.nfpa.org/codes-and-standards
NFPA 56:Standard for Fire and Explosion Prevention During Cleaning and Purging of
Flammable Gas Piping Systems, 2019 Edition. In NFPA National Fire Codes Online.
Retrieved from www.nfpa.org/codes-and-standards
NFPA 69:Standard on Explosion Prevention Systems, 2019 Edition. In NFPA National Fire
Codes Online. Retrieved from www.nfpa.org/codes-and-standards
NFPA 400:Hazardous Materials Code, 2019 Edition. In NFPA National Fire Codes Online.
Retrieved from www.nfpa.org/codes-and-standards
NFPA 495:Explosive Materials Code, 2019 Edition. In NFPA National Fire Codes Online.
Retrieved from www.nfpa.org/codes-and-standards
Nichols, M. (2018, July 31). 10 Ways To Stay Safe In The Chemical Industry. Retrieved
December 13, 2019, from https://www.manufacturing.net/home/article/13128452/10-
ways-to-stay-safe-in-the-chemical-industry.
O'Neil, M.J. (2013). The Merck Index - An Encyclopedia of Chemicals, Drugs, and Biologicals.
(pp. 888). Cambridge, UK: Royal Society of Chemistry.
Our Mission and What We Do. (2018, February 7). Retrieved December 13, 2019, from
https://www.epa.gov/aboutepa/our-mission-and-what-we-do.

54
Structural formula of furfuryl alcohol (n.d.). Retrieved from
https://en.wikipedia.org/wiki/Furfuryl_alcohol#/media/File:Structural_formula_of_furfur
yl_alcohol.svg
Structural formula of methanesulfonic acid (n.d.). Retrieved from
https://en.wikipedia.org/wiki/Methanesulfonic_acid#/media/File:Structural_formula_of_
methanesulfonic_acid.svg
Sun, S., Yang, R., Sun, P., Ma, C., & Chen, J. (2017). Kinetics of furfuryl alcohol condensation
over acid catalyst for preparing diesel precursor. Energy, 135, 577-584.
TSCA Handbook (1987). Rockville, MD: Government Institutes.
The Rate Law (n.d.). Chemistry LibreTexts. Retrieved from
https://chem.libretexts.org/Bookshelves/Physical_and_Theoretical_Chemistry_Textbook
_Maps/Supplemental_Modules_(Physical_and_Theoretical_Chemistry)/Kinetics/Rate_La
ws/The_Rate_Law
Übersichtsreaktionen von Veretherung und Kernkondensation von Furfurylalkohol (n.d.).
Retrieved from
https://en.wikipedia.org/wiki/Furan_resin#/media/File:Reaktionsschema_Kondensationen
_Furfurylalkohol.svg
UCDavis Safety Service. (2018, July 5). Retrieved December 13, 2019, from
https://safetyservices.ucdavis.edu/safetynet/general-guidelines-storage-and-management-
laboratory-chemicals.
U.S Bureau of Labor. (2018, December 18). Census of Fatal Occupational Injuries Summary,
2017. Retrieved December 13, 2019, from
https://www.bls.gov/news.release/cfoi.nr0.htm.
U.S. Department of Labor. (n.d.). Hazard Communication Standard: Safety Data Sheets.
Retrieved from https://www.osha.gov/Publications/OSHA3514.html.
U.S. Department of Labor. (n.d.). Personal Protective Equipment. Retrieved December 13, 2019,
from https://www.osha.gov/SLTC/personalprotectiveequipment/.
U.S. Department of Labor. (2016, November 18). Retrieved December 13, 2019, from
https://www.osha.gov/pls/oshaweb/owadisp.show_document?p_id=9777&p_table=STA
NDARDS.
U.S. Department of Labor. (2007, December 14). Retrieved December 13, 2019, from
https://www.osha.gov/laws-regs/regulations/standardnumber/1910/1910.144.
U.S. EPA. (2019, April 26). Learn the Basics of Hazardous Waste. Retrieved December 13,
2019, from https://www.epa.gov/hw/learn-basics-hazardous-waste.
U.S. National Library of Medicine (n.d.). Furfuryl Alcohol (Compound).
https://pubchem.ncbi.nlm.nih.gov/compound/Furfuryl-alcohol#section=Chemical-and-
Physical-Properties
Wang, R.-M., Zheng , S.-R., & Zheng , Y.-P. (2011). Polymer Matrix Composites and
Technology0. Retrieved April 4, 2020, from
https://www.sciencedirect.com/topics/chemistry/furfuryl-alcohol
Zhang, H., Zhao, H., Zheng, K., Li, X., Liu, G., & Wang, Y. (2014). Diminishing hazardous air
pollutant emissions from pyrolysis of furan no-bake binders using methanesulfonic acid
as the binder catalyst. Journal of Thermal Analysis and Calorimetry, 116(1), 373-381.

55
Appendices
Appendix A: Sample Mathcad Model

56

57

58
Appendix B: Experiments to Inform and Compare to the Mathcad Model
Table B-1. Experiments conducted to compare to the Mathcad model.
Conditions Trial Initial
temperature
(°C)
Pre-exponential
Coefficient
Frequency
Factor
Graph
20mL beaker, 10mL
recycled FA, 0.2mL of
HCl
1 21.27 11.69 9.5x10⁸ Appendix
G-1
20mL beaker, 10mL
recycled FA, 0.2mL of
HCl
2 22.27 - - Appendix
H-1
20mL beaker, 10mL
recycled FA, 0.2mL of
HCl
3 23.28 - - -
20mL beaker, 10mL
FA, 0.2mL of HCl
1 21.27 13.58 1.1x10⁹ Appendix
G-2
20mL beaker, 10mL
FA, 0.2mL of HCl
2 22.27 - - Appendix
H-2
20mL beaker, 10mL
FA, 0.2mL of HCl
3 24.29 - - -
20mL beaker, 10mL
FA, 0.2mL of HCl
4 24.29 - - -
20mL beaker, 10mL
FA, 0.1mL of HCl
1 23.28 12.11 9.9x10⁸ Appendix
G-3
20mL beaker, 10mL
FA, 0.1mL of HCl
2 24.29 - - Appendix
H-3

59
20mL beaker, 10mL
FA, 0.1mL of HCl
3 25.3 - - -
20mL beaker, 10mL
FA, 0.05mL HCl
1 19.25 12.94 1.1x10⁹ Appendix
G-4
20mL beaker, 10mL
FA, 0.05mL HCl
2 19.25 - - Appendix
H-4
50mL beaker, 30mL
FA, 0.1mL HCl
1 21.27 10.28 8.4x10⁸ Appendix
G-5
50mL beaker, 30mL
FA, 0.1mL HCl
2 19.25 - - Appendix
H-5
50mL beaker, 30mL
FA, 0.1mL HCl
3 20.26 - - -
50mL beaker, 30mL
FA, 0.2mL HCl
1 21.26 16.76 1.4x10⁹ Appendix
G-6
50mL beaker, 30mL
FA, 0.2mL HCl
2 22.27 - - -
50mL beaker, 30mL
FA, 0.2mL HCl
3 21.27 - - Appendix
H-6
50mL beaker, 30mL
FA, 0.3mL HCl
1 19.25 20.08 1.6x10⁹ Appendix
G-7
50mL beaker, 30mL
FA, 0.3mL HCl
2 19.25 - - Appendix
H-7
50mL beaker, 30mL
FA, 0.3mL HCl
3 20.26 - - -
100mL beaker, 50mL,
0.2mL HCl
1 20.26 17.35 1.4x10⁹ Appendix
G-8

60
100mL beaker, 50mL,
0.2mL HCl
2 20.26 - - Appendix
H-8
100mL beaker, 50mL,
0.2mL HCl
3 20.26 - - -
100mL beaker, 50mL,
0.15mL HCl
1 23.28 8.82 7.2x10⁸ Appendix
G-9
100mL beaker, 50mL,
0.3mL HCl
1 20.26 15.06 1.2x10⁹ Appendix
G-10
100mL beaker, 50mL,
0.3mL HCl
2 20.26 - - Appendix
H-9

61
Appendix C. Sample Calculations to Determine Heat of Reaction
For Trial 8
Constants:
The Density of Water = 1.000g/cm^3 = 𝛿𝑤
The Density of Ice = 0.917g/cm^3 = 𝛿𝑖
The Density of FA = 1.130g/cm^3 = 𝛿𝐹𝐴
(Densities are at 0oC)
The Heat of Fusion of Ice = 333.000J/g = 𝐿𝐹
Known Values:
Volume (V) of FA Added = 5.000mL = 𝑉𝐹𝐴
Need to Know
The change in water level in the pipette = Δ𝑉
Experimentally Determined Values
The initial water level in the pipette = -0.095mL
The final water level in the pipette = 0.640mL
To start, we first needed to identify the change in the water level in the pipette. This is the
final volume minus the initial volume. The initial volume is recorded when we insert the acid.
The final volume is when the rate of change of the volume returns to what it was prior to the acid
insertion (start of the third phase of the graph).
0.64 𝑚𝐿 − (−0.095 𝑚𝐿) = 0.735𝑚𝐿 The change in water level in the pipette through the course of the experiment is equal to
0.735mL. From there, we have everything necessary to calculate the heat of reaction. To
calculate the heat of reaction, the following equation is used:
−|ΔV × 𝛿𝑖 / (𝛿𝑤 − 𝛿𝑖) × 𝐿𝐹
𝑉𝐹𝐴 × 𝛿𝐹𝐴| = 𝑇ℎ𝑒 ℎ𝑒𝑎𝑡 𝑜𝑓 𝑟𝑒𝑎𝑐𝑡𝑖𝑜𝑛 𝑜𝑓 𝐹𝐴
Figure C-1 shows the calculation within our Google Spreadsheet.
Figure C-1. Heat of reaction calculation in Google Spreadsheet.
This equation uses three known densities (density of ice, water, and FA), the heat of fusion of
ice, the total volume of FA, and the change in water level in the pipette.

62
−|0.735 mL × 0.917 𝑚𝐿 / (1 − .0.917 𝑚𝐿) ∗ 333
𝐽𝑔
5 𝑚𝐿 × 1.13𝑔
𝑚𝐿
| = −479𝐽/𝑔
For Trial 8 we got an experimental heat of reaction of -479J/g.
This equation does not account for any heat loss to the surroundings. A heat loss factor of 30%
accounted for in the final answer.
(−479𝐽𝑔)
(1 − .3)= −684𝐽/𝑔
The new adjusted heat of reaction for Trial 8 is -684J/g.

63
Appendix D. Sample Calculations to Determine Heat Capacity
For Trial 6
Constants:
The Density of Water = 1.000g/cm^3 = 𝛿𝑤
The Density of Ice = 0.917g/cm^3 = 𝛿𝑖
(Densities are at 0oC)
The Heat of Fusion of Ice = 333.000J/g = 𝐿𝐹
Known Values:
Initial Temperature of the PFA = 100°C
Final Temperature of the PFA = 0°C The mass of the PFA sample = 3.619grams Need to Know
The change in water level in the pipette = Δ𝑉(𝑚𝐿)
The heat capacity of PFA = 𝐶𝑝(J/g °C)
Experimentally Determined Values
The initial water level in the pipette = 0.0017mL
The final water level in the pipette = 0.0673mL
We first needed to identify the change in water volume in the pipette due to the addition
of the heated sample. During the experiment, we logged the volume of water within the pipette
against time. We took note of the slopes before and after the sample was added. Three distinct
slopes can be seen in Figure D-1.
Figure D-1. Trial 6 temperature vs. time graph.
The first slope is due to the gradual change in volume within the pipette. This is caused
by the experimental setup. The second slope is after the addition of the heated sample. The
addition of the heated sample melts ice, causing the volume within the pipette to change at a
faster rate. It is important to note that there is still a gradual volume change due to the
experimental setup. The third slope takes place after the sample has cooled, and the slope returns
to its gradual increase. We used these slopes to find the y-intercepts and get the final and initial
volumes within the pipette during the experiment. The initial volume, found from the y-int of the

64
green section, of the was found to be 0.0017mL. The final volume was 0.0673mL, found from
the y-int of the yellow section. The change is volume is equal to the final minus initial volume.
0.0673𝑚𝐿𝑠 − 0.0017𝑚𝐿𝑠 = 0.735𝑚𝐿𝑠 In order to find the heat capacity for PFA, we needed to determine how much heat was
produced by the PFA sample. To do this we used the following equation:
𝑄 = |Δ𝑉 (𝛿𝑖
1 − 𝛿𝑖) 𝐿𝐹|
Heat is given in Joules. The calculation for Trial 6 is demonstrated below.
|(0.0673mL − 0.0017mL) (0.917
𝑔𝑚𝐿
1 − 0.917𝑔
𝑚𝐿
) (333𝐽
𝑔) | = 241𝐽
These calculations were completed within a Google Spreadsheet, shown in Figure D-2.
Figure D-2. Heat calculation within Google Spreadsheets.
Now that we have our Q value, we calculated the heat capacity of the sample. Using the
known temperature difference and mass of the PFA sample, we determined the experimental heat
capacity. We used a rearranged heat equation, solved for heat capacity.
𝐶𝑝 =𝑄
𝑚 ΔT
Next, we inputted our Trial 6 variables and solve.
(241𝐽)/(3.619𝑔)(100°C − 0°C ) = 0.667𝐽/𝑔°C These calculations were also completed in the same google spreadsheet, as demonstrated in Figure D-3.
Figure D-3. Heat capacity calculation within google spreadsheets
65
For Trial 6 we calculated an experimental heat capacity of 0.667 J/g °C. This equation
does not account for any heat loss to the surroundings. A heat loss factor of 10% accounted for in
the final answer.
(0.667𝐽𝑔 °C)
(1 − .1)= 0.741𝐽/𝑔°C
The adjusted heat of reaction for Trial 6 is 0.741J/g °C .

66
Appendix E. Overall Heat Transfer Coefficient Data
Some trials were recorded more than the time shown. For the sake of being concise, the
beginning of those tests are shown.
20 mL Beaker, All Trials
Time (s)
Temp. (C)
Temp. (K)
Time (s)
Temp. (C)
Temp. (K)
Time (s)
Temp. (C)
Temp. (K)
0 80.6 353.75 0 78.4 351.55 0 84.7 357.85
10 79.6 352.75 10 77.9 351.05 10 83.5 356.65
20 78.6 351.75 20 76.8 349.95 20 82.3 81
30 77.4 350.55 30 75.8 348.95 30 81 352.65
40 76.1 349.25 40 74.7 347.85 40 79.5 351.65
50 75.1 348.25 50 73.6 346.75 50 78.5 350.25
60 74.1 347.25 60 72.6 345.75 60 77.1 349.15
70 73 346.15 70 71.5 344.65 70 76 348.15
80 72.1 345.25 80 70.4 343.55 80 75 346.95
90 71.2 344.35 90 69.4 342.55 90 73.8 345.95
100 70.2 343.35 100 68.6 341.75 100 72.8 345.05
110 69.5 342.65 110 67.7 340.85 110 71.9 345.05
120 68.5 341.65 120 66.9 340.05 120 70.8 343.95
130 67.7 340.85 130 65.9 339.05 130 69.9 343.05
140 67 340.15 140 65.2 338.35 140 69 342.15
150 66.1 339.25 150 64.3 337.45 150 68.2 341.35
160 65.3 338.45 160 63.6 336.75 160 67.3 340.45
170 64.5 337.65 170 62.8 335.95 170 66.5 339.65
180 63.9 337.05 180 62.2 335.35 180 65.6 338.75
190 63.1 336.25 190 61.4 334.55 190 64.9 338.05
200 62.4 335.55 200 60.7 333.85 200 64.1 337.25
210 61.8 334.95 210 60 333.15 210 63.5 336.65
220 61.1 334.25 220 59.3 332.45 220 62.7 335.85
230 60.5 333.65 230 58.6 331.75 230 62 335.15
240 59.8 332.95 240 58.1 331.25 240 61.4 334.55
250 59.2 332.35 250 57.4 330.55 250 60.7 333.85
260 58.6 331.75 260 56.9 330.05 260 60.1 333.25
270 58 331.15 270 56.4 329.55 270 59.2 332.35
280 57.5 330.65 280 55.8 328.95 280 58.7 331.85
290 57 330.15 290 55.2 328.35 290 58.1 331.25
300 56.4 329.55 300 54.7 327.85 300 57.5 330.65
310 55.8 328.95 310 54.1 327.25 310 57 330.15
320 55.2 328.35 320 53.6 326.75 320 56.4 329.55

67
330 54.7 327.85 330 53.1 326.25 330 55.9 329.05
340 54.2 327.35 340 52.7 325.85 340 55.3 328.45
350 53.7 326.85 350 52.2 325.35 350 54.7 327.85
360 53.2 326.35 360 51.7 324.85 360 54.2 327.35
370 52.7 325.85 370 51.3 324.45 370 53.7 326.85
380 52.3 325.45 380 50.8 323.95 380 53.2 326.35
390 51.9 325.05 390 50.3 323.45 390 52.7 325.85
400 51.4 324.55 400 49.9 323.05 400 52.3 325.45
410 51 324.15 410 49.5 322.65 410 51.9 325.05
420 50.5 323.65 420 49.1 322.25 420 51.4 324.55
430 50 323.15 430 48.6 321.75 430 50.9 324.05
440 49.6 322.75 440 48.3 321.45 440 50.4 323.55
450 49.2 322.35 450 47.9 321.05 450 50 323.15
460 48.8 321.95 460 47.5 320.65 460 49.5 322.65
470 48.4 321.55 470 47.1 320.25 470 49.1 322.25
480 48 321.15 480 46.8 319.95 480 48.7 321.85
490 47.7 320.85 490 46.4 319.55 490 48.3 321.45
500 47.3 320.45 500 46.1 319.25 500 48 321.15
510 47 320.15 510 45.7 318.85 510 47.6 320.75
520 46.6 319.75 520 45.3 318.45 520 47.2 320.35
530 46.3 319.45 530 45 318.15 530 46.9 320.05
540 45.9 319.05 540 44.6 317.75 540 46.5 319.65
550 45.5 318.65 550 44.3 317.45 550 46.1 319.25
560 45.2 318.35 560 44 317.15 560 45.7 318.85
570 44.9 318.05 570 43.7 316.85 570 45.4 318.55
580 44.5 317.65 580 43.4 316.55 580 45.1 318.25
590 44.2 317.35 590 43.1 316.25 590 44.7 317.85
600 43.9 317.05 600 42.8 315.95 600 44.4 317.55
610 43.6 316.75 610 42.5 315.65 610 44.1 317.25
620 43.3 316.45 620 42.2 315.35 620 43.8 316.95
630 43 316.15 630 41.9 315.05 630 43.5 316.65
640 42.8 315.95 640 41.6 314.75 640 43.2 316.35
650 42.5 315.65 650 41.3 314.45 650 42.9 316.05
660 42.2 315.35 660 41 314.15 660 42.6 315.75
670 41.9 315.05 670 40.8 313.95 670 42.3 315.45
680 41.6 314.75 680 40.5 313.65 680 42 315.15
690 41.3 314.45 690 40.3 313.45 690 41.7 314.85
700 41.1 314.25 700 40 313.15 700 41.5 314.65
710 40.8 313.95 710 39.7 312.85 710 40.9 314.05
720 40.5 313.65 720 39.6 312.75 720 40.7 313.85
730 40.3 313.45 730 39.3 312.45 730 40.4 313.55

68
740 40 313.15 740 39.1 312.25 740 40.1 313.25
750 39.8 312.95 750 38.9 312.05 750 39.9 313.05
760 39.5 312.65 760 38.7 311.85 760 39.6 312.75
770 39.3 312.45 770 38.4 311.55 770 39.4 312.55
780 39.1 312.25 780 38.1 311.25 780 39.2 312.35
790 38.9 312.05 790 39 312.15
800 38.7 311.85 800 38.8 311.95
810 38.4 311.55 810 38.5 311.65
820 38.2 311.35 820 38.3 311.45
830 38 311.15 830 38.1 311.25
840 37.8 310.95 840 37.9 311.05
850 37.5 310.65
860 37.3 310.45
870 37.1 310.25
880 36.9 310.05
890 36.7 309.85
900 36.5 309.65
910 36.4 309.55
920 36.2 309.35
930 36 309.15
940 35.8 308.95
950 35.7 308.85
960 35.5 308.65
970 35.3 308.45
980 35.1 308.25
990 35 308.15
1000 34.9 308.05
1010 34.7 307.85
1020 34.5 307.65
1030 34.4 307.55
1040 34.2 307.35
1050 34.1 307.25
1060 33.9 307.05

69
50mL Beaker, All Trials
Time (s)
Temp. (C)
Temp. (K)
Time (s)
Temp. (C)
Temp. (K)
Time (s)
Temp. (C)
Temp. (K)
0 100.4 373.55 0 122.2 395.35 0 103.7 376.85
10 99.1 372.25 10 120.5 393.65 10 102.2 375.35
20 97.9 371.05 20 118.8 391.95 20 100.9 374.05
30 96.9 370.05 30 117.3 390.45 30 99.6 372.75
40 95.9 369.05 40 115.6 388.75 40 98.6 371.75
50 94.6 367.75 50 114.1 387.25 50 97.4 370.55
60 93.1 366.25 60 112.7 385.85 60 96.2 369.35
70 92.5 365.65 70 111.5 384.65 70 95.1 368.25
80 91.6 364.75 80 110.1 383.25 80 94 367.15
90 90.6 363.75 90 108.9 382.05 90 92.9 366.05
100 89.9 363.05 100 107.5 380.65 100 91.9 365.05
110 88.8 361.95 110 106.3 379.45 110 90.8 363.95
120 87.9 361.05 120 105.2 378.35 120 89.8 362.95
130 87 360.15 130 104 377.15 130 88.8 361.95
140 86.2 359.35 140 103 376.15 140 88 361.15
150 85.5 358.65 150 101.9 375.05 150 86.9 360.05
160 84.6 357.75 160 100.8 373.95 160 86.1 359.25
170 273.15 170 99.6 372.75 170 85.2 358.35
180 83.2 356.35 180 99.8 372.95 180 84.6 357.75
190 82.5 355.65 190 97.8 370.95 190 83.9 357.05
200 71.7 344.85 200 97 370.15 200 83.2 356.35
210 273.15 210 96.1 369.25 210 82.5 355.65
220 71.6 344.75 220 95 368.15 220 69.9 343.05
230 70 343.15 230 94.2 367.35 230 69.3 342.45
240 69.5 342.65 240 93.5 366.65 240 68.8 341.95
250 69 342.15 250 92.6 365.75 250 68.3 341.45
260 68.5 341.65 260 91.9 365.05 260 67.7 340.85
270 68 341.15 270 91 364.15 270 67.2 340.35
280 67.6 340.75 280 90.2 363.35 280 66.7 339.85
290 67 340.15 290 88.6 361.75 290 66.2 339.35
300 66.5 339.65 300 87.8 360.95 300 65.7 338.85
310 66 339.15 310 87.1 360.25 310 65.3 338.45
320 65.5 338.65 320 86.5 359.65 320 64.8 337.95
330 65.1 338.25 330 85.8 358.95 330 64.3 337.45
340 64.7 337.85 340 85.1 358.25 340 64 337.15
350 64.3 337.45 350 84.4 357.55 350 63.5 336.65
360 63.7 336.85 360 83.7 356.85 360 63 336.15
370 63.2 336.35 370 83.1 356.25 370 62.7 335.85

70
380 62.8 335.95 380 82.5 355.65 380 62.3 335.45
390 62.4 335.55 390 70.6 343.75 390 62 335.15
400 62 335.15 400 70.1 343.25 400 61.5 334.65
410 61.6 334.75 410 69.6 342.75 410 61.1 334.25
420 61.2 334.35 420 69.1 342.25 420 60.7 333.85
430 60.8 333.95 430 68.6 341.75 430 60.2 333.35
440 60.4 333.55 440 68.2 341.35 440 59.8 332.95
450 60 333.15 450 67.7 340.85 450 59.4 332.55
460 59.6 332.75 460 67.2 340.35 460 59.1 332.25
470 59.2 332.35 470 66.9 340.05 470 58.8 331.95
480 58.9 332.05 480 66.3 339.45 480 58.4 331.55
490 58.3 331.45 490 65.9 339.05 490 58 331.15
500 58.1 331.25 500 65.3 338.45 500 57.6 330.75
510 57.7 330.85 510 65 338.15 510 57.3 330.45
520 57.3 330.45 520 64.6 337.75 520 57 330.15
530 57 330.15 530 64 337.15 530 56.6 329.75
540 56.7 329.85 540 63.7 336.85 540 56.3 329.45
550 56.4 329.55 550 63.3 336.45 550 273.15
560 56 329.15 560 62.8 335.95 560 55.6 328.75
570 55.6 328.75 570 62.5 335.65 570 55.3 328.45
580 55.3 328.45 580 62.1 335.25 580 54.9 328.05
590 54.9 328.05 590 61.7 334.85 590 54.6 327.75
600 54.6 327.75 600 61.3 334.45 600 54.3 327.45
610 54.3 327.45 610 60.9 334.05 610 54 327.15
620 53.9 327.05 620 60.5 333.65 620 53.6 326.75
630 53.7 326.85 630 60.1 333.25 630 53.2 326.35
640 53.3 326.45 640 59.7 332.85 640 52.9 326.05
650 53 326.15 650 59.3 332.45 650 52.6 325.75
660 52.7 325.85 660 58.9 332.05 660 52.3 325.45
670 52.5 325.65 670 58.7 331.85 670 52 325.15
680 52.2 325.35 680 58.3 331.45 680 51.8 324.95
690 51.9 325.05 690 57.9 331.05 690 51.5 324.65
700 51.6 324.75 700 57.5 330.65 700 51.2 324.35
710 51.3 324.45 710 57.3 330.45 710 50.9 324.05
720 51.1 324.25 720 57 330.15 720 50.6 323.75
730 50.8 323.95 730 56.6 329.75 730 50.3 323.45
740 50.5 323.65 740 56.2 329.35 740 50.1 323.25
750 50.2 323.35 750 55.9 329.05 750 49.7 322.85
760 50 323.15 760 55.6 328.75 760 49.5 322.65
770 49.7 322.85 770 55.3 328.45 770 49.2 322.35

71
100mL Beaker, All Trials
Time (s)
Temp. (C)
Temp. (K)
Time - degrees C
Time (hh:mm:ss)
Time from start (seconds)
temp (oC)
Time - degrees C
Time from start (seconds)
Temp (C)
14:31:00.596 -> 82.76
14:31:00.596 0.0
82.76
15:07:21.496 -> 85.78 0
85.78
0 109.2 382.3
5 14:31:01.108 -> 82.76
14:31:01.108 0.5
82.76
15:07:22.004 -> 85.78 0.5
85.78
10 108.6 381.7
5 14:31:01.616 -> 82.76
14:31:01.616 1.0
82.76
15:07:22.509 -> 85.78 1
85.78
20 107.8 380.9
5 14:31:02.125 -> 82.76
14:31:02.125 1.5
82.76
15:07:23.018 -> 85.78 1.5
85.78
30 107.1 380.2
5 14:31:02.600 -> 82.76
14:31:02.600 2.0
82.76
15:07:23.524 -> 85.78 2
85.78
40 106.2 379.3
5 14:31:03.108 -> 82.76
14:31:03.108 2.5
82.76
15:07:24.002 -> 85.78 2.5
85.78
50 105.4 378.5
5 14:31:03.619 -> 83.77
14:31:03.619 3.0
83.77
15:07:24.508 -> 85.78 3
85.78
60 104.6 377.7
5 14:31:04.101 -> 82.76
14:31:04.101 3.5
82.76
15:07:25.017 -> 85.78 3.5
85.78
70 103.7 376.8
5 14:31:04.612 -> 82.76
14:31:04.612 4.0
82.76
15:07:25.492 -> 85.78 4
85.78
80 102.9 376.0
5 14:31:05.132 -> 83.77
14:31:05.132 4.5
83.77
15:07:25.998 -> 85.78 4.5
85.78
90 102 375.1
5 14:31:05.604 -> 83.77
14:31:05.604 5.0
83.77
15:07:26.504 -> 85.78 5
85.78
100 101.2 374.3
5 14:31:06.120 -> 83.77
14:31:06.120 5.5
83.77
15:07:27.015 -> 85.78 5.5
85.78
110 100.4 373.5
5 14:31:06.628 -> 83.77
14:31:06.628 6.0
83.77
15:07:27.522 -> 85.78 6
85.78
120 99.7 372.8
5 14:31:07.102 -> 83.77
14:31:07.102 6.5
83.77
15:07:28.000 -> 85.78 6.5
85.78
130 99 372.1
5 14:31:07.608 -> 83.77
14:31:07.608 7.0
83.77
15:07:28.508 -> 84.77 7
84.77
140 98.3 371.4
5 14:31:08.117 -> 83.77
14:31:08.117 7.5
83.77
15:07:29.018 -> 85.78 7.5
85.78
150 97.6 370.7
5 14:31:08.626 -> 83.77
14:31:08.626 8.0
83.77
15:07:29.525 -> 85.78 8
85.78
160 96.8 369.9
5 14:31:09.131 -> 83.77
14:31:09.131 8.5
83.77
15:07:30.001 -> 85.78 8.5
85.78

72
170 96.2 369.3
5 14:31:09.609 -> 83.77
14:31:09.609 9.0
83.77
15:07:30.510 -> 85.78 9
85.78
180 95.5 368.6
5 14:31:10.115 -> 83.77
14:31:10.115 9.5
83.77
15:07:31.018 -> 85.78 9.5
85.78
190 94.8 367.9
5 14:31:10.618 -> 83.77
14:31:10.618 10.0
83.77
15:07:31.527 -> 84.77 10
84.77
200 94.1 367.2
5 14:31:11.128 -> 83.77
14:31:11.128 10.5
83.77
15:07:31.999 -> 85.78 10.5
85.78
210 93.4 366.5
5 14:31:11.635 -> 83.77
14:31:11.635 11.0
83.77
15:07:32.508 -> 85.78 11
85.78
220 92.8 365.9
5 14:31:12.109 -> 82.76
14:31:12.109 11.5
82.76
15:07:33.016 -> 85.78 11.5
85.78
230 92.2 365.3
5 14:31:12.618 -> 83.77
14:31:12.618 12.0
83.77
15:07:33.524 -> 85.78 12
85.78
240 91.6 364.7
5 14:31:13.127 -> 82.76
14:31:13.127 12.5
82.76
15:07:34.031 -> 84.77 12.5
84.77
250 90.9 364.0
5 14:31:13.637 -> 82.76
14:31:13.637 13.0
82.76
15:07:34.504 -> 85.78 13
85.78
260 90.3 363.4
5 14:31:14.112 -> 82.76
14:31:14.112 13.5
82.76
15:07:35.012 -> 85.78 13.5
85.78
270 89.7 362.8
5 14:31:14.618 -> 82.76
14:31:14.618 14.0
82.76
15:07:35.524 -> 85.78 14
85.78
280 89.1 362.2
5 14:31:15.128 -> 82.76
14:31:15.128 14.5
82.76
15:07:36.030 -> 85.78 14.5
85.78
290 88.4 361.5
5 14:31:15.632 -> 82.76
14:31:15.632 15.0
82.76
15:07:36.503 -> 85.78 15
85.78
300 88 361.1
5 14:31:16.142 -> 82.76
14:31:16.142 15.5
82.76
15:07:37.009 -> 85.78 15.5
85.78
310 87.5 360.6
5 14:31:16.616 -> 82.76
14:31:16.616 16.0
82.76
15:07:37.515 -> 84.77 16
84.77
320 86.9 360.0
5 14:31:17.124 -> 82.76
14:31:17.124 16.5
82.76
15:07:38.022 -> 84.77 16.5
84.77
330 86.4 359.5
5 14:31:17.628 -> 82.76
14:31:17.628 17.0
82.76
15:07:38.528 -> 84.77 17
84.77
340 85.8 358.9
5 14:31:18.134 -> 82.76
14:31:18.134 17.5
82.76
15:07:39.036 -> 84.77 17.5
84.77
350 85.3 358.4
5 14:31:18.642 -> 82.76
14:31:18.642 18.0
82.76
15:07:39.541 -> 85.78 18
85.78
360 84.7 357.8
5 14:31:19.116 -> 82.76
14:31:19.116 18.5
82.76
15:07:40.016 -> 84.77 18.5
84.77
370 84.3 357.4
5 14:31:19.622 -> 82.76
14:31:19.622 19.0
82.76
15:07:40.525 -> 84.77 19
84.77

73
380 83.8 356.9
5 14:31:20.134 -> 82.76
14:31:20.134 19.5
82.76
15:07:41.033 -> 84.77 19.5
84.77
390 83.3 356.4
5 14:31:20.639 -> 82.76
14:31:20.639 20.0
82.76
15:07:41.539 -> 84.77 20
84.77
400 82.8 355.9
5 14:31:21.146 -> 82.76
14:31:21.146 20.5
82.76
15:07:42.044 -> 84.77 20.5
84.77
410 82.3 355.4
5 14:31:21.617 -> 82.76
14:31:21.617 21.0
82.76
15:07:42.519 -> 84.77 21
84.77
420 69.9 343.0
5 14:31:22.125 -> 82.76
14:31:22.125 21.5
82.76
15:07:43.025 -> 84.77 21.5
84.77
430 69.5 342.6
5 14:31:22.631 -> 81.75
14:31:22.631 22.0
81.75
15:07:43.535 -> 84.77 22
84.77
440 69.1 342.2
5 14:31:23.136 -> 82.76
14:31:23.136 22.5
82.76
15:07:44.009 -> 83.77 22.5
83.77
450 68.9 342.0
5 14:31:23.644 -> 82.76
14:31:23.644 23.0
82.76
15:07:44.523 -> 84.77 23
84.77
460 68.5 341.6
5 14:31:24.152 -> 82.76
14:31:24.152 23.5
82.76
15:07:45.030 -> 84.77 23.5
84.77
470 68.2 341.3
5 14:31:24.623 -> 81.75
14:31:24.623 24.0
81.75
15:07:45.540 -> 84.77 24
84.77
480 67.8 340.9
5 14:31:25.131 -> 82.76
14:31:25.131 24.5
82.76
15:07:46.042 -> 83.77 24.5
83.77
490 67.5 340.6
5 14:31:25.638 -> 81.75
14:31:25.638 25.0
81.75
15:07:46.520 -> 84.77 25
84.77
500 67.2 340.3
5 14:31:26.144 -> 82.76
14:31:26.144 25.5
82.76
15:07:47.025 -> 83.77 25.5
83.77
510 66.8 339.9
5 14:31:26.651 -> 82.76
14:31:26.651 26.0
82.76
15:07:47.534 -> 84.77 26
84.77
520 66.5 339.6
5 14:31:27.156 -> 82.76
14:31:27.156 26.5
82.76
15:07:48.041 -> 84.77 26.5
84.77
530 66.1 339.2
5 14:31:27.628 -> 82.76
14:31:27.628 27.0
82.76
15:07:48.548 -> 84.77 27
84.77
540 65.8 338.9
5 14:31:28.135 -> 81.75
14:31:28.135 27.5
81.75
15:07:49.023 -> 84.77 27.5
84.77
550 65.5 338.6
5 14:31:28.645 -> 82.76
14:31:28.645 28.0
82.76
15:07:49.531 -> 83.77 28
83.77
560 65.1 338.2
5 14:31:29.147 -> 82.76
14:31:29.147 28.5
82.76
15:07:50.044 -> 83.77 28.5
83.77
570 64.8 337.9
5 14:31:29.653 -> 81.75
14:31:29.653 29.0
81.75
15:07:50.548 -> 83.77 29
83.77
580 64.5 337.6
5 14:31:30.159 -> 81.75
14:31:30.159 29.5
81.75
15:07:51.019 -> 84.77 29.5
84.77

74
590 64.2 337.3
5 14:31:30.630 -> 82.76
14:31:30.630 30.0
82.76
15:07:51.526 -> 84.77 30
84.77
600 63.9 337.0
5 14:31:31.137 -> 81.75
14:31:31.137 30.5
81.75
15:07:52.033 -> 83.77 30.5
83.77
610 63.6 336.7
5 14:31:31.643 -> 81.75
14:31:31.643 31.0
81.75
15:07:52.544 -> 83.77 31
83.77
620 63.3 336.4
5 14:31:32.149 -> 81.75
14:31:32.149 31.5
81.75
15:07:53.021 -> 83.77 31.5
83.77
630 63 336.1
5 14:31:32.655 -> 80.74
14:31:32.655 32.0
80.74
15:07:53.528 -> 84.77 32
84.77
640 62.7 335.8
5 14:31:33.136 -> 81.75
14:31:33.136 32.5
81.75
15:07:54.039 -> 83.77 32.5
83.77
650 62.5 335.6
5 14:31:33.646 -> 81.75
14:31:33.646 33.0
81.75
15:07:54.552 -> 83.77 33
83.77
660 62.2 335.3
5 14:31:34.154 -> 81.75
14:31:34.154 33.5
81.75
15:07:55.028 -> 83.77 33.5
83.77
670 61.9 335.0
5 14:31:34.662 -> 81.75
14:31:34.662 34.0
81.75
15:07:55.534 -> 83.77 34
83.77
680 61.6 334.7
5 14:31:35.140 -> 81.75
14:31:35.140 34.5
81.75
15:07:56.043 -> 83.77 34.5
83.77
690 61.3 334.4
5 14:31:35.653 -> 81.75
14:31:35.653 35.0
81.75
15:07:56.547 -> 83.77 35
83.77
700 61 334.1
5 14:31:36.160 -> 81.75
14:31:36.160 35.5
81.75
15:07:57.058 -> 83.77 35.5
83.77
710 60.7 333.8
5 14:31:36.638 -> 81.75
14:31:36.638 36.0
81.75
15:07:57.528 -> 82.76 36
82.76
720 60.4 333.5
5 14:31:37.145 -> 81.75
14:31:37.145 36.5
81.75
15:07:58.040 -> 83.77 36.5
83.77
730 60.1 333.2
5 14:31:37.653 -> 81.75
14:31:37.653 37.0
81.75
15:07:58.546 -> 83.77 37
83.77
740 59.9 333.0
5 14:31:38.161 -> 80.74
14:31:38.161 37.5
80.74
15:07:59.051 -> 83.77 37.5
83.77
750 59.6 332.7
5 14:31:38.664 -> 81.75
14:31:38.664 38.0
81.75
15:07:59.559 -> 82.76 38
82.76
760 59.3 332.4
5 14:31:39.171 -> 80.74
14:31:39.171 38.5
80.74
15:08:00.035 -> 83.77 38.5
83.77
770 59.1 332.2
5 14:31:39.643 -> 81.75
14:31:39.643 39.0
81.75
15:08:00.548 -> 83.77 39
83.77
780 58.8 331.9
5 14:31:40.149 -> 81.75
14:31:40.149 39.5
81.75
15:08:01.056 -> 83.77 39.5
83.77
790 58.5 331.6
5 14:31:40.660 -> 81.75
14:31:40.660 40.0
81.75
15:08:01.537 -> 82.76 40
82.76

75
250mL Beaker, All Trials
Time - degrees C
Time from start (s)
Temp (oC)
Time - degrees C
Time from start (s)
Temp (C)
Time - degrees C
Time from start (s)
Temp (C)
15:52:36.400 -> 83.77 0 83.77
16:32:58.269 -> 83.77 0 83.77
13:32:39.254 -> 90.82 0 90.82
15:52:36.907 -> 83.77 0.5006495 83.77
16:33:00.273 -> 83.77 2 83.77
13:32:41.250 -> 90.82 2 90.82
15:52:37.385 -> 83.77 1.001299 83.77
16:33:02.266 -> 84.77 4 84.77
13:32:43.246 -> 90.82 4 90.82
15:52:37.892 -> 83.77 1.5019485 83.77
16:33:04.272 -> 84.77 6 84.77
13:32:45.243 -> 89.81 6 89.81
15:52:38.394 -> 83.77 2.002598 83.77
16:33:06.243 -> 84.77 8 84.77
13:32:47.235 -> 89.81 8 89.81
15:52:38.901 -> 83.77 2.5032475 83.77
16:33:08.270 -> 83.77 10 83.77
13:32:49.235 -> 89.81 10 89.81
15:52:39.407 -> 83.77 3.003897 83.77
16:33:10.263 -> 83.77 12 83.77
13:32:51.248 -> 89.81 12 89.81
15:52:39.911 -> 83.77 3.5045465 83.77
16:33:12.260 -> 83.77 14 83.77
13:32:53.247 -> 88.81 14 88.81
15:52:40.417 -> 83.77 4.005196 83.77
16:33:14.263 -> 83.77 16 83.77
13:32:55.245 -> 89.81 16 89.81
15:52:40.891 -> 82.76 4.5058455 82.76
16:33:16.269 -> 83.77 18 83.77
13:32:57.255 -> 89.81 18 89.81
15:52:41.399 -> 83.77 5.006495 83.77
16:33:18.270 -> 84.77 20 84.77
13:32:59.252 -> 89.81 20 89.81
15:52:41.906 -> 83.77 5.5071445 83.77
16:33:20.268 -> 83.77 22 83.77
13:33:01.264 -> 88.81 22 88.81
15:52:42.417 -> 83.77 6.007794 83.77
16:33:22.266 -> 83.77 24 83.77
13:33:03.241 -> 88.81 24 88.81
15:52:42.891 -> 83.77 6.5084435 83.77
16:33:24.260 -> 83.77 26 83.77
13:33:05.245 -> 89.81 26 89.81
15:52:43.399 -> 83.77 7.009093 83.77
16:33:26.264 -> 83.77 28 83.77
13:33:07.252 -> 89.81 28 89.81
15:52:43.904 -> 83.77 7.5097425 83.77
16:33:28.270 -> 82.76 30 82.76
13:33:09.254 -> 88.81 30 88.81
15:52:44.417 -> 83.77 8.010392 83.77
16:33:30.288 -> 82.76 32 82.76
13:33:11.260 -> 88.81 32 88.81
15:52:44.891 -> 83.77 8.5110415 83.77
16:33:32.265 -> 83.77 34 83.77
13:33:13.258 -> 88.81 34 88.81
15:52:45.400 -> 83.77 9.011691 83.77
16:33:34.276 -> 83.77 36 83.77
13:33:15.253 -> 88.81 36 88.81

76
15:52:45.907 -> 83.77 9.5123405 83.77
16:33:36.278 -> 83.77 38 83.77
13:33:17.258 -> 88.81 38 88.81
15:52:46.415 -> 82.76 10.01299 82.76
16:33:38.276 -> 82.76 40 82.76
13:33:19.265 -> 88.81 40 88.81
15:52:46.923 -> 83.77 10.5136395 83.77
16:33:40.268 -> 82.76 42 82.76
13:33:21.273 -> 87.80 42 87.80
15:52:47.395 -> 83.77 11.014289 83.77
16:33:42.267 -> 82.76 44 82.76
13:33:23.261 -> 87.80 44 87.80
15:52:47.906 -> 83.77 11.5149385 83.77
16:33:44.268 -> 82.76 46 82.76
13:33:25.261 -> 87.80 46 87.80
15:52:48.412 -> 83.77 12.015588 83.77
16:33:46.276 -> 82.76 48 82.76
13:33:27.260 -> 87.80 48 87.80
15:52:48.919 -> 83.77 12.5162375 83.77
16:33:48.272 -> 82.76 50 82.76
13:33:29.274 -> 87.80 50 87.80
15:52:49.397 -> 83.77 13.016887 83.77
16:33:50.267 -> 82.76 52 82.76
13:33:31.262 -> 87.80 52 87.80
15:52:49.904 -> 83.77 13.5175365 83.77
16:33:52.262 -> 82.76 54 82.76
13:33:33.274 -> 86.79 54 86.79
15:52:50.415 -> 82.76 14.018186 82.76
16:33:54.267 -> 81.75 56 81.75
13:33:35.249 -> 87.80 56 87.80
15:52:50.920 -> 82.76 14.5188355 82.76
16:33:56.263 -> 82.76 58 82.76
13:33:37.263 -> 87.80 58 87.80
15:52:51.425 -> 82.76 15.019485 82.76
16:33:58.289 -> 81.75 60 81.75
13:33:39.275 -> 86.79 60 86.79
15:52:51.903 -> 83.77 15.5201345 83.77
16:34:00.288 -> 81.75 62 81.75
13:33:41.255 -> 86.79 62 86.79
15:52:52.409 -> 83.77 16.020784 83.77
16:34:02.288 -> 81.75 64 81.75
13:33:43.259 -> 86.79 64 86.79
15:52:52.920 -> 82.76 16.5214335 82.76
16:34:04.292 -> 80.74 66 80.74
13:33:45.253 -> 86.79 66 86.79
15:52:53.425 -> 82.76 17.022083 82.76
16:34:06.300 -> 80.74 68 80.74
13:33:47.258 -> 86.79 68 86.79
15:52:53.936 -> 82.76 17.5227325 82.76
16:34:08.268 -> 80.74 70 80.74
13:33:49.256 -> 86.79 70 86.79
15:52:54.411 -> 82.76 18.023382 82.76
16:34:10.270 -> 81.75 72 81.75
13:33:51.264 -> 85.78 72 85.78
15:52:54.924 -> 82.76 18.5240315 82.76
16:34:12.275 -> 81.75 74 81.75
13:33:53.287 -> 85.78 74 85.78
15:52:55.426 -> 82.76 19.024681 82.76
16:34:14.273 -> 81.75 76 81.75
13:33:55.258 -> 86.79 76 86.79
15:52:55.933 -> 82.76 19.5253305 82.76
16:34:16.298 -> 80.74 78 80.74
13:33:57.263 -> 85.78 78 85.78
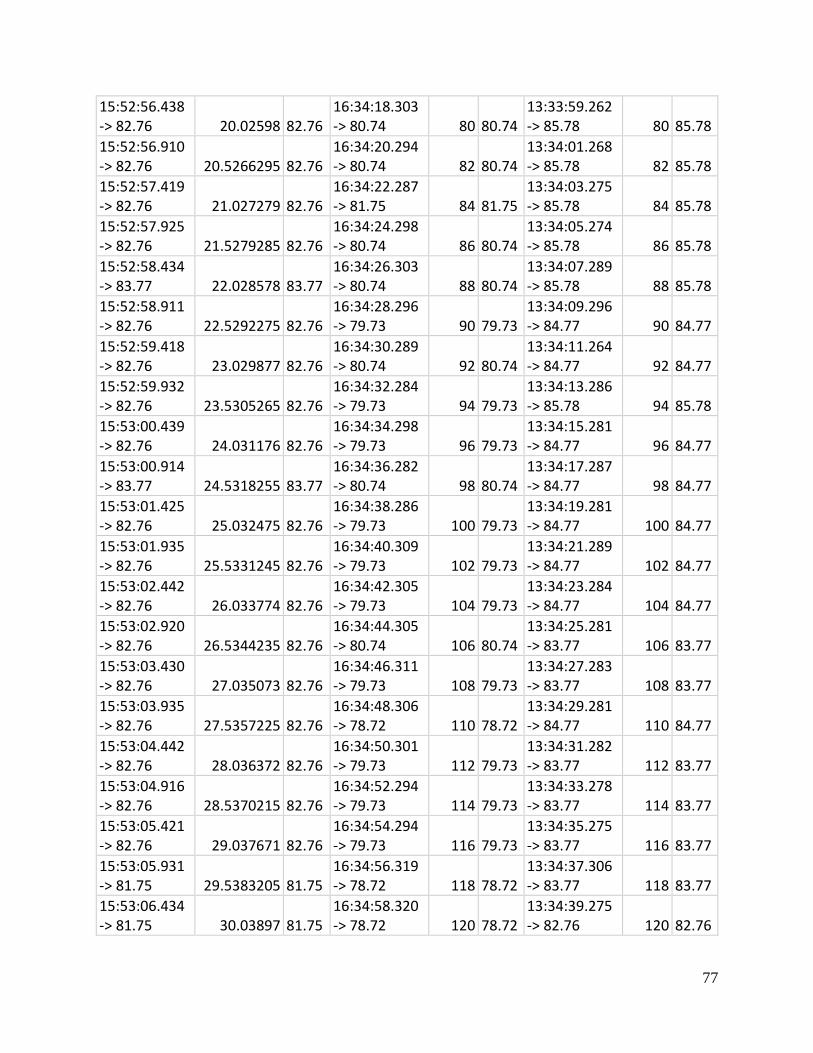
77
15:52:56.438 -> 82.76 20.02598 82.76
16:34:18.303 -> 80.74 80 80.74
13:33:59.262 -> 85.78 80 85.78
15:52:56.910 -> 82.76 20.5266295 82.76
16:34:20.294 -> 80.74 82 80.74
13:34:01.268 -> 85.78 82 85.78
15:52:57.419 -> 82.76 21.027279 82.76
16:34:22.287 -> 81.75 84 81.75
13:34:03.275 -> 85.78 84 85.78
15:52:57.925 -> 82.76 21.5279285 82.76
16:34:24.298 -> 80.74 86 80.74
13:34:05.274 -> 85.78 86 85.78
15:52:58.434 -> 83.77 22.028578 83.77
16:34:26.303 -> 80.74 88 80.74
13:34:07.289 -> 85.78 88 85.78
15:52:58.911 -> 82.76 22.5292275 82.76
16:34:28.296 -> 79.73 90 79.73
13:34:09.296 -> 84.77 90 84.77
15:52:59.418 -> 82.76 23.029877 82.76
16:34:30.289 -> 80.74 92 80.74
13:34:11.264 -> 84.77 92 84.77
15:52:59.932 -> 82.76 23.5305265 82.76
16:34:32.284 -> 79.73 94 79.73
13:34:13.286 -> 85.78 94 85.78
15:53:00.439 -> 82.76 24.031176 82.76
16:34:34.298 -> 79.73 96 79.73
13:34:15.281 -> 84.77 96 84.77
15:53:00.914 -> 83.77 24.5318255 83.77
16:34:36.282 -> 80.74 98 80.74
13:34:17.287 -> 84.77 98 84.77
15:53:01.425 -> 82.76 25.032475 82.76
16:34:38.286 -> 79.73 100 79.73
13:34:19.281 -> 84.77 100 84.77
15:53:01.935 -> 82.76 25.5331245 82.76
16:34:40.309 -> 79.73 102 79.73
13:34:21.289 -> 84.77 102 84.77
15:53:02.442 -> 82.76 26.033774 82.76
16:34:42.305 -> 79.73 104 79.73
13:34:23.284 -> 84.77 104 84.77
15:53:02.920 -> 82.76 26.5344235 82.76
16:34:44.305 -> 80.74 106 80.74
13:34:25.281 -> 83.77 106 83.77
15:53:03.430 -> 82.76 27.035073 82.76
16:34:46.311 -> 79.73 108 79.73
13:34:27.283 -> 83.77 108 83.77
15:53:03.935 -> 82.76 27.5357225 82.76
16:34:48.306 -> 78.72 110 78.72
13:34:29.281 -> 84.77 110 84.77
15:53:04.442 -> 82.76 28.036372 82.76
16:34:50.301 -> 79.73 112 79.73
13:34:31.282 -> 83.77 112 83.77
15:53:04.916 -> 82.76 28.5370215 82.76
16:34:52.294 -> 79.73 114 79.73
13:34:33.278 -> 83.77 114 83.77
15:53:05.421 -> 82.76 29.037671 82.76
16:34:54.294 -> 79.73 116 79.73
13:34:35.275 -> 83.77 116 83.77
15:53:05.931 -> 81.75 29.5383205 81.75
16:34:56.319 -> 78.72 118 78.72
13:34:37.306 -> 83.77 118 83.77
15:53:06.434 -> 81.75 30.03897 81.75
16:34:58.320 -> 78.72 120 78.72
13:34:39.275 -> 82.76 120 82.76

78
15:53:06.942 -> 81.75 30.5396195 81.75
16:35:00.319 -> 79.73 122 79.73
13:34:41.284 -> 83.77 122 83.77
15:53:07.449 -> 81.75 31.040269 81.75
16:35:02.317 -> 78.72 124 78.72
13:34:43.273 -> 82.76 124 82.76
15:53:07.925 -> 81.75 31.5409185 81.75
16:35:04.313 -> 78.72 126 78.72
13:34:45.286 -> 82.76 126 82.76
15:53:08.435 -> 81.75 32.041568 81.75
16:35:06.308 -> 78.72 128 78.72
13:34:47.291 -> 82.76 128 82.76
15:53:08.941 -> 82.76 32.5422175 82.76
16:35:08.304 -> 78.72 130 78.72
13:34:49.289 -> 82.76 130 82.76

79
250mL Plastic Bottle
Time - degrees C
Time from start (s)
Temp (oC)
Time - degrees C
Time from start (s)
Temp (oC)
Time - degrees C
Time from start (s)
Temp (oC)
14:24:01.586 -> 65.62 0 65.62
14:58:42.797 -> 80.74 0 80.74
15:34:45.263 -> 75.70 75.70
14:24:03.581 -> 65.62 2 65.62
14:58:44.790 -> 80.74 2 80.74
15:34:47.257 -> 75.70 75.70
14:24:05.582 -> 64.61 4 64.61
14:58:46.809 -> 80.74 4 80.74
15:34:49.252 -> 75.70 75.70
14:24:07.584 -> 65.62 6 65.62
14:58:48.811 -> 80.74 6 80.74
15:34:51.254 -> 76.71 0 76.71
14:24:09.561 -> 65.62 8 65.62
14:58:50.815 -> 80.74 8 80.74
15:34:53.269 -> 75.70 2 75.70
14:24:11.570 -> 64.61 10 64.61
14:58:52.794 -> 80.74 10 80.74
15:34:55.272 -> 76.71 4 76.71
14:24:13.572 -> 64.61 12 64.61
14:58:54.797 -> 79.73 12 79.73
15:34:57.275 -> 75.70 6 75.70
14:24:15.562 -> 64.61 14 64.61
14:58:56.799 -> 80.74 14 80.74
15:34:59.273 -> 75.70 8 75.70
14:24:17.560 -> 64.61 16 64.61
14:58:58.810 -> 79.73 16 79.73
15:35:01.283 -> 74.69 10 74.69
14:24:19.570 -> 64.61 18 64.61
14:59:00.814 -> 80.74 18 80.74
15:35:03.264 -> 74.69 12 74.69
14:24:21.576 -> 63.60 20 63.60
14:59:02.797 -> 79.73 20 79.73
15:35:05.260 -> 75.70 14 75.70
14:24:23.582 -> 64.61 22 64.61
14:59:04.803 -> 79.73 22 79.73
15:35:07.267 -> 75.70 16 75.70
14:24:25.580 -> 63.60 24 63.60
14:59:06.801 -> 79.73 24 79.73
15:35:09.268 -> 74.69 18 74.69
14:24:27.583 -> 64.61 26 64.61
14:59:08.799 -> 79.73 26 79.73
15:35:11.294 -> 75.70 20 75.70
14:24:29.586 -> 64.61 28 64.61
14:59:10.825 -> 79.73 28 79.73
15:35:13.278 -> 74.69 22 74.69
14:24:31.601 -> 64.61 30 64.61
14:59:12.823 -> 79.73 30 79.73
15:35:15.265 -> 75.70 24 75.70
14:24:33.574 -> 64.61 32 64.61
14:59:14.818 -> 79.73 32 79.73
15:35:17.272 -> 74.69 26 74.69
14:24:35.594 -> 64.61 34 64.61
14:59:16.828 -> 79.73 34 79.73
15:35:19.272 -> 75.70 28 75.70
14:24:37.594 -> 63.60 36 63.60
14:59:18.826 -> 79.73 36 79.73
15:35:21.273 -> 74.69 30 74.69

80
14:24:39.575 -> 64.61 38 64.61
14:59:20.824 -> 78.72 38 78.72
15:35:23.285 -> 75.70 32 75.70
14:24:41.602 -> 64.61 40 64.61
14:59:22.829 -> 78.72 40 78.72
15:35:25.268 -> 74.69 34 74.69
14:24:43.580 -> 63.60 42 63.60
14:59:24.829 -> 78.72 42 78.72
15:35:27.298 -> 74.69 36 74.69
14:24:45.594 -> 63.60 44 63.60
14:59:26.829 -> 78.72 44 78.72
15:35:29.269 -> 74.69 38 74.69
14:24:47.594 -> 63.60 46 63.60
14:59:28.830 -> 78.72 46 78.72
15:35:31.271 -> 73.68 40 73.68
14:24:49.605 -> 63.60 48 63.60
14:59:30.828 -> 79.73 48 79.73
15:35:33.275 -> 74.69 42 74.69
14:24:51.584 -> 63.60 50 63.60
14:59:32.825 -> 78.72 50 78.72
15:35:35.304 -> 73.68 44 73.68
14:24:53.599 -> 63.60 52 63.60
14:59:34.824 -> 78.72 52 78.72
15:35:37.306 -> 74.69 46 74.69
14:24:55.587 -> 63.60 54 63.60
14:59:36.818 -> 78.72 54 78.72
15:35:39.277 -> 73.68 48 73.68
14:24:57.610 -> 63.60 56 63.60
14:59:38.827 -> 78.72 56 78.72
15:35:41.286 -> 74.69 50 74.69
14:24:59.579 -> 63.60 58 63.60
14:59:40.819 -> 77.72 58 77.72
15:35:43.285 -> 73.68 52 73.68
14:25:01.597 -> 63.60 60 63.60
14:59:42.827 -> 77.72 60 77.72
15:35:45.280 -> 73.68 54 73.68
14:25:03.604 -> 63.60 62 63.60
14:59:44.824 -> 77.72 62 77.72
15:35:47.281 -> 73.68 56 73.68
14:25:05.613 -> 63.60 64 63.60
14:59:46.835 -> 77.72 64 77.72
15:35:49.285 -> 73.68 58 73.68
14:25:07.587 -> 63.60 66 63.60
14:59:48.837 -> 77.72 66 77.72
15:35:51.294 -> 73.68 60 73.68
14:25:09.602 -> 63.60 68 63.60
14:59:50.837 -> 77.72 68 77.72
15:35:53.298 -> 72.68 62 72.68
14:25:11.607 -> 63.60 70 63.60
14:59:52.848 -> 77.72 70 77.72
15:35:55.301 -> 73.68 64 73.68
14:25:13.604 -> 63.60 72 63.60
14:59:54.843 -> 77.72 72 77.72
15:35:57.292 -> 73.68 66 73.68
14:25:15.597 -> 63.60 74 63.60
14:59:56.836 -> 77.72 74 77.72
15:35:59.286 -> 72.68 68 72.68
14:25:17.590 -> 62.60 76 62.60
14:59:58.833 -> 77.72 76 77.72
15:36:01.297 -> 73.68 70 73.68
14:25:19.587 -> 62.60 78 62.60
15:00:00.827 -> 76.71 78 76.71
15:36:03.315 -> 73.68 72 73.68

81
14:25:21.603 -> 62.60 80 62.60
15:00:02.836 -> 76.71 80 76.71
15:36:05.309 -> 72.68 74 72.68
14:25:23.609 -> 62.60 82 62.60
15:00:04.842 -> 76.71 82 76.71
15:36:07.316 -> 73.68 76 73.68
14:25:25.600 -> 62.60 84 62.60
15:00:06.840 -> 76.71 84 76.71
15:36:09.318 -> 72.68 78 72.68
14:25:27.609 -> 62.60 86 62.60
15:00:08.845 -> 76.71 86 76.71
15:36:11.314 -> 72.68 80 72.68
14:25:29.614 -> 62.60 88 62.60
15:00:10.823 -> 76.71 88 76.71
15:36:13.289 -> 73.68 82 73.68
14:25:31.598 -> 62.60 90 62.60
15:00:12.842 -> 76.71 90 76.71
15:36:15.297 -> 72.68 84 72.68
14:25:33.594 -> 62.60 92 62.60
15:00:14.846 -> 76.71 92 76.71
15:36:17.298 -> 72.68 86 72.68
14:25:35.595 -> 62.60 94 62.60
15:00:16.844 -> 76.71 94 76.71
15:36:19.307 -> 72.68 88 72.68
14:25:37.619 -> 62.60 96 62.60
15:00:18.852 -> 76.71 96 76.71
15:36:21.312 -> 71.67 90 71.67
14:25:39.610 -> 62.60 98 62.60
15:00:20.829 -> 76.71 98 76.71
15:36:23.293 -> 72.68 92 72.68
14:25:41.617 -> 62.60 100 62.60
15:00:22.837 -> 75.70 100 75.70
15:36:25.322 -> 72.68 94 72.68
14:25:43.610 -> 62.60 102 62.60
15:00:24.833 -> 76.71 102 76.71
15:36:27.326 -> 72.68 96 72.68
14:25:45.619 -> 62.60 104 62.60
15:00:26.828 -> 76.71 104 76.71
15:36:29.326 -> 72.68 98 72.68
14:25:47.609 -> 61.59 106 61.59
15:00:28.861 -> 75.70 106 75.70
15:36:31.322 -> 71.67 100 71.67
14:25:49.609 -> 61.59 108 61.59
15:00:30.836 -> 75.70 108 75.70
15:36:33.329 -> 71.67 102 71.67
14:25:51.612 -> 61.59 110 61.59
15:00:32.849 -> 75.70 110 75.70
15:36:35.299 -> 71.67 104 71.67
14:25:53.611 -> 62.60 112 62.60
15:00:34.864 -> 75.70 112 75.70
15:36:37.331 -> 71.67 106 71.67
14:25:55.619 -> 62.60 114 62.60
15:00:36.853 -> 75.70 114 75.70
15:36:39.326 -> 71.67 108 71.67
14:25:57.617 -> 61.59 116 61.59
15:00:38.860 -> 74.69 116 74.69
15:36:41.319 -> 71.67 110 71.67
14:25:59.635 -> 62.60 118 62.60
15:00:40.861 -> 75.70 118 75.70
15:36:43.326 -> 71.67 112 71.67
14:26:01.622 -> 61.59 120 61.59
15:00:42.838 -> 75.70 120 75.70
15:36:45.331 -> 71.67 114 71.67

82
14:26:03.621 -> 62.60 122 62.60
15:00:44.867 -> 75.70 122 75.70
15:36:47.333 -> 71.67 116 71.67
14:26:05.632 -> 61.59 124 61.59
15:00:46.868 -> 75.70 124 75.70
15:36:49.330 -> 71.67 118 71.67
14:26:07.637 -> 62.60 126 62.60
15:00:48.862 -> 75.70 126 75.70
15:36:51.320 -> 70.66 120 70.66
14:26:09.613 -> 61.59 128 61.59
15:00:50.862 -> 75.70 128 75.70
15:36:53.318 -> 71.67 122 71.67
14:26:11.627 -> 61.59 130 61.59
15:00:52.849 -> 74.69 130 74.69
15:36:55.323 -> 71.67 124 71.67

83
Appendix F. Sample Calculations for Determining the Overall Heat Transfer
Coefficient
For Trial 1, 20mL Beaker
Constants:
Specific Heat of FA (C) = 2.1 J/(g*K)
Density of FA= 1.13g/mL
Data Needed:
Volume (V) of FA Added = 15mL
Diameter of Vessel (D) = 31.23mm
Height of Vessel (H) = 23mm
Temperature vs Time data of the constant cooling or heating of FA
These calculations should be in excel or google sheets. First, we calculated for the y-axis
of the graph. The equation for this axis is
y: axis = ln(𝑇𝑎𝑖𝑟 − 𝑇𝑜
𝑇𝑎𝑖𝑟 − 𝑇)
Tair is the ambient temperature (293.15K), To is the initial temperature of the FA (353.75K), and
T is the temperature of the cooling FA in K. This value should be set up as a column that
corresponds with time. A snip of the excel sheet we used is below.
Figure F-1. Screenshot of Google Sheet, with equations, used to calculate U
Second, we calculated the slope of the y-axis) vs time (x-axis) data. This was done in
excel simply by using the = slope (y-values, x-values). Third, we calculated the mass (m) of FA
by multiplying volume and density. Fourth, we calculated the area (A) of heat transfer. We
assumed that the beaker and the bottle are cylinders with heat transferring out of the sides and
the top; no heat transfer is occurring through the bottom. Be careful to use meters in this
calculation rather than millimeters which is how the data is recorded. A snip of that is included
below.

84
Figure F-2. Area of heat transfer snip
Lastly, to calculate U in units of W/(m2K), we used the following equation.
𝑈 = 𝑠𝑙𝑜𝑝𝑒 ∗ 𝐶 ∗ 𝑚/𝐴 A snip is included below to show this calculation.
Figure F-3. Calculation of U snip
To conclude, we used excel to find standard deviation once we have completed our three
experiments using the =stdev(results of U) function.

85
Appendix G: Mathcad Models and their Informing Experiments
Figure G-1. Experimental and calculated fit temperature profile for the following conditions:
20mL beaker, 10mL recycled FA, 0.2mL of HCl.
Figure G-2. Experimental and calculated fit temperature profile for the following conditions:
20mL beaker, 10mL FA, 0.2mL of HCl.

86
Figure G-3. Experimental and calculated fit temperature profile for the following conditions:
20mL beaker, 10mL FA, 0.1mL of HCl.
Figure G-4. Experimental and calculated fit temperature profile for the following conditions:
20mL beaker, 10mL FA, 0.05mL HCl.

87
Figure G-5. Experimental and calculated fit temperature profile for the following conditions:
50mL beaker, 30mL FA, 0.1mL HCl.
Figure G-6. Experimental and calculated fit temperature profile for the following conditions:
50mL beaker, 30mL FA, 0.2mL HCl.

88
Figure G-7. Experimental and calculated fit temperature profile for the following conditions:
50mL beaker, 30mL FA, 0.3mL HCl.
Figure G-8. Experimental and calculated fit temperature profile for the following conditions:
100mL beaker, 50mL, 0.2mL HCl.

89
Figure G-9. Experimental and calculated fit temperature profile for the following conditions:
100mL beaker, 50mL, 0.15mL HCl.
Figure G-10. Experimental and calculated fit temperature profile for the following conditions:
100mL beaker, 50mL, 0.3mL HCl.
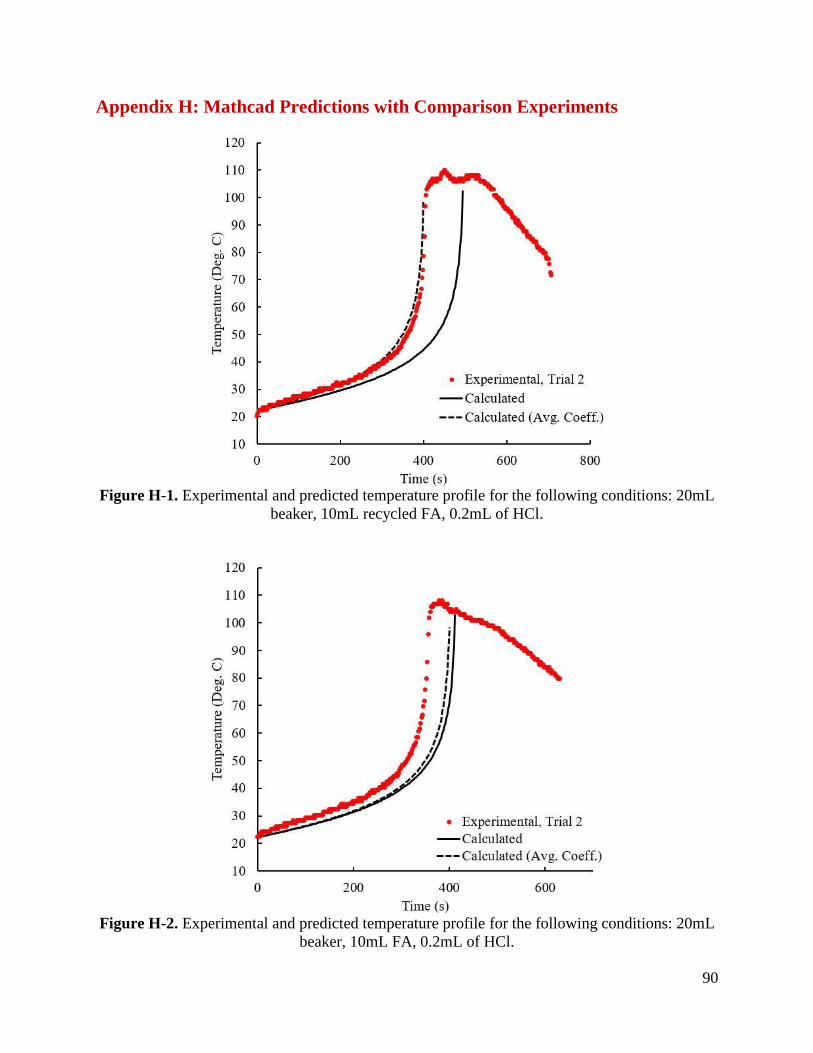
90
Appendix H: Mathcad Predictions with Comparison Experiments
Figure H-1. Experimental and predicted temperature profile for the following conditions: 20mL
beaker, 10mL recycled FA, 0.2mL of HCl.
Figure H-2. Experimental and predicted temperature profile for the following conditions: 20mL
beaker, 10mL FA, 0.2mL of HCl.

91
Figure H-3. Experimental and predicted temperature profile for the following conditions: 20mL
beaker, 10mL FA, 0.1mL of HCl.
Figure H-4. Experimental and predicted temperature profile for the following conditions: 20mL
beaker, 10mL FA, 0.05mL HCl.

92
Figure H-5. Experimental and predicted temperature profile for the following conditions: 50mL
beaker, 30mL FA, 0.1mL HCl.
Figure H-6. Experimental and predicted temperature profile for the following conditions: 50mL
beaker, 30mL FA, 0.2mL HCl.

93
Figure H-7. Experimental and predicted temperature profile for the following conditions: 50mL
beaker, 30mL FA, 0.3mL HCl.
Figure H-8. Experimental and predicted temperature profile for the following conditions:
100mL beaker, 50mL, 0.2mL HCl.

94
Figure H-9. Experimental and predicted temperature profile for the following conditions:
100mL beaker, 50mL, 0.3mL HCl.

95
Appendix I: Mathcad Model of Industrial Incident

96

97


![Benson Lecture Inpla[1] Phil Benson](https://img.pdfslide.net/doc/110x75/5549e849b4c90518488b4ca4/benson-lecture-inpla1-phil-benson.jpg)


![George Benson - The Best of George Benson[1]](https://img.pdfslide.net/doc/110x75/5695cf541a28ab9b028d9c4a/george-benson-the-best-of-george-benson1.jpg)