Embed Size (px)
Citation preview
1
Berkeley Lab Accident Statistics Through June 30, 2012
These slides are updated on a monthly basis as soon as data are reasonably final for the preceding month. Hours worked are estimated monthly and updated with final and actual values quarterly. Every effort is made to present accurate and final data. However, changes may occur in subsequent months as additional information becomes available and as developments change the recordability of some cases. Refer questions about these charts to [email protected]
2
Injury/Illness Cases – June 2012 Ergonomic
• Discomfort in shoulder and spine – The Administrative Assistant reported discomfort associated
with computer workstation use.
• Wrist strain – The Physicist Staff Scientist / Engineer experienced
discomfort and cramping of the wrist associated with a period of intense mouse use.
3
Injury/Illness Cases – June 2012 Trauma
• Tendon strain in right hand finger – The Truck Driver experienced pain in the right hand possibly
associated with use of the split shifter on a large delivery truck.
• Abrasion – The Administrative Assistant’s toes struck the bottom of an
open file cabinet drawer. The employee was wearing open-toed sandals.
4
Injury/Illness Cases – June 2012 Trauma
• Hairline fracture – The Guest Graduate Student Research Assistant suffered a
hairline fracture of the humerus (upper arm bone) while applying moderate force to an allen (hex) wrench.
• Contusion
– The Truck Driver suffered a contusion on the side of the head and minor abrasion of the thumb and index finger while directing a vendor semi truck and trailer into a parking location. The rear wheels of the semi tractor struck and bent over a stop sign which struck the employee.
5
Injury/Illness Cases – June 2012 Laceration / Puncture
• Puncture – The Research Associate was using a scalpel that somehow
caught on the glove and punctured the palm of the right hand.
• Laceration – The Administrative Specialist suffered a small laceration of
thumb while trimming a poster edge using a utility knife against a flat straight edge.
• Laceration – The Guest Student Assistant cut the tip of the index finger
while removing the cardboard protective sleeve from a new single edge razor blade.
6
Injury/Illness Cases – June 2012 Slip / Trip / Fall
• Strained ankle – The Subcontract Administrator turned an ankle while walking
on the paved walkway along McMillan Road. The employee did not fall to the ground.
• Contusions –The Mechanical Engineering Technician slipped while carrying
a four pound object down a set of metal stairs in Building 88. The employee was holding the handrail with the free hand but fell backward striking the thigh, elbow, hand, and head.
7
8
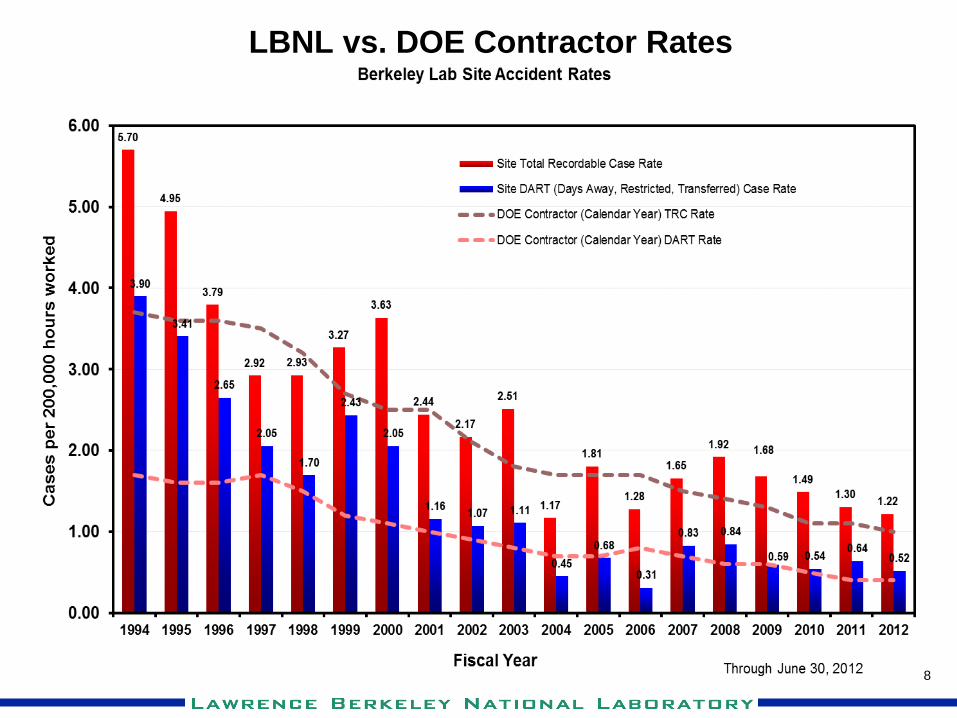
LBNL vs. DOE Contractor Rates
9
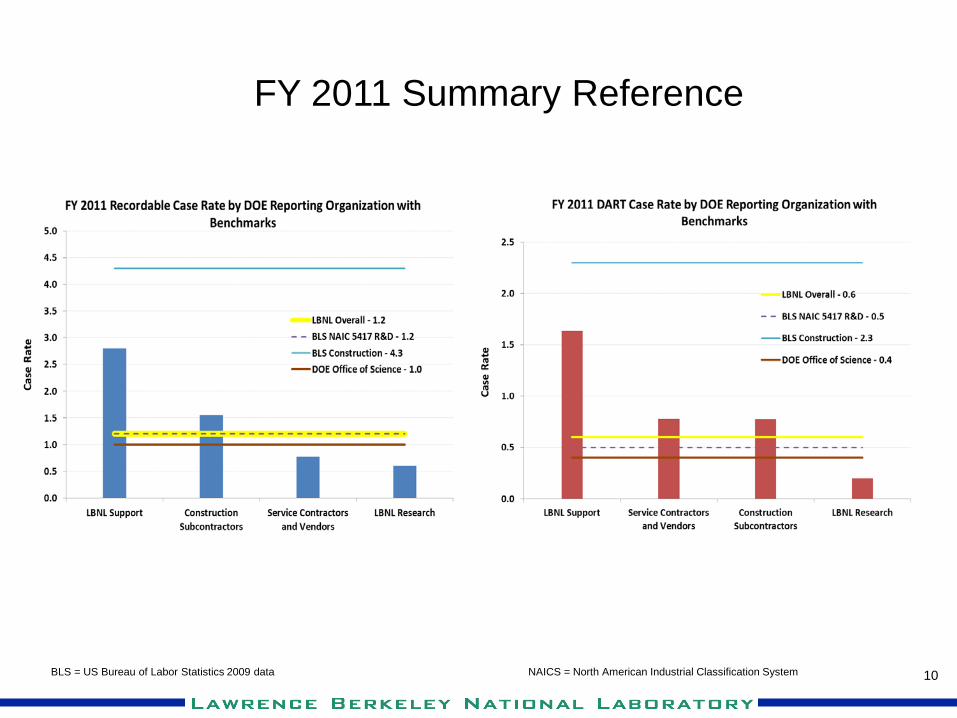
10 BLS = US Bureau of Labor Statistics 2009 data NAICS = North American Industrial Classification System
FY 2011 Summary Reference
11
12
13
14
15
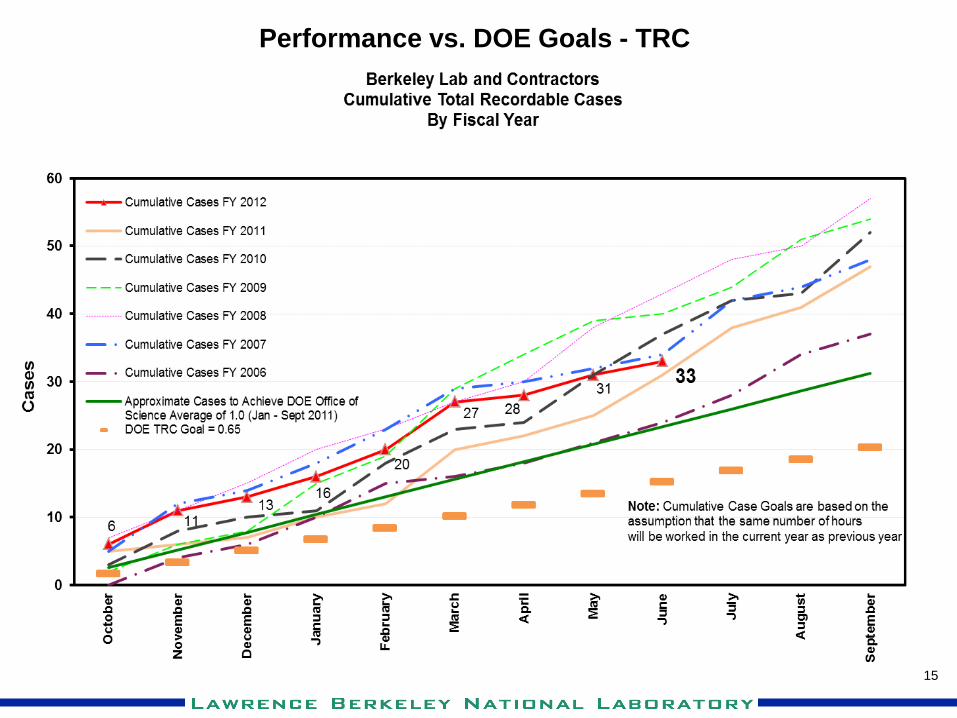
Performance vs. DOE Goals - TRC
16
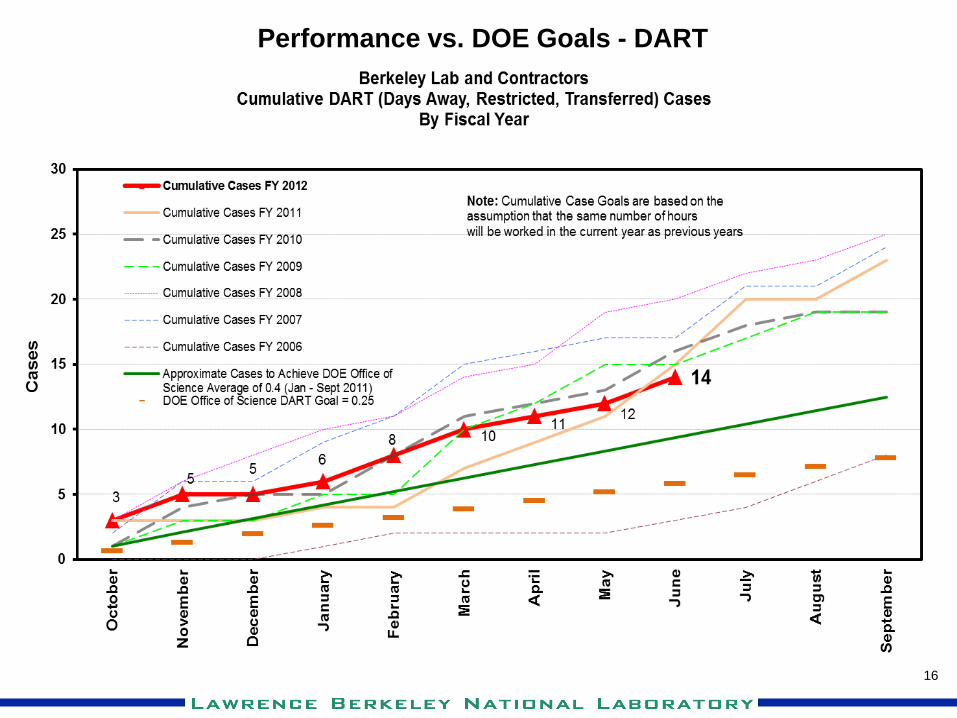
Performance vs. DOE Goals - DART
17
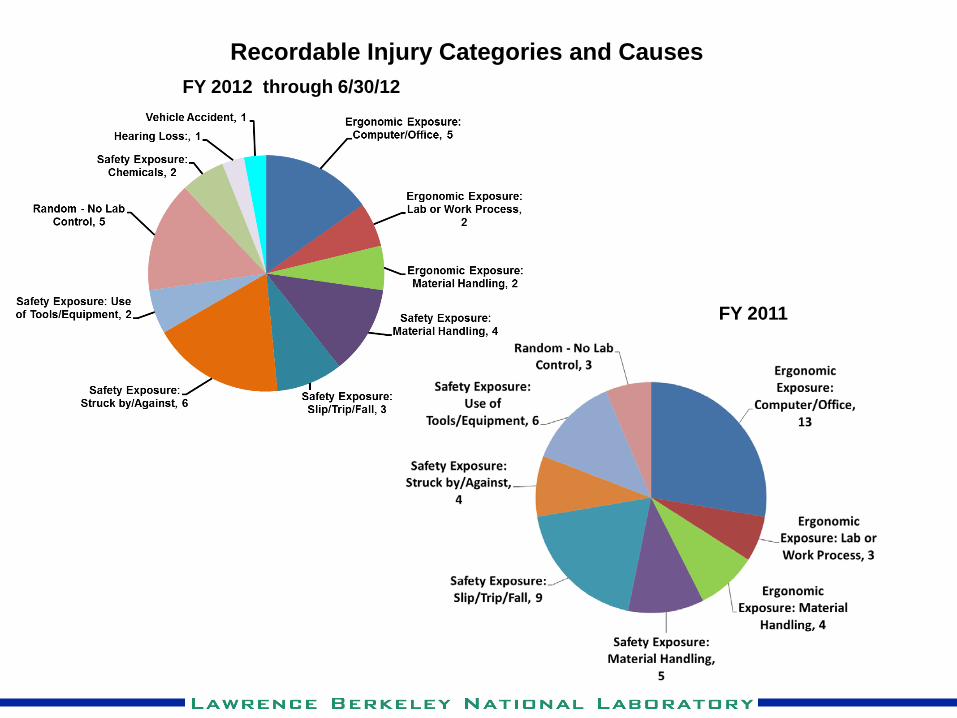
Recordable Injury Categories and Causes FY 2012 through 6/30/12
FY 2011
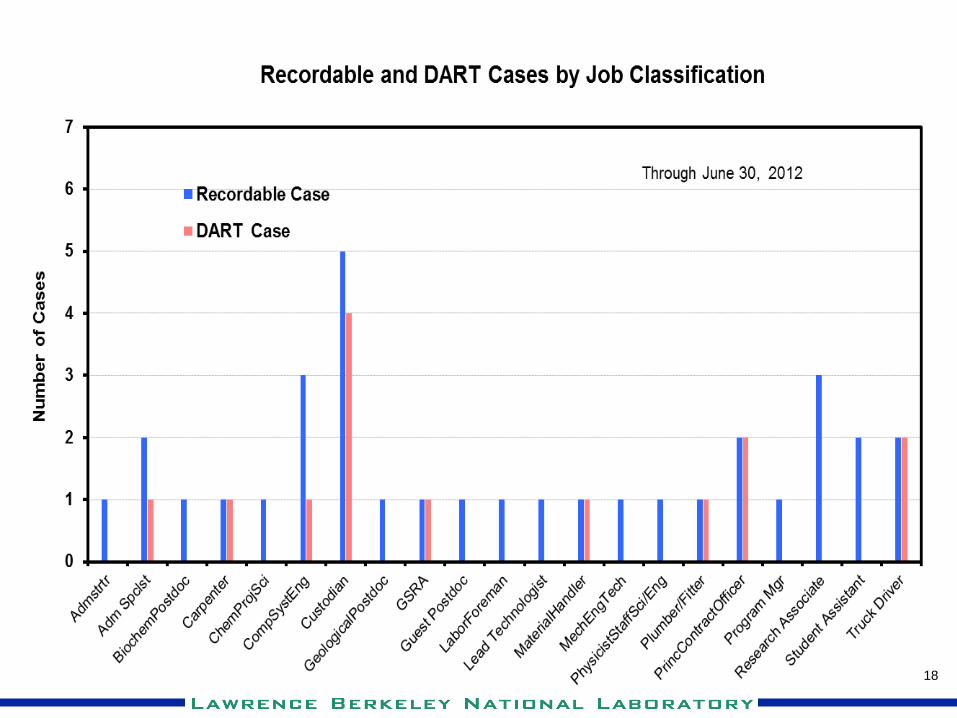
18
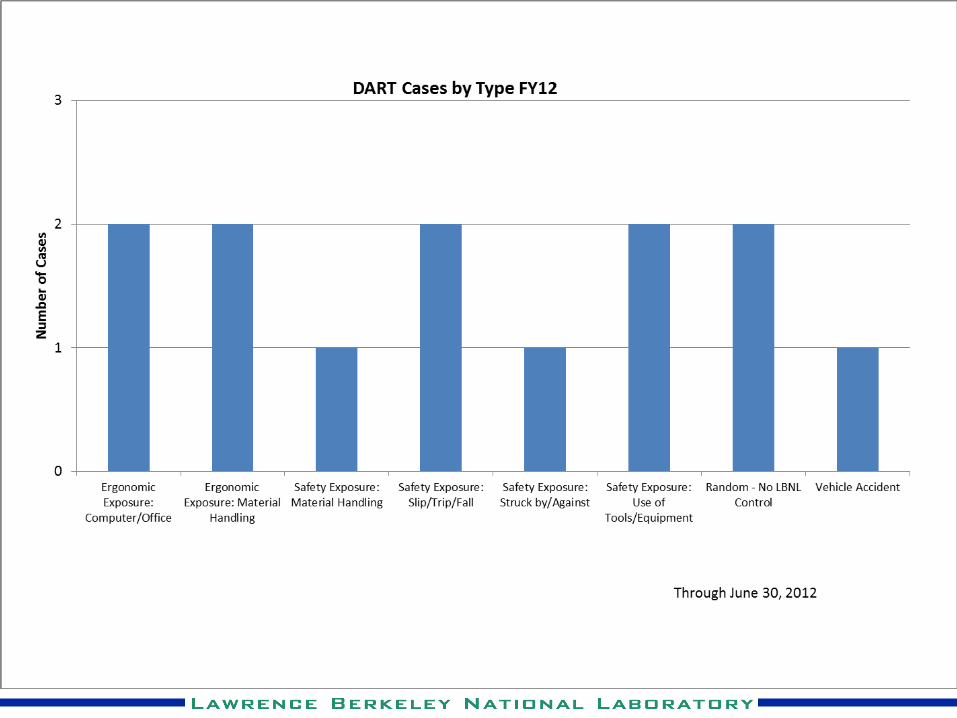
19
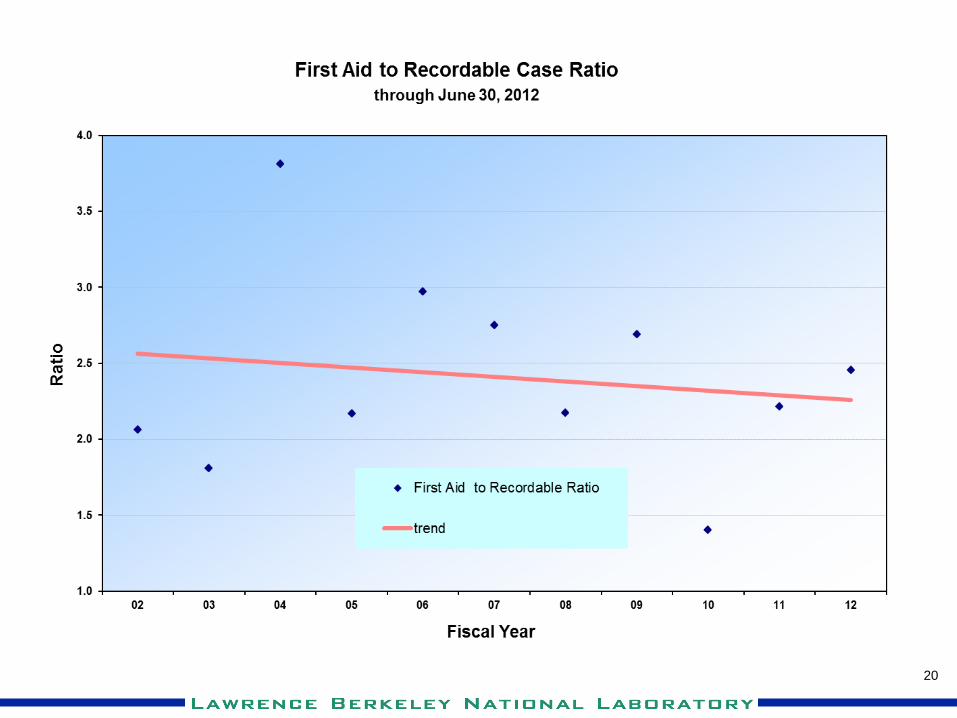
20
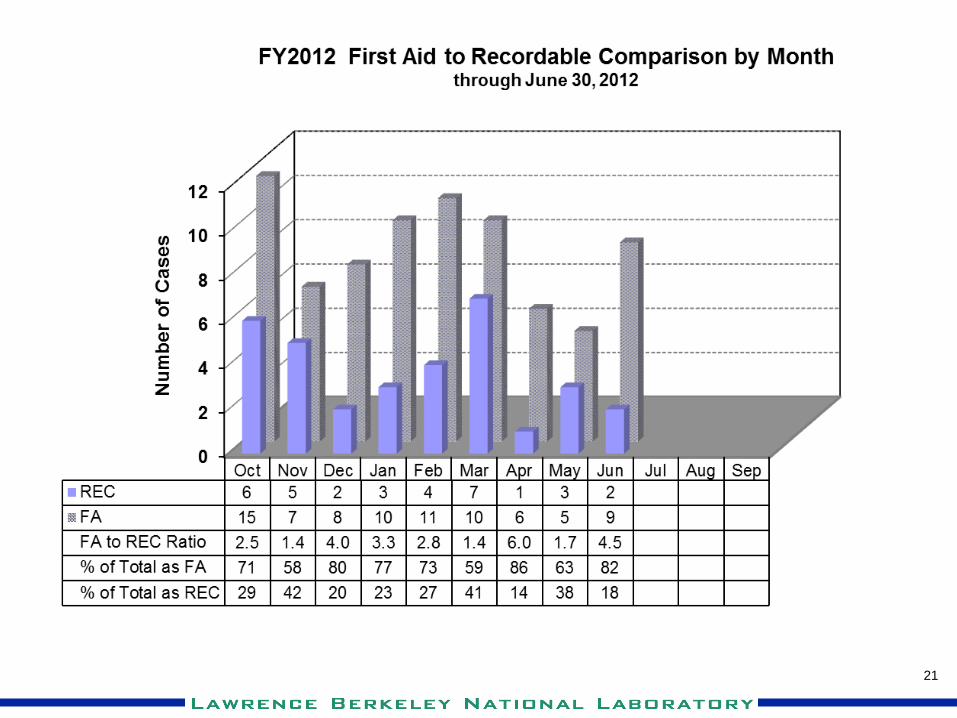
21
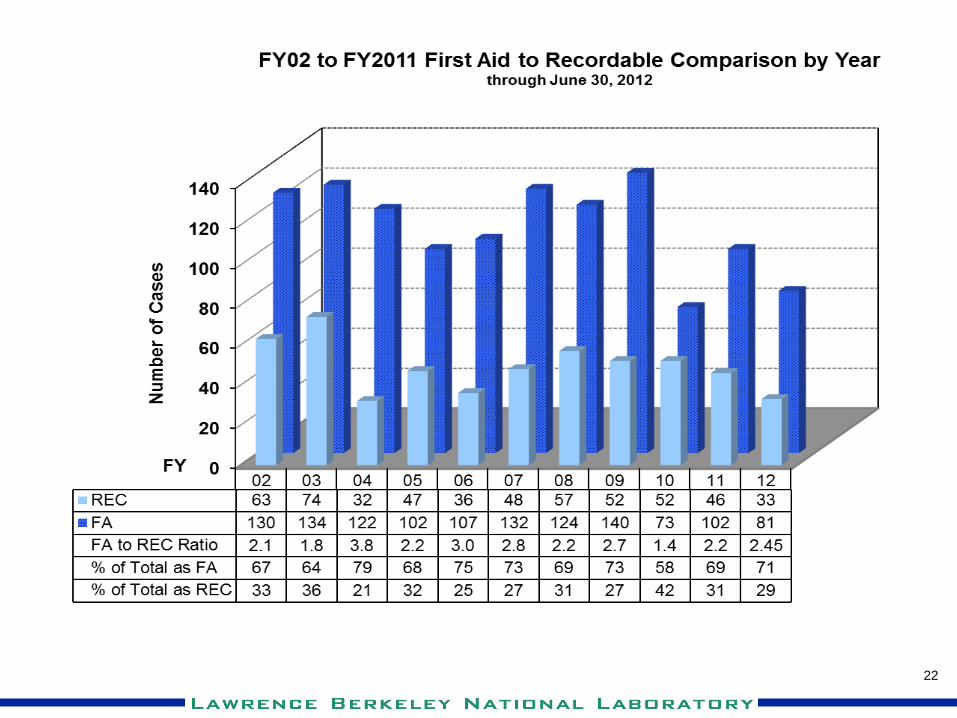
22
23
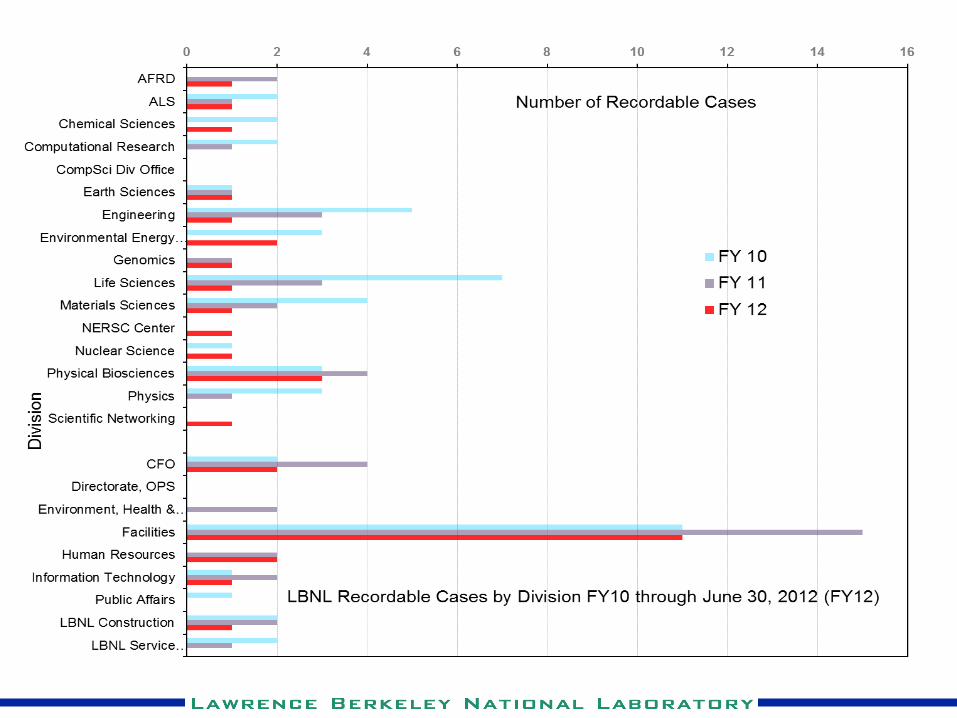
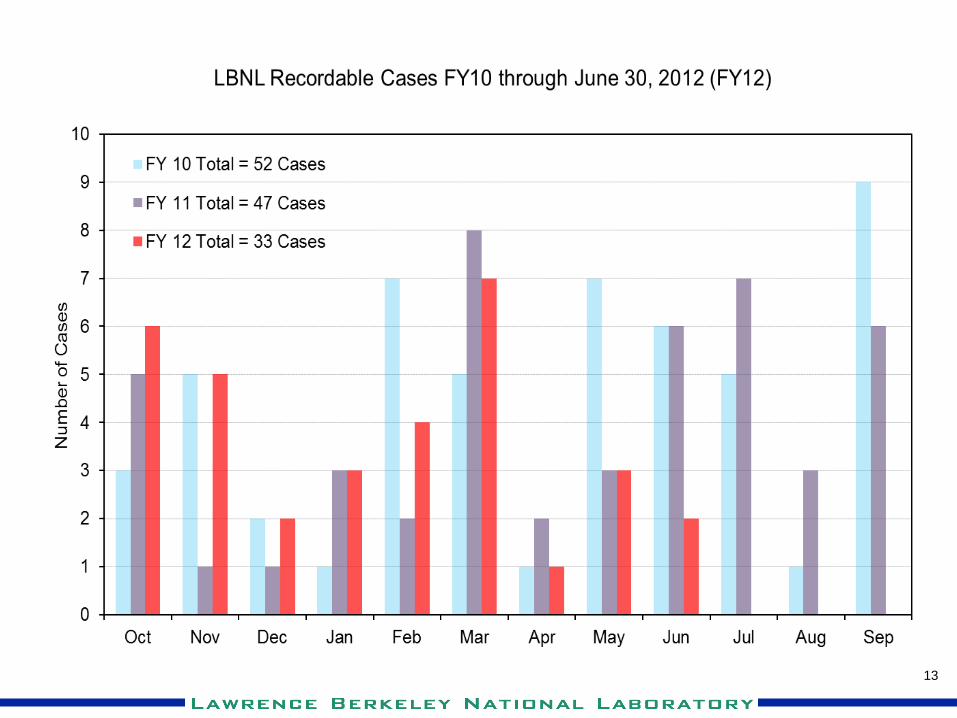
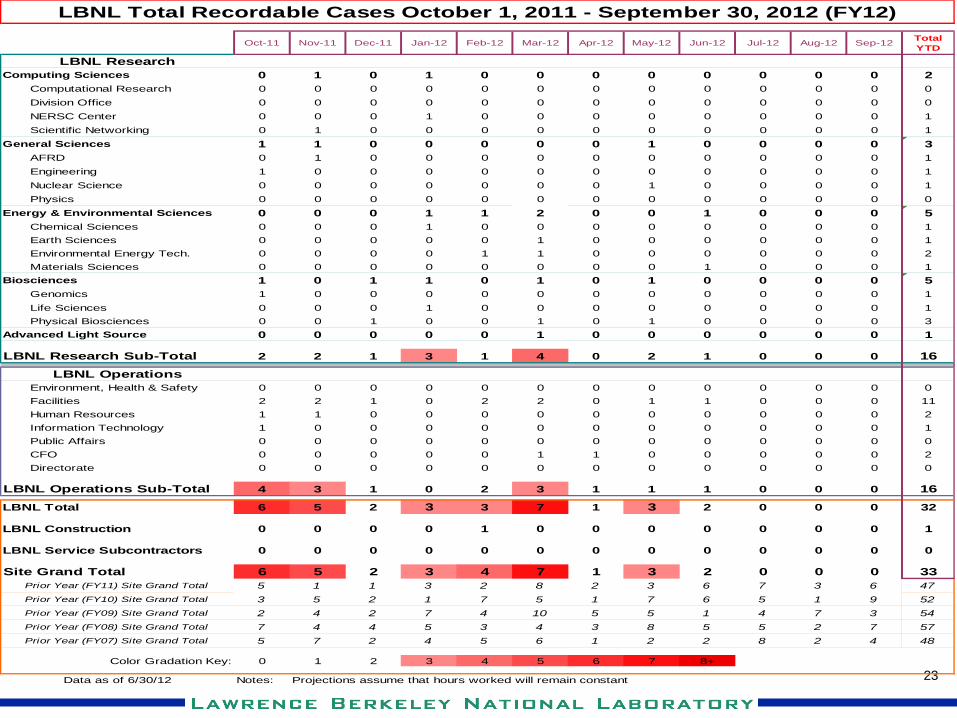
LBNL Total Recordable Cases October 1, 2011 - September 30, 2012 (FY12)
Oct-11 Nov-11 Dec-11 Jan-12 Feb-12 Mar-12 Apr-12 May-12 Jun-12 Jul-12 Aug-12 Sep-12 Total YTD
LBNL ResearchComputing Sciences 0 1 0 1 0 0 0 0 0 0 0 0 2 Computational Research 0 0 0 0 0 0 0 0 0 0 0 0 0 Division Office 0 0 0 0 0 0 0 0 0 0 0 0 0 NERSC Center 0 0 0 1 0 0 0 0 0 0 0 0 1 Scientific Networking 0 1 0 0 0 0 0 0 0 0 0 0 1General Sciences 1 1 0 0 0 0 0 1 0 0 0 0 3 AFRD 0 1 0 0 0 0 0 0 0 0 0 0 1 Engineering 1 0 0 0 0 0 0 0 0 0 0 0 1 Nuclear Science 0 0 0 0 0 0 0 1 0 0 0 0 1 Physics 0 0 0 0 0 0 0 0 0 0 0 0 0Energy & Environmental Sciences 0 0 0 1 1 2 0 0 1 0 0 0 5 Chemical Sciences 0 0 0 1 0 0 0 0 0 0 0 0 1 Earth Sciences 0 0 0 0 0 1 0 0 0 0 0 0 1 Environmental Energy Tech. 0 0 0 0 1 1 0 0 0 0 0 0 2 Materials Sciences 0 0 0 0 0 0 0 0 1 0 0 0 1Biosciences 1 0 1 1 0 1 0 1 0 0 0 0 5 Genomics 1 0 0 0 0 0 0 0 0 0 0 0 1 Life Sciences 0 0 0 1 0 0 0 0 0 0 0 0 1 Physical Biosciences 0 0 1 0 0 1 0 1 0 0 0 0 3Advanced Light Source 0 0 0 0 0 1 0 0 0 0 0 0 1
LBNL Research Sub-Total 2 2 1 3 1 4 0 2 1 0 0 0 16
LBNL Operations Environment, Health & Safety 0 0 0 0 0 0 0 0 0 0 0 0 0 Facilities 2 2 1 0 2 2 0 1 1 0 0 0 11 Human Resources 1 1 0 0 0 0 0 0 0 0 0 0 2 Information Technology 1 0 0 0 0 0 0 0 0 0 0 0 1 Public Affairs 0 0 0 0 0 0 0 0 0 0 0 0 0 CFO 0 0 0 0 0 1 1 0 0 0 0 0 2 Directorate 0 0 0 0 0 0 0 0 0 0 0 0 0
LBNL Operations Sub-Total 4 3 1 0 2 3 1 1 1 0 0 0 16
LBNL Total 6 5 2 3 3 7 1 3 2 0 0 0 32
LBNL Construction 0 0 0 0 1 0 0 0 0 0 0 0 1
LBNL Service Subcontractors 0 0 0 0 0 0 0 0 0 0 0 0 0
Site Grand Total 6 5 2 3 4 7 1 3 2 0 0 0 33Prior Year (FY11) Site Grand Total 5 1 1 3 2 8 2 3 6 7 3 6 47Prior Year (FY10) Site Grand Total 3 5 2 1 7 5 1 7 6 5 1 9 52Prior Year (FY09) Site Grand Total 2 4 2 7 4 10 5 5 1 4 7 3 54Prior Year (FY08) Site Grand Total 7 4 4 5 3 4 3 8 5 5 2 7 57Prior Year (FY07) Site Grand Total 5 7 2 4 5 6 1 2 2 8 2 4 48
Color Gradation Key: 0 1 2 3 4 5 6 7 8+
Data as of 6/30/12 Notes: Projections assume that hours worked will remain constant
24
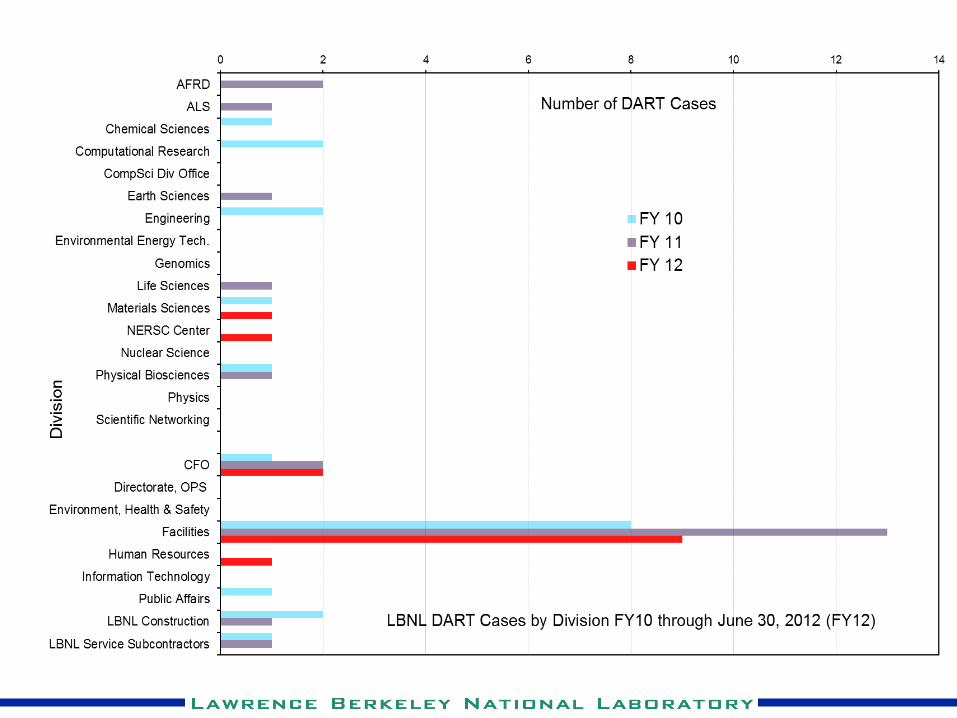
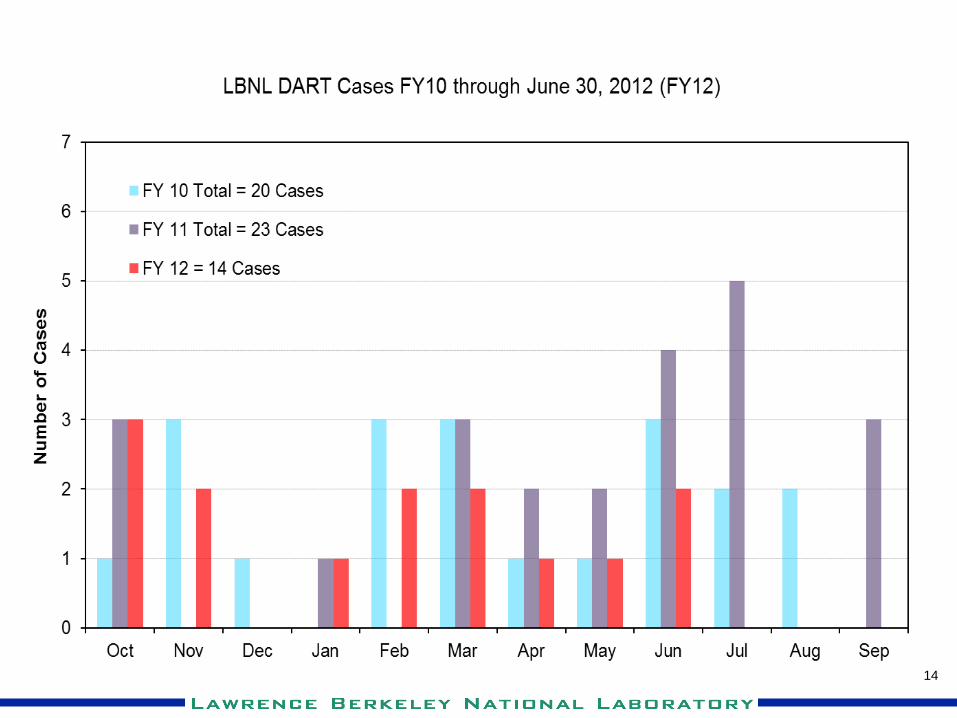
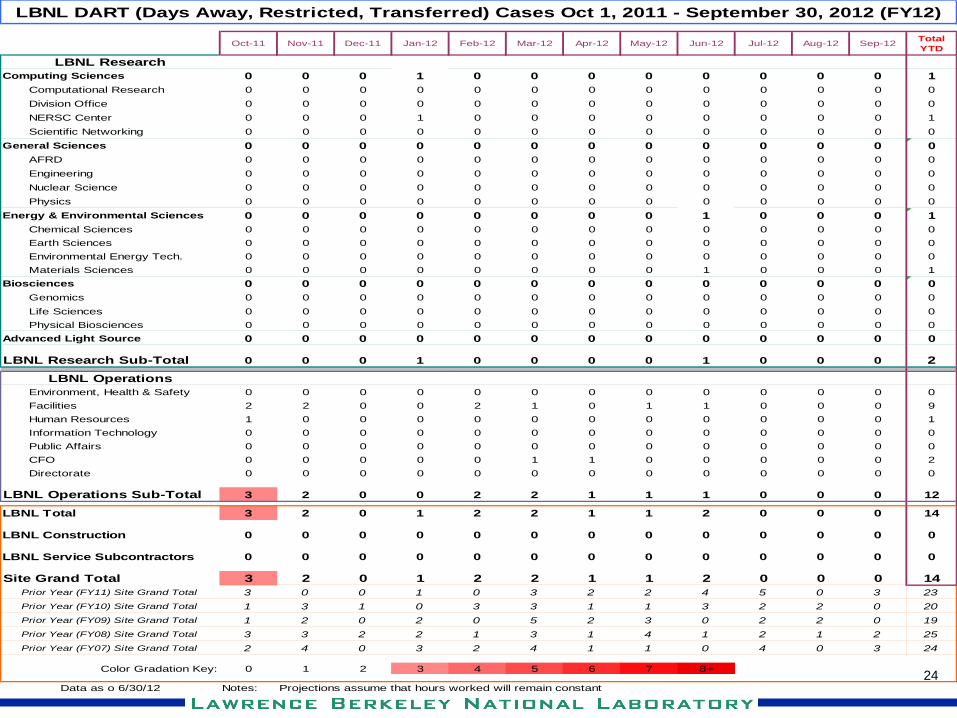
LBNL DART (Days Away, Restricted, Transferred) Cases Oct 1, 2011 - September 30, 2012 (FY12)
Oct-11 Nov-11 Dec-11 Jan-12 Feb-12 Mar-12 Apr-12 May-12 Jun-12 Jul-12 Aug-12 Sep-12 Total YTD
LBNL ResearchComputing Sciences 0 0 0 1 0 0 0 0 0 0 0 0 1 Computational Research 0 0 0 0 0 0 0 0 0 0 0 0 0 Division Office 0 0 0 0 0 0 0 0 0 0 0 0 0 NERSC Center 0 0 0 1 0 0 0 0 0 0 0 0 1 Scientific Networking 0 0 0 0 0 0 0 0 0 0 0 0 0General Sciences 0 0 0 0 0 0 0 0 0 0 0 0 0 AFRD 0 0 0 0 0 0 0 0 0 0 0 0 0 Engineering 0 0 0 0 0 0 0 0 0 0 0 0 0 Nuclear Science 0 0 0 0 0 0 0 0 0 0 0 0 0 Physics 0 0 0 0 0 0 0 0 0 0 0 0 0Energy & Environmental Sciences 0 0 0 0 0 0 0 0 1 0 0 0 1 Chemical Sciences 0 0 0 0 0 0 0 0 0 0 0 0 0 Earth Sciences 0 0 0 0 0 0 0 0 0 0 0 0 0 Environmental Energy Tech. 0 0 0 0 0 0 0 0 0 0 0 0 0 Materials Sciences 0 0 0 0 0 0 0 0 1 0 0 0 1Biosciences 0 0 0 0 0 0 0 0 0 0 0 0 0 Genomics 0 0 0 0 0 0 0 0 0 0 0 0 0 Life Sciences 0 0 0 0 0 0 0 0 0 0 0 0 0 Physical Biosciences 0 0 0 0 0 0 0 0 0 0 0 0 0Advanced Light Source 0 0 0 0 0 0 0 0 0 0 0 0 0
LBNL Research Sub-Total 0 0 0 1 0 0 0 0 1 0 0 0 2
LBNL Operations Environment, Health & Safety 0 0 0 0 0 0 0 0 0 0 0 0 0 Facilities 2 2 0 0 2 1 0 1 1 0 0 0 9 Human Resources 1 0 0 0 0 0 0 0 0 0 0 0 1 Information Technology 0 0 0 0 0 0 0 0 0 0 0 0 0 Public Affairs 0 0 0 0 0 0 0 0 0 0 0 0 0 CFO 0 0 0 0 0 1 1 0 0 0 0 0 2 Directorate 0 0 0 0 0 0 0 0 0 0 0 0 0
LBNL Operations Sub-Total 3 2 0 0 2 2 1 1 1 0 0 0 12
LBNL Total 3 2 0 1 2 2 1 1 2 0 0 0 14
LBNL Construction 0 0 0 0 0 0 0 0 0 0 0 0 0
LBNL Service Subcontractors 0 0 0 0 0 0 0 0 0 0 0 0 0
Site Grand Total 3 2 0 1 2 2 1 1 2 0 0 0 14Prior Year (FY11) Site Grand Total 3 0 0 1 0 3 2 2 4 5 0 3 23Prior Year (FY10) Site Grand Total 1 3 1 0 3 3 1 1 3 2 2 0 20Prior Year (FY09) Site Grand Total 1 2 0 2 0 5 2 3 0 2 2 0 19Prior Year (FY08) Site Grand Total 3 3 2 2 1 3 1 4 1 2 1 2 25Prior Year (FY07) Site Grand Total 2 4 0 3 2 4 1 1 0 4 0 3 24
Color Gradation Key: 0 1 2 3 4 5 6 7 8+
Data as o 6/30/12 Notes: Projections assume that hours worked will remain constant