Embed Size (px)
Citation preview
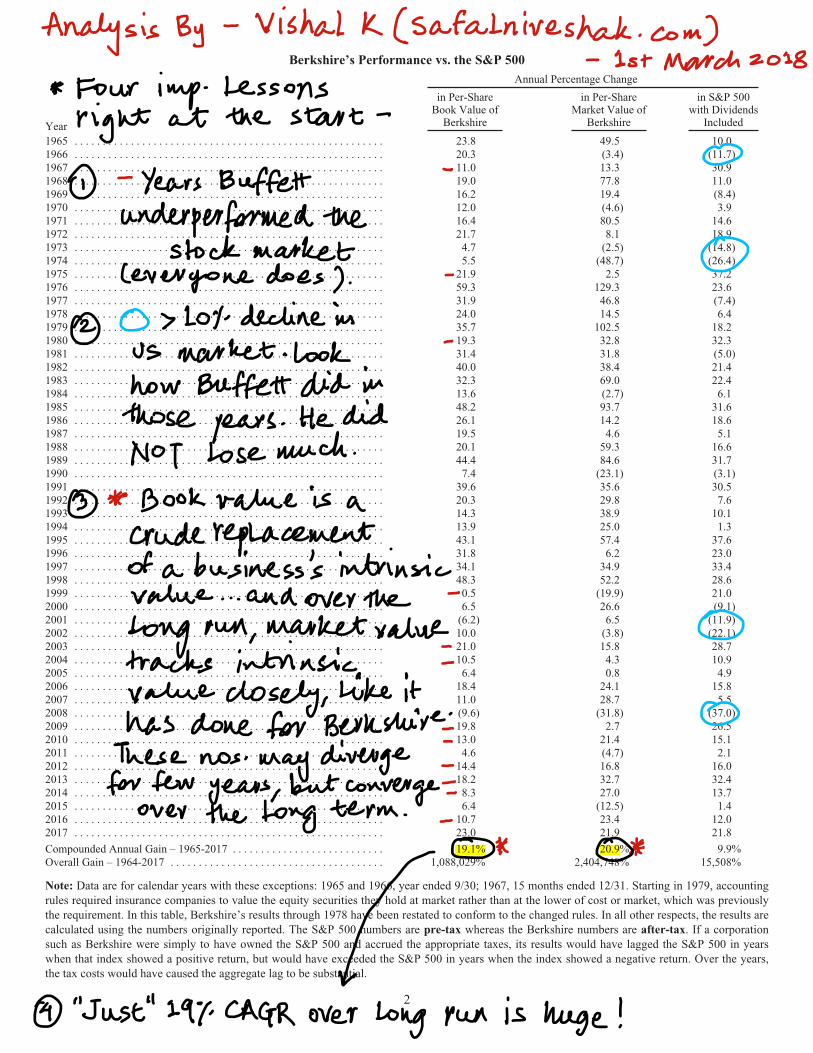
Berkshire’s Performance vs. the S&P 500
Annual Percentage Change
Year
in Per-ShareBook Value of
Berkshire
in Per-ShareMarket Value of
Berkshire
in S&P 500with Dividends
Included
1965 . . . . . . . . . . . . . . . . . . . . . . . . . . . . . . . . . . . . . . . . . . . . . . . . . . . . . . . 23.8 49.5 10.01966 . . . . . . . . . . . . . . . . . . . . . . . . . . . . . . . . . . . . . . . . . . . . . . . . . . . . . . . 20.3 (3.4) (11.7)1967 . . . . . . . . . . . . . . . . . . . . . . . . . . . . . . . . . . . . . . . . . . . . . . . . . . . . . . . 11.0 13.3 30.91968 . . . . . . . . . . . . . . . . . . . . . . . . . . . . . . . . . . . . . . . . . . . . . . . . . . . . . . . 19.0 77.8 11.01969 . . . . . . . . . . . . . . . . . . . . . . . . . . . . . . . . . . . . . . . . . . . . . . . . . . . . . . . 16.2 19.4 (8.4)1970 . . . . . . . . . . . . . . . . . . . . . . . . . . . . . . . . . . . . . . . . . . . . . . . . . . . . . . . 12.0 (4.6) 3.91971 . . . . . . . . . . . . . . . . . . . . . . . . . . . . . . . . . . . . . . . . . . . . . . . . . . . . . . . 16.4 80.5 14.61972 . . . . . . . . . . . . . . . . . . . . . . . . . . . . . . . . . . . . . . . . . . . . . . . . . . . . . . . 21.7 8.1 18.91973 . . . . . . . . . . . . . . . . . . . . . . . . . . . . . . . . . . . . . . . . . . . . . . . . . . . . . . . 4.7 (2.5) (14.8)1974 . . . . . . . . . . . . . . . . . . . . . . . . . . . . . . . . . . . . . . . . . . . . . . . . . . . . . . . 5.5 (48.7) (26.4)1975 . . . . . . . . . . . . . . . . . . . . . . . . . . . . . . . . . . . . . . . . . . . . . . . . . . . . . . . 21.9 2.5 37.21976 . . . . . . . . . . . . . . . . . . . . . . . . . . . . . . . . . . . . . . . . . . . . . . . . . . . . . . . 59.3 129.3 23.61977 . . . . . . . . . . . . . . . . . . . . . . . . . . . . . . . . . . . . . . . . . . . . . . . . . . . . . . . 31.9 46.8 (7.4)1978 . . . . . . . . . . . . . . . . . . . . . . . . . . . . . . . . . . . . . . . . . . . . . . . . . . . . . . . 24.0 14.5 6.41979 . . . . . . . . . . . . . . . . . . . . . . . . . . . . . . . . . . . . . . . . . . . . . . . . . . . . . . . 35.7 102.5 18.21980 . . . . . . . . . . . . . . . . . . . . . . . . . . . . . . . . . . . . . . . . . . . . . . . . . . . . . . . 19.3 32.8 32.31981 . . . . . . . . . . . . . . . . . . . . . . . . . . . . . . . . . . . . . . . . . . . . . . . . . . . . . . . 31.4 31.8 (5.0)1982 . . . . . . . . . . . . . . . . . . . . . . . . . . . . . . . . . . . . . . . . . . . . . . . . . . . . . . . 40.0 38.4 21.41983 . . . . . . . . . . . . . . . . . . . . . . . . . . . . . . . . . . . . . . . . . . . . . . . . . . . . . . . 32.3 69.0 22.41984 . . . . . . . . . . . . . . . . . . . . . . . . . . . . . . . . . . . . . . . . . . . . . . . . . . . . . . . 13.6 (2.7) 6.11985 . . . . . . . . . . . . . . . . . . . . . . . . . . . . . . . . . . . . . . . . . . . . . . . . . . . . . . . 48.2 93.7 31.61986 . . . . . . . . . . . . . . . . . . . . . . . . . . . . . . . . . . . . . . . . . . . . . . . . . . . . . . . 26.1 14.2 18.61987 . . . . . . . . . . . . . . . . . . . . . . . . . . . . . . . . . . . . . . . . . . . . . . . . . . . . . . . 19.5 4.6 5.11988 . . . . . . . . . . . . . . . . . . . . . . . . . . . . . . . . . . . . . . . . . . . . . . . . . . . . . . . 20.1 59.3 16.61989 . . . . . . . . . . . . . . . . . . . . . . . . . . . . . . . . . . . . . . . . . . . . . . . . . . . . . . . 44.4 84.6 31.71990 . . . . . . . . . . . . . . . . . . . . . . . . . . . . . . . . . . . . . . . . . . . . . . . . . . . . . . . 7.4 (23.1) (3.1)1991 . . . . . . . . . . . . . . . . . . . . . . . . . . . . . . . . . . . . . . . . . . . . . . . . . . . . . . . 39.6 35.6 30.51992 . . . . . . . . . . . . . . . . . . . . . . . . . . . . . . . . . . . . . . . . . . . . . . . . . . . . . . . 20.3 29.8 7.61993 . . . . . . . . . . . . . . . . . . . . . . . . . . . . . . . . . . . . . . . . . . . . . . . . . . . . . . . 14.3 38.9 10.11994 . . . . . . . . . . . . . . . . . . . . . . . . . . . . . . . . . . . . . . . . . . . . . . . . . . . . . . . 13.9 25.0 1.31995 . . . . . . . . . . . . . . . . . . . . . . . . . . . . . . . . . . . . . . . . . . . . . . . . . . . . . . . 43.1 57.4 37.61996 . . . . . . . . . . . . . . . . . . . . . . . . . . . . . . . . . . . . . . . . . . . . . . . . . . . . . . . 31.8 6.2 23.01997 . . . . . . . . . . . . . . . . . . . . . . . . . . . . . . . . . . . . . . . . . . . . . . . . . . . . . . . 34.1 34.9 33.41998 . . . . . . . . . . . . . . . . . . . . . . . . . . . . . . . . . . . . . . . . . . . . . . . . . . . . . . . 48.3 52.2 28.61999 . . . . . . . . . . . . . . . . . . . . . . . . . . . . . . . . . . . . . . . . . . . . . . . . . . . . . . . 0.5 (19.9) 21.02000 . . . . . . . . . . . . . . . . . . . . . . . . . . . . . . . . . . . . . . . . . . . . . . . . . . . . . . . 6.5 26.6 (9.1)2001 . . . . . . . . . . . . . . . . . . . . . . . . . . . . . . . . . . . . . . . . . . . . . . . . . . . . . . . (6.2) 6.5 (11.9)2002 . . . . . . . . . . . . . . . . . . . . . . . . . . . . . . . . . . . . . . . . . . . . . . . . . . . . . . . 10.0 (3.8) (22.1)2003 . . . . . . . . . . . . . . . . . . . . . . . . . . . . . . . . . . . . . . . . . . . . . . . . . . . . . . . 21.0 15.8 28.72004 . . . . . . . . . . . . . . . . . . . . . . . . . . . . . . . . . . . . . . . . . . . . . . . . . . . . . . . 10.5 4.3 10.92005 . . . . . . . . . . . . . . . . . . . . . . . . . . . . . . . . . . . . . . . . . . . . . . . . . . . . . . . 6.4 0.8 4.92006 . . . . . . . . . . . . . . . . . . . . . . . . . . . . . . . . . . . . . . . . . . . . . . . . . . . . . . . 18.4 24.1 15.82007 . . . . . . . . . . . . . . . . . . . . . . . . . . . . . . . . . . . . . . . . . . . . . . . . . . . . . . . 11.0 28.7 5.52008 . . . . . . . . . . . . . . . . . . . . . . . . . . . . . . . . . . . . . . . . . . . . . . . . . . . . . . . (9.6) (31.8) (37.0)2009 . . . . . . . . . . . . . . . . . . . . . . . . . . . . . . . . . . . . . . . . . . . . . . . . . . . . . . . 19.8 2.7 26.52010 . . . . . . . . . . . . . . . . . . . . . . . . . . . . . . . . . . . . . . . . . . . . . . . . . . . . . . . 13.0 21.4 15.12011 . . . . . . . . . . . . . . . . . . . . . . . . . . . . . . . . . . . . . . . . . . . . . . . . . . . . . . . 4.6 (4.7) 2.12012 . . . . . . . . . . . . . . . . . . . . . . . . . . . . . . . . . . . . . . . . . . . . . . . . . . . . . . . 14.4 16.8 16.02013 . . . . . . . . . . . . . . . . . . . . . . . . . . . . . . . . . . . . . . . . . . . . . . . . . . . . . . . 18.2 32.7 32.42014 . . . . . . . . . . . . . . . . . . . . . . . . . . . . . . . . . . . . . . . . . . . . . . . . . . . . . . . 8.3 27.0 13.72015 . . . . . . . . . . . . . . . . . . . . . . . . . . . . . . . . . . . . . . . . . . . . . . . . . . . . . . . 6.4 (12.5) 1.42016 . . . . . . . . . . . . . . . . . . . . . . . . . . . . . . . . . . . . . . . . . . . . . . . . . . . . . . . 10.7 23.4 12.02017 . . . . . . . . . . . . . . . . . . . . . . . . . . . . . . . . . . . . . . . . . . . . . . . . . . . . . . . 23.0 21.9 21.8
Compounded Annual Gain – 1965-2017 . . . . . . . . . . . . . . . . . . . . . . . . . . . 19.1% 20.9% 9.9%Overall Gain – 1964-2017 . . . . . . . . . . . . . . . . . . . . . . . . . . . . . . . . . . . . . . 1,088,029% 2,404,748% 15,508%
Note: Data are for calendar years with these exceptions: 1965 and 1966, year ended 9/30; 1967, 15 months ended 12/31. Starting in 1979, accountingrules required insurance companies to value the equity securities they hold at market rather than at the lower of cost or market, which was previouslythe requirement. In this table, Berkshire’s results through 1978 have been restated to conform to the changed rules. In all other respects, the results arecalculated using the numbers originally reported. The S&P 500 numbers are pre-tax whereas the Berkshire numbers are after-tax. If a corporationsuch as Berkshire were simply to have owned the S&P 500 and accrued the appropriate taxes, its results would have lagged the S&P 500 in yearswhen that index showed a positive return, but would have exceeded the S&P 500 in years when the index showed a negative return. Over the years,the tax costs would have caused the aggregate lag to be substantial.
2

BERKSHIRE HATHAWAY INC.
To the Shareholders of Berkshire Hathaway Inc.:
Berkshire’s gain in net worth during 2017 was $65.3 billion, which increased the per-share book value ofboth our Class A and Class B stock by 23%. Over the last 53 years (that is, since present management took over), per-share book value has grown from $19 to $211,750, a rate of 19.1% compounded annually.*
The format of that opening paragraph has been standard for 30 years. But 2017 was far from standard: Alarge portion of our gain did not come from anything we accomplished at Berkshire.
The $65 billion gain is nonetheless real – rest assured of that. But only $36 billion came from Berkshire’soperations. The remaining $29 billion was delivered to us in December when Congress rewrote the U.S. Tax Code.(Details of Berkshire’s tax-related gain appear on page K-32 and pages K-89 – K-90.)
After stating those fiscal facts, I would prefer to turn immediately to discussing Berkshire’s operations. But,in still another interruption, I must first tell you about a new accounting rule – a generally accepted accountingprinciple (GAAP) – that in future quarterly and annual reports will severely distort Berkshire’s net income figures andvery often mislead commentators and investors.
The new rule says that the net change in unrealized investment gains and losses in stocks we hold must beincluded in all net income figures we report to you. That requirement will produce some truly wild and capriciousswings in our GAAP bottom-line. Berkshire owns $170 billion of marketable stocks (not including our shares of KraftHeinz), and the value of these holdings can easily swing by $10 billion or more within a quarterly reporting period.Including gyrations of that magnitude in reported net income will swamp the truly important numbers that describe ouroperating performance. For analytical purposes, Berkshire’s “bottom-line” will be useless.
The new rule compounds the communication problems we have long had in dealing with the realized gains(or losses) that accounting rules compel us to include in our net income. In past quarterly and annual press releases,we have regularly warned you not to pay attention to these realized gains, because they – just like our unrealized gains– fluctuate randomly.
That’s largely because we sell securities when that seems the intelligent thing to do, not because we are tryingto influence earnings in any way. As a result, we sometimes have reported substantial realized gains for a period whenour portfolio, overall, performed poorly (or the converse).
*All per-share figures used in this report apply to Berkshire’s A shares. Figures for the B shares are 1/1500th of thoseshown for the A shares.
3
With the new rule about unrealized gains exacerbating the distortion caused by the existing rules applying torealized gains, we will take pains every quarter to explain the adjustments you need in order to make sense of ournumbers. But televised commentary on earnings releases is often instantaneous with their receipt, and newspaperheadlines almost always focus on the year-over-year change in GAAP net income. Consequently, media reportssometimes highlight figures that unnecessarily frighten or encourage many readers or viewers.
We will attempt to alleviate this problem by continuing our practice of publishing financial reports late onFriday, well after the markets close, or early on Saturday morning. That will allow you maximum time for analysisand give investment professionals the opportunity to deliver informed commentary before markets open on Monday.Nevertheless, I expect considerable confusion among shareholders for whom accounting is a foreign language.
At Berkshire what counts most are increases in our normalized per-share earning power. That metric is whatCharlie Munger, my long-time partner, and I focus on – and we hope that you do, too. Our scorecard for 2017 follows.
Acquisitions
There are four building blocks that add value to Berkshire: (1) sizable stand-alone acquisitions; (2) bolt-onacquisitions that fit with businesses we already own; (3) internal sales growth and margin improvement at our manyand varied businesses; and (4) investment earnings from our huge portfolio of stocks and bonds. In this section, wewill review 2017 acquisition activity.
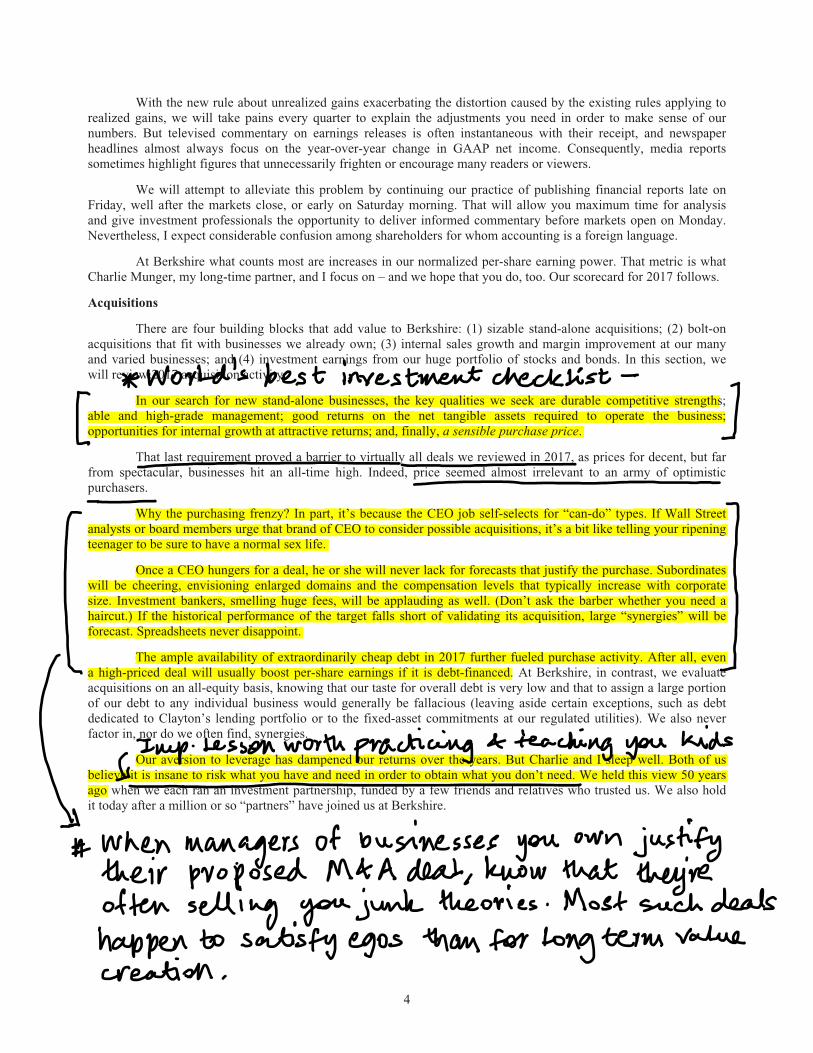
In our search for new stand-alone businesses, the key qualities we seek are durable competitive strengths;able and high-grade management; good returns on the net tangible assets required to operate the business;opportunities for internal growth at attractive returns; and, finally, a sensible purchase price.
That last requirement proved a barrier to virtually all deals we reviewed in 2017, as prices for decent, but farfrom spectacular, businesses hit an all-time high. Indeed, price seemed almost irrelevant to an army of optimisticpurchasers.
Why the purchasing frenzy? In part, it’s because the CEO job self-selects for “can-do” types. If Wall Streetanalysts or board members urge that brand of CEO to consider possible acquisitions, it’s a bit like telling your ripeningteenager to be sure to have a normal sex life.
Once a CEO hungers for a deal, he or she will never lack for forecasts that justify the purchase. Subordinateswill be cheering, envisioning enlarged domains and the compensation levels that typically increase with corporatesize. Investment bankers, smelling huge fees, will be applauding as well. (Don’t ask the barber whether you need ahaircut.) If the historical performance of the target falls short of validating its acquisition, large “synergies” will beforecast. Spreadsheets never disappoint.
The ample availability of extraordinarily cheap debt in 2017 further fueled purchase activity. After all, evena high-priced deal will usually boost per-share earnings if it is debt-financed. At Berkshire, in contrast, we evaluateacquisitions on an all-equity basis, knowing that our taste for overall debt is very low and that to assign a large portionof our debt to any individual business would generally be fallacious (leaving aside certain exceptions, such as debtdedicated to Clayton’s lending portfolio or to the fixed-asset commitments at our regulated utilities). We also neverfactor in, nor do we often find, synergies.
Our aversion to leverage has dampened our returns over the years. But Charlie and I sleep well. Both of usbelieve it is insane to risk what you have and need in order to obtain what you don’t need. We held this view 50 yearsago when we each ran an investment partnership, funded by a few friends and relatives who trusted us. We also holdit today after a million or so “partners” have joined us at Berkshire.
4

Despite our recent drought of acquisitions, Charlie and I believe that from time to time Berkshire will haveopportunities to make very large purchases. In the meantime, we will stick with our simple guideline: The less theprudence with which others conduct their affairs, the greater the prudence with which we must conduct our own.
* * * * * * * * * * * *We were able to make one sensible stand-alone purchase last year, a 38.6% partnership interest in Pilot Flying
J (“PFJ”). With about $20 billion in annual volume, the company is far and away the nation’s leading travel-centeroperator.
PFJ has been run from the get-go by the remarkable Haslam family. “Big Jim” Haslam began with a dreamand a gas station 60 years ago. Now his son, Jimmy, manages 27,000 associates at about 750 locations throughoutNorth America. Berkshire has a contractual agreement to increase its partnership interest in PFJ to 80% in 2023;Haslam family members will then own the remaining 20%. Berkshire is delighted to be their partner.
When driving on the Interstate, drop in. PFJ sells gasoline as well as diesel fuel, and the food is good. If it’sbeen a long day, remember, too, that our properties have 5,200 showers.
* * * * * * * * * * * *Let’s move now to bolt-on acquisitions. Some of these were small transactions that I will not detail. Here is
an account, however, of a few larger purchases whose closings stretched between late 2016 and early 2018.
Š Clayton Homes acquired two builders of conventional homes during 2017, a move that more than doubledour presence in a field we entered only three years ago. With these additions – Oakwood Homes in Colorado andHarris Doyle in Birmingham – I expect our 2018 site built volume will exceed $1 billion.
Clayton’s emphasis, nonetheless, remains manufactured homes, both their construction and their financing.In 2017 Clayton sold 19,168 units through its own retail operation and wholesaled another 26,706 units to independentretailers. All told, Clayton accounted for 49% of the manufactured-home market last year. That industry-leading share– about three times what our nearest competitor did – is a far cry from the 13% Clayton achieved in 2003, the year itjoined Berkshire.
Both Clayton Homes and PFJ are based in Knoxville, where the Clayton and Haslam families have long beenfriends. Kevin Clayton’s comments to the Haslams about the advantages of a Berkshire affiliation, and his admiringcomments about the Haslam family to me, helped cement the PFJ deal.
Š Near the end of 2016, Shaw Industries, our floor coverings business, acquired U.S. Floors (“USF”), a rapidlygrowing distributor of luxury vinyl tile. USF’s managers, Piet Dossche and Philippe Erramuzpe, came out of the gatefast, delivering a 40% increase in sales in 2017, during which their operation was integrated with Shaw’s. It’s clearthat we acquired both great human assets and business assets in making the USF purchase.
Vance Bell, Shaw’s CEO, originated, negotiated and completed this acquisition, which increased Shaw’ssales to $5.7 billion in 2017 and its employment to 22,000. With the purchase of USF, Shaw has substantiallystrengthened its position as an important and durable source of earnings for Berkshire.
Š I have told you several times about HomeServices, our growing real estate brokerage operation. Berkshirebacked into this business in 2000 when we acquired a majority interest in MidAmerican Energy (now named BerkshireHathaway Energy). MidAmerican’s activities were then largely in the electric utility field, and I originally paid littleattention to HomeServices.
5

Some of the stocks in the table are the responsibility of either Todd Combs or Ted Weschler, who work withme in managing Berkshire’s investments. Each, independently of me, manages more than $12 billion; I usually learnabout decisions they have made by looking at monthly portfolio summaries. Included in the $25 billion that the twomanage is more than $8 billion of pension trust assets of certain Berkshire subsidiaries. As noted, pension investmentsare not included in the preceding tabulation of Berkshire holdings.
* * * * * * * * * * * *
Charlie and I view the marketable common stocks that Berkshire owns as interests in businesses, not as tickersymbols to be bought or sold based on their “chart” patterns, the “target” prices of analysts or the opinions of mediapundits. Instead, we simply believe that if the businesses of the investees are successful (as we believe most will be)our investments will be successful as well. Sometimes the payoffs to us will be modest; occasionally the cash registerwill ring loudly. And sometimes I will make expensive mistakes. Overall – and over time – we should get decentresults. In America, equity investors have the wind at their back.
From our stock portfolio – call our holdings “minority interests” in a diversified group of publicly-ownedbusinesses – Berkshire received $3.7 billion of dividends in 2017. That’s the number included in our GAAP figures,as well as in the “operating earnings” we reference in our quarterly and annual reports.
That dividend figure, however, far understates the “true” earnings emanating from our stock holdings. Fordecades, we have stated in Principle 6 of our “Owner-Related Business Principles” (page 19) that we expectundistributed earnings of our investees to deliver us at least equivalent earnings by way of subsequent capital gains.
Our recognition of capital gains (and losses) will be lumpy, particularly as we conform with the new GAAPrule requiring us to constantly record unrealized gains or losses in our earnings. I feel confident, however, that theearnings retained by our investees will over time, and with our investees viewed as a group, translate intocommensurate capital gains for Berkshire.
The connection of value-building to retained earnings that I’ve just described will be impossible to detect inthe short term. Stocks surge and swoon, seemingly untethered to any year-to-year buildup in their underlying value.Over time, however, Ben Graham’s oft-quoted maxim proves true: “In the short run, the market is a voting machine;in the long run, however, it becomes a weighing machine.”
* * * * * * * * * * * *
Berkshire, itself, provides some vivid examples of how price randomness in the short term can obscure long-term growth in value. For the last 53 years, the company has built value by reinvesting its earnings and lettingcompound interest work its magic. Year by year, we have moved forward. Yet Berkshire shares have suffered fourtruly major dips. Here are the gory details:
Period High Low Percentage Decrease
March 1973-January 1975 93 38 (59.1%)10/2/87-10/27/87 4,250 2,675 (37.1%)6/19/98-3/10/2000 80,900 41,300 (48.9%)9/19/08-3/5/09 147,000 72,400 (50.7%)
This table offers the strongest argument I can muster against ever using borrowed money to own stocks.There is simply no telling how far stocks can fall in a short period. Even if your borrowings are small and yourpositions aren’t immediately threatened by the plunging market, your mind may well become rattled by scary headlinesand breathless commentary. And an unsettled mind will not make good decisions.
10

In the next 53 years our shares (and others) will experience declines resembling those in the table. No onecan tell you when these will happen. The light can at any time go from green to red without pausing at yellow.
When major declines occur, however, they offer extraordinary opportunities to those who are not handicappedby debt. That’s the time to heed these lines from Kipling’s If:
“If you can keep your head when all about you are losing theirs . . .If you can wait and not be tired by waiting . . .If you can think – and not make thoughts your aim . . .If you can trust yourself when all men doubt you . . .Yours is the Earth and everything that’s in it.”
“The Bet” is Over and Has Delivered an Unforeseen Investment Lesson
Last year, at the 90% mark, I gave you a detailed report on a ten-year bet I had made on December 19, 2007.(The full discussion from last year’s annual report is reprinted on pages 24 – 26.) Now I have the final tally – and, inseveral respects, it’s an eye-opener.
I made the bet for two reasons: (1) to leverage my outlay of $318,250 into a disproportionately larger sumthat – if things turned out as I expected – would be distributed in early 2018 to Girls Inc. of Omaha; and (2) topublicize my conviction that my pick – a virtually cost-free investment in an unmanaged S&P 500 index fund – would,over time, deliver better results than those achieved by most investment professionals, however well-regarded andincentivized those “helpers” may be.
Addressing this question is of enormous importance. American investors pay staggering sums annually toadvisors, often incurring several layers of consequential costs. In the aggregate, do these investors get their money’sworth? Indeed, again in the aggregate, do investors get anything for their outlays?
Protégé Partners, my counterparty to the bet, picked five “funds-of-funds” that it expected to overperformthe S&P 500. That was not a small sample. Those five funds-of-funds in turn owned interests in more than 200 hedgefunds.
Essentially, Protégé, an advisory firm that knew its way around Wall Street, selected five investment expertswho, in turn, employed several hundred other investment experts, each managing his or her own hedge fund. Thisassemblage was an elite crew, loaded with brains, adrenaline and confidence.
The managers of the five funds-of-funds possessed a further advantage: They could – and did – rearrangetheir portfolios of hedge funds during the ten years, investing with new “stars” while exiting their positions in hedgefunds whose managers had lost their touch.
Every actor on Protégé’s side was highly incentivized: Both the fund-of-funds managers and the hedge-fundmanagers they selected significantly shared in gains, even those achieved simply because the market generally movesupwards. (In 100% of the 43 ten-year periods since we took control of Berkshire, years with gains by the S&P 500exceeded loss years.)
Those performance incentives, it should be emphasized, were frosting on a huge and tasty cake: Even if thefunds lost money for their investors during the decade, their managers could grow very rich. That would occur becausefixed fees averaging a staggering 21⁄2% of assets or so were paid every year by the fund-of-funds’ investors, with partof these fees going to the managers at the five funds-of-funds and the balance going to the 200-plus managers of theunderlying hedge funds.
11

Here’s the final scorecard for the bet:
YearFund-of-Funds A
Fund-of-Funds B
Fund-of-Funds C
Fund-of-Funds D
Fund-of-Funds E
S&PIndex Fund
2008 -16.5% -22.3% -21.3% -29.3% -30.1% -37.0%2009 11.3% 14.5% 21.4% 16.5% 16.8% 26.6%2010 5.9% 6.8% 13.3% 4.9% 11.9% 15.1%2011 -6.3% -1.3% 5.9% -6.3% -2.8% 2.1%2012 3.4% 9.6% 5.7% 6.2% 9.1% 16.0%2013 10.5% 15.2% 8.8% 14.2% 14.4% 32.3%2014 4.7% 4.0% 18.9% 0.7% -2.1% 13.6%2015 1.6% 2.5% 5.4% 1.4% -5.0% 1.4%2016 -3.2% 1.9% -1.7% 2.5% 4.4% 11.9%2017 12.2% 10.6% 15.6% N/A 18.0% 21.8%
Final Gain 21.7% 42.3% 87.7% 2.8% 27.0% 125.8%AverageAnnual Gain 2.0% 3.6% 6.5% 0.3% 2.4% 8.5%
Footnote: Under my agreement with Protégé Partners, the names of these funds-of-funds have never been publiclydisclosed. I, however, have received their annual audits from Protégé. The 2016 figures for funds A, Band C were revised slightly from those originally reported last year. Fund D was liquidated in 2017; itsaverage annual gain is calculated for the nine years of its operation.
The five funds-of-funds got off to a fast start, each beating the index fund in 2008. Then the roof fell in. Inevery one of the nine years that followed, the funds-of-funds as a whole trailed the index fund.
Let me emphasize that there was nothing aberrational about stock-market behavior over the ten-year stretch.If a poll of investment “experts” had been asked late in 2007 for a forecast of long-term common-stock returns, theirguesses would have likely averaged close to the 8.5% actually delivered by the S&P 500. Making money in thatenvironment should have been easy. Indeed, Wall Street “helpers” earned staggering sums. While this groupprospered, however, many of their investors experienced a lost decade.
Performance comes, performance goes. Fees never falter.
* * * * * * * * * * * *The bet illuminated another important investment lesson: Though markets are generally rational, they
occasionally do crazy things. Seizing the opportunities then offered does not require great intelligence, a degree ineconomics or a familiarity with Wall Street jargon such as alpha and beta. What investors then need instead is anability to both disregard mob fears or enthusiasms and to focus on a few simple fundamentals. A willingness to lookunimaginative for a sustained period – or even to look foolish – is also essential.
Originally, Protégé and I each funded our portion of the ultimate $1 million prize by purchasing $500,000face amount of zero-coupon U.S. Treasury bonds (sometimes called “strips”). These bonds cost each of us $318,250 –a bit less than 64¢ on the dollar – with the $500,000 payable in ten years.
As the name implies, the bonds we acquired paid no interest, but (because of the discount at which they werepurchased) delivered a 4.56% annual return if held to maturity. Protégé and I originally intended to do no more thantally the annual returns and distribute $1 million to the winning charity when the bonds matured late in 2017.
12

After our purchase, however, some very strange things took place in the bond market. By November 2012,our bonds – now with about five years to go before they matured – were selling for 95.7% of their face value. At thatprice, their annual yield to maturity was less than 1%. Or, to be precise, .88%.
Given that pathetic return, our bonds had become a dumb – a really dumb – investment compared toAmerican equities. Over time, the S&P 500 – which mirrors a huge cross-section of American business, appropriatelyweighted by market value – has earned far more than 10% annually on shareholders’ equity (net worth).
In November 2012, as we were considering all this, the cash return from dividends on the S&P 500 was 21⁄2%annually, about triple the yield on our U.S. Treasury bond. These dividend payments were almost certain to grow.Beyond that, huge sums were being retained by the companies comprising the 500. These businesses would use theirretained earnings to expand their operations and, frequently, to repurchase their shares as well. Either course would,over time, substantially increase earnings-per-share. And – as has been the case since 1776 – whatever its problems ofthe minute, the American economy was going to move forward.
Presented late in 2012 with the extraordinary valuation mismatch between bonds and equities, Protégé andI agreed to sell the bonds we had bought five years earlier and use the proceeds to buy 11,200 Berkshire “B” shares.The result: Girls Inc. of Omaha found itself receiving $2,222,279 last month rather than the $1 million it had originallyhoped for.
Berkshire, it should be emphasized, has not performed brilliantly since the 2012 substitution. But brilliancewasn’t needed: After all, Berkshire’s gain only had to beat that annual .88% bond bogey – hardly a Herculeanachievement.
The only risk in the bonds-to-Berkshire switch was that yearend 2017 would coincide with an exceptionallyweak stock market. Protégé and I felt this possibility (which always exists) was very low. Two factors dictated thisconclusion: The reasonable price of Berkshire in late 2012, and the large asset build-up that was almost certain to occurat Berkshire during the five years that remained before the bet would be settled. Even so, to eliminate all risk to thecharities from the switch, I agreed to make up any shortfall if sales of the 11,200 Berkshire shares at yearend 2017didn’t produce at least $1 million.
* * * * * * * * * * * *
Investing is an activity in which consumption today is foregone in an attempt to allow greater consumptionat a later date. “Risk” is the possibility that this objective won’t be attained.
By that standard, purportedly “risk-free” long-term bonds in 2012 were a far riskier investment than a long-term investment in common stocks. At that time, even a 1% annual rate of inflation between 2012 and 2017 wouldhave decreased the purchasing-power of the government bond that Protégé and I sold.
I want to quickly acknowledge that in any upcoming day, week or even year, stocks will be riskier – farriskier – than short-term U.S. bonds. As an investor’s investment horizon lengthens, however, a diversified portfolioof U.S. equities becomes progressively less risky than bonds, assuming that the stocks are purchased at a sensiblemultiple of earnings relative to then-prevailing interest rates.
It is a terrible mistake for investors with long-term horizons – among them, pension funds, collegeendowments and savings-minded individuals – to measure their investment “risk” by their portfolio’s ratio of bondsto stocks. Often, high-grade bonds in an investment portfolio increase its risk.
* * * * * * * * * * * *
A final lesson from our bet: Stick with big, “easy” decisions and eschew activity. During the ten-year bet,the 200-plus hedge-fund managers that were involved almost certainly made tens of thousands of buy and selldecisions. Most of those managers undoubtedly thought hard about their decisions, each of which they believed wouldprove advantageous. In the process of investing, they studied 10-Ks, interviewed managements, read trade journalsand conferred with Wall Street analysts.
13