Embed Size (px)
Citation preview

Best practice 2.1 – Environmental management system implementation
Best Environmental Management Practice in THE TOURISM SECTOR
Waste and Waste Water Management in Tourist Accommodation
This best practice is an extract from the report Best Environmental
Management Practice in the Tourism Sector.
Find out about other best practices at www.takeagreenstep.eu/BEMP or download the full report at http://susproc.jrc.ec.europa.eu/activities/emas/documents/TourismBEMP.pdf
6

Chapter 6
318 Best Environmental Management Practise in the Tourism Sector
6 WASTE AND WASTE WATER MANAGEMENT IN TOURIST ACCOMMODATION
Tourism and waste generation Tourism is responsible for a small share of waste generation within Europe, contributing
towards the 6.7 % of total waste generation that arises from the wider services sector in the EU-
27 (EEA, 2010). Nonetheless, the quantities of solid waste generated by tourism enterprises are
large in absolute terms – 35 million tonnes of solid waste per year globally (Conservation
International, 2003) – and the types of waste generated are associated with greater
environmental impacts than bulky and often inert wastes from the construction and mining
sectors that dominate waste generation statistics.
Tourists may generate up to twice as much solid waste per capita as local residents (IFC, 2007).
Waste from accommodation has similar characteristics to mixed household waste, being
composed of a diverse mix of materials, including organic and hazardous materials, that can
give rise to significant environmental impacts upon disposal (especially through GHG emissions
and leaching of toxic materials). Accommodation and restaurants are major contributors to
packaging waste (Eurostat, 2010), including plastics and metals with high embodied energy that
are responsible for significant resource depletion upon disposal. Furthermore, tourism waste
often varies seasonally, and is generated in areas sensitive to littering, potentially putting
pressure on waste management facilities during peak season and damaging high nature value
resources. Plastic waste in the oceans poses a threat to whales, dolphins, sea turtles and birds.
Accommodation waste sorting Waste generation and sorting varies considerably across hotels (Figure 6.1), and other types of
accommodation. Waste sorting partly depends on the waste collection services available in
different locations, and this may partly explain the large differences in unsorted waste
generation across hotels within the same hotel chain but in different countries (Figure 6.1).
0.0
1.0
2.0
3.0
4.0
5.0
6.0
7.0
Ho
tel 1
Ho
tel 2
AL
L
DE
urb
an
BE
urb
an
IT u
rba
n
ES
urb
an
E.
Eu
rop
e
Re
so
rt
ho
tels
Ra
dis
so
n
Blu
Pa
rk In
n
Sca
nd
ic
NH hotel group
Un
so
rte
d w
aste
(kg
/gn
)
NH HOTEL GROUP
Figure 6.1: Unsorted waste generated per guest-night across different groups and types of hotel,
from sustainability reports
The composition of waste from accommodation establishments is similar to household waste,
but varies somewhat depending on the services offered. Hotels with restaurants have a higher

Chapter 6
Best Environmental Management Practise in the Tourism Sector 319
share of organic waste. Classification of waste varies according to sorting, but organic, glass,
paper and cardboard and plastic and metal are the main fractions (Figure 6.2). For many hotels
with poor sorting, residual waste is the dominant fraction.
0%
20%
40%
60%
80%
100%
German &
Austrian
hotels
Norway
hotels
156 Sol
Media
hotels
Small UK
hotel
Danish
hotel
Danish
holiday
centre
Pro
po
rtio
n w
aste
Residual
Hazardous
Plastic and
metal
Paper and
cardboard
Glass
Organic
t/yr per enterpise: 293 6.9 58 563
Sources: Ecotrans (2006); SFT (1998); Sol Media (2011); Envirowise (2008); Miljøstyrelsen (2000).
Figure 6.2: Composition of waste for accommodation enterprises reported by different sources
Waste management hierarchy Figure 6.3 displays priority actions for resource efficiency and waste management, with actions
relevant for accommodation managers highlighted. Priority actions relevant to accommodation
managers are summarised below.
1. Reduce: Create as little waste as possible by not producing it to begin with – implement
green procurement, do not over-order, select products with little packaging or returnable
packaging.
2. Reuse: Consider where certain items can be reused, sold or donated to others that can
use them.
3. Sort: Have a system in place for sorting everyday waste items such as bottles, cans,
cardboard and paper for recycling. Consider what else might be recycled, taking into
account local disposal possibilities.
4. Recycle: Send sorted waste for recycling.

Chapter 6
320 Best Environmental Management Practise in the Tourism Sector
Eco design
Municipality
facilities and policy
Ac
co
mm
od
ati
on
Management -
alternative
uses
Selective
procurement
Management
- separation
Source: Derived from EC (2011).
Figure 6.3: The waste management hierarchy, with priority actions at the top
Driving forces for waste management Various regulations are relevant for waste management in the tourism sector. Accommodation
enterprises generate, store, and in some cases trade waste. European legislation relevant to
accommodation providers with respect to waste management is listed below.
Directive 2008/98/EC on waste and repealing certain directives.
Decision 2000/532/EC establishing a list of hazardous wastes.
Directive 2002/96/EC on waste electrical and electronic equipment.
Regulation 1774/2002 laying down health rules concerning animal by-products not
intended for human consumption.
Directive 75/439/EEC regarding disposal of waste oils.
Directive 94/62/EC on packaging and packaging waste and the amendment of Directive
2004/12/EC.
Directive 2006/66/EC on batteries and accumulators and waste batteries and
accumulators.
Other regulations are relevant for local authorities and waste management companies. These
include Directive 99/31/EC on landfill of waste and Directive 2000/76/EC on waste
incineration.
There are also strong economic incentives for minimising waste. For many types of waste, such
as packaging, accommodation pays twice for it: at purchasing and at disposal.
References
Conservation International, Linking Communities, Tourism & Conservation: A Tourism
Assessment Process, Conservation International, 2005, Washington DC. ISBN 1-8811
73-43-7.
EC, technical report on best environmental management practice for the retail trade
sector, EC (IPTS), 2011, Seville. Available to download from:
http://susproc.jrc.ec.europa.eu/activities/emas/retail.html
Ecotrans, Environmental initiatives by European tourism businesses: Instruments,
indicators and practical examples, Ecotrans, 2006, Saarbrücken

Chapter 6
Best Environmental Management Practise in the Tourism Sector 321
EEA, European Environment, State and Outlook 2010, EEA, 2010, Copenhagen. ISBN
978-92-9213-155-5.
EIONET, Waste reports and publications webpage, accessed January 2012:
http://scp.eionet.europa.eu/publications/
Envirowise, Cost-effective management of organic waste from the food and drink and
hospitality sectors (Guide GG808), Envirowise, 2008, Didcot.
Eurostat, Environmental statistics and accounts in Europe – 2010 edition, Eurostat, 2010,
Luxembourg. ISBN 978-92-79-15701-1.
IFC, Environmental, Health, and Safety Guidelines for Tourism and Hospitality
Development, IFC, 2007, Washington D.C.
Miljøstyrelsen, Arbejdsrapport fra Miljøstyrelsen Nr. 21 2000: Kortlægning af
affaldssammensætningen i servicesektoren; Institutioner, handel og kontor,
Miljøstyrelsen, 2000, Copenhagen.
SFT (Statens forurensningstilsyn), Analysis of Municipal Waste, SFT, Oslo, 1998.
Sol Media, Sustainable Development webpage for waste, accessed June 2011:
http://fr.solmelia.com/html/dsostenible/en/residuos.html

Chapter 6
322 Best Environmental Management Practise in the Tourism Sector
6.1 Waste prevention Description The first step in waste prevention and management in accommodation is to generate an
inventory of the types and sources of on-site waste generation. Waste generated by
accommodation is diverse, with a similar composition to domestic (municipal) waste, and
comprises paper and cardboard items, glass and aluminium products, plastic items, organic
waste, building materials and furniture, and used oils and fats (see Figure 6.2 in section 6). The
Danish EPA conducted a waste survey of all service sector operations in Denmark in 2000,
including accommodation facilities, and conference and course centres (Table 6.1). Hotels were
generally found to sort into four main waste types: ordinary (residual) waste, bottles and other
glass jars, organic waste and cardboard packaging.
Table 6.1: Typical waste constituents from different types of hotel, according to Danish waste
classification
Hotels with restaurants Holiday centres
mixed waste for incineration
batteries
waste with household characteristics
bottles and glass
garden and park waste
iron and metal
organic waste
fluorescent tubes
cardboard waste
paper
plastic packaging
machines
equipment and furnishings
refrigerators
electric and electronic products
mixed waste for incineration
batteries
waste with household characteristics
bottles and glass
garden and park waste
iron and metal
organic waste
fluorescent tubes
cardboard waste
paper
plastic packaging
machines
equipment and furnishings
Source: Miljøstyrelsen (2000).
Table 6.2 presents the results from a more recent analysis of waste management in 36 hotels in
the 2- to 4- star categories in Germany and Austria. Total waste generation averaged 1.98 kg (6
litres), per guest-night. Plastic and metal comprised a relatively small proportion of overall
waste in this survey, but this may reflect low separation rates for these materials. The
classification of waste in accommodation depends on the degree of sorting, and 'residual'
classification is typically applied to a large proportion of waste where sorting rates are low.
Waste types and quantities from accommodation depend on the services offered, especially in
relation to food and beverage services.
Table 6.2: Waste percentages from Survey among German and Austrian hotels
Residual Paper Glass Plastic and
metal Organic
kg 49 % 12 % 6 % 2 % 31 %
Litre 55 % 23 % 5 % 8 % 9 %
Source: Ecotrans (2006).

Chapter 6
Best Environmental Management Practise in the Tourism Sector 323
Hazardous wastes may include batteries, solvents, paints, antifouling agents, some packaging
wastes, leftover insecticides and pesticides, leftover chlorine and hydrochloric acid from
swimming pool operations, and de-icing chemicals. Generally the amount of hazardous waste
resulting from hotel operations is small. Commission Decision 2000/532/EC lists how
hazardous waste, including electronic equipment, shall be separated, collected and disposed of.
Directives 2002/96/EC and 2002/95/EC of the European Parliament and the Council specify
hazardous waste types affected.
A large portion of accommodation waste can be readily eliminated from the waste stream
through prevention measures and recycling (section 6.2), informed by a site-specific waste
inventory. An effective waste management programme can usually reduce the volume of waste
sent to landfill or incineration by more than 50 % (Travel Foundation, 2011). Waste
management programmes also save money by improving the use of materials and resources, and
by lowering waste disposal costs. Senior management and procurement staff, housekeeping
staff, catering staff and reception staff must be fully involved with waste management
programmes to ensure effective implementation of prevention measures (Table 6.3).
Following the creation of a waste inventory, waste prevention and minimisation are the first
priority steps in waste management and resource efficiency (see Figure 6.3 in section 6). There
is considerable scope to prevent waste in the accommodation sector by taking a number of
actions across different departments (Table 6.3).
Table 6.3: Best practice measures to prevent and avoid waste
Department Measure Description
All (management
led)
Develop waste
inventory
Survey all areas and processes to identify types and
sources of on-site waste generation
Procurement
Efficient ordering
and storage
Order perishable products frequently in quantities
required. Store perishable products in appropriate
conditions (e.g. correctly adjusted refrigeration units:
section 8.4). Order non-perishable products in bulk
Local sourcing and
packaging return
Source food locally where appropriate, and return
packaging for reuse (see also section 8.1)
Select low packaging
products
Select products with less packaging where possible
and consistent with other green procurement criteria
(section 2.2) – e.g. purchase chemicals in concentrate
form
Housekeeping
Efficient bathroom
toiletries
Replace individually wrapped soaps and shampoos
with soap and shampoo dispensers. Provide
additional toiletry items only on request
Efficient
housekeeping
Avoid use of bags in bins, or where used, replace
only when soiled
Catering
Provision of low
impact drinking
water
Avoid bought-in bottled water where possible.
Provide guests with tap water in rooms and dining
area (may be filtered and bottled), and provide
reusable glasses for drinking
Efficient breakfast
provision
Avoid single-portion servings as far as possible
within hygiene constraints, and cook to order (see
also section 8.1). Avoid single-use plates, cutlery, etc.
Reception Efficient document
management
Print documents only when absolutely necessary,
double-sided in small font. Use electronic billing.
Packaging alone can account for up to 40 % of a hotel’s waste stream (Travel Foundation,
2011), and avoiding single-use and individually wrapped items can prevent a considerable
Chapter 6
324 Best Environmental Management Practise in the Tourism Sector
quantity of waste. The quantity of packaging is a relevant criteria for green procurement
decisions, and it may be possible to return packaging to local suppliers for reuse – such
practices may be negotiated with suppliers where they are not already offered. Procurement of
concentrated products (e.g. chemicals) can also reduce packaging requirements, as can buying
in bulk where appropriate, and avoiding over-ordering of perishable products. Accor (2007)
estimated that just 30 % of individual hygiene products provided to guests are used, leading to
considerable product waste in addition to packaging waste. Installation of soap and shampoo
dispensers is one effective and economic measure to reduce waste. Similarly, there is often
scope to reduce individually wrapped portions provided for breakfast, and to install tap-water
dispensers (with filtration and bottling systems where necessary) to reduce the purchase of
bottled water. Provision of information electronically, including electronic invoices and
newspapers, instead of hard copies, can significantly reduce paper waste.
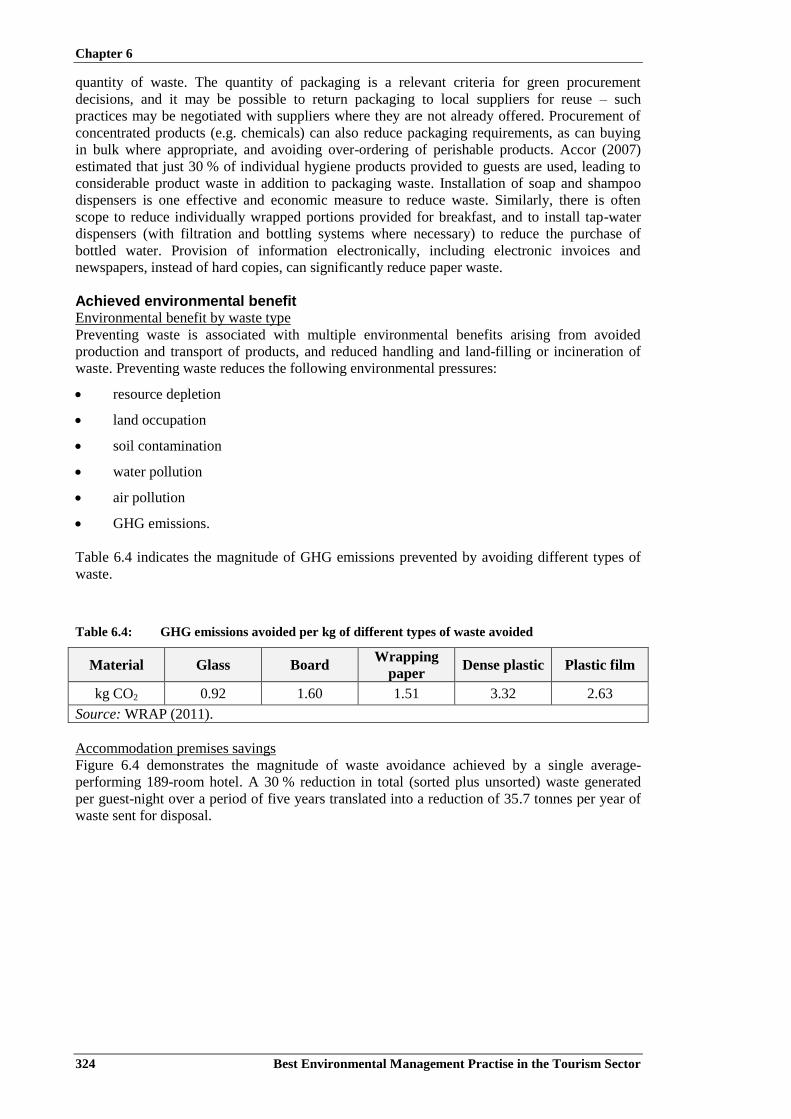
Achieved environmental benefit Environmental benefit by waste type
Preventing waste is associated with multiple environmental benefits arising from avoided
production and transport of products, and reduced handling and land-filling or incineration of
waste. Preventing waste reduces the following environmental pressures:
resource depletion
land occupation
soil contamination
water pollution
air pollution
GHG emissions.
Table 6.4 indicates the magnitude of GHG emissions prevented by avoiding different types of
waste.
Table 6.4: GHG emissions avoided per kg of different types of waste avoided
Material Glass Board Wrapping
paper Dense plastic Plastic film
kg CO2 0.92 1.60 1.51 3.32 2.63
Source: WRAP (2011).
Accommodation premises savings
Figure 6.4 demonstrates the magnitude of waste avoidance achieved by a single average-
performing 189-room hotel. A 30 % reduction in total (sorted plus unsorted) waste generated
per guest-night over a period of five years translated into a reduction of 35.7 tonnes per year of
waste sent for disposal.

Chapter 6
Best Environmental Management Practise in the Tourism Sector 325
0
20
40
60
80
100
2005 2010Year
To
tal w
aste
(to
nn
es)
. -37 %
(35.7 t/yr)
0.0
0.5
1.0
1.5
2005 2010Year
Sp
ecific
wa
ste
ge
ne
ratio
n
(kg
/gn
)
-30 %
(0.4 kg/gn)
Figure 6.4: Trend in total (left) and specific (right) unsorted waste generation for a 189-room
hotel between 2005 and 2010
Meanwhile, a reduction of waste generation per guest-night from the median of the 135 hotels
displayed in Figure 6.5 (1.05 kg/guest-night) to the best-performing tenth percentile (0.59
kg/guest-night) would represent a 44 % reduction in the environmental pressures listed above
associated with production and disposal of waste products. Thus, implementation of waste
prevention measures could easily lead to a reduction in waste-incurred environmental impact of
30 % to 50 % for average hotels and other accommodation.
The Scandic Hotel group found that only 15 % of individual soaps and shampoos provided to
guests were used. Following the installation of soap and shampoo dispensers and associated
bulk buying (see Figure 6.7), Scandic Hotels reduced waste volume by 40 %, including a
reduction of 11 tonnes per year in packaging waste.
In relation to bottled water alone, an estimated 2.7 million tonnes of plastic are used to bottle
water globally each year, and 25 % of bottled water is exported across national boundaries
(EEA, 2010). In addition to environmental pressures arising from production and disposal of the
plastic (e.g. non-renewable resource depletion), transport of bottled water incurs environmental
pressures including energy consumption, GHG emissions, air emissions and congestion,
compared with minor pressures arising from the piped transport of drinking water from
treatment works to consumers' taps (EPI, 2007). By replacing bottled water with filtered tap
water provided in reused glass bottles, one 65-room five-star hotel in London avoids the
purchase and disposal of 500 000 plastic bottles of 200 ml capacity and 200 000 plastic bottles
of 1 L capacity, and 205 tonnes of glass bottle, every year (Rafayel Hotel, 2011).
Appropriate environmental indicator Indicators
The total quantity of waste generated per guest-night is the most appropriate indicator of the
intensity of waste generation, and the effectiveness of accommodation management measures to
reduce it. To specifically reflect waste avoidance, sorted fractions sent for recycling should also
be included in total waste generation. The density of waste varies considerably depending on the
type and the degree of compaction. Therefore, the weight of waste generated is a more reliable
indicator of performance in waste avoidance than the volume of waste generated, and one
aspect of best practice is to monitor and record all waste generation by weighing waste
fractions. In the absence of weighing, waste quantities may be expressed by volume, easily
estimated from the number of waste receptacles (e.g. bins, skips) filled every day, week or
month. The weight of waste may be estimated from (non-compacted) volumes according to
estimated densities (Table 6.5).

Chapter 6
326 Best Environmental Management Practise in the Tourism Sector
Table 6.5: Average density of non-compacted waste fractions from different establishments
Type C
ard
Pa
per
&
card
Mix
ed
gla
ss
Mix
ed
recy
clin
g
Fo
od
Met
al
Mix
ed
pla
stic
Mix
ed
wa
ste
B&
B
Ho
tel
Ho
tel
&
rest
au
ra
nt
Pu
b
Density
(kg/L) 0.03 0.08 0.27 0.06 0.52 0.05 0.05 0.1 0.079 0.05 0.064 0.1
Source: ITP (2008); WRAP (2011).
Benchmark of excellence
Figure 6.5 displays the range of total waste generation (sorted plus unsorted) performance
across hotels in a mid-range European hotel chain, based on aggregated monthly data for 2010.
The median rate of waste generation across hotels in this chain is 1.05 kg per guest-night. Based
on the top tenth percentile of hotels in this chain, the following benchmark of excellence is
proposed:
BM: total waste generation (sorted plus unsorted) of ≤0.6 kg per guest-night.
0.0
0.5
1.0
1.5
2.0
2.5
3.0
3.5
To
tal w
aste
ge
ne
ratio
n (
kg
/ g
ue
st-
nig
ht)
Hotels
Proposed benchmark of excellence
Figure 6.5: A distribution curve for total waste generation (sorted and unsorted fractions) from
135 hotels within a mid-range European hotel chain
Cross-media effects Preventing waste is often associated with significant and multiple upstream, as well as
downstream (i.e. waste disposal) environmental benefits.
One aspect where some care may be required is packaging minimisation. When considering the
quantity of packaging in product selection, it is important to ensure that the risk of product
spoiling is not increased, as this could more than offset any reduction in packaging waste. Also,
product packaging is one criterion that should be considered alongside other, often more
important, lifecycle environmental criteria (e.g. production method, use efficiency) when
selecting environmentally responsible products.

Chapter 6
Best Environmental Management Practise in the Tourism Sector 327
Operational data Useful guidance on waste prevention has been compiled on a European Commission website
dedicated to the subject: http://ec.europa.eu/environment/waste/prevention/index.htm.
Firstly, it is useful for accommodation managers to generate an inventory of all the waste
arising in different parts of the premises, and possible measures to prevent or reduce this waste.
The main areas of waste generation are:
guest rooms
kitchen (see section 8.2 for organic waste management)
bar area
housekeeping stores.
A once-off survey may be performed to generate such an inventory, also identifying sources
(e.g. packaging of specific products).
It is also important to regularly monitor and record the total quantity of waste sent for recycling
or disposal, ideally following separation into fractions as defined in the subsequent section
(section 6.2): organic, glass, paper and cardboard, plastics, metals, electrical items, hazardous
wastes. The cost associated with disposal and recycling of these factions, based on local rates,
can be calculated in order to indicate the achievable cost savings. Costs associated with excess
purchasing should also be considered.
As an example, the Rafayel Hotel in London provides electronic newspapers for guest viewing
on large TV screens in rooms, and has a 'no plastics' policy. Guests are provided with water
filtered in-house and served in reusable glass bottles (Figure 6.6), using Vivreau bottling
technology.
Many hotel chains use refillable soap dispensers (Figure 6.7), and a considerable amount of
waste can be avoided by using reusable, or better still no, table cloths and place mats, and by
using refillable condiment and other food containers.
Source: Rafayel Hotel (2011).
Figure 6.6: Reusable glass bottles for filtered tap water, and entertainment screen in rooms on
which newspapers can be read, in a luxury hotel

Chapter 6
328 Best Environmental Management Practise in the Tourism Sector
Source: Scandic Berlin (2011).
Figure 6.7: Refillable soap dispenser, and tables set without tablecloths, and with reusable
napkins and refillable condiment containers
Table 6.6: Summary of items to avoid, items to select and actions to prevent waste in
accommodation
Avoid Select Do
bought-in bottled water
single-use hygiene products
single-portion food products
disposable plates, cups and
cutlery
excessive use of paper
napkins
items with unnecessary or
excessive packaging
offering newspapers and
magazines
refillable amenity dispensers
in guest bathrooms
food sold in bulk packaging
where appropriate
cloths instead of disposable
paper towels
durable coasters instead of
paper ones
electrical resistance or
refillable burners instead of
disposable heating fuel
cartridges for buffet lines
cloth bags or baskets instead
of plastic bags to collect and
return towels, linens and
guest laundry
refillable printer and copier
cartridges
rechargeable batteries
provide guests with filtered
tap water
provide guests with reusable
glasses and cups in rooms
put condiments and food
servings in refillable
containers
purchase chemicals in bulk
and dispense them from
refillable pump bottles or
containers
give preference to vendors
that supply their products in
returnable and reusable
containers
minimise the use of
hazardous chemicals (e.g.,
drain cleaning chemicals,
solvents and bleach)
provide electronic
information and newspapers
print double sided
collect outdoor waste in
canvas bags, wheelbarrows or
carts rather than in disposable
plastic
identify reuse possibilities
Source: ITP (2008); Travel Foundation (2011).

Chapter 6
Best Environmental Management Practise in the Tourism Sector 329
Accommodation managers may be able to influence suppliers to reduce packaging, or to use
returnable and reusable packaging (e.g. Gavarni Hotel Paris, Strattons Hotel UK). However,
packaging is just one of many sustainability criteria relevant to green procurement. Green
procurement selection should be informed by identification of product-specific environmental
hotspots, and products that perform well across these hotspots (section 2.2; section 8.1). One
effective method to reduce packaging from existing suppliers, or new suppliers selected
according to non-packaging-related green procurement criteria, is to return all packaging to
them (Green Hotelier, 2011).
Applicability Some hotel groups prefer to provide guests of higher classification hotels in certain countries
with individually-wrapped single-use hygiene products, citing customer expectations in those
countries (e.g. NH Hoteles, 2011). Nonetheless, effective waste prevention and avoidance can
be implemented by all types of accommodation, including high end luxury hotels – as
demonstrated by the example of the five-star Rafayel Hotel in London.
Economics Replacing single-use products with durable alternatives can often generate substantial cost
savings. For example, replacing disposable heating fuel cartridges with electric resistance
elements in a buffet line of 10 chafers (water vessels for heating food) avoids the purchase of
EUR 11 400 per year of disposable cartridges (Travel Foundation, 2011).
The Ascos Beach Hotel in Paphos, Cyprus, invested EUR 867 to purchase 3 000 reusable plastic
cups to replace disposable plastic cups, and stopped using plastic bin liners in guest rooms. In
the first year of operation, the disposal of 100 000 plastic cups was avoided, saving almost
EUR 2 000, and 50 % fewer bin liners were disposed of, saving a further EUR 300. Guest
satisfaction was not affected (Travel Foundation, 2011).
Driving force for implementation Legislation is an important driver for preventing and managing waste. Some relevant legislation
is listed in section 6, and on the European Commission's waste prevention website:
http://ec.europa.eu/environment/waste/prevention/index.htm. In particular, the Waste
Framework Directive (2008/98/EC) is an important driving force.
Waste prevention is closely related to resource efficiency and cost reductions. Avoiding excess
products and packaging can reduce purchasing costs and disposal costs. The cost of waste
disposal has increased sharply in most European countries over the past decade, and is likely to
continue increasing owing to escalating landfill and incineration taxes.
In summary, the driving forces to prevent waste are:
environmental responsibility
legislation
waste disposal costs
waste handling costs
excess product costs (partially used products and unnecessary packaging).
Reference companies Gavarni Hotel Paris (FR), Strattons Hotel (UK), Rafayel Hotel (UK), Scandic Hotel group.
References
Accor, Accor hotels environment charter practical guide, Accor, 2007, Paris.
Ecotrans, Environmental initiatives by European tourism businesses: Instruments,
indicators and practical examples, Ecotrans, 2006, Saarbrücken.

Chapter 6
330 Best Environmental Management Practise in the Tourism Sector
EEA, European Environment, State and Outlook 2010, EEA, 2010, Copenhagen. ISBN
978-92-9213-155-5.
Eurostat, Environmental statistics and accounts in Europe – 2010 edition, Eurostat, 2010,
Luxembourg. ISBN 978-92-79-15701-1.
Green Hotelier, Know-how: Sustainability in the kitchen part two: food and drink, Green
Hotelier, www.greenhotelier.org, 2011
ITP, Environmental Management for Hotels, ITP, 2008, London UK.
Miljøstyrelsen, Arbejdsrapport fra Miljøstyrelsen Nr. 21 2000: Kortlægning af
affaldssammensætningen i servicesektoren; Institutioner, handel og kontor,
Miljøstyrelsen, 2000, Copenhagen.
NH Hotels, personal communication with sustainable development personnel 27.09.2011.
Rafayel Hotel, personal communication June 2011.
Scandic Berlin, personal communication June 2011.
Travel Foundation, Green business tools: greener accommodations – Waste, website
accessed December 2011:
http://www.thetravelfoundation.org.uk/green_business_tools/greener_accommodations/w
aste/
WRAP, The composition of waste disposed of by the UK hospitality industry, WRAP,
2011, UK. ISBN 1-84405-452-7.

Chapter 6
Best Environmental Management Practise in the Tourism Sector 331
6.2 Waste sorting and sending for recycling
Description On average, hotels generate approximately one kg of unsorted waste per guest per night (ITP,
2008), equating to 66 tonnes per hotel per year in the UK (WRAP, 2011). Waste disposal costs
are likely to increase steadily in the future due to diminishing landfill space and increasing
collection and disposal costs. Poor waste management has implications for hygiene and health,
environmental quality, resource and economic sustainability. As outlined in section 6, a
multitude of regulations pertain to waste management and handling, including local, national
and European waste regulations, health and safety regulations in relation to waste handling,
noise regulations in relation to compaction and collection operations (Waste Management
World, 2011). The largest waste fractions generated by hotels are glass, organic, cardboard and
paper, metals and plastics. Organic waste originates mainly from kitchen activities, for example
preparing breakfast and meals for in-house restaurants. Best practice for organic waste
management is described in section 8.2, in the chapter addressing kitchens. Meanwhile,
economic factors are driving widespread glass recycling, with a similar situation evolving for
cardboard and paper fractions. This section therefore focuses on best practice for the
management of non-organic waste, and especially plastic waste, arising in accommodation.
Hotels face a range of barriers to sorting and recycling their waste. They are to some extent
limited by the waste management infrastructure in their locality, often owned and operated by
the local authority, especially if they are not able to find other takers for waste fractions that the
local system does not accept. In city hotels, available ground floor space may constrain the
storage of multiple bins for separated waste fractions – front-of-house areas such as reception,
lobby, restaurant and banqueting facilities are prioritised for ground floor space. However,
experience shows that there are many innovative means of sorting and recycling waste in
accommodation, in the process reducing disposal costs. Figure 6.8 presents an example of the
high sorting and recycling rates achievable by best performers, summarising data for a small
UK hotel where 98 % of waste is recycled. Interesting aspects of the hotel's waste minimisation
strategy include the reuse of clear bottles in the kitchen and return of food and drink packaging
for reuse by local suppliers.
2600
2100
1702
7447 130
252Compost
Glass
Paper
Cardboard
Plastics
Cans/foils
Residual
6 905 kg/yr
98 % recycled
Non-recycled
fraction
Source: Envirowise (2008).
Figure 6.8: Sorted waste fractions recorded and recycled in a small 14-room boutique UK hotel
and restaurant

Chapter 6
332 Best Environmental Management Practise in the Tourism Sector
As described in section 6.1, a relevant starting point for waste prevention, sorting and recycling
is to record on-site waste generation by category and source. In addition, it may be necessary to
perform or organise a study exploring local reuse and recycling options (Table 6.7). As outlined
in Figure 6.3 (section 6), where possible, opportunities for product reuse should be sought
before waste is sent for recycling. These may be on site or off site, and include options such as
returning packaging to suppliers. Implementation of a successful waste sorting and recycling
programme requires engaged management to coordinate technical and human resource
requirements across all departments, including relevant staff training and time allocation (Table
6.7). In particular, staff should receive clear instructions on what types of waste are to be sorted
and how, with specific responsibilities assigned. On-going monitoring and reporting of waste
quantities should be monitored and reported so that recycling rates and unsorted waste disposal
can be benchmarked to track progress. Consequently, hotels should seek to integrate waste
management into an overall EMS (see section 2.1).
Table 6.7: Best practice measures to separate and recycle waste
Department Measure Description
All (management
led)
Develop waste
inventory and
identify options
Survey of all areas and processes to identify types and
sources of on-site waste generation. Identify waste
recycling and packaging return options available
locally
Monitoring and
reporting
Continuously monitor and periodically report waste
generation and collection by fraction
Procurement Procurement
selection
Select products and packaging made from recycled
and recyclable material
Housekeeping
Waste bins Install separated waste collection bins in rooms
Waste collection in
rooms
Separate waste during room cleaning into fractions
collected separately from accommodation premises
Back-of-house waste
management
Separate waste arising from public areas, maintenance
of outdoor and indoor facilities, and other back-of-
house areas into appropriate fractions for recycling
and correct disposal
Catering
Green procurement
Consider packaging volume, production impact and
recyclability when assessing products for green
procurement (see section 8.1)
Separation
Install and train staff to use conveniently located bins
for separate collection of glass, plastics, and paper
and cardboard in kitchen and dining areas. See section
8.2 for separate organic collection
Reception and
public areas Collection points
Install collection points for paper and magazines,
batteries and other hazardous waste
Achieved environmental benefits Lifecycle environmental benefits
Figure 6.9 displays the lifecycle chain for extraction, production, consumption and waste
generation. Reuse, recovery and recycling within the economic sphere are associated with
environmental pressures, most notably energy consumption and emissions. However, these
actions avoid much greater pressures associated with extraction and waste disposal, particularly
resource depletion, energy consumption and emissions.

Chapter 6
Best Environmental Management Practise in the Tourism Sector 333
Source: EEA (2010).
Figure 6.9:The lifecycle chain for extraction, production, consumption, waste management
Table 6.8 indicates the GHG emissions avoided by recycling one kg of different types of waste.
Despite significant energy requirements to recycle some types of waste (e.g. glass transport and
recycling), GHG emission savings are significant compared with disposal and production of
new products with virgin materials.
Table 6.8: GHG emissions avoided per kg of different types of waste recycled
Material Glass Board Wrapping
paper Dense plastic Plastic film
kg CO2 0.39 1.08 0.99 1.20 1.08
Source: WRAP (2011).
However, recycling results in a range of environmental benefits, in addition to GHG reduction,
compared with disposal. Table 6.9 summarises the range of reuse and recycling options for
different types of material, and the main environmental benefits of reuse/recycling.

Chapter 6
334 Best Environmental Management Practise in the Tourism Sector
Table 6.9: Recycling options and associated environmental benefits for different materials
Material Recycling option Environmental benefit
Meat and fish
Send for anaerobic digestion or
composting, to local pig farm for feed
(legislation permitting) or compost onsite
using 'in vessel' composter Reduced GHG emissions,
water pollution, landfill
Other organic
waste
Send for anaerobic digestion or
composting, to local pig farm for feed
(legislation permitting) or compost on site
Garden
greenery Compost on site, chip and use as mulch on
site, or send for composting
Used cooking
oil Send for conversion to biodiesel
Reduced resource depletion,
water pollution and landfill
Cork Send to make insulation, tiles, pin-boards,
soil mulch, etc.
Reduced resource depletion
and landfill
Aluminium
cans and foil Send for recycling and use in aluminium
industry
Reduced resource depletion
and landfill, and 75 – 90%
reduction in energy and air
pollution compared with
virgin aluminium
production
Glass
Send bottles for reuse where possible, and
send remaining glass fractions for
crushing and recycling into new glass
products
Reduced landfill and 20 –
30% reduction in energy
compared with virgin glass.
Recycling one tonne saves
100 kg oil
Paper and card Separate into fractions (low- and high-
grade) as specified by collectors and send
for recycling
Reduced resource
consumption, landfill and
energy
Plastics
Return to supplier (packaging) or send for
recycling into new plastic products
through melting and remoulding or
shredding Depends on types of plastic: see
Table 6.11
Other
packaging
Select new, or work with existing,
suppliers to reduce non-recyclable
packaging waste
White goods Return to supplier for recycling and
disposal
Reduced soil, water and air
pollution from leakages
Chemicals and
pharmaceutica
ls
Return to supplier or send to specialist
contractor
Batteries and
lighting Return to supplier or send to specialist
contractor
Engine oils Send to specialist contractor
Accommodation premises savings
Table 6.10 summarises the energy and GHG emission savings associated with recycling
different materials, and indicates the magnitude of environmental savings achievable for a small
14-room hotel (Figure 6.8).

Chapter 6
Best Environmental Management Practise in the Tourism Sector 335
Table 6.10: GHG and energy savings from recycling compared with land-filling, and an example
of savings achievable for a small 14-room hotel (Figure 6.8)
Recycled fraction
GHG
saving
from
recycling
Energy
saving
from
recycling
Small hotel
waste
generation
GHG
emissions
avoided by
small hotel
with 84 %
recycling rate
Eenergy saved
by small hotel
with 84 %
recycling rate
kg CO2
eq./kg kWh/kg kg Kg CO2 eq./yr kWh/yr
Paper & card 1.0 4.1 1 954 1 700 6 730
Plastic 1.10 6.9 74 70.8 429
Metal 3.30 20.5 47 58.9 1 274
Glass 0.39 1.17 2 100 712.5 2 058
Source: Envirowise (2008); Browne et al. (2009); WRAP (2011).
Compliance across the entire hotel chain represented in presented Figure 6.12 with the proposed
benchmark of 0.16 kg waste per guest-night would lead to a reduction in unsorted waste sent to
landfill or incineration of 0.3 kg per guest-night. Compliance with the proposed benchmark
across average hotels generating one kg residual waste per guest-night (ITP, 2008) would
reduce the quantity of unsorted waste sent to landfill or incineration by 0.84 kg per guest-night.
These reductions would translate into annual reductions in unsorted waste collection from a
high occupancy 100 room hotel of 11 tonnes and 31 tonnes, respectively. In turn, these waste
reductions would lead to annual GHG avoidance of over 13 t CO2 eq., and annual energy
avoidance of over 70 MWh, per hotel (Figure 6.10).
0
2
4
6
8
10
12
14
16
GHG
Avo
ide
d G
HG
(t C
O2e
q./yr)
.
Glass
Metal
Plastic
Paper&card
0
10
20
30
40
50
60
70
80
Energy
Avoid
ed e
nerg
y c
onsum
ption (
MW
h/y
r) .
Glass
Metal
Plastic
Paper&card
NB: Assumes average 80 % room occupancy, and 25 % double occupancy within occupied rooms,
residual waste reduction from 1.0 to 0.16 kg per guest-night, residual waste fractions as per WRAP
(2011).
Figure 6.10: Potential annual GHG and energy savings for a 100-room hotel arising from
achieving residual waste of 0.16 kg per guest-night (excludes organic fraction)
Appropriate environmental indicator Indicators
There are two primary indicators of performance in terms of sorting and recycling waste
generated on accommodation premises:

Chapter 6
336 Best Environmental Management Practise in the Tourism Sector
the proportion of waste that is sorted and sent for recycling (percentage mass of total
waste)
the quantity of unsorted waste sent for disposal (kg per guest-night).
Benchmarks of excellence
Figure 6.11 displays the range of recycling rates across hotels in a mid-range European hotel
chain, based on aggregated monthly data for 2010. The median recycling rate across hotels in
the chain is 56 %, and the top tenth percentile best performers achieve recycling rates above
84 %.
0%
20%
40%
60%
80%
100%
Pro
po
rtio
n o
f w
aste
so
rte
d f
or
recyclin
g
Hotels
Proposed benchmark of excellence (84% waste sorted and sent for recycling)
Figure 6.11: Distribution of recycling rates across hotels in a mid-range European hotel chain
Figure 6.12 displays the range of unsorted waste generated per guest-night (final waste sent for
disposal) across hotels in a mid-range European hotel chain, based on aggregated monthly data
for 2010.
The median quantity of unsorted waste per guest-night is 0.46 kg, and the top tenth percentile
best performers generate less than 0.16 kg of unsorted waste per guest-night.
Thus, the following benchmarks of excellence are proposed:
BM: at least 84 % of waste, expressed on a weight basis, is recycled
BM: unsorted waste sent for disposal is less than 0.16 kg per guest-night.

Chapter 6
Best Environmental Management Practise in the Tourism Sector 337
0.0
0.5
1.0
1.5
2.0
2.5
3.0
3.5
Un
so
rte
d w
aste
(kg
/ g
ue
st-
nig
ht)
Hotels
Proposed benchmark of excellence
Figure 6.12: Distribution of unsorted waste sent for disposal across hotels in a mid-range
European hotel chain
Cross-media effects As represented in Figure 6.9, recycling is associated with energy consumption and other
environmental impacts that arise during collection, transport and recovery operations. These
impacts are usually considerably smaller than impacts arising from production from raw
materials (Table 6.10). A detailed lifecycle assessment for PET recycling demonstrated that the
environmental impact of recycling is comprised of logistics activities (37 % of overall burden)
and production of PET (63 % of overall burden) (Figure 6.13). However, PET recycling is
significantly more environmentally friendly than the incineration of the PET bottles in
municipal waste incineration plants with waste heat recovery (Dinkel, 2008).
Packaging volume and recyclability is one of a number of important environmental criteria that
should be considered in the context of lifecycle impacts when making procurement decisions
(section 2.2). For many products, the production and/or use phases dominate lifecycle
environmental impacts, so that procurement decisions based on packaging alone may not
identify the best performing products from an overall environmental perspective.

Chapter 6
338 Best Environmental Management Practise in the Tourism Sector
Logistics Infrastructure
Logistics
R-PET
bottle-grade
Production of
granulate
63.3 %
All collection bags
4.2 %
All collections containers
3.0 %
Transport from sorting
centre to recycler (6) 22.6 %
Transport collection
points to recycling (7)
6.9 %
Infrastructure
1.7 %
Electricity
19.6 %
Sorting
8.7 %
Disposal in incineration
plants
5.2 %
Natural gas 2.5 %
Packaging
1.0 %
Plastic container0.2 %
Metal container 2.8 %
Packaging strap
3.4 %
Transport , HGV
1.9 %
Transport of partners to
sorting centre (3)
1.9 %
Transport from
consolidating centre to
sorting centre (4) 3.6 %
Transport from collection
points to sorting centre (5)
11.8 %
Packaging strap3.4 %
Transport , HGV3.5 %
Disposal in incineration
plants
0.3 %
Wastewater treatment
and emissions
7.4 %
Chemicals8.2 %
Heat incineration plant
Diesel
0.4 %
Packaging strap3.5 %
Infrastructure
2.2 %Heating oil 0.2 %
Electricity
Packaging strap
0.7 %Transport , LGV
1.8 %
Transport , HGV 0.2 %
Transport sorting points to
consolidating centre (2)
0.9 %
Packaging strap
2.4 %
Transport , HGV7.1 %
Transport , LGV
2.3 %
Energy
31.1 %
Energy2.7 %
Transport from collection
points to transport partner
(1), LGV 0.3 %
Transport , LGV 0.7 %
Transport , HGV
0.9 %
9.0 %
2.1 %
Transport , HGV
Transport , LGV
0.3 %
0.6 %
NB: The impact was calculated according to the Swiss Ecological Scarcity Method (Frischknecht et
al., 2008), Legend: HGV = Heavy goods vehicles, LGV = Light goods vehicles.
Source: Dinkel, 2008.
Figure 6.13: Environmental impact of the production of bottle-grade PET-flakes from recycled
PET bottles
Operational data
Hazardous waste
A basic practice is to ensure that all hazardous waste, including chemicals, electronic equipment
and fluorescent bulbs, is disposed of correctly, as required under relevant legislation and as
recommended by producers (e.g. on packaging) or suppliers. Battery collection points may be
provided at the reception for guests.
Waste inventory and reuse-recycling feasibility study
As for waste prevention described in section 6.1, developing an inventory of on-site waste types
and sources is a relevant starting point for waste recycling and minimisation of residual waste.
This requires management coordination and involves all departments, for example:
housekeeping
catering
leisure facilities
maintenance
office.
Catering and housekeeping typically account for the majority of waste in accommodation. The
initial waste inventory should be sufficiently detailed so that the major sources of all waste can
be identified. Many sources can be identified from a simple tour of the premises, but in some
cases there may be specific products to which large volumes of waste can be attributed, and that
requires the involvement of specific relevant staff to identify. The information generated may
then inform procurement decisions within a lifecycle context (see section 2.2 on supply chain
management), and indicate existing recycling potential.

Chapter 6
Best Environmental Management Practise in the Tourism Sector 339
With respect to economic implications, charges for collection of different waste fractions vary
considerably across, and sometimes within, European countries. Therefore, it is important to
identify locally applicable costs associated with various reuse, waste recycling and disposal
options. It may be possible to form partnerships with other local enterprises producing similar
types of waste in order to efficiently implement recycling collection or delivery (e.g. by
guaranteeing the existence of a sufficiently large recyclable waste fraction for providers to
collect separately, or by making organised delivery of waste fractions to central waste
management stations economic). Alternatively, it may be possible to reach agreements with
suppliers who may take back used products. For example, magazines provided to guests in the
Rafayel Hotel in London are returned to the publishers for recycling.
Housekeeping
Housekeeping staff may separate waste from guest
rooms, but some hotel groups have a policy for staff,
based on health and safety concerns, not to retrieve
waste already placed in bins (Accor, 2007). One
solution to this problem is the provision of recycling
bins in guest rooms, such as those provide in Scandic
Hotels (left, inset). These bins comprise three separate
compartments to facilitate sorting of organic, paper
and other materials (inset, left).
The Hilton Slussen in Stockholm separates waste into
26 different fractions (ITP, 2008). However, for a
typical hotel, it is usually unnecessary to separate
waste into so many fractions – depending on the
collection and recycling service. The Savoy hotel in
London sends over 95 % of waste for reuse or
recycling. Waste from throughout the hotel, including
rooms, is separated into eight fractions: glass,
cardboard and paper, wood, plastic and metal, cork,
organic oil, batteries, and electrical. Housekeeping staff recover recyclable waste from room
bins. One company deals with the majority of the waste, and undertakes further separation after
collection (The Savoy, 2011).
Catering
Management of organic kitchen waste is described in section 8.2. The Savoy in London
incorporates a large kitchen for its restaurants, three smaller banqueting kitchens, and a staff
canteen kitchen, and provides a particularly good example of catering waste management.
Kitchen waste is carefully separated at source into the eight recycling streams listed above. Of
particular note is the installation of a new automated system to monitor and change cooking oil,
and store used oil centrally for collection to be converted into biodiesel. In addition, a use has
been found for the thousands of bottle corks produced every week from the hotel and associated
restaurants. Two 140-litre bins of corks are collected by catering staff every week and returned
to Laithwaite's wine suppliers, who shred them to produce a mulch that is applied to their
vineyards to help maintain soil moisture and suppress weeds (The Savoy, 2011).
Plastic waste recycling
Plastics represent a significant fraction of waste from accommodation which create
environmental problems when sent to landfill owing to their slow decomposition. Many types of
plastic are available across a wide range of products, some of which are easier and more likely
to be recycled than others (Table 6.11). These may be identified by commonly used symbols
similar to those displayed in Table 6.11 and referred to in the ISO 11469 standard relating to the
generic identification and marking of plastics products. Depending on the area and service
provider, mixed plastics may be collected for subsequent separation of recyclable fractions, or
accommodation staff may have to separate specific recyclable fractions. In either case, an
important aspect to consider in green procurement decisions is the use of difficult-to-recycle
Recycling bin in Scandic Berlin
Chapter 6
340 Best Environmental Management Practise in the Tourism Sector
plastics such as polyvinyl chloride, low density polyethylene and polystyrene (Table 6.11) in
consumable products and packaging. Packaging minimisation and reuse (without affecting
product quality and longevity) is the most straightforward measure to reduce waste from a
lifecycle perspective. Accommodation managers may request suppliers of preferred products to
improve the environmental performance, including recyclability, of their packaging.
Lifecycle impacts of packaging are heavily dependent on factors such as whether or not
recycled material is used in production, different packaging weights associated with alternative
materials, manufacturing location and methods, transport distance, energy sources, fate of used
products, etc. (Öko-Institut, 2008). In a study of alternative drinking cup options for the Euro
2008 football games in Germany, Austria and Switzerland, Öko-Institut (2008) used LCA
methods to assess the environmental performance of different cup types. Based on the Eco-
Indicator-99 method, cups were ranked in the following order of environmental preference (best
first):
reusable PP cups (1st)
disposable cardboard cups (2nd
)
disposable PET cups (3rd
)
disposable biodegradable polyacetide cups (4th)
disposable PS cups (5th).
The results from this study highlight the environmental superiority of light-weight reusable
cups, and cardboard over polystyrene cups.

Chapter 6
Best Environmental Management Practise in the Tourism Sector 341
Table 6.11: Main types of plastic, their identifiers, typical applications, and recyclability
Polymer Identifier
symbol(*)
Typical relevant
applications Example Recyclability
Polyethylene
Terephthalate
Drinks bottles; food
containers; condiment
containers.
Very good.
Recycled into
new bottles
and clothes.
High Density
PolyEthylene
Chemical containers (e.g.
detergents, cosmetics);
water pipes; garden
furniture; other outdoor
equipment such as water
butts, potting trays,
flower pots.
Good.
Recycled to
produce new
bottles or
pipes.
Polyvinyl
Chloride
Bubble-wrap packaging;
cling film for non-food
use; electrical cable
insulation; rigid piping;
window and door frames.
Poor owing to
additives.
Low Density
Polyethylene
Shrink wraps; frozen
food bags; squeezable
bottles; cling films;
flexible container lids.
Poor owing to
economics and
frequent
contamination
of films with
e.g. food.
Polypropylene
Reusable microwaveable
ware; kitchenware;
yogurt containers;
margarine tubs;
microwaveable
disposable take-away
containers; disposable
cups; plates; bottle tops;
nappies.
Poor. Wide
range of types
and grade
make recycling
difficult.
Polystyrene
Egg cartons; packaging
protection; disposable
cups, plates, trays and
cutlery; disposable take-
away containers.
Poor owing to
economics.
Other (e.g.
polycarbonate)
Beverage bottles; baby
milk bottles; compact
discs; 'unbreakable'
glazing; electronic
apparatus housings.
Poor because
often present
in components
of mixed
plastic.
(*)American Society of the Plastics Industry. Symbols may vary across Europe (e.g.
German DIN pre-fixes numbers with '0').
Source: Demesne (2011); Marius Pedersen (2011); Recyclemore (2011); British Plastics
Federation (2011); Wikipedia (2011).

Chapter 6
342 Best Environmental Management Practise in the Tourism Sector
Storage and collection
Storage areas for waste fractions may be limited in some hotels, particularly those located in
city centres. Compaction and densification of waste fractions using compactors, shredders or
balers reduces storage area requirements and transport costs. Waste volume may be reduced 20
to 50 fold (Waste Care Corporation, 2011). The Savoy hotel in London compresses cardboard
and paper waste into bales for collection, and stores plastic, metal and wood in a large
compactor for collection and subsequent separation (Table 6.12).
Table 6.12: Waste compactor and compressed cardboard for collection from a large hotel
Source: The Savoy (2011).
Donate items for reuse
Having addressed waste at source, the next step is to put appropriate systems in place to identify
how the remaining waste can be redeployed, on site or by external organisations (ITP, 2008).
Amongst others, Carlson Hotels Worldwide, Radisson Hotels & Resorts, Marriott International
and Fairmont Hotels and Resorts donate untouched food from catering displays and trolleys,
unwanted bed linens, mending kits and bathroom amenities to community projects such as
homeless shelters, orphanages, homes for the elderly and drug rehabilitation centres, sometimes
working through charitable organisations (Waste Management World, 2011).
Case Studies
Strattons Hotel
Strattons Hotel in Norfolk (UK) provides a good example of extensive reuse and recycling in a
small boutique hotel (see Figure 6.8 above).
Hilton Slussen Hotel
Amongst larger high-end hotels, the Hilton Slussen in Stockholm sorts waste into 26 different
bins. Introduction of a sorting and recycling scheme in 1997 reduced the 125 tonnes per month
sent to landfill by 76 %, to 0.3 kg per guest-night. Cardboard was diverted to recycling, wooden
pallets were diverted for heating buildings outside Stockholm, and other combustible materials
were sent to generate district heating for apartments. Candle stumps were diverted to day care
centres and to a church to be made into new candles for sale (ITP, 2008).
Chapter 6
Best Environmental Management Practise in the Tourism Sector 343
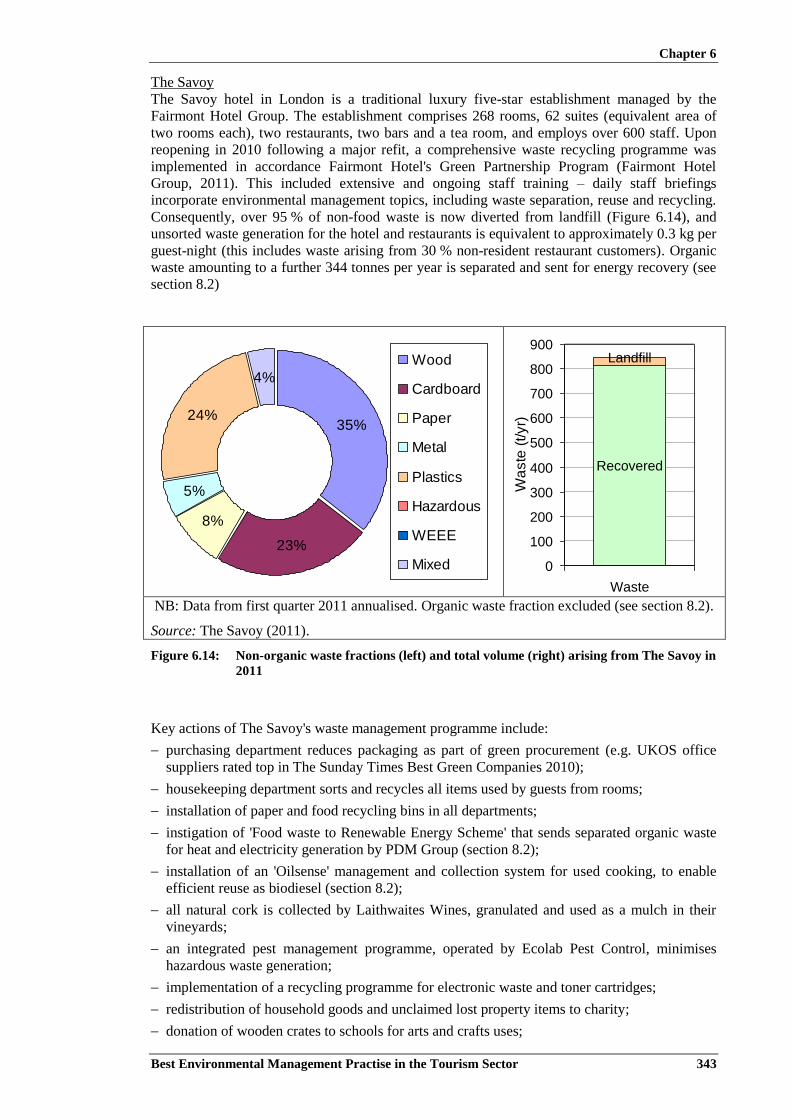
The Savoy
The Savoy hotel in London is a traditional luxury five-star establishment managed by the
Fairmont Hotel Group. The establishment comprises 268 rooms, 62 suites (equivalent area of
two rooms each), two restaurants, two bars and a tea room, and employs over 600 staff. Upon
reopening in 2010 following a major refit, a comprehensive waste recycling programme was
implemented in accordance Fairmont Hotel's Green Partnership Program (Fairmont Hotel
Group, 2011). This included extensive and ongoing staff training – daily staff briefings
incorporate environmental management topics, including waste separation, reuse and recycling.
Consequently, over 95 % of non-food waste is now diverted from landfill (Figure 6.14), and
unsorted waste generation for the hotel and restaurants is equivalent to approximately 0.3 kg per
guest-night (this includes waste arising from 30 % non-resident restaurant customers). Organic
waste amounting to a further 344 tonnes per year is separated and sent for energy recovery (see
section 8.2)
35%
23%
8%
5%
24%
4%
Wood
Cardboard
Paper
Metal
Plastics
Hazardous
WEEE
Mixed
Recovered
Landfill
0
100
200
300
400
500
600
700
800
900
Waste
Wa
ste
(t/yr)
NB: Data from first quarter 2011 annualised. Organic waste fraction excluded (see section 8.2).
Source: The Savoy (2011).
Figure 6.14: Non-organic waste fractions (left) and total volume (right) arising from The Savoy in
2011
Key actions of The Savoy's waste management programme include:
purchasing department reduces packaging as part of green procurement (e.g. UKOS office
suppliers rated top in The Sunday Times Best Green Companies 2010);
housekeeping department sorts and recycles all items used by guests from rooms;
installation of paper and food recycling bins in all departments;
instigation of 'Food waste to Renewable Energy Scheme' that sends separated organic waste
for heat and electricity generation by PDM Group (section 8.2);
installation of an 'Oilsense' management and collection system for used cooking, to enable
efficient reuse as biodiesel (section 8.2);
all natural cork is collected by Laithwaites Wines, granulated and used as a mulch in their
vineyards;
an integrated pest management programme, operated by Ecolab Pest Control, minimises
hazardous waste generation;
implementation of a recycling programme for electronic waste and toner cartridges;
redistribution of household goods and unclaimed lost property items to charity;
donation of wooden crates to schools for arts and crafts uses;

Chapter 6
344 Best Environmental Management Practise in the Tourism Sector
electronic document sending, double-sided printing and the use of whiteboards to minimise
paper usage.
Applicability
All types, sizes and grades of accommodation can implement waste recycling (see also example
of recycling on campsites in section 9.5).
Waste recycling options available to accommodation enterprises may be restricted in some
locations. The provision of waste recycling services varies considerably across countries and
localities, as indicated by the range of recycling rates across Europe (Figure 6.15; Figure 6.16).
In areas where the municipality or private companies do not collect separated materials for
recycling, accommodation managers can request the municipality to prioritise the provision of
such services and seek alternative solutions, as required in such situations by criteria for the EU
Ecolabel.
Even where collection services are not provided, proactive hotels are able to find solutions to
waste recycling though cooperation with other local stakeholders, for example by arranging
shared waste collection, or sending organic waste to local farmers for composting or biogas
production.
In rural areas where collection services are less likely to be provided, it is usually possible to
implement composting of the important organic waste fraction (section 8.2).
0
50
100
150
200
250
300
350
400
Austr
ia
Begiu
m
Cypru
s
Czech
Denm
ark
Esto
nia
Fin
land
Fra
nce
Germ
any
Irela
nd
Italy
Latv
ia
Lith
uania
Luxem
bourg
Neth
erlands
Norw
ay
Pola
nd
Port
ugal
Slo
vakia
Slo
venia
Spain
Sw
eden
Unite
d K
ingdom
EU
25+
Norw
ay
Waste
recyclin
g r
ate
(kg/c
ap/y
r) Others
Bulky waste
Glass, metals,
plastics
Organic
Paper and
cardboard
Source: ETC/SCP (2010).
Figure 6.15: Recycling rates for different fractions of municipal waste across EU Member States
and Norway
Chapter 6
Best Environmental Management Practise in the Tourism Sector 345
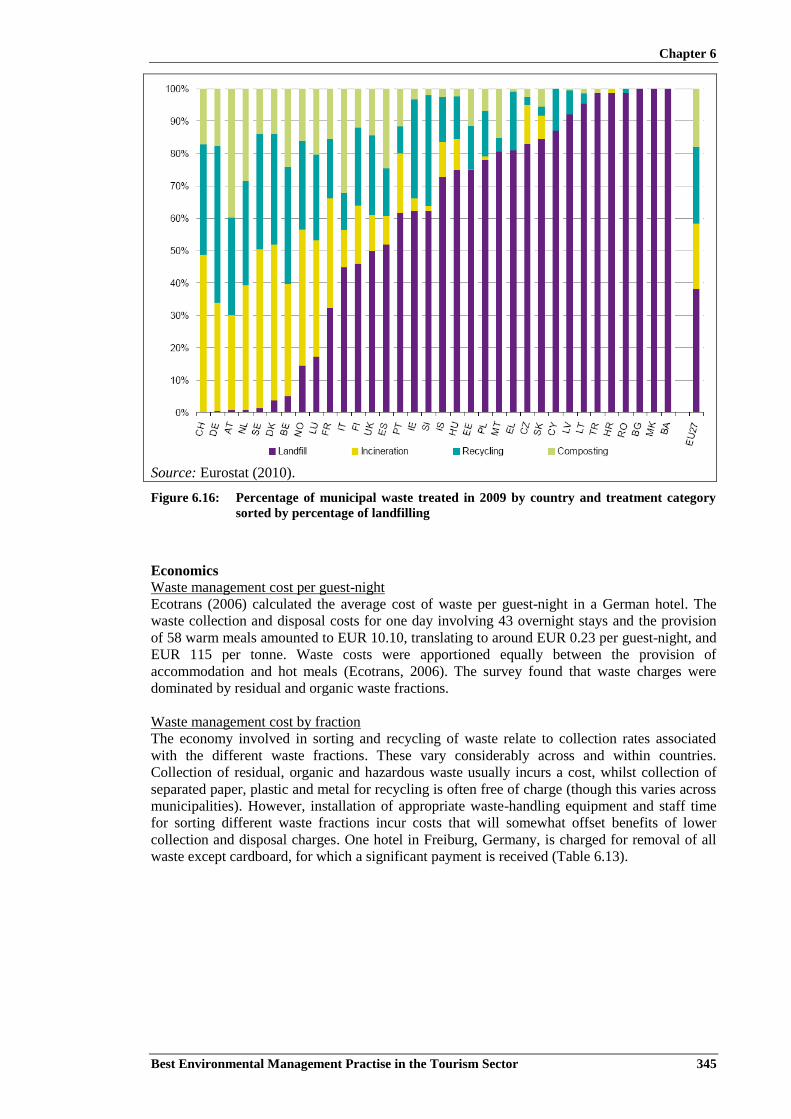
Source: Eurostat (2010).
Figure 6.16: Percentage of municipal waste treated in 2009 by country and treatment category
sorted by percentage of landfilling
Economics
Waste management cost per guest-night
Ecotrans (2006) calculated the average cost of waste per guest-night in a German hotel. The
waste collection and disposal costs for one day involving 43 overnight stays and the provision
of 58 warm meals amounted to EUR 10.10, translating to around EUR 0.23 per guest-night, and
EUR 115 per tonne. Waste costs were apportioned equally between the provision of
accommodation and hot meals (Ecotrans, 2006). The survey found that waste charges were
dominated by residual and organic waste fractions.
Waste management cost by fraction
The economy involved in sorting and recycling of waste relate to collection rates associated
with the different waste fractions. These vary considerably across and within countries.
Collection of residual, organic and hazardous waste usually incurs a cost, whilst collection of
separated paper, plastic and metal for recycling is often free of charge (though this varies across
municipalities). However, installation of appropriate waste-handling equipment and staff time
for sorting different waste fractions incur costs that will somewhat offset benefits of lower
collection and disposal charges. One hotel in Freiburg, Germany, is charged for removal of all
waste except cardboard, for which a significant payment is received (Table 6.13).

Chapter 6
346 Best Environmental Management Practise in the Tourism Sector
Table 6.13: A breakdown of waste management costs for one German hotel
Fraction Volume Transport Disposal Total cost
Tonnes EUR/tonne EUR
Waste for recycling 148.18 30.27 95.63 125.90 18 656.14
Building rubble sorted 7.88 11.68 6.50 18.18 143.22
Wood packaging 10.22 77.10 9.12 86.23 881.24
Mixed construction waste 10.16 18.11 91.96 110.07 1 118.30
Cardboard packaging 59.16 20.14 -61.60 -41.46 -2 452.85
Glass 50 28.76 4.63 33.39 1 669.54
Food waste 116.64 NA 103.69 103.69 12 094.00
Light weight recyclables 18.4 49.32 93.01 142.33 2 618.96
Fat from grease traps 28.9 84.78(*) 41.18 41.18 3 640.00
Container rental 4 640.00
Total 43 008.55
(*)Service costs to empty and clean grease traps (25 hours per year).
Hotel waste management savings
The Savoy in London pays approximately EUR 110 per tonne for mixed waste collection,
compared with free collection for separated recyclable materials, and receives payment of
EUR 0.30 per litre for the 600 litres of waste cooking oil collected every month by a private
company to produce biodiesel.
A reduction in unsorted waste of between 11 and 31 tonnes per year for a 100-room hotel (see
'Environmental benefit', above) would lead to annual cost savings of between EUR 1 210 and
EUR 4 030, assuming collection costs of EUR 110 to EUR 130 per tonne of mixed waste and
free collection of recyclable materials.
By reusing or recycling 98 % of waste, Strattons 14-room hotel and restaurant in the UK saves
over EUR 1 000 per year in waste disposal costs (Envirowise, 2008).
Table 6.14: Some examples of economic savings arising from recycling actions
Hotel Action Annual waste
reduction
Annual
saving Source
EUR
96-room
conference hotel Waste separation
72 t reduction in
landfill 4 120
Sustainable South
Land (2011)
Hotel and
restaurant Onsite composting
150 t organic
waste reduction 30 000 Irish EPA (2008)
148-room
conference hotel
and restaurant
Food and general
waste recycling
70 % reduction in
landfill
21 480
(44 %) Irish EPA (2008)
74-room hotel and
restaurant
Introduction of
organic and mixed
recyclable bin
127 t food waste,
17.5 t glass, 6.5 t
paper and
cardboard, 0.65 t
plastic
2 300 Foodwaste.ie
(2010)

Chapter 6
Best Environmental Management Practise in the Tourism Sector 347
Driving Force for Implementation
Driving forces for implementing waste sorting and recycling include:
corporate social responsibility
waste legislation
differentiated charges for collection of recycling waste and disposal of waste
voluntary EMS or ecolabel criteria
environmental marketing – waste management is a visible demonstration of environmental
commitment.
Reference organisations
The Hilton Slussen hotel Stockholm; The Savoy hotel, London; Scandic hotels; Strattons hotel
Norfolk (UK).
References
Accor, Accor hotels environment charter practical guide, Accor, 2007, Paris.
British Plastics Federation, website accessed October 2011:
http://www.bpf.co.uk/Sustainability/Plastics_Recycling.aspx
Browne, D., O'Regan, B., Moles, R., Use of carbon footprinting to explore alternative
household waste policy scenarios in an Irish city-region, Resources, Conservation and
Recycling, Vol. 54 (2009), pp. 113 – 122.
Demesne, webpage accessed October 2011: http://www.demesne.info/Sustainable-
Living/Plastics-Recycling.htm
Dinkel, Oekologischer Nutzen des PET-Recycling Schweiz, Dinkel, 2008, Switzerland.
Available from: http://www.petrecycling.ch/
EC, Regulation (EC) No 1774/2002 of the European Parliament and the Council of 3
October 2002 laying down health rules concerning animal by-products not intended for
human consumption, OJ L 273/34-36, 2002, Brussels.
EC, Commission Decision 2009/578/EC of 9 July 2009 establishing the ecological
criteria for the award of the Community ecolabel for tourist accommodation service, EC,
2009, Brussels.
Ecotrans, Environmental initiatives by European tourism businesses, Instruments,
indicators and practical examples, A contribution to the development of sustainable
tourism in Europe, Ecotrans, 2006, Stuttgart.
EEA, European Environment, State and Outlook 2010, EEA, 2010, Copenhagen. ISBN
978-92-9213-155-5.
Envirowise, Resource efficiency at a small hotel, case study CS 616R, Envirowise, 2008,
Didcot UK.
ETC/SCP, Europe as a Recycling Society. The European Recycling Map. Working paper
5/2010, ETC/SCP, 2010, Copenhagen.
Eurostat, Environmental statistics and accounts in Europe – 2010 edition, Eurostat, 2010,
Luxembourg. ISBN 978-92-79-15701-1.
Fairmont Hotel Group, Green Partnership program, webpage accessed November 2011:
http://www.fairmont.com/EN_FA/AboutFairmont/environment/GreenPartnershipProgra
m/

Chapter 6
348 Best Environmental Management Practise in the Tourism Sector
Foodwaste.ie, Case studies of organisations managing food waste properly, webpage
accessed October 2011: http://www.foodwaste.ie/wp-content/uploads/2010/06/Case-
Studies-of-Organisations-Managing-Food-Waste-Properly.pdf
Grontmij | Carlbro, Indsamling og behandling af emballageaffald i Danmark, Frankrig,
Holland Storbritannien, Sverige, og Tyskland, 2001, Denmark.
IFC, EHS guidelines for Tourism and Hospitality Development, International Finance
Corporation, 2007.
Irish EPA, National Waste Prevention Programme Annual Report 2007/2008, Irish EPA,
2008, Wexford Ireland. Available at: http://www.epa.ie/pubs/reports/waste/prevention/ –
Accessed January 2011.
Irish EPA, Developing a Cleaner Production Programme for the Irish Hotel Industry –
Greening Irish Hotels, EPA, 2008, Wexford Ireland. Available at:
http://www.epa.ie/pubs/reports/research/tech/cgppreportcummins.html – Accessed
January 2011.
ITP, Environmental Management for Hotels. The industry guide for sustainable operation
(3rd
edition), ITP, 2008, UK.
Öko-Institut, Comparative Life Cycle Assessment of various Cup Systems for the Selling
of Drinks at Events, Öko-Institut, 2008, Vienna, Basel, Darmstadt.
Quality Mark of New Zealand website: http://www.qualmark.co.nz/ accessed January
2011
Rafayel Hotel, personal communication June 2011.
Recyclemore, website accessed October 2011: http://www.recycle-more.co.uk
SFT (Statens forurensningstilsyn), Analysis of Municipal Waste, SFT, Oslo, 1998.
Sustainable South Land, Ascot Park Hotel case study, webpage accessed November 2011:
http://www.sustainablesouthland.co.nz/CaseStudies/articleType/ArticleView/articleId/11
4/Ascot-Park-Hotel.aspx
The Savoy, personal communication June 2011.
Waste Management World, website accessed January 2011: http://www.waste-
management-world.com/index/display/article-display/271254/articles/waste-
management-world/volume-7/issue-7/features/a-welcome-sign-hotels-adopt-reuse-and-
recycling.html
Waste Care Corporation, Trash compactors, balers, recycling equipment, industrial
shredders and grinders, waste equipment and other waste related products and services:
http://www.wastecare.com/Articles/Waste_Reduction_Recycling_Tips_Hotels.htm
Accessed October, 2011.
Wikepedia, Plastic Recycling page, accessed October 2011:
http://en.wikipedia.org/wiki/Plastic_recycling
WRAP, The composition of waste disposed of by the UK hospitality industry, WRAP,
2011, UK. ISBN 1-84405-452-7.

Chapter 6
Best Environmental Management Practise in the Tourism Sector 349
6.3 Waste water treatment
Description In case waste water cannot be discharged to a sewer to be treated in a municipal effluent
treatment plant (see section 3.3), individual local solutions have to be applied. Here, three
different applications are described: for an individual hotel, a campsite and huts in the alpine
region. Best practice is to apply well-designed pre-treatment (sieve/bar rack, equalisation,
sedimentation), biological treatment with high BOD5 removal and high nitrification and sludge
treatment/disposal for all of these applications.
Due to the high variation of waste water flow and load across different tourism seasons, the
applied technique must be flexible and able to adapt to these special conditions. For hotels and
campsites, in many cases, sequencing batch reactors have been proven to be a satisfactory
option to fulfil these requirements. However, other types of biological treatment may also be
appropriate as long as they achieve high removal efficiencies (see operational data).
In the alpine region, mountain huts may be connected to a municipal treatment plant in an
adjacent valley via individual pipes (see Figure 6.22, below). This represents best practice, but
may not always be technically or economically viable, in which case individual waste water
treatment solutions, as described here, are required. Similarly, many rural tourist
accommodations across Europe are outside the catchment areas of municipal treatment plants.
The applicable techniques are illustrated in Figure 6.17.
Waste water collection▪ Grey water
▪ Dry toilets
▪ Flush toilets
Pre-treatment
▪ Sedimentation plants (one-or multiple chamber)
▪ Mechan. solids separation (dry toilets, press for solids dewatering, filter sack plants, bar racks)
▪ Grease trap
Biological treatment▪ Biofilm processes
▪ Activated sludge processes
▪ Waste water ponds
Tertiary treatment
Discharge
User/guest
Primary sludge
Excess sludge
Collection
Transport to
external sludge
processing facilities
Sludge treatment
Disposal onsite or
transport to
external facilities
Return of filtrate
Source: IEVEBS (2010a and b).
Figure 6.17: Sequence for waste water treatment and sludge disposal for individual huts in the
alpine region where discharge to a municipal effluent treatment plant is either
technically or economically unviable

Chapter 6
350 Best Environmental Management Practise in the Tourism Sector
Biofilm plants have been demonstrated to be the most appropriate technology. If they are not
applicable, due to local circumstances, activated sludge systems are recommended. Concerning
biofilm reactors, priority is for reed bed filters. In case, they are not applicable, e.g. because of
the altitude, priority may be given to trickling filters. Concerning waste water treatment for
individual huts in the alpine region, a compilation is provided under operational data. Due to the
climate conditions, the treatment plants should be located within a building. In the alpine region,
tertiary treatment should be applied. For this purpose, in principle, simple systems such as
mechanical biofilters and reed bed filters have been proven to be appropriate (IEVEBS, 2010a
and b).
Achieved environmental benefit As suspended solids and organic compounds are removed to a high extent (BOD5 removal of
more than 95 %) and ammonia is nitrified to a high extent (at least 90 %), the pollution of waste
water is significantly reduced and the impact to receiving natural waters is minimised. Sludge
disposal from plants for hotels and campsites should include anaerobic digestion and/or
incineration according to standards meeting those defined in the Best Available Reference
Techniques Reference Document on Incineration Plants (BREF WI, 2006).
Appropriate environmental indicator Indicators
BOD5, COD and ammonia concentration (mg/L) or specific factors such as g BOD5/PE,
COD/PE or NH4-N/PE (where PE is the waste water treatment system load, expressed as person
equivalent), and removal efficiency (% removed) for the parameters BOD5, COD, ammonia,
total phosphorous and total nitrogen, are appropriate environmental indicators.
Benchmark of excellence
The following benchmark of excellence is proposed:
BM: where it is not possible to send waste water for centralised treatment, on-site waste water
treatment includes pre-treatment (sieve/bar-rack, equalisation and sedimentation) followed
by biological treatment with >95 % BOD5 removal, >90 % nitrification, and (off-site)
anaerobic digestion of sludge where possible
Cross-media effects The most important cross media effects is due to the energy consumption to operate the
treatment plant (mainly electricity for aeration) and the excess sludge produced from biological
treatment. However, on one hand adequate treatment without energy consumption is not
possible and on the other hand, the described systems are energy efficient. Performance data for
plants with sequencing batch reactors are presented below (operational data). Surplus sludge is
unavoidable and has to be disposed of properly.
Operational data Information is presented for an individual hotel, a campsite and for huts in the alpine region.
Individual hotel
The waste water from an individual hotel (Figure 6.18) is treated in a biological treatment plant
designed for 33 m3/d and 300 Person Equivalents (PE).

Chapter 6
Best Environmental Management Practise in the Tourism Sector 351
Figure 6.18: Location of the Hotel Schindelbruch and its waste water treatment plant in
Stolberg/Germany
The layout of the plant is shown in Figure 6.19, consisting of a sedimentation tank to eliminate
coarse particles and an equalisation tank to collect the waste water and to equalise its
concentration and load. The biological stage is a sequencing batch reactor provided with forced
aeration by compressors followed by a flow reducer to enable constant discharge flow (because
of the discontinuous treatment process in the sequencing batch reactor).and the sampling
manhole. Excess sludge is pumped to a collection tank from where it is transported to an
external facility (anaerobic digester of a municipal waste water treatment plant).
Sequencing
batch reactor
(90 m3)
Equalisation
tank
Sludge
storage tank
Sludge extraction
Sludge extr.
Flow
reducer and
sampling
manhole
Ventilation
Air supplyExcess sludge pump
Flow
measure-
ment
OverflowSampling
point
Compressor
Plate
aerators
Control
panel
Sampling
manhole
Sedim.
tation
tank Influent, designed
for 33 m3/d
Effluent
Plate
aerators
Pumps10 m3
17 m3
15 m3
16 m3
Excess sludge (0.44 m3/d)
Figure 6.19: Layout of the biological treatment plant of the Hotel Schindelbruch, based on a
scheme provided by Mall GmbH, it is designed for 300 person equivalents
The annual flow is about 12 400 m
3. The removal efficiency is 90 % for COD, more than 95 %
for BOD5, 81 % for NH4-N, 77 % for total nitrogen and 44 % for total phosphorous. Available
waste water analysis carried out by an independent and certified laboratory in 2011are compiled
in Table 6.15.
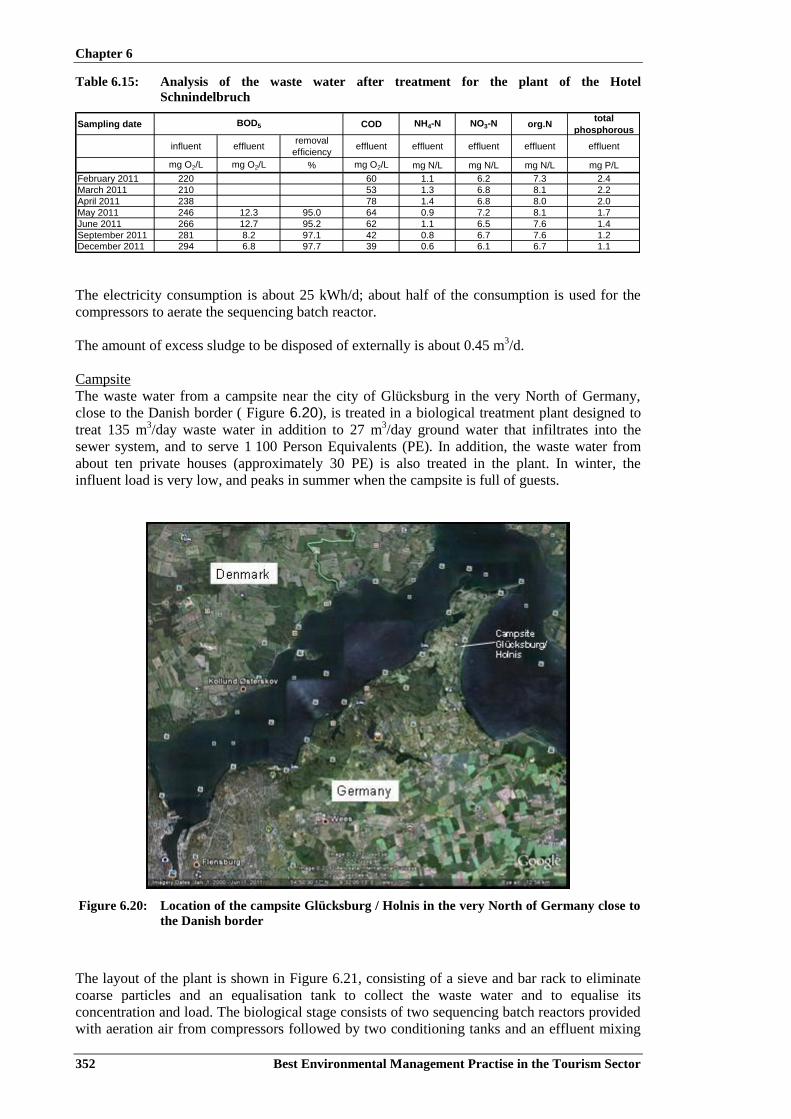
Chapter 6
352 Best Environmental Management Practise in the Tourism Sector
Table 6.15: Analysis of the waste water after treatment for the plant of the Hotel
Schnindelbruch
Sampling date COD NH4-N NO3-N org.Ntotal
phosphorous
influent effluentremoval
efficiencyeffluent effluent effluent effluent effluent
mg O2/L mg O2/L % mg O2/L mg N/L mg N/L mg N/L mg P/L
February 2011 220 60 1.1 6.2 7.3 2.4
March 2011 210 53 1.3 6.8 8.1 2.2
April 2011 238 78 1.4 6.8 8.0 2.0
May 2011 246 12.3 95.0 64 0.9 7.2 8.1 1.7
June 2011 266 12.7 95.2 62 1.1 6.5 7.6 1.4
September 2011 281 8.2 97.1 42 0.8 6.7 7.6 1.2
December 2011 294 6.8 97.7 39 0.6 6.1 6.7 1.1
BOD5
The electricity consumption is about 25 kWh/d; about half of the consumption is used for the
compressors to aerate the sequencing batch reactor.
The amount of excess sludge to be disposed of externally is about 0.45 m3/d.
Campsite
The waste water from a campsite near the city of Glücksburg in the very North of Germany,
close to the Danish border ( Figure 6.20), is treated in a biological treatment plant designed to
treat 135 m3/day waste water in addition to 27 m
3/day ground water that infiltrates into the
sewer system, and to serve 1 100 Person Equivalents (PE). In addition, the waste water from
about ten private houses (approximately 30 PE) is also treated in the plant. In winter, the
influent load is very low, and peaks in summer when the campsite is full of guests.
Figure 6.20: Location of the campsite Glücksburg / Holnis in the very North of Germany close to
the Danish border
The layout of the plant is shown in Figure 6.21, consisting of a sieve and bar rack to eliminate
coarse particles and an equalisation tank to collect the waste water and to equalise its
concentration and load. The biological stage consists of two sequencing batch reactors provided
with aeration air from compressors followed by two conditioning tanks and an effluent mixing

Chapter 6
Best Environmental Management Practise in the Tourism Sector 353
sewer to enable constant discharge flow (because of the discontinuous treatment process in the
sequencing batch reactor) and the sampling manhole. Excess sludge is pumped to a collection
tank from where it is transported to an external facility (anaerobic digester of a municipal waste
water treatment plant).
Gate
Sludge tank
Sequencing batch reactor 1 (201 m3)
Plate
aerators
Plate
aerators
Air supply
Air supply
Equalisation
tank
Exce
ss s
ludg
e
Sieve/
bar rack
Influent
Decante
d liquor
Emergency overflow
Excess
sludge
Compressors
Effluent
Treated waste water
Sampling
manhole
Co
ntr
ol p
an
el
Effluent mixing sewer
Sludge extraction
Agitator
Effluent
control
tank II
Effluent
control
tank II
41 m3
76 m3
20 m3 Sequencing batch reactor 2 (201 m3)
Figure 6.21: Layout of the biological treatment plant of the Campsite Glücksburg / Holnis, based
on a scheme provided by Mall GmbH, it is designed for 1100 person equivalents
(PE)
The annual flow is about 59 000 m
3. The removal efficiency for COD is more than 90 %, for
BOD5 more than 98 % and for ammonia about 95 %. Available waste water analysis carried out
by an independent and certified laboratory are compiled in Table 6.16. The values are very low.
As BOD5 is removed below the detection limit, the ammonia content is expected to be at least
below 0.5 mg NH4-N/L.
Table 6.16: Analysis of the waste water after treatment discharged from the plant for the
campsite Glücksburg / Holnis
Sampling
date
Waste water
temp pH COD BOD5
Total
phosphorus
ºC mg O2/L mg O2/L mg P/L
03.03.2011 4.9 8.1 17 <3 0.1
25.07.2012 18.6 6.9 26 <3 2.5
24.102011 10.9 7.0 27 <3 5.7
07.03.2012 5.4 8.0 19 <3 1.4
The electricity consumption is about 80 kWh/day; more than half of the consumption is used for
the compressors to aerate the sequencing batch reactors.
The amount of excess sludge to be disposed of externally is about 1.1 m3/day.

Chapter 6
354 Best Environmental Management Practise in the Tourism Sector
Huts in the alpine region
There are cases where the installation of a waste water pipe down to the valley to discharge the
waste water to a municipal waste water treatment plant may be the best solution. Figure 6.22
shows two examples for this option.
Figure 6.22: Installation of a pipe to discharge waste water down to the valley to a municipal waste
water treatment plant, (BLU, 2000)
Figure 6.23 shows that, as of the year 2000, this option had already been realised in many cases
in the Bavarian alpine region, but for many others, individual solutions are required.
Installation of a pipe to the valley
(discharge to a municipal plant)
Individual treatment (installed)Individual treatment (to be installed)
Source: BLU (2000).
Figure 6.23: Waste water disposal of huts in the Bavarian alpine region, (BLU, 2000)

Chapter 6
Best Environmental Management Practise in the Tourism Sector 355
There are cases where water availability is limited or where treatment is more difficult,
especially at high altitude. In these cases; it may be appropriate, to use separation toilets to
collect urine separately to be transported to other facilities as well as dry toilets for faeces
(Figure 6.24).
NB: the fall down pipe on the left is located immediately below the toilet.
Source: Jäger (2009) and Abegglen (2004).
Figure 6.24: Separation toilet (on the left) and separate dry collection of faeces (on the right)
Permeating liquid is collected and discharged to the grey water treatment system. The room of
the dry toilet is vented to minimise odours. Then, the residual grey water from kitchen and bath
room can be filtered in a sack filter and treated in a reed bed plant (Figure 6.25). In this way the
load and waste water emissions are minimised.

Chapter 6
356 Best Environmental Management Practise in the Tourism Sector
Building for the sack filter
Reed bed filter
Source: Jäger (2009).
Figure 6.25: Example for a reed bed filter for the treatment of grey water from a hut at 2 245 m
above sea level, designed for 30 PE60
Where no segregation is needed or carried out, treatment according to the scheme in Figure 6.17
is required. The available pre-treatment systems are compiled in Table 6.17 with brief
summaries of their applicability, properties and characteristics. They have to be selected
according to the individual circumstances and conditions.
Subsequent to pre-treatment, biological treatment and in many cases also tertiary treatment has
to be applied. The applicability, properties and characteristics of the different available
techniques are compiled in Table 6.18.
As already indicated above, biofilm plants have been proven to be most appropriate. If they are
not applicable, due to local circumstances, activated sludge systems are recommended.
Concerning biofilm reactors, priority is for reed bed filters. In case they are not applicable, e.g.
because of the altitude, priority may be given to trickling filters. Concerning waste water
treatment for individual huts in the alpine region, a compilation is provided under operational
data. Due to the climate conditions, the treatment plants should be established in a building. In
the alpine region, tertiary treatment should be applied. For this purpose, in principle, simple
systems such as mechanical biofilters and reed bed filters have been proven to be appropriate
(IEVEBS, 2010a and b).
For a long time, the disposal of sludge from biological treatment remained problematic. Now,
different options are available such as filter sack systems, reed bed plants, solar dryers and
composters (Günthert, 2007; Günthert, 2008). Depending on legal requirements and individual
permits as well as on the availability of land, it is also possible to apply the processed sludge on
land close to the hut.

Chapter 6
Best Environmental Management Practise in the Tourism Sector 357
Table 6.17: Applicability, properties and characteristics of available pre-treatment techniques for waste water from huts in alpine regions (IEVEBS, 2010a and b)
Sedimentation plants Dewatering press Dry toilets Filter sack plants
Spreading onsite permitted + + + +
Spreading onsite not permitted
++ + + +
Transport in vaccum tankspace and weight
minimised transport
space and weight
minimised transport
space and weight
minimised transport
o + + +
wet sludge has to be
dewatered for transport
space and weight
minimised transport
space and weight
minimised transport
space and weight
minimised transport
Limited tap water / water for use availability
++ o o ++
usually no energy consumpt. const. energy consumpt. energy for aeration low or no energy consum.
Plant size
< 50 PE60 ++ ++ ++ ++
50 - 100 PE60 ++ ++ + o
> 100 PE60 ++ + o -
Ease of operation and maintenance ++ - - o
Reliability ++ - + ++
Average assessment by operators + o o o
Legend: PE60: Population Equivalent (60 g BOD5/d)
++: very good/very highly appropriate; +: good/highly appropriate: o: satisfactory/appropriate
Ap
plicab
ilit
y
Pro
pert
ies
an
d
ch
ara
teri
s.
Pretreatment systems
in case of water shortage, dry toilets are recommended
Cost-intensive energy supply
in case of supply and disposal via a road
in case of supply and disposal via
helicopter or cable lift/cable car

Chapter 6
358 Best Environmental Management Practise in the Tourism Sector
Table 6.18: Applicability, properties and characteristics of available biological treatment techniques for waste water from huts in alpine regions (IEVEBS, 2010a and b)
Reed bed filter Trickling filterMechanical
biofilter
Rotating
biological
contactor
Conventional
activated sludge
system
Sequencing batch
reactor
Membrane
bioreactor
Type of supply (applicability due to
transport costs/efforts)
Roadway + ++ ++ ++ ++ ++ ++ +
+ / - ++ ++ ++ ++ ++ ++ + / -
no inoculation
required
no inoculation
required
no inoculation
required
no inoculation
required
transport costs low but
annual inocluation with
activated sludge
required
transport costs low but
annual inocluation with
activated sludge
required
transport costs low but
annual inocluation with
activated sludge
required
no inoculation
required
Above sea level
< 1800 a.s. ++ ++ ++ ++ ++ ++ ++ ++
> 1800 a.s. o ++ ++ ++ ++ ++ ++ + / -
Summer and winter operation + / - ++ ++ ++ ++ ++ ++ + / -
Energy efficiency (low consumption) ++ + + o + / - + / - + / - ++
Open country topography (steep,
bedrock)+ / - ++ ++ ++ ++ ++ ++ + / -
Legal requirements+ / -
Plants above 150 PE60 + / - ++ ++ ++ ++ ++ ++ + / -
o o o o + + + o
longer start-up
phase
longer start-up
phase
longer start-up
phase
longer start-up
phase
shorter start-up phase
with inoculation (see
above)
shorter start-up phase
with inoculation (see
above)
shorter start-up phase
with inoculation (see
above)
longer start-up phase
+ / -
signific. reduction of
germs, in case tertiary
treatm. is demanded, e.g.
a UV plant can be added
in case of tert. treatm. demand,
add. germ removal ist not
needed. A UV plant can be
applied to be on the safe side.
in case of tert. treatm. demand, a
UV plant has to be added
Ease of operation and maintenance ++ + + + o o data not available ++
Reliability ++ + o o o o data not available ++
Assessment by operator ++ + + + + o + ++
Assessment of total costs (capital value)1800 - 3900
EUR/PE
2200 - 3900
EUR/PE
3300 - 5700
EUR/PE
2700 - 5300
EUR/PE
4900 - 7900
EUR/PE
3600 - 4400
EUR/PE
no info due to low
number of available
plants
no info due to low number
of available plants
Investment costs average average high low low low average very low
Reinvestment expenses very low low low low high high high very low
Operation costs very low low low average high high high very low
Legend: PE60: Population Equivalent (60 g BOD5/d)
++: very good/very highly appropriate; +: good/highly appropriate: o: satisfactory/appropriate; + / -: sufficient/of limited suitability
cable lift / helicopter
Biofilm processes Activated sludge systemsWaste water
lagoon
Pro
pe
rtie
s a
nd
ch
ara
cte
ris
tic
s
Provided well-done planning and regular maintenance, these systems, in adequate combination with pre-treatment systems and tertiary
treatment, usually meet the legal performance requirements
in case there is a demand for tertiary treatment, an additional treatment stage (e.g. UV plant) can be
provided
in case of adequate dimension and combination with appropriate tertiary treatment, all systems usually meet the performance
requirements
Treatment performance ( tertiary
treatment
Ap
pli
ca
bil
ity

Chapter 6
Best Environmental Management Practise in the Tourism Sector 359
Applicability The different techniques described for the biological treatment of waste water from individual
hotels, campsites and huts in the alpine region are applicable without limitations. There are
different options depending on the individual circumstances, but in principle the described
techniques for pre-treatment and biological treatment are applicable to all cases of the
aforementioned categories.
Economics Plant for the Hotel Schindelbruch (described above)
Investment costs: 145 000 EUR net (turn key); i.e. 500 – 1 000 EUR/PE. The operational costs
are as follows
- Electricity: 5.9 EUR/PE (price for one kWh: 0.21 EUR)
- External sampling and analysis: 4.9 EUR/PE
- Maintenance: 3.2 EUR/PE
- Repairs: 4.6 EUR/PE
- Personal costs 7.0 EUR/PE
- Disposal costs for sludge and residues from sedimentation: 14.2 EUR/PE
This is in total 39.8 EUR/PE, equivalent to 0.96 EUR/m3.
Plant for the campsite Glücksburg / Holnis described above
Investment costs: 540 000 EUR net (turn key), i.e. also 500 – 1000 EUR/PE. The investment
was made by the city Glücksburg as it is competent for the discharge of waste water. The
campsite operator has to pay a fee on the basis of each cubic meter of waste water discharged to
the plant.
The operational costs are as follows
- Electricity: 5 900 EUR (price for one kWh: 0.21 EUR), equivalent to 5.4 EUR/PE
- External sampling and analysis: 8.1 EUR/PE
- Maintenance: 1 EUR/PE
- Repairs: 3.5 EUR/PE
- Personal costs (20 hours/month): 7.7 EUR/PE (35 EUR/working hour)
- Sludge disposal costs: 7.9 EUR/PE (21 EUR/m3 sludge)
This is in total 33.6 EUR/PE, equivalent to 0.63 EUR/m3.
For the installation of a waste water pipe down to the valley to discharge the waste water to a
municipal treatment plant, the following costs have been reported (although these values are
now more than 10 years old, and will now be higher): 45 – 340 EUR/m (average: 160 EUR/m) and 350 – 4 100 EUR/PE (average: 1 400 EUR/PE) (BLU, 2000).
No detailed figures for the different treatment techniques of the waste water from huts in the
alpine region could be identified.
Concerning sludge processing techniques, investment costs between EUR 7 000 and
EUR 25 000 have been reported (Günthert, 2008).
Driving force for implementation On one hand, legal requirements represent one of the most important driving forces to
implement the techniques described. On the other hand, an awareness of environmental damage

Chapter 6
360 Best Environmental Management Practise in the Tourism Sector
and responsibility to operate tourist accommodation in a sustainable manner are also relevant
driving forces to go beyond regulatory requirements.
Reference applications See the examples presented above under operational data.
References
BREF WI, 2006, Reference Document on the Best AvailableTechniques for Waste
Incineration, EC (JRC IPTS), 2006. Available at:
http://eippcb.jrc.es/reference/BREF/wi_bref_0806.pdf
IEVEBS, Abschlussbericht "Projekt Integrale Evaluierung der Ver- und
Entsorgungssysteme bei Berg- und Schutzhütten" (Final report 'Project on the integrated
evaluation of supply and disposal systems for huts in the alpine region'), 2010a
EVEBS, Guidelines for planning and erecting as well as operation and maintenance of
supply and disposal facilities of alpine huts derived from the 'Projekt Integrale
Evaluierung der Ver- und Entsorgungssysteme bei Berg- und Schutzhütten', 2010b.
Available at:
http://www.umweltfoerderung.at/uploads/2010_10_ievebs_leitlinien_310810.pdf
Bayerisches Landesamt für Umwelt (BLU), Abwasserentsorgung im Gebirge (Waste
water disposal in the alpine region, accessed may 2012:
http://www.lfu.bayern.de/wasser/abwasserentsorgung_von_einzelanwesen/abwasserentso
rgung_im_gebirge/doc/info.pdf, 2000, accessed 10 May 2012
Jäger, R., Demonstration umweltgerechter Ver- und Entsorgungssysteme für ausgewählte
Berg- und Schutzhütten, Projekt 17400, hier Göppinger Hütte – 2245 müNN
(demonstration of environmentally-friendly supply and disposal systems for selected huts
in the alpine region, project 14700, here Göppinger Hut – 2245 m a.s.
Lechquellengebirge), sponsored by DBU, 2009, Germany. Available at:
http://www.dbu.de/OPAC/ab/DBU-Abschlussbericht-AZ-17400_43.pdf,
Günthert, F.W., Schönherr, F., Schlussbericht 'Klärschlammproblematik im
Hochgebirge', zweite Phase (Final report The issue of sludge disposal in the alpine
region, second phase), sponsored by DBU, 2007, Germany.
Günthert, F.W.; Rauch, W. et al., Schlussbericht 'Klärschlammproblematik im
Hochgebirge', dritte Phase (Final report The issue of sludge disposal in the alpine region,
third phase), sponsored by DBU, 2008, Germany.
Mall GmbH, Project sheet of Mall GmbH for the Hotel Schindelbruch, accessed May
2012:
http://www.mall.info/fileadmin/Gewerblich/Klaeranlagen/Projektberichte/Projektbericht_
Harzhotel_Schindelbruch.pdf
Abegglen, C., Übersicht Abwasserentsorgungssysteme in SAC-Hütten, Teilprojekt des
SAC-Projektes 'vom Plumpsklo zur Umweltverträglichen Abwasserentsorgung“
(Overview of waste water disposal systems in SAC huts)', ETH/EAWAG, 2004, Zurich.

Best practice 2.1 – Environmental management system implementation
Best Environmental Management Practise in the Tourism Sector 11
IMPRINT This document is an extract from a Scientific and Policy report by the Joint Research Centre (JRC), the
European Commission’s science and knowledge service. The scientific output expressed does not imply a policy
position of the European Commission. Neither the European Commission nor any person acting on behalf of the
Commission is responsible for the use that might be made of this publication.
Contact information
European Commission - Joint Research Centre - Industrial Leadership and Circular Economy Unit
Address: Calle Inca Garcilaso 3, 41092, Seville, Spain
E-mail: [email protected]
Website: http://susproc.jrc.ec.europa.eu/activities/emas/
JRC Science Hub
https://ec.europa.eu/jrc
The reuse of the document is authorised, provided the source is acknowledged and the original meaning or
message of the texts are not distorted. The European Commission shall not be held liable for any consequences
stemming from the reuse.
How to cite this document
This best practice is an extract from the report Best Environmental Management Practice in the Tourism
Sector to be cited as: Styles D., Schönberger H., Galvez Martos J. L., Best Environmental Management
Practice in the Tourism Sector, EUR 26022 EN, doi:10.2788/33972.
All images © European Union 2017, except: cover image, stock.adobe.com