Embed Size (px)
Citation preview

Where America’s Jobs Are Created and SustainedSeptember 2008
Best-Performing Cities 2008
1250 Fourth Street • Santa Monica, CA 90401Phone: 310.570.4600 • Fax: 310.570.4601E-mail: [email protected]
© 2008 Milken Institute
Ross DeVol, Armen Bedroussian, Kevin Klowden, and Soojung Kim
PROVO-OREM, UTAHBest-Performing City

Where America’s Jobs Are Created and SustainedSeptember 2008
Best-Performing Cities 2008
Ross DeVol, Armen Bedroussian, Kevin Klowden, and Soojung Kim

About the Milken Institute
The Milken Institute is an independent economic think tank whose mission is to improve the lives and economic conditions of diverse populations in the United States and around the world by helping business and public policy leaders identify and implement innovative ideas for creating broad-based prosperity. We put research to work with the goal of revitalizing regions and finding new ways to generate capital for people with original ideas.
By creating ways to spread the benefits of human, financial, and social capital to as many people as possible—by democratizing capital—we hope to contribute to prosperity and freedom in all corners of the globe.
© 2008 Milken Institute
About Greenstreet Real Estate Partners
Greenstreet Real Estate Partners is an investment and asset management company operating throughout the United States since 1983. Its principals apply creative, entrepreneurial strategies that consistently deliver strong operating results and financial returns. Greenstreet has developed a streamlined approach to investment with an opportunistic focus on high-growth markets and value creation acquisitions. Greenstreet’s principals possess extensive experience navigating volatile and distressed markets that uniquely positions the firm to take advantage of market turbulence. Because the firm invests the equity and capital of its principals, it can execute transactions quickly and apply its investment strategies to a diverse range of property types.
Greenstreet’s proficiency in asset management is an ideal complement to its investment expertise. Through financial structuring, adroit leasing strategies, renovation, repositioning, or redevelopment, Greenstreet consistently optimizes property value within its hold periods. Greenstreet’s asset management portfolio includes more than 800 educational facilities owned by Knowledge Learning Corporation, operating as KinderCare and Knowledge Beginnings centers. Greenstreet’s principals and executive team have completed more than $15 billion in transactional volume in public and private structures.

Executive Summary ........................................................................................................ 1
Introduction ....................................................................................................................... 5
The Biggest Gainers ........................................................................................................ 9
The Biggest Losers.........................................................................................................11
The Best-Performing Large Cities ..........................................................................13
America’s Ten Largest Cities: Performance ........................................................29
The Best-Performing Small Cities ..........................................................................39
Complete Results: 2008 Best-Performing Large Cities ................................48
Complete Results: 2008 Best-Performing Small Cities ................................50
References .........................................................................................................................53
About the Authors .........................................................................................................55
Table of Contents


1
Best-Performing Cities 2008
Executive SummaryOver the past decade, the Milken Institute has regularly analyzed U.S. metropolitan areas to determine which cities are most successful at creating and sustaining jobs. Global, national, and regional economic trends are reflected in the annual rankings, shedding light on where businesses are thriving or struggling, and where wages are growing or lagging. In the Milken Institute and Greenstreet Real Estate Partners’ Best-Performing Cities 2008 index , we see a continuation of trends that were already becoming evident in last year’s figures, along with new developments that are affecting the outlook for communities across the country.
As regional growth rates diverge, human capital shifts from areas with weaker growth to locations experiencing more rapid gains. Cities with large concentrations of technology firms have been performing quite well, as have metros that are highly dependent on export-intensive industries. Rising energy prices have hindered the performance of cities where industries with high energy use are the key drivers, while benefiting those regions with significant oil and gas production and exploration activities. Faced with weaker job and wage growth, along with losses in home equity and rising commodity prices, consumers have cut back their expenditures on discretionary items such as cars, appliances, and other durable goods—and metros that are heavily dependent on the production of consumer durables have seen their economies falter.
As businesses, labor, investors, and public officials plan their next moves, the Best-Performing Cities index provides important benchmarks for charting a course. The combination of long- and short-term measures provides an indicator of whether each city is developing a prosperous, competitive economy and a stable society.
National Conditions
U.S. economic growth weakened in 2007. Real GDP rose 2.1 percent in 2007, down from the 2.9 percent increase achieved in 2006, and most of that growth occurred in the early part of the year. Job growth slowed to 1.1 percent in 2007, a decline from the 1.8 percent recorded in 2006. International trade kept the economy from experiencing an even more dramatic slowdown in 2007, as the falling dollar and continued strong economic expansion abroad produced robust gains in exports and substantially diminished increases in imports. Business investment in structures (and, to a lesser extent, in equipment) was strong in 2007.
The primary culprit behind the economic slowdown was the bursting of the bubble in the housing market. In 2007, existing home sales dropped 13.0 percent, new home sales declined 26.0 percent, housing starts plunged by 25.0 percent, and residential fixed investment fell 17.0 percent.
Economic conditions deteriorated even further in the first half of 2008 under the weight of multiple challenges: the contraction of the housing market, rising agricultural and commodity prices, oil prices above $120 per barrel, overall inflation exceeding wage growth, a continuing credit crunch, declining employment figures, and consumers facing excessive debt-servicing burdens. The U.S. economy slowed to a crawl, at best, though it is more likely that the nation actually entered a mild recession in 2008. These factors will further change the patterns of economic growth around the country and will surely impact next year’s rankings.
Executive Summary

2
Best-Performing Cities 2008
The Top 25 Best-Performing Cities
Texas performed particularly well in the 2008 index, with six cities placing in the top twenty-five large metros (more than any other state). Thanks to its heavy concentration of oil and gas operations, Texas was a clear beneficiary of rising energy prices and renewed activity in the industry. Additionally, several Texas metros received a boost from continued strength in technology hardware and services. While the housing downturn has been severe in states such as Florida, California, Arizona, and Nevada, Texas has not experienced a similar decline.
Metropolitan Statistical Area (MSA)2008rank
2007rank
Provo-Orem, UT 1 8Raleigh-Cary, NC 2 10Salt Lake City, UT 3 18Austin-Round Rock, TX 4 20Huntsville, AL 5 16Wilmington, NC 6 2McAllen-Edinburg-Mission, TX 7 7Tacoma, WA* 8 50Olympia, WA 9 37Charleston-North Charleston-Summerville, SC 10 12Orlando-Kissimmee, FL 11 5Bakersfield, CA 12 17Killeen-Temple-Fort Hood, TX 13 33Lafayette, LA 14 24San Antonio, TX 15 43Houston-Sugar Land-Baytown, TX 16 32Seattle-Bellevue-Everett, WA* 17 77Ogden-Clearfield, UT 18 42Myrtle Beach-North Myrtle Beach-Conway, SC 19 11Greeley, CO 20 29Durham, NC 21 74Nashville-Davidson-Murfreesboro-Franklin, TN 22 61Dallas-Plano-Irving, TX* 23 59Savannah, GA 24 34Des Moines-West Des Moines, IA 25 58*Indicates Metropolitan DivisionSource : Milken Institute
Table 1. Best-performing cities: top twenty-five large metrosRank in 2008 index
All three of Utah’s largest metros ranked among the nation’s top twenty-five performers. In fact, Utah claimed two of the top three spots in the index, and Provo-Orem emerged as the best-performing city of 2008. Two other states, North Carolina and Washington, placed three metros among the top twenty-five. Most of these cities witnessed strong growth in their technology industries. All the technology centers in the top echelon improved their ranking from last year. South Carolina was the only other state with more than one metro in the top twenty-five.
The South had sixteen metros among the top twenty-five in the nation, surpassing last year’s performance by one despite the falloff experienced in Florida. The West had eight metros in the top tier. (Only one California metro, Bakersfield, remains on the list.)
Executive Summary

3
Best-Performing Cities 2008
There was a ray of good news for the heartland: Des Moines –West Des Moines, Iowa, cracked the top twenty-five, a change from last year’s index, in which no metros from the Midwest made the list. Unlike most other Midwest metros, Des Moines has produced growth in professional services, with financial services as the primary engine of its job creation.
At the other end of the spectrum, nine Midwest metros finished in the bottom ten of the 200 largest metros in the country—and all are in Michigan or Ohio. The Northeast again failed to place a single city in the top twenty-five this year. Its best-ranked metro, Trenton-Ewing, New Jersey, placed 62nd overall.
This Year’s Best-Performing City: Provo-Orem, Utah
Provo-Orem, Utah, jumps into the no. 1 ranking, an improvement from last year’s 8th-place finish. The area’s economy has been generating jobs at a pace far above the national average over the past five years. Its job growth performance remained strong in 2007 at 5.0 percent, placing the metro 3rd in the nation in this indicator. The quality of jobs being created has been high as well, a fact borne out by its 3rd-place position in wage and salary growth in 2006. Much of the area’s economic growth has been fueled by a remarkable recovery in high-tech information services and hardware. Provo-Orem has benefited from increased research and associated spin-off activity at Brigham Young University (BYU). Superior job growth has led to high rates of migration to the area, spurring housing and non-residential construction building activity.
The Ten Largest Cities
Because America’s largest metropolitan areas are characterized by high density, with minimal room for expansion, we have broken out their performances separately. It isn’t reasonable to expect cities like Los Angeles, New York, or Chicago to grow at the same rate as Provo, Raleigh, or Austin. However, the big metro areas could learn something from the favorable business climates promoted by these fast-growing areas.
The best performer among the nation’s largest metros, with an overall ranking of 16th place, Houston–Sugar Land–Baytown, Texas, expanded its job base by a whopping 3.2 percent between March 2007 and March 2008, the second-largest increase in the nation. The one-year indicators for job and wage growth also showed robust gains, rising 3.0 and 4.0 percentage points faster, respectively, than the national average. Opportunities stemming from the energy industry, specifically with respect to oil exploration in the Gulf, have been a key engine of growth. Industries that support oil exploration have also been performing well. The heavy and civil engineering construction sector expanded by 5,700 jobs, while specialty trade contractors added another 7,800 workers in 2007.
The Biggest Gainers
The biggest gainers on the 2008 index rose for a variety of reasons, but they do share some commonalities. Most of these metros never experienced a housing-price bubble, so they are now being spared the pain of a major correction and its attendant ripple effects. Some have benefited from increased energy-related activity, while others improved due to the continued strength in the technology sector. Several rose courtesy of more aircraft production over the past couple of years. Metros dependent on industries with rising exports have risen in the rankings, courtesy of the depreciating dollar.
Executive Summary

4
Best-Performing Cities 2008
The most improved metro, El Paso, Texas, climbed an impressive eighty-five spots to place 37th overall. El Paso saw a boost in economic activity due to a major expansion of the U.S. Army base at Fort Bliss under the Pentagon’s Base Realignment and Closure (BRAC) program. Nearly 21,000 soldiers are expected to transfer from other bases, with more than 7,000 having already arrived so far.
The Best-Performing Small City
Midland, Texas, was the best performer among the 124 small cities in our 2008 index, improving from last year’s 3rd-place finish. (Note that last year’s small-city index ranked 179 metros.) In our one-year indicator for job growth, which covers 2006 to 2007, employment increased by 4.3 percent in this region, outpacing the national average by 3.2 percentage points. Oilfield services—including the drilling of oil and gas wells and oil and gas operations—provide almost 6,900 jobs (or 10.4 percent of total jobs in Midland); this industry recorded an 11.3 percent average annual increase between 2002 and 2007.
Executive Summary

5
Best-Performing Cities 2008
IntroductionThe Best-Performing Cities index was designed to measure which U.S. metropolitan areas are most successful in terms of job creation and retention, the quality of jobs being produced, and overall economic performance. Specifically, it pinpoints where jobs are being created and maintained, where wages and salaries are increasing, and where economies and businesses are growing and thriving.
The index allows businesses, industry associations, economic development agencies, investors, academics, and government and public policy groups to assess, monitor, and gain insight into each metro’s relative performance. It also provides benchmarking data that can be used in developing strategies to improve and maintain a metro’s economic performance. Moreover, it is a tool for understanding consumer and business expansion opportunities. In today’s economic slowdown, it helps determine which regional markets may have the lowest risk. The 2008 index applies the methodology used in previous indexes.
The index employs geographic terms used by the Office of Management and Budget (OMB), which in turn uses data from the 2000 Census. The OMB defines a metropolitan statistical area (MSA) as a region generally consisting of a large population nucleus and adjacent territory with a high degree of economic and social integration, as measured by community ties.1 Using these parameters, the agency identifies 361 metropolitan statistical areas. County population growth accounts for the creation of new MSAs.
If specific criteria are met, an MSA with a single nucleus and a population of 2.5 million or more is further divided into geographic areas called metropolitan divisions. There are currently twenty-nine metropolitan divisions. For example, two metropolitan divisions (Dallas-Plano-Irving and Fort Worth–Arlington) make up the Dallas–Fort Worth–Arlington MSA. We include the smaller metropolitan divisions in the index to reflect more accurate geographic growth patterns.
Outcomes-Based, Not Cost-Based
The components shown in the following table are used to calculate our index rankings. The index measures growth in jobs, wages and salaries, and technology output over a five-year span (2002–2007) to adjust for extreme variations in business cycles. It also incorporates the latest year’s performance in these areas. Lastly, it includes the latest twelve-month job growth performance (March 2007 to March 2008) to capture the relative recent momentum among metropolitan economies.2 Employment growth is weighted most heavily in the index because of its critical importance in determining community vitality. Wage and salary growth measures the quality of the jobs being created and sustained. Technology output growth is also an important element in determining the economic vibrancy of cities.
We have incorporated other measures to reflect the concentration and diversity of technology industries within the MSAs. High-tech location quotients (LQs, which measure the concentration of the technology industry in a particular metro relative to the national average) are included to indicate a metro’s participation in the knowledge-based economy.3 We also measure the number of specific high-tech industries (out of a possible twenty-five) whose concentrations in an MSA are higher than the national average.
The Best-Performing Cities index is solely an outcomes-based measure. It does not incorporate explicit input measures (such as business costs; cost-of-living components, such as housing; and other quality-of-life measures, such as commute times or crime rates). Static input measures, although important,
Introduction

6
are subject to large variations and can be highly subjective, making them less meaningful than more objective indicators of outcome.
Businesses choose to locate in particular areas for various reasons. Some, for instance, opt to remain in high-cost cities despite the availability of lower-cost locations. The output measures used for this index include the benefits of situating in expensive locations. Theoretically, a prospering region will raise wages and rents as its businesses tap into more human capital and available space. Nevertheless, holding all other factors constant (such as the productivity associated with being in one location versus another), a company will generally choose to locate where business costs are lower and employees enjoy higher living standards.
Component WeightJob growth (I=2002) 0.143
Job growth (I=2006) 0.143
Wage and salary growth (I=2001) 0.143
Wage and salary growth (I=2005) 0.143
Short-term job growth (Mar 07-Mar 08) 0.143
Relative high-tech GDP growth (I=2002) 0.071
Relative high-tech GDP growth (I=2006) 0.071
High-tech GDP location quotient 0.071
Number of high-tech GDP LQ>1 0.071Note: I refers to the beginning year of the index.Source : Milken Institute
Table 2. Components of the Best-Performing Cities index
National Economic Conditions
The U.S. economy slowed substantially in 2007 and may have entered a recession by year-end. Real GDP rose 2.1 percent in 2007, down from the 2.9 percent increase in 2006, and most of that growth occurred earlier in the year. Job growth was 1.1 percent in 2007, a decline from the 1.8 percent recorded in 2006. International trade kept the economy from experiencing an even more dramatic slowdown in 2007 as a falling dollar and continued strong economic expansion abroad resulted in robust gains in exports and substantially diminished increases in imports. Business investment in structures was strong in 2007, as was (to a lesser extent) investment in equipment.
Just as the end of the dot-com and technology bubble sparked the 2001 recession, today it is the bursting of the housing bubble that has precipitated a decline in economic activity.4 The correction in housing started to unfold in 2006, with residential fixed investment spending falling by 4.6 percent. The correction accelerated in 2007, with existing home sales dropping by 13.0 percent, new home sales declining by 26.0 percent, housing starts plunging by 25.0 percent, and residential fixed investment falling another 17.0 percent. As the initial teaser rates on adjustable-rate mortgages (ARMs) reset and housing prices plummet, foreclosure rates are skyrocketing, further weakening prices. Many homes were purchased with little or no down payment, and due to falling home prices, their loan-to-value ratios are over 100, making it difficult for homeowners to refinance mortgages. Housing market activity will contract by an even greater percentage in 2008 and is unlikely to bottom out until sometime in 2009. This will cause dramatically disparate impacts on metros around the country.
Best-Performing Cities 2008Introduction

7
Best-Performing Cities 2008
Rising energy prices, especially in oil and refined petroleum products, is another strong headwind that slowed economic growth in late 2007 and has taken a major toll in 2008. As higher crude prices filter into downstream prices for gasoline, jet fuel, home heating oil, and other refined-petroleum products, energy costs are eating up a greater share of household income. This has forced consumers to cut purchases of discretionary items such as autos, furniture, appliances, and other durable goods. Higher energy prices have also harmed energy-intensive industries, such as airlines and chemical producers. Metros with a high concentration of energy-reliant industries have been harmed. On the other hand, metros with significant oil and gas production and exploration activities have seen higher energy prices acting as a stimulus.
Exports of goods and services were the strongest segment of the U.S. economy in 2007. Real exports of goods and services rose by 8.1 percent in 2007, a minor decrease from the 8.4 percent gain of 2006. Rapid growth in exports has mitigated the impact of declining domestic sales of manufactured goods. Metros with high concentrations of exporters have benefited from rising international demand for U.S. products.
U.S. economic conditions deteriorated even further in the first half of 2008, as growth slowed to a crawl (at best) or, more likely, a mild recession took hold. Multiple challenges converged simultaneously: the continued contraction of the housing market, rising agricultural and commodity prices, a sharp spike in oil prices, overall inflation exceeding wage growth, a continuing credit crunch, declining employment figures, and a consumer increasingly squeezed by excessive debt-servicing burdens. These factors will further impact the patterns of economic growth around the country in the months to come and will surely impact next year’s rankings.
Introduction


9
Best-Performing Cities 2008
The Biggest GainersThe biggest gainers on the 2008 Best-Performing Cities index rose for a variety of reasons, but they do share some commonalities. The majority of these metros didn’t experience a drastic housing-price bubble and an overbuilt market, so they haven’t seen a major correction in new home construction and the attendant loss of construction employment, along with the ripple effects on their economies. Some have benefited from increased energy-related activity, while others improved due to the continued strength in the technology sector. Several rose courtesy of more aircraft production activity over the past couple of years. Metros dependent on industries producing rising exports have improved in the rankings, courtesy of a depreciating dollar. Upward revisions to previous job gain estimates were reported in many of these metros as well.
The most-improved metro, El Paso, Texas, climbed an impressive eighty-five spots to place 37th overall. El Paso saw a boost in economic activity due to a major expansion of the U.S. Army base at Fort Bliss under the Pentagon’s Base Realignment and Closure (BRAC) program. Nearly 21,000 soldiers are expected to transfer from other bases, with more than 7,000 having already arrived so far.5
Metropolitan Statistical Area (MSA)2008rank
2007rank
Spots climbed
El Paso, TX 37 122 +85Asheville, NC 46 117 +71Wichita, KS 45 114 +69Shreveport-Bossier City, LA 67 131 +64New York-White Plains-Wayne, NY-NJ* 85 148 +63Denver-Aurora, CO 44 106 +62Seattle-Bellevue-Everett, WA* 17 77 +60Oklahoma City, OK 50 108 +58Durham, NC 21 74 +53Greenville-Mauldin-Easley, SC 68 121 +53Syracuse, NY 127 174 +47Spokane, WA 35 81 +46Nassau-Suffolk, NY* 96 139 +43Tacoma, WA* 8 50 +42Bridgeport-Stamford-Norwalk, CT 93 135 +42Augusta-Richmond County, GA-SC 121 163 +42Amarillo, TX 49 89 +40Pittsburgh, PA 136 176 +40Nashville-Davidson-Murfreesboro-Franklin, TN 22 61 +39Lynchburg, VA 71 110 +39Kansas City, MO-KS 77 116 +39Indianapolis-Carmel, IN 81 120 +39*Indicates Metropolitan Division
Table 3. Biggest gainersChange in rankings
Source : Milken Institute
The Biggest Gainers


11
Best-Performing Cities 2008
The Biggest LosersMost of the metros experiencing the most precipitous declines in the 2008 rankings were the epicenters of the housing decline. Many experienced a rise in home sales and prices far in excess of the underlying fundamentals earlier this decade. Some had a high share of sub-prime mortgage loan issuance over the past several years, and as interest rates on ARMs adjusted higher, delinquency and foreclosure rates soared. Housing prices have plummeted in the majority of these markets and new home construction has ground to a halt. Additionally, several had a high concentration of mortgage originators and have experienced a dramatic decline in financial services employment. Thirteen out of the twenty biggest decliners are in Florida, California, or Nevada, reflecting the severity of the housing downturn in those markets.
Vallejo-Fairfield, California, saw the biggest plunge, falling a precipitous 123 spots to 145th. This metro area has taken one of the hardest hits in the nation from recent housing woes. The economic and financial consequences have been so severe, in fact, that the city of Vallejo was forced to declare bankruptcy.
Table 4. Biggest losersChange in rankings
Metropolitan Statistical Area (MSA)2008rank
2007rank
Spots down
321-22541AC ,dleifriaF-ojellaV311-72041 AC ,arutneV-skaO dnasuohT-dranxO701-62331 VN ,skrapS-oneR701-31021 LF ,sreyM troF-laroC epaC77-638 LF ,dnalsI ocraM-selpaN27-78951 YN ,nwotelddiM-hgrubweN-eispeekhguoP07-8289 LF ,nevaH retniW-dnalekaL96-63501 *LF ,hcaeB notnyoB-notaR acoB-hcaeB mlaP tseW66-957 VN ,esidaraP-sageV saL26-0329 LF ,hcaeB dnomrO-hcaeB anotyaD-anotleD75-94601 *AC ,enivrI-miehanA-anA atnaS65-84401 LF ,ellivsutiT-enruobleM-yaB mlaP45-421871 *JN-DM-ED ,notgnimliW45-0449 IH ,ululonoH05-335 AC ,oiratnO-onidranreB naS-edisreviR94-101051 LA ,revooH-mahgnimriB74-511261 AC ,otsedoM74-26901 *JN ,nedmaC64-65201 AV ,dnomhciR14-17211 VW-DM ,grubsnitraM-nwotsregaH
*Indicates Metropolitan DivisionSource : Milken Institute
The Biggest Losers


13
Best-Performing Cities 2008
The Best-Performing Large CitiesProvo-Orem, Utah, jumps into the no. 1 ranking in the 2008 Best-Performing Cities index, posting a solid improvement from last year’s 8th-place finish. The area’s economy has been generating job growth far in excess of the national average over the past five years. From 2002 to 2007, Provo-Orem has seen its employment base expand 16.5 percentage points faster than the U.S. average, ranking 5th overall in this indicator. Its job-growth performance remained strong in 2007 at 5.0 percent, placing the metro 3rd in the nation in this measure. The quality of jobs being generated has been high as well, highlighted by its 3rd-place position in wages and salary growth in 2006. Much of its economic growth has been fueled by a remarkable recovery in high-tech information services and hardware. Provo-Orem has benefited from increased research and associated spin-off activity at Brigham Young University (BYU). Superior job growth has sparked high rates of migration to the area, further spurring housing and non-residential construction building activity.
2007200620052004200320022001
110
105
100
95
90
85
80
2001 index =100
Sources: Moody's Economy.com, Milken Institute
Figure 1. High-tech employment Provo-Orem vs. United States
Provo-OremUnited States
Like many high-tech areas of the country, Provo-Orem experienced a dramatic decline in employment at its leading firms when the technology bubble burst earlier this decade. However, while national high-tech employment has never regained the levels achieved in early 2001, Provo-Orem has actually managed to eclipse its previous peak. Its new Micron Technology/Intel flash memory plant has expanded employment in this high-paying sector.6 Software technology is another important driver for the area’s economy. Provo-Orem is 3.3 times more dependent on software employment than the national average, with Novell and Symantec as key anchors. BYU has also expanded its research budget, increased student enrollment, and has become the center of an emerging life sciences cluster. A number of companies have either been spun out or launched based on university-developed intellectual property.
Broad-based job growth led to high rates of net migration into Provo-Orem. From a low of 1,600 in 2004, net migration rose to an estimated 10,000 in 2007.7 This population growth is self-reinforcing, as it drove higher consumer purchases and greater demand for housing. New residential construction activity was brisk (although it has fallen off in recent months), with building construction employment
The Best-Performing Large Cities

14
Best-Performing Cities 2008
rising by an average of 15.8 percent over the last five years. Construction generated more than 25 percent of all jobs created in 2006 and 2007. A retrenchment in new home construction will reduce future job growth in Provo-Orem, but national business investment in information and communication technology remains fairly strong despite the economic downturn and should mitigate the extent of the slowdown in Provo-Orem.
Raleigh-Cary, North Carolina, leapt to 2nd place this year, up from 10th in last year’s rankings. At 5.5 percent, its job growth was 2nd in the nation in 2007. Despite some slowing this year, job growth over the twelve-month period from March 2007 to March 2008 was 1st in the nation at 3.6 percent. Like many tech centers, its economy took a hit in the national tech implosion of 2001; however, Raleigh-Cary’s technology sectors have recovered and aided economic expansion. Professional and business services have witnessed robust growth, and state government employment provides some stability. Stellar economic growth was reinforced by high net migration, which rose to an estimated 36,000 in 2007.
Figure 2. Professional, scientific, and technical servicesRaleigh-Cary vs. United States
2007200620052004200320022001
10.0
8.0
6.0
4.0
2.0
0.0
-2.0
-4.0
Jobs, percent change from preceding year
Sources: Moody's Economy.com, Milken Institute
Raleigh-CaryUnited States
Raleigh-Cary has developed into one of the premier technology clusters in the nation. Top-notch universities (North Carolina State and the University of North Carolina, Chapel Hill) serve as research anchors and provide high-quality talent at moderate wage levels relative to other U.S. tech centers.8 The relatively low cost of living is a major recruiting advantage for the area. Universities and other research centers interact with the business community to form a closely integrated network that aids economic development. IBM has a major presence in the area, employing more than 13,000 workers.9 SAS Institute, the statistical software giant, is also headquartered here, while Red Hat is another major player. The biopharmaceutical sector has been growing, with GlaxoSmithKline being the largest employer in this field. Overall, the region is more than 50 percent more dependent on the high-tech sector than the national average. The high knowledge content of the region’s economy is reflected in per capita income roughly $4,000 above the average for North Carolina as a whole. Raleigh-Cary won’t escape the national housing market correction, but it should avoid the steep declines in new construction activity and prices that other areas will experience.
The Best-Performing Large Cities

15
Best-Performing Cities 2008
Salt Lake City, Utah, improved to take the 3rd spot this year, rising fifteen places from its 2007 ranking. While it lands in the top five in only one of the individual components that comprise the index, it consistently achieves upper-tier ranking. As with the top two metros, the high-tech sector played a role in propelling Salt Lake City up the list, but in this case, energy operations factored into the outcome as well. Computer systems and related design is an important driver of economic growth in the area’s economy. Salt Lake City has become an important regional financial center, with Zions Bancorporation employing 9,500 and Discover Financial Services basing major operations in the area.10
Figure 3. Computer systems design and related servicesSalt Lake City vs. United States
2007200620052004200320022001
20.0
10.0
0.0
-10.0
-20.0
Jobs, percent change from preceding year
Sources: Moody's Economy.com, Milken Institute
Salt Lake CityUnited States
Health care is an important component of the area’s economy; Intermountain Health Care employs more than 27,000 workers.11 The University of Utah is an important player in medical research, and the state has supported commercialization activities through its Centers of Excellence program funding. The state government is the largest employer—and while many state capitals are experiencing severe budget shortfalls, Utah’s finances have been managed in a fiscally prudent manner. This should allow Salt Lake City to avoid cutbacks in government employment. Travel and tourism activity is another vital sector for the area’s economy. The local housing sector is slowing, with building permits running at approximately one-half their peak level in 2005. Nevertheless, strong export markets and continued high levels of business investment in information technology leave Salt Lake City well positioned relative to other areas of the nation.
The Best-Performing Large Cities

16
Best-Performing Cities 2008
Austin–Round Rock, Texas, a thriving example of a 21st-century knowledge-based community, soars sixteen places from last year’s ranking to stand at 4th overall in 2008. Its economy has recently gained forward momentum as evidenced by two job growth indicators: one showing growth from 2006 to 2007 and another measuring the twelve months from March 2007 to March 2008. Austin placed 4th in the nation in both of these categories, while its five-year job growth ranking from 2002 to 2007 was 21st.
Austin–Round Rock ranks 10th in the nation in terms of the importance of the high-tech sector to its local economy. Among high-tech industries, its highest concentration is in computer and electronic product manufacturing; it is four-and-a-half times more dependent on this sector than the nation overall. Dell is the major computer manufacturer, along with IBM; electronic component firms Applied Materials, Advanced Micro Devices, Flextronics, Samsung Austin Semiconductor, and others play a major role in the area’s economy.12 Even Google recently announced that it chose Austin for the site of a new satellite software engineering office that will be home to some 100 engineers.13 With the University of Texas, Austin, producing high-quality science and engineering graduates, and the relative attractiveness of the area to talent from other parts of country, many tech firms have established operations. Governor Perry is even pushing harder for UT-Austin to create more start-up firms and include commercialization of research as a criterion in granting tenure.
Figure 4. Computer and electronic product manufacturingAustin-Round Rock vs. United States
2007200620052004200320022001
7.0
6.0
5.0
4.0
3.0
2.0
1.0
0.0
Percent share of total employment
Sources: Moody's Economy.com, Milken Institute
Austin-Round Rock United States
The Austin economy isn’t built on high tech alone, but is based on a diverse group of industries. A wide array of professional and business services provide high-paying jobs to the area’s residents. Austin is well known for its music scene, and its economy has a related travel and tourism component. New residents far outnumber those who leave the area; Austin’s net migration total was more than 48,000 in 2007. This causes a ripple effect in new home construction and related retail and other non-residential construction. Additionally, Austin’s role as the state capital positions state and local government as the largest employer. While the area won’t escape the national slowdown, it is poised to remain among the top performers.
The Best-Performing Large Cities

17
Best-Performing Cities 2008
Huntsville, Alabama, climbs to 5th place this year, an improvement of eleven spots from last year’s ranking. The Huntsville economy is among the most dependent on high-tech industries in the country, ranking 7th overall; the area is more than twice as tied to the sector as the nation overall. Computer and electronic product manufacturing has the highest concentration of any industry in the metro, closely followed by transportation equipment manufacturing. Government employment is the third most concentrated in Huntsville, closely followed by another tech sector: professional, scientific, and technical services. NASA’s Marshall Space Flight Center is an important anchor for the area and will play a vital role in mankind’s return to the moon on the Ares 1.14 Many aerospace contractors are establishing or expanding operations in hopes of securing additional work on the program. Aerospace giants Boeing and Northrop Grumman have an important presence in the metro area.
Figure 5. Professional, scientific, and technical servicesHuntsville vs. United States
2007200620052004200320022001
16.0
14.0
12.0
10.0
8.0
6.0
4.0
Percent share of total employment
Sources: Moody's Economy.com, Milken Institute
Huntsville United States
The Redstone Arsenal, a major U.S. Army post, will benefit from the Pentagon’s Base Realignment and Closure (BRAC) program over the next several years. The Army Space Missile Defense Command recently completed its move from Arlington, Virginia,15 and the Missile Defense Agency is slated to relocate more than 2,200 employees here over the next couple of years. Huntsville is also beginning to establish new growth in the life sciences as the HudsonAlpha Institute for Biotechnology opened its doors late last year. Strong service sector growth has resulted in gains in consumer spending. New office construction has been driven by all of the business expansion activity; residential construction has increased demand for workers, but the number of permits has recently fallen off. Nevertheless, Huntsville seems well-positioned for continued growth despite the national contraction.
Wilmington, North Carolina, ranks 6th this year, slipping just four slots from 2007. Although its momentum has been slowing in recent months, the metro has recorded job growth rates that are among the highest in the nation. Wilmington was 8th in job growth measured over the last five years and 5th in 2007 alone, but failed to place in the top forty for job growth as measured over the twelve months ending in March 2008. Increased port activity and the associated logistical support infrastructure have been a significant source of growth. A new, deeper channel has allowed the port to handle larger container ships
The Best-Performing Large Cities

18
Best-Performing Cities 2008
and establish a new shipping service with closer ties to Asia. Easy rail and interstate freeway access has made the area an important distribution center for big box retailers.16 The tourism sector is another key driver for Wilmington: Scenic and sightseeing transportation is the most concentrated industry in the area’s economy, while full-service restaurants and limited-service eating places are the second- and third-largest employers after state and local government.
Job growth in professional and business services has bolstered the area’s economy. Development officials have adopted a strategy of growing knowledge-intensive industries that will diversify the local economy and improve per capita incomes.17 In support of that effort, Verizon Wireless has been expanding operations and now employs more than 1,200 workers. Over the past five years, telecommunications employment has risen by an annual average rate of 23.9 percent. The revival of the nuclear energy industry is creating opportunities for the region’s economy, too. GE Energy is consolidating many of its design operations in Wilmington. Rapid employment and population growth, along with strong demand for second homes, supported a high level of home construction, but Wilmington’s housing market is slowing and will remove this sector as a source of economic growth.
Figure 6. Jobs in wireless telecommunications carriers* Wilmington vs. United States
2007200620052004200320022001
120
100
80
60
40
20
0
-20
Percent change from preceding year
Sources: Moody's Economy.com, Milken Institute
*Excluding satellite
WilmingtonUnited States
McAllen-Edinburg-Mission, Texas, is holding steady in 7th place, retaining the same ranking it received last year. Although it has slipped somewhat in recent months, the metro’s job growth remains among the strongest in the nation. McAllen had the 3rd-highest job growth on a five-year basis, while the most recent data one-year job momentum indicator places it 10th in the nation. Its economy is closely linked to its sister metro across the border, Reynosa, Mexico.18 Burgeoning trade activity with Maquiladora facilities has allowed the area to become a key distribution/logistic center. For example, increased U.S.-Mexican trade through McAllen is reflected in the 14.4 percent annual average increase over the past five years in truck transportation employment. Declining demand from the Big Three automakers due to weak sales has reduced imports of parts from Maquiladora plants.
The Best-Performing Large Cities

19
Best-Performing Cities 2008
Another key source of growth has been new call centers. Converges and T-Mobile have established operations in the area.19 Nearly 1,200 jobs have been created in telecommunications services over the past five years, an average annual growth rate of 29.4 percent. The area has become a regional health services center with a strong position in home health care, now the second largest employment sector after state and local government. Health services provide a relatively stable source of job growth. McAllen has developed a major presence in retail trade, serving many consumers south of the border.
Tacoma, Washington, leaps to 8th place, moving up from last year’s ranking of 50th. The area has enjoyed stable employment growth, coming in slightly above 3.0 percent for the period measured in our five-year indicator. Although its housing and business costs are close to the national average, they are inexpensive relative to nearby Seattle. Low housing costs have attracted many young families, including professionals who work in Seattle. As more professionals move into the area, firms have opened offices to tap into the labor pool.20 For example, Intel employs 1,100 in the metro division. Data processing, hosting, and related services enjoyed average annual job growth of 17.2 percent over the past five years.
Figure 7. Job growthTacoma vs. United States
2007200620052004200320022001
4.0
3.0
2.0
1.0
0.0
-1.0
-2.0
Percent change from preceding year
Sources: Moody's Economy.com, Milken Institute
TacomaUnited States
International trade plays an important role in the area’s economy as well. The Port of Tacoma specializes in inbound containers from Asia and has benefited from capacity constraints at the ports of Los Angeles and Long Beach. Its largest exports are wood products and apples. The industry category of support activities for transportation has the highest concentration of employment in the metro economy, and many other transportation-related categories rank among the leaders. The military also has a large presence in the Tacoma economy. The U.S. Army base at Fort Lewis is the largest employer, with 37,000 soldiers and workers; along with McChord Air Force Base, it provides a steady source of demand.21 A slowdown in construction activity will curtail growth in the local economy, but nevertheless, Tacoma should remain among the best performers in the country.
The Best-Performing Large Cities

20
Best-Performing Cities 2008
Olympia, Washington, joins its neighbor Tacoma on the list of the nation’s top ten best performers, ranking 9th this year. In previous years Olympia was categorized as a small metro, but steady employment and population growth have pushed it onto the list of the 200 largest metro areas. Because it is the capital of Washington, state and local government is the key driver of Olympia’s economy. State and local government employs 36,200 workers, which is nearly 36.0 percent of total employment in the region. Since Washington’s economy has seen brisk growth in recent years, Olympia’s state government has benefited from this largesse. The current state budget gap will curtail growth in this sector, but is unlikely to cause a decline in overall economic activity in the area.
Business and housing costs are low relative to nearby Seattle, and Olympia has probably benefited even more than Tacoma from this cost advantage.22 Olympia has been gaining more residents from Tacoma and Seattle than it has lost, with net migration estimated at over 4,300 in 2007. This population growth has resulted in fairly strong housing construction. Information services have been the fastest-growing job sector over the past five years, with average annual growth of 38.0 percent. The main limit on long-term economic growth is the absence of large private-sector employers. Nevertheless, as other metro areas experience significant declines due to the deterioration of formerly high-flying housing markets, Olympia’s government sector should immunize it from a similar fate.
2007200620052004200320022001
30.0
20.0
10.0
0.0
-10.0
-20.0
Percent change from preceding year
Sources: Moody's Economy.com, Milken Institute
Figure 8. Information services employmentOlympia vs. United States
OlympiaUnited States
The Best-Performing Large Cities

21
Best-Performing Cities 2008
Charleston–North Charleston–Summerville, South Carolina, moves up two places to rank 10th this year. Tourism has been a catalyst of job creation for the regional economy, as increasing numbers of tourists from the Northeast and Midwest have been drawn here to discover Charleston’s history, architecture, and rich cultural scene. Although it has recently experienced slower growth in inbound cargo due to the low value of the dollar and the national economic contraction, the Port of Charleston has witnessed remarkable growth in recent years. It is consistently ranked among the most efficient ports in North America. A large transportation/logistics industry has developed, supporting thousands of jobs in the regional economy.
Another key source of growth is its expanding aerospace manufacturing sector, with specializations in advanced composite materials, precision metal parts, and systems integration. Dupont is building a $500 million Kevlar production facility as commercial aircraft producers are turning to Kevlar as a lightweight substitute for aluminum.23 Employment in data processing, hosting, and related services has achieved average annual growth of 10.9 percent over the past five years. The health-care industry, anchored by the Medical University of South Carolina, is an important component of the economy, while biosciences are a target for investment as the sector attempts to leverage its medical research assets.
Figure 9. Aerospace product and parts manufacturingCharleston-North Charleston-Summerville vs. U.S.
2007200620052004200320022001
40.0
30.0
20.0
10.0
0.0
-10.0
-20.0
-30.0
Jobs, percent change from preceding year
Sources: Moody's Economy.com, Milken Institute
Charleston-North Charleston-SummervilleUnited States
Even as the housing downturn worsened throughout 2007, Orlando-Kissimmee, Florida, maintained a strong showing, coming in at 11th overall. Although it dropped six places from its ranking in last year’s index, it has consistently achieved high growth. Total employment and wages in the metro area have grown 15.0 and 17.0 percentage points, respectively, above the national average in the period examined in our five-year indicators. Orlando-Kissimmee’s emerging health-care cluster is broadening the area’s industry base. The development of the Burnham Institute for Medical Research and a new medical school based at the University of Central Florida will expand the industry’s R&D capacity and attract more high-tech firms to the area. Recently approved plans for the Nemours Children’s Hospital Orlando will further enhance the metro’s growing health-care sector.24 In the last year alone, roughly 4,000 jobs were added to this sector.
The Best-Performing Large Cities

22
Best-Performing Cities 2008
Growth in recent months has been suppressed by the real-estate market, as high foreclosure rates and a dearth of buyers have sent inventories soaring. This has placed a damper on construction activity; employment in the industry declined 7.0 percent between 2006 and 2007. Additionally, weakness in the national economy has strained the area’s leisure and hospitality sector, the primary driver of growth in the region. But the negative impacts on Orlando’s tourism industry may be offset by an influx of international travelers, who can take advantage of the weaker U.S. dollar to enjoy the area’s resorts and theme parks at bargain prices.
Bakersfield, California, gained some ground, moving up from 17th to 12th place in this year’s index. Over the last few years, the metro’s growth has been ignited by housing and a burgeoning population. As a result, the metro has benefited from increased demand for services such as education and health care. Natural resources such as oilfields have created opportunities for growth. The mining and petroleum manufacturing industries in particular have been largely responsible for the underlying growth in the region. Total non-farm employment and wages grew 10.0 and 14.0 percentage points faster, respectively, than the national average in the five-year span we examined. Administrative and support services along with food and drinking places added 6,300 jobs between 2002 and 2007, a period that still reflected some of the positive ripple effects from the housing boom. Today, however, Bakersfield is being hit hard by the housing crisis, posting one of the nation’s highest foreclosure rates. The same industries that drove growth in the past few years are now bracing for deterioration.
Figure 10. Non-farm employmentBakersfield vs. United States
2007200620052004200320022001
6.0
4.0
2.0
0.0
-2.0
Percent change from preceding year
Sources: Moody's Economy.com, Milken Institute
BakersfieldUnited States
In the long term, Bakersfield will rely on its strategic location between northern and southern California and its proximity to Nevada, factors that will continue to support its transportation and logistics sector. The presence and operations of Edwards Air Base and Chevron will help stabilize the metro’s economy during the downturn.25
The Best-Performing Large Cities

23
Best-Performing Cities 2008
Killeen-Temple–Fort Hood, Texas, moved sharply higher in this year’s index, rising from 33rd to 13th place. Wages and salaries grew by 5.0 percentage points above the national average between 2005 and 2006. The strong military presence in Fort Hood has been the primary driver of growth in the area.26 Killeen’s solid performance also reflects the fact that it has not been as severely affected by the housing downturn as most metros in the nation, sparing the area from further ripple effects in related industries. In fact, most sectors in the metro area have experienced growth in the past few years. Professional, business, and scientific services grew by an average of 6.0 percent annually in the five-year period we examined, adding more than 1,200 jobs. Telecommunications employment grew by 14.0 percent average annually (creating nearly 800 jobs) in the same period, driving high-tech output growth in Killeen to 10th highest in the nation. The area’s low cost of doing business has provided incentives for firms in nearby larger cities.
The biggest gainer in last year’s index, Lafayette, Louisiana, improved its position by another ten spots to claim 14th place this year. Last year’s dramatic climb was largely attributable to the population influx of hurricane evacuees. This sharp growth in population consequently led to increased demand in various service-driven industries. With the current housing crisis and slowdown in related sectors of the economy, growth in the metro has begun to subside. Interestingly, a shortage in health-care and education services has led to a dramatic increase in wages and salaries in those industries.27 Between 2005 and 2006, overall wages and salaries in the metro experienced the fastest increase in the nation, growing 8.0 percentage points above the U.S. average.
2007200620052004200320022001
3.0
2.5
2.0
1.5
1.0
0.5
0.0
Percent change from preceding year
Sources: Moody's Economy.com, Milken Institute
Figure 11. Population growthLafayette vs. United States
LafayetteUnited States
Energy exploration in the nearby Gulf of Mexico will continue to support local manufacturing and mining industries, helping to mitigate some losses in other sectors. Machinery and fabricated metal product manufacturing added more than 600 jobs in the last year, while support for mining generated an additional 1,000 workers. These sectors have contributed to overall job growth of 2.8 percent in the twelve months ending with March 2008.
The Best-Performing Large Cities

24
Best-Performing Cities 2008
San Antonio, Texas, climbed twenty-eight spots in this year’s ranking to place 15th. The indicator for recent job momentum (comparing March 2007 and March 2008) shows robust growth of 2.3 percent. It appears that the metro’s housing market has been relatively stable as compared to other parts of the country. Construction employment actually increased by 4.5 percent between 2006 and 2007, and if anything, a strong military presence and proposed renovations and modernizations within the local bases will help to sustain employment in the industry. The presence of a Toyota plant has positively contributed to the transportation equipment manufacturing industry, which has generated more than 4,000 jobs in the last five years (an average increase of 14.0 percent annually). Proposed defense spending will generate additional economic activity in the metro and help sustain viable growth in the long run.28
Another Texas metro, Houston–Sugar Land–Baytown, has climbed up in the rankings, rising from 32nd to 16th place. Among the nine measures used to compile the overall index, Houston’s most recent job momentum performance (comparing March 2007 and March 2008) was most notable. The metro area expanded its job base by a whopping 3.2 percent, the second-largest increase in the nation. The indicators for one-year job and wage growth also showed robust gains, rising 3.0 and 4.0 percentage points faster, respectively, than the national averages. Opportunities stemming from the energy industry, specifically with respect to oil exploration in the Gulf, have been a key engine for growth. Industries supporting oil exploration have also been performing well. Heavy and civil engineering construction recorded an increase of 5,700 jobs, while specialty trade contractors added another 7,800 jobs in the one-year indicator we examined (2006–2007). Support activities for mining also contributed 3,700 jobs. In terms of high-tech, machinery manufacturing grew 5.0 percent between 2006 and 2007, generating 3,800 high-paying jobs. The presence of key players in the region (namely Exxon-Mobil, Shell, Chevron, and BP) will help sustain the industry’s growth.29
Figure 12. Mining, quarrying, and oil and gas extractionHouston-Sugar Land-Baytown vs. United States
2007200620052004200320022001
15.0
10.0
5.0
0.0
-5.0
Employment, percent change from preceding year
Sources: Moody's Economy.com, Milken Institute
Houston-Sugar Land-BaytownUnited States
The Best-Performing Large Cities

25
Best-Performing Cities 2008
The metro division of Seattle-Bellevue-Everett, Washington, jumped an impressive sixty spots to claim 17th place in this year’s index. The indicator for recent job momentum (comparing March 2007 with March 2008) showed a healthy 2.0 percent employment growth. Transportation equipment manufacturing, which encompasses the aerospace sector, was responsible for generating 5,600 of the jobs measured in our indicator for one-year growth between 2006 and 2007. In the same period, professional R&D services added another 6,200 jobs. Most of the growth can be attributed to the vast presence of Boeing and Microsoft (and the secondary impacts of these two behemoths throughout the region). Increased global demand for more fuel-efficient commercial aircraft has sweetened Boeing’s outlook.30 The metro’s high-tech sector produces 1.3 times the national average for output. In addition, this sector depends on highly skilled labor, resulting in above-average wages—so it is no surprise that the indicator for one-year growth in wages and salaries was 3.2 percentage points above the national average.
2007200620052004200320022001
15.0
10.0
5.0
0.0
-5.0
-10.0
-15.0
Percent change from preceding year
Sources: Moody's Economy.com, Milken Institute
Figure 13. Transportation equipment manufacturing jobsSeattle-Bellevue-Everett vs. United States
Seattle-Bellevue-EverettUnited States
Ogden-Clearfield, Utah, moved up from 42nd to 18th place in the rankings. The indicator for five-year job growth between 2002 and 2007 shows the metro area outpacing the national average by 7.4 percentage points. Although it has since slowed, the construction industry grew by more than 10 percent between 2006 and 2007. Strong population growth in the area has helped fuel demand across consumer-driven industries. Ambulatory health care and administrative and support industries together added roughly 5,000 jobs in the period encompassed by our five-year indicator. Professional, scientific, and technical services added another 2,600 jobs. The debut of a new rail line between Salt Lake and Ogden in 2008 will help support future economic activity.31 In addition, Ogden’s Hills Air Force Base has served as an important driver for the metro’s emerging aerospace industry.
Although it dropped eight spots, Myrtle Beach–North Myrtle Beach–Conway, South Carolina, managed to maintain a solid position in 19th place. Overall job growth in the five-year period examined in our indicators outstripped the national average by more than 15 percentage points. Contributing to that growth was the metro’s leisure and hospitality sector, which posted 6.6 percent growth between 2006 and 2007 alone. Plans for an airport expansion are currently underway to accommodate both residents
The Best-Performing Large Cities

26
Best-Performing Cities 2008
and leisure travelers.32 In the past few years, a booming population (driven in part by an increasing number of retirees who choose to settle here) has helped to maintain a robust service economy. Our indicator for five-year employment growth shows that accommodations and food services added more than 6,700 jobs between 2002 and 2007. Another 2,100 jobs were added in administrative and support services during the same period.
Greeley, Colorado, improved by nine positions to rank 20th in this year’s index. The area’s low cost of living has provided a more affordable alternative to residents in nearby metros. With a healthy population influx in the last few years, Greeley’s overall employment base rose 2.5 percent from March 2007 to March 2008. Vestas Wind Systems, a manufacturer of wind turbines, will give a further boost to the area’s high-tech industry base, as it expects to add another 700 jobs.33 In fact, high-tech output in the metro grew 2.7 percentage points faster than the national average. Plastic and rubber manufacturing has grown by 12.2 percent on an average annual basis over the five-year period we examined, while professional, scientific, and technical services added over 600 jobs during that same time frame.
Rising by a substantial fifty-three spots in this year’s index, Durham, North Carolina, ranks 21st overall. Our indicator for recent job momentum shows that total employment grew 2.3 percent between March 2007 and March 2008. In 2007, Durham’s high-tech output was 2.2 times the national average. In addition, the metro area (which is part of the Research Triangle) is home to a diverse set of high-tech industries, thanks to key players such as Duke University, IBM, and GlaxoSmithKline.34 Durham’s economy has witnessed an expansion in the last few years. Between 2002 and 2007 (the period covered in our five-year job growth indicator), ambulatory health-care hospital services created more than 5,200 jobs, while education services added another 3,600 jobs. Perhaps the most significant expansion came from the public sector, as government created more than 4,300 jobs in the metro area. The region’s strength in high tech, particularly in the life sciences, brightens its prospects for long-term economic prosperity.
2007200620052004200320022001
4.0
3.0
2.0
1.0
0.0
Percent change from preceding year
Sources: Moody's Economy.com, Milken Institute
Figure 14. Government employmentDurham vs. United States
DurhamUnited States
The Best-Performing Large Cities

27
Best-Performing Cities 2008
Nashville-Davidson-Murfreesboro-Franklin, Tennessee, made solid strides from last year’s ranking to claim the 22nd spot overall. Strong migration trends have contributed to population growth year-over-year, while housing prices have declined at a more moderate pace than in the rest of the nation. Non-farm employment and wages have experienced healthy gains, rising 4.5 and 7.7 percentage points higher, respectively, than the national average in our indicator for five-year job growth. The metro’s relatively low business costs have supported the expansion of warehousing (1,500 jobs), clothing (2,400 jobs), and management of companies (2,200 jobs) between 2002 and 2007. In the last year alone, the metro area added 540 jobs in its data-processing services sector. The presence of Nissan and GM plants, however, may not continue to be a source of growth, given the gloomy outlook on auto manufacturing in the short term.35
Dallas-Plano-Irving, Texas, moved up sharply to come in at 23rd place. Growth in the metro division has been fairly broad-based, exceeding the national average in many of the categories used to compile the index. The area’s high-tech sector continues to diversify and attract new firms. Just recently, AT&T announced that it will be moving its headquarters from San Antonio to Dallas.36 Internet service providers/data processing and telecoms are already 3.5 and 2.3 times more concentrated, respectively, in Dallas than in the nation as a whole. Between 2006 and 2007, the category for management of companies and enterprises contributed more than 2,100 jobs, an increase of 7.7 percent. The credit-intermediation industry has added more than 18,000 jobs over the last five years, supporting the metro’s already well-established financial sector. Dallas’s growing reputation as a convention center has generated positive impact on local business and increased demand in industries that cater to such large-scale events.
Savannah, Georgia, rose to 24th place this year. Our five-year indicator shows that non-farm employment and wages have risen by 11.9 and 9.5 percentage points higher, respectively, than the national averages. Not only does the city benefit from a strong military presence, but Savannah’s port has also served as a key asset to its economic vitality.37 As the dollar has declined, exports have strengthened, supporting trade-related activity in the region. Support activities for transportation added 1,200 jobs between 2002 and 2007, while administrative and support contributed nearly 4,000 jobs. The metro’s aerospace industry has also generated 1,400 jobs during that period, increasing 4.8 percent on an average annual basis. Growth in these industries has yielded higher-paying jobs in the region.
Figure 15. Support activities for transportation employmentSavannah vs. United States
2007200620052004200320022001
20.0
15.0
10.0
5.0
0.0
-5.0
-10.0
Percent change from preceding year
Sources: Moody's Economy.com, Milken Institute
SavannahUnited States
The Best-Performing Large Cities

28
Best-Performing Cities 2008
Des Moines–West Des Moines, Iowa, came in at 25th, after placing 58th last year. The Des Moines economy has been growing slightly above the U.S. average in terms of employment and wages. The area’s high-tech output outstripped the national average by 6.3 percentage points. Professional, scientific, and technical services generated more than 1,900 jobs between 2002 and 2007, the period examined in our five-year indicators. Machinery manufacturing has grown at an average annual rate of almost 4.0 percent over that period. The metro area is also a hub for financial services and insurance, including key players such as Wells Fargo and Principal Financial Group.38 The credit-intermediation activities industry is almost three times more concentrated in Des Moines than in the nation as a whole; this industry has contributed more than 4,200 jobs during the five-year period we examined.
The Best-Performing Large Cities

29
Best-Performing Cities 2008
America’s Ten Largest Cities: PerformanceAmong America’s ten largest cities, outcomes were decidedly mixed. Unlike the previous two editions of the index, this year’s results show none of the ten largest cities in the country ranked among the top ten overall performers. As shown in the table below, previous standouts Riverside–San Bernardino–Ontario, California, and Phoenix-Mesa-Scottsdale, Arizona, both experienced significant declines. Meanwhile, Houston–Sugar Land–Baytown, Texas, continued its dramatic, energy-industry-driven ascent to become the top performer among the nation’s ten largest metros. (The economies of Houston and Dallas-Plano-Irving, Texas, were profiled earlier in this report since both metros placed among the top twenty-five best-performing cities overall.)
Metropolitan Statistical Area (MSA)2008rank
2007rank
Houston-Sugar Land-Baytown, TX 16 32Dallas-Plano-Irving, TX* 23 59Phoenix-Mesa-Scottsdale, AZ 32 4Washington-Arlington-Alexandria, DC-VA-MD-WV* 41 37Riverside-San Bernardino-Ontario, CA 53 3Atlanta-Sandy Springs-Marietta, GA 59 86New York-White Plains-Wayne, NY-NJ* 85 148Los Angeles-Long Beach-Glendale, CA* 126 109Philadelphia, PA* 130 142Chicago-Naperville-Joliet, IL* 160 152*Indicates Metropolitan DivisionSource : Milken Institute
Table 5. Performance of America's ten largest cities Rank in 2008 index
America’s Ten Largest Cities: Performance
30
Best-Performing Cities 2008
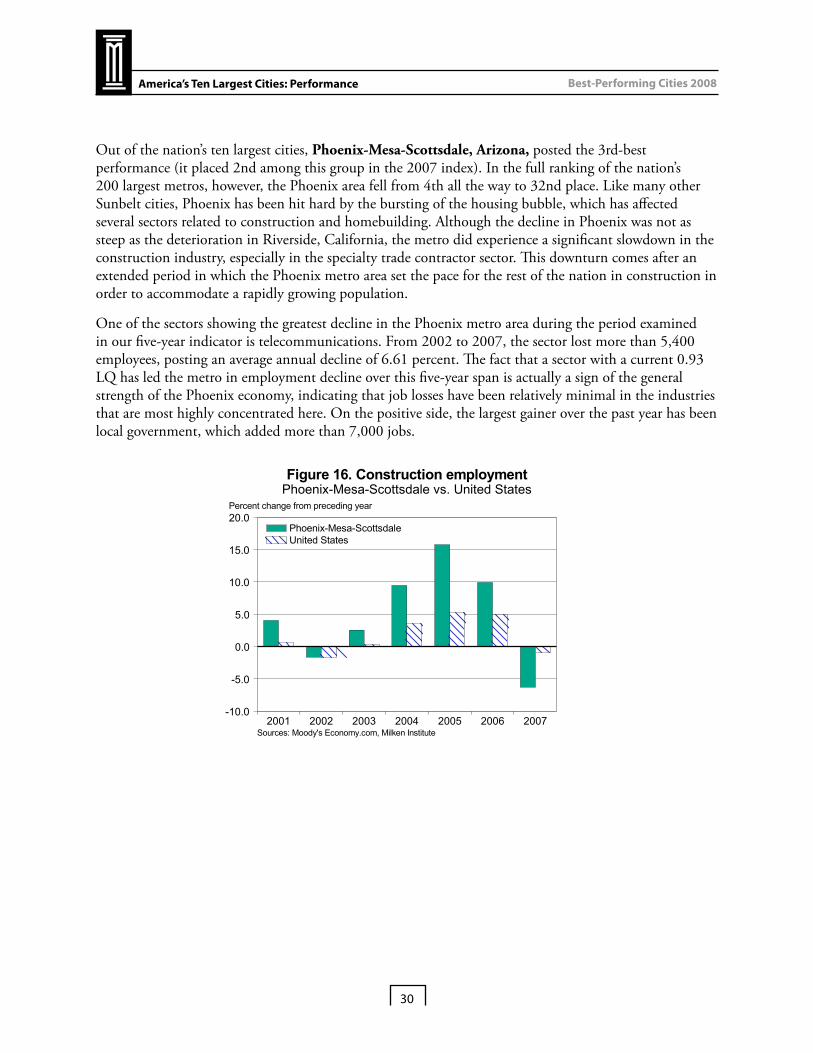
Out of the nation’s ten largest cities, Phoenix-Mesa-Scottsdale, Arizona, posted the 3rd-best performance (it placed 2nd among this group in the 2007 index). In the full ranking of the nation’s 200 largest metros, however, the Phoenix area fell from 4th all the way to 32nd place. Like many other Sunbelt cities, Phoenix has been hit hard by the bursting of the housing bubble, which has affected several sectors related to construction and homebuilding. Although the decline in Phoenix was not as steep as the deterioration in Riverside, California, the metro did experience a significant slowdown in the construction industry, especially in the specialty trade contractor sector. This downturn comes after an extended period in which the Phoenix metro area set the pace for the rest of the nation in construction in order to accommodate a rapidly growing population.
One of the sectors showing the greatest decline in the Phoenix metro area during the period examined in our five-year indicator is telecommunications. From 2002 to 2007, the sector lost more than 5,400 employees, posting an average annual decline of 6.61 percent. The fact that a sector with a current 0.93 LQ has led the metro in employment decline over this five-year span is actually a sign of the general strength of the Phoenix economy, indicating that job losses have been relatively minimal in the industries that are most highly concentrated here. On the positive side, the largest gainer over the past year has been local government, which added more than 7,000 jobs.
2007200620052004200320022001
20.0
15.0
10.0
5.0
0.0
-5.0
-10.0
Percent change from preceding year
Sources: Moody's Economy.com, Milken Institute
Figure 16. Construction employmentPhoenix-Mesa-Scottsdale vs. United States
Phoenix-Mesa-ScottsdaleUnited States
America’s Ten Largest Cities: Performance

31
Best-Performing Cities 2008
The Washington-Arlington-Alexandria, DC-VA-MD-WV, metro area saw very little change from last year. The 4th-best performer among the ten largest cities in the country, it slid only four spots (from 37th to 41st) in the complete rankings of the 200 largest metros. More than 10,000 jobs were added in professional, scientific, and technical services from 2006 to 2007; in our five-year indicator, which examines the period from 2002 to 2007, more than 77,000 jobs were added in this sector. High tech continues to thrive in the region, even as other sectors have begun to falter. The federal government has been a key source of new employment in the metro. While this sector fell slightly in 2007, the number of federal jobs grew significantly from 2002 to 2006, due in large part to the creation of the Department of Homeland Security and growth in the Defense Department. Although total growth in federal employment in the metro area averaged only slightly over 1 percent per year from 2002 to 2006, the vast size of the government means that even a relatively small percentage change translates into a significant number of jobs.
2007200620052004200320022001
3.0
2.0
1.0
0.0
-1.0
-2.0
-3.0
-4.0
Percent change from preceding year
Sources: Moody's Economy.com, Milken Institute
Figure 17. Federal government employmentWashington-Arlington-Alexandria vs. United States
Washington-Arlington-AlexandriaUnited States
America’s Ten Largest Cities: Performance

32
Best-Performing Cities 2008
This year’s index shows a dramatic reversal of fortunes in Riverside–San Bernardino–Ontario, California. Last year’s top performer among the nation’s ten largest cities, it is now only the 5th-best performer in that group. In the full rankings of the nation’s 200 largest metro areas, however, Riverside tumbled from 3rd place all the way to 53rd. The housing downtown has hit the metro’s economy hard. The specialty trade contractor sector, which includes home builders and related services, lost more than 12,600 jobs from 2006 to 2007. In fact, Riverside’s construction sector, which dramatically outpaced the rest of the nation for the first half of the decade, has now become one of the greatest drags on the local economy, shrinking by 11 percent from 2006 to 2007. The region has continued to benefit from corporate relocations, however, with administrative and support services adding more than 3,200 jobs year over year.
Warehousing and storage continues to be a strong sector for the Riverside metro area, as its location outside Los Angeles and San Diego makes it an ideal distribution point. Despite the softening economy, warehousing added more than 1,600 jobs from 2006 to 2007, growing at over 6.4 percent (not matching the rapid 17.5 percent increase it posted during the entire period from 2002 to 2007, but still posting solid gains). Continued growth in this sector is highly likely as the metro remains the only area in Southern California with both the space and the infrastructure to handle expanded cargo flows.39 The largest overall gains in our one-year job growth indicator came from administrative and support services, which added more than 3,200 jobs from 2006 to 2007.
2007200620052004200320022001
15.0
10.0
5.0
0.0
-5.0
-10.0
-15.0
Percent change from preceding year
Sources: Moody's Economy.com, Milken Institute
Figure 18. Construction employmentRiverside-San Bernardino-Ontario vs. United States
Riverside-San Bernardino-OntarioUnited States
America’s Ten Largest Cities: Performance
33
Best-Performing Cities 2008
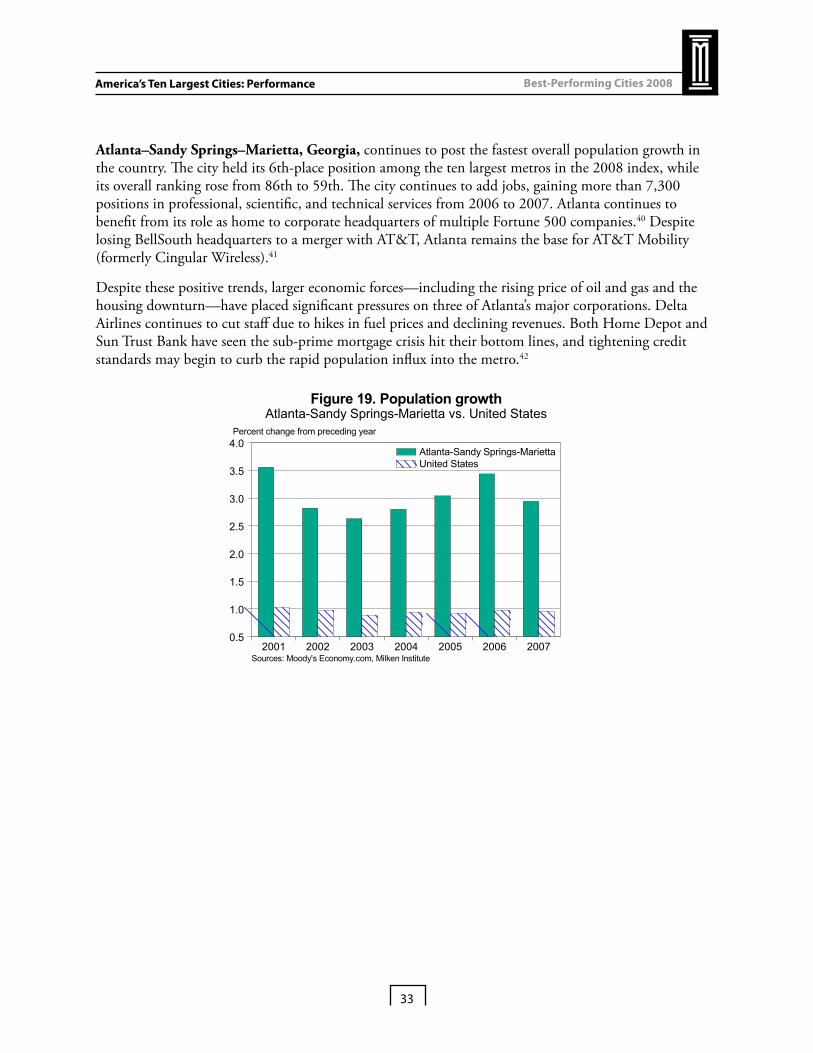
Atlanta–Sandy Springs–Marietta, Georgia, continues to post the fastest overall population growth in the country. The city held its 6th-place position among the ten largest metros in the 2008 index, while its overall ranking rose from 86th to 59th. The city continues to add jobs, gaining more than 7,300 positions in professional, scientific, and technical services from 2006 to 2007. Atlanta continues to benefit from its role as home to corporate headquarters of multiple Fortune 500 companies.40 Despite losing BellSouth headquarters to a merger with AT&T, Atlanta remains the base for AT&T Mobility (formerly Cingular Wireless).41
Despite these positive trends, larger economic forces—including the rising price of oil and gas and the housing downturn—have placed significant pressures on three of Atlanta’s major corporations. Delta Airlines continues to cut staff due to hikes in fuel prices and declining revenues. Both Home Depot and Sun Trust Bank have seen the sub-prime mortgage crisis hit their bottom lines, and tightening credit standards may begin to curb the rapid population influx into the metro.42
2007200620052004200320022001
4.0
3.5
3.0
2.5
2.0
1.5
1.0
0.5
Percent change from preceding year
Sources: Moody's Economy.com, Milken Institute
Figure 19. Population growthAtlanta-Sandy Springs-Marietta vs. United States
Atlanta-Sandy Springs-MariettaUnited States
America’s Ten Largest Cities: Performance

34
Best-Performing Cities 2008
Of the nation’s ten largest metros, New York–White Plains–Wayne, New York–New Jersey, posted the most dramatic gains. Once ranked 9th among this group, it is now the 7th-best performer. In terms of the overall rankings, however, it jumped an impressive sixty-three places, rising from 148th place in the 2007 index to 85th this year. Construction in New York has been thriving, and so far the area has staved off the slump that has affected the rest of the country. Employment in building construction actually grew at a 4 percent pace over the year from 2006 to 2007, adding more than 3,700 jobs; specialty trade contractors also added nearly 6,700 jobs. The sector comprising securities, commodities, and other financial investment activities continued to consolidate in the metro, adding more than 11,500 jobs from 2006 to 2007. New York actually trailed the country as a whole in adding jobs in finance and insurance from 2001 to 2003 (in fact, it suffered significant losses in this sector as financial firms relocated in the wake of 9/11), but that trend has since reversed itself. Employment growth in the metro area’s finance sector remained strong at 2 percent, even as the sector slipped into slightly negative territory on a national level, reflecting the credit crunch.
However, continued pressure on major financial institutions is now becoming apparent in the New York metro area; many firms in the financial sector and in support activities are trimming payrolls in 2008 due to the fallout from the subprime crisis. The sudden fall of Bear Stearns combined with tremendous losses at major institutions such as Citibank are likely to soon wipe out many of the gains posted by New York this year.
2007200620052004200320022001
4.0
2.0
0.0
-2.0
-4.0
-6.0
-8.0
Percent change from preceding year
Sources: Moody's Economy.com, Milken Institute
Figure 20. Finance and insurance employmentNew York-White Plains-Wayne vs. United States
New York-White Plains-WayneUnited States
America’s Ten Largest Cities: Performance

35
Best-Performing Cities 2008
The local economy in Los Angeles–Long Beach–Glendale, California, did not perform well over the past year. The metro area fell seventeen places overall from 109th to 126th in the overall rankings, and slipped from 7th to 8th place among the ten largest metros. In our indicator for recent job momentum, which examines March 2007 to March 2008, Los Angeles ranked 156th overall for job growth, actually losing 0.26 percent of its work force. Like other metros experiencing steep housing declines, Los Angeles has been hit over the past year by the loss of jobs in the construction sector (but since most of the metro area is already heavily developed, losses in this sector are a far smaller percentage of the total work force than in neighboring Riverside). However, high housing prices in Los Angeles have left the metro area highly vulnerable to the effects of tightening credit. Job losses in the financial-services sector (including trouble spots such as Countrywide and IndyMac) are a growing concern.
Our five-year job growth indicator shows that the largest job losses during this period in Los Angeles have been suffered in the apparel industry and in corporate management. Although Los Angeles has managed to remain a center for fashion design, more than 16,400 jobs were lost in apparel manufacturing between 2002 and 2007 (including more than 3,000 cuts between 2006 and 2007 alone). The category encompassing management of companies and enterprises saw the loss of more than 23,300 workers between 2002 and 2007 (including more than 3,800 in the most recent year). As companies have continued to move their headquarters out of Los Angeles due to high cost of doing business, the impact has not only been felt in terms of lost jobs, but also in the form of lost spending that these companies once contributed locally.
The one continued bright spot for the local economy continues to be international trade and tourism. As the dollar weakens, exports thrive and international visitors arrive to take advantage of travel bargains. Los Angeles saw a 4 percent rise in international arrivals in the first quarter of 2008.43
2007200620052004200320022001
4.0
2.0
0.0
-2.0
-4.0
-6.0
-8.0
-10.0
Percent change from preceding year
Sources: Moody's Economy.com, Milken Institute
Figure 21. Corporate management employmentLos Angeles-Long Beach-Glendale vs. United States
Los Angeles-Long Beach-GlendaleUnited States
America’s Ten Largest Cities: Performance

36
Best-Performing Cities 2008
Overtaken by New York, Philadelphia, Pennsylvania, slipped one spot, to 9th place, among the ten largest metro areas. Despite this, the city rose twelve places, from 142nd to 130th, in the full ranking of all 200 metro areas. Philadelphia has continued to thrive as a corporate center. In our indicator for five-year job growth, which examines 2002 through 2007, the management of companies and enterprises sector posted more than 11.5 percent annual growth, adding more than 15,300 jobs. On the down side, data processing, hosting, and related services saw an annual decline of more than 16 percent per year, shedding more than 7,000 jobs in the region during the same period. More troubling has been the decline of pharmaceutical manufacturing, which has been vital to the region’s economy. Chemical manufacturing as a whole lost more than 8,300 jobs from 2002 to 2007 (although losses have slowed recently, to only 640 from 2006 to 2007). While Philadelphia outpaced the nation in pharmaceutical manufacturing growth in 2001 and 2002, it has since trailed severely, continuing to lose jobs even as the country as a whole returned to net gains in the sector in 2006 and 2007.
Philadelphia’s ongoing quest to remain competitive and attract new jobs is made more difficult by its high cost of doing business and the region’s high taxes. Steps have been proposed to reduce property and wage tax burdens in Pennsylvania, and this may restore some of the region’s competitive balance in the near future.44
2007200620052004200320022001
10.0
5.0
0.0
-5.0
-10.0
-15.0
Percent change from preceding year
Sources: Moody's Economy.com, Milken Institute
Figure 22. Pharmaceutical manufacturing employmentPhiladelphia vs. United States
PhiladelphiaUnited States
America’s Ten Largest Cities: Performance

37
Best-Performing Cities 2008
Chicago-Naperville-Joliet, Illinois, remains in 10th place among the ten largest metros, with its overall ranking falling slightly to 160th from 152nd. Mirroring a trend faced by many other older industrial cities, Chicago is coping with the decline of manufacturing. Our five-year job growth indicator shows that six different industrial sectors (textile mills, apparel manufacturing, leather manufacturing, wood product manufacturing, plastics and rubber manufacturing, and computer and electronic product manufacturing) all lost jobs at the rate of more than 4 percent per year between 2002 and 2007, shedding more than 19,000 jobs in total. Chicago’s need for health care has actually been a leading source for new jobs, as ambulatory health-care services contributed more than 19,300 new jobs between 2002 and 2007. Administrative support services fared even better during that period, adding more than 35,200 jobs.
The one-year job growth indicator shows the effect of the decline in home construction, with a loss of more than 3,700 specialty trade contractor jobs from 2006 to 2007; this sector posted the largest decline during that period in the region. However, the retail environment has remained strong, led by electronics wholesaling, which grew by more than 10,000 jobs from 2002 to 2007, including more than 2,900 jobs added from 2006 to 2007 alone.
2007200620052004200320022001
0.0
-2.0
-4.0
-6.0
-8.0
-10.0
Percent change from preceding year
Sources: Moody's Economy.com, Milken Institute
Figure 23. Manufacturing employmentChicago-Naperville-Joliet vs. United States
Chicago-Naperville-JolietUnited States
America’s Ten Largest Cities: Performance


39
Best-Performing Cities 2008
The Best-Performing Small CitiesIn addition to ranking the 200 largest metro areas in the United States, we have also created a companion index of the best-performing small cities.
Although last year’s index ranked 179 of these metro areas, the 2008 report examines only 124 cities. Fifty-five locations were dropped, since the Bureau of Labor Statistics no longer compiles employment data on these metros due to funding cuts.45 Most of the newly dropped locations did not perform well in the 2007 index, so excluding them had little effect on our 2008 rankings of the top cities.
The West dominates this year’s list of small cities exhibiting robust economic growth. Texas, which also posted a strong performance in the index of the largest metros, is well-represented here, with three small metros placing in the top ten. The state is clearly benefiting from high oil prices, an abundance of natural resources, and growth in the broader energy industry. Midland, Texas, took the top spot, while Longview and Odessa are newcomers to the top ten list. (Grand Junction, Colorado, and Bellingham, Washington, also made their debut in the top ten in 2008.) At the other end of the spectrum, many cities in the upper Midwest, particularly those in Michigan and Ohio, did not fare well, placing in the bottom ranks.
Table 6. Top ten best-performing small citiesRank in 2008 index
Metropolitan Statistical Area (MSA)2008rank
2007*rank
31 XT ,dnaldiM62 DI ,enelA'd rueoC13 RO ,dneB24 TU ,egroeG .tS815 OC ,noitcnuJ dnarG016 AG ,sniboR renraW037 XT ,weivgnoL418 AW ,mahgnilleB
79 ZA ,ttocserP7201 XT ,assedO
* Among 179 small citiesSource : Milken Institute
The Best-Performing Small Cities

40
Best-Performing Cities 2008
Midland, Texas, was the best performer among 124 small cities in our 2008 index, improving from last year’s 3rd-place ranking among 179 metros. Overall job and wage growth were solid. In our one-year indicator for job growth, which measures from 2006 to 2007, employment increased by 4.3 percent in this region, outpacing the national average by 3.2 percentage points. Midland’s unemployment rate dropped to 2.7 percent in February 2008, demonstrating that the local economy remains very healthy.46 Oilfield services are highly concentrated in this region. The employment category encompassing support activities for mining—including the drilling of oil and gas wells and oil and gas operations—provides 6,870 jobs (or 10.4 percent of total jobs in Midland); this industry recorded an 11.3 percent average annual increase between 2002 and 2007. Consumer spending has been a source of strength; retail sales have increased by 3.8 percent over 2007 levels.47
2007200620052004200320022001
10.50
10.00
9.50
9.00
8.50
8.00
7.50
7.00
6.50
0.22
0.20
0.18
0.16
0.14
0.12
Percent share of total employment Percent share of total employment
Sources: Moody's Economy.com, Milken Institute
Figure 24. Employment in support activities for miningMidland vs. United States
Midland (L)United States (R)
The Best-Performing Small Cities

41
Best-Performing Cities 2008
Placing 2nd among the 124 smallest cities in 2008 is Coeur d’Alene, Idaho. Despite the housing downturn, overall job and wage growth in this region outperformed the national average. Our five-year indicators, which encompass the period from 2002 to 2007, show that employment and wages in Coeur d’Alene grew 18.8 and 21.8 percent over the national average, respectively.
The area’s fast-growing tourism industry has recently been a major engine of growth, adding 1,800 new jobs in 2007 alone.48 This sector now accounts for 3.1 percent of total jobs in the metro area. Coeur d’Alene has also emerged as a regional health-care hub; hospitals and health-care services accounted for 51.7 percent of job growth from 2006 to 2007.
2007200620052004200320022001
10
8
6
4
2
0
-2
-4
Percent change from preceding year
Sources: Global Insight, Milken Institute
Figure 25. Job growthCoeur d'Alene vs. United States
Coeur d'AleneUnited States
The Best-Performing Small Cities

42
Best-Performing Cities 2008
Bend, Oregon, last year’s top performer, has slipped slightly to 3rd place in the 2008 index. Our five-year job growth indicator, which spans 2002 to 2007, shows that Bend’s overall employment rose 25.3 percent faster than the national average during this period. However, recent unemployment figures indicate a softening local economy, with Bend recording a higher jobless rate than the U.S. average for 2007 (5.0 percent in Bend vs. 4.6 percent for the nation as a whole). Bend’s housing market has been decelerating, with median home prices falling by 10.1 percent (from $319,900 in the first quarter of 2007 to $290,500 in the first quarter of 2008). But a recent report singled out Bend as having the second-most overvalued housing market in the nation (trailing only Atlantic City, New Jersey), and estimated that its home values are still inflated by 49.5 percent.49 This may indicate that further declines are in store.
The indicator for recent job momentum shows the greatest decline in the Bend area occurred in manufacturing; employment in this industry dropped 6.9 percent from March 2007 to March 2008. Weakness was especially apparent in wood manufacturing, which is strongly concentrated in this region. This sector lost 7.9 percent of its jobs from 2006 to 2007, possibly due to a slowdown in new housing construction. But tourism remains a bright spot for job creation. From 2006 to 2007, employment in air transportation grew by 11.8 percent, while the arts, entertainment, and recreation sector saw 11.2 percent job growth.
2007200620052004200320022001
25
20
15
10
5
0
-5
Percent change from preceding year
Sources: Moody's Economy.com, Milken Institute
Figure 26. Arts, entertainment, and recreation employmentBend vs. United States
BendUnited States
The Best-Performing Small Cities

43
Best-Performing Cities 2008The Best-Performing Small Cities
Sliding out of the 2nd-place position it held in the 2007 index, St. George, Utah, now ranks 4th among small metros this year. Its five-year job and wage growth indicators rose 35.4 percent and 47.5 percent higher, respectively, than the national average, outpacing all the other small cities on the index. St. George posted strong GDP growth from high tech in 2007, ranking 7th in the nation (7.7 percentage points above the national average between 2006 and 2007). Specialty trade contractors are a leading industry in this region, accounting for some 6,000 jobs (or 11.2 percent of total employment) in 2007, and driving 16.2 percent of average annual job growth from 2002 to 2007.
2007200620052004200320022001
12.0
11.0
10.0
9.0
8.0
7.0
3.7
3.6
3.5
3.4
3.3
3.2
Percent share of total employment Percent share of total employment
Sources: Moody's Economy.com, Milken Institute
Figure 27. Specialty trade contractor employment St. George vs. United States
St. George (L)United States (R)

44
Best-Performing Cities 2008
Grand Junction, Colorado, moved up the rankings to take the 5th-place spot. After placing 18th out of 179 small cities in 2007, the metro area made a remarkable jump into the top ten small cities in 2008 index. The indicator for one-year overall job growth shows a robust performance, 4.6 percentage points above the national average from 2006 to 2007; in this measure, Grand Junction ranks 2nd among small cities. The city’s unemployment rate has consistently declined since 2003, dipping to 3.2 percent in 2007, well below the national average of 4.6 percent.
Soaring oil prices contributed to economic gains in this region due to its abundance of oil shale and potential for extraction.50 The employment category for mining support activities has consequently become a leading industry here, creating 2,420 jobs for a 37.4 percent average annual increase in growth from 2002 to 2007. The availability of jobs has sparked population growth; Grand Junction experienced a net migration rate of 3.1 percent in 2007.
200720062005200420032002
100
80
60
40
20
0
-20
-40
Percent change from preceding year
Sources: Moody's Economy.com, Milken Institute
Figure 28. Net migration Grand Junction, Colorado
Net migrationPopulation
Improving on its 10th-place showing in the 2007 index, Warner Robins, Georgia, now ranks 6th among the best-performing small cities. Robins Air Force Base is still a dominant force in the local economy, generating $4.2 billion in economic impact in central Georgia each year. Warner Robins Air Logistics Center remains the metro’s top employer, accounting for more than 15,000 jobs.51
Not surprisingly, federal jobs are more highly concentrated in this region than jobs in private industry. This level of government employment has brought economic stability to the metro area, since federal positions typically have greater job security and less frequent turnovers.
The Best-Performing Small Cities
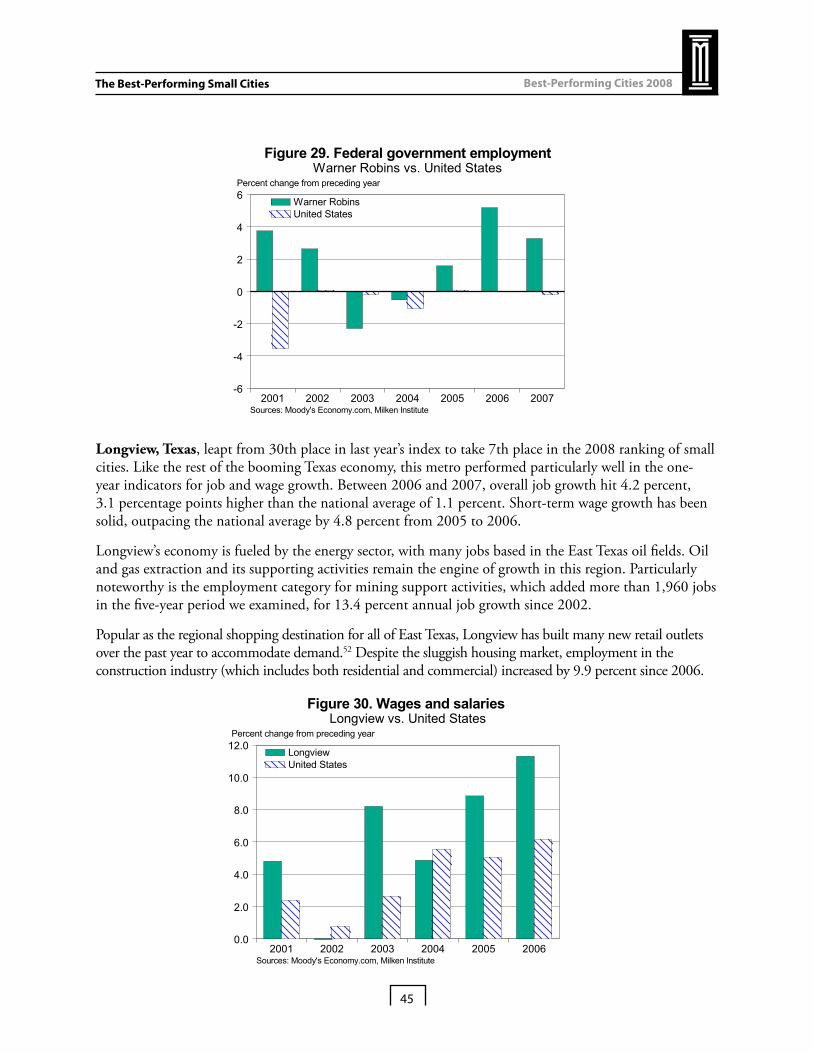
45
Best-Performing Cities 2008
2007200620052004200320022001
6
4
2
0
-2
-4
-6
Percent change from preceding year
Sources: Moody's Economy.com, Milken Institute
Figure 29. Federal government employmentWarner Robins vs. United States
Warner RobinsUnited States
Longview, Texas, leapt from 30th place in last year’s index to take 7th place in the 2008 ranking of small cities. Like the rest of the booming Texas economy, this metro performed particularly well in the one-year indicators for job and wage growth. Between 2006 and 2007, overall job growth hit 4.2 percent, 3.1 percentage points higher than the national average of 1.1 percent. Short-term wage growth has been solid, outpacing the national average by 4.8 percent from 2005 to 2006.
Longview’s economy is fueled by the energy sector, with many jobs based in the East Texas oil fields. Oil and gas extraction and its supporting activities remain the engine of growth in this region. Particularly noteworthy is the employment category for mining support activities, which added more than 1,960 jobs in the five-year period we examined, for 13.4 percent annual job growth since 2002.
Popular as the regional shopping destination for all of East Texas, Longview has built many new retail outlets over the past year to accommodate demand.52 Despite the sluggish housing market, employment in the construction industry (which includes both residential and commercial) increased by 9.9 percent since 2006.
200620052004200320022001
12.0
10.0
8.0
6.0
4.0
2.0
0.0
Percent change from preceding year
Sources: Moody's Economy.com, Milken Institute
Figure 30. Wages and salaries Longview vs. United States
LongviewUnited States
The Best-Performing Small Cities

46
Best-Performing Cities 2008
Another newcomer to the top ten, Bellingham, Washington, places 8th on this year’s list. Job growth maintained a robust pace from 2002 to 2007, the period measured in our five-year indicator, with an average annual growth rate of 3.4 percent. Because of its proximity to Canada, Bellingham benefits from the weak dollar, since Canadian consumers often cross the border to make retail purchases here.53 West Washington University is the top employer in the metro area, accounting for more than 2,200 jobs in 2007 and bringing economic stability to this region.
2007200620052004200320022001
6.0
4.0
2.0
0.0
-2.0
Percent change from preceding year
Sources: Global Insight, Milken Institute
Figure 31. Job growthBellingham vs. United States
BellinghamUnited States
Prescott, Arizona, slipped to 9th place this year from its 7th-place position in the 2007 index. The metro’s clean mountain air and relatively low cost of living has attracted an influx of retirees as well as younger workers. Since 1990, Prescott’s population has almost doubled, increasing by 95.4 percent as of 2007. During the five-year periods examined in our indicators, job and wage growth have remained strong, with Prescott ranking 4th and 3rd, respectively, among small cities in these categories. Despite a weak concentration of high-tech industry, relative high-tech GDP growth increased 12.4 percentage points above the national average between 2006 and 2007, ranking 3rd among small cities.
2007200620052004200320022001
5
4
3
2
1
0
Percent change from preceding year
Sources: Moody's Economy.com, Milken Institute
Figure 32. Population growthPrescott vs. United States
PrescottUnited States
The Best-Performing Small Cities

47
Best-Performing Cities 2008
Odessa, Texas, jumped to 10th in the 2008 index of best-performing small cities, making a substantial improvement from its 27th-place position in 2007. Odessa’s economy has been booming in recent years, posting strong performances in indicators for short-term and long-term overall job and wage growth. Our measurement of short-term job momentum shows that employment in March 2008 had increased by 5.2 percent in a year-over-year comparison to March 2007, the 3rd-best performance in this indicator posted among the 124 small cities we ranked. Odessa’s unemployment rate was 2.9 percent in February 2008, the second-lowest in the state, trailing only Midland, Texas, which came in at 2.7 percent.54
Odessa and Midland are the economic hubs of the Permian Basin region, which extends across West Texas and into southern New Mexico and is rich in natural resources. Not surprisingly, oil and gas extraction and support activities for mining are the leading industries, accounting for some 5,890 jobs (or 9.9 percent of total jobs) in 2007.
2007200620052004200320022001
8
7
6
5
4
3
2
Percent share of labor force
Sources: Bureau of Labor Statistics, Milken Institute
Figure 33. Unemployment rate*Odessa vs. Texas
* Not seasonally adjusted.
OdessaTexas
The Best-Performing Small Cities

48
Complete Results: 2008 Best-Performing Large Cities
2008
rank
2007
rank
Met
ropo
litan
are
aP
opul
atio
n20
07O
vera
llin
dex
2007
Val
ueR
ank
2007
Val
ueR
ank
2006
Val
ueR
ank
2006
Val
ueR
ank
Gro
wth
Ran
k20
07 V
alue
Ran
k20
07 V
alue
Ran
k20
07 V
alue
Ran
k20
07 V
alue
Ran
k(T
hous
ands
)
18
Pro
vo-O
rem
, UT
MS
A11
6.49
510
3.87
310
9.54
3310
5.23
31.
90%
2710
5.80
5510
6.06
91.
3434
763
493
100.
00
210
Ral
eigh
-Car
y, N
C M
SA
113.
0711
104.
282
105.
8657
103.
2916
3.56
%1
101.
9873
100.
1494
1.53
1810
211,
048
125.
40
318
Sal
t Lak
e C
ity, U
T M
SA
107.
3828
102.
808
103.
5180
103.
1219
2.20
%17
109.
7537
107.
194
1.07
529
321,
100
141.
82
420
Aus
tin-R
ound
Roc
k, T
X M
SA
108.
9221
103.
554
100.
1610
510
3.55
152.
89%
410
6.28
5210
1.30
631.
6710
1021
1,59
814
6.74
516
Hun
tsvi
lle, A
L M
SA
107.
5226
102.
1115
109.
6732
101.
5548
2.11
%18
116.
3124
99.4
911
52.
167
932
387
150.
64
62
Wilm
ingt
on, N
C M
SA
115.
908
103.
335
111.
2623
102.
5030
1.39
%43
148.
444
100.
8574
0.75
946
7234
015
2.48
77
McA
llen-
Edi
nbur
g-M
issi
on, T
X M
SA
118.
393
102.
7010
119.
999
102.
4531
2.50
%9
200.
931
102.
6342
0.46
171
314
471
115
8.84
850
Taco
ma,
WA
MD
109.
1119
102.
0316
114.
7816
101.
5647
2.29
%12
137.
668
105.
5614
0.68
109
314
477
316
3.34
937
*O
lym
pia,
WA
MS
A10
9.45
1810
1.67
2510
8.70
3610
1.35
523.
09%
311
2.51
3310
6.10
80.
5315
55
9123
918
3.19
1012
Cha
rlest
on-N
orth
Cha
rlest
on-S
umm
ervi
lle, S
C M
SA
108.
3823
103.
027
111.
2524
100.
7468
1.18
%53
115.
7325
103.
0327
0.69
108
672
630
192.
26
115
Orla
ndo-
Kis
sim
mee
, FL
MS
A11
4.59
910
0.99
4211
6.73
1210
1.13
530.
64%
9111
3.80
3010
3.32
220.
9170
847
2,03
219
2.74
1217
Bak
ersf
ield
, CA
MS
A11
0.25
1710
1.17
3211
3.72
1710
2.93
201.
39%
4411
1.81
3510
3.19
250.
5116
14
121
791
198.
63
1333
Kill
een-
Tem
ple-
For
t Hoo
d, T
X M
SA
103.
2657
101.
1831
121.
808
104.
514
1.90
%26
133.
5510
97.3
816
20.
8478
412
137
020
5.52
1424
Lafa
yette
, LA
MS
A10
4.66
4310
2.36
1210
7.57
4210
8.20
12.
79%
511
4.98
2997
.04
169
0.64
120
314
425
622
0.21
1543
San
Ant
onio
, TX
MS
A10
4.56
4510
1.44
2810
7.99
3710
2.63
252.
28%
1491
.07
143
99.5
311
20.
9269
847
1,99
122
0.76
1632
Hou
ston
-Sug
ar L
and-
Bay
tow
n, T
X M
SA
105.
5236
103.
096
105.
0263
104.
308
3.19
%2
94.5
112
499
.56
111
0.81
844
121
5,62
822
0.93
1777
Sea
ttle-
Bel
levu
e-E
vere
tt, W
A M
D10
2.91
6110
1.88
2296
.74
146
103.
2317
2.04
%19
98.6
391
104.
7617
2.30
48
472,
536
227.
87
1842
Ogd
en-C
lear
field
, UT
MS
A10
7.40
2710
2.03
1610
7.58
4110
2.59
271.
47%
3697
.60
9910
1.06
690.
6810
94
121
518
228.
31
1911
Myr
tle B
each
-Nor
th M
yrtle
Bea
ch-C
onw
ay, S
C M
SA
115.
957
102.
2913
116.
3813
104.
456
1.58
%35
86.8
616
210
0.62
800.
3819
03
144
250
238.
50
2029
Gre
eley
, CO
MS
A10
9.02
2010
1.93
2111
0.10
2910
2.56
292.
45%
1093
.06
134
102.
7040
0.49
166
216
924
423
9.65
2174
Dur
ham
, NC
MS
A10
2.34
7010
1.99
2099
.78
111
102.
3335
2.33
%11
94.7
612
199
.87
103
2.21
511
1448
024
3.58
2261
Nas
hvill
e-D
avid
son-
-Mur
free
sbor
o--F
rank
lin, T
N M
SA
104.
5246
100.
1278
107.
7239
102.
2636
1.42
%39
101.
2279
101.
5858
0.72
102
763
1,52
125
7.02
2359
Dal
las-
Pla
no-I
rvin
g, T
X M
D10
2.54
6710
1.69
2498
.04
130
102.
1839
1.97
%23
97.3
710
210
0.00
991.
5617
129
4,11
226
2.17
2434
Sav
anna
h, G
A M
SA
111.
8615
102.
4211
109.
5234
102.
6924
0.50
%10
095
.41
118
102.
8735
0.68
109
216
932
926
3.68
2558
Des
Moi
nes-
Wes
t Des
Moi
nes,
IA M
SA
103.
9751
101.
1533
106.
8250
100.
6272
1.72
%30
109.
0739
106.
277
0.57
141
314
454
726
5.24
2623
Cha
rlotte
-Gas
toni
a-C
onco
rd, N
C-S
C M
SA
105.
6235
102.
808
106.
8649
102.
7523
1.71
%31
94.1
312
599
.35
119
0.61
130
314
41,
652
267.
12
2719
Boi
se C
ity-N
ampa
, ID
MS
A11
2.31
1410
0.90
4511
0.19
2810
5.83
2-1
.65%
190
137.
757
100.
2390
1.49
203
144
588
270.
70
2838
Por
tland
-Van
couv
er-B
eave
rton
, OR
-WA
MS
A10
4.03
5010
1.00
4199
.31
116
100.
9557
0.84
%74
121.
7316
100.
8276
1.64
138
472,
175
273.
93
2960
For
t Wor
th-A
rling
ton,
TX
MD
104.
0949
102.
0019
102.
0190
102.
7722
2.00
%21
89.0
215
094
.50
192
1.10
506
722,
034
285.
80
301
Oca
la, F
L M
SA
116.
486
99.5
112
512
5.05
510
3.58
14-1
.39%
184
161.
902
100.
9872
0.83
798
4732
528
7.07
3131
Alb
uque
rque
, NM
MS
A10
3.57
5499
.92
8910
4.72
7010
1.13
530.
30%
112
138.
705
100.
2192
2.19
611
1483
528
8.92
324
Pho
enix
-Mes
a-S
cotts
dale
, AZ
MS
A11
3.26
1010
0.17
7511
5.20
1510
4.04
10-0
.25%
155
80.1
417
910
2.85
361.
0158
672
4,17
928
9.06
3354
Pen
saco
la-F
erry
Pas
s-B
rent
, FL
MS
A10
6.82
2999
.65
112
107.
1545
101.
7046
1.27
%50
113.
2932
99.1
212
60.
7399
763
453
292.
10
3452
Gai
nesv
ille,
FL
MS
A10
1.81
7910
0.44
6311
2.00
2210
0.56
761.
84%
2910
7.87
4310
0.50
850.
6113
05
9125
729
3.02
3581
Spo
kane
, WA
MS
A10
5.38
3710
1.15
3310
3.57
7910
1.55
480.
69%
8798
.38
9310
6.57
60.
6611
54
121
456
298.
36
3669
Col
umbi
a, S
C M
SA
103.
0758
101.
0539
103.
8977
100.
9459
1.59
%34
105.
7756
103.
3123
0.54
150
314
471
629
9.59
3712
2E
l Pas
o, T
X M
SA
100.
2296
101.
1036
104.
3775
101.
3751
2.61
%8
113.
5931
99.5
311
20.
6511
74
121
735
301.
56
3876
Mon
tgom
ery,
AL
MS
A10
2.33
7110
0.38
6510
4.46
7210
0.99
561.
45%
3711
1.90
3410
0.19
930.
6611
55
9136
630
8.96
3939
Jack
sonv
ille,
FL
MS
A10
6.67
3110
0.25
7211
3.07
1910
2.59
27-0
.11%
146
96.4
111
210
2.91
310.
6511
75
911,
301
310.
91
4067
Bat
on R
ouge
, LA
MS
A10
4.64
4410
1.61
2610
6.77
5110
4.33
70.
60%
9510
7.04
4699
.50
114
0.47
169
216
977
031
1.56
4137
Was
hing
ton-
Arli
ngto
n-A
lexa
ndria
, DC
-VA
-MD
-WV
MD
105.
0739
99.8
299
106.
9848
99.4
811
70.
96%
6210
4.70
6399
.45
117
1.57
169
324,
151
316.
82
4247
Spr
ingf
ield
, MO
MS
A10
5.87
3210
1.52
2710
3.85
7898
.72
150
1.21
%52
109.
6238
101.
8654
0.65
117
672
420
317.
03
4368
Peo
ria, I
L M
SA
101.
3181
100.
5952
107.
3044
102.
3633
0.92
%68
106.
1553
98.3
914
70.
5514
85
9137
132
8.59
4410
6D
enve
r-A
uror
a, C
O M
SA
100.
2495
100.
9843
94.8
116
510
0.88
621.
60%
3396
.64
111
101.
1967
1.66
1111
142,
465
330.
46
4511
4W
ichi
ta, K
S M
SA
98.0
013
610
1.75
2397
.61
136
103.
7811
1.11
%57
66.6
019
910
5.64
121.
6512
672
596
337.
54
4611
7A
shev
ille,
NC
MS
A10
3.90
5210
2.25
1410
0.48
100
100.
7864
2.24
%15
98.2
794
95.8
118
20.
4816
75
9140
433
7.98
4766
Fre
sno,
CA
MS
A10
2.78
6599
.99
8610
7.06
4610
0.53
770.
70%
8511
8.11
2210
3.56
210.
4617
15
9189
933
8.18
4875
For
t Col
lins-
Love
land
, CO
MS
A10
2.80
6410
1.29
2998
.44
126
99.3
012
42.
78%
692
.60
135
98.5
314
31.
4227
1021
288
338.
46
4989
Am
arill
o, T
X M
SA
102.
5966
99.9
091
105.
0263
100.
9557
1.64
%32
104.
6365
102.
9033
0.54
150
216
924
234
1.89
5010
8O
klah
oma
City
, OK
MS
A99
.76
107
100.
0480
105.
3959
103.
2317
0.46
%10
310
1.45
7610
3.01
280.
6212
76
721,
193
342.
16
5146
Cla
rksv
ille,
TN
-KY
MS
A10
5.16
3810
0.36
6712
4.32
610
2.21
380.
27%
115
100.
3982
98.2
115
10.
5415
03
144
262
348.
26
5280
Fay
ette
ville
, NC
MS
A10
4.79
4110
0.58
5311
7.71
1199
.88
990.
79%
7998
.86
8810
0.61
810.
4417
73
144
349
348.
68
533
Riv
ersi
de-S
an B
erna
rdin
o-O
ntar
io, C
A M
SA
112.
9412
99.0
316
112
2.48
710
1.92
42-1
.60%
189
128.
1314
104.
9316
0.63
124
591
4,08
135
2.89
5473
Littl
e R
ock-
Nor
th L
ittle
Roc
k-C
onw
ay, A
R M
SA
102.
1174
100.
3865
101.
1594
99.9
098
0.94
%65
109.
0040
98.9
613
21.
1346
763
666
354.
80
5515
Tuc
son,
AZ
MS
A10
5.84
3399
.81
100
110.
3027
102.
0941
-1.9
7%19
479
.31
182
102.
3946
1.13
4611
1496
735
6.44
5653
Lubb
ock,
TX
MS
A98
.89
125
99.6
711
110
1.70
9310
0.85
630.
92%
6712
1.40
1710
2.94
291.
3531
591
267
359.
36
5721
Fay
ette
ville
-Spr
ingd
ale-
Rog
ers,
AR
-MO
MS
A11
1.24
1610
0.02
8311
9.62
1010
0.78
640.
11%
127
136.
759
98.2
315
00.
5116
12
169
436
359.
61
5825
Sac
ram
ento
--A
rden
-Arc
ade-
-Ros
evill
e, C
A M
SA
102.
8862
99.4
413
110
7.00
4710
0.15
910.
04%
137
106.
5450
103.
1426
1.02
578
472,
091
369.
27
5986
Atla
nta-
San
dy S
prin
gs-M
arie
tta, G
A M
SA
103.
0659
101.
1435
97.7
713
499
.76
103
1.07
%58
91.1
314
299
.45
117
1.11
498
475,
279
374.
50
6079
Kno
xvill
e, T
N M
SA
102.
0176
100.
3171
105.
1962
100.
4580
0.80
%77
98.7
989
96.4
217
50.
7399
847
682
377.
35
6135
For
t Lau
derd
ale-
Pom
pano
Bea
ch-D
eerf
ield
Bea
ch, F
L M
D10
7.56
2599
.38
140
112.
4321
100.
4978
-0.9
0%17
410
0.90
8010
1.46
600.
8282
847
1,76
037
8.67
6255
Tre
nton
-Ew
ing,
NJ
MS
A10
0.89
8699
.07
160
103.
1182
100.
8961
0.93
%66
105.
3059
99.7
810
61.
2240
932
365
379.
41
6364
Anc
hora
ge, A
K M
SA
102.
5467
99.7
210
610
7.79
3899
.53
113
0.71
%84
101.
2877
101.
0170
0.75
945
9136
237
9.52
6445
Vis
alia
-Por
terv
ille,
CA
MS
A10
4.83
4099
.63
115
110.
0330
103.
6112
-0.3
5%16
110
8.05
4110
2.03
500.
2619
93
144
422
379.
95
6572
San
Die
go-C
arls
bad-
San
Mar
cos,
CA
MS
A10
0.70
8799
.42
134
105.
5058
99.6
010
8-0
.08%
144
106.
0054
103.
3123
1.58
1515
32,
975
383.
05
6657
Sal
em, O
R M
SA
103.
8053
100.
7747
105.
2361
100.
9060
0.07
%13
698
.22
9510
2.34
470.
5614
62
169
387
386.
85
6713
1S
hrev
epor
t-B
ossi
er C
ity, L
A M
SA
101.
0284
99.8
110
010
3.40
8110
0.31
872.
28%
1311
5.14
2792
.23
196
0.61
130
591
388
387.
88
6812
1G
reen
ville
-Mau
ldin
-Eas
ley,
SC
MS
A10
1.41
8010
2.03
1695
.72
155
99.5
910
92.
61%
788
.50
156
99.0
213
10.
8282
672
614
388.
21
6910
3F
ort S
mith
, AR
-OK
MS
A10
2.50
6910
0.47
5810
1.89
9110
0.62
720.
77%
8010
2.53
7010
5.77
100.
3019
72
169
290
391.
85
7085
Bea
umon
t-P
ort A
rthu
r, T
X M
SA
98.6
313
110
1.08
3810
2.45
8810
4.07
9-0
.56%
167
129.
8413
102.
8337
0.72
102
216
937
639
2.47
7111
0Ly
nchb
urg,
VA
MS
A10
1.85
7810
0.03
8197
.56
137
100.
3385
2.04
%20
94.1
112
610
2.46
440.
5614
66
7224
439
3.31
7298
Tul
sa, O
K M
SA
100.
1510
010
0.45
6098
.30
127
104.
475
-0.0
7%14
296
.97
105
104.
2218
0.68
109
591
906
393.
79
7363
Mer
ced,
CA
MS
A10
0.67
8910
0.33
6811
0.96
2599
.94
961.
12%
5692
.25
138
105.
2715
0.34
196
118
824
639
7.93
7497
San
Fra
ncis
co-S
an M
ateo
-Red
woo
d C
ity, C
A M
D94
.69
176
101.
2130
86.0
219
710
0.44
812.
22%
1693
.99
128
102.
9131
1.45
2310
211,
720
398.
04
759
Las
Veg
as-P
arad
ise,
NV
MS
A12
0.11
199
.91
9012
6.98
410
2.22
37-0
.28%
159
100.
1083
96.0
018
10.
3819
01
188
1,83
640
3.98
7651
Eug
ene-
Spr
ingf
ield
, OR
MS
A10
3.34
5610
0.32
6910
2.55
8699
.40
120
-0.1
9%15
111
7.49
2399
.61
110
0.98
606
7234
440
6.51
7711
6K
ansa
s C
ity, M
O-K
S M
SA
99.8
510
510
0.94
4497
.07
140
99.5
511
10.
76%
8195
.84
116
101.
5459
1.35
317
631,
985
407.
16
7841
Por
t St.
Luci
e, F
L M
SA
117.
594
99.3
714
112
8.33
210
1.76
43-1
.24%
180
104.
1168
100.
3089
0.46
171
216
940
040
8.62
7982
San
Lui
s O
bisp
o-P
aso
Rob
les,
CA
MS
A10
0.69
8810
0.16
7610
5.98
5610
0.38
820.
67%
8898
.42
9298
.49
145
0.61
130
591
262
409.
04
8044
Tam
pa-S
t. P
eter
sbur
g-C
lear
wat
er, F
L M
SA
104.
7442
98.5
917
610
5.38
6010
1.09
55-1
.08%
176
104.
4366
101.
3761
0.96
649
322,
724
410.
58
8112
0In
dian
apol
is-C
arm
el, I
N M
SA
101.
2383
100.
4560
97.9
613
299
.25
128
0.75
%82
101.
7174
99.9
110
21.
3531
672
1,69
541
3.10
8210
4O
mah
a-C
ounc
il B
luffs
, NE
-IA
MS
A99
.38
113
100.
0381
102.
3989
100.
5975
1.36
%47
99.7
884
98.9
413
30.
7110
54
121
830
414.
05
836
Nap
les-
Mar
co Is
land
, FL
MS
A11
2.47
1396
.39
198
127.
713
100.
6570
-5.4
7%19
812
7.57
1510
3.64
200.
4218
16
7231
641
4.08
8410
7S
an J
ose-
Sun
nyva
le-S
anta
Cla
ra, C
A M
SA
93.7
718
710
0.77
4784
.44
198
102.
6325
0.79
%78
92.5
813
610
2.63
423.
051
153
1,80
441
4.32
8514
8N
ew Y
ork-
Whi
te P
lain
s-W
ayne
, NY
-NJ
MD
98.4
013
410
0.66
4997
.88
133
102.
1839
1.00
%61
90.3
014
610
2.11
480.
7010
74
121
11,6
0841
4.43
8691
Ced
ar R
apid
s, IA
MS
A99
.26
118
100.
6250
96.1
515
298
.83
144
0.87
%71
105.
4758
108.
702
0.95
677
6325
341
6.95
8794
Bal
timor
e-To
wso
n, M
D M
SA
99.8
310
699
.81
100
104.
9765
99.2
512
80.
85%
7310
2.03
7298
.68
141
0.98
608
472,
668
417.
98
8865
Cor
pus
Chr
isti,
TX
MS
A10
0.56
9110
0.32
6910
4.81
6810
2.80
210.
63%
9210
5.55
5794
.75
191
0.52
157
118
841
442
0.99
8910
5V
irgin
ia B
each
-Nor
folk
-New
port
New
s, V
A-N
C M
SA
99.9
810
399
.86
9510
6.65
5299
.91
970.
89%
6996
.69
109
97.6
815
60.
7791
591
1,65
942
2.65
9095
Mad
ison
, WI M
SA
100.
2198
99.2
914
510
4.78
6999
.08
138
0.52
%98
119.
3019
100.
4487
1.04
559
3255
642
6.55
9188
Mob
ile, A
L M
SA
98.8
912
510
0.81
4610
3.09
8310
3.59
13-0
.07%
143
104.
4067
98.2
414
90.
5813
84
121
404
427.
89
9230
Del
tona
-Day
tona
Bea
ch-O
rmon
d B
each
, FL
MS
A10
6.73
3097
.93
186
115.
8114
100.
7269
-1.8
1%19
310
6.86
4710
1.98
530.
6412
05
9150
042
8.27
9313
5B
ridge
port
-Sta
mfo
rd-N
orw
alk,
CT
MS
A96
.93
149
100.
4560
96.7
914
410
0.65
701.
41%
4085
.83
164
100.
4886
0.97
627
6389
543
0.11
9440
Hon
olul
u, H
I MS
A10
4.27
4899
.49
128
110.
0031
100.
0194
0.64
%90
104.
6464
98.7
713
70.
5215
72
169
906
432.
40
9593
Bou
lder
, CO
MS
A97
.97
140
101.
0937
88.8
819
199
.27
126
1.15
%55
97.2
510
399
.76
107
2.86
215
329
043
4.45
9613
9N
assa
u-S
uffo
lk, N
Y M
D98
.45
132
100.
1278
99.6
011
299
.55
111
0.82
%75
92.2
413
910
2.00
510.
9762
847
2,76
043
4.92
9778
Bra
dent
on-S
aras
ota-
Ven
ice,
FL
MS
A10
2.33
7197
.55
192
113.
4418
101.
7544
-4.0
0%19
713
2.07
1210
2.77
380.
6113
05
9168
743
4.98
9828
Lake
land
-Win
ter
Hav
en, F
L M
SA
108.
7122
98.8
816
511
0.67
2610
0.78
64-1
.34%
182
106.
2951
103.
9419
0.39
188
314
457
543
6.34
9912
8W
inst
on-S
alem
, NC
MS
A99
.91
104
100.
5554
95.3
615
898
.75
148
1.38
%45
119.
9218
102.
9230
0.45
176
591
463
440.
85
100
70S
anta
Bar
bara
-San
ta M
aria
-Gol
eta,
CA
MS
A99
.42
112
99.5
711
810
2.82
8497
.18
185
0.23
%11
711
8.38
2110
2.43
451.
4424
1114
404
442.
33
5-yr
job
grow
th20
02–2
007
1-yr
job
grow
th20
06–2
007
5-yr
wag
es/s
alar
ies
grow
th 2
001–
2006
1-yr
wag
es/s
alar
ies
grow
th 2
005–
2006
# of
HT
GD
P
LQs
over
1Jo
b gr
owth
(3/0
7–3/
08)
5-yr
rel
ativ
e H
T G
DP
gr
owth
200
2–20
071-
yr r
elat
ive
HT
GD
P
grow
th 2
006–
2007
Hig
h-Te
ch
GD
P L
Q
Best-Performing Cities 2008

49
2008
rank
2007
rank
Met
ropo
litan
are
aP
opul
atio
n20
07O
vera
llin
dex
2007
Val
ueR
ank
2007
Val
ueR
ank
2006
Val
ueR
ank
2006
Val
ueR
ank
Gro
wth
Ran
k20
07 V
alue
Ran
k20
07 V
alue
Ran
k20
07 V
alue
Ran
k20
07 V
alue
Ran
k(T
hous
ands
)
5-yr
job
grow
th20
02–2
007
1-yr
job
grow
th20
06–2
007
5-yr
wag
es/s
alar
ies
grow
th 2
001–
2006
1-yr
wag
es/s
alar
ies
grow
th 2
005–
2006
# of
HT
GD
P
LQs
over
1Jo
b gr
owth
(3/0
7–3/
08)
5-yr
rel
ativ
e H
T G
DP
gr
owth
200
2–20
071-
yr r
elat
ive
HT
GD
P
grow
th 2
006–
2007
Hig
h-Te
ch
GD
P L
Q
101
134
San
ta C
ruz-
Wat
sonv
ille,
CA
MS
A96
.76
152
100.
6051
89.8
319
010
2.34
341.
96%
2477
.61
187
96.4
217
50.
9959
932
252
447.
81
102
56R
ichm
ond,
VA
MS
A10
2.23
7310
0.18
7410
2.81
8598
.76
146
0.52
%99
98.0
896
98.7
113
90.
7594
672
1,21
344
7.93
103
113
Sto
ckto
n, C
A M
SA
103.
3955
100.
2073
104.
9666
99.3
512
11.
37%
4696
.77
107
97.3
316
50.
3719
42
169
671
448.
05
104
48P
alm
Bay
-Mel
bour
ne-T
itusv
ille,
FL
MS
A10
4.47
4797
.17
195
112.
8720
99.6
410
7-0
.56%
168
99.3
385
96.7
317
11.
4424
161
536
448.
21
105
36W
est P
alm
Bea
ch-B
oca
Rat
on-B
oynt
on B
each
, FL
MD
105.
6634
98.6
917
310
8.77
3510
0.17
89-1
.09%
177
98.0
497
105.
7311
0.64
120
412
11,
266
451.
37
106
49S
anta
Ana
-Ana
heim
-Irv
ine,
CA
MD
102.
1174
98.5
217
810
7.64
4099
.74
104
-1.3
9%18
510
1.28
7710
0.35
881.
3235
153
2,99
745
1.70
107
126
Man
ches
ter-
Nas
hua,
NH
MS
A99
.30
115
99.4
413
199
.40
114
98.2
816
41.
44%
3897
.66
9899
.82
105
1.42
278
4740
246
3.46
108
143
Lake
Cou
nty-
Ken
osha
Cou
nty,
IL-W
I MD
99.2
911
699
.57
118
100.
1110
610
0.78
640.
65%
8989
.79
147
97.5
416
01.
3036
591
873
469.
39
109
62C
amde
n, N
J M
D10
0.18
9998
.81
169
104.
2576
98.8
614
30.
94%
6498
.87
8799
.17
124
0.85
769
321,
246
469.
99
110
111
Cha
ttano
oga,
TN
-GA
MS
A99
.63
110
99.7
710
598
.72
124
99.8
110
20.
08%
132
138.
356
114.
091
0.54
150
412
151
547
1.08
111
96C
olor
ado
Spr
ings
, CO
MS
A99
.72
108
99.8
398
99.3
011
798
.58
154
1.40
%42
75.1
219
297
.12
167
1.74
99
3260
947
5.43
112
71H
ager
stow
n-M
artin
sbur
g, M
D-W
V M
SA
100.
0110
298
.48
181
104.
4473
99.8
510
1-0
.07%
141
133.
3711
108.
663
0.58
138
591
261
476.
13
113
100
Roc
king
ham
Cou
nty-
Str
affo
rd C
ount
y, N
H M
D10
0.34
9499
.53
123
100.
3210
210
0.38
82-0
.82%
172
97.4
810
099
.46
116
0.96
6410
2141
847
8.64
114
133
Edi
son-
New
Bru
nsw
ick,
NJ
MD
98.9
512
499
.89
9296
.32
150
100.
1690
0.22
%12
087
.47
160
99.2
512
21.
5219
129
2,32
048
3.59
115
90Ta
llaha
ssee
, FL
MS
A10
2.99
6099
.88
9410
0.86
9899
.30
124
0.36
%10
995
.14
119
97.6
615
70.
7210
24
121
352
485.
47
116
84Y
ork-
Han
over
, PA
MS
A10
2.81
6310
0.47
5810
0.88
9795
.73
195
0.88
%70
94.6
412
399
.27
121
0.57
141
412
142
148
6.45
117
112
Mia
mi-M
iam
i Bea
ch-K
enda
ll, F
L M
D10
1.29
8299
.97
8710
4.48
7110
0.61
74-0
.06%
140
91.9
514
099
.74
108
0.55
148
216
92,
387
486.
64
118
153
Bos
ton-
Qui
ncy,
MA
MD
96.1
316
310
0.49
5694
.97
164
100.
4679
1.22
%51
87.5
715
910
0.58
830.
8085
412
11,
858
487.
25
119
92B
row
nsvi
lle-H
arlin
gen,
TX
Met
ropo
litan
Sta
tistic
al A
rea
101.
8777
100.
5455
104.
9267
101.
4950
0.42
%10
679
.28
183
94.9
118
90.
2520
00
199
387
488.
82
120
13C
ape
Cor
al-F
ort M
yers
, FL
MS
A11
9.31
297
.60
188
134.
691
102.
4531
-5.7
2%20
088
.69
154
95.0
518
80.
4118
34
121
591
492.
09
121
163
Aug
usta
-Ric
hmon
d C
ount
y, G
A-S
C M
SA
99.1
312
110
0.02
8399
.00
120
97.0
318
60.
96%
6310
7.30
4599
.86
104
0.58
138
672
529
497.
72
122
129
Lexi
ngto
n-F
ayet
te, K
Y M
SA
100.
2296
100.
4364
99.3
811
599
.23
131
0.45
%10
580
.40
178
100.
2291
0.67
113
412
144
750
4.01
123
83B
ethe
sda-
Fre
deric
k-G
aith
ersb
urg,
MD
MD
98.7
412
998
.98
163
106.
0955
99.5
011
5-0
.25%
153
96.3
311
499
.17
124
1.43
269
321,
156
504.
82
124
99H
arris
burg
-Car
lisle
, PA
MS
A97
.20
147
99.4
013
898
.98
121
97.5
217
70.
86%
7211
8.41
2010
0.67
780.
7791
932
529
506.
65
125
147
Bin
gham
ton,
NY
MS
A93
.98
181
99.8
695
88.5
719
399
.98
950.
18%
123
101.
6575
100.
8973
1.64
1312
924
651
1.08
126
109
Los
Ang
eles
-Lon
g B
each
-Gle
ndal
e, C
A M
D96
.85
150
99.5
012
798
.73
123
100.
1392
-0.2
6%15
694
.82
120
100.
6778
1.37
3010
219,
879
511.
23
127
174
Syr
acus
e, N
Y M
SA
95.8
616
799
.65
112
94.7
816
697
.90
170
1.01
%60
97.0
910
410
1.77
571.
1050
1114
645
521.
22
128
130
Kin
gspo
rt-B
risto
l-Bris
tol,
TN
-VA
MS
A95
.79
168
98.3
318
396
.75
145
100.
1888
0.31
%11
111
5.14
2710
0.81
770.
8674
1021
304
525.
92
129
102
Alle
ntow
n-B
ethl
ehem
-Eas
ton,
PA
-NJ
MS
A10
0.41
9399
.52
124
101.
1395
99.6
610
60.
07%
134
81.6
217
597
.62
159
0.73
997
6380
452
8.87
130
142
Phi
lade
lphi
a, P
A M
D96
.38
161
99.5
412
299
.60
112
99.6
810
50.
45%
104
79.7
318
199
.24
123
1.14
448
473,
888
530.
10
131
169
Loui
svill
e-Je
ffers
on C
ount
y, K
Y-I
N M
SA
99.3
411
410
0.49
5697
.74
135
99.3
112
31.
85%
2888
.32
157
94.8
019
00.
4816
71
188
1,23
453
3.03
132
156
Sal
inas
, CA
MS
A93
.89
184
99.2
715
010
1.11
9698
.76
146
1.40
%41
105.
0761
106.
675
0.41
183
314
440
853
8.06
133
26R
eno-
Spa
rks,
NV
MS
A10
7.95
2499
.29
145
106.
6153
100.
1392
-0.6
1%17
190
.53
145
93.4
619
40.
4417
73
144
410
538.
43
134
164
Utic
a-R
ome,
NY
MS
A95
.15
172
99.5
512
195
.34
160
99.1
513
60.
22%
119
110.
4736
99.1
012
81.
0654
153
295
541.
77
135
154
Col
umbu
s, O
H M
SA
97.8
214
210
0.14
7796
.70
147
98.3
016
11.
05%
5992
.41
137
98.2
115
10.
7889
591
1,75
454
2.19
136
176
Pitt
sbur
gh, P
A M
SA
95.1
317
399
.62
116
94.6
216
899
.26
127
0.73
%83
93.7
413
110
0.14
940.
8773
932
2,35
655
0.46
137
151
Min
neap
olis
-St.
Pau
l-Blo
omin
gton
, MN
-WI M
SA
98.9
612
399
.51
125
96.4
914
998
.30
161
0.82
%76
95.8
511
597
.37
163
0.95
677
633,
208
554.
25
138
166
Alb
any-
Sch
enec
tady
-Tro
y, N
Y M
SA
96.5
215
899
.20
154
95.3
615
898
.75
148
0.11
%12
698
.68
9010
2.88
341.
1248
1021
853
556.
41
139
171
Cam
brid
ge-N
ewto
n-F
ram
ingh
am, M
A M
D92
.77
190
99.3
114
489
.91
189
99.5
011
50.
37%
108
94.7
412
210
1.20
662.
803
161
1,47
355
7.40
140
27O
xnar
d-T
hous
and
Oak
s-V
entu
ra, C
A M
SA
99.4
411
198
.28
184
107.
5143
97.8
717
1-1
.75%
191
95.5
811
798
.72
138
1.47
2212
979
855
7.85
141
136
Gre
ensb
oro-
Hig
h P
oint
, NC
MS
A98
.45
132
99.8
497
94.7
316
799
.19
134
1.17
%54
88.0
715
897
.22
166
0.63
124
672
698
557.
97
142
173
Eva
nsvi
lle, I
N-K
Y M
SA
93.7
818
698
.69
173
98.2
912
898
.42
158
0.63
%94
106.
6248
102.
6541
1.14
445
9135
056
3.29
143
118
San
ta R
osa-
Pet
alum
a, C
A M
SA
96.6
815
599
.57
118
93.1
217
598
.96
140
0.10
%12
883
.13
171
102.
7639
1.16
4210
2146
456
4.17
144
141
Mem
phis
, TN
-MS
-AR
MS
A99
.28
117
99.7
210
699
.83
110
99.5
910
90.
23%
118
93.9
712
999
.69
109
0.42
181
216
91,
281
564.
44
145
22V
alle
jo-F
airf
ield
, CA
MS
A10
0.08
101
97.5
918
910
6.13
5499
.17
135
-1.2
3%17
910
7.95
4297
.85
154
0.63
124
672
409
564.
89
146
149
Linc
oln,
NE
MS
A99
.01
122
100.
0185
99.1
311
998
.15
168
1.99
%22
71.5
619
483
.36
200
0.57
141
314
429
256
5.22
147
119
Oak
land
-Fre
mon
t-H
ayw
ard,
CA
MD
95.4
317
199
.10
158
97.3
513
899
.42
119
-0.8
9%17
396
.85
106
101.
2264
1.49
2015
32,
484
566.
35
148
144
Dav
enpo
rt-M
olin
e-R
ock
Isla
nd, I
A-I
L M
SA
97.9
813
999
.37
141
99.8
410
999
.23
131
0.18
%12
210
5.18
6010
0.02
980.
5215
74
121
376
568.
76
149
160
Har
tford
-Wes
t Har
tford
-Eas
t Har
tford
, CT
MS
A96
.13
163
99.4
113
797
.31
139
98.4
715
61.
28%
4988
.99
152
99.3
012
00.
8674
591
1,18
957
0.42
150
101
Birm
ingh
am-H
oove
r, A
L M
SA
99.2
012
099
.80
104
101.
7292
99.1
313
7-0
.14%
147
83.6
016
996
.34
177
0.75
945
911,
108
572.
19
151
186
New
Orle
ans-
Met
airie
-Ken
ner,
LA M
SA
80.4
020
010
6.20
188
.66
192
93.7
019
81.
91%
2581
.74
174
105.
5913
0.46
171
314
41,
030
573.
25
152
125
St.
Loui
s, M
O-I
L M
SA
96.4
516
099
.42
134
95.9
015
498
.26
166
-0.4
2%16
210
7.70
4410
1.78
551.
0752
932
2,82
857
4.32
153
123
Hun
tingt
on-A
shla
nd, W
V-K
Y-O
H M
SA
100.
9485
99.9
388
98.0
912
998
.67
151
0.70
%86
88.6
915
497
.34
164
0.38
190
216
928
457
9.80
154
137
Jack
son,
MS
MS
A10
0.52
9299
.13
156
102.
4987
100.
3484
0.48
%10
271
.13
195
95.2
618
50.
5415
01
188
534
581.
36
155
132
Roc
kfor
d, IL
MS
A97
.99
138
101.
0240
93.9
217
210
0.32
86-0
.53%
165
94.0
212
798
.27
148
0.51
161
412
135
258
1.40
156
146
Wor
cest
er, M
A M
SA
96.7
415
399
.69
108
94.2
517
198
.77
145
-0.2
2%15
290
.82
144
99.9
210
11.
2041
1114
781
581.
67
157
162
Milw
auke
e-W
auke
sha-
Wes
t Alli
s, W
I MS
A96
.72
154
99.6
811
095
.63
156
99.4
811
70.
08%
131
104.
7762
97.6
315
80.
7987
412
11,
544
583.
36
158
157
Por
tland
-Sou
th P
ortla
nd-B
idde
ford
, ME
MS
A97
.92
141
99.5
811
710
0.41
101
98.2
216
70.
49%
101
93.6
913
296
.03
180
0.62
127
672
513
583.
50
159
87P
ough
keep
sie-
New
burg
h-M
iddl
etow
n, N
Y M
SA
98.7
013
098
.71
171
100.
1710
497
.81
174
0.10
%12
985
.64
166
101.
2165
0.89
718
4767
058
3.87
160
152
Chi
cago
-Nap
ervi
lle-J
olie
t, IL
MD
96.6
015
699
.69
108
94.4
617
099
.52
114
0.31
%11
089
.25
148
99.0
412
90.
7987
591
7,95
358
5.61
161
158
Scr
anto
n--W
ilkes
-Bar
re, P
A M
SA
97.4
914
599
.26
151
94.5
416
996
.97
190
0.39
%10
710
6.60
4910
0.59
820.
7889
932
549
587.
74
162
115
Mod
esto
, CA
MS
A10
0.61
9098
.99
162
104.
4473
97.5
517
6-0
.56%
166
154.
573
98.5
914
20.
5116
13
144
511
589.
93
163
168
New
ark-
Uni
on, N
J-P
A M
D95
.73
169
99.2
515
296
.60
148
99.2
413
0-0
.05%
138
84.2
316
899
.98
100
1.23
3910
212,
129
596.
18
164
159
Rea
ding
, PA
MS
A98
.76
128
99.4
812
997
.05
141
101.
7245
-0.5
7%16
985
.42
167
98.2
115
10.
5714
13
144
402
603.
82
165
178
Gre
en B
ay, W
I MS
A99
.25
119
99.4
213
499
.23
118
97.9
416
90.
09%
130
102.
1171
102.
0051
0.40
185
118
830
160
6.72
166
127
Col
umbu
s, G
A-A
L M
SA
96.1
316
398
.40
182
99.8
710
899
.05
139
-0.1
5%14
996
.39
113
96.6
817
31.
2837
932
283
607.
71
167
175
Dul
uth,
MN
-WI M
SA
97.3
814
699
.89
9295
.24
161
98.3
016
11.
30%
4899
.29
8694
.48
193
0.47
169
019
927
461
5.65
168
138
Roa
noke
, VA
MS
A95
.10
175
99.4
013
898
.03
131
99.3
212
20.
28%
114
91.5
114
198
.90
135
0.74
983
144
297
620.
91
169
165
For
t Way
ne, I
N M
SA
97.6
814
399
.20
154
91.1
418
698
.35
159
-2.0
9%19
511
5.40
2610
1.09
680.
8379
591
410
641.
38
170
150
Pro
vide
nce-
New
Bed
ford
-Fal
l Riv
er, R
I-M
A M
SA
96.8
415
198
.84
166
100.
2110
398
.62
152
-1.5
9%18
896
.77
107
98.6
914
00.
8085
591
1,60
164
2.67
171
170
Pea
body
, MA
MD
94.2
518
099
.11
157
92.7
217
898
.92
141
-0.9
4%17
583
.27
170
100.
1196
1.88
812
973
364
3.65
172
155
Akr
on, O
H M
SA
99.6
710
998
.98
163
98.8
212
297
.01
187
-0.1
8%15
097
.48
100
101.
0170
0.53
155
216
969
964
6.81
173
167
Cin
cinn
ati-M
iddl
etow
n, O
H-K
Y-I
N M
SA
98.1
313
599
.64
114
97.0
114
297
.20
184
0.13
%12
596
.67
110
97.7
615
50.
7110
51
188
2,13
464
7.32
174
180
Gar
y, IN
MD
97.6
214
499
.81
100
95.9
115
397
.76
175
0.08
%13
310
2.72
6999
.11
127
0.40
185
216
969
964
8.00
175
161
Lanc
aste
r, P
A M
SA
98.7
912
799
.47
130
98.6
812
597
.36
180
0.59
%97
61.7
120
099
.04
129
0.46
171
314
449
864
8.45
176
145
Nor
wic
h-N
ew L
ondo
n, C
T M
SA
96.5
315
799
.24
153
96.8
414
397
.33
181
-0.0
5%13
987
.23
161
98.8
213
61.
3929
591
267
649.
31
177
140
Cha
rlest
on, W
V M
SA
96.1
216
699
.29
145
96.2
215
199
.22
133
0.26
%11
682
.74
172
96.7
317
10.
5913
65
9130
465
8.56
178
124
Wilm
ingt
on, D
E-M
D-N
J M
D98
.00
136
99.4
313
310
0.86
9898
.47
156
-0.1
5%14
879
.24
184
95.1
018
70.
5913
63
144
694
658.
70
179
181
Erie
, PA
MS
A96
.27
162
99.2
914
592
.97
177
97.8
217
30.
30%
113
86.4
916
398
.51
144
0.67
113
672
279
671.
99
180
183
Buf
falo
-Nia
gara
Fal
ls, N
Y M
SA
94.6
317
899
.10
158
93.8
517
398
.27
165
0.22
%12
189
.24
149
98.9
313
40.
8576
591
1,12
867
4.74
181
182
Roc
hest
er, N
Y M
SA
95.1
217
499
.33
143
91.3
018
597
.27
183
0.14
%12
477
.24
188
96.4
817
41.
1642
847
1,03
068
4.34
182
177
Spr
ingf
ield
, MA
MS
A94
.61
179
98.8
416
695
.01
162
97.4
917
8-0
.43%
163
100.
5881
102.
0849
0.60
135
412
168
368
8.80
183
187
Spa
rtan
burg
, SC
MS
A96
.48
159
98.6
117
595
.37
157
99.8
899
0.63
%93
69.5
019
689
.05
199
0.35
195
216
927
670
2.18
184
172
New
Hav
en-M
ilfor
d, C
T M
SA
95.4
917
098
.76
170
94.9
916
397
.85
172
-1.3
6%18
379
.93
180
96.9
417
01.
2438
847
845
711.
54
185
188
Kal
amaz
oo-P
orta
ge, M
I MS
A93
.95
182
99.2
814
991
.91
181
96.9
319
1-0
.25%
154
67.2
319
898
.49
145
0.88
724
121
323
744.
10
186
185
Sou
th B
end-
Mis
haw
aka,
IN-M
I MS
A93
.91
183
98.5
517
793
.75
174
96.6
519
20.
60%
9681
.89
173
95.6
218
40.
6412
03
144
317
748.
87
187
179
Atla
ntic
City
, NJ
MS
A97
.06
148
96.3
919
810
0.03
107
98.4
815
5-0
.28%
158
68.0
619
791
.86
197
0.38
190
216
927
175
5.19
188
191
You
ngst
own-
War
ren-
Boa
rdm
an, O
H-P
A M
SA
92.2
719
197
.53
193
91.9
418
098
.34
160
-0.2
7%15
789
.02
150
101.
3462
0.44
177
314
457
175
9.02
189
190
Day
ton,
OH
MS
A90
.85
194
97.7
518
790
.84
187
96.9
818
9-1
.28%
181
85.7
516
597
.07
168
0.83
7910
2183
676
3.89
190
192
Gra
nd R
apid
s-W
yom
ing,
MI M
SA
93.8
718
598
.83
168
91.9
617
997
.00
188
-0.0
9%14
581
.58
176
100.
1196
0.52
157
118
877
777
6.05
191
199
Hic
kory
-Len
oir-
Mor
gant
on, N
C M
SA
91.0
919
398
.52
178
86.9
119
598
.61
153
0.07
%13
593
.90
130
90.3
819
80.
3918
83
144
360
782.
90
192
184
Ann
Arb
or, M
I MS
A91
.45
192
97.5
918
993
.05
176
95.9
219
4-1
.77%
192
75.5
219
196
.13
179
1.03
566
7235
078
8.58
193
193
Cle
vela
nd-E
lyria
-Men
tor,
OH
MS
A93
.72
188
98.5
217
891
.32
184
97.4
817
9-0
.61%
170
93.4
713
397
.48
161
0.57
141
216
92,
096
794.
30
194
196
Tole
do, O
H M
SA
92.9
518
997
.59
189
91.7
118
297
.33
181
-1.2
1%17
888
.83
153
101.
7855
0.40
185
118
865
179
9.98
195
194
Flin
t, M
I MS
A87
.61
198
96.1
920
082
.55
200
96.3
019
3-5
.56%
199
78.2
018
610
0.53
840.
6212
75
9143
581
6.43
196
200
Lans
ing-
Eas
t Lan
sing
, MI M
SA
90.0
619
698
.07
185
91.6
118
398
.91
142
-0.5
3%16
476
.53
190
95.7
218
30.
4417
71
188
456
819.
16
197
198
Can
ton-
Mas
sillo
n, O
H M
SA
89.9
019
798
.71
171
87.0
719
494
.84
197
-0.2
9%16
074
.08
193
100.
8475
0.28
198
118
840
782
3.99
198
195
War
ren-
Tro
y-F
arm
ingt
on H
ills,
MI M
D90
.61
195
97.4
019
486
.75
196
93.6
719
9-1
.52%
187
76.9
618
996
.28
178
0.96
644
121
2,48
282
4.89
199
189
Hol
land
-Gra
nd H
aven
, MI M
SA
94.6
617
797
.15
196
90.4
718
895
.24
196
-1.4
0%18
680
.54
177
95.1
818
60.
5016
53
144
259
845.
82
200
197
Det
roit-
Livo
nia-
Dea
rbor
n, M
I MD
86.7
119
996
.40
197
84.0
019
993
.38
200
-3.6
1%19
679
.11
185
92.5
219
50.
7693
412
11,
985
851.
96
* In
dica
tes
this
city
’s p
ositi
on o
n la
st y
ear’s
sm
all m
etro
s lis
t.
Best-Performing Cities 2008

50
Complete Results: 2008 Best-Performing Small Cities
2008
rank
2007
rank
Met
ropo
litan
are
aP
opul
atio
n20
07O
vera
llin
dex
2007
Val
ueR
ank
2007
Val
ueR
ank
2006
Val
ueR
ank
2006
Val
ueR
ank
Gro
wth
Ran
k20
07 V
alue
Ran
k20
07 V
alue
Ran
k20
07 V
alue
Ran
k20
07 V
alue
Ran
k(T
hous
ands
)
13
Mid
land
, TX
MS
A11
3.75
610
3.13
812
3.50
511
0.89
33.
45%
914
6.80
897
.93
870.
7726
710
126
100.
002
6C
oeur
d'A
lene
, ID
MS
A11
8.80
310
1.75
2212
1.83
710
4.77
95.
86%
215
0.98
698
.26
800.
6651
533
134
132.
663
1B
end,
OR
MS
A12
5.32
210
1.94
1812
9.81
210
7.24
51.
27%
4412
0.34
2110
0.39
510.
7533
710
154
133.
384
2S
t. G
eorg
e, U
T M
SA
135.
441
102.
3513
147.
451
110.
094
2.41
%15
124.
5018
107.
747
0.45
883
7913
413
4.66
518
Gra
nd J
unct
ion,
CO
MS
A11
3.15
810
4.58
211
4.95
1510
4.50
114.
42%
510
0.32
7010
5.92
120.
5764
533
139
135.
236
10W
arne
r R
obin
s, G
A M
SA
113.
507
102.
5411
117.
5112
100.
6830
1.01
%54
158.
474
100.
3951
0.87
156
2213
116
6.26
730
Long
view
, TX
MS
A10
9.56
1810
3.02
911
2.92
2010
4.82
82.
09%
2511
4.99
3497
.98
850.
7922
622
204
167.
568
14B
ellin
gham
, WA
MS
A11
2.04
910
2.02
1611
3.49
1910
0.33
363.
24%
1010
6.64
5510
0.19
590.
7726
456
193
195.
039
7P
resc
ott,
AZ
MS
A11
6.93
410
0.34
5112
8.68
310
5.54
61.
64%
3510
8.56
4911
2.94
30.
4883
456
213
201.
8210
27O
dess
a, T
X M
SA
111.
2013
103.
029
117.
8410
111.
862
5.24
%3
87.6
899
108.
996
0.36
109
111
012
720
6.02
1117
Las
Cru
ces,
NM
MS
A10
7.81
2510
0.49
4911
7.78
1110
0.88
281.
53%
3817
1.51
199
.61
700.
9410
622
199
210.
4712
47C
heye
nne,
WY
MS
A10
6.70
2910
1.79
2111
6.28
1410
4.55
102.
77%
1496
.41
8510
1.06
410.
5275
533
8621
2.60
1332
Yum
a, A
Z M
SA
116.
555
100.
3750
119.
018
101.
3524
2.01
%27
161.
893
115.
872
0.30
114
379
191
221.
0614
81S
anta
Fe,
NM
MS
A10
5.15
3810
1.36
3010
9.18
3010
1.81
161.
24%
4614
1.32
1010
2.06
310.
6258
710
143
222.
9415
42B
ism
arck
, ND
MS
A10
8.03
2410
0.97
3811
0.83
2210
0.55
332.
17%
2210
4.90
5910
5.49
130.
6454
533
103
226.
9316
33H
oum
a-B
ayou
Can
e-T
hibo
daux
, LA
MS
A10
9.39
2010
4.49
311
8.22
911
4.37
11.
61%
3698
.31
7910
5.03
140.
2911
62
9820
123
0.55
1736
Far
go, N
D-M
N M
SA
107.
1528
101.
1235
109.
5926
100.
6331
1.70
%34
114.
0536
102.
3526
0.69
425
3319
223
1.17
1812
Cha
rlotte
svill
e, V
A M
SA
107.
6726
101.
8819
109.
4628
101.
6820
0.35
%81
104.
9158
103.
2023
0.92
128
619
323
2.35
1929
Aub
urn-
Ope
lika,
AL
MS
A11
1.61
1110
1.33
3111
7.06
1310
1.84
153.
51%
812
6.17
1698
.51
770.
3710
81
110
131
241.
9920
54G
aine
svill
e, G
A M
SA
111.
6012
103.
217
104.
7345
101.
4023
2.13
%23
96.5
284
101.
1040
0.46
874
5618
025
2.56
215
Win
ches
ter,
VA
-WV
MS
A10
8.36
2299
.56
8410
9.88
2510
0.79
292.
09%
2412
6.89
1599
.69
680.
7140
86
121
258.
2722
43G
reen
ville
, NC
MS
A10
9.80
1610
4.16
410
2.51
6010
0.36
352.
33%
1784
.48
104
104.
4016
0.82
182
9817
225
9.44
2335
Sio
ux F
alls
, SD
MS
A10
5.46
3510
1.84
2010
7.98
3510
0.58
322.
35%
1658
.64
121
104.
8015
0.61
595
3322
726
1.56
2441
Bill
ings
, MT
MS
A10
8.12
2310
2.41
1210
9.41
2910
0.25
371.
41%
4111
3.31
3897
.70
910.
5667
456
150
278.
1325
25Io
wa
City
, IA
MS
A10
3.39
4910
1.52
2710
3.50
4899
.34
580.
77%
6217
1.08
211
0.11
40.
8120
622
147
278.
8726
38Ty
ler,
TX
MS
A10
3.83
4510
0.73
4110
6.32
3910
0.08
401.
07%
5211
6.95
2899
.66
690.
7630
86
199
294.
7027
56W
aco,
TX
MS
A10
0.03
6810
1.55
2610
2.79
5698
.39
803.
14%
1114
7.81
710
1.67
340.
8715
533
228
296.
9428
24M
orga
ntow
n, W
V M
SA
110.
8014
101.
5227
108.
8531
101.
0926
1.97
%28
97.4
182
100.
4849
0.42
962
9811
829
9.21
2969
Ken
new
ick-
Pas
co-R
ichl
and,
WA
MS
A10
6.43
3110
3.68
510
4.80
4495
.55
119
5.19
%4
81.1
010
810
3.37
221.
253
456
229
309.
0730
13P
anam
a C
ity-L
ynn
Hav
en, F
L M
SA
111.
7710
99.3
888
122.
696
101.
7419
0.48
%72
142.
239
92.9
311
90.
6845
533
164
309.
5331
31H
attie
sbur
g, M
S M
SA
106.
1432
100.
6942
110.
0724
104.
997
2.29
%18
106.
6854
96.8
995
0.41
991
110
138
313.
1432
20F
ort W
alto
n B
each
-Cre
stvi
ew-D
estin
, FL
MS
A10
6.58
3097
.24
117
125.
164
99.3
259
0.06
%88
140.
1511
106.
5510
1.12
59
118
132
4.24
3346
Bow
ling
Gre
en, K
Y M
SA
108.
9721
101.
7423
110.
6223
99.7
651
2.27
%19
111.
7841
97.7
889
0.27
120
012
011
633
3.92
3457
Ann
isto
n-O
xfor
d, A
L M
SA
103.
1550
101.
0537
108.
6232
99.4
156
0.36
%78
132.
2813
97.6
192
0.73
367
1011
334
1.49
3551
St.
Jose
ph, M
O-K
S M
SA
109.
6917
103.
356
100.
1072
101.
2925
0.28
%84
112.
9039
100.
2756
0.63
561
110
123
347.
3436
16H
arris
onbu
rg, V
A M
SA
104.
0043
98.9
599
101.
0069
100.
9927
1.26
%45
116.
0430
100.
9843
0.70
419
111
835
4.11
3779
Ath
ens-
Cla
rke
Cou
nty,
GA
MS
A10
4.04
4210
0.62
4410
2.70
5999
.82
461.
35%
4310
7.17
5212
6.09
10.
5863
298
187
354.
2738
67C
olle
ge S
tatio
n-B
ryan
, TX
MS
A10
0.06
6799
.42
8710
7.63
3610
1.44
220.
84%
5911
9.89
2410
0.16
610.
7726
533
203
356.
6139
26M
edfo
rd, O
R M
SA
107.
1827
100.
5347
108.
5633
99.0
468
0.60
%66
118.
1827
94.3
511
30.
6356
622
199
363.
6340
78A
bile
ne, T
X M
SA
99.9
769
98.8
010
210
5.11
4310
1.67
212.
21%
2010
9.18
4610
2.34
270.
5372
456
159
369.
4241
23S
alis
bury
, MD
MS
A10
5.47
3499
.30
8910
8.19
3499
.81
480.
29%
8310
7.32
5110
0.56
470.
7533
86
120
370.
6942
50T
usca
loos
a, A
L M
SA
105.
3536
100.
8539
109.
5827
101.
7718
0.50
%70
108.
3850
96.8
896
0.34
111
298
205
381.
3543
130
Pue
blo,
CO
MS
A10
1.39
5710
2.01
1795
.87
9399
.05
661.
13%
4797
.81
8110
3.84
200.
5569
710
155
384.
5944
28La
redo
, TX
MS
A11
0.59
1510
1.14
3411
4.74
1699
.70
520.
82%
6010
1.89
6698
.11
830.
2412
20
120
233
386.
4345
109
Pas
cago
ula,
MS
MS
A99
.83
7110
1.19
3296
.73
8897
.45
9414
.10%
112
4.59
1794
.90
109
0.75
336
2215
239
1.36
4675
Roc
hest
er, M
N M
SA
101.
0358
100.
0366
103.
7247
99.1
563
1.79
%32
80.1
411
099
.24
730.
7922
622
181
394.
3147
88S
tate
Col
lege
, PA
MS
A97
.18
8999
.79
7410
3.36
5099
.12
651.
91%
2999
.86
7298
.71
760.
9311
91
145
402.
3748
70Jo
hnso
n C
ity, T
N M
SA
104.
1541
100.
1261
101.
0168
98.9
871
1.08
%50
119.
4925
85.2
412
10.
9114
533
194
402.
7749
45D
over
, DE
MS
A10
9.49
1999
.81
7311
1.45
2198
.77
74-0
.61%
100
151.
275
98.1
982
0.72
373
7915
240
3.77
5090
Gra
nd F
orks
, ND
-MN
MS
A10
3.52
4710
0.04
6510
3.29
5298
.29
811.
87%
3011
5.97
3110
4.08
190.
4390
298
9840
9.37
5112
6F
lore
nce,
SC
MS
A97
.44
8810
2.26
1495
.89
9299
.97
423.
77%
698
.68
7610
1.65
350.
4296
298
199
409.
6552
52C
hico
, CA
MS
A10
0.14
6699
.89
7010
2.95
5410
0.43
340.
94%
5710
3.52
6297
.80
880.
5372
710
219
412.
5253
73V
aldo
sta,
GA
MS
A10
5.93
3310
0.30
5410
6.06
4099
.05
660.
57%
6899
.11
7499
.52
710.
4296
533
130
413.
4054
39D
ubuq
ue, I
A M
SA
103.
9044
99.6
182
104.
1246
98.5
579
0.36
%80
135.
5412
100.
3754
0.59
617
1092
415.
4755
98B
loom
ingt
on, I
N M
SA
98.3
280
99.7
077
97.9
279
97.4
195
1.54
%37
118.
4526
102.
0332
1.39
17
1018
441
8.84
5693
Eau
Cla
ire, W
I MS
A10
3.46
4810
0.34
5199
.76
7310
0.02
410.
36%
7910
6.75
5310
0.63
460.
6748
379
158
420.
8757
140
Bur
lingt
on, N
C M
SA
96.7
592
102.
1315
91.1
711
099
.35
571.
38%
4210
8.87
4810
2.14
290.
5471
533
145
422.
5958
95S
t. C
loud
, MN
MS
A10
2.30
5410
1.18
3310
1.90
6399
.89
441.
07%
5181
.90
106
96.6
599
0.51
774
5618
642
9.83
5964
Red
ding
, CA
MS
A97
.69
8698
.77
103
103.
3451
99.8
845
1.05
%53
101.
3368
106.
579
0.65
526
2217
942
9.99
6091
Jopl
in, M
O M
SA
102.
7551
100.
6145
98.1
278
99.9
343
0.48
%71
116.
8329
100.
1760
0.47
843
7917
143
0.14
6110
8W
ichi
ta F
alls
, TX
MS
A96
.26
9699
.00
9897
.79
8210
2.18
141.
12%
4810
5.86
5799
.92
661.
017
622
148
430.
5162
40M
isso
ula,
MT
MS
A10
4.40
4010
0.24
5710
5.29
4299
.81
48-0
.69%
103
88.2
096
102.
5025
0.53
723
7910
644
2.57
6321
Fla
gsta
ff, A
Z M
SA
104.
4839
99.8
871
113.
8118
101.
8017
-0.3
4%95
79.7
511
273
.81
124
0.60
603
7912
744
3.75
6497
Ithac
a, N
Y M
SA
100.
8060
99.9
269
100.
9670
98.7
873
1.08
%49
90.1
693
95.7
710
70.
988
710
101
446.
9365
72C
olum
bia,
MO
MS
A10
3.68
4610
0.24
5710
1.73
6499
.14
640.
71%
6492
.52
9110
1.57
380.
5079
379
162
455.
5366
92R
apid
City
, SD
MS
A10
0.48
6410
0.13
6010
3.19
5398
.66
752.
18%
2174
.03
116
100.
4550
0.44
893
7912
045
6.92
6778
*B
rem
erto
n-S
ilver
dale
, WA
MS
A10
5.31
3798
.68
106
113.
8317
99.8
246
0.58
%67
63.1
011
995
.55
108
0.65
524
5623
745
7.43
6876
Yak
ima,
WA
MS
A10
0.60
6299
.77
7610
2.21
6110
0.23
392.
80%
1387
.55
100
97.7
490
0.26
121
111
023
347
8.99
6913
4W
ater
loo-
Ced
ar F
alls
, IA
MS
A98
.86
7710
0.12
6110
1.12
6798
.19
831.
84%
3111
1.22
4310
2.86
240.
3610
91
110
163
480.
0070
86D
otha
n, A
L M
SA
100.
8459
100.
6942
102.
9554
99.2
262
-1.0
0%11
410
1.25
6910
0.23
580.
4784
456
139
482.
6771
60N
apa,
CA
MS
A99
.29
7310
0.11
6310
3.40
4998
.63
760.
97%
5691
.38
9295
.96
104
0.56
675
3313
348
3.09
7277
Gle
ns F
alls
, NY
MS
A10
1.48
5699
.25
9210
2.05
6298
.00
861.
47%
3992
.58
9093
.78
116
1.06
64
5612
948
7.35
7311
9G
ulfp
ort-
Bilo
xi, M
S M
SA
93.0
211
210
7.93
195
.75
9494
.63
122
2.81
%12
99.0
875
100.
2955
0.50
794
5623
249
2.05
7411
2La
ke C
harle
s, L
A M
SA
100.
6161
101.
4329
99.1
775
100.
2438
-0.6
1%10
181
.32
107
99.3
472
0.43
903
7919
249
6.43
7515
2Ja
nesv
ille,
WI M
SA
98.4
978
98.4
111
198
.80
7610
2.77
13-0
.57%
9910
8.99
4710
1.86
330.
4390
533
160
497.
4876
85F
lore
nce-
Mus
cle
Sho
als,
AL
MS
A10
2.47
5310
0.57
4697
.46
8498
.97
720.
86%
5811
1.76
4210
0.10
620.
3011
40
120
143
500.
6377
128
Kin
gsto
n, N
Y M
SA
94.2
610
998
.71
105
102.
7857
103.
7312
-0.6
4%10
275
.25
115
102.
1230
0.67
489
118
250
1.16
7884
Ale
xand
ria, L
A M
SA
102.
0955
100.
8440
106.
9837
99.4
555
0.53
%69
77.6
311
494
.84
110
0.29
116
012
015
050
4.35
5-yr
job
grow
th20
02–2
007
1-yr
job
grow
th20
06–2
007
5-yr
wag
es/s
alar
ies
grow
th 2
001–
2006
1-yr
wag
es/s
alar
ies
grow
th 2
005–
2006
# of
HT
GD
P
LQs
over
1Jo
b gr
owth
(3/0
7–3/
08)
5-yr
rel
ativ
e H
T G
DP
gr
owth
200
2–20
071-
yr r
elat
ive
HT
GD
P
grow
th 2
006–
2007
Hig
h-Te
ch
GD
P L
Q
Best-Performing Cities 2008

51
2008
rank
2007
rank
Met
ropo
litan
are
aP
opul
atio
n20
07O
vera
llin
dex
2007
Val
ueR
ank
2007
Val
ueR
ank
2006
Val
ueR
ank
2006
Val
ueR
ank
Gro
wth
Ran
k20
07 V
alue
Ran
k20
07 V
alue
Ran
k20
07 V
alue
Ran
k20
07 V
alue
Ran
k(T
hous
ands
)
5-yr
job
grow
th20
02–2
007
1-yr
job
grow
th20
06–2
007
5-yr
wag
es/s
alar
ies
grow
th 2
001–
2006
1-yr
wag
es/s
alar
ies
grow
th 2
005–
2006
# of
HT
GD
P
LQs
over
1Jo
b gr
owth
(3/0
7–3/
08)
5-yr
rel
ativ
e H
T G
DP
gr
owth
200
2–20
071-
yr r
elat
ive
HT
GD
P
grow
th 2
006–
2007
Hig
h-Te
ch
GD
P L
Q
7915
0D
ecat
ur, A
L M
SA
* In
dica
tes
this
city
’s p
ositi
on o
n la
st y
ear’s
larg
e m
etro
s lis
t.98.2
881
101.
5625
91.5
410
898
.15
841.
74%
3310
9.25
4598
.38
790.
4199
298
149
510.
5980
142
Blo
omin
gton
-Nor
mal
, IL
MS
A93
.60
111
100.
0564
96.7
089
99.6
453
0.11
%87
128.
9614
98.7
275
0.77
263
7916
452
0.94
8110
4Te
xark
ana,
TX
-Tex
arka
na, A
R M
SA
98.8
976
99.6
280
105.
4641
99.5
854
1.43
%40
99.7
073
83.9
612
20.
2811
80
120
134
526.
8482
149
Ban
gor,
ME
MS
A95
.26
106
99.6
280
94.9
599
97.7
190
2.04
%26
92.6
189
100.
9444
0.69
424
5614
953
6.94
8387
App
leto
n, W
I MS
A99
.75
7299
.61
8297
.20
8797
.21
100
-0.2
0%94
109.
4444
100.
7345
0.69
425
3321
853
7.71
8412
7Le
wis
ton-
Aub
urn,
ME
MS
A96
.39
9410
0.29
5599
.28
7498
.99
700.
11%
8612
0.29
2299
.72
670.
3211
33
7910
753
9.89
8511
3Ja
ckso
n, T
N M
SA
100.
5563
99.7
077
97.9
080
98.1
085
0.78
%61
115.
3832
93.5
911
70.
4784
379
113
542.
3886
83P
ittsf
ield
, MA
MS
A96
.46
9310
0.01
6797
.23
8697
.55
92-1
.02%
115
123.
5719
104.
2918
0.78
243
7913
054
4.04
8712
2C
ham
paig
n-U
rban
a, IL
MS
A94
.23
110
99.4
585
94.5
210
197
.80
87-0
.41%
9612
2.63
2010
3.46
210.
7237
710
221
544.
2388
125
Bur
lingt
on-S
outh
Bur
lingt
on, V
T M
SA
96.8
391
99.1
995
97.3
585
99.0
269
0.45
%74
79.8
511
197
.13
941.
342
533
207
555.
1389
99W
ausa
u, W
I MS
A99
.85
7099
.09
9610
1.34
6698
.57
78-0
.55%
9798
.38
7810
0.24
570.
4390
533
130
557.
1590
136
Jeffe
rson
City
, MO
MS
A98
.47
7910
0.31
5395
.00
9896
.87
105
0.46
%73
106.
4156
101.
4439
0.57
642
9814
655
7.67
9194
John
stow
n, P
A M
SA
99.2
674
99.0
397
96.4
190
98.2
782
-0.0
1%89
104.
9059
98.0
584
0.82
184
5614
556
1.98
9210
0B
lack
sbur
g-C
hris
tians
burg
-Rad
ford
, VA
MS
A97
.94
8398
.12
113
102.
7458
99.7
750
-4.9
6%12
497
.99
8097
.42
930.
7630
533
158
567.
6493
106
Roc
ky M
ount
, NC
MS
A97
.54
8710
1.59
2489
.10
118
97.6
091
-0.7
9%10
780
.30
109
76.0
112
30.
959
91
146
569.
7094
143
Par
kers
burg
-Mar
ietta
-Vie
nna,
WV
-OH
MS
A95
.50
102
99.2
194
92.7
010
698
.62
770.
98%
5510
2.66
6410
1.59
370.
5177
456
161
572.
8695
133
Terr
e H
aute
, IN
MS
A92
.49
115
99.2
393
96.0
591
96.8
910
4-1
.41%
119
115.
2633
107.
328
1.18
46
2216
957
8.15
9613
2E
lkha
rt-G
oshe
n, IN
MS
A10
2.51
5297
.05
120
106.
8738
96.4
611
4-1
.23%
118
92.8
887
104.
4016
0.49
824
5619
858
4.80
9717
7N
iles-
Ben
ton
Har
bor,
MI M
SA
90.1
112
010
0.14
5990
.47
113
97.7
788
3.63
%7
84.1
810
596
.03
103
0.38
106
456
160
594.
2398
105
Alb
any,
GA
MS
A97
.94
8398
.92
100
93.9
710
395
.78
118
-0.1
8%93
114.
6435
100.
3951
0.64
547
1016
459
5.03
9914
5O
shko
sh-N
eena
h, W
I MS
A10
0.42
6599
.69
7994
.47
102
96.7
010
9-0
.11%
9112
0.23
2398
.23
810.
5275
379
162
597.
7610
013
1A
ltoon
a, P
A M
SA
97.1
490
99.8
372
94.6
910
096
.50
112
0.32
%82
98.5
977
97.9
586
0.67
485
3312
660
0.93
101
137
Bar
nsta
ble
Tow
n, M
A M
SA
96.2
895
98.7
610
410
0.52
7197
.31
97-1
.15%
117
87.8
497
100.
0464
0.81
206
2222
260
8.89
102
154
Mac
on, G
A M
SA
95.9
699
98.5
611
092
.65
107
96.8
610
60.
74%
6389
.13
9598
.81
740.
7824
533
230
621.
8210
313
8La
Cro
sse,
WI-
MN
MS
A98
.09
8298
.89
101
95.7
095
99.2
461
-0.1
3%92
97.2
883
94.3
811
20.
4390
456
131
625.
0510
410
7D
ecat
ur, I
L M
SA
95.2
010
799
.78
7593
.47
105
97.2
299
0.18
%85
103.
5361
100.
5548
0.41
994
5610
962
6.89
105
155
She
boyg
an, W
I MS
A98
.98
7599
.26
9097
.86
8197
.23
98-1
.09%
116
62.4
612
010
1.06
410.
4010
25
3311
563
1.98
106
158
Tope
ka, K
S M
SA
90.1
311
910
0.29
5590
.33
114
97.2
010
10.
42%
7778
.99
113
106.
4011
0.43
903
7922
963
6.68
107
121
Lafa
yette
, IN
MS
A95
.47
103
100.
0068
93.8
210
495
.98
117
0.44
%75
92.8
588
96.7
697
0.72
373
7919
264
1.85
108
146
Spr
ingf
ield
, IL
MS
A92
.83
113
99.2
690
90.7
411
296
.64
111
-0.0
9%90
85.4
710
398
.39
780.
9212
710
207
642.
2110
912
0M
onro
e, L
A M
SA
92.5
911
498
.29
112
95.7
095
99.2
860
0.42
%76
102.
1065
95.9
110
60.
5764
298
172
647.
9811
011
8V
inel
and-
Mill
ville
-Brid
geto
n, N
J M
SA
97.9
483
97.5
911
510
1.49
6597
.35
96-0
.97%
113
87.7
598
87.2
612
00.
5079
456
156
673.
9411
116
6S
ioux
City
, IA
-NE
-SD
MS
A95
.45
104
101.
0936
88.4
312
096
.82
108
-0.8
6%10
950
.73
123
99.9
765
0.38
106
456
143
677.
6011
215
9R
acin
e, W
I MS
A95
.86
100
98.5
810
995
.01
9797
.55
92-0
.87%
110
95.6
786
102.
2328
0.39
104
379
195
682.
4711
311
7D
alto
n, G
A M
SA
95.9
898
97.5
511
697
.51
8396
.50
112
-0.8
8%11
287
.16
102
95.9
610
40.
8617
379
134
698.
5911
416
3W
illia
msp
ort,
PA
MS
A95
.07
108
99.4
585
90.1
611
596
.44
115
-0.5
6%98
87.2
910
194
.46
111
0.59
615
3311
770
0.66
115
151
Mun
cie,
IN M
SA
90.2
211
898
.63
107
81.8
412
393
.86
124
-0.7
4%10
510
1.57
6710
0.08
630.
6845
533
115
708.
3111
616
5M
uske
gon-
Nor
ton
Sho
res,
MI M
SA
95.6
510
197
.18
119
89.8
811
696
.96
103
0.68
%65
52.5
012
293
.94
115
0.55
694
5617
471
1.91
117
164
Man
sfie
ld, O
H M
SA
89.5
112
296
.88
122
88.5
111
994
.99
121
-1.6
2%12
011
2.34
4010
1.62
360.
7630
456
126
712.
6411
811
1W
heel
ing,
WV
-OH
MS
A96
.01
9798
.62
108
98.4
477
96.8
410
7-0
.88%
111
100.
2671
96.3
110
10.
3910
42
9814
571
3.95
119
173
And
erso
n, S
C M
SA
95.3
110
510
0.52
4888
.21
121
97.7
788
-0.8
2%10
870
.52
117
93.4
711
80.
2012
31
110
180
731.
3112
017
9S
prin
gfie
ld, O
H M
SA
90.8
511
797
.66
114
80.7
512
497
.20
101
-0.7
6%10
633
.97
124
109.
585
0.20
123
111
014
077
2.30
121
168
Sag
inaw
-Sag
inaw
Tow
nshi
p N
orth
, MI M
SA
89.2
112
396
.89
121
82.7
812
296
.70
109
-3.5
1%12
390
.02
9496
.54
100
0.68
454
5620
277
5.15
122
167
Lim
a, O
H M
SA
91.3
211
696
.65
123
90.9
911
196
.14
116
-0.7
0%10
410
3.26
6394
.04
114
0.40
102
111
010
579
4.59
123
178
Bat
tle C
reek
, MI M
SA
90.0
012
197
.23
118
91.3
210
995
.37
120
-2.0
3%12
111
3.89
3796
.11
102
0.28
118
111
013
780
3.00
124
174
Jack
son,
MI M
SA
87.6
312
496
.61
124
89.2
311
794
.34
123
-2.2
1%12
268
.68
118
96.7
498
0.33
112
298
163
855.
37
Best-Performing Cities 2008


53
References1. Office of Information and Regulatory Affairs Statistical and Science Policy Branch, Office of Management and
Budget, OMB Bulletin, no. 04-03.2. The latest twelve-month job performance calculates the percentage change from the same month in the previous
year (e.g., the percentage change in jobs from March 2007 to March 2008). The percentage change is a measure of recent momentum, capturing which metropolitan areas have improved their performance in recent months. The annual growth rate measures the percentage change from calendar year 2006 to 2007. While annual growth rate does not indicate whether high growth was achieved or diminished in the first or latter half of the year, the twelve-month growth rate captures that aspect.
3. An industry’s location quotient (LQ) measures the level of employment concentration in a given location (in this case, an MSA) relative to the industry average across the United States. A metro with an employment LQ higher than 1.0 in a high-tech industry, for example, has a greater concentration of that industry than the nation has, on average. It is an indication of whether a metro has successfully attracted an above-average mass of high-tech industries. Metros that exceed the national average in high-tech industry LQ have an edge in attracting and retaining high-tech firms because of their dense employment base and other positive agglomeration, or clustering, factors.
4. Ross DeVol and Armen Bedroussian, The Economic Outlook for the United States and California: Slow Growth or Recession?, Executive Summary and Research Findings (California Center, Milken Institute, 2008).
5. Federal Reserve Bank of Dallas El Paso Branch, “Crossroads: Economic Trends in the Desert Southwest,” no. 2 (2007), http://www.dallasfed.org/research/crossroads/2007/cross0702a.html.
6. Answers.com, “U.S. City Guide: Provo, Utah,” http://www.answers.com/topic/provo-economy.7. Census Bureau, “Population Estimates: Net Migration, PRV” (2007).8. Michael D. Helmar, “Précis Metro for Raleigh” (Moody’s Economy.com Inc., 2008).9. Triangle Business Journal, Triangle Business Journal Book of Lists (2008).10. Economic Development of Corporation of Utah, “Utah Major Employers Guide” (2007).11. City-Data.com, “Salt Lake City: Economy,” http://www.city-data.com/us-cities/The-West/Salt-Lake-City-
Economy.html.12. Austin Chamber of Commerce, “Business & Industry,” http://www.austin-chamber.org/DoBusiness/
GreaterAustinProfile/business.html.13. Ibid.14. The University of Alabama, Alabama Economic Outlook 2008 (Center for Business and Economic Research,
Culverhouse College of Commerce, University of Alabama, 2008).15. Chamber of Commerce of Huntsville/Madison County, “2007 Aerospace/Defense Industry Profile: Huntsville/
Madison County Alabama” (2007).16. Michael D. Helmar, “Précis Metro for Wilmington” (Moody’s Economy.com Inc., 2008).17. Greater Wilmington Chamber of Commerce, “Cape Fear Future,” http://www.wilmingtonchamber.org/
capefearfuture.html.18. McAllen Chamber of Commerce, “McAllen Chamber Economic Profile” (2008).19. Ibid.20. City-Data.com, “Tacoma: Economy,” http://www.city-data.com/us-cities/The-West/Tacoma-Economy.html.21. Andrew Gledhill, “Précis Metro for Tacoma” (Moody’s Economy.com Inc., 2008).22. ———, “Précis Metro for Olympia” (Moody’s Eonomy.com Inc., 2008).23. Morgan McGowan, “Précis Metro for Charleston” (Moody’s Economy.com Inc., 2008).
Best-Performing Cities 2008

54
24. Harry Wessel, “Nemours Orlando Children’s Hospital Gets Green Light,” Orlando Sentinel, February 20, 2008.
25. Greater Bakersfield Chamber of Commerce, “Major Employers in Kern County” (2008).26. Copperas Cove Economic Development Corporation, “Fort Hood, the ‘Great Place’” (2008).27. Glenn Wingard, “Précis Metro for Lafayette” (Moody’s Economy.com Inc., 2008).28. Military Transformation Task Force, “Economic Impact of the U.S. Department of Defense in
San Antonio” (2006).29. Edward Freidman, “Précis Metro for Houston” (Moody’s Economy.com Inc., 2008).30. Jessica Mintz, “Boeing Ups 20-Year Plane Market Forecast,” Seattle Times, July 9, 2008.31. Augustine Fauche, “Précis Metro for Ogden” (Moody’s Economy.com Inc., 2008).32. Myrtle Beach International Airport, “MYR Airport Expansion Program” (2008).33. Sean Maher, “Précis Metro for Greeley” (Moody’s Economy.com Inc., 2008).34. Greater Durham Chamber of Commerce, “Economic Profile” (2008).35. Alexander Miron, “Précis Metro for Nashville” (Moody’s Economy.com Inc., 2008).36. Victor Godinez, “AT&T Moving Headquarters to Dallas from San Antonio,” Dallas Morning News,
June 28, 2008.37. Business Press, “Georgia Ports Equal Prosperity for Savannah,” WSAV.com, July 2, 2008.38. The Greater Des Moines Partnership, “Major Employers” (2008).39. Steven G. Cochrane, “Précis Metro for Riverside” (Moody’s Economy.com Inc., 2008).40. “Fortune 500 List for ’08 Features 12 Georgia Companies,” Atlanta Business Chronicle, April 22, 2008.41. Maria Saporta, “Apparently, AT&T’s Heart Deep in Texas,” Atlanta Journal-Constitution, July 3, 2008.42. Rebecca Seweryn, “Précis Metro for Atlanta” (Moody’s Economy.com Inc., 2008).43. Steven G. Cochrane, “Précis Metro for Los Angeles” (Moody’s Economy.com Inc., 2008).44. Ryan Sweet, “Précis Metro for Philadelphia” (Moody’s Economy.com Inc., 2008).45. Bureau of Labor Statistics, “Reductions to Current Employment Statistics Metropolitan Area Series,”
http://www.bls.gov/sae/msareductions.htm.46. Robert W. Gilmer and Charles James, “Spotlight: Midland and Odessa Permian Basin Cities Ride Oil Boom
Again,” Southwest Economy, no. 2 (2008).47. Mella McEwen, “Midland-Odessa Economy Stronger Than Thought,” http://www.mywesttexas.com/
articles/2008/04/02/news/top_stories/doc47f39af37ead0924068995.prt.48. Mike McLean, “2008 Economic Outlook: Strong Sectors to Keep Kootenai Growth on Track,” Journal of
Business 22, no. 26 (2007).49. Global Insight and National City Corporation, “Housing Prices in America” (2008).50. Glenn Wingard, “Précis Metro for Grand Junction” (Moody’s Economy.com Inc., 2008).51. Gene Rector, “Commander: RAFB Rumors Are Baseless: Owen Uses Address to Reassure, Challenge Robins
Employees,” Macon Telegraph, November 1, 2007.52. Arnold Slesers, “Précis Metro for Longview” (Moody’s Economy.com Inc., 2008).53. Andrew Gledhill, “Précis Metro for Bellingham” (Moody’s Economy.com Inc., 2008).54. Robert W. Gilmer and Charles James, “Spotlight: Midland and Odessa Permian Basin Cities Ride Oil Boom
Again,” Southwest Economy, no. 2 (2008).
Best-Performing Cities 2008

55
About the AuthorsRoss C. DeVol is Director of Regional Economics at the Milken Institute. He oversees the Institute’s research efforts on the dynamics of comparative regional growth performance, as well as technology and its impact on regional and national economies. He is an expert on the new intangible economy and how regions can prepare themselves to compete in it. DeVol authored the groundbreaking study America’s High-Tech Economy: Growth, Development, and Risks for Metropolitan Areas, an examination of how clusters of high-technology industries across the country affect economic growth in those regions, and created the State Technology and Science Index, which ranks the 50 states in terms of their technology and science assets. Prior to joining the Institute, DeVol was senior vice president of Global Insight, Inc. (formerly Wharton Econometric Forecasting), where he supervised the Regional Economic Services group. DeVol supervised the re-specification of Global Insight’s regional econometric models and played an instrumental role on similar work on its U.S. Macro Model, originally developed by Nobel laureate Lawrence Klein. He was the firm’s chief spokesman on international trade. He also served as the head of Global Insight’s U.S. Long-Term Macro Service and authored numerous special reports on behalf of the U.S. Macro Group. He is ranked among the “Super Stars” of Think Tank Scholars by International Economy magazine. DeVol earned his M.A. in economics at Ohio University.
Armen Bedroussian is a Research Economist with the Milken Institute. He has extensive graduate training in econometrics, statistical methods, and other modeling techniques. Before joining the Institute, he was an economics teaching assistant at the University of California, Riverside, where he taught intermediate micro- and macroeconomics. Since coming to the Institute, Bedroussian has co-authored numerous studies, including The Impact of 9/11 on U.S. Metropolitan Economies, America’s Biotech and Life Science Clusters, Biopharmaceutical Industry Contributions to U.S. and State Economies, Economic Benefits of Proposed University of Central Florida College of Medicine, and An Unhealthy America: The Economic Burden of Chronic Disease. In addition to co-authoring annual reports on Best-Performing Cities, Bedroussian is also responsible for compiling the Milken Institute’s Cost of Doing Business Index; both of these studies have gained increasing popularity among business and policy leaders across the nation. Bedroussian earned his B.S. in applied mathematics and a master’s degree in economics from UC-Riverside.
Kevin Klowden is Managing Economist of the California Center and is part of the Regional Economics group at the Milken Institute, specializing in the study of demographic and spatial factors, and how these are influenced by public policy and affect regional economies. He has written and spoken on the role of transportation infrastructure as it relates to the movement of goods and people in the development of regional competitiveness. Klowden has a strong interest in the role of technology and media, and has spoken and organized panels addressing the subject; he recently authored The Writers’ Strike of 2007–2008: The Economic Impact of Digital Distribution, a study that examined the underlying issues surrounding the recent Hollywood writers’ strike and calculated the costs of that work stoppage to the overall California economy. He coordinated the Institute’s Los Angeles Economy Project, seeking public policy and private-sector solutions to challenges the region faces amid a growing unskilled labor pool. He served on the editorial board of Millennium, the international affairs journal of the London School of Economics, where he earned a master’s degree in the politics of world economy. Klowden also earned a master’s in economic geography from the University of Chicago.
Best-Performing Cities 2008

56
Soojung Kim is a Senior Research Analyst in the Regional Economics group at the Milken Institute. Her research interests include regional economics, economic development, and infrastructure. Her expertise covers statistical analysis, econometric modeling, transportation network analysis, and GIS applications. Kim has co-authored An Unhealthy America: The Economic Burden of Chronic Disease and the 2007 edition of Best-Performing Cities. She also has contributed to the Institute’s Cost-of-Doing-Business Index and its 2008 State Technology and Science Index. Kim received her Ph.D. in urban planning from the University of Southern California. She received a bachelor’s degree from Yonsei University and a master’s degree in city planning from Seoul National University in Korea.
Best-Performing Cities 2008

Where America’s Jobs Are Created and SustainedSeptember 2008
Best-Performing Cities 2008
1250 Fourth Street • Santa Monica, CA 90401Phone: 310.570.4600 • Fax: 310.570.4601E-mail: [email protected]
© 2008 Milken Institute
Ross DeVol, Armen Bedroussian, Kevin Klowden, and Soojung Kim
PROVO-OREM, UTAHBest-Performing City