Embed Size (px)
Citation preview
Best Practices in Data-Based Decision Making
Within an RTI ModelGary L. Cates, Ph.D.
Illinois State University
Ben Ditkowsky, Ph.D.Lincolnwood School District 74
MeasuredEffects.com
3 Learner ObjectivesLearners will:
• Understand data-based decision making process focusing on screening, diagnostics, progress monitoring, and outcomes.
• Understand how CBM can be helpful to the data-based decision-making process
• Learn to make decisions based on graphical analysis of data
House Keeping• Workshop Time 2:00- 9:00• 15 minute Breaks (3:30; 7:30; PRN)• Dinner Break (5:00- 6:00)• Please Silence Cell Phones
Agenda• Preliminary Points• 10 Areas of Data- based Decision making• Methods of Data- based decision making
for each area• Issues in Evaluation and Progress
Monitoring• Final thoughts about Data- based Decision
Making• Questions
How Are Assessment Data Used?
• Communicating individual student performance to parents, students, and teachers
• Communicating grade-level, building or district performance to the staff and the community
• Informing instructional decisions at all levels, from the individual to the district
• Evaluating effectiveness of programming• Evaluating schools and districts for No Child Left
Behind
Key Purposes of Assessment
• Screening• Diagnostic• Progress Monitoring• Outcomes
Problem-Solving• R.I.O.T
– These are the Methods for acquiring data
• I.C.E.L– These are the domains to be assessed
and/or manipulated
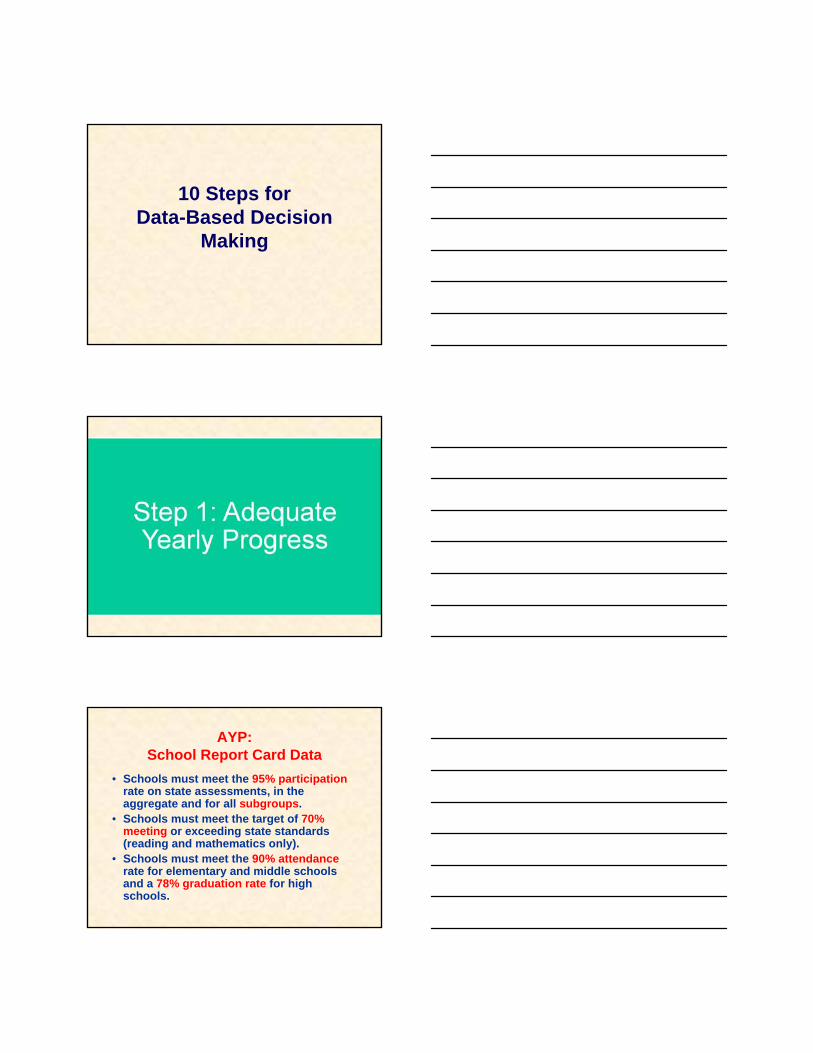
10 Steps forData-Based Decision
Making
AYP:School Report Card Data
• Schools must meet the 95% participation rate on state assessments, in the aggregate and for all subgroups.
• Schools must meet the target of 70% meeting or exceeding state standards (reading and mathematics only).
• Schools must meet the 90% attendance rate for elementary and middle schools and a 78% graduation rate for high schools.
Activity #1• Consider/Analyze your school report
card• What are your strengths• What areas need to be developed
– What can YOU do to facilitate these areas?
– What could help YOU facilitate these areas?
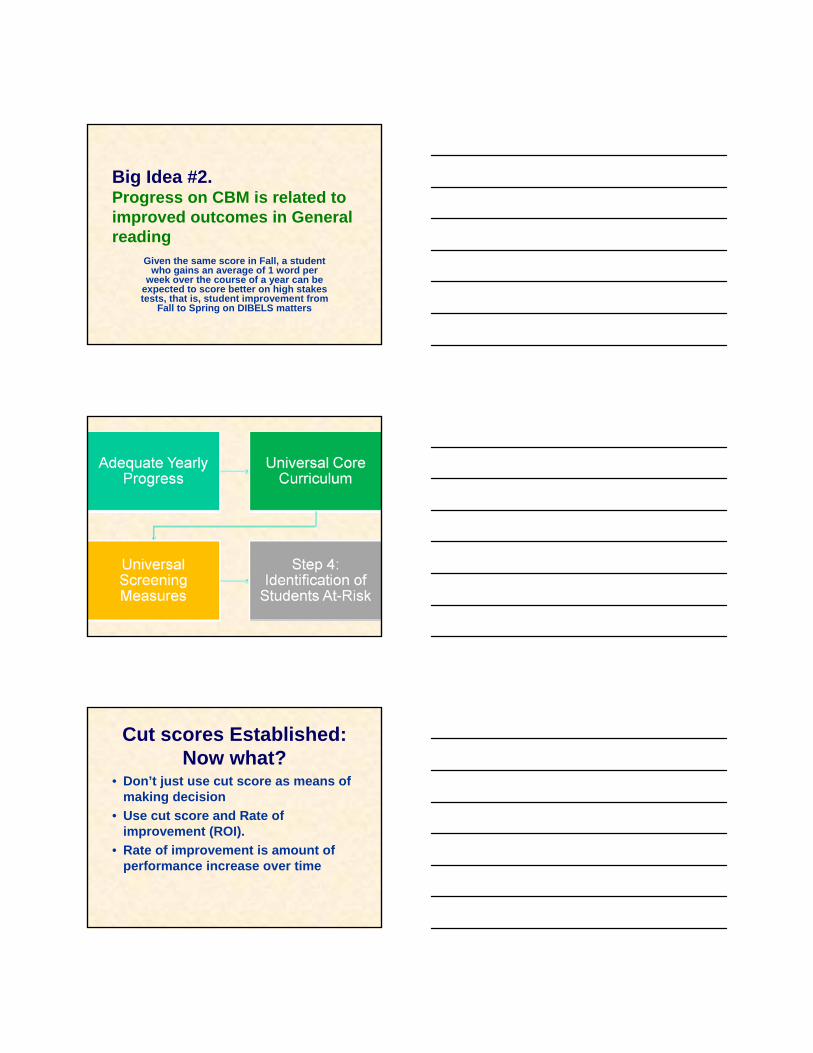
Data-Based Decision Making:Universal Core Curriculum and
Instruction• How Effective is the universal
curriculum?– ISTEP, ISAT, ITBS, MAPS, MEAP, etc.– Graduation Rate– Attendance– Percent of Children needing additional
instruction• NO MORE THAN 80% or AYP
– Do an analysis of the Instructional Planning Forms (IPF)

Activity #2• What Percent of your students are
receiving more than universal curriculum and instruction?
• What percent of your students are not meeting or exceeding expectations on your high stakes test?– Using Riot & ICEL develop testable
hypotheses
Sample 3rd Grade Instructional Planning Form for Reading
Activity Materials Arrangement Time MotivationalStrategy
•Pre-teach story
vocabulary
•3rd grade basal•Blackboard
•Practice Sentences
•Small Group (1:5 Ratio)
•10 min/day •Praise for attention
•Round Robin Choral
Reading
•3rd grade basal •Small Group (1:5 Ratio)
•20 min/day •Reminding of rules
•Story Mapping
•Visual organizer •Small Group •15 min/day •Praise for answering
•Grammar Workbook
•3rd grade workbook
•Independent •15 min/day •Reminding and peer grading
•Phonics Instruction
•Manipulatives •Small Group •15 min/day •Praise for answering
Data-Based Decision Making: Universal Screening Measures
• Benchmarks must be established– Based on Cut Score– correlated with High- Stakes Testing
(DIBELS?)– Administered 3- 4 times per year– Brief To administer (few minutes)– Easy and Quick To score & Interpret
Activity #3• What do you currently have in place for
reading, writing, math, and behavior for universal screening measures?
• How do each stack up to the criteria of– Brief to administer (how long does it take?)– Easy to interpret and Score (how is this being
done?)– How many times per year?– Does it predict high-stakes test performance?
Why Use Local Assessments, Like CBM?
• State-mandated tests assess outcomes• Local assessments allow us to:
– Measure students earlier than 3rd grade– Monitor progress more frequently than once
per year– Rely on multiple assessment tools for our
information– Develop an integrated assessment system with
benchmarks for performance, linked to a common outcome

Question #1. Do Scores On CBM Matter?
Source data AIMSWEB
How many words did they read in one minute?
Sam read 22Mary read 44
Juan read 65 Dorothy read 94
Sam read 22
Mary read 44
Juan read 65Dorothy read 94
Curriculum-Based Measurement and High Stakes Testing
120
130
140
150
160
170
180
190
200
210
220
0 20 40 60 80 100
120
140
160
180
200
220
240
260
Reading (CWPM)
Rea
ding
ISA
T S
cale
Sco
re
Exceed Standards
Meets Standards
Below Standards
Academic Warning
Curriculum-Based Measurement and High Stakes Testing
120
130
140
150
160
170
180
190
200
210
220
0 20 40 60 80 100
120
140
160
180
200
220
240
260
Reading (CWPM)
Rea
ding
ISA
T S
cale
Sco
re
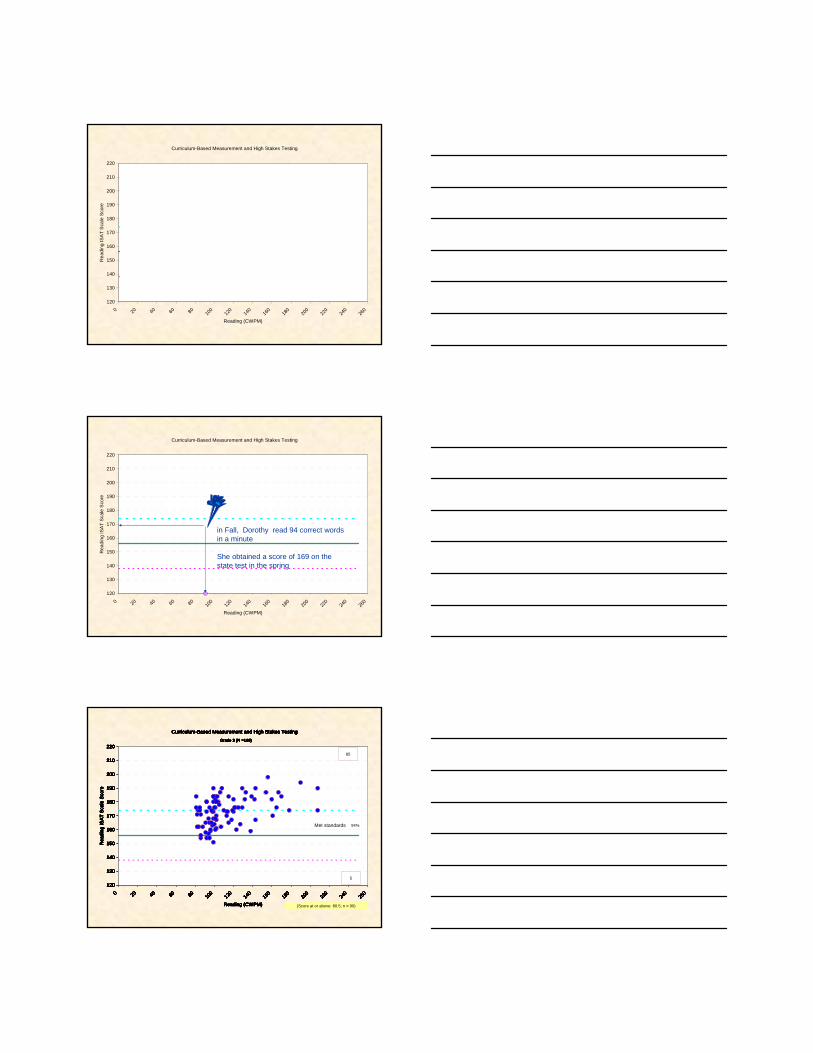
in Fall, Dorothy read 94 correct words in a minute
She obtained a score of 169 on the state test in the spring
Curriculum-Based Measurement and High Stakes Testing
120
130
140
150
160
170
180
190
200
210
220
0 20 40 60 80 100
120
140
160
180
200
220
240
260
Reading (CWPM)
Rea
ding
ISA
T S
cale
Sco
re
0
1
Grade 3 (N =143)
(Score at or below: 20; n = 1)
0%Met
Curriculum-Based Measurement and High Stakes Testing
120
130
140
150
160
170
180
190
200
210
220
0 20 40 60 80 100
120
140
160
180
200
220
240
260
Reading (CWPM)
Rea
ding
ISA
T S
cale
Sco
re
0
4
Grade 3 (N =144)
(Score at or below: 30; n = 4)
0%Met
Curriculum-Based Measurement and High Stakes Testing
120
130
140
150
160
170
180
190
200
210
220
0 20 40 60 80 100
120
140
160
180
200
220
240
260
Reading (CWPM)
Rea
ding
ISA
T S
cale
Sco
re
0
9
Grade 3 (N =144)
(Score at or below: 40; n = 9)
0%Met
Curriculum-Based Measurement and High Stakes Testing
120
130
140
150
160
170
180
190
200
210
220
0 20 40 60 80 100
120
140
160
180
200
220
240
260
Reading (CWPM)
Rea
ding
ISA
T S
cale
Sco
re
2
11
Grade 3 (N =144)
(Score at or below: 50; n = 13)
15%Met standards
Curriculum-Based Measurement and High Stakes Testing
120
130
140
150
160
170
180
190
200
210
220
0 20 40 60 80 100
120
140
160
180
200
220
240
260
Reading (CWPM)
Rea
ding
ISA
T S
cale
Sco
re
6
14
Grade 3 (N =140)
(Score at or below: 60; n = 20)
30%Met standards
Curriculum-Based Measurement and High Stakes Testing
120
130
140
150
160
170
180
190
200
210
220
0 20 40 60 80 100
120
140
160
180
200
220
240
260
Reading (CWPM)
Rea
ding
ISA
T S
cale
Sco
re
15
18
Grade 3 (N =143)
(Score at or below: 70; n = 33)
45%Met standards
Curriculum-Based Measurement and High Stakes Testing
120
130
140
150
160
170
180
190
200
210
220
0 20 40 60 80 100
120
140
160
180
200
220
240
260
Reading (CWPM)
Rea
ding
ISA
T S
cale
Sco
re
27
22
Grade 3 (N =138)
(Score at or below: 80; n = 49)
55%Met standards
Curriculum-Based Measurement and High Stakes Testing
120
130
140
150
160
170
180
190
200
210
220
0 20 40 60 80 100
120
140
160
180
200
220
240
260
Reading (CWPM)
Rea
ding
ISA
T S
cale
Sco
re
27
22
Grade 3 (N =138)
(Score at or below: 80; n = 49)
Curriculum-Based Measurement and High Stakes Testing
120
130
140
150
160
170
180
190
200
210
220
0 20 40 60 80 100
120
140
160
180
200
220
240
260
Reading (CWPM)
Rea
ding
ISA
T S
cale
Sco
re
27
22
Grade 3 (N =138)
(Score at or below: 80; n = 49)
85
5
94%Met standards
Curriculum-Based Measurement and High Stakes Testing
120
130
140
150
160
170
180
190
200
210
220
0 20 40 60 80 100
120
140
160
180
200
220
240
260
Reading (CWPM)
Rea
ding
ISA
T S
cale
Sco
re
85
5
Grade 3 (N =138)
(Score at or above: 80.5; n = 90)
94%Met standards
Curriculum-Based Measurement and High Stakes Testing
120
130
140
150
160
170
180
190
200
210
220
0 20 40 60 80 100
120
140
160
180
200
220
240
260
Reading (CWPM)
Rea
ding
ISA
T S
cale
Sco
re
55%
45%
0%
100%
94%
6%
Grade 3 (N =138)
Curriculum-Based Measurement and High Stakes Testing
120
130
140
150
160
170
180
190
200
210
220
0 20 40 60 80 100
120
140
160
180
200
220
240
260
Reading (CWPM)
Rea
ding
ISA
T S
cale
Sco
re
49%
51%
89%
11%
Grade 3 (N =517)
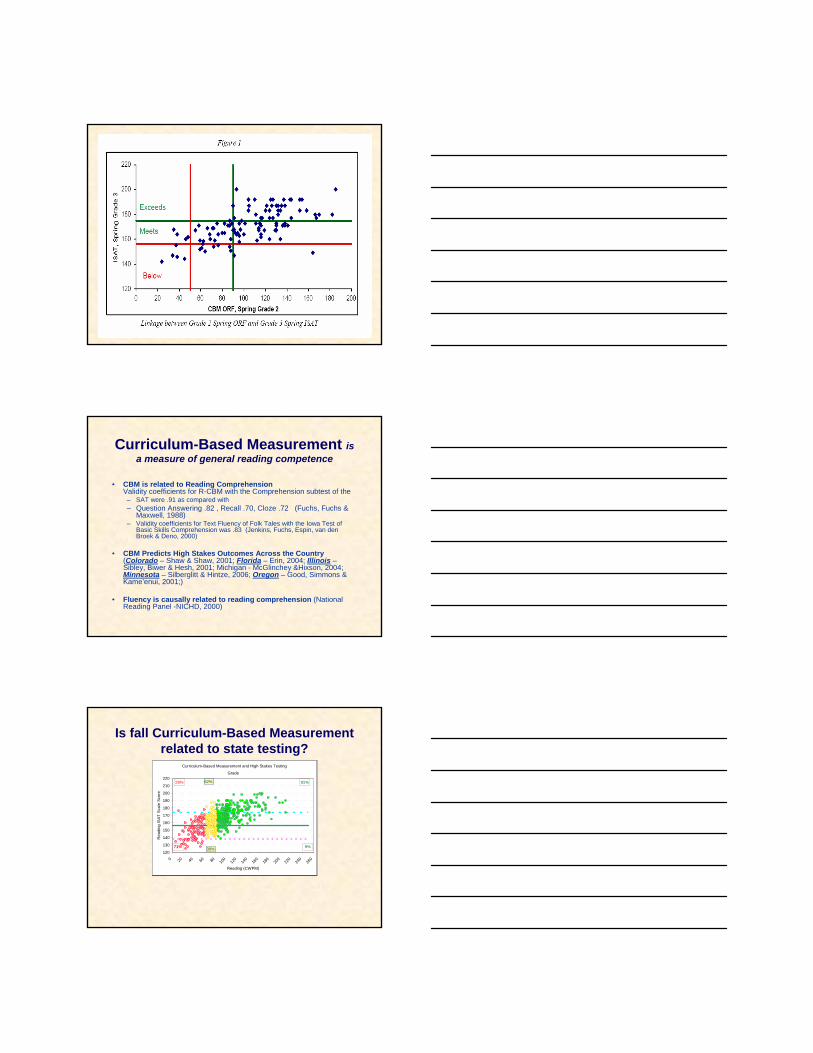
Curriculum-Based Measurement is a measure of general reading competence
• CBM is related to Reading ComprehensionValidity coefficients for R-CBM with the Comprehension subtest of the
– SAT were .91 as compared with – Question Answering .82 , Recall .70, Cloze .72 (Fuchs, Fuchs &
Maxwell, 1988)– Validity coefficients for Text Fluency of Folk Tales with the Iowa Test of
Basic Skills Comprehension was .83 (Jenkins, Fuchs, Espin, van den Broek & Deno, 2000)
• CBM Predicts High Stakes Outcomes Across the Country(Colorado – Shaw & Shaw, 2001; Florida – Erin, 2004; Illinois –Sibley, Biwer & Hesh, 2001; Michigan - McGlinchey &Hixson, 2004; Minnesota – Silberglitt & Hintze, 2006; Oregon – Good, Simmons & Kame’enui, 2001;)
• Fluency is causally related to reading comprehension (National Reading Panel -NICHD, 2000)
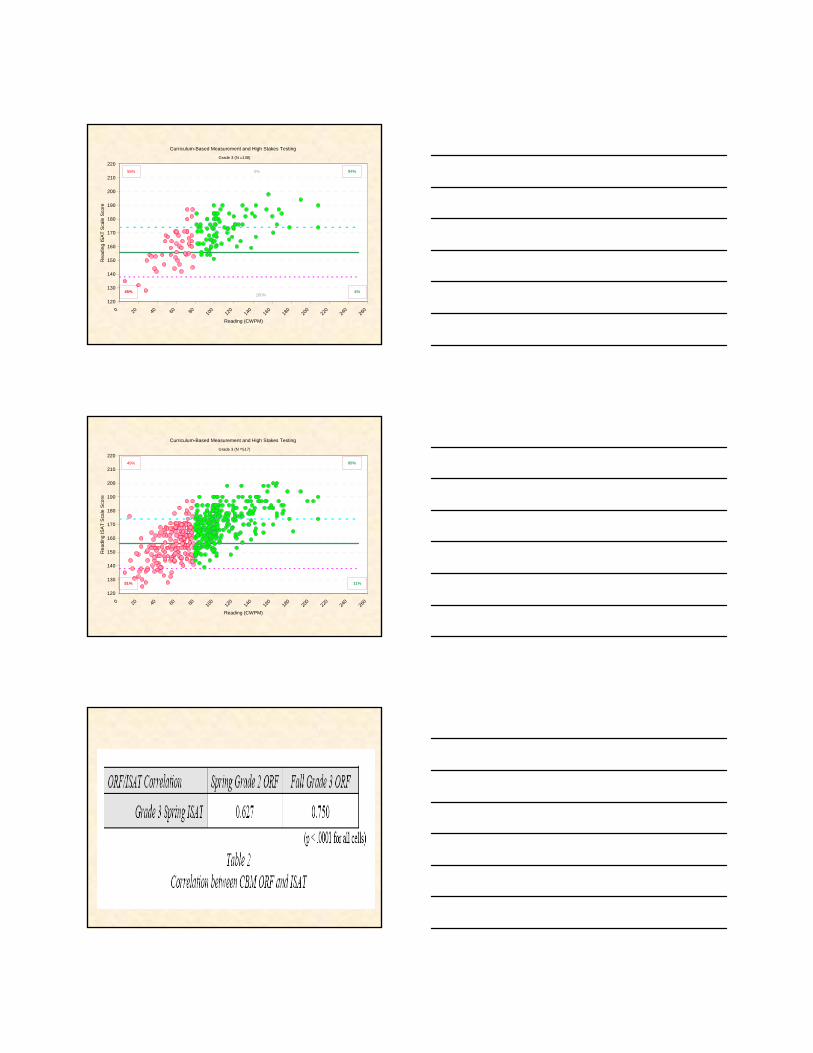
Is fall Curriculum-Based Measurement related to state testing?
Curriculum-Based Measurement and High Stakes Testing
120
130
140
150
160
170
180
190
200
210
220
0 20 40 60 80 100
120
140
160
180
200
220
240
260
Reading (CWPM)
Rea
ding
ISAT
Sca
le S
core
Grade
Curriculum-Based Measurement and High Stakes Testing
120
130
140
150
160
170
180
190
200
210
220
0 20 40 60 80 100
120
140
160
180
200
220
240
260
Reading (CWPM)
Rea
ding
ISAT
Sca
le S
core
46%
54%
90%
10%
Grade
Curriculum-Based Measurement and High Stakes Testing
120
130
140
150
160
170
180
190
200
210
220
0 20 40 60 80 100
120
140
160
180
200
220
240
260
Reading (CWPM)
Rea
ding
ISAT
Sca
le S
core
50%
50%
91%
9%
Grade
Curriculum-Based Measurement and High Stakes Testing
120
130
140
150
160
170
180
190
200
210
220
0 20 40 60 80 100
120
140
160
180
200
220
240
260
Reading (CWPM)
Rea
ding
ISAT
Sca
le S
core
29%
71%
91%
9%
Grade
62%
38%
Big Idea # 1. Scores on CBM are related
to results of high-stakes testing
Question # 2.Is progress as measured by
CBM meaningful?
Progress Over Time
0.00
20.00
40.00
60.00
80.00
100.00
120.00
Time
DIB
ELS
OR
F (W
RC
)
Adeq ProNot Adeq
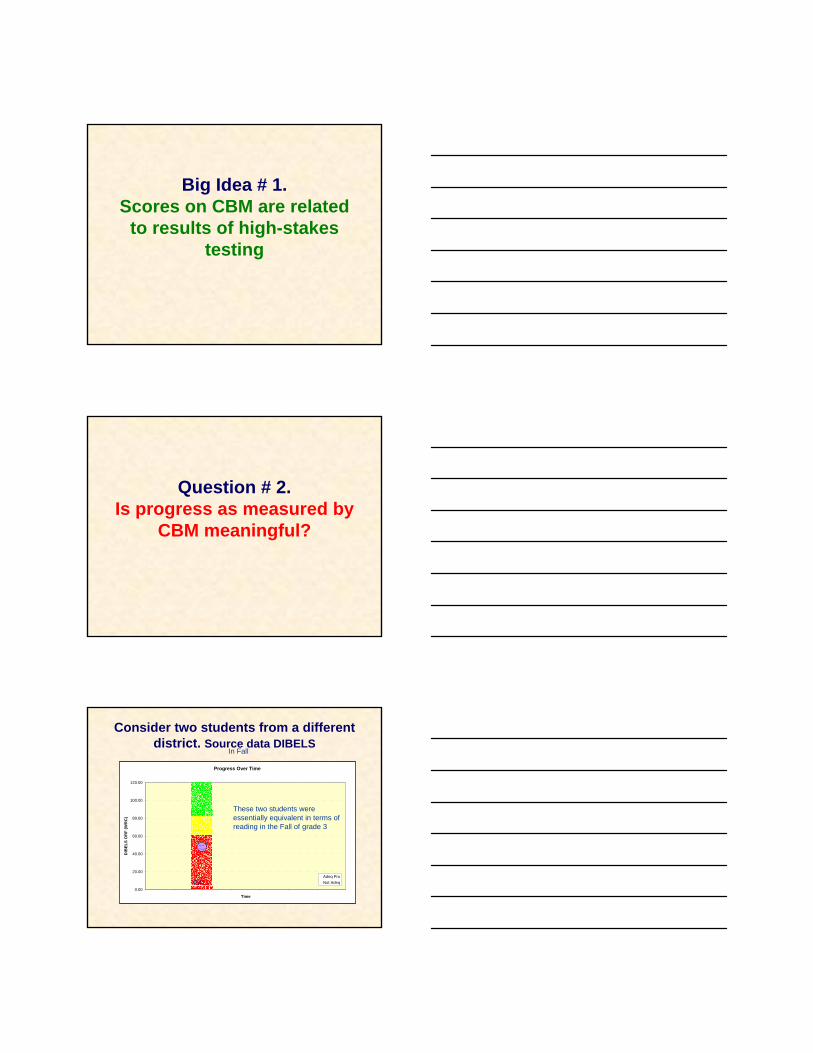
Consider two students from a different district. Source data DIBELS
FALL
In Fall
These two students were essentially equivalent in terms of reading in the Fall of grade 3
Progress Over Time
0.00
20.00
40.00
60.00
80.00
100.00
120.00
Time
DIB
ELS
OR
F (W
RC
)
Adeq ProNot Adeq
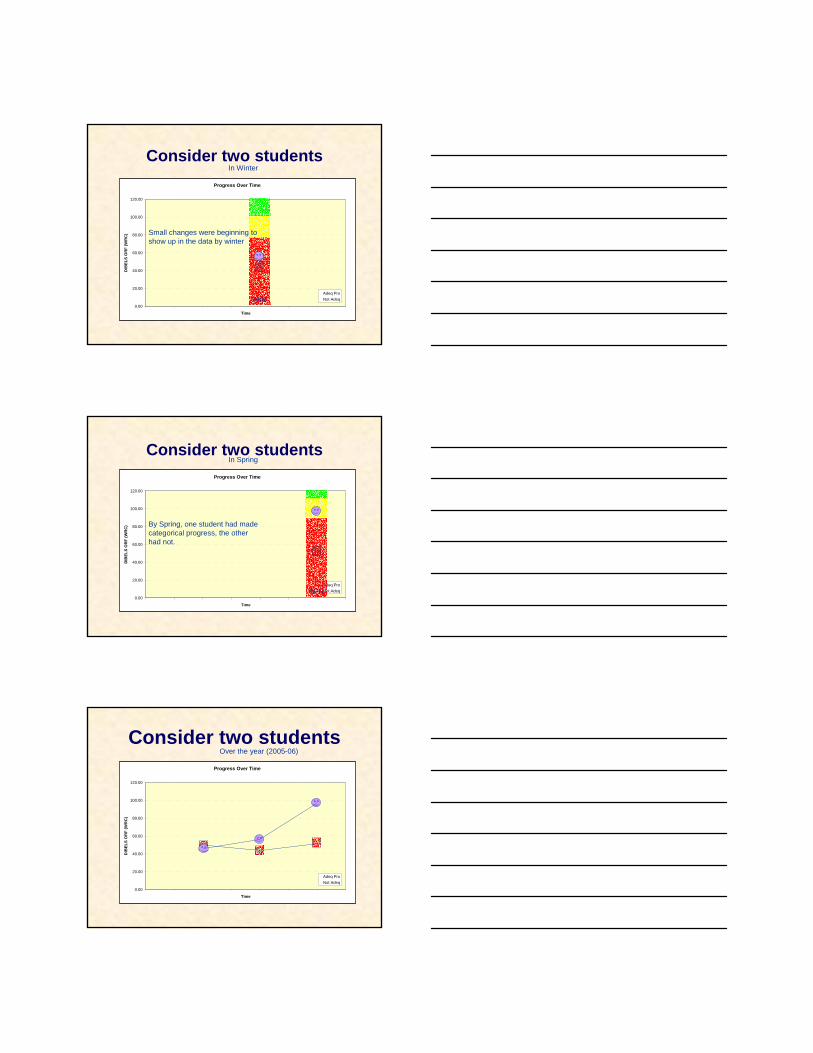
Consider two students
WIN
In Winter
Small changes were beginning to show up in the data by winter
Progress Over Time
0.00
20.00
40.00
60.00
80.00
100.00
120.00
Time
DIB
ELS
OR
F (W
RC
)
Adeq ProNot AdeqSPR
Consider two studentsIn Spring
By Spring, one student had made categorical progress, the other had not.
Progress Over Time
0.00
20.00
40.00
60.00
80.00
100.00
120.00
Time
DIB
ELS
OR
F (W
RC
)
Adeq ProNot Adeq
Consider two studentsOver the year (2005-06)
• Both students began the year Below Basic• In winter one student had not made any
progress, one student had made minimal progress
• By Spring, one student had demonstrated an average gain of 1 word per week, the other demonstrated little gain all year
Consider two studentsOver the year (2005-06)
Adequate
Not Adequate
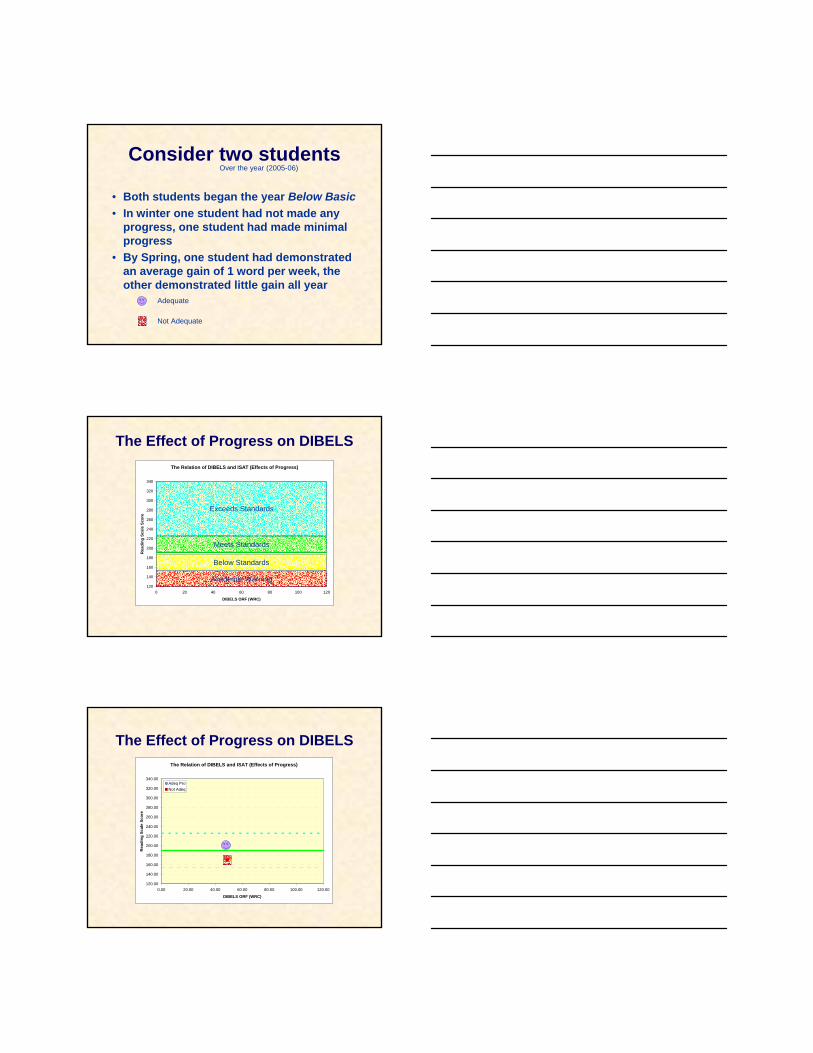
The Effect of Progress on DIBELSThe Relation of DIBELS and ISAT (Effects of Progress)
120
140
160
180
200
220
240
260
280
300
320
340
0 20 40 60 80 100 120
DIBELS ORF (WRC)
Rea
ding
Sca
le S
core
Exceeds Standards
Meets Standards
Below Standards
Academic Warning
The Effect of Progress on DIBELSThe Relation of DIBELS and ISAT (Effects of Progress)
120.00
140.00
160.00
180.00
200.00
220.00
240.00
260.00
280.00
300.00
320.00
340.00
0.00 20.00 40.00 60.00 80.00 100.00 120.00
DIBELS ORF (WRC)
Rea
ding
Sca
le S
core
Adeq ProNot Adeq
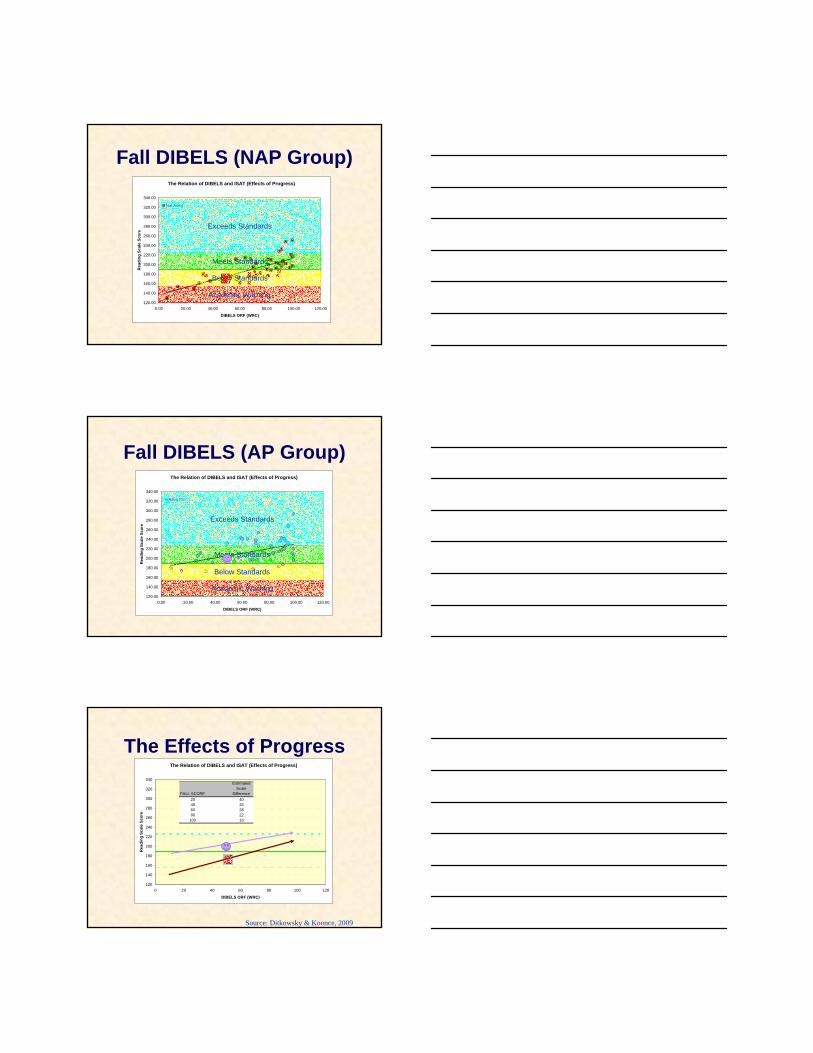
Fall DIBELS (NAP Group)The Relation of DIBELS and ISAT (Effects of Progress)
120.00
140.00
160.00
180.00
200.00
220.00
240.00
260.00
280.00
300.00
320.00
340.00
0.00 20.00 40.00 60.00 80.00 100.00 120.00
DIBELS ORF (WRC)
Rea
ding
Sca
le S
core
Not Adeq
Exceeds Standards
Meets Standards
Below Standards
Academic Warning
Fall DIBELS (AP Group)The Relation of DIBELS and ISAT (Effects of Progress)
120.00
140.00
160.00
180.00
200.00
220.00
240.00
260.00
280.00
300.00
320.00
340.00
0.00 20.00 40.00 60.00 80.00 100.00 120.00
DIBELS ORF (WRC)
Rea
ding
Sca
le S
core
Adeq Pro
Exceeds Standards
Meets Standards
Below Standards
Academic Warning
The Relation of DIBELS and ISAT (Effects of Progress)
120
140
160
180
200
220
240
260
280
300
320
340
0 20 40 60 80 100 120
DIBELS ORF (WRC)
Rea
ding
Sca
le S
core
The Effects of Progress
FALL SCORE
Estimated Scale
Difference20 4040 3460 2880 22
100 16
Source: Ditkowsky & Koonce, 2009
Big Idea #2.Progress on CBM is related to improved outcomes in General reading
Given the same score in Fall, a student who gains an average of 1 word per
week over the course of a year can be expected to score better on high stakes tests, that is, student improvement from
Fall to Spring on DIBELS matters
Cut scores Established: Now what?
• Don’t just use cut score as means of making decision
• Use cut score and Rate of improvement (ROI).
• Rate of improvement is amount of performance increase over time
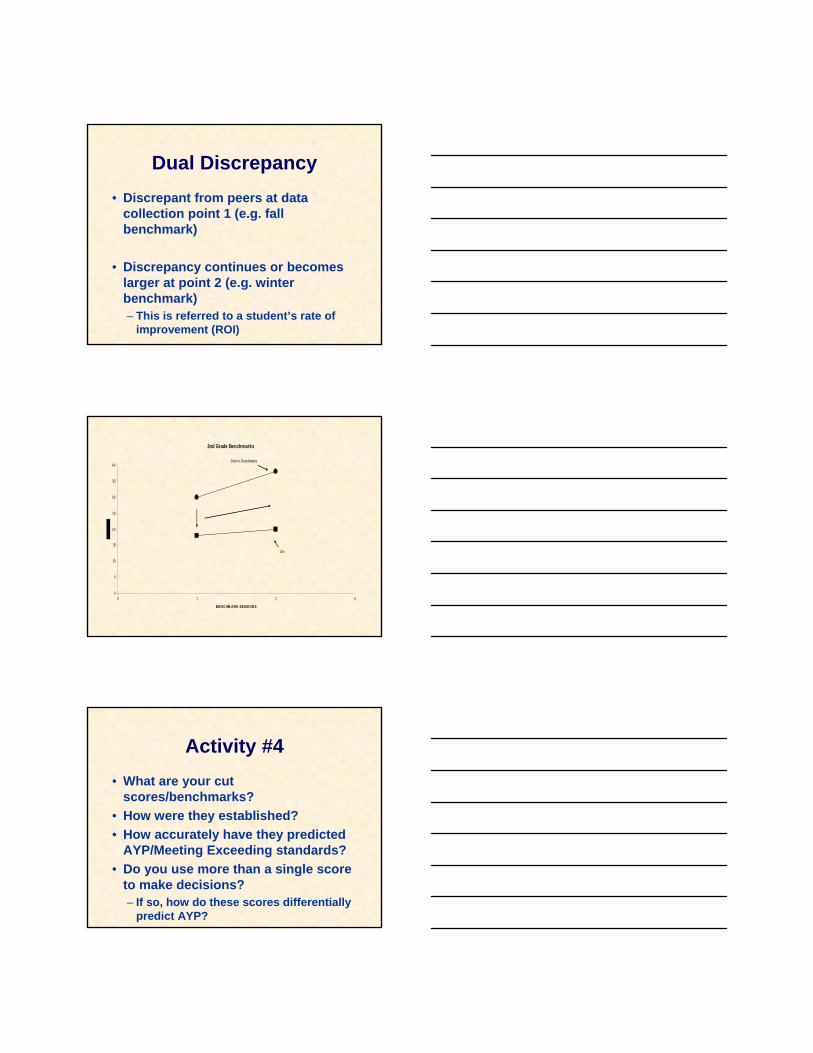
Dual Discrepancy• Discrepant from peers at data
collection point 1 (e.g. fall benchmark)
• Discrepancy continues or becomes larger at point 2 (e.g. winter benchmark)– This is referred to a student’s rate of
improvement (ROI)
2nd Grade Benchmarks
0
5
10
15
20
25
30
35
40
0 1 2 3
B EN C HM A R K SESSION S
Jim
District Benchmarks
Activity #4• What are your cut
scores/benchmarks?• How were they established?• How accurately have they predicted
AYP/Meeting Exceeding standards?• Do you use more than a single score
to make decisions?– If so, how do these scores differentially
predict AYP?
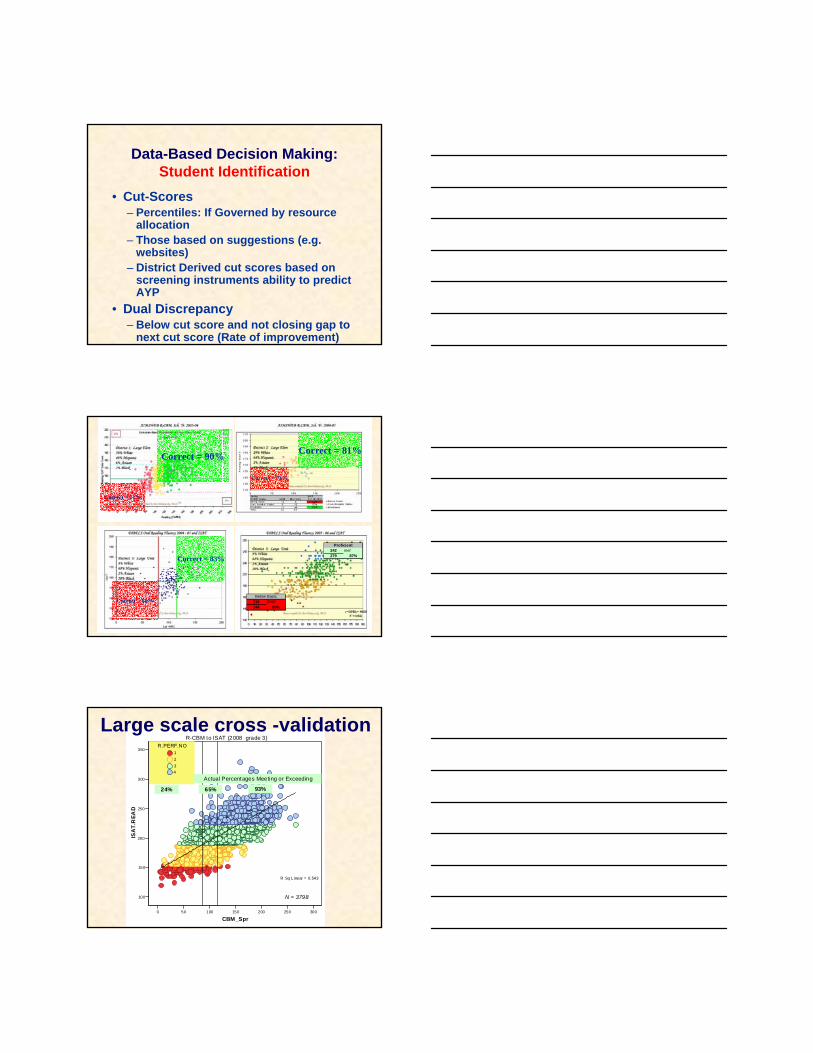
Data-Based Decision Making: Student Identification
• Cut-Scores– Percentiles: If Governed by resource
allocation– Those based on suggestions (e.g.
websites)– District Derived cut scores based on
screening instruments ability to predict AYP
• Dual Discrepancy– Below cut score and not closing gap to
next cut score (Rate of improvement)
Correct = 90% Correct = 81%
Correct = 71%
Correct = 71%
Correct = 83%
Correct = 88% 115 DNM144 80%
Below Basic
242 met279 87%
Proficient
0 50 100 150 200 250 300
CBM_Spr
100
150
200
250
300
350
ISA
T.R
EAD
R.PERF.NO1234
R-CBM to ISAT (2008 grade 3)
R Sq Linear = 0.543
24% 65% 93%
Actual Percentages Meeting or Exceeding
N = 3798
Large scale cross -validation
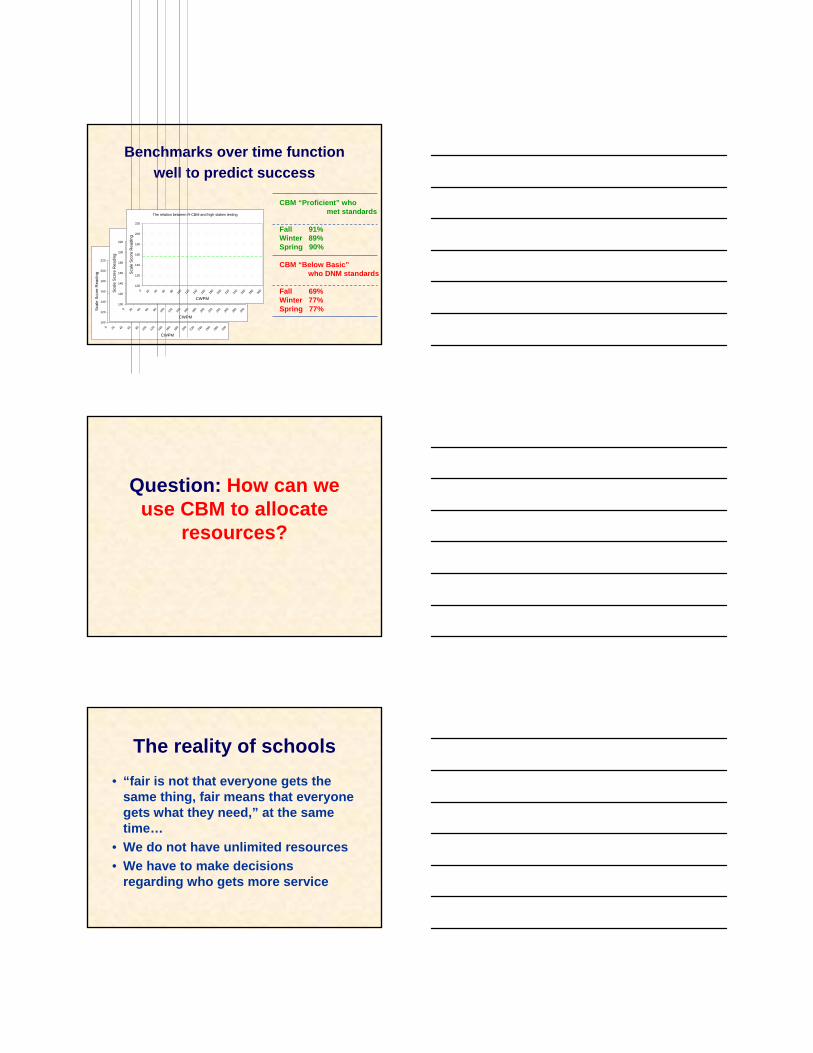
Benchmarks over time function well to predict success
The relation between R-CBM and high stakes testing
100
120
140
160
180
200
220
0 20 40 60 80 100
120
140
160
180
200
220
240
260
280
300
CWPM
Sca
le S
core
Rea
ding
The relation between R-CBM and high stakes testing
100
120
140
160
180
200
220
0 20 40 60 80 100
120
140
160
180
200
220
240
260
280
300
CWPM
Sca
le S
core
Rea
ding
The relation between R-CBM and high stakes testing
100
120
140
160
180
200
220
0 20 40 60 80 100
120
140
160
180
200
220
240
260
280
300
CWPM
Sca
le S
core
Rea
ding
CBM “Proficient” who met standards
Fall 91%Winter 89%Spring 90%
CBM “Below Basic”who DNM standards
Fall 69%Winter 77%Spring 77%
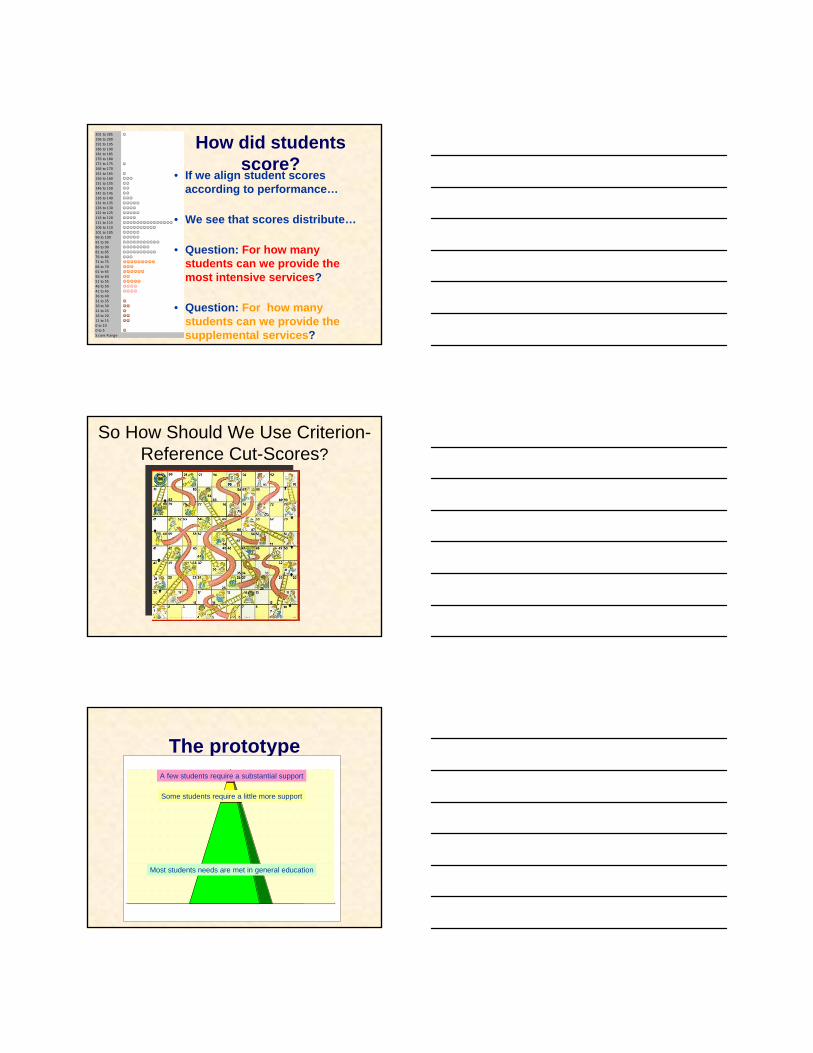
Question: How can we use CBM to allocate
resources?
The reality of schools• “fair is not that everyone gets the
same thing, fair means that everyone gets what they need,” at the same time…
• We do not have unlimited resources• We have to make decisions
regarding who gets more service
201 to 205 ☺196 to 200191 to 195186 to 190181 to 185176 to 180171 to 175 ☺166 to 170161 to 165 ☺156 to 160 ☺☺☺151 to 155 ☺☺146 to 150 ☺☺141 to 145 ☺☺136 to 140 ☺☺☺131 to 135 ☺☺☺☺☺126 to 130 ☺☺☺☺121 to 125 ☺☺☺☺☺116 to 120 ☺☺☺☺111 to 115 ☺☺☺☺☺☺☺☺☺☺☺☺☺☺☺106 to 110 ☺☺☺☺☺☺☺☺☺☺101 to 105 ☺☺☺☺☺96 to 100 ☺☺☺☺☺91 to 95 ☺☺☺☺☺☺☺☺☺☺☺86 to 90 ☺☺☺☺☺☺☺☺81 to 85 ☺☺☺☺☺☺☺☺☺☺76 to 80 ☺☺☺71 to 75 ☺☺☺☺☺☺☺☺☺66 to 70 ☺☺☺61 to 65 ☺☺☺☺☺☺56 to 60 ☺☺51 to 55 ☺☺☺☺☺46 to 50 ☺☺☺☺41 to 45 ☺☺☺☺36 to 4031 to 35 ☺26 to 30 ☺☺21 to 25 ☺16 to 20 ☺☺11 to 15 ☺☺6 to 100 to 5 ☺S core R ange
201 to 205 ☺196 to 200191 to 195186 to 190181 to 185176 to 180171 to 175 ☺166 to 170161 to 165 ☺156 to 160 ☺☺☺151 to 155 ☺☺146 to 150 ☺☺141 to 145 ☺☺136 to 140 ☺☺☺131 to 135 ☺☺☺☺☺126 to 130 ☺☺☺☺121 to 125 ☺☺☺☺☺116 to 120 ☺☺☺☺111 to 115 ☺☺☺☺☺☺☺☺☺☺☺☺☺☺☺106 to 110 ☺☺☺☺☺☺☺☺☺☺101 to 105 ☺☺☺☺☺96 to 100 ☺☺☺☺☺91 to 95 ☺☺☺☺☺☺☺☺☺☺☺86 to 90 ☺☺☺☺☺☺☺☺81 to 85 ☺☺☺☺☺☺☺☺☺☺76 to 80 ☺☺☺71 to 75 ☺☺☺☺☺☺☺☺☺66 to 70 ☺☺☺61 to 65 ☺☺☺☺☺☺56 to 60 ☺☺51 to 55 ☺☺☺☺☺46 to 50 ☺☺☺☺41 to 45 ☺☺☺☺36 to 4031 to 35 ☺26 to 30 ☺☺21 to 25 ☺16 to 20 ☺☺11 to 15 ☺☺6 to 100 to 5 ☺S core R ange
201 to 205 ☺196 to 200191 to 195186 to 190181 to 185176 to 180171 to 175 ☺166 to 170161 to 165 ☺156 to 160 ☺☺☺151 to 155 ☺☺146 to 150 ☺☺141 to 145 ☺☺136 to 140 ☺☺☺131 to 135 ☺☺☺☺☺126 to 130 ☺☺☺☺121 to 125 ☺☺☺☺☺116 to 120 ☺☺☺☺111 to 115 ☺☺☺☺☺☺☺☺☺☺☺☺☺☺☺106 to 110 ☺☺☺☺☺☺☺☺☺☺101 to 105 ☺☺☺☺☺96 to 100 ☺☺☺☺☺91 to 95 ☺☺☺☺☺☺☺☺☺☺☺86 to 90 ☺☺☺☺☺☺☺☺81 to 85 ☺☺☺☺☺☺☺☺☺☺76 to 80 ☺☺☺71 to 75 ☺☺☺☺☺☺☺☺☺66 to 70 ☺☺☺61 to 65 ☺☺☺☺☺☺56 to 60 ☺☺51 to 55 ☺☺☺☺☺46 to 50 ☺☺☺☺41 to 45 ☺☺☺☺36 to 4031 to 35 ☺26 to 30 ☺☺21 to 25 ☺16 to 20 ☺☺11 to 15 ☺☺6 to 100 to 5 ☺S core R ange
201 to 205 ☺196 to 200191 to 195186 to 190181 to 185176 to 180171 to 175 ☺166 to 170161 to 165 ☺156 to 160 ☺☺☺151 to 155 ☺☺146 to 150 ☺☺141 to 145 ☺☺136 to 140 ☺☺☺131 to 135 ☺☺☺☺☺126 to 130 ☺☺☺☺121 to 125 ☺☺☺☺☺116 to 120 ☺☺☺☺111 to 115 ☺☺☺☺☺☺☺☺☺☺☺☺☺☺☺106 to 110 ☺☺☺☺☺☺☺☺☺☺101 to 105 ☺☺☺☺☺96 to 100 ☺☺☺☺☺91 to 95 ☺☺☺☺☺☺☺☺☺☺☺86 to 90 ☺☺☺☺☺☺☺☺81 to 85 ☺☺☺☺☺☺☺☺☺☺76 to 80 ☺☺☺71 to 75 ☺☺☺☺☺☺☺☺☺66 to 70 ☺☺☺61 to 65 ☺☺☺☺☺☺56 to 60 ☺☺51 to 55 ☺☺☺☺☺46 to 50 ☺☺☺☺41 to 45 ☺☺☺☺36 to 4031 to 35 ☺26 to 30 ☺☺21 to 25 ☺16 to 20 ☺☺11 to 15 ☺☺6 to 100 to 5 ☺S core R ange
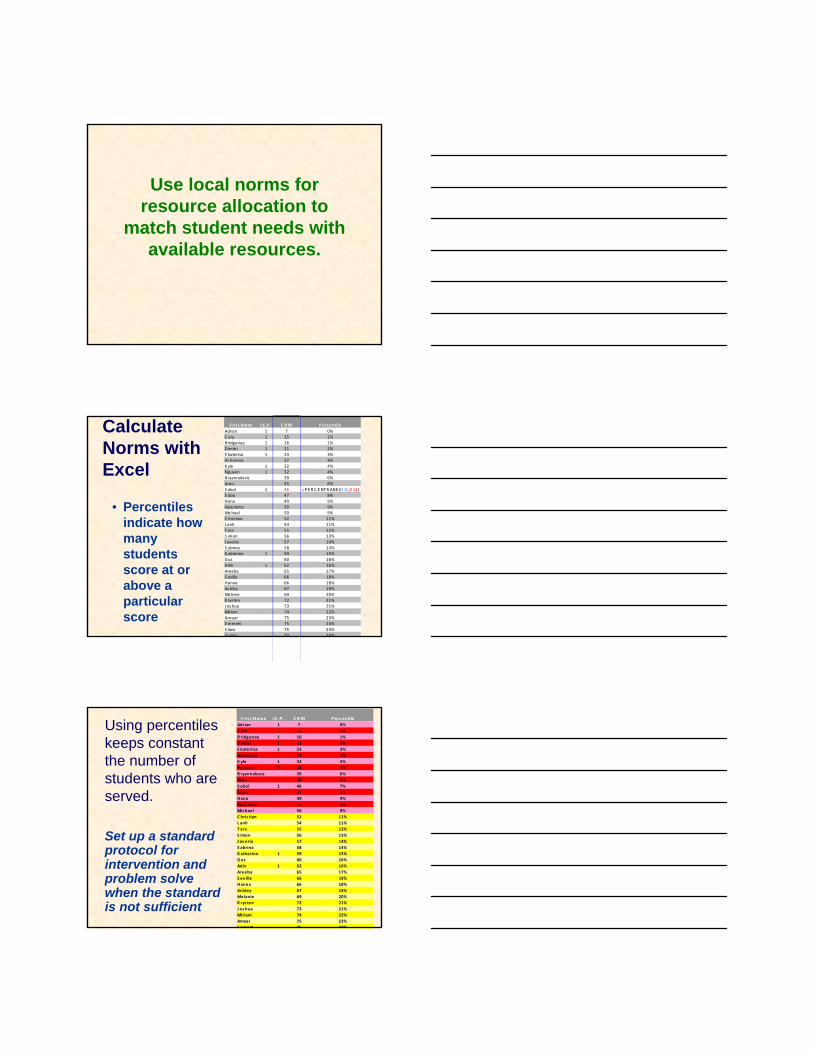
How did students score?
• If we align student scores according to performance…
• We see that scores distribute…
• Question: For how many students can we provide the most intensive services?
• Question: For how many students can we provide the supplemental services?
So How Should We Use Criterion-Reference Cut-Scores?
The prototype
Most students needs are met in general education
Some students require a little more support
A few students require a substantial support
Use local norms for resource allocation to
match student needs with available resources.
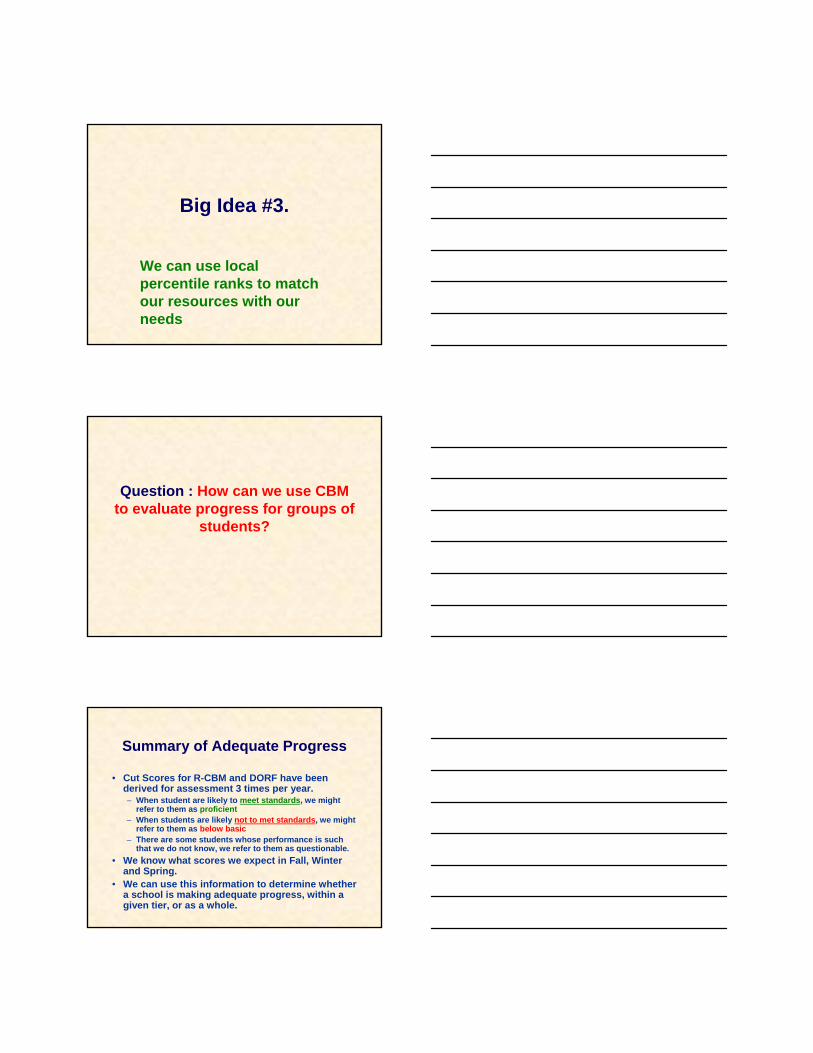
Calculate Norms with Excel
• Percentiles indicate how many students score at or above a particular score
F irs t Name I.E .P . C BM PercentileAdrian 1 7 0%C ory 1 15 1%Bridganae 1 16 1%Dimitri 1 21 2%E katerina 1 23 3%Ashorena 27 4%Kyle 1 32 4%Nguyen 1 32 4%Bryannalexis 39 6%Aron 45 6%S okol 1 46 =P E R C ENTR ANK (D:D ,D12)S aba 47 8%Hana 49 9%Apos tolos 50 9%Michael 50 9%C hris tian 52 11%Lanh 54 11%Tara 55 12%S imon 56 13%Javeria 57 14%S abrina 58 14%Katherine 1 59 15%Gus 60 16%Adin 1 62 16%Areeba 65 17%S eville 66 18%Hanna 66 18%Ashley 67 19%Melanie 69 20%K rys ten 72 21%Jos hua 73 21%Miriam 74 22%Amaar 75 23%Emmett 75 23%S liwa 75 23%Zunair 77 25%
Using percentiles keeps constant the number of students who are served.
Set up a standard protocol for intervention and problem solve when the standard is not sufficient
F irs t Name I.E .P . C BM PercentileAdrian 1 7 0%C ory 1 15 1%B ridganae 1 16 1%Dimitri 1 21 2%E katerina 1 23 3%Ashorena 27 4%K yle 1 32 4%Nguyen 1 32 4%B ryannalexis 39 6%Aron 45 6%S okol 1 46 7%S aba 47 8%Hana 49 9%Apos tolos 50 9%Michael 50 9%C hris tian 52 11%L anh 54 11%T ara 55 12%S imon 56 13%J averia 57 14%S abrina 58 14%K atherine 1 59 15%Gus 60 16%Adin 1 62 16%Areeba 65 17%S ev ille 66 18%Hanna 66 18%Ashley 67 19%Melanie 69 20%K rys ten 72 21%J oshua 73 21%Miriam 74 22%Amaar 75 23%Emmett 75 23%
Big Idea #3.
We can use local percentile ranks to match our resources with our needs
Question : How can we use CBM to evaluate progress for groups of
students?
Summary of Adequate Progress
• Cut Scores for R-CBM and DORF have been derived for assessment 3 times per year.– When student are likely to meet standards, we might
refer to them as proficient– When students are likely not to met standards, we might
refer to them as below basic– There are some students whose performance is such
that we do not know, we refer to them as questionable.• We know what scores we expect in Fall, Winter
and Spring.• We can use this information to determine whether
a school is making adequate progress, within a given tier, or as a whole.
0.00
0.10
0.20
0.30
0.40
0.50
0.60
0.70
0.80
0.90
1.00
0 20 40 60 80 100 120 140 160 180 200 220 240 2600.00
0.10
0.20
0.30
0.40
0.50
0.60
0.70
0.80
0.90
1.00
0 20 40 60 80 100 120 140 160 180 200 220 240 2600.00
0.10
0.20
0.30
0.40
0.50
0.60
0.70
0.80
0.90
1.00
0 20 40 60 80 100 120 140 160 180 200 220 240 260
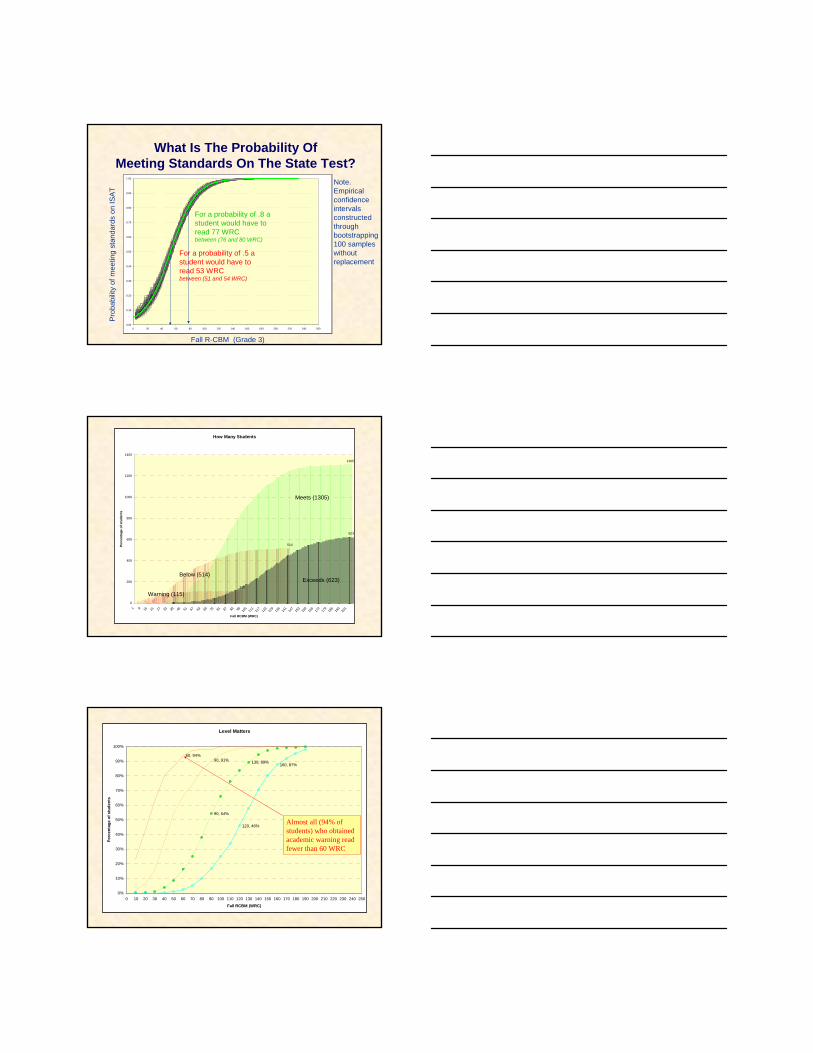
What Is The Probability Of Meeting Standards On The State Test?
Fall R-CBM (Grade 3)
Prob
abili
ty o
f mee
ting
stan
dard
s on
ISAT
For a probability of .5 a student would have to read 53 WRC between (51 and 54 WRC)
For a probability of .8 a student would have to read 77 WRC between (76 and 80 WRC)
Note. Empirical confidence intervals constructed through bootstrapping 100 samples without replacement
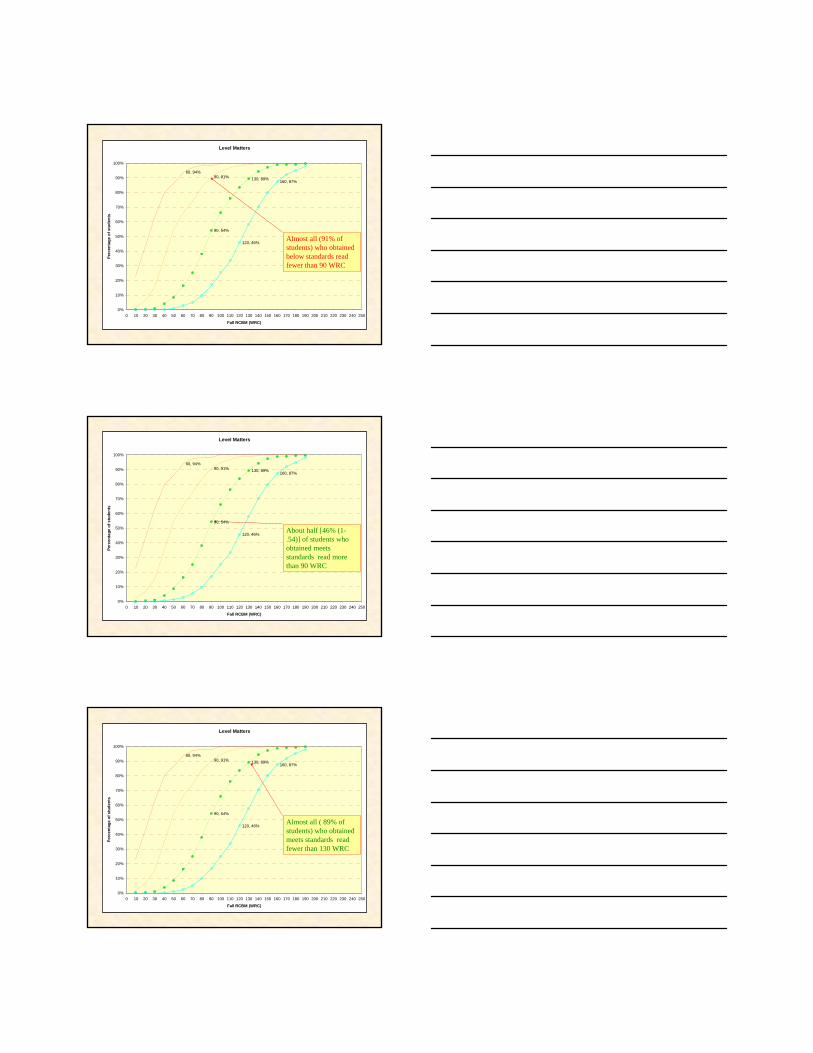
How Many Students
115
514
1305
623
0
200
400
600
800
1000
1200
1400
1 9 15 21 27 33 39 45 51 57 63 69 75 81 87 93 99 105
111
117
123
129
135
141
147
153
159
165
172
179
185
193
201
Fall RCBM (WRC)
Perc
enta
ge o
f stu
dent
s
Meets (1305)
Exceeds (623)Below (514)
Warning (115)
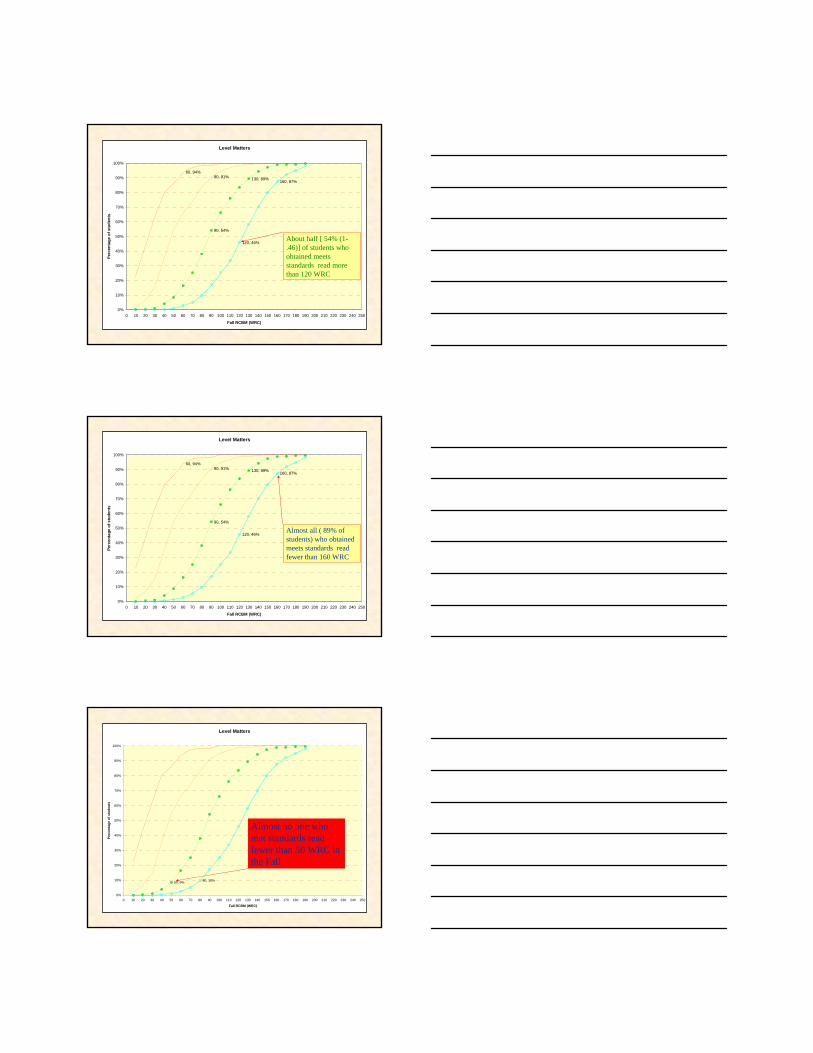
Level Matters
60, 94%90, 91%
90, 54%
130, 89%
120, 46%
160, 87%
0%
10%
20%
30%
40%
50%
60%
70%
80%
90%
100%
0 10 20 30 40 50 60 70 80 90 100 110 120 130 140 150 160 170 180 190 200 210 220 230 240 250
Fall RCBM (WRC)
Perc
enta
ge o
f stu
dent
s
Almost all (94% of students) who obtained academic warning read fewer than 60 WRC
Level Matters
60, 94%90, 91%
90, 54%
130, 89%
120, 46%
160, 87%
0%
10%
20%
30%
40%
50%
60%
70%
80%
90%
100%
0 10 20 30 40 50 60 70 80 90 100 110 120 130 140 150 160 170 180 190 200 210 220 230 240 250
Fall RCBM (WRC)
Perc
enta
ge o
f stu
dent
s
Almost all (91% of students) who obtained below standards read fewer than 90 WRC
Level Matters
60, 94%90, 91%
90, 54%
130, 89%
120, 46%
160, 87%
0%
10%
20%
30%
40%
50%
60%
70%
80%
90%
100%
0 10 20 30 40 50 60 70 80 90 100 110 120 130 140 150 160 170 180 190 200 210 220 230 240 250
Fall RCBM (WRC)
Perc
enta
ge o
f stu
dent
s
About half [46% (1-.54)] of students who obtained meets standards read more than 90 WRC
Level Matters
60, 94%90, 91%
90, 54%
130, 89%
120, 46%
160, 87%
0%
10%
20%
30%
40%
50%
60%
70%
80%
90%
100%
0 10 20 30 40 50 60 70 80 90 100 110 120 130 140 150 160 170 180 190 200 210 220 230 240 250
Fall RCBM (WRC)
Perc
enta
ge o
f stu
dent
s
Almost all ( 89% of students) who obtained meets standards read fewer than 130 WRC
Level Matters
60, 94%90, 91%
90, 54%
130, 89%
120, 46%
160, 87%
0%
10%
20%
30%
40%
50%
60%
70%
80%
90%
100%
0 10 20 30 40 50 60 70 80 90 100 110 120 130 140 150 160 170 180 190 200 210 220 230 240 250
Fall RCBM (WRC)
Perc
enta
ge o
f stu
dent
s
About half [ 54% (1-.46)] of students who obtained meets standards read more than 120 WRC
Level Matters
60, 94%90, 91%
90, 54%
130, 89%
120, 46%
160, 87%
0%
10%
20%
30%
40%
50%
60%
70%
80%
90%
100%
0 10 20 30 40 50 60 70 80 90 100 110 120 130 140 150 160 170 180 190 200 210 220 230 240 250
Fall RCBM (WRC)
Perc
enta
ge o
f stu
dent
s
Almost all ( 89% of students) who obtained meets standards read fewer than 160 WRC
Level Matters
50, 9% 80, 10%
0%
10%
20%
30%
40%
50%
60%
70%
80%
90%
100%
0 10 20 30 40 50 60 70 80 90 100 110 120 130 140 150 160 170 180 190 200 210 220 230 240 250
Fall RCBM (WRC)
Perc
enta
ge o
f stu
dent
s
Almost no one who met standards read fewer than 50 WRC in the Fall
Level Matters
50, 9% 80, 10%
0%
10%
20%
30%
40%
50%
60%
70%
80%
90%
100%
0 10 20 30 40 50 60 70 80 90 100 110 120 130 140 150 160 170 180 190 200 210 220 230 240 250
Fall RCBM (WRC)
Perc
enta
ge o
f stu
dent
s
Almost no one who exceeded standards read fewer than 80 WRC in the Fall
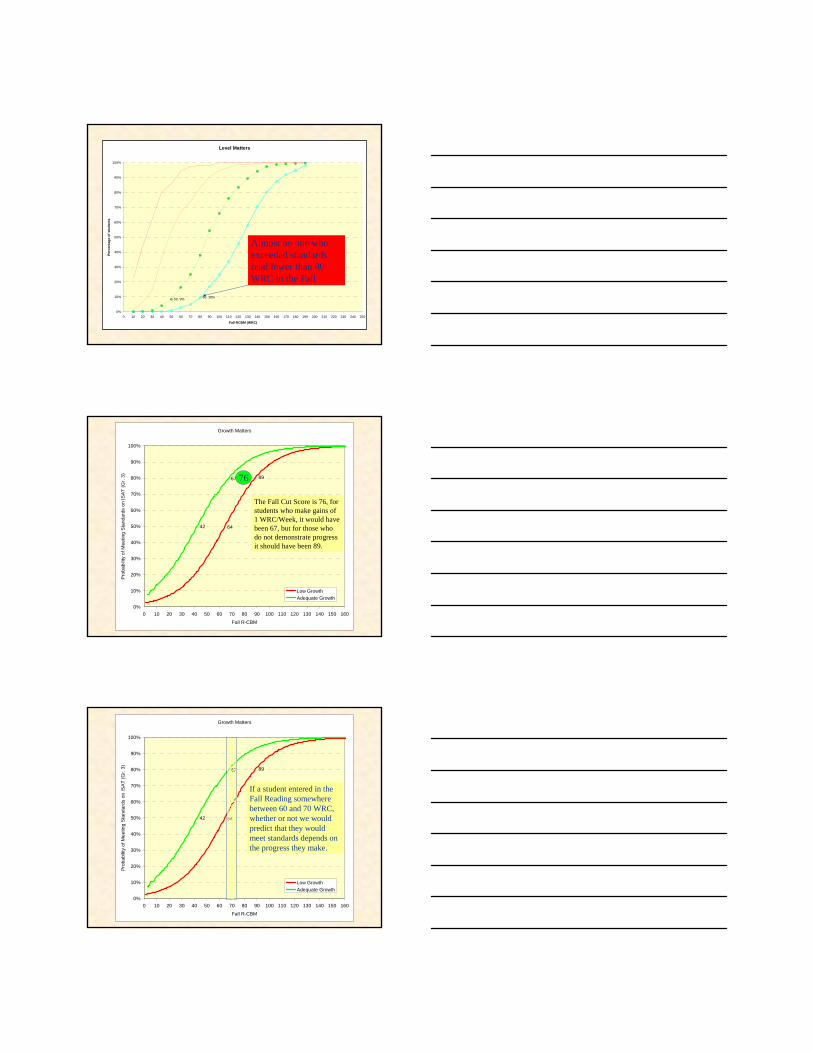
Growth Matters
89
64
67
42
0%
10%
20%
30%
40%
50%
60%
70%
80%
90%
100%
0 10 20 30 40 50 60 70 80 90 100 110 120 130 140 150 160
Fall R-CBM
Prob
abilit
y of
Mee
ting
Stan
dard
s on
ISA
T (G
r. 3)
Low Growth Adequate Growth
76
The Fall Cut Score is 76, for students who make gains of 1 WRC/Week, it would have been 67, but for those who do not demonstrate progress it should have been 89.
The Fall Cut Score is 76, for students who make gains of 1 WRC/Week, it would have been 67, but for those who do not demonstrate progress it should have been 89.
The Fall Cut Score is 76, for students who make gains of 1 WRC/Week, it would have been 67, but for those who do not demonstrate progress it should have been 89.
The Fall Cut Score is 76, for students who make gains of 1 WRC/Week, it would have been 67, but for those who do not demonstrate progress it should have been 89.
Growth Matters
89
64
67
42
0%
10%
20%
30%
40%
50%
60%
70%
80%
90%
100%
0 10 20 30 40 50 60 70 80 90 100 110 120 130 140 150 160
Fall R-CBM
Prob
abilit
y of
Mee
ting
Stan
dard
s on
ISAT
(Gr.
3)
Low Growth Adequate Growth
If a student entered in the Fall Reading somewhere between 60 and 70 WRC, whether or not we would predict that they would meet standards depends on the progress they make.

Grade MeasureFall
Below BasicFall
ProficientWinter
Below BasicWinter
ProficientSpring
Below BasicSpring
Proficient
K LNF* 2 8 15 27 29 40LSF 3 13 15 30 25 40ISF* 4 8 10 25 - -PSF* - - 7 18 10 35NWF* - - 5 20 15 25
1 LSF 20 35 - - - -NWF* 15 25 30 50 - -R-CBM 0 20 20 40 40 60MAZE x x 2 6 5 10
2 R-CBM 30 45 55 65 70 90MAZE 2 4 5 10 8 15
3 R-CBM 51 76 72 97 87 114MAZE 5 10 10 17 15 22
4 R-CBM 71 97 87 113 98 126MAZE 7 11 13 18 15 20
5 R-CBM 80 106 94 121 110 138MAZE 11 17 16 23 21 28
Cut-Scores For Proficiency
Note. Cut scores for grades 3-5 revised based on 2008 ISAT data
R-CBM BB QS PS Pct Meet BB QS PSFall Grade 3 50 55 462 .66 77% 27% 68% 91%Winter Grade 3 80 90 470 .70 78% 31% 74% 91%Spring Grade 3 95 115 451 .68 77% 31% 76% 91%
Fall Grade 5 95 130 527 .62 72% 28% 63% 91%Winter Grade 5 105 145 544 .60 71% 30% 59% 89%Spring Grade 5 130 160 532 .61 71% 33% 63% 89%
Fall Grade 8 120 155 702 .62 77% 34% 66% 92%Winter Grade 8 125 165 695 .58 77% 31% 67% 91%Spring Grade 8 138 175 708 .62 77% 31% 64% 92%
Example - actual percentages meeting standards
Reading Progress & Reading Trajectory
Progress over time is determined based on the the pattern formed by repeated measurements of oral reading fluency with grade level material.
This general pattern of progress over time is called a Reading Trajectory.
Trajectory • Once children can
read, Reading Fluency is a critical measure of “Academic Wellness”
• Growth in Reading is measurable.
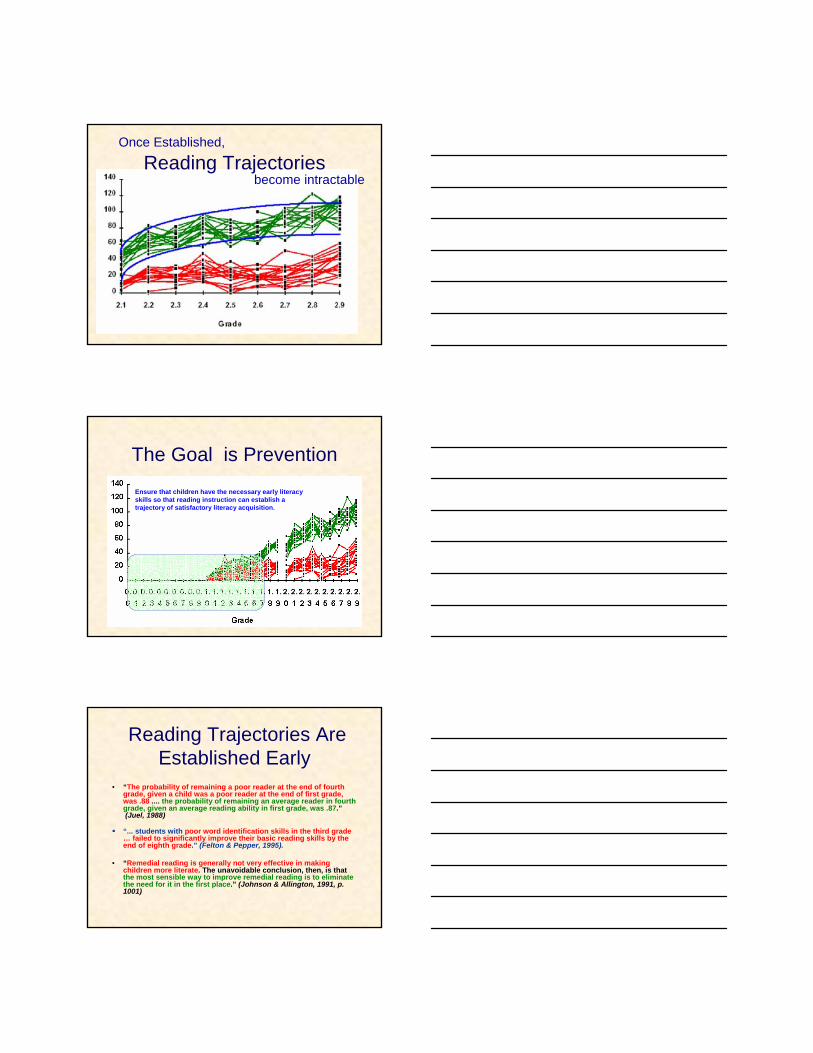
Cross-Sectional Growth Expectations
0
25
50
75
100
125
150
175
200
225
250
1 Fall
1 Winte
r
1 Sprin
g2 F
all
2 Winte
r
2 Sprin
g3 F
all
3 Winte
r
3 Sprin
g4 F
all
4 Winte
r
4 Sprin
g5 F
all
5 Winte
r
5 Sprin
g6 F
all
6 Winte
r
6 Sprin
g7 F
all
7 Winte
r
7 Sprin
g8 F
all
8 Winte
r
8 Sprin
g
Time
Cor
rect
Wor
ds R
ead
per M
inut
e
Data from http://edformation.com/ - Norms represent between 3500 to 10,000 students per grade
Cross-Sectional Growth Expectations
0
25
50
75
100
125
150
175
200
225
250
1 Fall
1 Wint
er
1 Spri
ng2 F
all
2 Wint
er
2 Spri
ng3 F
all
3 Wint
er
3 Spri
ng4 F
all
4 Wint
er
4 Spri
ng5 F
all
5 Wint
er
5 Spri
ng6 F
all
6 Wint
er
6 Spri
ng7 F
all
7 Wint
er
7 Spri
ng8 F
all
8 Wint
er
8 Spri
ng
Time
Cor
rect
Wor
ds R
ead
per M
inut
e
Typical growth in Reading
Grade 140
-
70
Grade 280
-
115
Grade 3100
-
130
Grade 4125
-
150
Grade 5140
-
170
How many words read correctly is that?
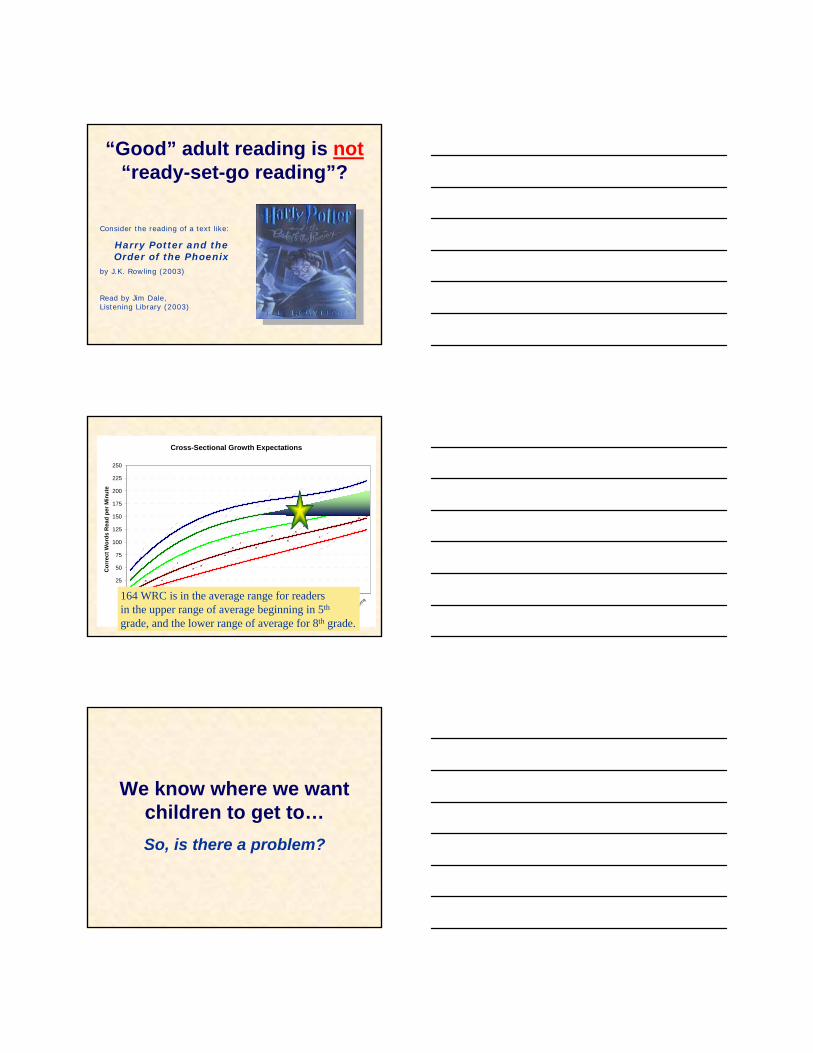
“Good” adult reading is not“ready-set-go reading”?
Consider the reading of a text like:
Harry Potter and the Order of the Phoenix
by J.K. Rowling (2003)
Read by Jim Dale, Listening Library (2003)
Cross-Sectional Growth Expectations
0
25
50
75
100
125
150
175
200
225
250
1 Fall
1 Wint
er
1 Spri
ng2 F
all
2 Wint
er
2 Spri
ng3 F
all
3 Wint
er
3 Spri
ng4 F
all
4 Wint
er
4 Spri
ng5 F
all
5 Wint
er
5 Spri
ng6 F
all
6 Wint
er
6 Spri
ng7 F
all
7 Wint
er
7 Spri
ng8 F
all
8 Wint
er
8 Spri
ng
Time
Cor
rect
Wor
ds R
ead
per M
inut
e
164 WRC is in the average range for readers in the upper range of average beginning in 5th
grade, and the lower range of average for 8th grade.
We know where we want children to get to…So, is there a problem?
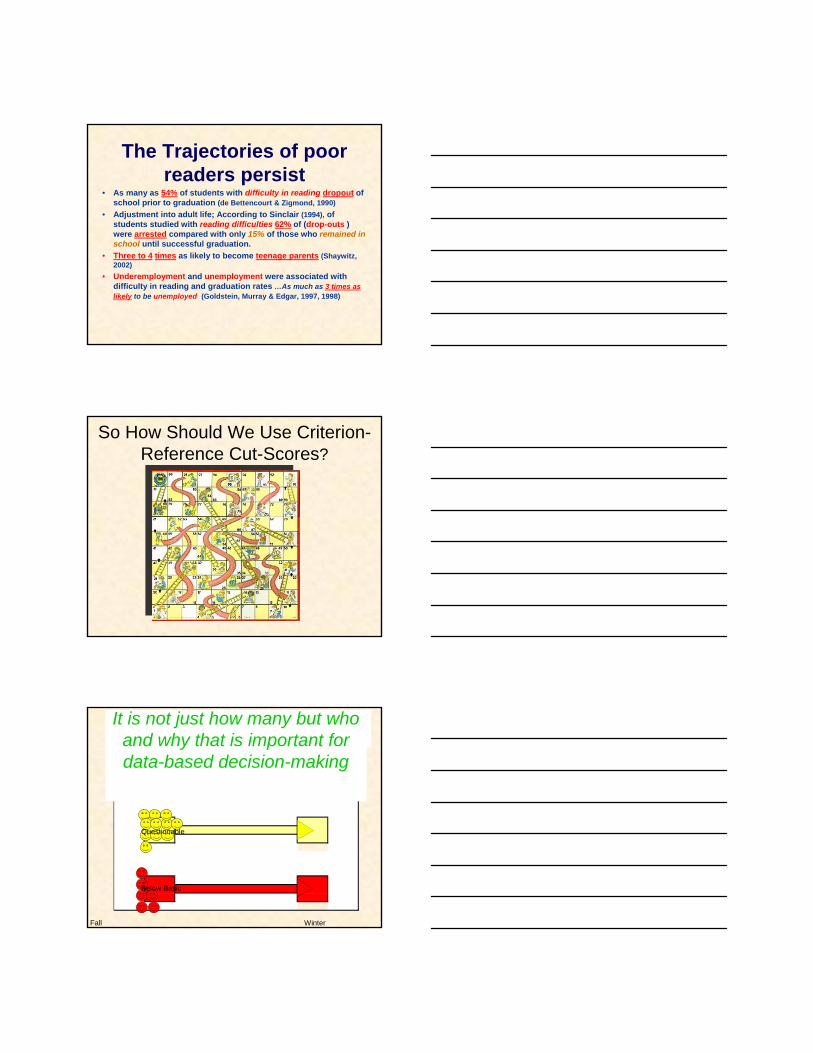
Reading TrajectoriesOnce Established,
become intractable
The Goal is Prevention
Ensure that children have the necessary early literacy skills so that reading instruction can establish a trajectory of satisfactory literacy acquisition.
Reading Trajectories Are Established Early
• “The probability of remaining a poor reader at the end of fourth grade, given a child was a poor reader at the end of first grade, was .88 .... the probability of remaining an average reader in fourth grade, given an average reading ability in first grade, was .87.”(Juel, 1988)
“... students with poor word identification skills in the third grade … failed to significantly improve their basic reading skills by the end of eighth grade.” (Felton & Pepper, 1995).
• “Remedial reading is generally not very effective in making children more literate. The unavoidable conclusion, then, is that the most sensible way to improve remedial reading is to eliminate the need for it in the first place.” (Johnson & Allington, 1991, p. 1001)
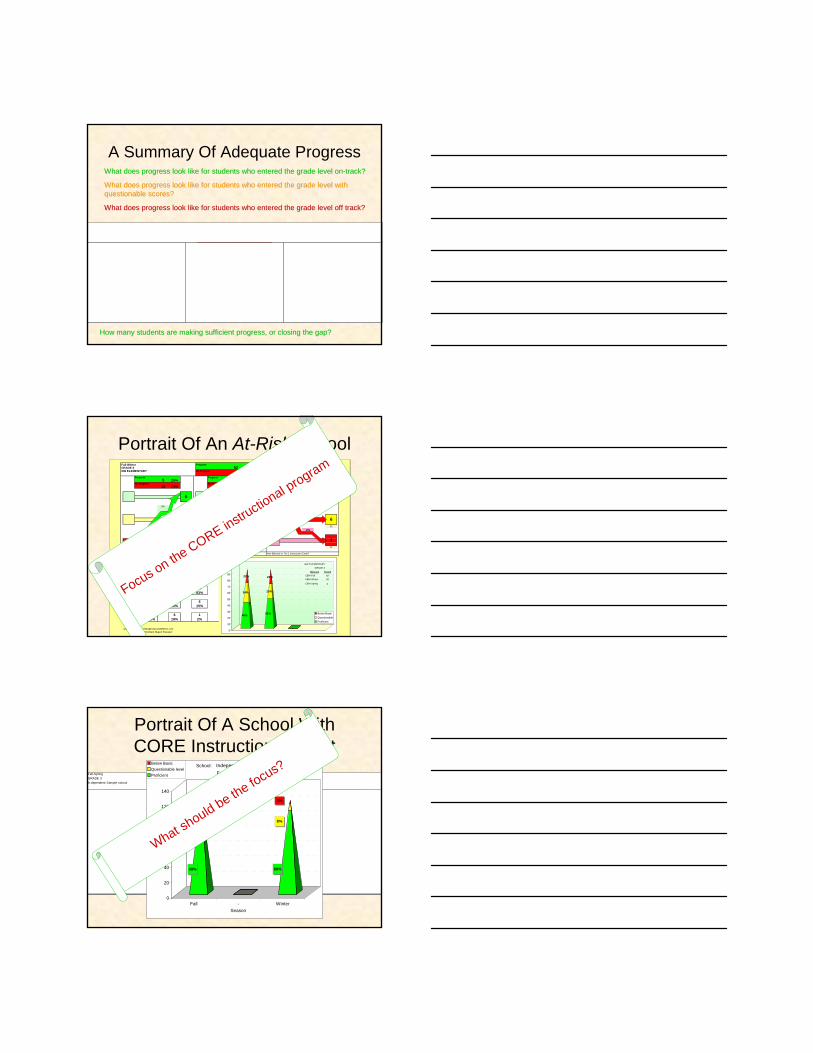
The Trajectories of poor readers persist
• As many as 54% of students with difficulty in reading dropout of school prior to graduation (de Bettencourt & Zigmond, 1990)
• Adjustment into adult life; According to Sinclair (1994), of students studied with reading difficulties 62% of (drop-outs ) were arrested compared with only 15% of those who remained in school until successful graduation.
• Three to 4 times as likely to become teenage parents (Shaywitz, 2002)
• Underemployment and unemployment were associated with difficulty in reading and graduation rates …As much as 3 times as likely to be unemployed (Goldstein, Murray & Edgar, 1997, 1998)
So How Should We Use Criterion-Reference Cut-Scores?
Progress looks like
Fall Winter
Proficient
Questionable
Below Basic
How did they do in fall?Closing the Gap looks likeNOT Closing the Gap looks likeIt is not just how many but who and why that is important for data-based decision-making
A Summary Of Adequate ProgressWhat does progress look like for students who entered the grade What does progress look like for students who entered the grade level onlevel on--track?track?
What does progress look like for students who entered the grade What does progress look like for students who entered the grade level with level with questionable scores?questionable scores?
What does progress look like for students who entered the grade What does progress look like for students who entered the grade level off track?level off track?
How many students are making sufficient progress, or closing theHow many students are making sufficient progress, or closing the gap?gap?
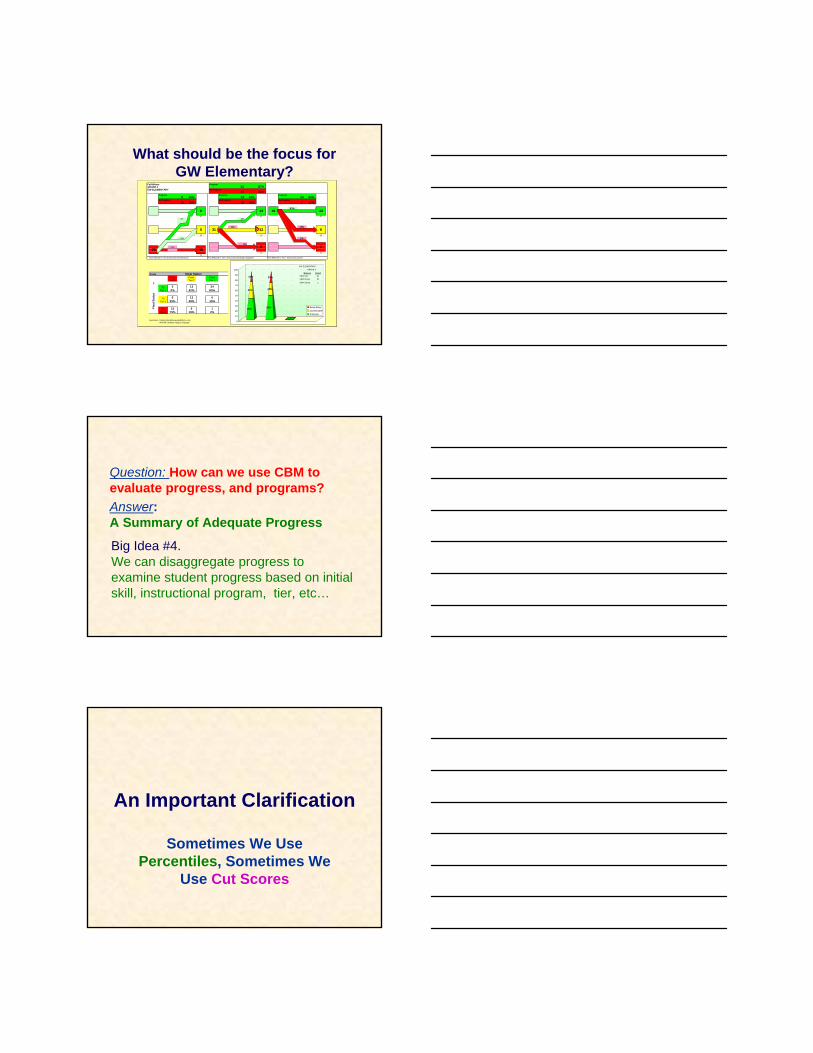
Portrait Of An At-Risk SchoolFall-Winter ProgressGRADE 3GW ELEMENTARY No Progress
Progress Progress Progress
No Progress No Progress No Progress
83%
47 47 470% 42%
39% 15%
23 23 2325% 2%
19%75%
22 2222
How Effective is Tier 3 (intensive intervention)? How Effective is Tier 2 Instruction (Strategic Support)? How Effective is Tier 1 Instruction (Core)?
GradeFrom From Tier 3 Tier 2
0 130% 42%
5 1225% 39%
15 675% 19%
Questions: Contact [email protected] Northern Region Evaluator
2%
To Tier 1
To Tier 3
To Tier 2
3483%
615%
Fina
l Sta
tus
Initial Status
1
620 15
3
FromTier 1
1
41 34
65 31 12
0 13
83%
15 75% 18 58% 7 17%
5 25% 13 42%
52
34
57%40 43%
45%
34%
22%
51%
25%
24%
---0
10
20
30
40
50
60
70
80
90
100
Below BasicQuestionableProficient
GRADE 3
CBM FallCBM Winter
CBM Spring
9292
0
Measure Tested
GW ELEMENTARY
Focus on the CORE instructional program
Portrait Of A School With CORE Instruction In-Tact
Fall-Spring Categorical ProgressGRADE 3In dependent Sample school Insufficient Progress
Closing the Gap Closing the Gap Progress
Not Closing the Gap Not Closing the Gap No Progress
95%
107 107 10738% 43%
57% 5%
10 10 1013% 0%
0%50%
4 44
How Effective is Tier 3 (intensive intervention)? How Effective is Tier 2 Instruction (Strategic Support)? How Effective is Tier 1 Instruction (Core)?
108 89%13 11%
4 50% 3 43% 101 95%
4 50% 4 57% 5 5%
3 3
1 7 4
0
106 101
5
8 40
0
20
40
60
80
100
120
140
No.
Stu
dent
s
Fall - WinterSeason
Fall to Winter
Below BasicQuestionable levelProficient
88% 88%
6% 8%
7% 3%
Independent Sample School:
What should be the focus?
Fall-Spring Categorical ProgressGRADE 3In dependent Sample school Insufficient Progress
Closing the Gap Closing the Gap Progress
Not Closing the Gap Not Closing the Gap No Progress
95%
107 107 10738% 43%
57% 5%
10 10 1013% 0%
0%50%
4 44
How Effective is Tier 3 (intensive intervention)? How Effective is Tier 2 Instruction (Strategic Support)? How Effective is Tier 1 Instruction (Core)?
108 89%13 11%
4 50% 3 43% 101 95%
4 50% 4 57% 5 5%
3 3
1 7 4
0
106 101
5
8 40
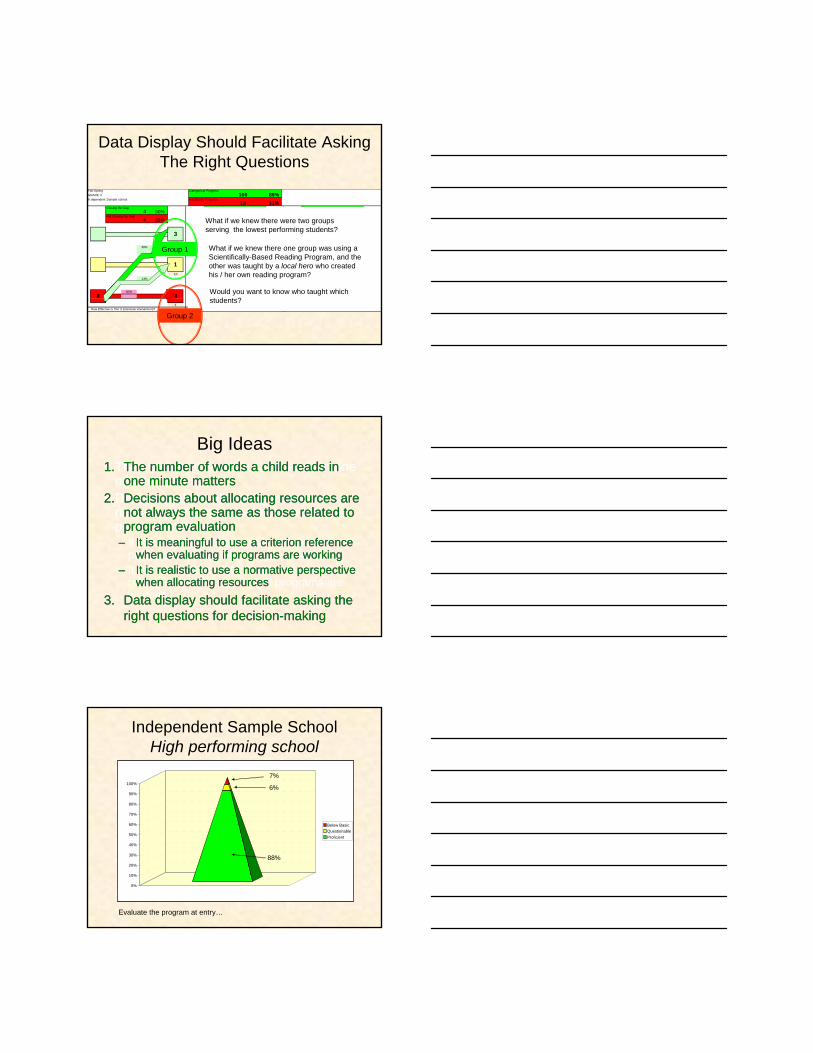
Data Display Should Facilitate Asking The Right Questions
What if we knew there were two groups serving the lowest performing students?
Group 1
Group 2
What if we knew there one group was using aScientifically-Based Reading Program, and the other was taught by a local hero who created his / her own reading program?
Would you want to know who taught which students?
Big Ideas• The number of words a child reads in one
minute matters• Decisions about allocating resources are
not always the same as those related to program evaluation– It is most reasonable to use a normative
perspective when allocating resources– It is most meaningful to use a criterion
reference when evaluating if programs are working
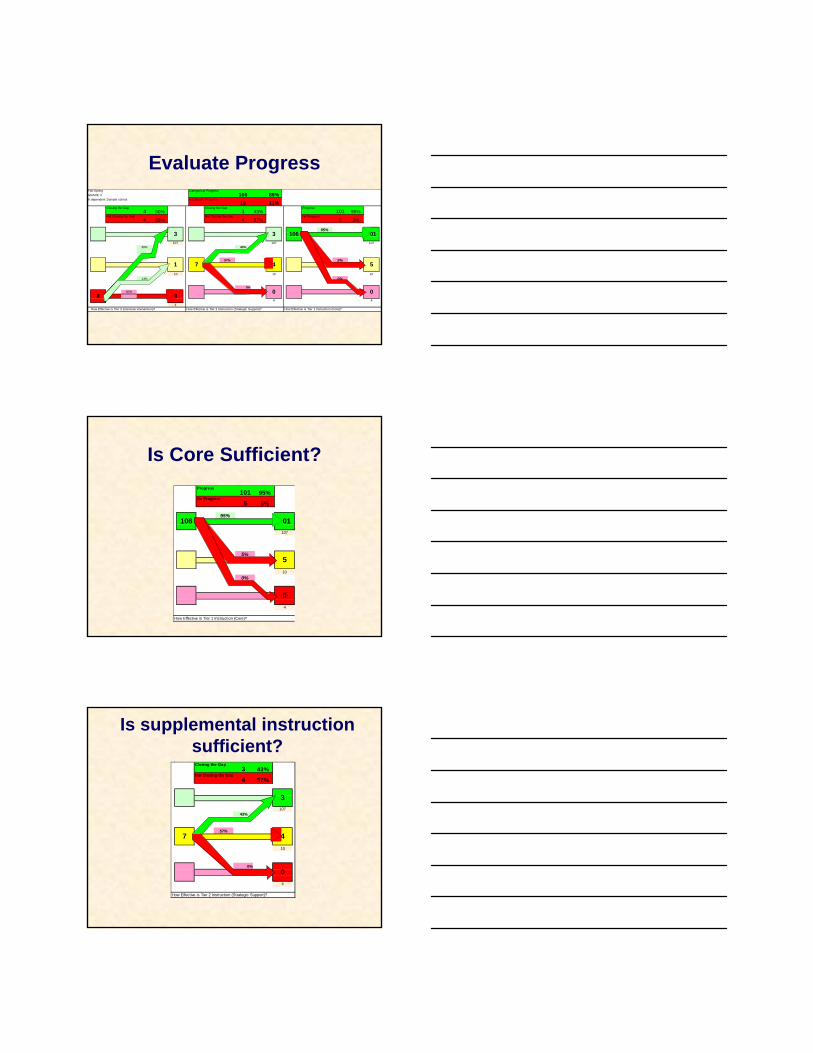
1. The number of words a child reads in one minute matters
2. Decisions about allocating resources are not always the same as those related to program evaluation
– It is meaningful to use a criterion reference when evaluating if programs are working
– It is realistic to use a normative perspective when allocating resources
3. Data display should facilitate asking the right questions for decision-making
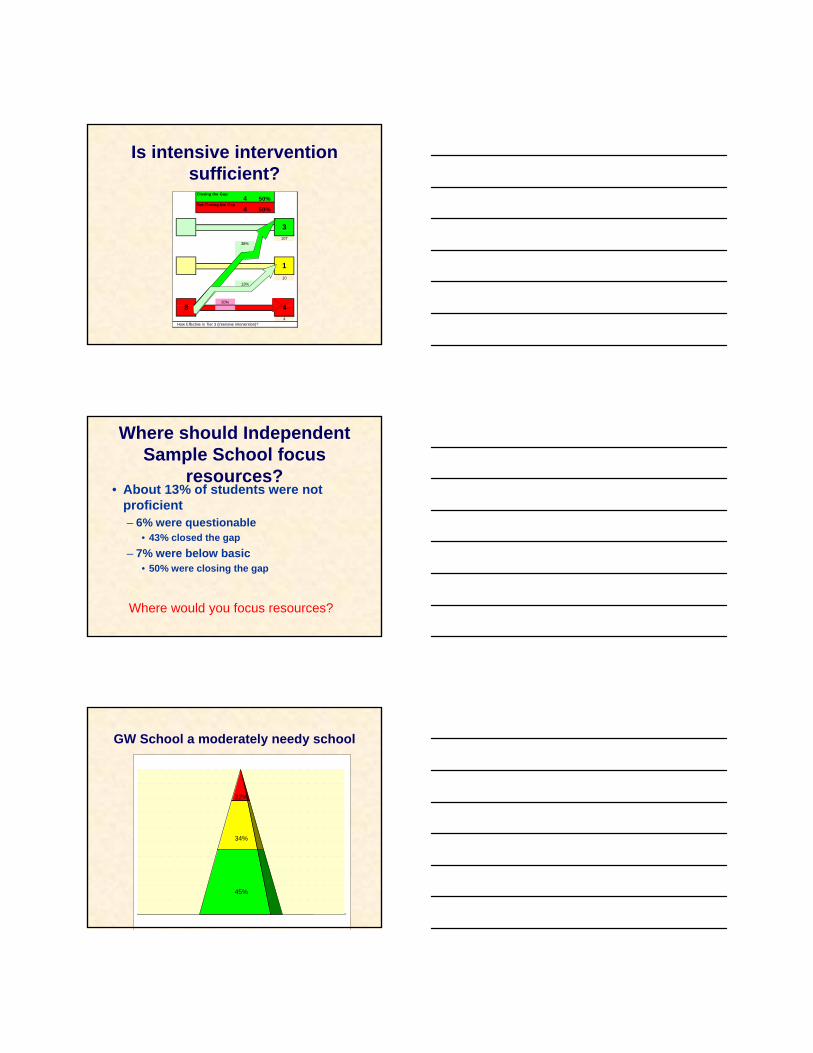
Independent Sample SchoolHigh performing school
0%
10%
20%
30%
40%
50%
60%
70%
80%
90%
100%
Below BasicQuestionableProficient
88%
6%
7%
Evaluate the program at entry…
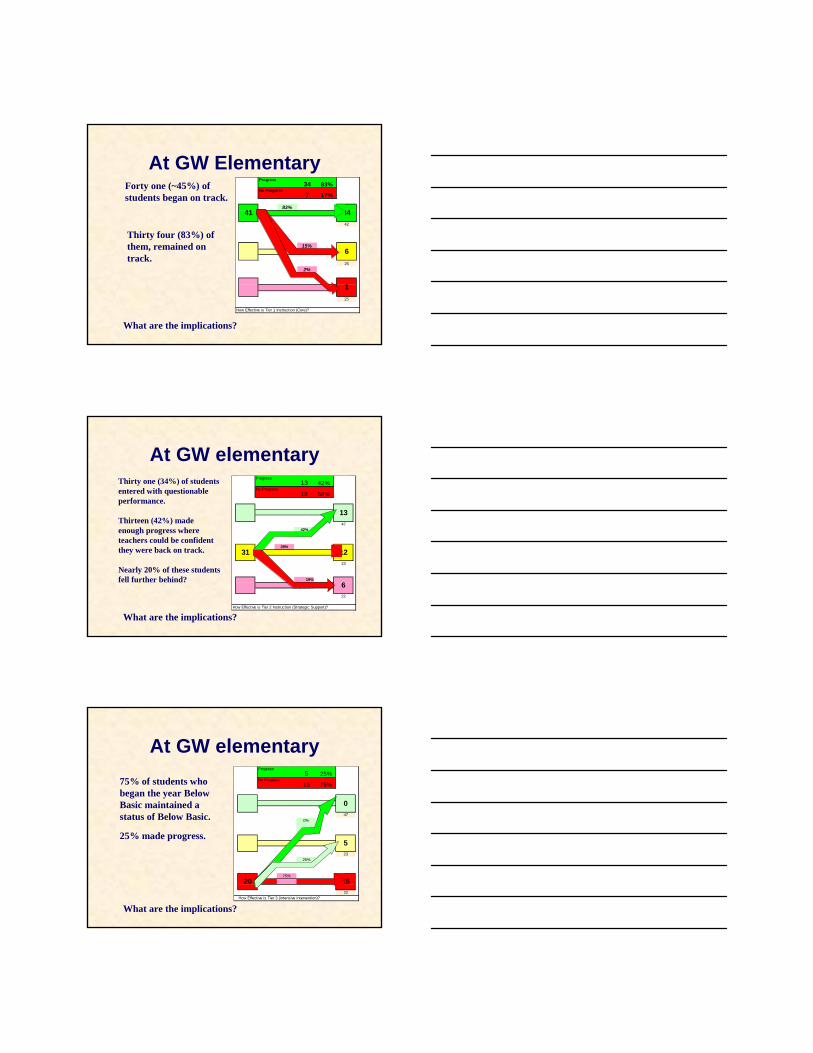
Evaluate ProgressFall-Spring Categorical ProgressGRADE 3In dependent Sample school Insufficient Progress
Closing the Gap Closing the Gap Progress
Not Closing the Gap Not Closing the Gap No Progress
95%
107 107 10738% 43%
57% 5%
10 10 1013% 0%
0%50%
4 44
How Effective is Tier 3 (intensive intervention)? How Effective is Tier 2 Instruction (Strategic Support)? How Effective is Tier 1 Instruction (Core)?
108 89%13 11%
4 50% 3 43% 101 95%
4 50% 4 57% 5 5%
3 3
1 7 4
0
106 101
5
8 40
Is Core Sufficient?Progress
No Progress
95%
107
5%
100%
4
How Effective is Tier 1 Instruction (Core)?
101 95%
5 5%
0
106 101
5
Is supplemental instruction sufficient?
Closing the Gap
Not Closing the Gap
10743%
57%
10
0%
4
How Effective is Tier 2 Instruction (Strategic Support)?
43%
4 57%
3
3
7 4
0
Is intensive intervention sufficient?
Closing the Gap
Not Closing the Gap
10738%
1013%
50%
4How Effective is Tier 3 (intensive intervention)?
4 50%
4 50%
3
1
8 4
Where should Independent Sample School focus
resources?• About 13% of students were not
proficient– 6% were questionable
• 43% closed the gap– 7% were below basic
• 50% were closing the gap
Where would you focus resources?
GW School a moderately needy school
45%
34%
22%
At GW ElementaryProgress
No Progress
83%
42
15%
252%
25
How Effective is Tier 1 Instruction (Core)?
1
41 34
6
83%
7 17%
34Forty one (~45%) of students began on track.
What are the implications?
Thirty four (83%) of them, remained on track.
At GW elementaryProgress
No Progress
4742%
39%
23
19%
22
How Effective is Tier 2 Instruction (Strategic Support)?
6
31
13
12
13 42%
18 58%
Thirty one (34%) of students entered with questionable performance.
Thirteen (42%) made enough progress where teachers could be confident they were back on track.
Nearly 20% of these students fell further behind?
What are the implications?
At GW elementaryProgress
No Progress
470%
2325%
75%
22How Effective is Tier 3 (intensive intervention)?
5 25%
5
1520
0
15 75%75% of students who began the year Below Basic maintained a status of Below Basic.
25% made progress.
What are the implications?
What should be the focus for GW Elementary?
Fall-Winter ProgressGRADE 3GW ELEMENTARY No Progress
Progress Progress Progress
No Progress No Progress No Progress
83%
47 47 470% 42%
39% 15%
23 23 2325% 2%
19%75%
22 2222
How Effective is Tier 3 (intensive intervention)? How Effective is Tier 2 Instruction (Strategic Support)? How Effective is Tier 1 Instruction (Core)?
GradeFrom From Tier 3 Tier 2
0 130% 42%
5 1225% 39%
15 675% 19%
Questions: Contact [email protected] Northern Region Evaluator
2%
To Tier 1
To Tier 3
To Tier 2
3483%
615%
Fina
l Sta
tus
Initial Status
1
620 15
3
FromTier 1
1
41 34
65 31 12
0 13
83%
15 75% 18 58% 7 17%
5 25% 13 42%
52
34
57%40 43%
45%
34%
22%
51%
25%
24%
---0
10
20
30
40
50
60
70
80
90
100
Below BasicQuestionableProficient
GRADE 3
CBM FallCBM Winter
CBM Spring
9292
0
Measure Tested
GW ELEMENTARY
Big Idea #4.We can disaggregate progress to examine student progress based on initial skill, instructional program, tier, etc…
Question: How can we use CBM to evaluate progress, and programs?Answer: A Summary of Adequate Progress
An Important Clarification
Sometimes We Use Percentiles, Sometimes We
Use Cut Scores
---
80%
15%
5%
---0
20
40
60
80
100
120
140
160
180
Grade 3 Fall Screening
Tier 3Tier 2Tier 1
Fall Prototype -
Allocating ResourcesWe know what it should look like…
All students All students
Some students Some students A few students A few students
58%
14%
28%
80%
15%
5%
---0
20
40
60
80
100
120
140
160
180
Grade 3 Fall Screening
Tier 3Tier 2Tier 1
Fall Prototype -
Allocating ResourcesBut what happens when
58%
14%
28%
80%
15%
5%
95%
2%3%
0
20
40
60
80
100
120
140
160
180
Grade 3 Fall Screening
Tier 3Tier 2Tier 1
Low performing Prototype High Performing
……or?
Decisions about allocating resources are not
always the same asthose related to
program evaluation.
Decisions about allocating resources are not
always the same asthose related to
program evaluation.
210 - 214
205 - 209 ☺200 - 204 ☺195 - 199
190 - 194 ☺185 - 189
180 - 184 ☺☺175 - 179 ☺170 - 174 ☺165 - 169
160 - 164
155 - 159 ☺☺☺☺☺150 - 154 ☺☺145 - 149
140 - 144 ☺☺☺135 - 139 ☺☺☺130 - 134 ☺☺☺125 - 129 ☺☺☺☺120 - 124 ☺☺☺115 - 119 ☺☺☺☺☺☺☺110 - 114 ☺☺☺☺☺☺☺☺105 - 109 ☺☺☺100 - 104 ☺☺☺☺☺95 - 99 ☺☺☺☺☺☺☺☺90 - 94 ☺☺☺☺☺☺☺85 - 89 ☺☺☺☺☺☺☺☺☺☺☺80 - 84 ☺☺☺☺☺☺☺☺☺75 - 79 ☺☺☺☺☺☺☺☺☺70 - 74 ☺☺☺☺65 - 69 ☺☺☺☺60 - 64 ☺☺☺☺55 - 59 ☺☺☺☺☺☺☺☺☺☺☺☺50 - 54 ☺☺☺☺☺45 - 49 ☺☺☺☺☺40 - 44 ☺☺☺☺☺☺☺35 - 39 ☺☺☺☺☺☺☺30 - 34 ☺☺☺☺☺☺☺☺☺25 - 29 ☺☺☺☺☺20 - 24 ☺☺☺☺☺15 - 19 ☺10 - 14
5 - 9 ☺☺☺0 - 4
RA
NG
E of
sco
res
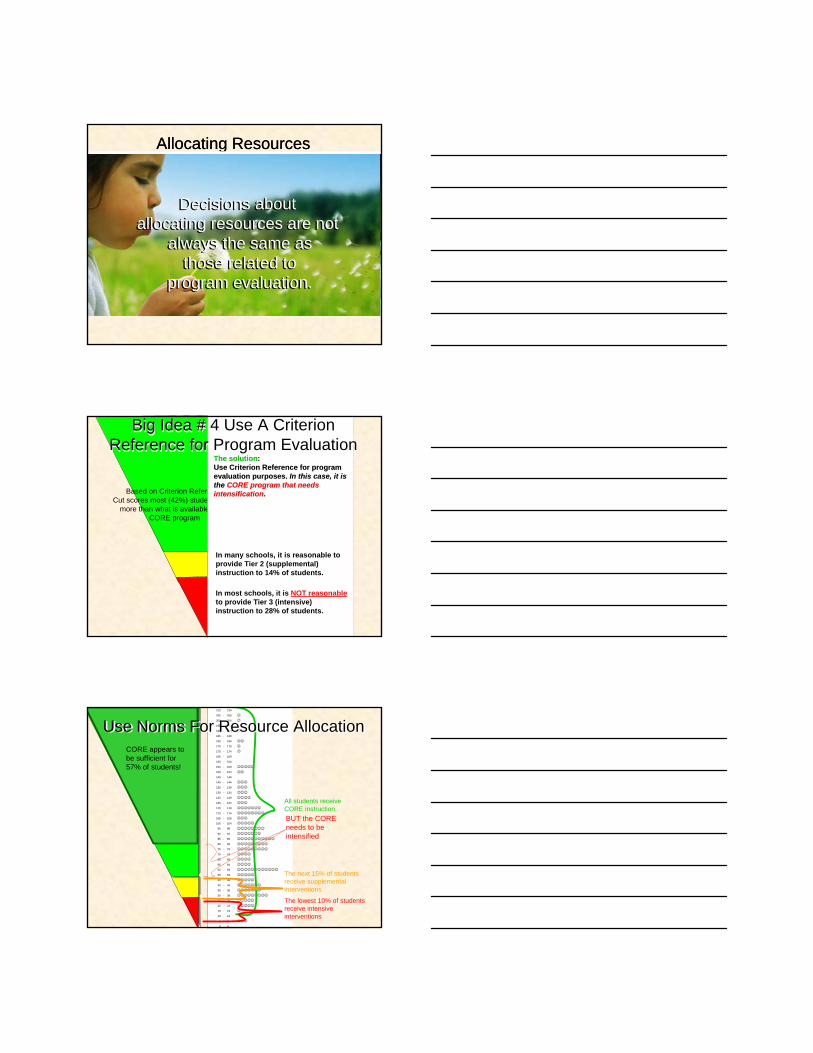
Based on Criterion ReferenceCut scores most (42%) students need
more than what is available in the CORE program
Num
ber o
f stu
dent
s
In many schools, it is reasonable to provide Tier 2 (supplemental) instruction to 14% of students.
In most schools, it is NOT reasonableto provide Tier 3 (intensive) instruction to 28% of students.
The solutionThe solution: : Use Criterion Reference for program Use Criterion Reference for program evaluation purposes. evaluation purposes. In this case, it is In this case, it is the the CORE program that needs CORE program that needs intensificationintensification. .
Big Idea # 2 Use A Criterion Reference for Program Evaluation
Big Idea # 4 Use A Criterion Reference for Program Evaluation
210 - 214
205 - 209 ☺200 - 204 ☺195 - 199
190 - 194 ☺185 - 189
180 - 184 ☺☺175 - 179 ☺170 - 174 ☺165 - 169
160 - 164
155 - 159 ☺☺☺☺☺150 - 154 ☺☺145 - 149
140 - 144 ☺☺☺135 - 139 ☺☺☺130 - 134 ☺☺☺125 - 129 ☺☺☺☺120 - 124 ☺☺☺115 - 119 ☺☺☺☺☺☺☺110 - 114 ☺☺☺☺☺☺☺☺105 - 109 ☺☺☺100 - 104 ☺☺☺☺☺95 - 99 ☺☺☺☺☺☺☺☺90 - 94 ☺☺☺☺☺☺☺85 - 89 ☺☺☺☺☺☺☺☺☺☺☺80 - 84 ☺☺☺☺☺☺☺☺☺75 - 79 ☺☺☺☺☺☺☺☺☺70 - 74 ☺☺☺☺65 - 69 ☺☺☺☺60 - 64 ☺☺☺☺55 - 59 ☺☺☺☺☺☺☺☺☺☺☺☺50 - 54 ☺☺☺☺☺45 - 49 ☺☺☺☺☺40 - 44 ☺☺☺☺☺☺☺35 - 39 ☺☺☺☺☺☺☺30 - 34 ☺☺☺☺☺☺☺☺☺25 - 29 ☺☺☺☺☺20 - 24 ☺☺☺☺☺15 - 19 ☺10 - 14
5 - 9 ☺☺☺0 - 4
All students receive CORE instruction,
The lowest 10% of students receive intensive interventions
The next 15% of students receive supplemental interventions
BUT the CORE needs to be intensified
CORE appears to be sufficient for 57% of students!
Use Norms For Resource AllocationUse Norms For Resource Allocation
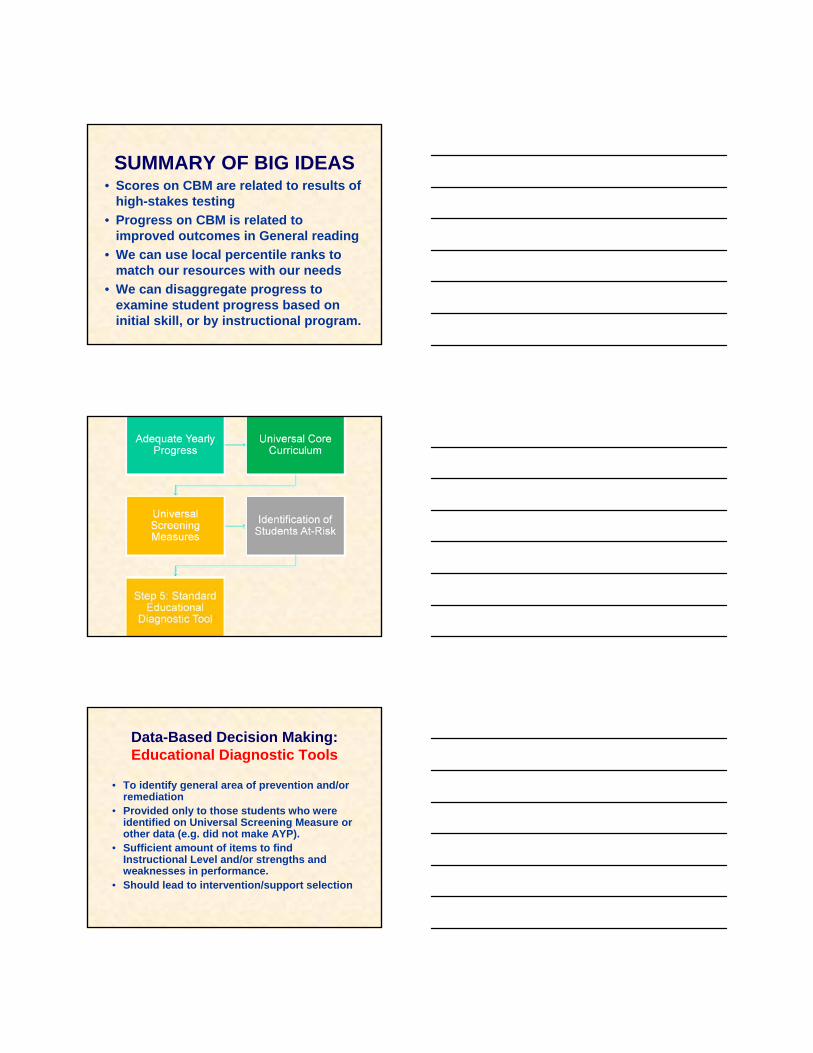
SUMMARY OF BIG IDEAS• Scores on CBM are related to results of
high-stakes testing• Progress on CBM is related to
improved outcomes in General reading• We can use local percentile ranks to
match our resources with our needs• We can disaggregate progress to
examine student progress based on initial skill, or by instructional program.
Data-Based Decision Making: Educational Diagnostic Tools
• To identify general area of prevention and/or remediation
• Provided only to those students who were identified on Universal Screening Measure or other data (e.g. did not make AYP).
• Sufficient amount of items to find Instructional Level and/or strengths and weaknesses in performance.
• Should lead to intervention/support selection
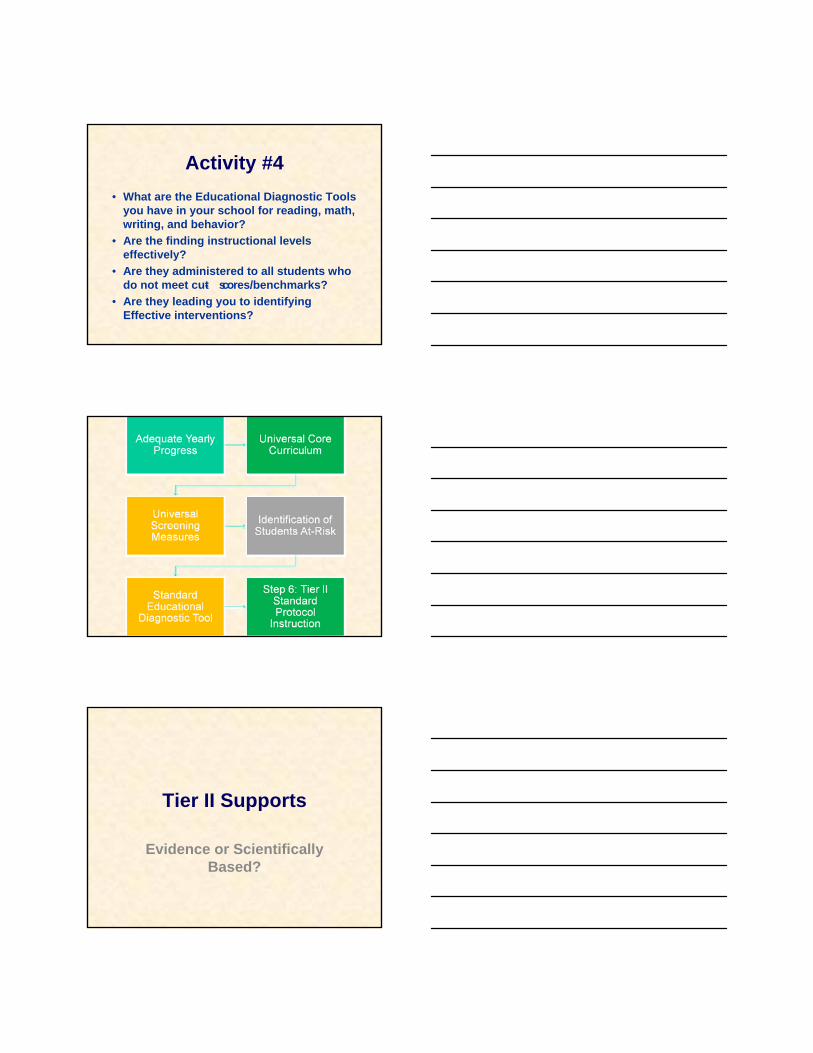
Activity #4• What are the Educational Diagnostic Tools
you have in your school for reading, math, writing, and behavior?
• Are the finding instructional levels effectively?
• Are they administered to all students who do not meet cut- scores/benchmarks?
• Are they leading you to identifying Effective interventions?
Tier II Supports
Evidence or Scientifically Based?
Evaluating Quality of Intervention
• Scientific Based• Evidenced Based
Activity 5• What evidence do you have justifying
the supports/interventions being provided to students at the Tier II level?
• Consider Chutes & Ladders
Is Tier II Effective
2 Questions and 2 Sub Questions
Question 1:Is Tier II Effective for the Group?
• What evidence existed prior to the selection of the intervention that lead to it’s selection?
• More than 10% of students receiving service at tier II level?– If so is less than 20% receiving tier II, III, and
special education combined?• You can also consider experimental
research (i.e. providing half in tier II the intervention and the other half an alternate method of intervention to develop your own internal validity/evidence base).
Question 2:Is Tier II Effective for the
Individual?• Did the student meet cut score
criteria by a pre-specified date? -CHANGES
• Is the student on track for meeting the criteria by the pre-specified date? TWEAKS
Individualized Assessment
• Specific Targeted Instruction• More Intensive and Time Consuming• Curriculum Based Evaluation• Response Patterns and linking
assessment to behavioral response patterns– Experimental Analysis of accuracy procedures– Experimental Analysis of fluency procedures– Testing a motivation (i.e. lack of reinforcement
) hypothesis
Activity 6• What evidence do you have justifying
the supports/interventions being provided to students at the Tier III level?
Is Tier III Effective
2 Questions and 2 Sub Questions
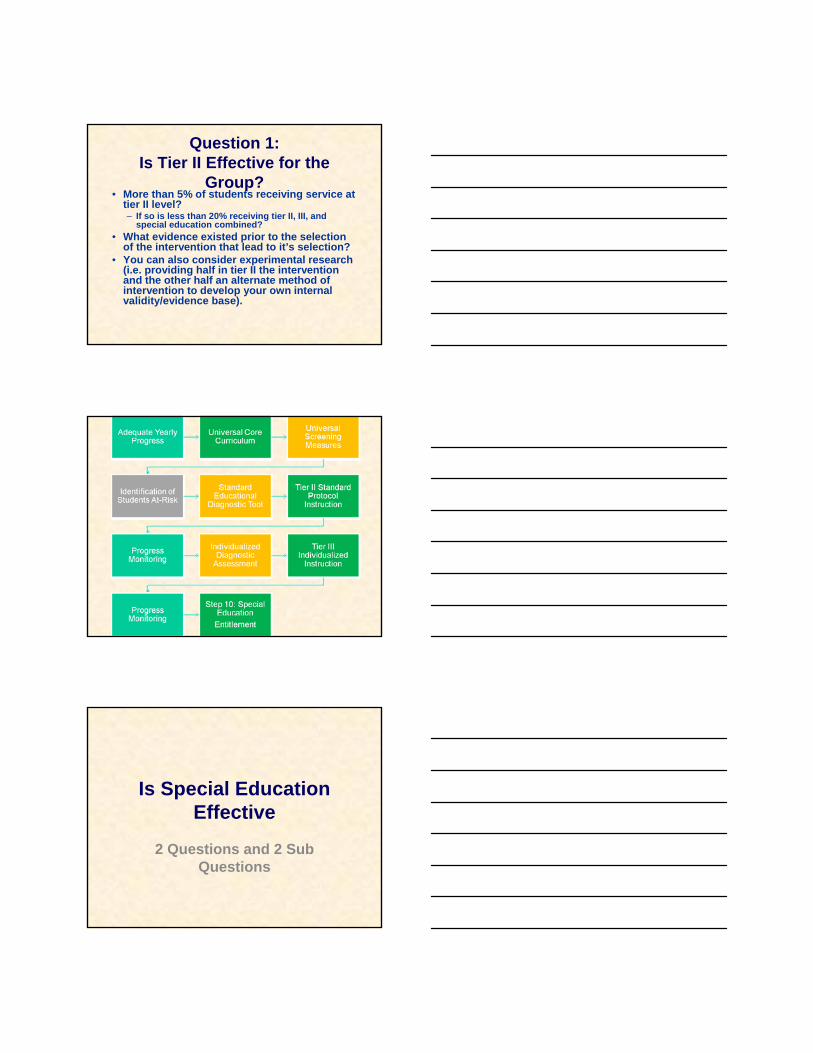
Question 1:Is Tier II Effective for the
Group?• More than 5% of students receiving service at
tier II level?– If so is less than 20% receiving tier II, III, and
special education combined?• What evidence existed prior to the selection
of the intervention that lead to it’s selection?• You can also consider experimental research
(i.e. providing half in tier II the intervention and the other half an alternate method of intervention to develop your own internal validity/evidence base).
Is Special Education Effective
2 Questions and 2 Sub Questions
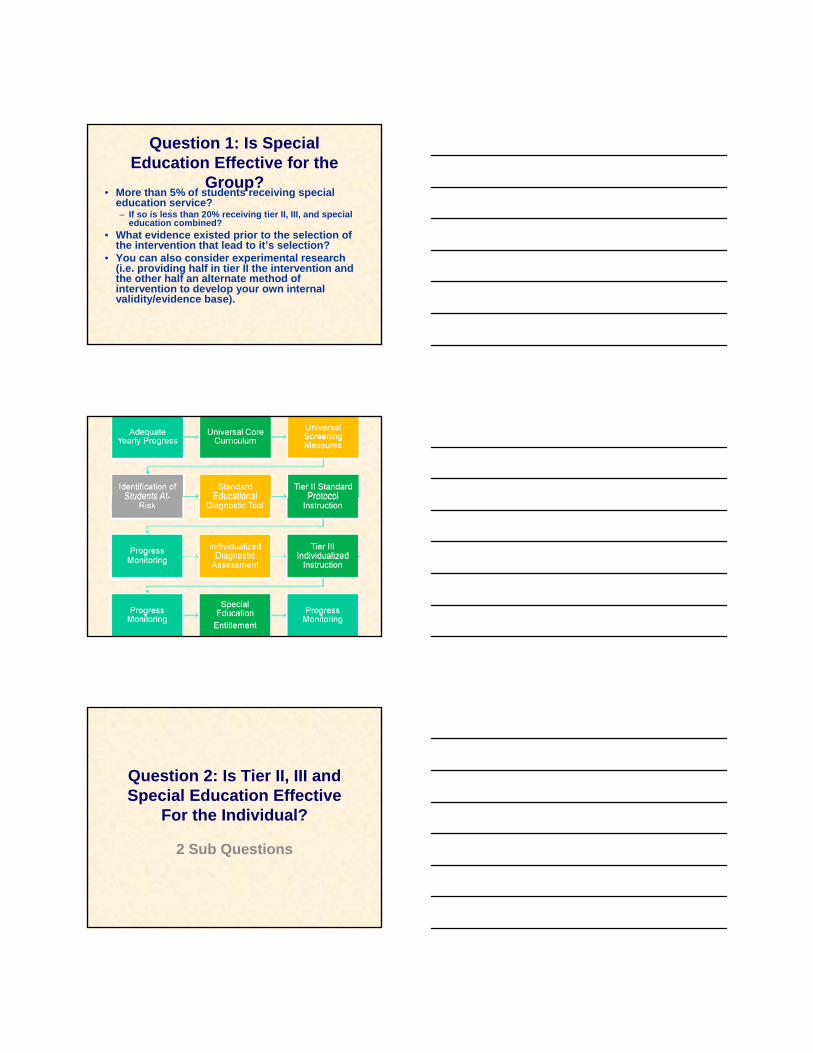
Question 1: Is Special Education Effective for the
Group?• More than 5% of students receiving special
education service?– If so is less than 20% receiving tier II, III, and special
education combined?• What evidence existed prior to the selection of
the intervention that lead to it’s selection?• You can also consider experimental research
(i.e. providing half in tier II the intervention and the other half an alternate method of intervention to develop your own internal validity/evidence base).
Question 2: Is Tier II, III andSpecial Education Effective
For the Individual?
2 Sub Questions
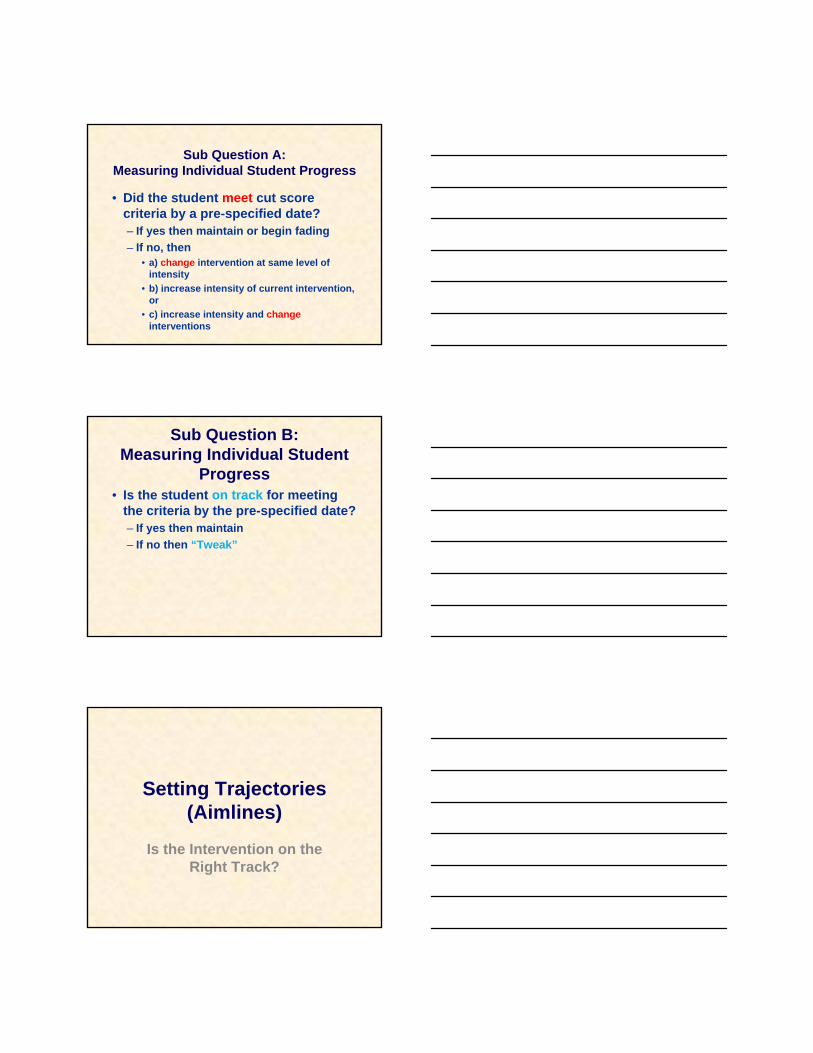
Sub Question A: Measuring Individual Student Progress
• Did the student meet cut score criteria by a pre-specified date?– If yes then maintain or begin fading– If no, then
• a) change intervention at same level of intensity
• b) increase intensity of current intervention, or
• c) increase intensity and change interventions
Sub Question B:Measuring Individual Student
Progress • Is the student on track for meeting
the criteria by the pre-specified date?– If yes then maintain– If no then “Tweak”
Setting Trajectories (Aimlines)
Is the Intervention on the Right Track?
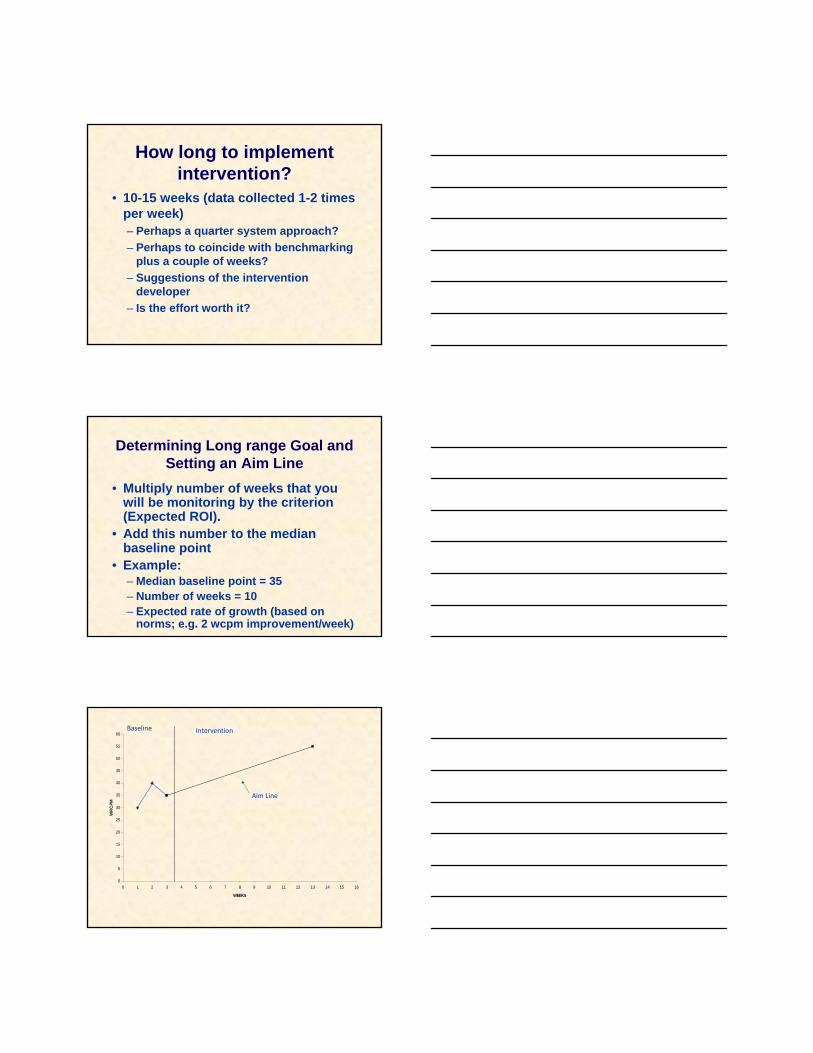
How long to implement intervention?
• 10-15 weeks (data collected 1-2 times per week)– Perhaps a quarter system approach?– Perhaps to coincide with benchmarking
plus a couple of weeks?– Suggestions of the intervention
developer– Is the effort worth it?
Determining Long range Goal and Setting an Aim Line
• Multiply number of weeks that you will be monitoring by the criterion (Expected ROI).
• Add this number to the median baseline point
• Example:– Median baseline point = 35– Number of weeks = 10– Expected rate of growth (based on
norms; e.g. 2 wcpm improvement/week)
0
5
10
15
20
25
30
35
40
45
50
55
60
0 1 2 3 4 5 6 7 8 9 10 11 12 13 14 15 16
WEEKS
WR
CPM
Baseline Intervention
Aim Line
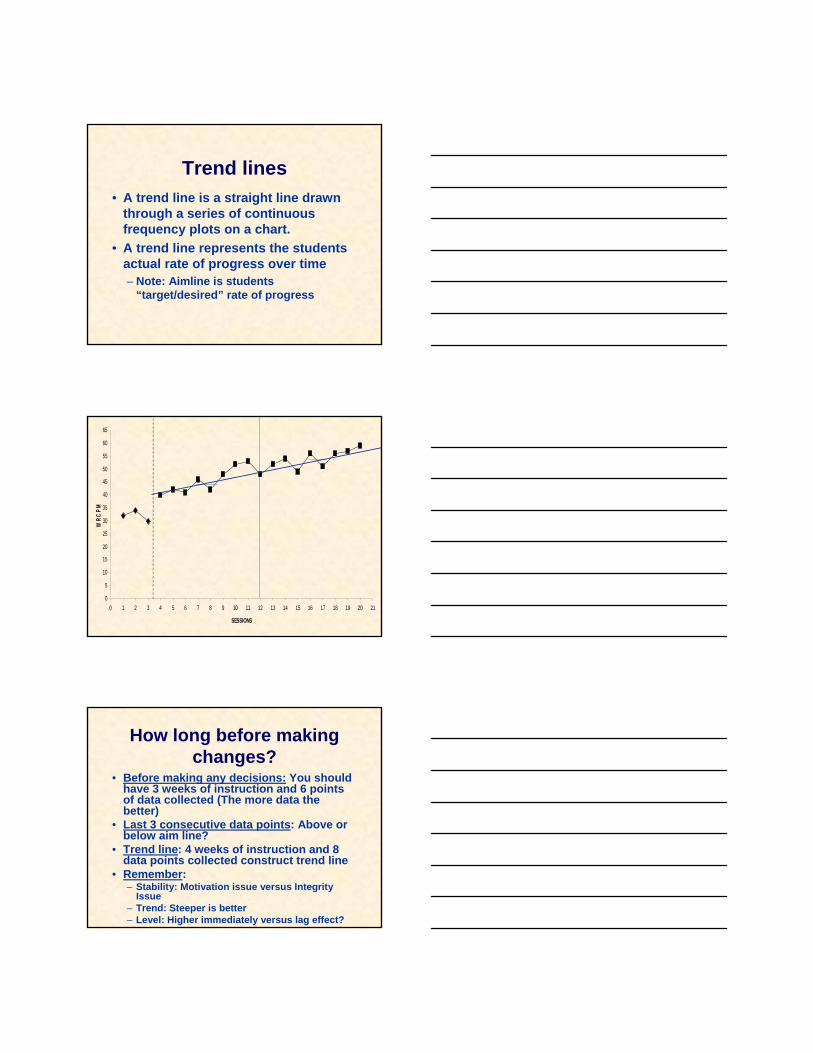
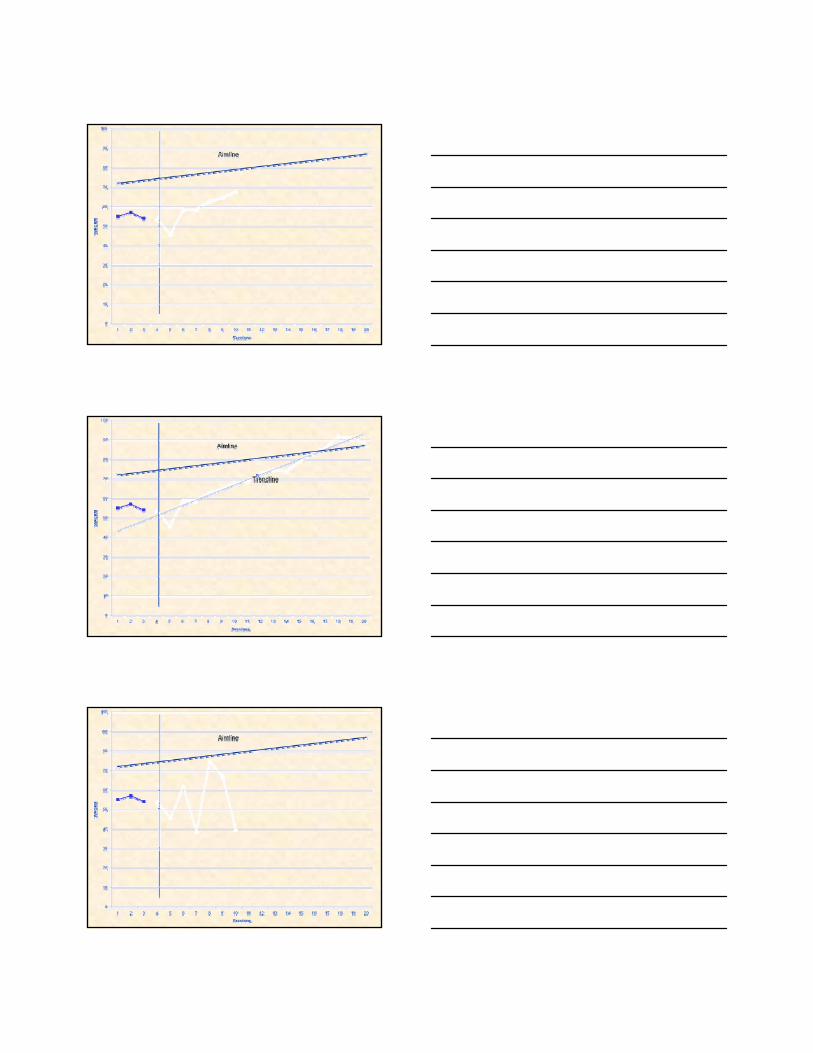
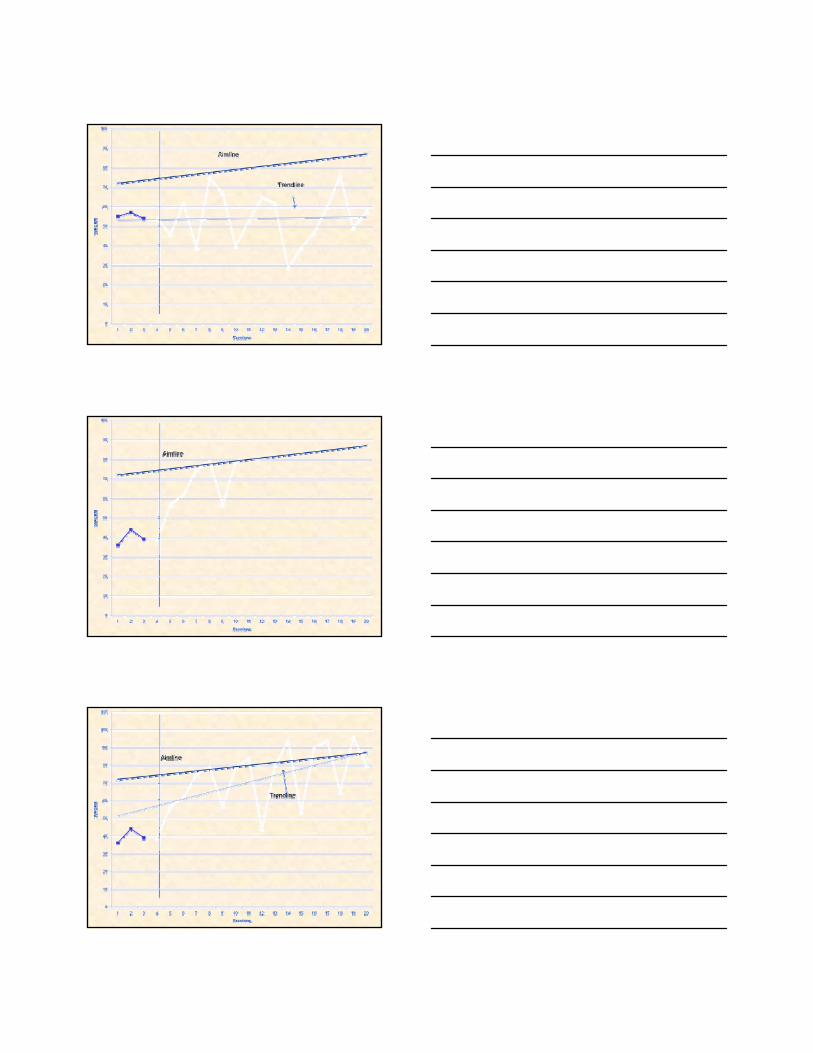
Trend lines• A trend line is a straight line drawn
through a series of continuous frequency plots on a chart.
• A trend line represents the students actual rate of progress over time– Note: Aimline is students
“target/desired” rate of progress
0
5
10
15
20
25
30
35
40
45
50
55
60
65
0 1 2 3 4 5 6 7 8 9 10 11 12 13 14 15 16 17 18 19 20 21
SESSIONS
WRC
PM
How long before making changes?
• Before making any decisions: You should have 3 weeks of instruction and 6 points of data collected (The more data the better)
• Last 3 consecutive data points: Above or below aim line?
• Trend line: 4 weeks of instruction and 8 data points collected construct trend line
• Remember: – Stability: Motivation issue versus Integrity
Issue– Trend: Steeper is better– Level: Higher immediately versus lag effect?
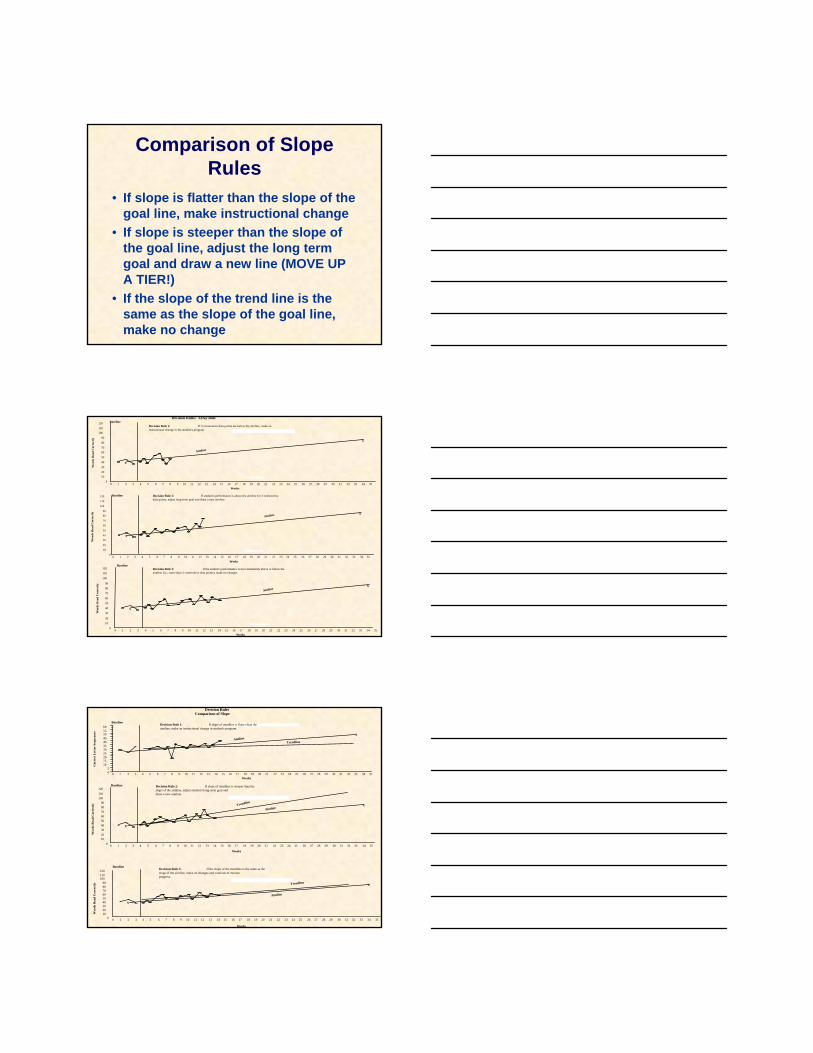
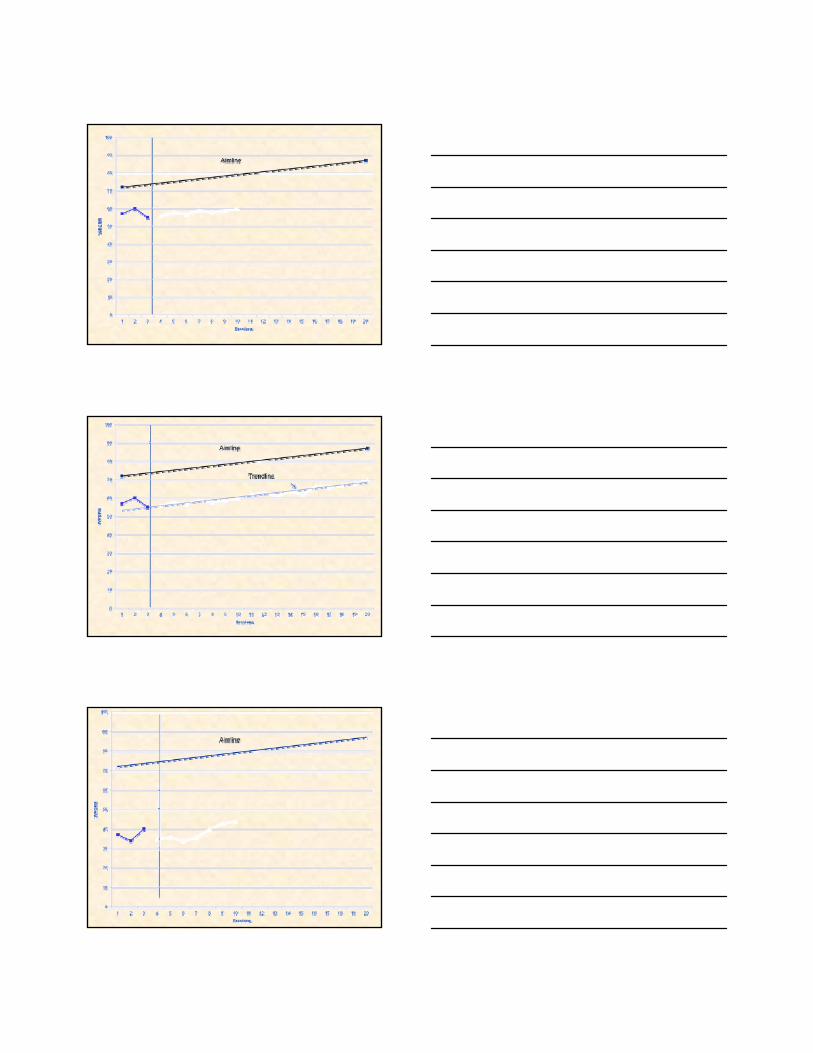
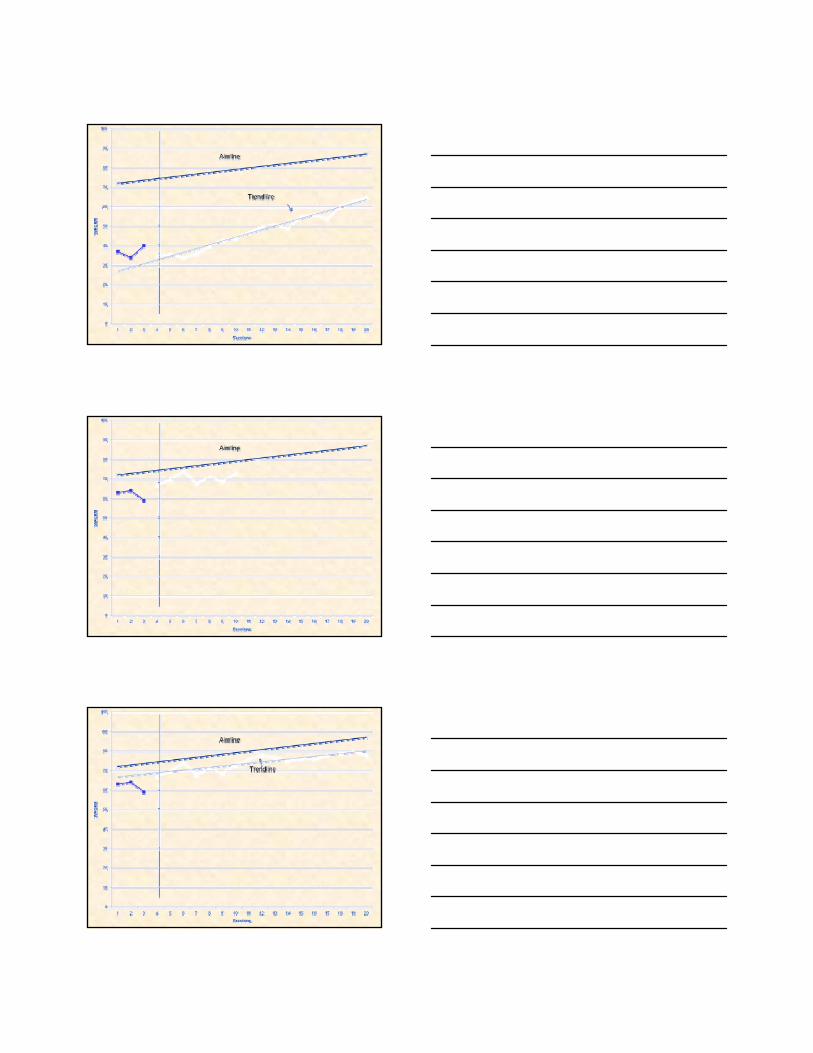
Comparison of Slope Rules
• If slope is flatter than the slope of the goal line, make instructional change
• If slope is steeper than the slope of the goal line, adjust the long term goal and draw a new line (MOVE UP A TIER!)
• If the slope of the trend line is the same as the slope of the goal line, make no change
Decision Rule 1: If 3 consecutive data points are below the aimline, make an instructional change in the student's program.
0 1 2 3 4 5 6 7 8 9 10 11 12 13 14 15 16 17 18 19 20 21 22 23 24 25 26 27 28 29 30 31 32 33 34 350
102030405060708090
100110120
Weeks
Wor
ds R
ead
Cor
rect
ly
Baseline
X
x
Aimline
Decision Rules: 3-Day Rule
Decision Rule 2: If student's performance is above the aimline for 3 consecutive data points, adjust long-term goal and draw a new aimline.
Weeks0 1 2 3 4 5 6 7 8 9 10 11 12 13 14 15 16 17 18 19 20 21 22 23 24 25 26 27 28 29 30 31 32 33 34 35
0
10
20
30
40
50
60
70
80
90
100
110
120
Wor
ds R
ead
Cor
rect
ly
Baseline
X
x
Aimline
Decision Rule 3: If the student's performance is not consistently above or below the aimline (i.e., more than 3 consecutive data points), make no changes.
0 1 2 3 4 5 6 7 8 9 10 11 12 13 14 15 16 17 18 19 20 21 22 23 24 25 26 27 28 29 30 31 32 33 34 350
1020
30405060708090
100110120
Weeks
Wor
ds R
ead
Cor
rect
ly
Baseline
X
x
Aimline
Decision Rule 1: If slope of trendline is flatter than the aimline, make an instructional change in student's program.
0 1 2 3 4 5 6 7 8 9 10 11 12 13 14 15 16 17 18 19 20 21 22 23 24 25 26 27 28 29 30 31 32 33 34 3505
1015202530354045505560
Weeks
Cor
rect
Let
ter
Sequ
ence
s
Baseline
x
x
TrendlineAimline
Decision Rules Comparison of Slope
Decision Rule 2: If slope of trendline is steeper than the slope of the aimline, adjust student's long-term goal and draw a new aimline.
0 1 2 3 4 5 6 7 8 9 10 11 12 13 14 15 16 17 18 19 20 21 22 23 24 25 26 27 28 29 30 31 32 33 34 350102030405060708090
100110120
Weeks
Wor
ds R
ead
Cor
rect
ly
Baseline
X
x
AimlineTrendline
Decision Rule 3: If the slope of the trendline is the same as the slope of the aimline, make no changes and continue to monitor progress.
0 1 2 3 4 5 6 7 8 9 10 11 12 13 14 15 16 17 18 19 20 21 22 23 24 25 26 27 28 29 30 31 32 33 34 350102030405060708090
100110120
Weeks
Wor
ds R
ead
Cor
rect
ly
Baseline
X
x
Aimline
Trendline

Are You Confident That You Should Change the
Intervention?Using Confidence Intervals for
Decision - Making
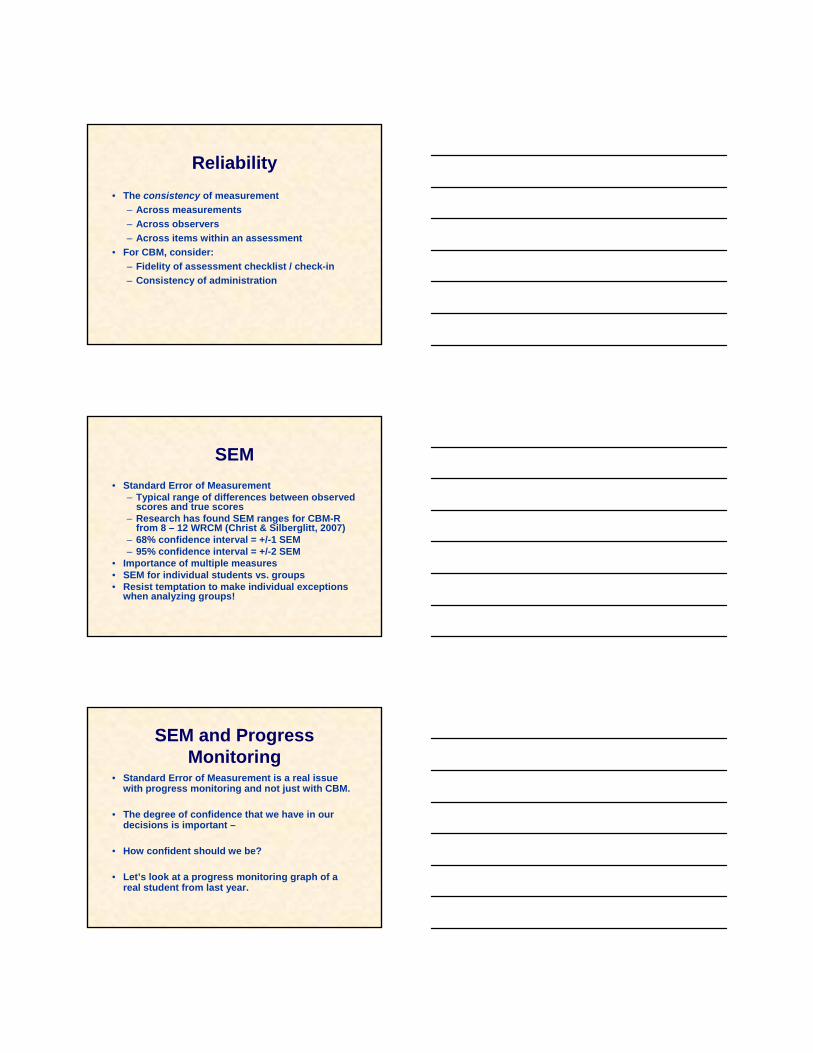
Reliability• The consistency of measurement
– Across measurements– Across observers– Across items within an assessment
• For CBM, consider:– Fidelity of assessment checklist / check-in– Consistency of administration
SEM• Standard Error of Measurement
– Typical range of differences between observed scores and true scores
– Research has found SEM ranges for CBM-R from 8 – 12 WRCM (Christ & Silberglitt, 2007)
– 68% confidence interval = +/-1 SEM– 95% confidence interval = +/-2 SEM
• Importance of multiple measures• SEM for individual students vs. groups• Resist temptation to make individual exceptions
when analyzing groups!
SEM and Progress Monitoring
• Standard Error of Measurement is a real issue with progress monitoring and not just with CBM.
• The degree of confidence that we have in our decisions is important –
• How confident should we be?
• Let’s look at a progress monitoring graph of a real student from last year.
0
10
20
30
40
50
60
70
80
90
100
8/6/200
7
9/25/2
007
11/14
/2007
1/3/200
8
2/22/2
008
4/12/2
008
6/1/200
8
7/21/2
008
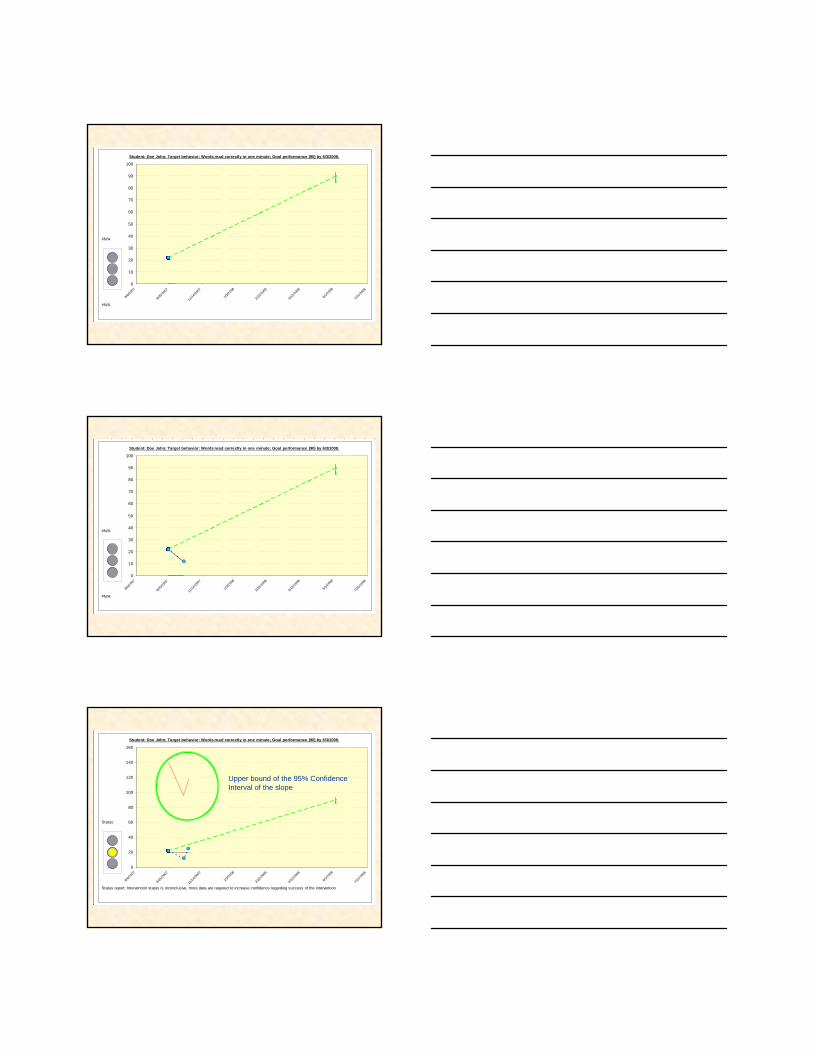
Student: Doe John; Target behavior: Words read correctly in one minute; Goal performance (90) by 6/3/2008.
#N/A
#N/A
0
10
20
30
40
50
60
70
80
90
100
8/6/200
7
9/25/2
007
11/14
/2007
1/3/200
8
2/22/2
008
4/12/2
008
6/1/200
8
7/21/2
008
Student: Doe John; Target behavior: Words read correctly in one minute; Goal performance (90) by 6/3/2008.
#N/A
#N/A
0
20
40
60
80
100
120
140
160
8/6/200
7
9/25/2
007
11/14
/2007
1/3/200
8
2/22/2
008
4/12/2
008
6/1/200
8
7/21/2
008
Student: Doe John; Target behavior: Words read correctly in one minute; Goal performance (90) by 6/3/2008.
Status
Status report: Intervention status is inconclusive, more data are required to increase confidence regarding success of the intervention
Upper bound of the 95% Confidence Interval of the slope

(Confidence Interval at final data point)
0
10
20
30
40
50
60
70
80
90
100
8/6/200
7
9/25/2
007
11/14
/2007
1/3/200
8
2/22/2
008
4/12/2
008
6/1/200
8
7/21/2
008
Student: Doe John; Target behavior: Words read correctly in one minute; Goal performance (90) by 6/3/2008.
Status
Status report: Intervention status is inconclusive, more data are required to increase confidence regarding success of the intervention
Anyone ready to make an instructional decision?
Upper bound of the 95% Confidence Interval of the slope
0
10
20
30
40
50
60
70
80
90
100
8/6/200
7
9/25/2
007
11/14
/2007
1/3/200
8
2/22/2
008
4/12/2
008
6/1/200
8
7/21/2
008
Student: Doe John; Target behavior: Words read correctly in one minute; Goal performance (90) by 6/3/2008.
Status
Status report: Intervention status is inconclusive, more data are required to increase confidence regarding success of the intervention
Using most decision rules this would be considered an inadequate response to interventionWhat do you think?
0
10
20
30
40
50
60
70
80
90
100
8/6/200
7
9/25/2
007
11/14
/2007
1/3/200
8
2/22/2
008
4/12/2
008
6/1/200
8
7/21/2
008
Student: Doe John; Target behavior: Words read correctly in one minute; Goal performance (90) by 6/3/2008.
Status
Status report: Intervention status is inconclusive, more data are required to increase confidence regarding success of the intervention
Are we ready to make a decision yet?
0
10
20
30
40
50
60
70
80
90
100
8/6/200
7
9/25/2
007
11/14
/2007
1/3/200
8
2/22/2
008
4/12/2
008
6/1/200
8
7/21/2
008
Student: Doe John; Target behavior: Words read correctly in one minute; Goal performance (90) by 6/3/2008.
Status
Status report: Intervention status is inconclusive, more data are required to increase confidence regarding success of the intervention
0
10
20
30
40
50
60
70
80
90
100
8/6/200
7
9/25/2
007
11/14
/2007
1/3/200
8
2/22/2
008
4/12/2
008
6/1/200
8
7/21/2
008
Student: Doe John; Target behavior: Words read correctly in one minute; Goal performance (90) by 6/3/2008.
Status :Green
Status report: Intervention on track.
0
10
20
30
40
50
60
70
80
90
100
8/6/200
7
9/25/2
007
11/14
/2007
1/3/200
8
2/22/2
008
4/12/2
008
6/1/200
8
7/21/2
008
Student: Doe John; Target behavior: Words read correctly in one minute; Goal performance (90) by 6/3/2008.
Status :Green
Status report: Intervention on track.
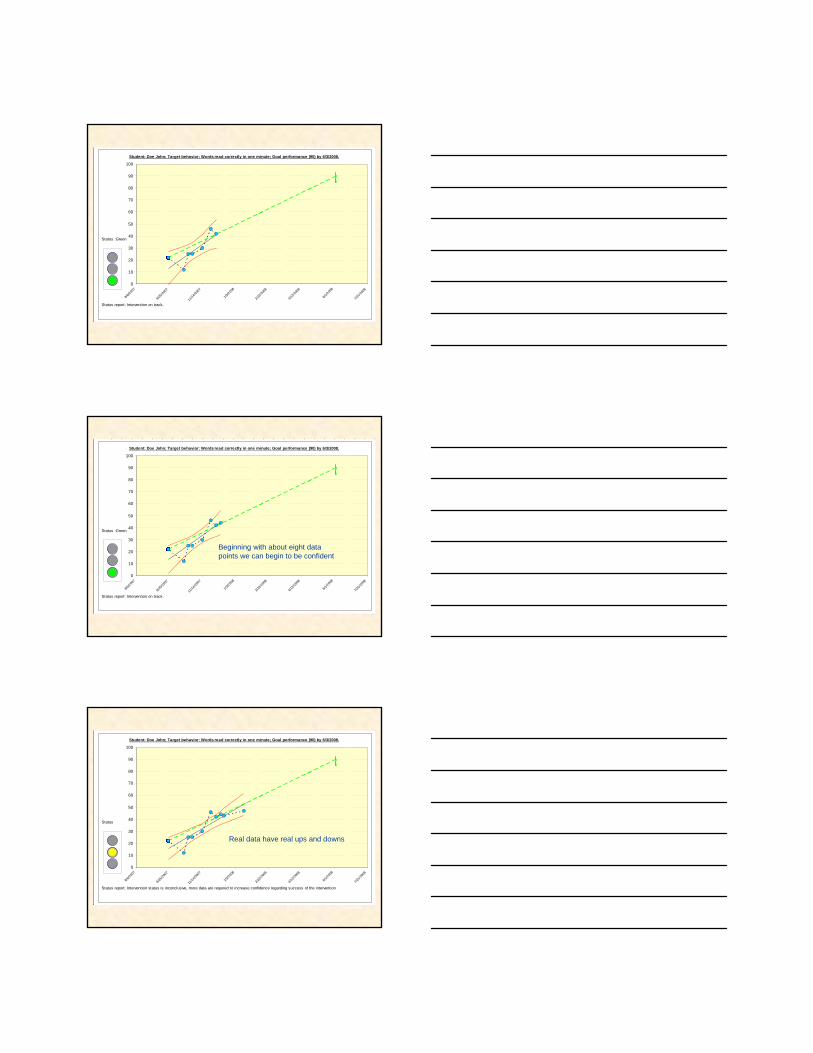
Beginning with about eight data points we can begin to be confident
0
10
20
30
40
50
60
70
80
90
100
8/6/200
7
9/25/2
007
11/14
/2007
1/3/200
8
2/22/2
008
4/12/2
008
6/1/200
8
7/21/2
008
Student: Doe John; Target behavior: Words read correctly in one minute; Goal performance (90) by 6/3/2008.
Status
Status report: Intervention status is inconclusive, more data are required to increase confidence regarding success of the intervention
Real data have real ups and downs

0
10
20
30
40
50
60
70
80
90
100
8/6/200
7
9/25/2
007
11/14
/2007
1/3/200
8
2/22/2
008
4/12/2
008
6/1/200
8
7/21/2
008
Student: Doe John; Target behavior: Words read correctly in one minute; Goal performance (90) by 6/3/2008.
Status :Green
Status report: Intervention on track.
95% Confidence interval(12.2 points)
0
10
20
30
40
50
60
70
80
90
100
8/6/200
7
9/25/2
007
11/14
/2007
1/3/200
8
2/22/2
008
4/12/2
008
6/1/200
8
7/21/2
008
Student: Doe John; Target behavior: Words read correctly in one minute; Goal performance (90) by 6/3/2008.
Status :Green
Status report: Intervention on track.
90% Confidence interval(10 points)
0
10
20
30
40
50
60
70
80
90
100
8/6/200
7
9/25/2
007
11/14
/2007
1/3/200
8
2/22/2
008
4/12/2
008
6/1/200
8
7/21/2
008
Student: Doe John; Target behavior: Words read correctly in one minute; Goal performance (90) by 6/3/2008.
Status :Green
Status report: Intervention on track.
80% Confidence interval(7.6 points)
0
10
20
30
40
50
60
70
80
90
100
8/6/200
7
9/25/2
007
11/14
/2007
1/3/200
8
2/22/2
008
4/12/2
008
6/1/200
8
7/21/2
008
Student: Doe John; Target behavior: Words read correctly in one minute; Goal performance (90) by 6/3/2008.
Status :Green
Status report: Intervention on track.
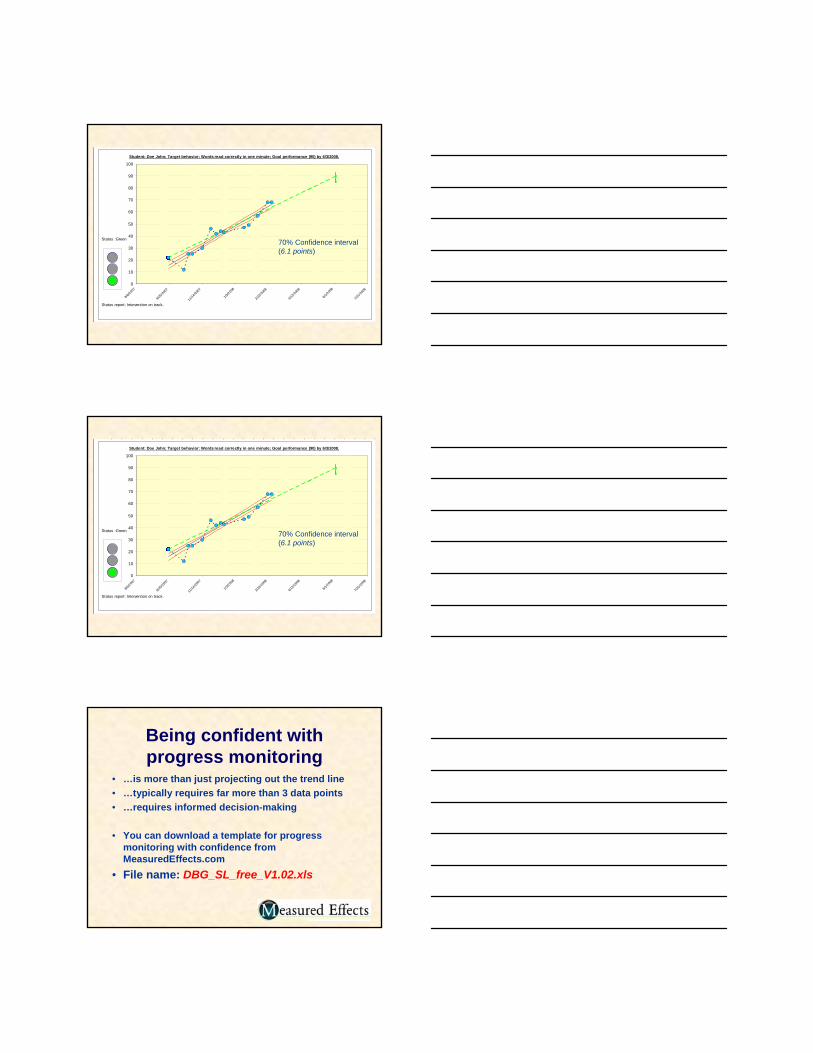
70% Confidence interval(6.1 points)
0
10
20
30
40
50
60
70
80
90
100
8/6/200
7
9/25/2
007
11/14
/2007
1/3/200
8
2/22/2
008
4/12/2
008
6/1/200
8
7/21/2
008
Student: Doe John; Target behavior: Words read correctly in one minute; Goal performance (90) by 6/3/2008.
Status :Green
Status report: Intervention on track.
70% Confidence interval(6.1 points)
Being confident with progress monitoring
• …is more than just projecting out the trend line• …typically requires far more than 3 data points• …requires informed decision-making
• You can download a template for progress monitoring with confidence from MeasuredEffects.com
• File name: DBG_SL_free_V1.02.xls
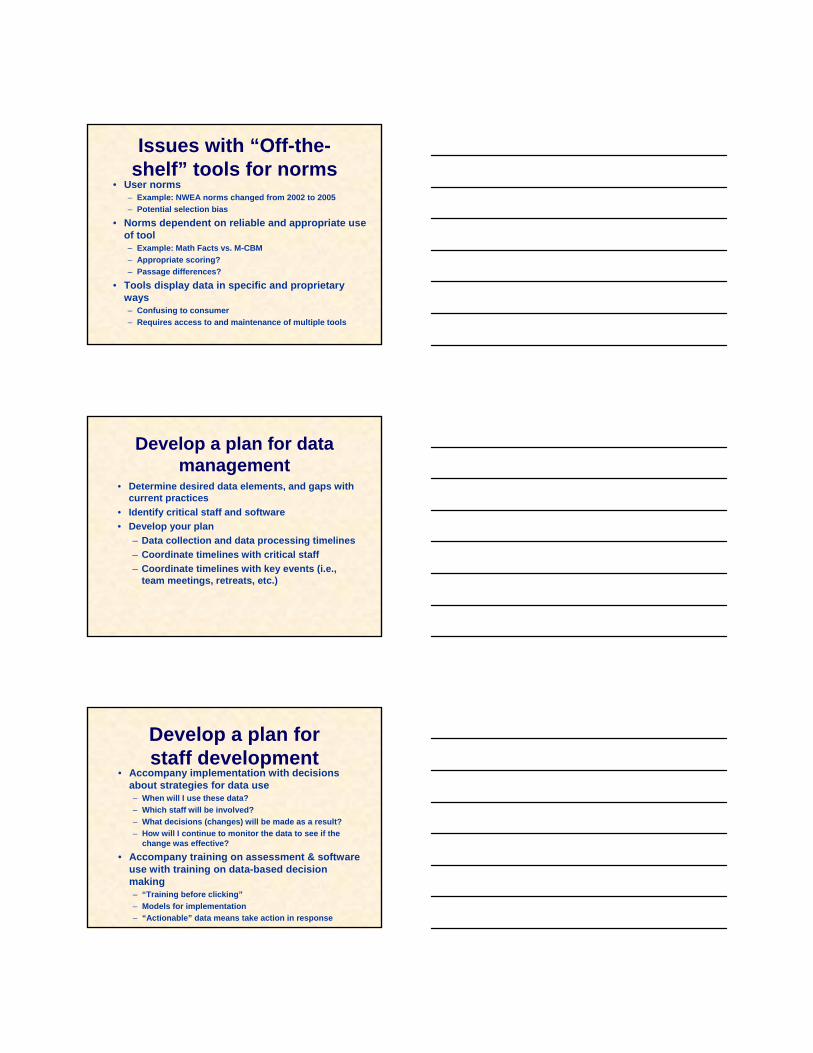
Issues with “Off-the-shelf” tools for norms
• User norms– Example: NWEA norms changed from 2002 to 2005– Potential selection bias
• Norms dependent on reliable and appropriate use of tool– Example: Math Facts vs. M-CBM– Appropriate scoring?– Passage differences?
• Tools display data in specific and proprietary ways– Confusing to consumer– Requires access to and maintenance of multiple tools
Develop a plan for data management
• Determine desired data elements, and gaps with current practices
• Identify critical staff and software• Develop your plan
– Data collection and data processing timelines– Coordinate timelines with critical staff– Coordinate timelines with key events (i.e.,
team meetings, retreats, etc.)
Develop a plan for staff development
• Accompany implementation with decisions about strategies for data use– When will I use these data?– Which staff will be involved?– What decisions (changes) will be made as a result?– How will I continue to monitor the data to see if the
change was effective?• Accompany training on assessment & software
use with training on data-based decision making– “Training before clicking”– Models for implementation– “Actionable” data means take action in response
Questions?Ben [email protected]://measuredeffects.com
Gary [email protected]://www.ilstu.edu/~glcates