Embed Size (px)
Citation preview
Beyond Dose Assessment
Using Risk with Full Disclosure of Uncertainty in Public and Scientific Communication
F. Owen Hoffman, David C. Kocher and A. Iulian Apostoaei
SENES Oak Ridge, Inc.Center for Risk Analysis
102 Donner DriveOak Ridge, TN 37830
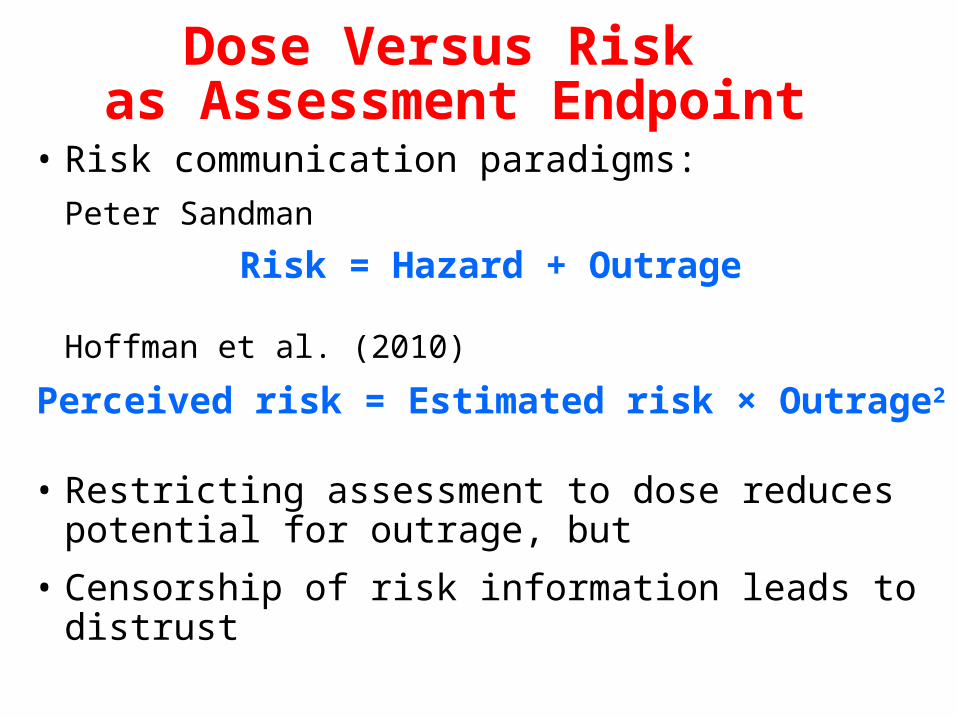
Dose Versus Risk as Assessment Endpoint
• Risk communication paradigms:
Peter Sandman
Risk = Hazard + Outrage
Hoffman et al. (2010)
Perceived risk = Estimated risk × Outrage2
• Restricting assessment to dose reduces potential for outrage, but
• Censorship of risk information leads to distrust
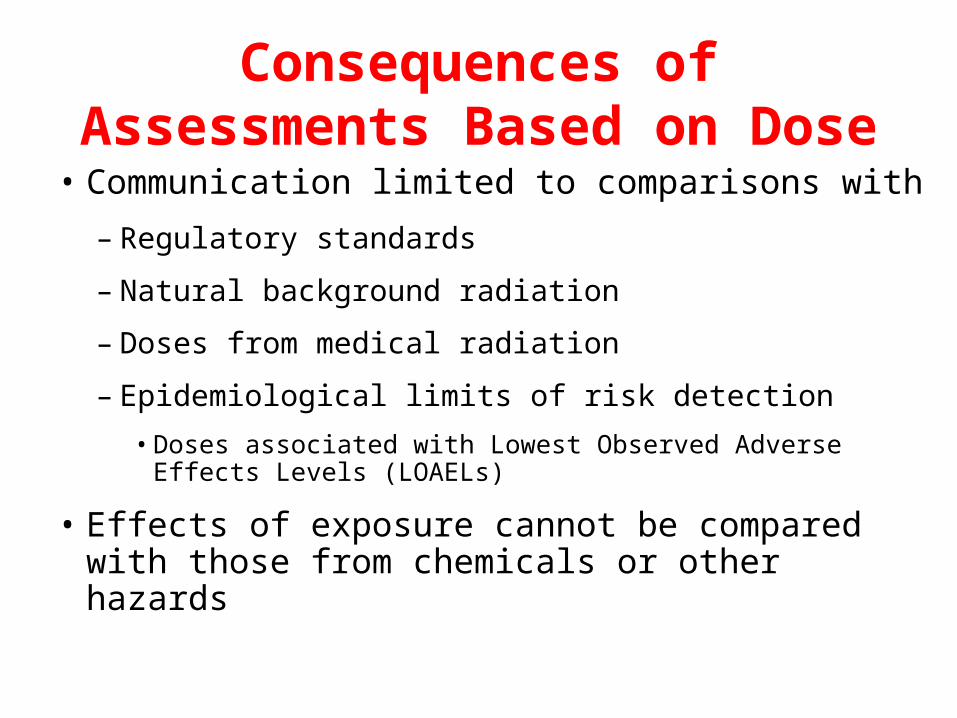
Consequences of Assessments Based on Dose
• Communication limited to comparisons with
– Regulatory standards
– Natural background radiation
– Doses from medical radiation
– Epidemiological limits of risk detection
• Doses associated with Lowest Observed Adverse Effects Levels (LOAELs)
• Effects of exposure cannot be compared with those from chemicals or other hazards
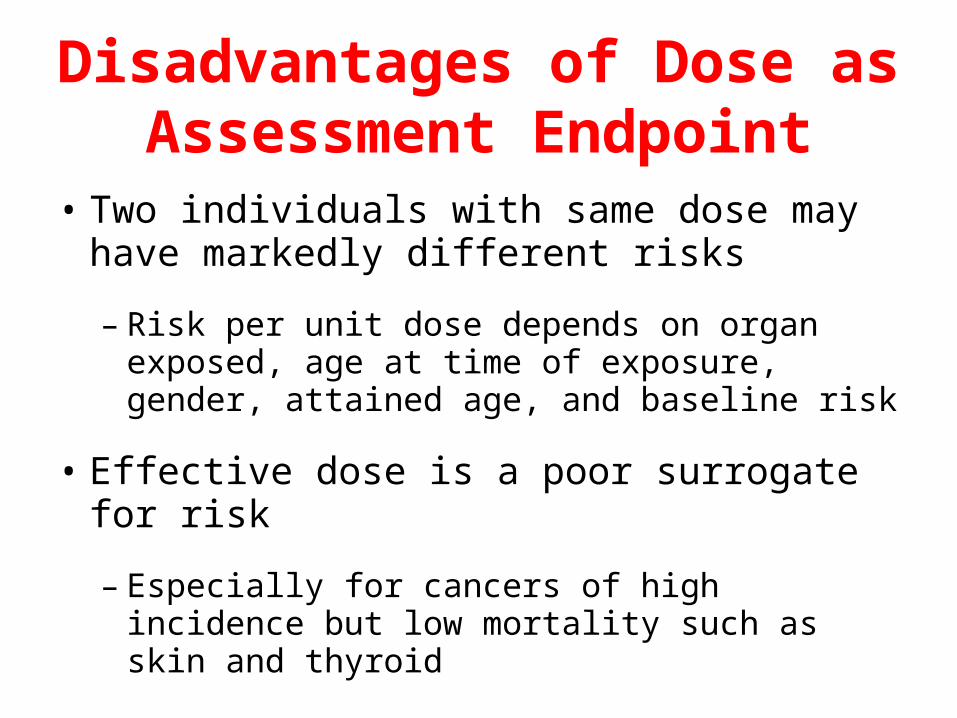
Disadvantages of Dose as Assessment Endpoint
• Two individuals with same dose may have markedly different risks
– Risk per unit dose depends on organ exposed, age at time of exposure, gender, attained age, and baseline risk
• Effective dose is a poor surrogate for risk
– Especially for cancers of high incidence but low mortality such as skin and thyroid
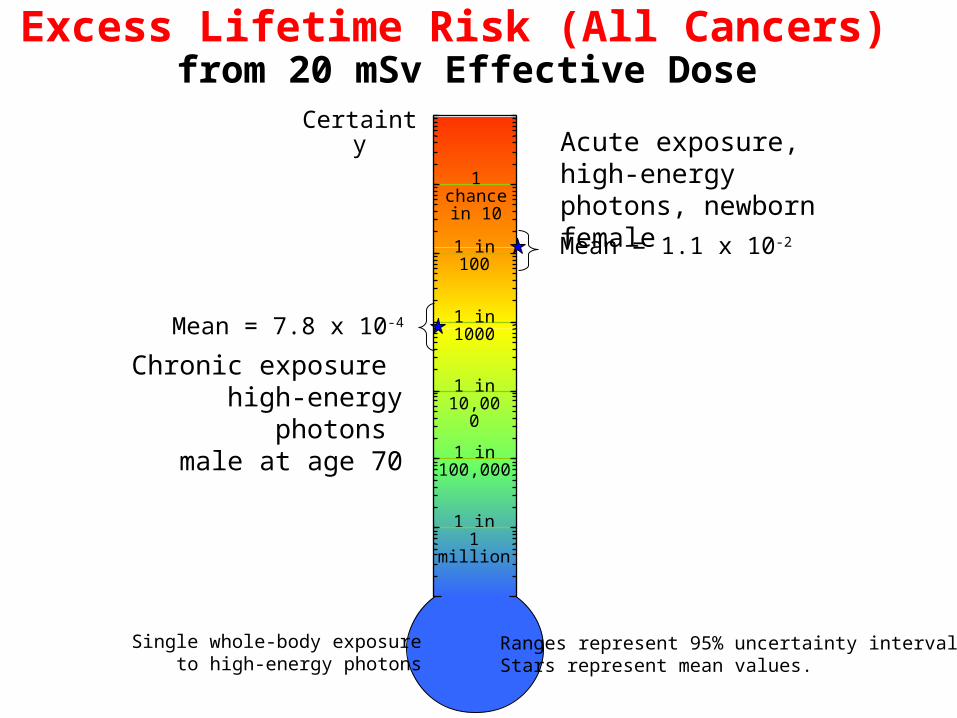
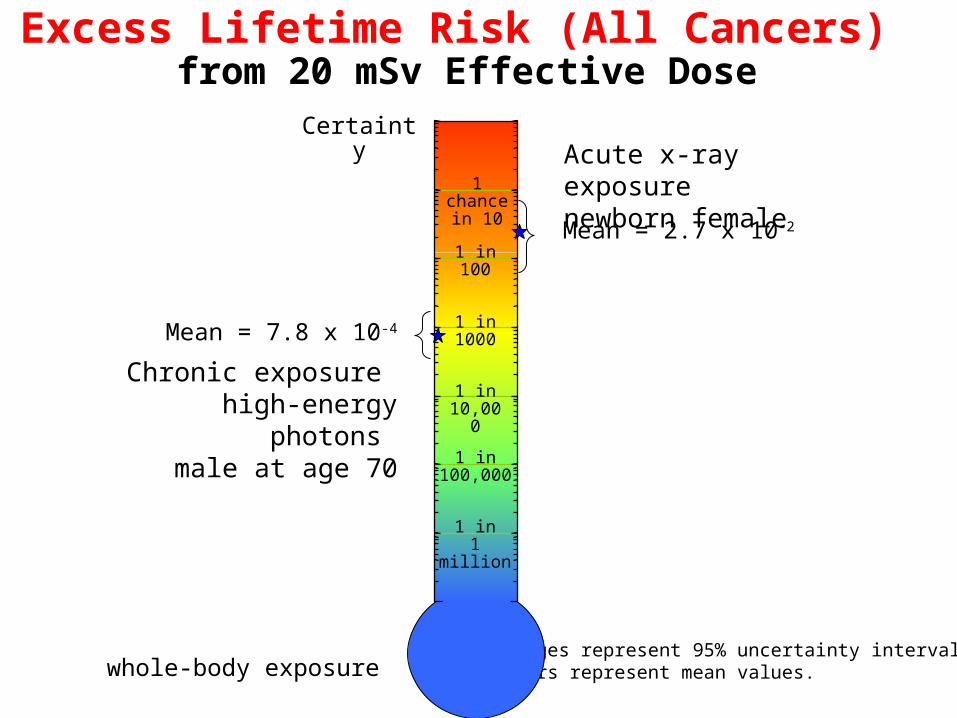
Excess Lifetime Risk (All Cancers) from 20 mSv Effective Dose
Certainty
1 in1 million
1 chancein 10
1 in100
1 in1000
1 in 10,000
1 in100,000
Acute exposure, high-energy photons, newborn female
Mean = 1.1 x 10⁻²
Ranges represent 95% uncertainty intervals.Stars represent mean values.
Chronic exposure high-energy photons
male at age 70
Mean = 7.8 x 10⁻⁴
Single whole-body exposureto high-energy photons
Excess Lifetime Risk (All Cancers) from 20 mSv Effective Dose
Ranges represent 95% uncertainty intervals.Stars represent mean values.whole-body exposure
Certainty
1 in1 million
1 chancein 10
1 in100
1 in1000
1 in 10,000
1 in100,000
Chronic exposure high-energy photons
male at age 70
Mean = 7.8 x 10⁻⁴
Acute x-ray exposurenewborn female
Mean = 2.7 x 10⁻²
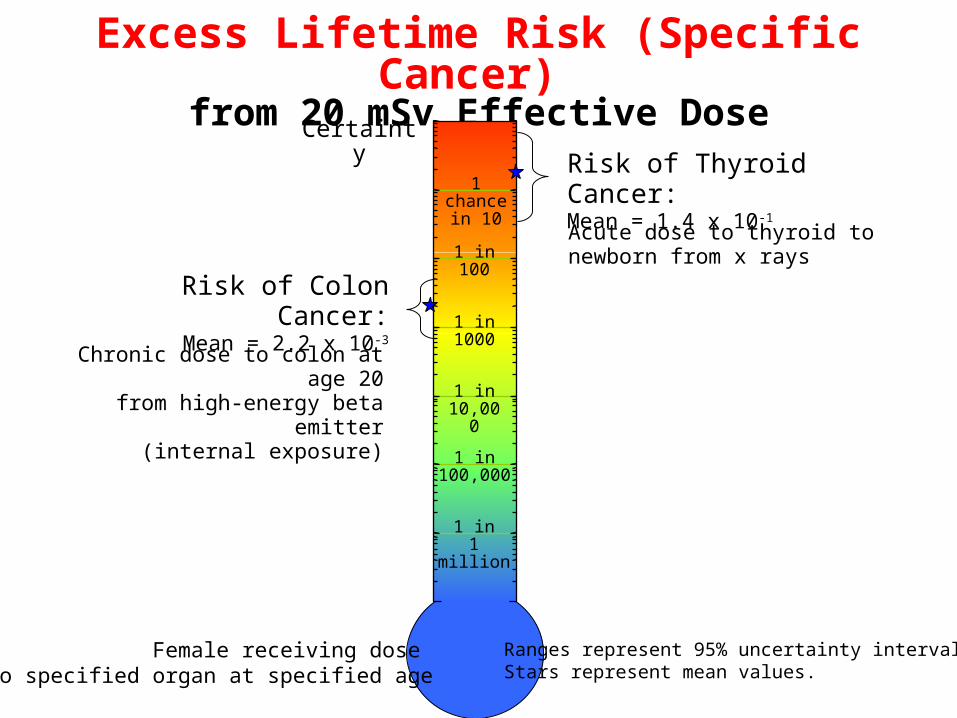
Excess Lifetime Risk (Specific Cancer) from 20 mSv Effective Dose
Certainty
1 in1 million
1 chancein 10
1 in100
1 in1000
1 in 10,000
1 in100,000
Chronic dose to colon at age 20from high-energy beta emitter
(internal exposure)
Risk of Colon Cancer:Mean = 2.2 x 10⁻³
Acute dose to thyroid to newborn from x rays
Risk of Thyroid Cancer:Mean = 1.4 x 10⁻¹
Ranges represent 95% uncertainty intervals.Stars represent mean values.
Female receiving dose to specified organ at specified age
The public has legitimate questions about risk from
radiation exposure;these questions deserve answers
When Addressing Questions about Risk
• Include information about uncertainty
– Uncertainty represents state of knowledge
– 95% uncertainty ranges more informative than central “best estimate” value
• Put risk estimates into perspective
– Compare with other risks
– Communicate benefits, if any
Examples of Risk Evaluations for Major Exposure Situations
• Indoor Radon
• CT scans in medicine
• Fallout from atmospheric testing of nuclear weapons
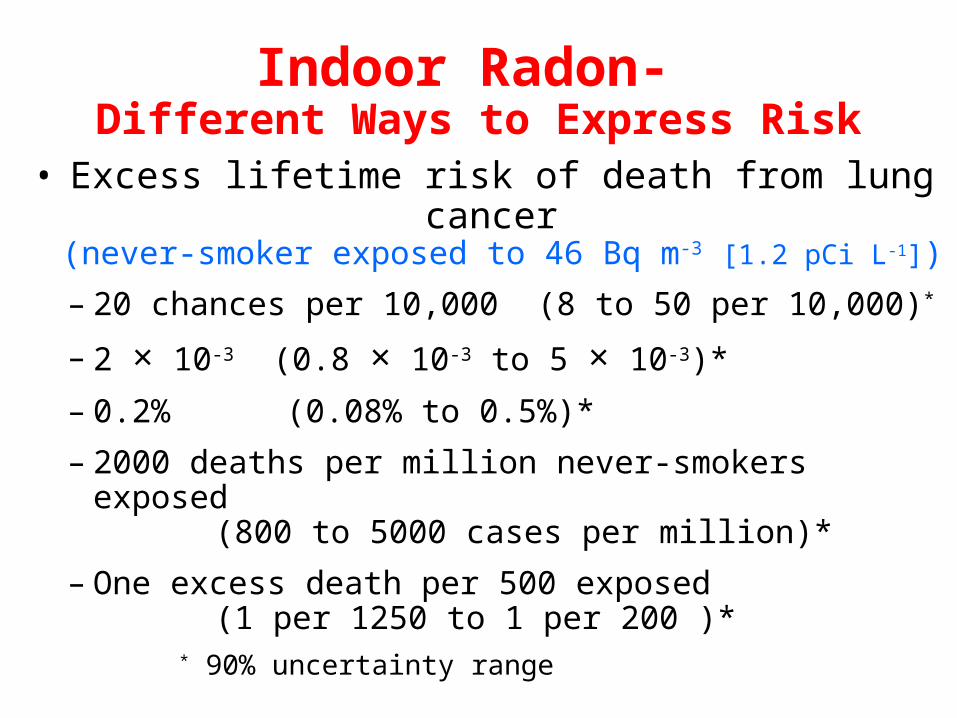
Indoor Radon- Different Ways to Express Risk
• Excess lifetime risk of death from lung cancer (never-smoker exposed to 46 Bq m-3 [1.2 pCi L-1])
– 20 chances per 10,000 (8 to 50 per 10,000)*
– 2 × 10⁻³ (0.8 × 10⁻³ to 5 × 10⁻³)*
– 0.2% (0.08% to 0.5%)*
– 2000 deaths per million never-smokers exposed (800 to 5000 cases per million)*
– One excess death per 500 exposed (1 per 1250 to 1 per 200 )*
* 90% uncertainty range
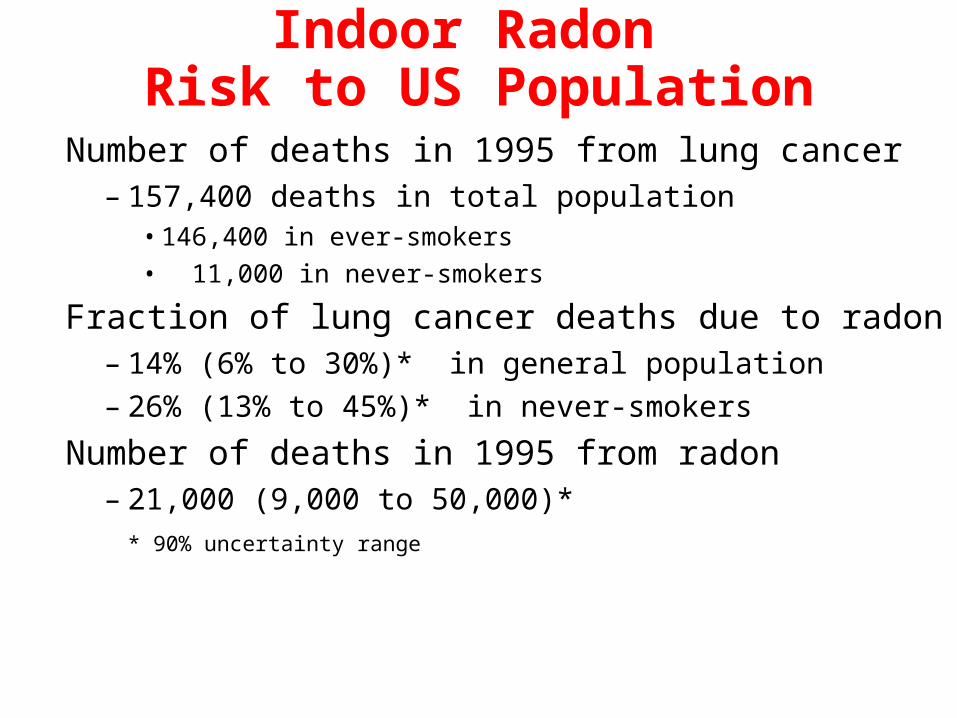
Indoor Radon Risk to US Population
Number of deaths in 1995 from lung cancer – 157,400 deaths in total population
• 146,400 in ever-smokers
• 11,000 in never-smokers
Fraction of lung cancer deaths due to radon– 14% (6% to 30%)* in general population
– 26% (13% to 45%)* in never-smokers
Number of deaths in 1995 from radon– 21,000 (9,000 to 50,000)*
* 90% uncertainty range
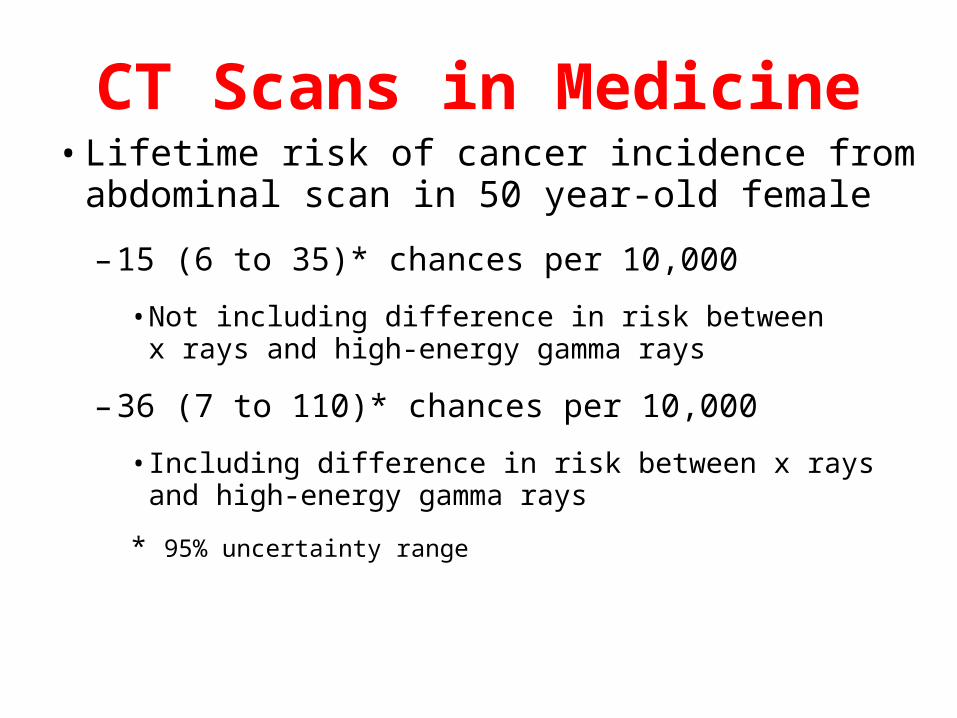
CT Scans in Medicine• Lifetime risk of cancer incidence from
abdominal scan in 50 year-old female
– 15 (6 to 35)* chances per 10,000
• Not including difference in risk between x rays and high-energy gamma rays
– 36 (7 to 110)* chances per 10,000
• Including difference in risk between x rays and high-energy gamma rays
* 95% uncertainty range
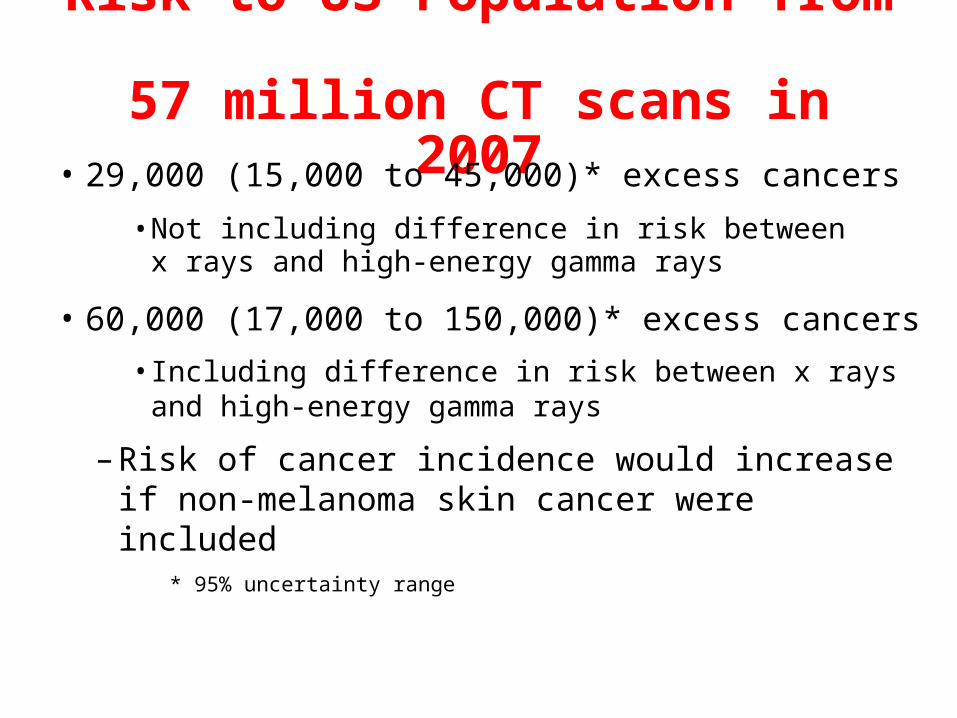
Risk to US Population from 57 million CT scans in 2007
• 29,000 (15,000 to 45,000)* excess cancers
• Not including difference in risk between x rays and high-energy gamma rays
• 60,000 (17,000 to 150,000)* excess cancers
• Including difference in risk between x rays and high-energy gamma rays
– Risk of cancer incidence would increase if non-melanoma skin cancer were included
* 95% uncertainty range
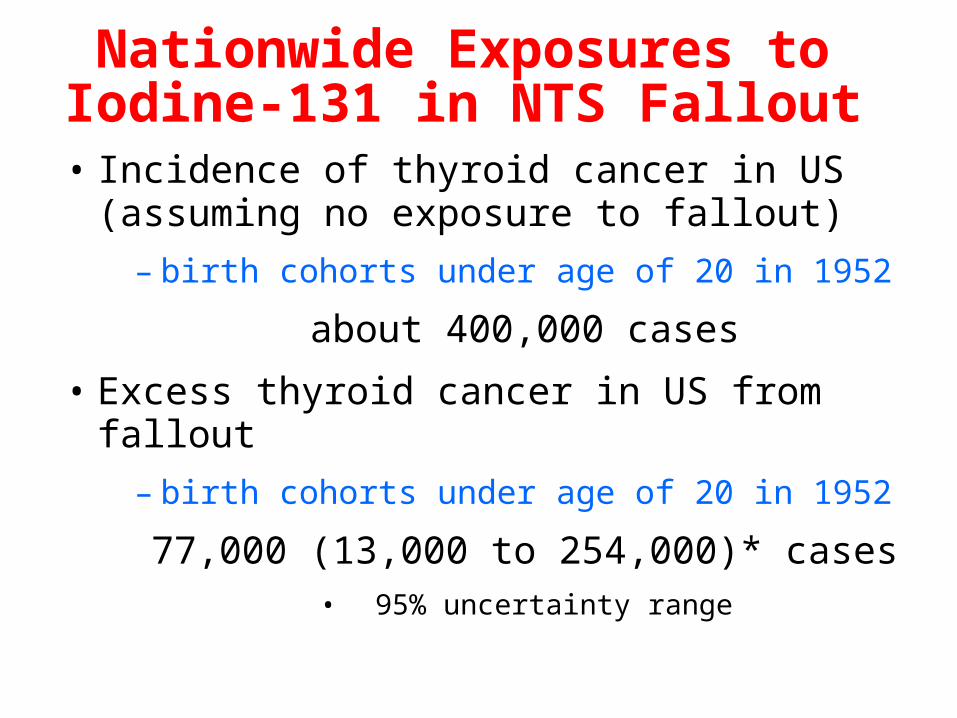
Nationwide Exposures to Iodine-131 in NTS Fallout
• Incidence of thyroid cancer in US (assuming no exposure to fallout)
– birth cohorts under age of 20 in 1952
about 400,000 cases
• Excess thyroid cancer in US from fallout
– birth cohorts under age of 20 in 1952
77,000 (13,000 to 254,000)* cases• 95% uncertainty range
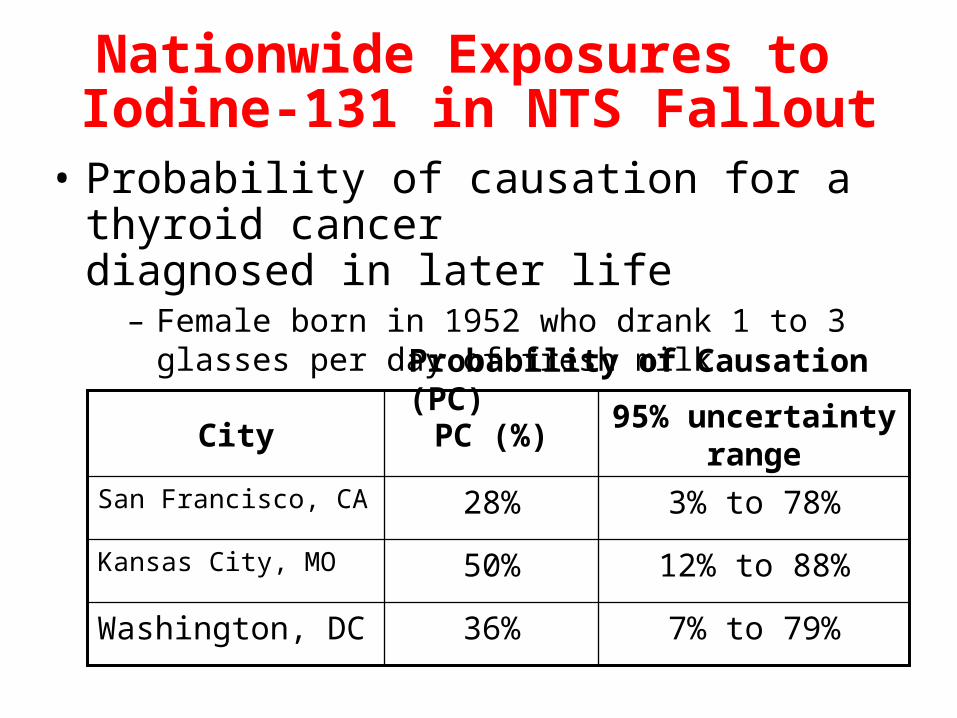
Nationwide Exposures to Iodine-131 in NTS Fallout
• Probability of causation for a thyroid cancer diagnosed in later life
– Female born in 1952 who drank 1 to 3 glasses per day of fresh milk
95% uncertainty range
PC (%)City
7% to 79%36%Washington, DC
12% to 88%50%Kansas City, MO
3% to 78%28%San Francisco, CA
Probability of Causation (PC)
Placing Risk into Perspective
Challenge is to Communicate Risk to a Public Unfamiliar with Concept of
Risk Expressed as a Probability
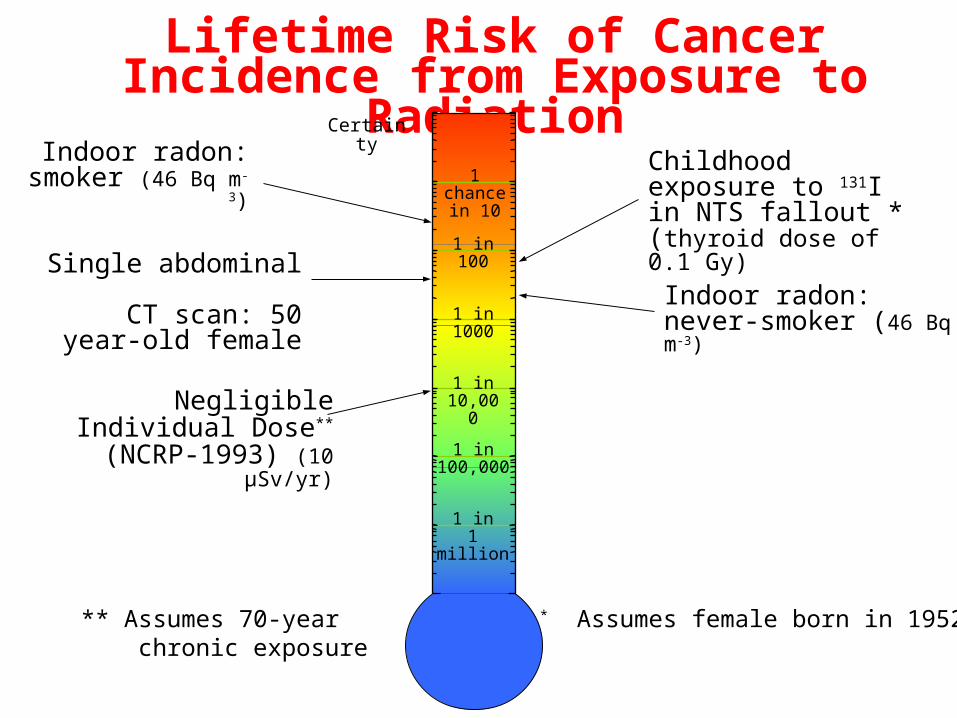
Lifetime Risk of Cancer Incidence from Exposure to Radiation
Certainty
Indoor radon: smoker (46 Bq m-3)
Indoor radon: never-smoker (46 Bq m-3)
1 in1 million
1 chancein 10
1 in100
1 in1000
1 in 10,000
1 in100,000
* Assumes female born in 1952
Childhood exposure to 131I in NTS fallout *(thyroid dose of 0.1 Gy)
Single abdominal CT scan: 50 year-old
female
Negligible Individual Dose**
(NCRP-1993) (10 µSv/yr)
** Assumes 70-year chronic exposure
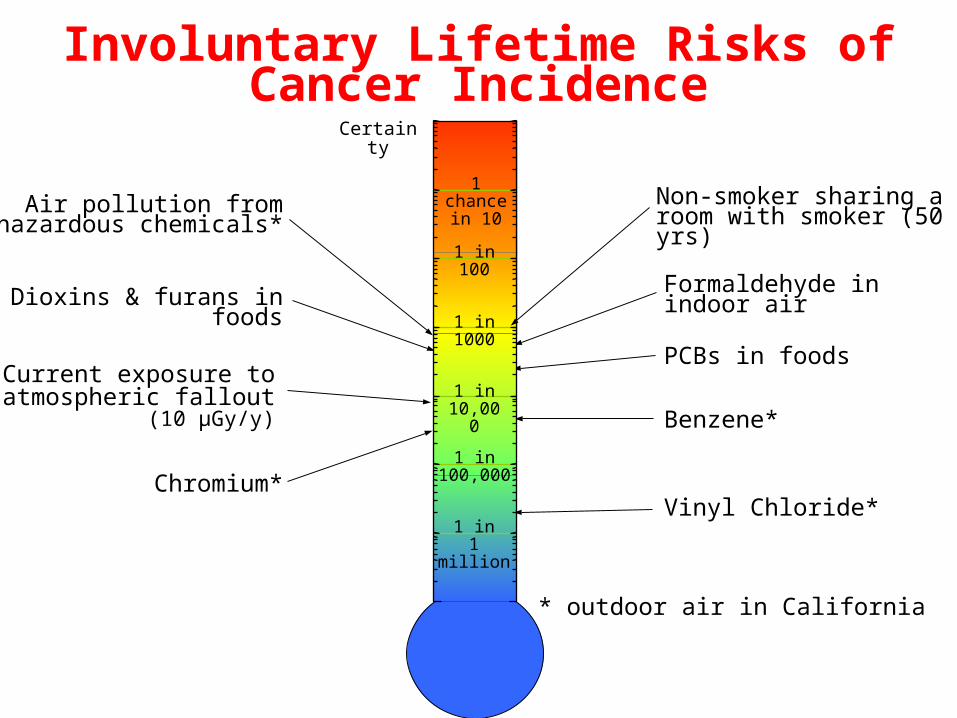
Involuntary Lifetime Risks ofCancer Incidence
Certainty
Dioxins & furans in foods
Current exposure toatmospheric fallout
(10 µGy/y)
Chromium*
Formaldehyde inindoor air
PCBs in foods
Non-smoker sharing a room with smoker (50 yrs)
1 in1 million
1 chancein 10
1 in100
1 in1000
1 in 10,000
1 in100,000
Benzene*
Vinyl Chloride*
Air pollution fromhazardous chemicals*
* outdoor air in California
What Have We Learned from Risk Assessment?
• Medical exposures now a leading source of future radiation risk to general population
– Assessments should account for
• Risk due to exposure to x rays vs. high-energy gamma rays
• Risk from incidence of non-fatal skin cancer
• Indoor radon is second leading cause of lung cancer
– May cause from 6% to 30% of lung cancers in general population
What Have We Learned from Risk Assessment?
• Thyroid cancers from childhood exposures to 131I in weapons fallout would be compensable nationwide
– If risk criteria established for compensation of energy employees were extended to public
• (i.e., upper 99th percentile of estimate of probability of causation equals or exceeds 50%)
A Vision for the Future• Radiation risk assessment embraced by regulatory
and health protection communities
• Uncertainty in risk used for decision-making
– Uncertainty represents limits to our state of knowledge about risk
– Uncertainty can include alternative hypotheses about effects at low dose
• Risk communication overcomes concern that
– Risk estimation may alarm, if not harm, an otherwise uninformed public