Embed Size (px)
Citation preview

Beyond forecasting: Find your future in an uncertain energy market
By developing a set of future scenarios, executives can identify the indicators that tell which direction markets are headed.
By Jorge Leis and Mark Gottfredson

Jorge Leis is a partner with Bain & Company in Houston, where he leads the
fi rm’s Oil & Gas practice in the Americas. Mark Gottfredson is a Bain partner
in Dallas.
Copyright © 2013 Bain & Company, Inc. All rights reserved.

Beyond forecasting: Find your future in an uncertain energy market
1
Imagine if you could have seen North America’s shale gas phenomenon coming years ahead of the competi-tion. What might you have done differently? Some com-panies might have avoided spending billions of dollars on liquefied natural gas (LNG) import facilities in the US. Some might have acquired acreage before hyper-inflation escalated land values tenfold or more in some areas. Others would have reallocated capital to better position their companies for the onslaught of natural gas and natural gas liquids (NGLs). If you had seen it coming, would you have anticipated the global com-petitive advantage of US domestic industries, from manufacturing to fertilizer to plastics to coal, and the resulting changes to international flows?
Hindsight is 20/20, but there were indicators that pointed to the plausibility of a shale gas supply shock. What was missing from most leadership teams’ strategic planning processes was a systematic approach for identifying plausible scenarios and defining the leading indicators to monitor the market’s evolution toward them. Such a process would have helped executives not only to gauge the magnitude of the supply shock, but also make the most of its far-reaching effects.
Of course, predicting markets is difficult and entails risks. But the challenge is particularly acute in today’s energy markets, where vast new supplies of oil and gas are suddenly entering the market at the lower ends of the cost curves, sending shocks through the energy in-dustry as well as other sectors that are energy intensive or rely on petrochemicals for feedstock. Hydrocarbons from unconventional sources—tight oil and shale gas, in particular—are changing the economic dynamics and competitive positioning with remarkable speed, even though no consensus exists on how much can be extracted economically, and thus how sustainable these supplies are. Still, the stakes are enormous, as the in-flux of these comparatively inexpensive fuel sources threatens to upend entire industries, shake up compet-itive positions and destroy the economics of previously profitable ventures.
The same indicators that might have helped executives see the shale gale coming years ago continue to send signals today. What can you learn from them about how to best position yourself for the years ahead? The key is
to develop a rigorous process for identifying plausible future states for energy markets, based on supply poten-tials for gas, oil and renewables, and acting on leading indicators of movement toward one or more scenarios. Bain & Company has built a series of plausible scenar-ios based on analytical models of potential outcomes. Some include very surprising results, such as a global oil price of less than $60 per barrel, where oil-indexed pricing for natural gas would actually favor buyers.
In our experience, many companies need this approach for understanding the evolution of the energy ecosystem at a time of unprecedented uncertainty. Executive teams can extract insights by comparing multiple, plausible futures—corner scenarios in our model—and defining signposts to support better, real-time decision making, with the benefit of clearer, longer-range visibility. These signposts are sets of potentially disruptive changes in the marketplace that shape strategic decisions. In the energy industry, signposts can give foresight on supply and demand shocks. For example, the volume of North American tight oil entering the market would be a sign-post that helps companies make strategic decisions about investment and substitution. Leading indicators such as capital expenditures in exploration, production and midstream infrastructure all help shed light on whether that signpost is imminent (see Figure 1). It’s a forward-looking process that anticipates disruptive change and informs executives for better decision mak-ing. At its best, it can cast the headlights out one to three years further than competitors can see, offering an opportunity to create and sustain significant com-petitive advantage.
Evidence of disruption
The uncertainty that challenges executives today stems from the fact that crude oil, natural gas and NGL mar-kets in the US have all experienced supply shocks in recent years, due to the rise of unconventional sources. Tight oil is the fastest-growing supply of crude oil, post-ing gains of 42% per year from 2009 to 2012. Shale gas, nonexistent as a supply source just a dozen years ago, now rivals all conventional sources. NGLs are ex-periencing unprecedented growth rates as well. And regulatory regimes around the world have been subsi-dizing renewables, leading to significant cost reductions

2
Beyond forecasting: Find your future in an uncertain energy market
facturers competitive again. Specifically, ethane-based ethylene manufacturers in the US are putting severe pressure on naphtha-based ethylene manufacturers worldwide. Abundant propane and butane have also made the US competitive in liquefied petroleum gas (LPG), tripling the amount it exports since 2008.
Still, the global impact of US shale gas and tight oil is up for debate. No one knows how much of it can be recovered economically, so we can’t know the sustain-ability of these supply shocks.
This uncertainty contributes to wildly different expecta-tions for crude oil and natural gas production in North America. In the case of crude oil, production forecasts out to 2030 vary from a net reduction to a near doubling of today’s volumes. For natural gas, production estimates vary by about 50% above or below today’s estimates.
Supply shocks and substitution
Our approach to managing this uncertainty begins with the observation that we can capture the dynamics shap-
and the potential for green sources to become compet-itive within reasonable time frames.
The sheer magnitude of production and the location of unconventional formations are creating infrastructure bottlenecks that constrain oil and gas flows to demand markets. This has resulted in the decoupling of natural gas and oil prices in the US—and cheaper gas prices here than in the rest of the world. Another sign of this bottleneck between supply and demand has shown up in the spread on crude oil prices: West Texas Interme-diate prices (representative of prices obtained by US suppliers) have been far below Brent prices (those more commonly seen on international markets). This differ-ence has decreased in recent months as infrastructure to move the crude has started to catch up with output, but lower-priced domestic crude continues to displace light imports, while heavy Canadian crude is beginning to displace other heavy crude imports into the US.
NGL supplies from “wet plays”—those wells that deliver high liquids content in addition to gas—have shaken up the global petrochemical industry, making US manu-
Figure 1: Examples of signposts and leading indicators for crude oil supply and demand
Production growth
Leading indicators for North American tight oil
Source: Bain analysis
• Canadian oil sands
• Brazilian deep water
• Other potential supply shocks from Iraq, Kurdistan, Mexico or other countries
• North American tight oil
• E&P Capex budgets
• Planned midstream infrastructure projects
• Experience curve progressions
• EURs and technically recoverable reserves estimates
• OPEC quotas and production
• Spare capacity
• Oil consumption in developing nations
• Economic growth in emerging markets
OPEC’s influence
Crude oil signposts
Demand growth

Beyond forecasting: Find your future in an uncertain energy market
3
ing the energy ecosystem along three major vectors: the supply of natural gas,1 the supply of crude oil and the pen-etration of renewables2 in the total energy mix. The per-mutations of supply levels for each of these fuel sources result in a set of eight plausible scenarios (see Figure 2). Within each scenario, we extrapolate cost experience curves for each fuel source, the efficiency gains that result from cumulative experience of months and years of practical application. Applying the economics of these efficiency gains alters the shape of their respective sup-ply curves and sets new clearing prices. We use these new fuel-source prices to calculate intrafuel substitution, such as shale gas for coal bed methane (CBM) gas, and also interfuel substitutions, such as natural gas for coal. Regulatory actions and technology breakthroughs can make renewables competitive and lead to substitution away from fossil fuels. We considered the constraints on infrastructure build-out in order to determine plau-sible production forecasts.
Balancing supply and demand by industry sector (power generation, transportation, industrial heating and power, and industrial feedstock) as the final step reveals mate-
rial differences in the energy mix for total consumption (see Figure 3). Some interesting findings:
• High production volumes of shale gas and tight oil would lead to a scenario in which coal and renew-ables are priced out by cheaper hydrocarbon fuels, and the US stops importing oil and gas from out-side North America.
• If renewables continue on their trajectory of cost reduction and experience a breakthrough in storage technology, we may shift to a scenario where a signif-icant percentage of power generation and transpor-tation comes from clean sources.
• If, on the other hand, shale gas and tight oil prove to be less available or harder to extract than antici-pated, we could see a coal renaissance and mount-ing pressure to impose stricter climate legislation in the US.
Despite the material differences, we see some common-alities across the scenarios:
Figure 2: Corner scenarios coincide with permutations of high and low supply for three commodity types
Source: Bain analysis
HydrocarbonStarved
Gas Land
Oil Rebirth
HydrocarbonWorld
Green Nirvana
GreenBreakthrough
Feuding Fuels
Green Mandate1
3
7
5
Gas supply
Oilsupply
Renewables
4
2
8
6
• Unconventional and ambitious conventional oil and gas falter• Carbon-friendly legislation induces a coal renaissance
• Limited oil; abundant shale gas • Low gas prices curb political will and economic incentives to mandate/invest in renewables
• Abundant oil globally; limited gas• Carbon-friendly legislation induces a coal renaissance
• Both shale gas and global oil thrive• Low gas prices curb political will and economic incentives to mandate/invest in renewables
• Unconventional and conventional oil and gas falter• High oil and gas prices drive broad adoption of renewables
• Limited oil; abundant shale gas• Continued innovation allows renewables to compete, despite low gas prices
• Abundant oil; limited gas• Expensive gas and limits to oil power generation drive adoption of renewables
• Shale gas and global oil thrive• Continued innovation pushes renewables adoption, despite low oil and gas prices
1
2
3
4
5
6
7
8

4
Beyond forecasting: Find your future in an uncertain energy market
The share of the fuel mix from coal and renewables varies widely, too:
• Renewables could supply between 10% and 25% of the total energy mix.
• Coal could supply between 15% and 30% of the mix.
As we noted earlier, the fundamental drivers of vari-ability across scenarios include the application of expe-rience curves and efficiency gains to different supply potentials as we estimate future commodity supply levels, as well as substitution barriers (how easy or difficult it is for one fuel to substitute for another). For example, when natural gas prices fell to around $2 per MMBtu, drilling rigs in the US rapidly transferred to more liquid-rich plays such as the Bakken. However, basic infra-structure could not keep up, leading to gas flaring—burning off excess gas when the infrastructure isn’t in place to transport it for more useful purposes—and a temporary decoupling of US oil prices from interna-tional prices. Consider the scenario that we call Hydro-carbon World, in which tight oil supplies from North America in 2030 are far greater than estimates from
• Oil will continue to be the dominant energy source for the transportation sector through 2030, notwith-standing some very interesting inroads from elec-tricity and natural gas under some scenarios.3
• At the other end of the spectrum, the supply mix of industrial feedstock can vary widely depending on interfuel pricing dynamics.
• Coal will continue to be a critical component of the total energy mix, driven by low-cost, coal-fired power generation.4
Collectively, these scenarios yield a wide range of pro-duction and prices for US oil and gas in 2030:
• Oil production could range between 8 million and 14 million barrels per day, with prices between $60 and $130 per barrel (in 2012 dollars).
• Natural gas production could range from less than 50 billion cubic feet per day (bcfd) to more than 120 bcfd (depending on exports), with prices between $4 and $12 per million British thermal units (MMBtu).
Figure 3: Each scenario reveals significant differences in energy consumption
Sources: EIA and Bain analysis
US energy consumption, by fuel (QBTU)
2030 EIAreference
HydrocarbonStarved
Gas Land Oil Rebirth HydrocarbonWorld
GreenNirvana
GreenMandate
Feuding Fuels GreenBreakthrough
0
25
50
75
100
125
104 104 103 104 104 102 102 102 102
Oil NG NGL Coal Renew Nuclear Imports
Beyond forecasting: Find your future in an uncertain energy market
5
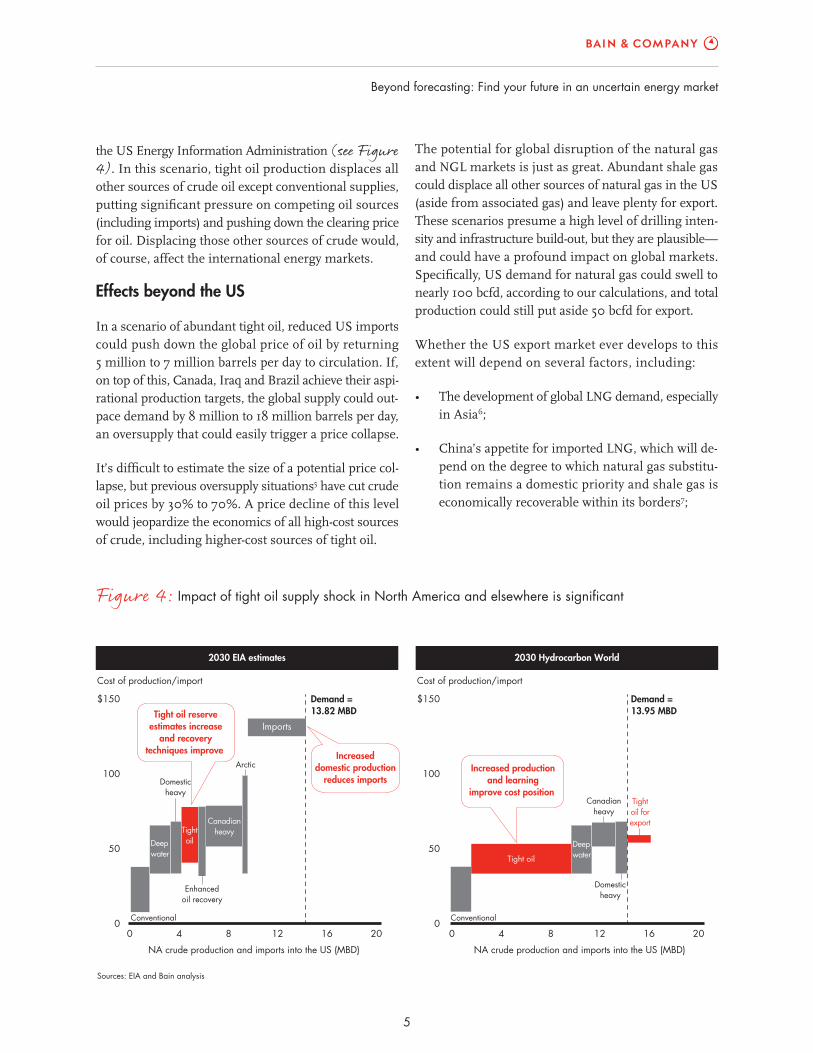
The potential for global disruption of the natural gas and NGL markets is just as great. Abundant shale gas could displace all other sources of natural gas in the US (aside from associated gas) and leave plenty for export. These scenarios presume a high level of drilling inten-sity and infrastructure build-out, but they are plausible—and could have a profound impact on global markets. Specifically, US demand for natural gas could swell to nearly 100 bcfd, according to our calculations, and total production could still put aside 50 bcfd for export.
Whether the US export market ever develops to this extent will depend on several factors, including:
• The development of global LNG demand, especially in Asia6;
• China’s appetite for imported LNG, which will de-pend on the degree to which natural gas substitu-tion remains a domestic priority and shale gas is economically recoverable within its borders7;
the US Energy Information Administration (see Figure 4). In this scenario, tight oil production displaces all other sources of crude oil except conventional supplies, putting significant pressure on competing oil sources (including imports) and pushing down the clearing price for oil. Displacing those other sources of crude would, of course, affect the international energy markets.
Effects beyond the US
In a scenario of abundant tight oil, reduced US imports could push down the global price of oil by returning 5 million to 7 million barrels per day to circulation. If, on top of this, Canada, Iraq and Brazil achieve their aspi-rational production targets, the global supply could out-pace demand by 8 million to 18 million barrels per day, an oversupply that could easily trigger a price collapse.
It’s difficult to estimate the size of a potential price col-lapse, but previous oversupply situations5 have cut crude oil prices by 30% to 70%. A price decline of this level would jeopardize the economics of all high-cost sources of crude, including higher-cost sources of tight oil.
Figure 4: Impact of tight oil supply shock in North America and elsewhere is significant
Sources: EIA and Bain analysis
2030 EIA estimates 2030 Hydrocarbon World
0
50
100
$150
0 4 8 12 16 20
Cost of production/import
Demand =13.82 MBD
Enhancedoil recovery
Domesticheavy
Arctic
CanadianheavyTight
oilDeepwater
Conventional
NA crude production and imports into the US (MBD)
Increaseddomestic production
reduces imports
Tight oil reserveestimates increase
and recoverytechniques improve
0 4 8 12 16 200
50
100
$150
Cost of production/import
NA crude production and imports into the US (MBD)
Canadianheavy
Tight oil
Domesticheavy
Tightoil forexport
Demand =13.95 MBD
Deepwater
Conventional
Increased productionand learning
improve cost position
Imports

6
Beyond forecasting: Find your future in an uncertain energy market
These descriptions offer a mixed bag of global and re-gional effects, so it’s important to develop good market definitions by commodity, apply cost experience curves and assess substitution barriers. Oil is the most global and liquid of the energy commodities. More than 60% of oil trades across regions (according to the 2012 BP Statistical Review of World Energy), and cost experience curves apply more to the source—for example, deep water production—than to regions. Price variations across regions result from infrastructure gaps and limited abilities to substitute, both of which can be taken into account in the model. Coal is less global than oil, but global trade is increasing, including US exports to Europe and China.
In sharp contrast to oil, natural gas is primarily a re-gional market: 70% of natural gas is consumed domes-tically, 20% is traded regionally by pipeline and 10% is traded globally as LNG. High liquefaction and trans-portation costs associated with LNG and pipeline con-straints can cause price disconnects across regions.
Renewables and nuclear market definitions fall some-
• The ability of a multitude of liquefaction projects across the globe to deliver on time and on budget (significant LNG supply, scheduled to come on line by the end of this decade, is rated at lower landed cost to Asia than from the US);
• The speed of US regulatory approvals.
Each region will find itself at different positions within our scenario cube, depending on how supplies play out (see Figure 5). It’s also clear that we can describe and track the variables that define the trajectories across the cube. Today, North America has abundant natural gas supply, an emerging supply of tight oil and growing but still unsubstantial renewables. Western Europe is at a crossroads between the Hydrocarbon Starved and Green Nirvana scenarios: Low supplies of oil and gas are precipitating a coal renaissance, but there is also a strong policy push toward renewables. China is Hydro-carbon Starved and likely to remain so for some time with its growing energy needs—but under a strong policy push to reduce reliance on coal and increase use of natu-ral gas and renewables.
Figure 5: Today, regions are in different places in the cube
Source: Bain analysis
3
7
5
Gas supply
Oilsupply
Renewables
4
2
8
6
North AmericaIn the middle
• Lots of natural gas
• Emerging supply of tight oil
• Renewables growing, but less than in Europe
ChinaHydrocarbon
Starved
• Energy supply is about 65% coal
• Low usage of natural gas and renewables
EuropeGreen Nirvana/
HydrocarbonStarved
• Strong policy push toward renewables • Low natural gas supply; recent coal renaissance
2013
5
111111111
China
Europe
NorthAmerica

7
Beyond forecasting: Find your future in an uncertain energy market
Six surprising outcomesBain’s extensive research and analysis on shocks to supply and demand in energy markets reveal some surprising but plausible possibilities over the next three to five years. (Note that these outcomes may be from different—and in some cases, contradictory—scenarios.)
Oil falls below $60 per barrel
If optimistic or aspirational goals are achieved in North America, Brazil and Iraq, the oversupply situation could precipitate a 30% to 70% price drop.
Natural gas prices rest at $4 in the US
Experience curve effects coupled to more optimistic estimates of recoverable reserves could yield attractive producer economics and spur huge demand as sectors switch from other fuel sources.
China may have a shale boom—or a natural gas shortfall—with global repercussions
If China can produce its huge shale resources economically, it could see a boom in gas production. If not, it will see a shortage, which could jeopardize its stated goal of increasing gas to 10% of its energy mix by 2020. Either way, the impact will be felt globally.
Batteries could unleash solar and wind power—but not yet
There are upper limits on how much of the power mix can come from solar and wind power, because they can generate power only some of the time (in daylight and when the wind blows). Utility-scale storage is the key, but battery technology will need to improve. It will take more than five years to develop batteries that can solve this problem at scale.
Electric vehicles may be cheaper than gasoline cars by 2020
Batteries for electric cars are getting better, solving the problem of limited range. Within seven years, electric cars may be less expensive to own than gasoline-powered vehicles (assuming today’s oil prices).
Significant switching to natural gas vehicles likely in the near term
The low cost of gas in North America is already making it economical to run some light trucks and fleet vehicles in cities on compressed natural gas. As the infrastructure to supply these vehicles in-creases and gas producers continue to descend the experience curve, ownership of natural-gas-powered cars is likely to climb.
ogy, infrastructure investments, and user economics and preferences. But attempting to consider all of these variables together without a simplifying structure is a complex process that won’t necessarily lead executive teams to the right options as quickly as they need them.
Our work with executives has helped us identify common traps that companies can fall into when faced with the kind of uncertainty that we see in today’s energy indus-try. Some traps result from being underconfident:
where in between. Economics are driven by global tech-nology and cost experience curves, but regulation and, in the case of renewables, weather (sunshine and wind) determine local break-even points.
Navigating strategy in uncertainty
Hundreds of variables help determine the trajectory of any region across the cube, including production and refining issues, regulations, advancements in technol-

8
Beyond forecasting: Find your future in an uncertain energy market
signpost conditions the organization to become more agile and respond quickly to market realities—which is more effective than taking long periods of time to study the latest disruptive events.
These decisions should align with and inform the or-ganization’s long-term strategic plan and goals. Given how rapidly the situation can change, it’s no longer about making one right bet, but about being more accurate more often. Strategy is, increasingly, a dynamic process in which companies continually monitor their options, realign direction and roll steadily toward their goals. This allows companies to be constantly aware, ahead of competitors, and enables them to quickly take advan-tage of market shifts and opportunities.
Executives in energy and energy-intensive industries are just beginning to come to terms with the likelihood of ongoing supply shocks. Potentially abundant sup-plies of natural gas, NGLs and crude oil may continue to outpace the ability of global industry participants to make reasonable bets on future supply levels and pric-ing. In this world, many assets and projects may require levels of investment that become uneconomic as addi-tional supplies enter the market.
Current estimates do little to reduce the uncertainty surrounding how the energy markets might evolve. We see wide gulfs in thinking not only on North American reserves and the ability to extract them economically, but also on those around the world. Under such uncer-tainty, it is impossible to predict the future. But com-panies can build the capabilities to see further into the future by developing scenarios, identifying signposts and tracking leading indicators. Doing so will help both companies and their investors make sense of the future landscape.
• Treating uncertainty as unknowable
• Focusing only on the things they can control
• Taking a wait-and-see stance
• Doubling down on current advantages
• Failing to take bets on innovation or new ventures
And some traps stem from being overconfident, which is also a common reaction when facing uncertainty:
• Taking bold but unrealistic stances
• Failing to anticipate competition
• Placing big bets that lock in future investment
• Having little or no risk management
• Rigidly adhering to current business models
Strategy in uncertainty requires developing plausible supply and demand scenarios, identifying signposts that determine supply and demand levels as well as prices that drive fuel substitution and import-export markets, and tracking leading indicators to assess the state of these signposts so companies can predict potential dis-ruptions. A major advantage of this approach is that it creates a dynamic strategy. When leadership teams weigh different scenarios rather than betting on one point of view, they are able to see which strategies will help companies win under different scenarios. This approach also allows teams to develop a strategy with options, such as specific triggers that signal when they need to change directions. Identifying the decisions that teams will need to take in advance of an imminent
1 We modeled NGLs as ratios to shale gas production.
2 We included renewables as an independent vector because they are very much a part of the energy ecosystem, and continued innovation and the real possibility of technological break-throughs within our forecast period could make renewables truly disruptive. Coal and nuclear, while important components of the energy mix, are not as potentially disruptive, and we have modeled them as dependent on the volumes and prices of oil, gas and renewables.
3 Given the greater energy efficiency of electric vehicles and—to a lesser extent—natural-gas vehicles, compared with gasoline-power vehicles, energy demand decreases as the penetration of electric vehicles and natural-gas vehicles increases.
4 While the adoption of stricter emission standards in scenarios 5 through 8 disproportionally impacts the use of coal, we didn’t assume an explicit carbon tax.
5 There have been five crude oil oversupply situations since 1986: 1986, 1991, 1998, 2001 and 2008.
6 Competitive dynamics in Asia are much more favorable to US LNG exports than European exports.
7 By some estimates, China has the largest shale gas reserves in the world.

Shared Ambit ion, True Re sults
Bain & Company is the management consulting fi rm that the world’s business leaders come to when they want results.
Bain advises clients on strategy, operations, technology, organization, private equity and mergers and acquisitions.
We develop practical, customized insights that clients act on and transfer skills that make change stick. Founded
in 1973, Bain has 48 offi ces in 31 countries, and our deep expertise and client roster cross every industry and
economic sector. Our clients have outperformed the stock market 4 to 1.
What sets us apart
We believe a consulting fi rm should be more than an adviser. So we put ourselves in our clients’ shoes, selling
outcomes, not projects. We align our incentives with our clients’ by linking our fees to their results and collaborate
to unlock the full potential of their business. Our Results Delivery® process builds our clients’ capabilities, and
our True North values mean we do the right thing for our clients, people and communities—always.

For more information, visit www.bain.com
Key contacts in Bain’s Global Oil & Gas practice:
Europe, Middle East Lars Jacob Boe in Oslo ([email protected])and Africa: Luca Caruso in Moscow ([email protected]) Juan Carlos Gay in London ([email protected]) Marc Lamure in Paris ([email protected]) Christophe de Mahieu in Dubai ([email protected]) Roberto Nava in Milan ([email protected]) Peter Parry in London ([email protected]) Tiziano Rivolta in Milan ([email protected]) José Ignacio Rios in Madrid ([email protected]) Natan Shklyar in Moscow ([email protected]) Luis Uriza in London ([email protected])
Americas: Riccardo Bertocco in Dallas ([email protected]) Pedro Caruso in Houston ([email protected]) Mark Gottfredson in Dallas ([email protected]) Jorge Leis in Houston ([email protected]) Rodrigo Mas in São Paulo ([email protected]) Ethan Phillips in Houston ([email protected]) José de Sá in São Paulo ([email protected])
Asia-Pacifi c: Sharad Apte in Bangkok ([email protected]) Francesco Cigala in Kuala Lumpur ([email protected]) John McCreery in Singapore ([email protected]) Brian Murphy in Perth ([email protected])