Embed Size (px)
Citation preview


Beyond GDP: New Measures of Wellbeing and Progress
Jānis Brizga
Pasaules dabas fonds

Content of presentation
• Myth about growth• Alternative measures
• Example of ecological footprint
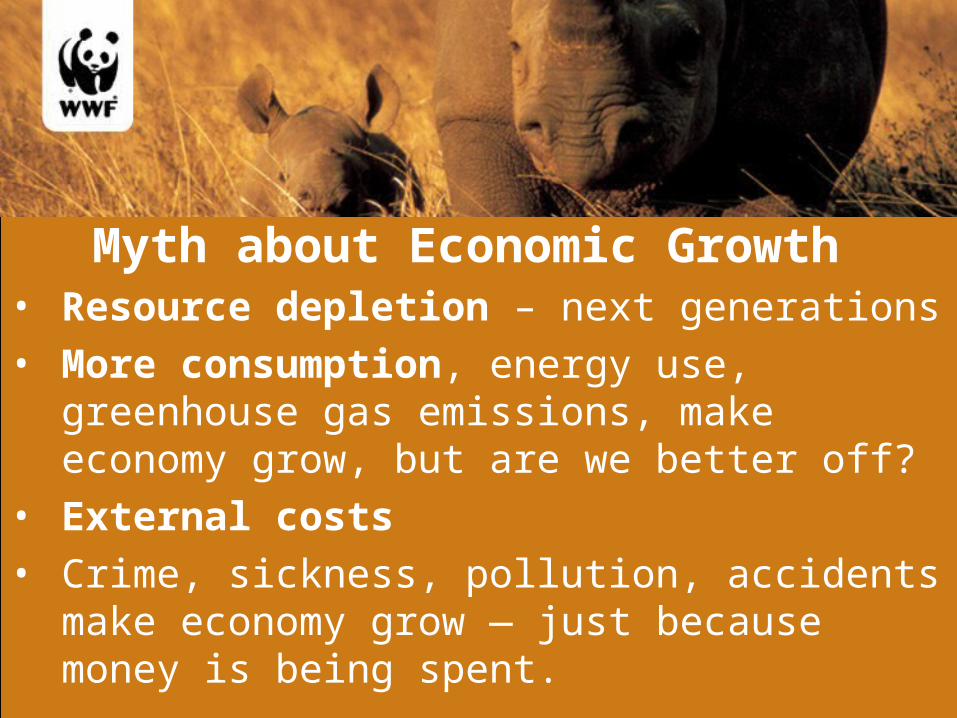
Myth about Economic Growth• Resource depletion – next generations
• More consumption, energy use, greenhouse gas emissions, make economy grow, but are we better off?
• External costs
• Crime, sickness, pollution, accidents make economy grow — just because money is being spent.


Wrong messages
• GDP can grow even as poverty and inequality increase;
• More work hours make economy grow - free time has no value – affects health (stress);
• GDP ignores work that contributes directly to community health (volunteers, work at home).

Values, elements of wellbeing• Health
• Security
• Knowledge
• Community
• Freedom
• Ecological integrity
• Equity

Expanded definition of capital

Different SDI approaches grouped around a policy cycle

Different SDI approaches grouped around a policy cycle (Source of policy cycle: de Ridder et al., 2006)

The Genuine Progress Index (US, Australia only)
or Index of Sustainable Welfare or Measur of Domestic Progress (UK only)
GPI is calculated by adjusting GDP by subtracting social and environmental costs, and adding in the value of non-market productive activity, such as volunteer work and child rearing.
Calculated by NGOs and think tanks - Redefining Progress (GPI, 2006, U.S. only); New economics foundation (MDP, 2004; UK only); Friends of the Earth UK and New economics foundation (ISEW)

Adjusted Net Savings (Genuine Savings) – World Bank
ANS = Net savings - resource depletion & environmental degradation + the value of investment in human capital.
Negatively adjusted net saving rates imply a total wealth in decline. The basic idea behind this concept is that only net savings increase wealth. While the standard national accounts solely show change in physical capital, i.e. man-made assets like machinery and infrastructure, 'genuine savings' strive to include the natural, environmental and human capital as a source of wealth.
Adjusted Net Saving rates by region (% of GNI)

Human Development Index (UNDP)
The HDI was designed as a measure for progress in developing countries beyond simple income figures such as GDP. A long and healthy life, knowledge and a decent standard of living are considered as the three key elements of development. Therefore, data on life expectancy, adult literacy, school enrolment and GDP are combined to calculate the index.

Gross National Happiness (Kingdom of Bhutan)
• The four pillars of GNH are: • sustainable and equitable socio-economic development; • preservation and promotion of cultural values; • conservation of the environment; and • establishment of good governance.
• Application: GNH is not a quantified measure. Rather, happiness is the guiding framework for the country’s five-year planning processes.
• Assessment: After two international conferences about the concept of GNH, the current focus is to develop indicators to measure GNH. A target date to complete a first set of indicators is 2008, when the first democratic elections in Bhutan will be held.

Happy Planet Index(The new economics foundation)
HPI = (Life satisfaction x Life expectancy) / Ecological Footprint.
Quality of life indices (generally): Research on quality of life goes beyond economic and environmental statistics and includes surveys to get information directly from the individual. Various indexes for quality of life have been developed by different research teams. The aim is to monitor the state and development of quality of life for different countries and various social groups. Moreover, these studies seek to find correlations with socio-economic data to identify drivers for well-being and happiness.

Ecological footprintEF measures the amount of natural resources an individual, a community, or a country consumes in a given year.
To understand the humanity’s footprint we need to know two key things:
- Ecological Supply (the available biocapacity / ecological capacity)- Ecological Demand (our use of biological resources / the footprint).
Compares human consumption of natural resources with the planet’s ecological capacity to regenerate them Assumes current technology levels, and looks at the amount of area needed to generate and to dispose of waste.
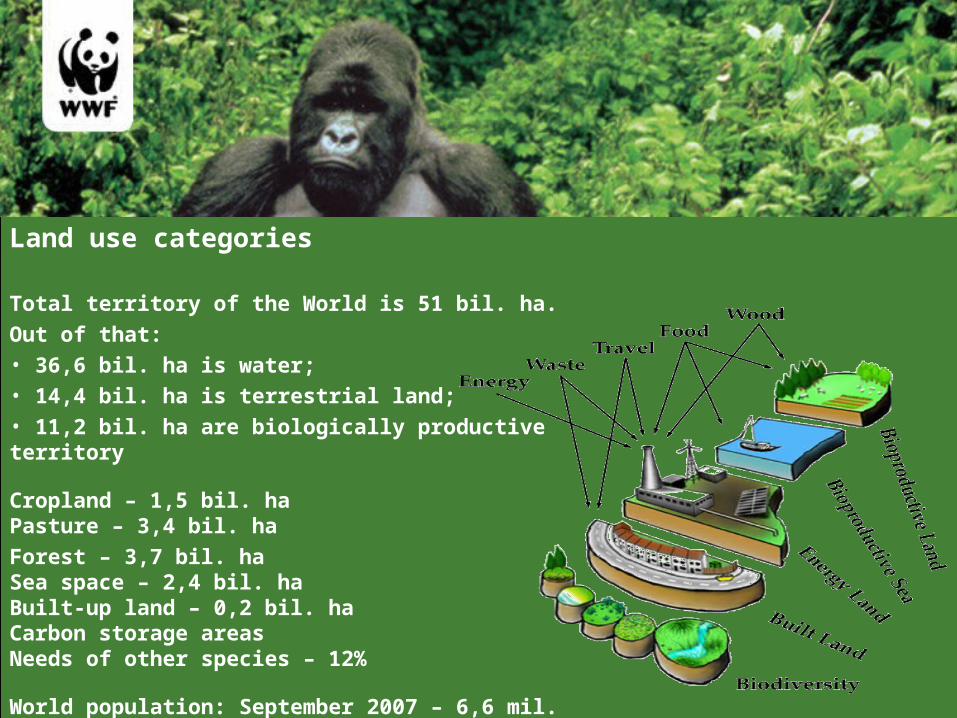
Land use categories
Total territory of the World is 51 bil. ha.
Out of that:• 36,6 bil. ha is water;• 14,4 bil. ha is terrestrial land;• 11,2 bil. ha are biologically productive territory
Cropland – 1,5 bil. haPasture – 3,4 bil. ha
Forest – 3,7 bil. ha Sea space – 2,4 bil. haBuilt-up land – 0,2 bil. haCarbon storage areas Needs of other species – 12%
World population: September 2007 – 6,6 mil.
Available productive land per capita 1,7 ha


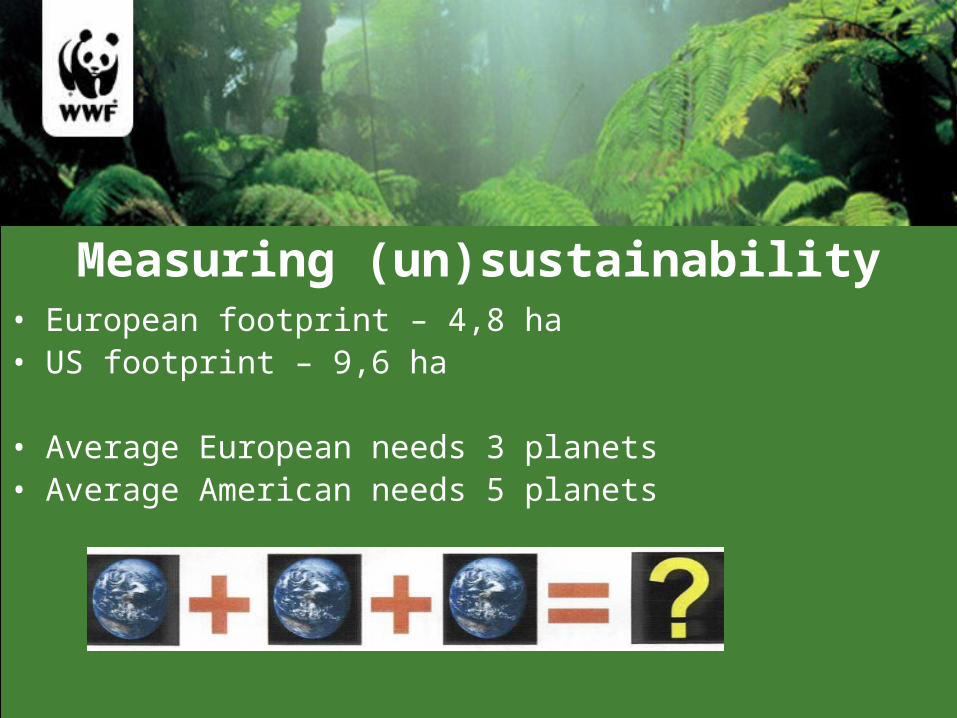
Measuring (un)sustainability• European footprint – 4,8 ha • US footprint – 9,6 ha
• Average European needs 3 planets • Average American needs 5 planets

EF and Growth in EU


20 years ago and now
LV
LT
EE

Ecological dept

Future scenarios1) Inerce (40 planētas biokapacitātes gadi līdz 2050.g);
2) neskārti 50% no ekosistēmām
3) neskārti 67% no ekosistēmām
4) neskārti 88% no ekosistēmām

Solutions