Embed Size (px)
Citation preview
BHARAT Financial Inclusion Ltd
Prayaas se pragati
(Formerly known as 'SKS Microfinance Limited')
January 29, 2019
The General Manager, Department of Corporate Services BSE Limited Phiroze Jeejeebhoy Towers, Dalal Street, Fort, Mumbai - 400 001.
Dear Sir/Madam,
Head Office: 3rd Floor, My Home Tycoon, Block A, 6-3-1192, Kundanbagh Begumpet, Hyderabad - 500 016, Telangana, India T: +91 40 4452 6000
F: +91 40 4452 6001; [email protected] I www.bfil.co.in
Corporate Identity Number: L65999MH2003PLC250504
Registered Office: Unit No. 410, Madhava, Bandra-Kurla Complex Sandra (East), Mumbai - 400 051, Maharashtra, India T: +91 22 2659 2375
The Vice President - Listing Department The National Stock Exchange of India Limited Exchange Plaza, Bandra - Kurla Complex, Bandra (East) Mumbai - 400 051.
Sub: Approval of Audited Financial results for quarter/ nine months ended December 31, 2018
In compliance with Regulation 33 of the Securities and Exchange Board of India (Listing Obligations and
Disclosure Requirements) Regulations, 2015, we hereby inform you that the Board of Directors of Bharat
Financial Inclusion Limited at its meeting held on January 29, 2019 (commenced at 2.30 p.m. and
concluded at 5.30 p.m.) has approved Audited Financial Results for the quarter / nine months ended
December 31, 2018.
In relation to the above, we are enclosing herewith a copy of each of the following:
1. Audited Financial Results for the quarter / nine months ended December 31, 2018 along with the Auditor's Report thereon;
2. Earnings Update for the quarter / nine months ended December 31, 2018, which we plan to host
on our website www.bfil.co.in
We request you to take the same on record.
Thanking you,
Yours faithfully
For Bharat Financial Inclusion Limited
~ Rajendra Patil
Sr. Executive Vice President - Legal & Company Secretary
Encl: As above
January 29, 2019
Regional Offices: Ambala I Aurangabad I Bangalore I Bhagalpur I Bhopal I Bhubaneswar I Dharwad I Gulbarga I Hyderabad I Jaipur I Kechi Kolkata I Lucknow I Meerut I Nagpur I Patna I Pune I Raipur I Ranchi I Sambalpur I Siliguri I Varanasi I Vizag
B S R & Associates LLP Chartered Accountants
Salarpuria Knowledge City Orwell, B Wing, 6th Floor, Unit-3 Sy. No. 83/1, Plot No 2, Ra1durg Hyderabad-500081, India.
Telephone +91 40 7182 2000 Fax · +91 40 7182 2399
Independent Auditor's report on quarterly financial results and year-to-date results pursuant to Regulation 33 of the SEBI (Listing Obligations and Disclosure Requirements) Regulations, 2015 ('Listing Regulations')
To
The Board of Directors of Bharat Financial Inclusion Limited
1. We have audited the quarterly financial results of Bharat Financial Inclusion Limited ('the Company') for the quarter ended 31 December 2018 and the year-to-date financial results for the period from 1 April 2018 to 31 December 2018 ('financial results'), attached herewith, being submitted by the Company pursuant to the requirement of Regulation 33 of the Listing Regulations.
2. These quarterly financial results as well as the year-to-date financial results have been prepared on the basis of the interim financial statements, which are the responsibility of the Company's management. Our responsibility is to express an opinion on these financial results based on our audit of such interim financial statements, which have been prepared in accordance with the recognition and measurement principles laid down in Indian Accounting Standard (Ind AS) for Interim Financial Reporting (Ind AS 34), prescribed under Section 133 of the Companies Act, 2013 and other accounting principles generally accepted in lndia and in compliance with Regulation 33 of Listing Regulation.
3. We conducted our audit in accordance with the auditing standards generally accepted in India. Those standards require that we plan and perform the audit to obtain reasonable assurance about . whether the financial results are free of material misstatement. An audit includes examining, on a test basis, evidence supporting the amounts disclosed as financial results. An audit also includes assessing the accounting principles used and significant estimates made by management. We believe that our audit provides a reasonable basis for our opinion.
B S R & Assocoa1es la paitnersh,p hrm with Registration No BA69226) convened ln!O B S R & Associates LLP (a litn1ted l.Ja~f1Y Pi>ranersh;p \•,,1h t. LP ~rstrat1on No MB-3182) with atteic.1 from OcloDer 14 1013"
Registered Office; 5th Floor, Lodha Excelus AJIDlo Mills Compoucd N M Joshi Marg, Mahalakshrn, Mumbai~ 400 011
B S R & Associates LLP
Bharat Financial Inclusion Limited Independent Auditor's Report (continued)
4. Based on our audit conducted as above, in our opinion and to the best of our information and according to the explanations given to us, these quarterly financial results as well as the year-todate results:
(i) are presented in accordance with the requirements of Regulation 33 of the Listing Regulations; and
(ii) give a true and fair view of the net profit and other comprehensive income and other financial information for the quarter ended 31 December 2018 as well as the year-to-date results for the period from I April 2018 to 31 December 2018.
Place: Mumbai Date: 29 January 2019
for B S R & Associates LLP Chartered Accountants
Firm's Registration Number: 116231 W/W-100024
2
Sriram Mahalingam Partner
Membership No: 049642
Bharat Financial Inclusion Limited Read.Office : Unit No. 410, "Madhava", Bandra-Kurla C . Bandra {East), Mumbai - 400 051
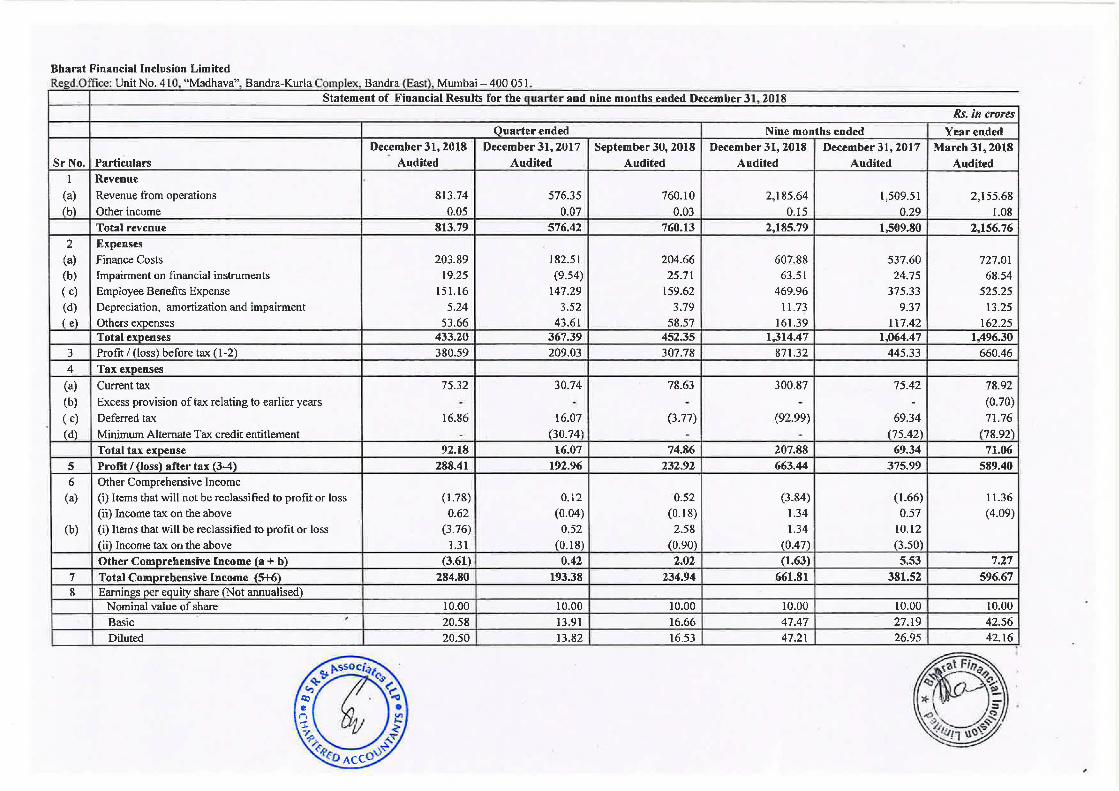
Statement of Financial Results for the quarter and nine months ended December 31, 2018 Rs. in crores
Quarter ended Nine months ended Year ended December 31, 2018 December 31, 2017 September 30, 2018 December 31, 2018 December 31, 2017 March 31, 2018
Sr No. Particulars Audited Audited Audited Audited Audited Audited 1 Revenue
(a) Revenue from operations 813.74 576.35 760.10 2,185.64 1,509.51 2,155.68 (b) Other income 0.05 0.07 0.03 0.15 0.29 1.08
Total revenue 813.79 576.42 760.13 2,185.79 1,509.80 2,156.76 2 Expenses
(a) Finance Costs 203.89 182.5 L 204.66 607.88 537.60 727.01 (b) Impairment on financial instruments 19.25 (9.54) 25.71 63.51 24.75 68.54 ( c) Employee Benefits Expense 151.16 147.29 159.62 469.96 375.33 525.25 (d) Depreciation, amortization and impairment 5.24 3.52 3.79 11.73 9.37 13.25 ( e) Others expenses 53.66 43.61 58.57 161.39 117.42 162.25
Total expenses 433.20 367.39 452.35 1,314.47 1,064.47 1,496.30 3 Profit/ (loss) before tax (l-2) 380.59 209.03 307.78 871.32 445.33 660.46
4 Tax expenses (a) Current tax 75.32 30.74 78.63 300.87 75.42 78.92
(b) Excess provision of tax relating to earlier years - - - - - (0.70)
( c) Deferred tax 16.86 16.07 (3. 77) (92.99) 69.34 71.76 (d) Minimum Alternate Tax credit entitlement . (30.74) - - (75.42) (78.92)
Total tax expense 92.18 16.07 74.86 207.88 69.34 71.06 5 Profit/ (loss) after tax (3-4) 288.41 192.96 232.92 663.44 375.99 589.40 6 Other Comprehensive Income
(a) (i) Items that will not be reclassified to profit or loss ( 1.78) 0.12 0.52 (3.84) (l.66) 11.36
(ii) Income tax on the above 0.62 (0.04) (0.18) 1.34 0.57 (4.09)
(b) (i) Items that will be reclassified to profit or loss (3.76) 0.52 2.58 1.34 10.12
(ii) Income tax on the above 1.31 (0.18) (0.90) (0.47) (3.50)
Other Comprehensive Income (a+ b) (3.61) 0.42 2.02 (l.63) 5.53 7.27
7 Total Comprehensive Income (5+6) 284.80 193.38 234.94 661.81 381.52 596.67 8 Earnings per equity share (Not annualised)
Nominal value of share 10.00 10.00 10.00 10.00 10.00 10.00
Basic ' 20.58 13.91 16.66 47.47 27.19 42.56
Diluted 20.50 13.82 16.53 47.21 26.95 42.16 •.
'?rn~ i,.ssoc;<l,;;:-, co ('_ e . ~ IJ • .).. V ..,, "Y.p t '<': ~"r'
.P,e ':<:' D ACCO\) . ~
BHARAT FINANCIAL INCLUSION LIMITED
Notes:
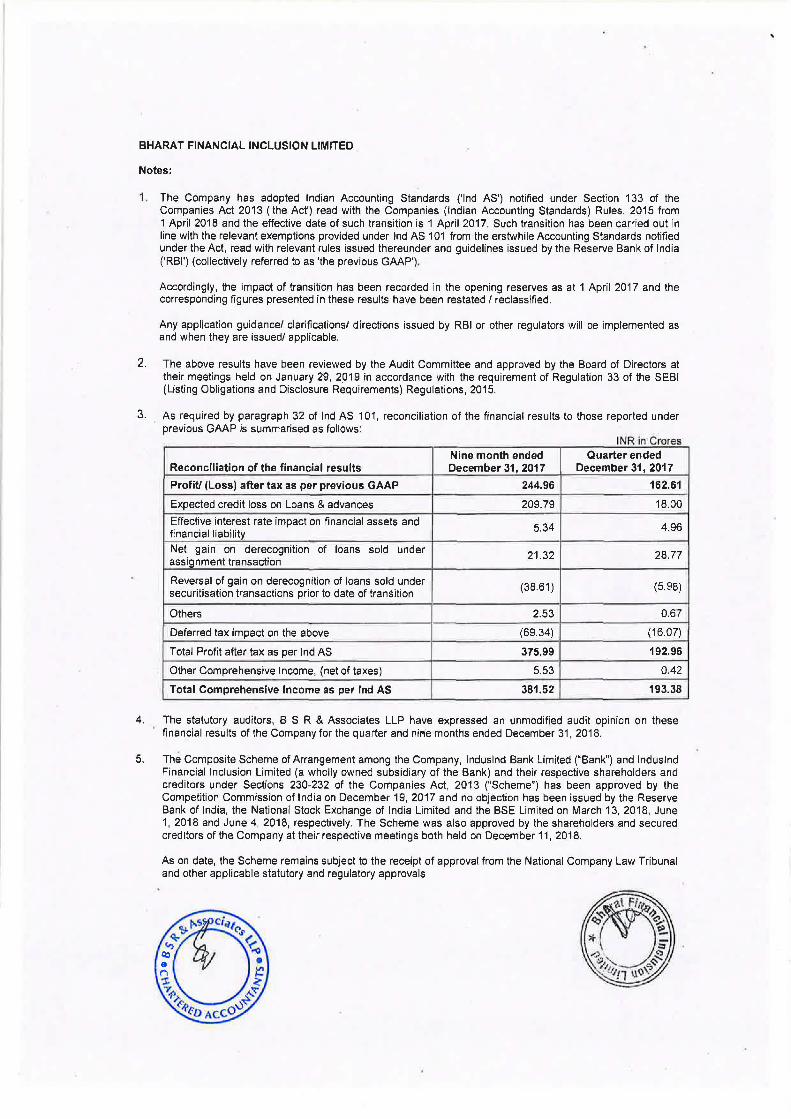
1. The Company has adopted Indian Accounting Standards ('Ind AS') notified under Section 133 of the Companies Act 2013 ('the Act') read with the Companies (Indian Accounting Standards) Rules, 2015 from 1 April 2018 and the effective date of such transition is 1 April 2017. Such transition has been carried out in line with the relevant exemptions provided under Ind AS 101 from the erstwhile Accounting Standards notified under the Act, read with relevant rules issued thereunder and guidelines issued by the Reserve Bank of India ('RBI') (collectively referred to as 'the previous GAAP').
Accordingly, the impact of transition has been recorded in the opening reserves as at 1 April 2017 and the corresponding figures presented in these results have been restated/ reclassified.
Any application guidance/ clarifications/ directions issued by RBI or other regulators will be implemented as and when they are issued/ applicable.
2. The above results have been reviewed by the Audit Committee and approved by the Board of Directors at their meetings held on January 29, 2019 in accordance with the requirement of Regulation 33 of the SEBI (Listing Obligations and Disclosure Requirements) Regulations, 2015.
3. As required by paragraph 32 of Ind AS 101, reconciliation of the financial results to those reported under previous GAAP is summarised as follows:
INR in Crores Nine month ended Quarter ended
Reconciliation of the financial results December 31, 2017 December 31, 2017
Profit/ (Loss) after tax as per previous GAAP 244.96 162.61
Expected credit loss on Loans & advances 209.79 18.00
Effective interest rate impact on financial assets and 5.34 4.96
financial liability Net gain on derecognition of loans sold under 21.32 28.77 assignment transaction
Reversal of gain on derecognition of loans sold under (38.61) (598) securitisation transactions prior to date of transition
Others 2.53 0.67
Deferred tax impact on the above (69.34) (16.07)
Total Profit after tax as per Ind AS 375.99 192.96
Other Comprehensive Income, (net of taxes) 5.53 0.42
Total Comprehensive Income as per Ind AS 381.52 193.38
4. The statutory auditors, B S R & Associates LLP have expressed an unmodified audit opinion on these financial results of the Company for the quarter and nirie months ended December 31, 2018.
5. The Composite Scheme of Arrangement among the Company, lnduslnd Bank Limited ("Bank") and lnduslnd Financial Inclusion Limited (a wholly owned subsidiary of the Bank) and their respective shareholders and creditors under Sections 230-232 of the Companies Act, 2013 ("Scheme") has been approved by the Competition Commission of India on December 19, 2017 and no objection has been issued by the Reserve Bank of India, the National Stock Exchange of India Limited and the BSE Limited on March 13, 2018, June 1, 2018 and June 4, 2018, respectively. The Scheme was also approved by the shareholders and secured creditors of the Company at their respective meetings both held on December 11, 2018.
As on date, the Scheme remains subject to the receipt of approval from the National Company Law Tribunal and other applicable statutory and regulatory approvals

6. The Company is engaged primarily In the business of Micro- financing and accordingly there are no separate reportable segments as per Ind AS dealing with Operating Segment. The company operates in a single geographical segment l.e domestic.
Place: Hyderabad Date: January 29, 2019
EARNINGS UPDATE Q3FY19
BHARAT FINANCIAL INCLUSION LIMITED(Formerly known as ‘SKS Microfinance Limited’)BSE: 533228 ● NSE: BHARATFIN
Corporate Identity No. L65999MH2003PLC250504
www.bfil.co.in
This presentation is solely for viewing. No part of it may be circulated, quoted, or reproduced for distribution without prior written approval from BHARAT Financial Inclusion Limited.
JANUARY 2019
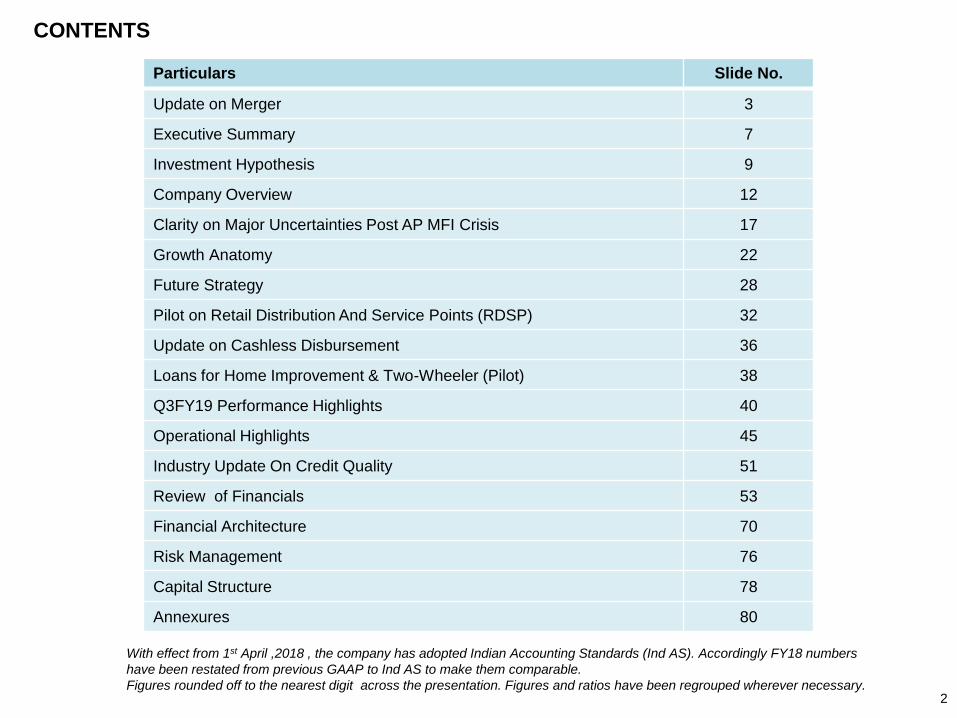
CONTENTS
Particulars Slide No.
Update on Merger 3
Executive Summary 7
Investment Hypothesis 9
Company Overview 12
Clarity on Major Uncertainties Post AP MFI Crisis 17
Growth Anatomy 22
Future Strategy 28
Pilot on Retail Distribution And Service Points (RDSP) 32
Update on Cashless Disbursement 36
Loans for Home Improvement & Two-Wheeler (Pilot) 38
Q3FY19 Performance Highlights 40
Operational Highlights 45
Industry Update On Credit Quality 51
Review of Financials 53
Financial Architecture 70
Risk Management 76
Capital Structure 78
Annexures 80
With effect from 1st April ,2018 , the company has adopted Indian Accounting Standards (Ind AS). Accordingly FY18 numbers
have been restated from previous GAAP to Ind AS to make them comparable.
Figures rounded off to the nearest digit across the presentation. Figures and ratios have been regrouped wherever necessary.2
3
UPDATE ON MERGER
3
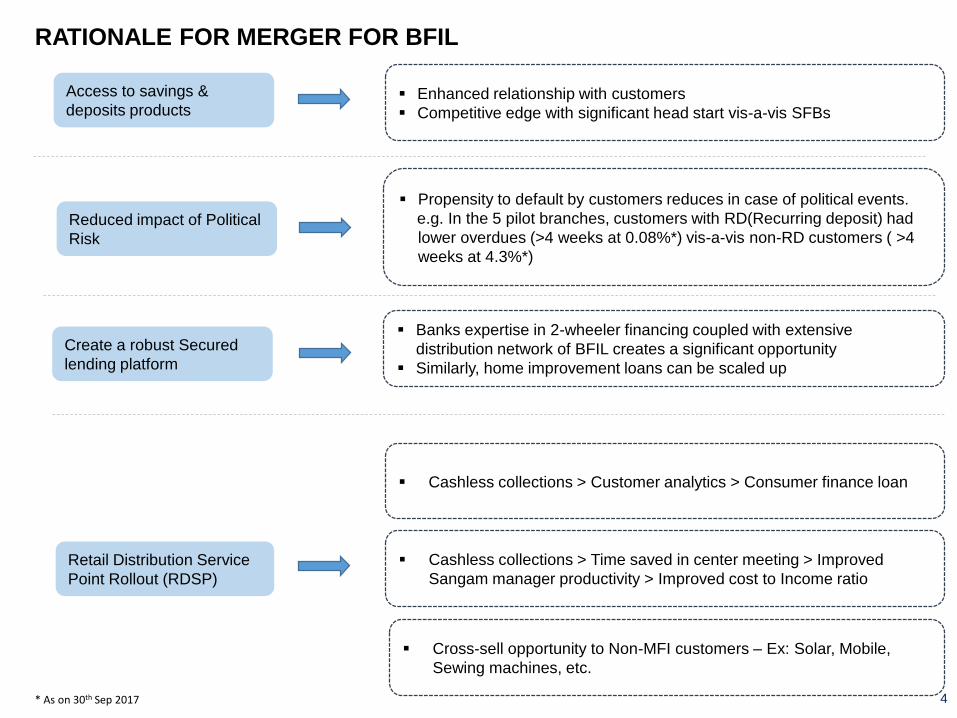
RATIONALE FOR MERGER FOR BFIL
4
Access to savings &
deposits products▪ Enhanced relationship with customers
▪ Competitive edge with significant head start vis-a-vis SFBs
Retail Distribution Service
Point Rollout (RDSP)
▪ Cashless collections > Customer analytics > Consumer finance loan
▪ Cross-sell opportunity to Non-MFI customers – Ex: Solar, Mobile,
Sewing machines, etc.
Create a robust Secured
lending platform
▪ Banks expertise in 2-wheeler financing coupled with extensive
distribution network of BFIL creates a significant opportunity
▪ Similarly, home improvement loans can be scaled up
▪ Cashless collections > Time saved in center meeting > Improved
Sangam manager productivity > Improved cost to Income ratio
Reduced impact of Political
Risk
▪ Propensity to default by customers reduces in case of political events.
e.g. In the 5 pilot branches, customers with RD(Recurring deposit) had
lower overdues (>4 weeks at 0.08%*) vis-a-vis non-RD customers ( >4
weeks at 4.3%*)
* As on 30th Sep 2017
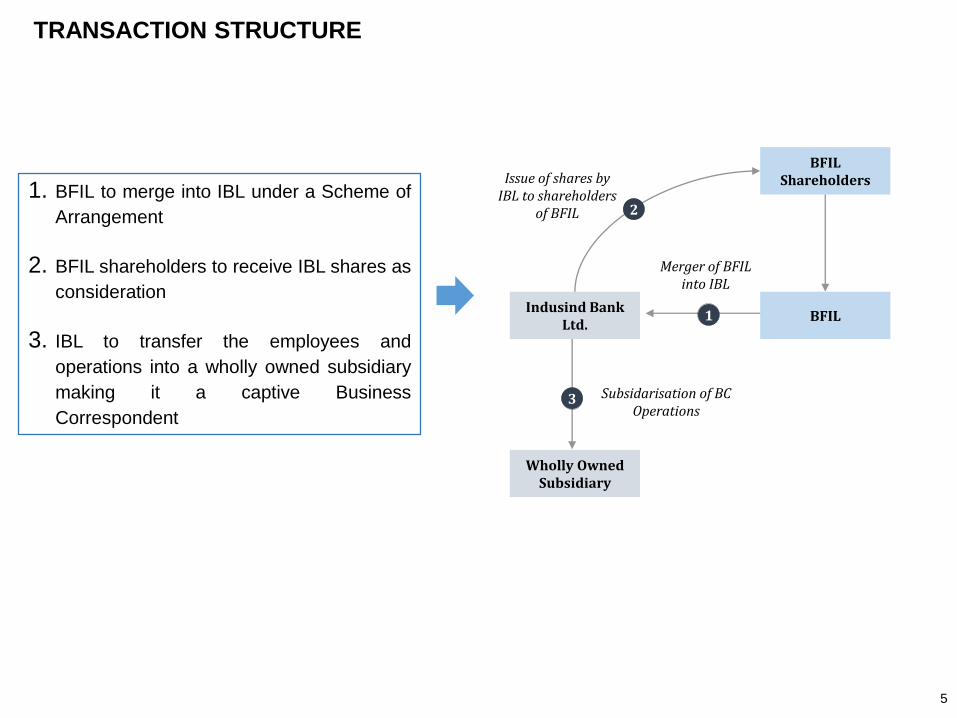
TRANSACTION STRUCTURE
5
1. BFIL to merge into IBL under a Scheme of
Arrangement
2. BFIL shareholders to receive IBL shares as
consideration
3. IBL to transfer the employees and
operations into a wholly owned subsidiary
making it a captive Business
Correspondent
Issue of shares by IBL to shareholders
of BFIL
BFILShareholders
BFILIndusind Bank
Ltd.1
Wholly Owned Subsidiary
3 Subsidarisation of BC Operations
2
Merger of BFIL into IBL
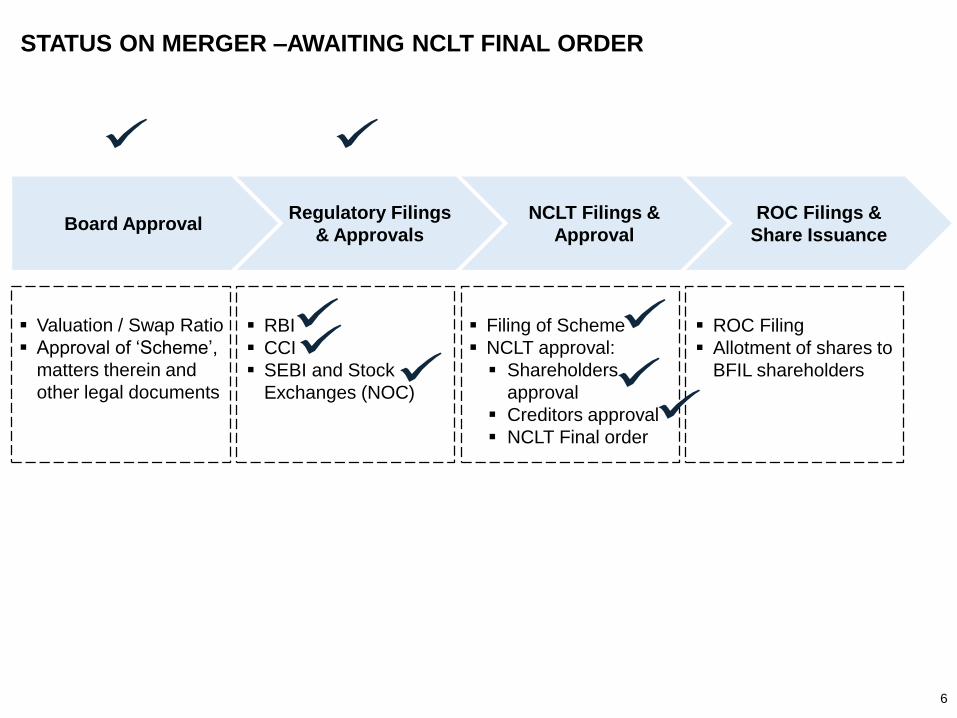
Board ApprovalRegulatory Filings
& Approvals
NCLT Filings &
Approval
ROC Filings &
Share Issuance
▪ Valuation / Swap Ratio
▪ Approval of ‘Scheme’,
matters therein and
other legal documents
▪ RBI
▪ CCI
▪ SEBI and Stock
Exchanges (NOC)
▪ Filing of Scheme
▪ NCLT approval:
▪ Shareholders
approval
▪ Creditors approval
▪ NCLT Final order
▪ ROC Filing
▪ Allotment of shares to
BFIL shareholders
STATUS ON MERGER –AWAITING NCLT FINAL ORDER
6
EXECUTIVE SUMMARY
7
8
136 244
377
641
848
1,277
361
582
FY13 FY14 FY15 FY16 FY17 FY18 Q3FY18Q3FY19
2,016 2,837
4,171
7,677 9,150
12,575
11,447
16,651
Mar-13 Mar-14 Mar-15 Mar-16 Mar-17 Mar-18 Dec-17 Dec-18
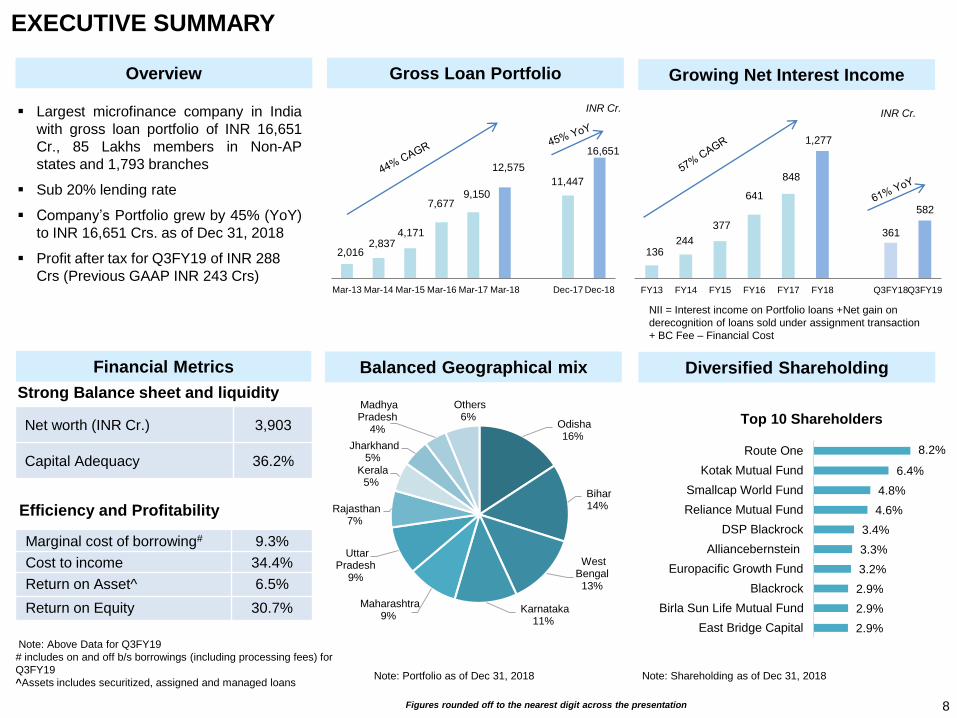
Overview Gross Loan Portfolio Growing Net Interest Income
Financial Metrics Balanced Geographical mix Diversified Shareholding
Marginal cost of borrowing# 9.3%
Cost to income 34.4%
Return on Asset^ 6.5%
Return on Equity 30.7%
EXECUTIVE SUMMARY
▪ Largest microfinance company in India
with gross loan portfolio of INR 16,651
Cr., 85 Lakhs members in Non-AP
states and 1,793 branches
▪ Sub 20% lending rate
▪ Company’s Portfolio grew by 45% (YoY)
to INR 16,651 Crs. as of Dec 31, 2018
▪ Profit after tax for Q3FY19 of INR 288
Crs (Previous GAAP INR 243 Crs)
Note: Shareholding as of Dec 31, 2018
Net worth (INR Cr.) 3,903
Capital Adequacy 36.2%
Note: Portfolio as of Dec 31, 2018
Strong Balance sheet and liquidity
Efficiency and Profitability
INR Cr.INR Cr.
NII = Interest income on Portfolio loans +Net gain on
derecognition of loans sold under assignment transaction
+ BC Fee – Financial Cost
Note: Above Data for Q3FY19
# includes on and off b/s borrowings (including processing fees) for
Q3FY19
^Assets includes securitized, assigned and managed loans
Odisha 16%
Bihar 14%
West Bengal 13%
Karnataka 11%
Maharashtra 9%
Uttar Pradesh
9%
Rajasthan 7%
Kerala 5%
Jharkhand 5%
Madhya Pradesh
4%
Others 6%
2.9%
2.9%
2.9%
3.2%
3.3%
3.4%
4.6%
4.8%
6.4%
8.2%
East Bridge Capital
Birla Sun Life Mutual Fund
Blackrock
Europacific Growth Fund
Alliancebernstein
DSP Blackrock
Reliance Mutual Fund
Smallcap World Fund
Kotak Mutual Fund
Route One
Top 10 Shareholders
Figures rounded off to the nearest digit across the presentation
9
INVESTMENT HYPOTHESIS
9
INVESTMENT HYPOTHESIS
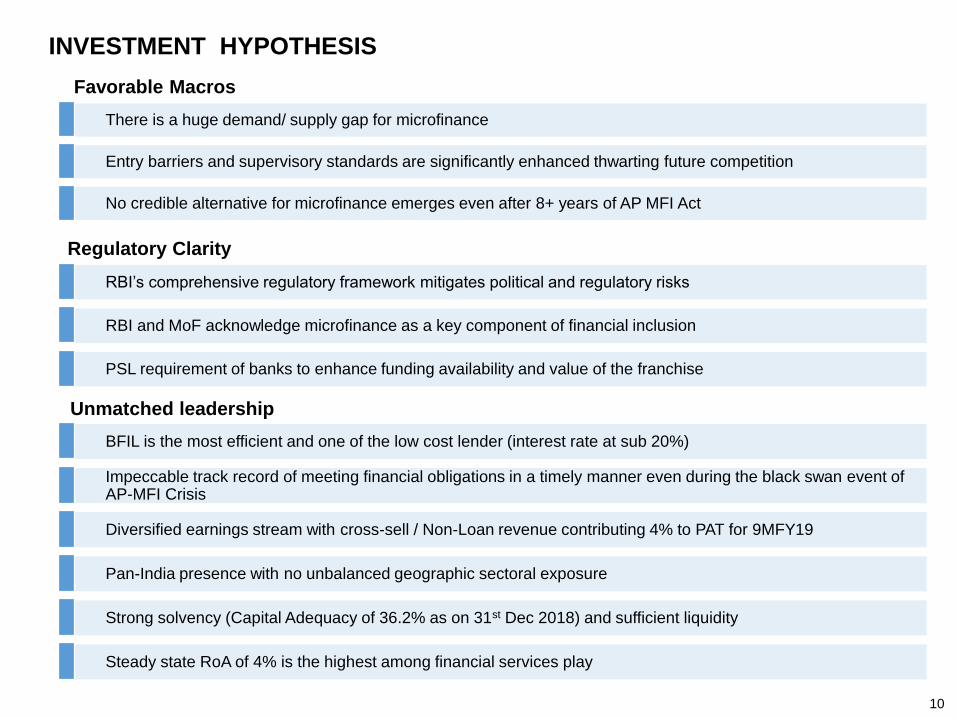
BFIL is the most efficient and one of the low cost lender (interest rate at sub 20%)
Impeccable track record of meeting financial obligations in a timely manner even during the black swan event of AP-MFI Crisis
Diversified earnings stream with cross-sell / Non-Loan revenue contributing 4% to PAT for 9MFY19
Pan-India presence with no unbalanced geographic sectoral exposure
Strong solvency (Capital Adequacy of 36.2% as on 31st Dec 2018) and sufficient liquidity
Steady state RoA of 4% is the highest among financial services play
Favorable Macros
Unmatched leadership
There is a huge demand/ supply gap for microfinance
Entry barriers and supervisory standards are significantly enhanced thwarting future competition
No credible alternative for microfinance emerges even after 8+ years of AP MFI Act
Regulatory Clarity
RBI’s comprehensive regulatory framework mitigates political and regulatory risks
RBI and MoF acknowledge microfinance as a key component of financial inclusion
PSL requirement of banks to enhance funding availability and value of the franchise
10
11
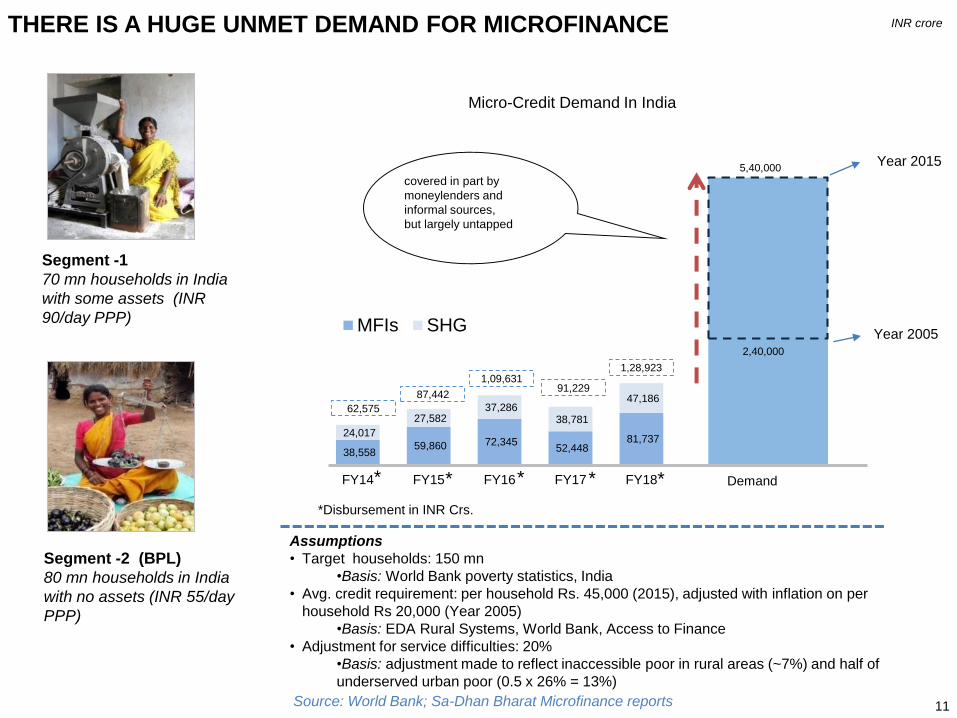
Segment -1
70 mn households in India
with some assets (INR
90/day PPP)
Segment -2 (BPL)
80 mn households in India
with no assets (INR 55/day
PPP)
THERE IS A HUGE UNMET DEMAND FOR MICROFINANCE
Assumptions
• Target households: 150 mn
•Basis: World Bank poverty statistics, India
• Avg. credit requirement: per household Rs. 45,000 (2015), adjusted with inflation on per
household Rs 20,000 (Year 2005)
•Basis: EDA Rural Systems, World Bank, Access to Finance
• Adjustment for service difficulties: 20%
•Basis: adjustment made to reflect inaccessible poor in rural areas (~7%) and half of
underserved urban poor (0.5 x 26% = 13%)
Source: World Bank; Sa-Dhan Bharat Microfinance reports
38,558 59,860 72,345
52,448 81,737
24,017
27,582 37,286
38,781
47,186
FY14 FY15 FY16 FY17 FY18
MFIs SHG
Micro-Credit Demand In India
covered in part by
moneylenders and
informal sources,
but largely untapped
*Disbursement in INR Crs.
Demand
2,40,000
* *
87,442
62,575
5,40,000
Year 2005
Year 2015
*
1,09,631 91,229
*
INR crore
1,28,923
*
12
COMPANY OVERVIEW
12
13
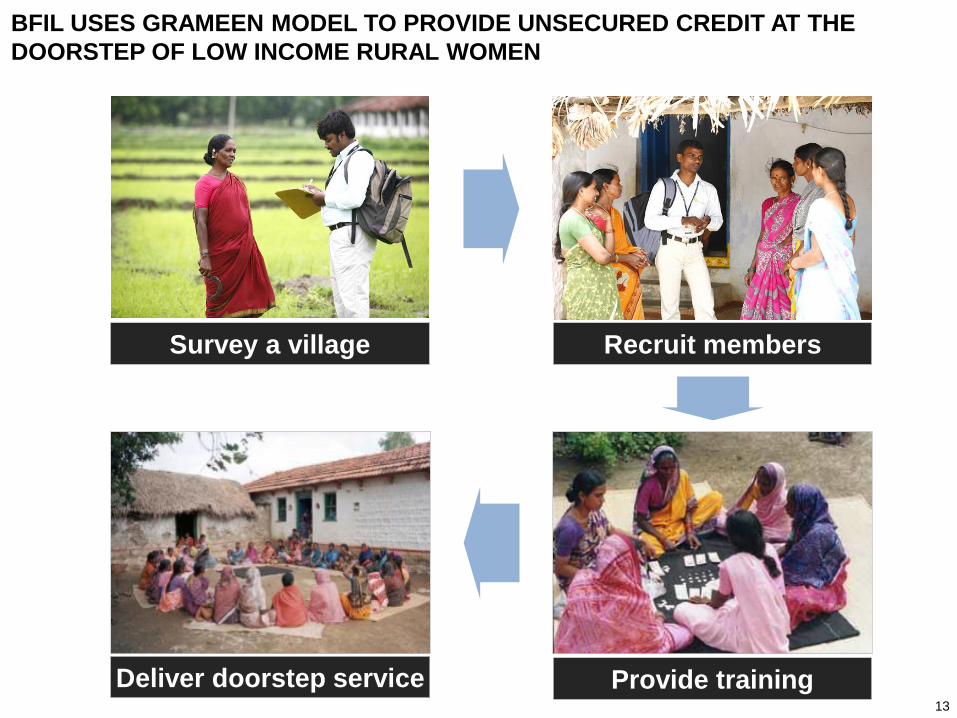
Survey a village Recruit members
Deliver doorstep service Provide training
BFIL USES GRAMEEN MODEL TO PROVIDE UNSECURED CREDIT AT THE
DOORSTEP OF LOW INCOME RURAL WOMEN
Put loan
officers pic
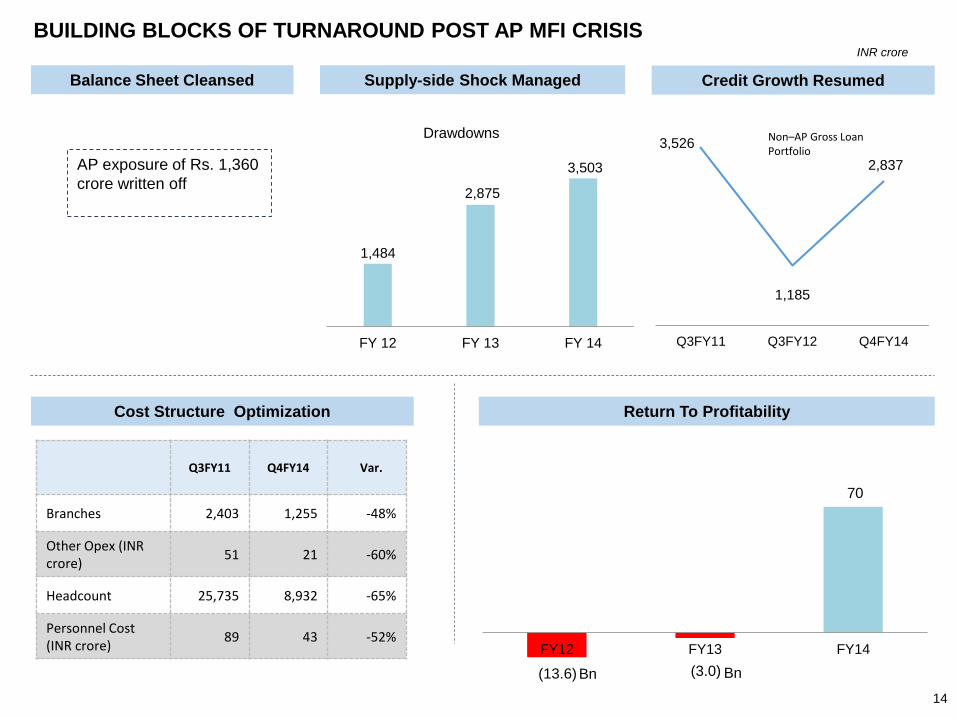
1,484
2,875
3,503
FY 12 FY 13 FY 14
Drawdowns
AP exposure of Rs. 1,360
crore written off
Q3FY11 Q4FY14 Var.
Branches 2,403 1,255 -48%
Other Opex (INR crore)
51 21 -60%
Headcount 25,735 8,932 -65%
Personnel Cost (INR crore)
89 43 -52%
3,526
1,185
2,837
Q3FY11 Q3FY12 Q4FY14
Non–AP Gross Loan Portfolio
(13.6) (3.0)
70
FY12 FY13 FY14
Return To Profitability
Bn Bn
INR crore
BUILDING BLOCKS OF TURNAROUND POST AP MFI CRISIS
Balance Sheet Cleansed Supply-side Shock Managed Credit Growth Resumed
Cost Structure Optimization
14
12.6%
8.7% 9.3%
FY14 FY18 Q3FY19
Marginal Cost of Borrowing#
74.5%
49.0%
34.4%
FY14 FY18 Q3FY19
Cost to Income
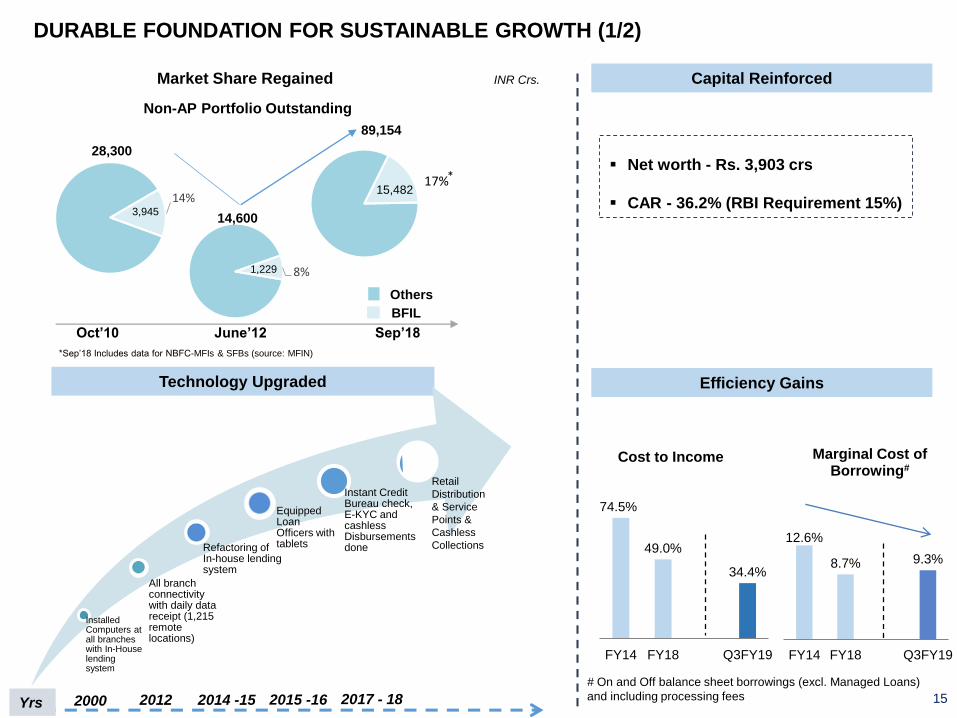
2000 2014 -152012Yrs
14%
8%1,229
Oct’10 June’12 Sep’18
28,300
14,600
Non-AP Portfolio Outstanding
3,945
BFIL
Others
INR Crs.
▪ Net worth - Rs. 3,903 crs
▪ CAR - 36.2% (RBI Requirement 15%)
# On and Off balance sheet borrowings (excl. Managed Loans)
and including processing fees 2015 -16
*Sep’18 Includes data for NBFC-MFIs & SFBs (source: MFIN)
17%15,482
89,154
DURABLE FOUNDATION FOR SUSTAINABLE GROWTH (1/2)
Market Share Regained
Technology Upgraded
Capital Reinforced
Efficiency Gains
Installed Computers at all branches with In-House lending system
All branch connectivity with daily data receipt (1,215 remote locations)
Refactoring of In-house lending system
Equipped Loan Officers with tablets
Instant Credit Bureau check, E-KYC and cashless Disbursements done
2017 - 18 15
*
Retail
Distribution
& Service
Points &
Cashless
Collections
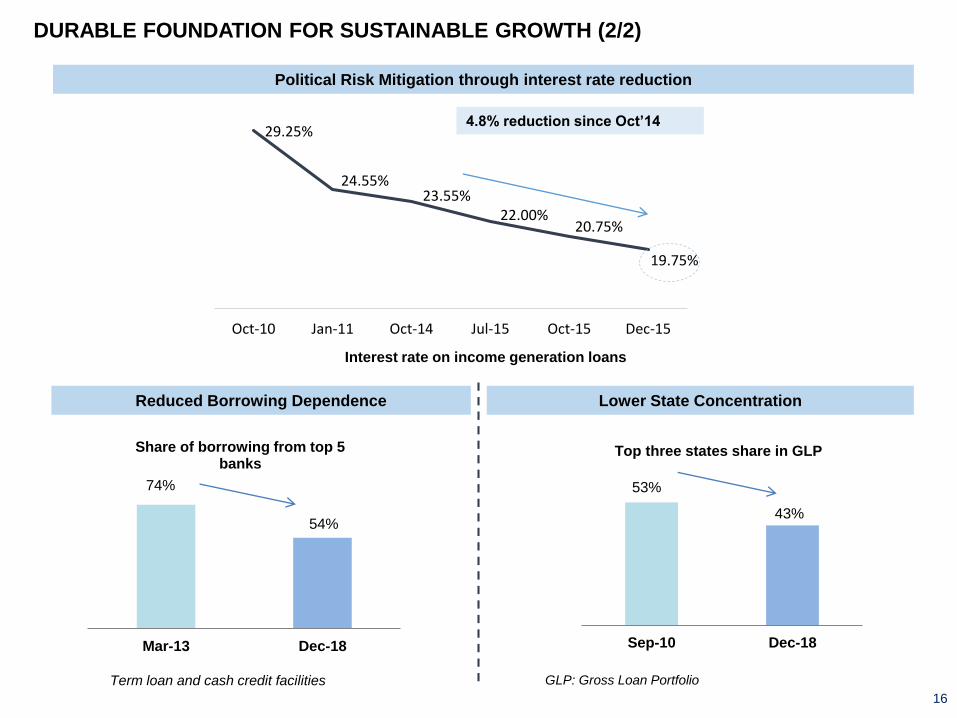
29.25%
24.55%23.55%
22.00%20.75%
19.75%
Oct-10 Jan-11 Oct-14 Jul-15 Oct-15 Dec-15
4.8% reduction since Oct’14
GLP: Gross Loan PortfolioTerm loan and cash credit facilities
Interest rate on income generation loans
74%
54%
Mar-13 Dec-18
Share of borrowing from top 5 banks
53%
43%
Sep-10 Dec-18
Top three states share in GLP
Political Risk Mitigation through interest rate reduction
Reduced Borrowing Dependence Lower State Concentration
DURABLE FOUNDATION FOR SUSTAINABLE GROWTH (2/2)
16
CLARITY ON MAJOR UNCERTAINTIES
POST AP MFI CRISIS
17
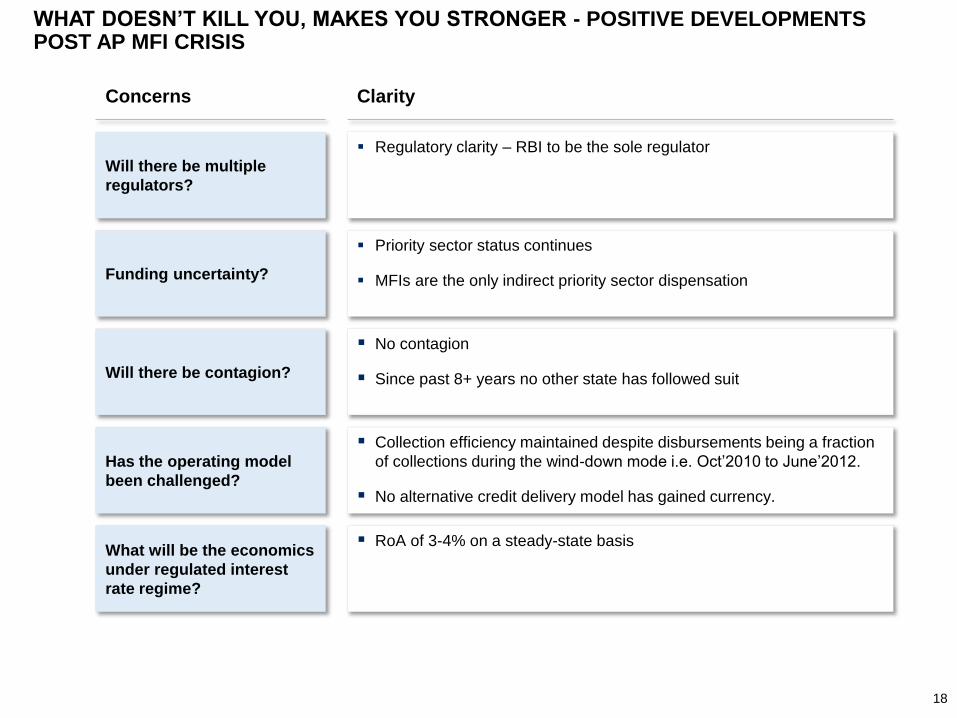
WHAT DOESN’T KILL YOU, MAKES YOU STRONGER - POSITIVE DEVELOPMENTS POST AP MFI CRISIS
Will there be multiple
regulators?
▪ Regulatory clarity – RBI to be the sole regulator
Funding uncertainty?
▪ Priority sector status continues
▪ MFIs are the only indirect priority sector dispensation
Will there be contagion?
▪ No contagion
▪ Since past 8+ years no other state has followed suit
Has the operating model
been challenged?
▪ Collection efficiency maintained despite disbursements being a fraction
of collections during the wind-down mode i.e. Oct’2010 to June’2012.
▪ No alternative credit delivery model has gained currency.
What will be the economics
under regulated interest
rate regime?
▪ RoA of 3-4% on a steady-state basis
Concerns Clarity
18
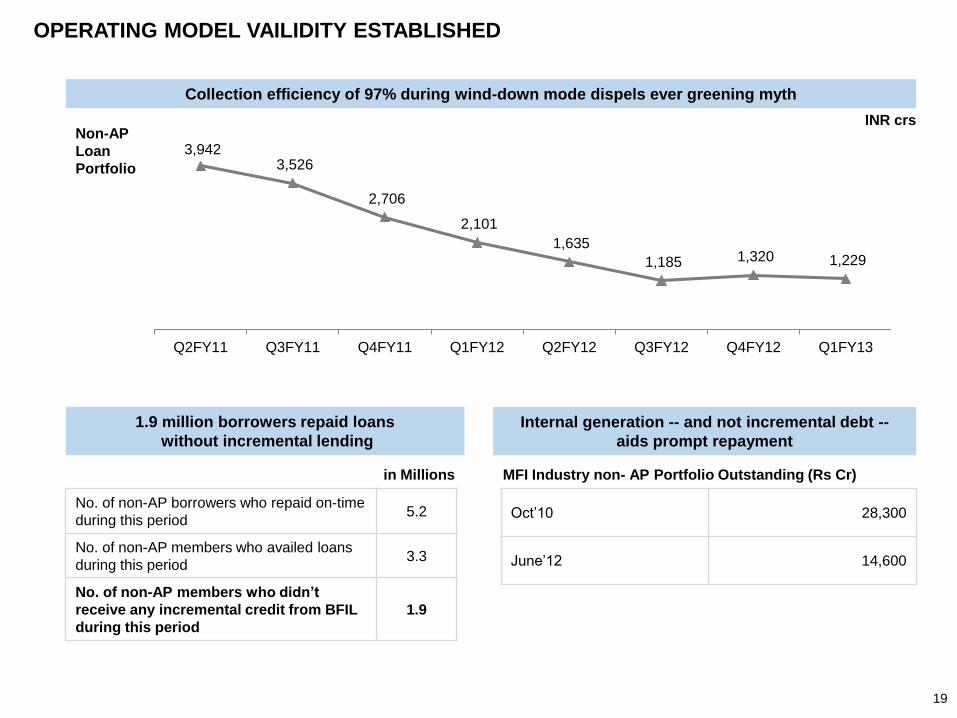
OPERATING MODEL VAILIDITY ESTABLISHED
3,942 3,526
2,706
2,101
1,635
1,185 1,320 1,229
Q2FY11 Q3FY11 Q4FY11 Q1FY12 Q2FY12 Q3FY12 Q4FY12 Q1FY13
Collection efficiency of 97% during wind-down mode dispels ever greening myth
Non-AP
Loan
Portfolio
No. of non-AP borrowers who repaid on-time
during this period5.2
No. of non-AP members who availed loans
during this period3.3
No. of non-AP members who didn’t
receive any incremental credit from BFIL
during this period
1.9
in Millions
1.9 million borrowers repaid loans
without incremental lending
INR crs
Internal generation -- and not incremental debt --
aids prompt repayment
MFI Industry non- AP Portfolio Outstanding (Rs Cr)
Oct’10 28,300
June’12 14,600
19
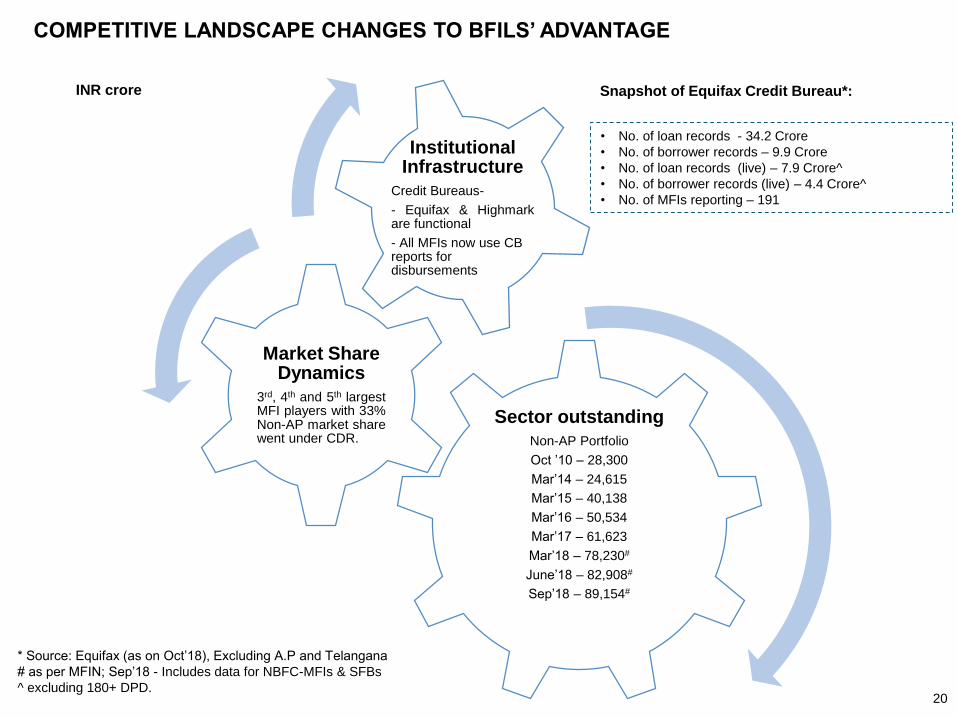
Sector outstanding
Non-AP Portfolio
Oct ’10 – 28,300
Mar’14 – 24,615
Mar’15 – 40,138
Mar’16 – 50,534
Mar’17 – 61,623
Mar’18 – 78,230#
June’18 – 82,908#
Sep’18 – 89,154#
Market Share Dynamics
3rd, 4th and 5th largestMFI players with 33%Non-AP market sharewent under CDR.
Institutional Infrastructure
Credit Bureaus-
- Equifax & Highmarkare functional
- All MFIs now use CB reports for disbursements
COMPETITIVE LANDSCAPE CHANGES TO BFILS’ ADVANTAGE
INR crore
• No. of loan records - 34.2 Crore
• No. of borrower records – 9.9 Crore
• No. of loan records (live) – 7.9 Crore^
• No. of borrower records (live) – 4.4 Crore^
• No. of MFIs reporting – 191
Snapshot of Equifax Credit Bureau*:
* Source: Equifax (as on Oct’18), Excluding A.P and Telangana
# as per MFIN; Sep’18 - Includes data for NBFC-MFIs & SFBs
^ excluding 180+ DPD.20
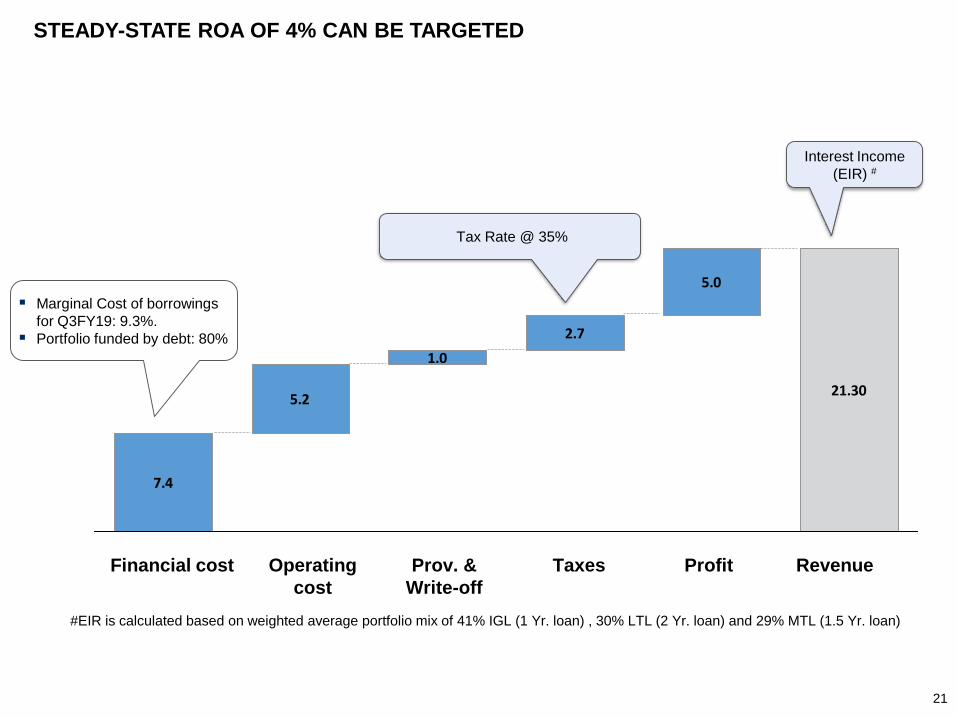
7.4
5.2
1.0
2.7
5.0
21.30
STEADY-STATE ROA OF 4% CAN BE TARGETED
RevenueProfitTaxesProv. &
Write-off
Operating
cost
Financial cost
▪ Marginal Cost of borrowings
for Q3FY19: 9.3%.
▪ Portfolio funded by debt: 80%
Tax Rate @ 35%
21
Interest Income
(EIR) #
#EIR is calculated based on weighted average portfolio mix of 41% IGL (1 Yr. loan) , 30% LTL (2 Yr. loan) and 29% MTL (1.5 Yr. loan)
GROWTH ANATOMY
22
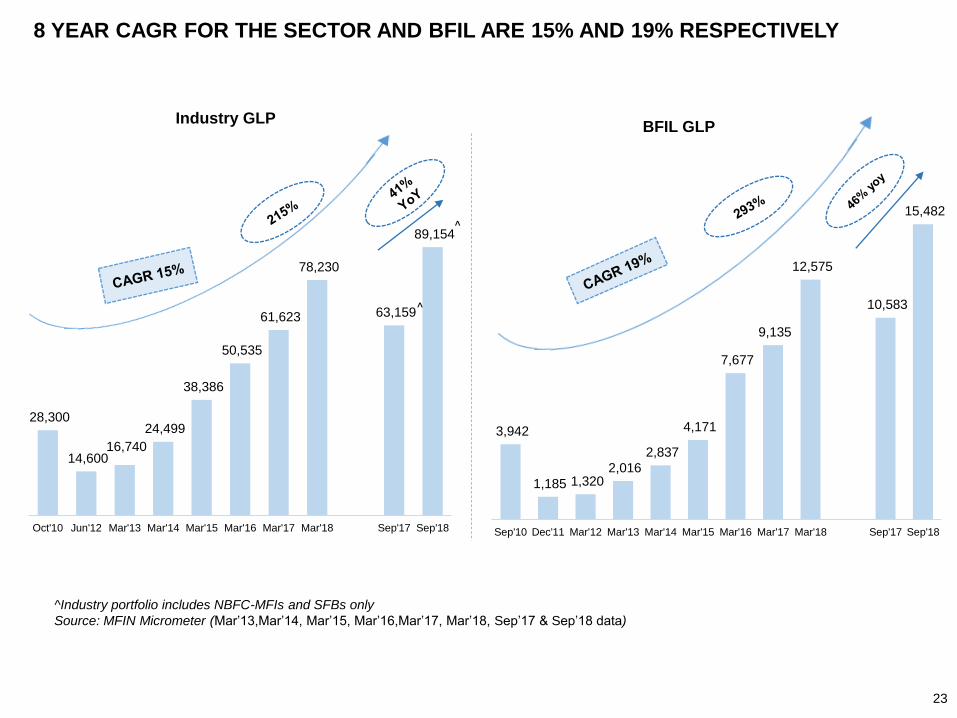
28,300
14,600 16,740
24,499
38,386
50,535
61,623
78,230
63,159
89,154
Oct'10 Jun'12 Mar'13 Mar'14 Mar'15 Mar'16 Mar'17 Mar'18 Sep'17 Sep'18
Industry GLP
3,942
1,185 1,320 2,016
2,837
4,171
7,677
9,135
12,575
10,583
15,482
Sep'10 Dec'11 Mar'12 Mar'13 Mar'14 Mar'15 Mar'16 Mar'17 Mar'18 Sep'17 Sep'18
BFIL GLP
8 YEAR CAGR FOR THE SECTOR AND BFIL ARE 15% AND 19% RESPECTIVELY
^Industry portfolio includes NBFC-MFIs and SFBs only
Source: MFIN Micrometer (Mar’13,Mar’14, Mar’15, Mar’16,Mar’17, Mar’18, Sep’17 & Sep’18 data)
23
^
^
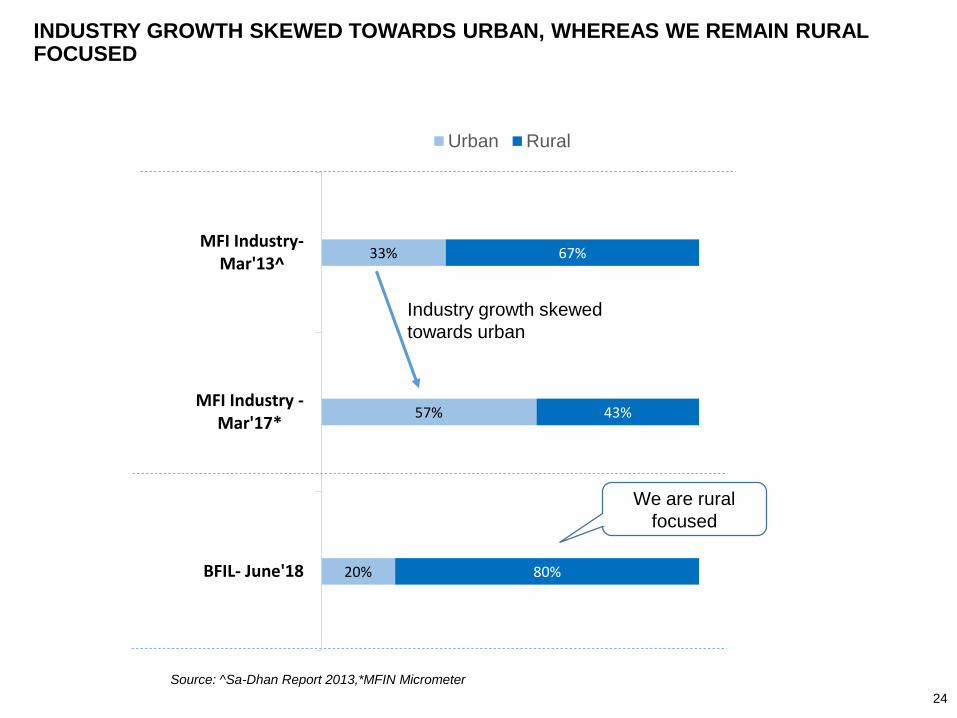
20%
57%
33%
80%
43%
67%
0% 20% 40% 60% 80% 100%
BFIL- June'18
MFI Industry -Mar'17*
MFI Industry-Mar'13^
Urban Rural
INDUSTRY GROWTH SKEWED TOWARDS URBAN, WHEREAS WE REMAIN RURAL FOCUSED
Industry growth skewed
towards urban
We are rural
focused
Source: ^Sa-Dhan Report 2013,*MFIN Micrometer
24
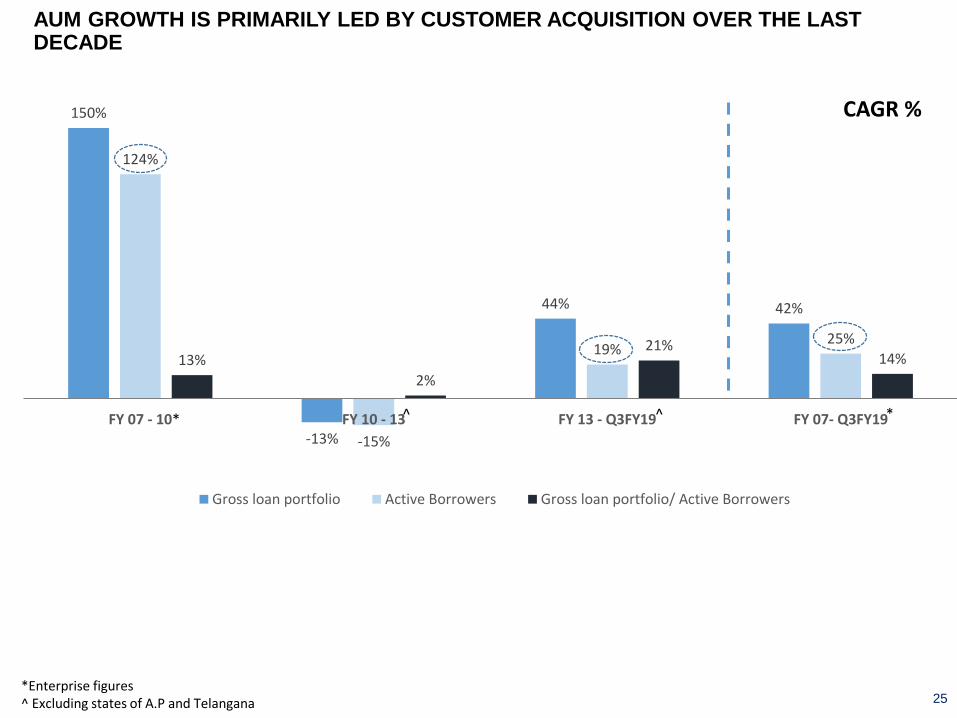
AUM GROWTH IS PRIMARILY LED BY CUSTOMER ACQUISITION OVER THE LAST DECADE
25
150%
-13%
44% 42%
124%
-15%
19%25%
13%
2%
21%14%
FY 07 - 10 FY 10 - 13 FY 13 - Q3FY19 FY 07- Q3FY19
Gross loan portfolio Active Borrowers Gross loan portfolio/ Active Borrowers
CAGR %
*
*Enterprise figures^ Excluding states of A.P and Telangana
^ ^ *
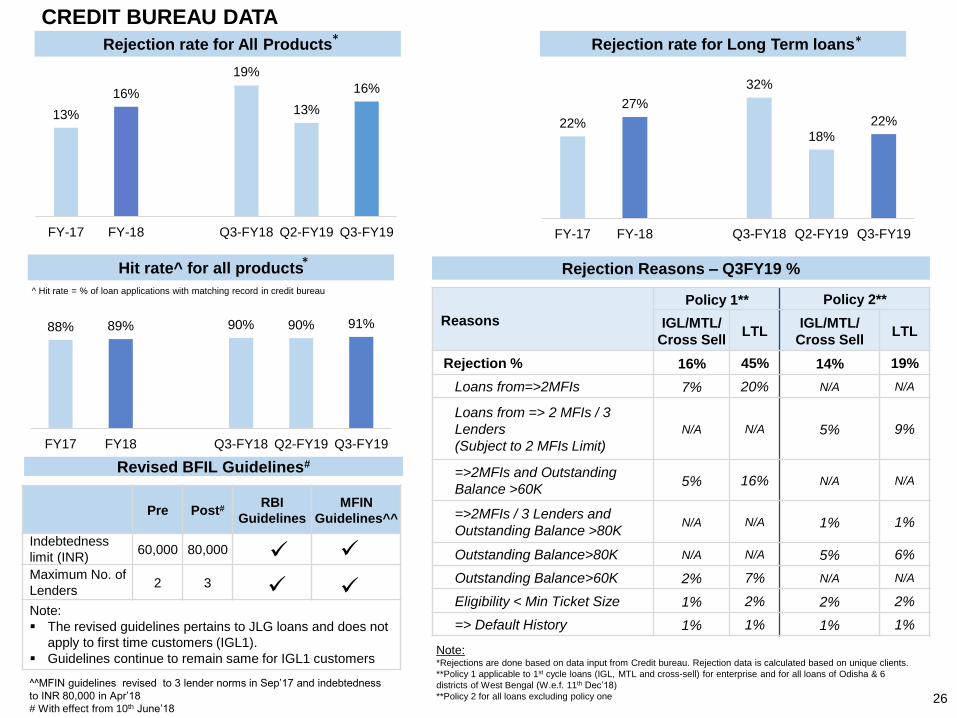
CREDIT BUREAU DATA
13%
16%
19%
13%
16%
FY-17 FY-18 Q3-FY18 Q2-FY19 Q3-FY19
22%
27%
32%
18%22%
FY-17 FY-18 Q3-FY18 Q2-FY19 Q3-FY19
Rejection rate for Long Term loansRejection rate for All Products
88% 89% 90% 90% 91%
FY17 FY18 Q3-FY18 Q2-FY19 Q3-FY19
Hit rate^ for all products
Hit rate = % of loan applications with matching record in credit bureau
Rejection Reasons – Q3FY19 %
26
Reasons
Policy 1** Policy 2**
IGL/MTL/
Cross SellLTL
IGL/MTL/
Cross SellLTL
Rejection % 16% 45% 14% 19%
Loans from=>2MFIs 7% 20% N/A N/A
Loans from => 2 MFIs / 3
Lenders
(Subject to 2 MFIs Limit)
N/A N/A 5% 9%
=>2MFIs and Outstanding
Balance >60K5% 16% N/A N/A
=>2MFIs / 3 Lenders and
Outstanding Balance >80KN/A N/A 1% 1%
Outstanding Balance>80K N/A N/A 5% 6%
Outstanding Balance>60K 2% 7% N/A N/A
Eligibility < Min Ticket Size 1% 2% 2% 2%
=> Default History 1% 1% 1% 1%
Note:*Rejections are done based on data input from Credit bureau. Rejection data is calculated based on unique clients.
**Policy 1 applicable to 1st cycle loans (IGL, MTL and cross-sell) for enterprise and for all loans of Odisha & 6
districts of West Bengal (W.e.f. 11th Dec’18)
**Policy 2 for all loans excluding policy one
* *
*
Pre Post#RBI
Guidelines
MFIN
Guidelines^^
Indebtedness
limit (INR)60,000 80,000
Maximum No. of
Lenders2 3
Note:
▪ The revised guidelines pertains to JLG loans and does not
apply to first time customers (IGL1).
▪ Guidelines continue to remain same for IGL1 customers
Revised BFIL Guidelines#
^^MFIN guidelines revised to 3 lender norms in Sep’17 and indebtedness
to INR 80,000 in Apr’18
# With effect from 10th June’18
✓
✓ ✓
✓
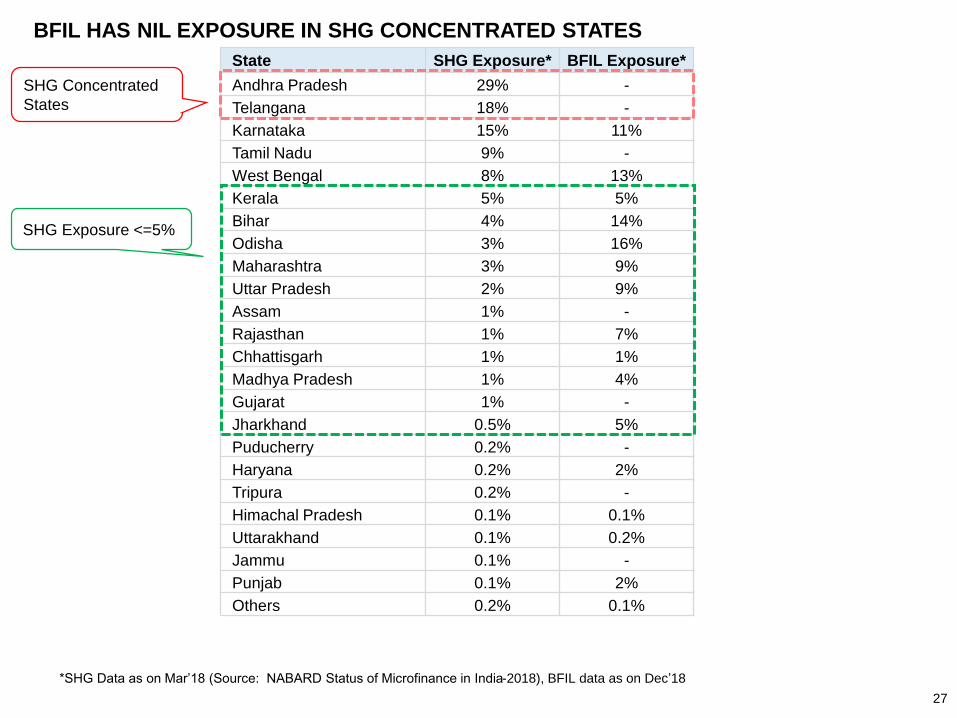
State SHG Exposure* BFIL Exposure*
Andhra Pradesh 29% -
Telangana 18% -
Karnataka 15% 11%
Tamil Nadu 9% -
West Bengal 8% 13%
Kerala 5% 5%
Bihar 4% 14%
Odisha 3% 16%
Maharashtra 3% 9%
Uttar Pradesh 2% 9%
Assam 1% -
Rajasthan 1% 7%
Chhattisgarh 1% 1%
Madhya Pradesh 1% 4%
Gujarat 1% -
Jharkhand 0.5% 5%
Puducherry 0.2% -
Haryana 0.2% 2%
Tripura 0.2% -
Himachal Pradesh 0.1% 0.1%
Uttarakhand 0.1% 0.2%
Jammu 0.1% -
Punjab 0.1% 2%
Others 0.2% 0.1%
BFIL HAS NIL EXPOSURE IN SHG CONCENTRATED STATES
SHG Exposure <=5%
SHG Concentrated
States
*SHG Data as on Mar’18 (Source: NABARD Status of Microfinance in India-2018), BFIL data as on Dec’18
27
FUTURE STRATEGY
28
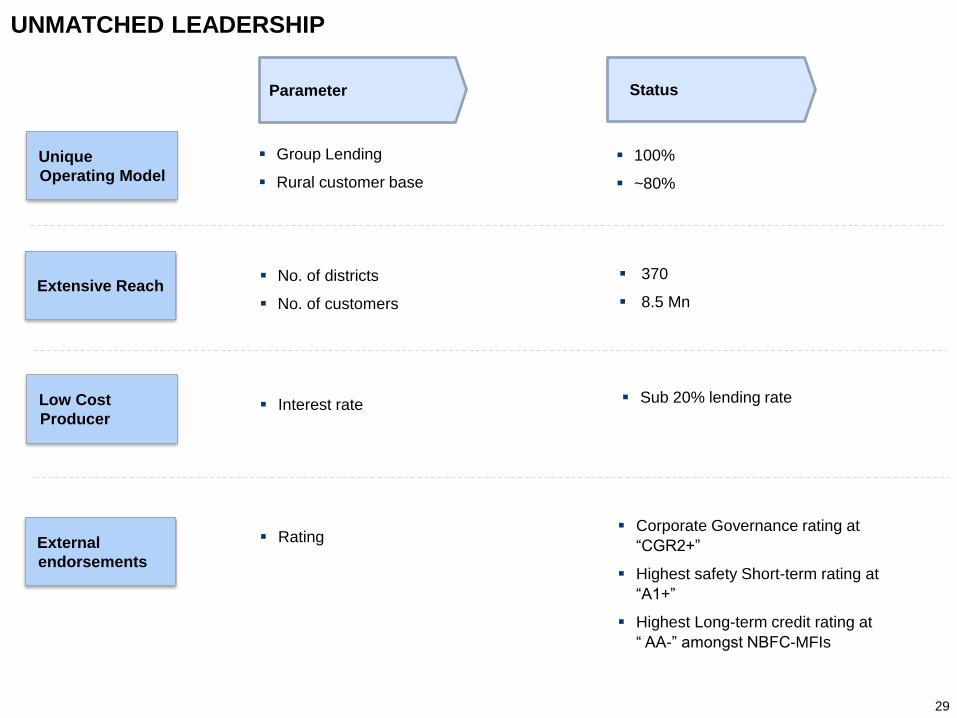
UNMATCHED LEADERSHIP
Unique
Operating Model
Extensive Reach
Low Cost
Producer
External
endorsements
Parameter
▪ Interest rate
▪ No. of districts
▪ No. of customers
▪ Group Lending
▪ Rural customer base
▪ Rating
Status
▪ 100%
▪ ~80%
▪ Sub 20% lending rate
▪ 370
▪ 8.5 Mn
▪ Corporate Governance rating at
“CGR2+”
▪ Highest safety Short-term rating at
“A1+”
▪ Highest Long-term credit rating at
“ AA-” amongst NBFC-MFIs
29
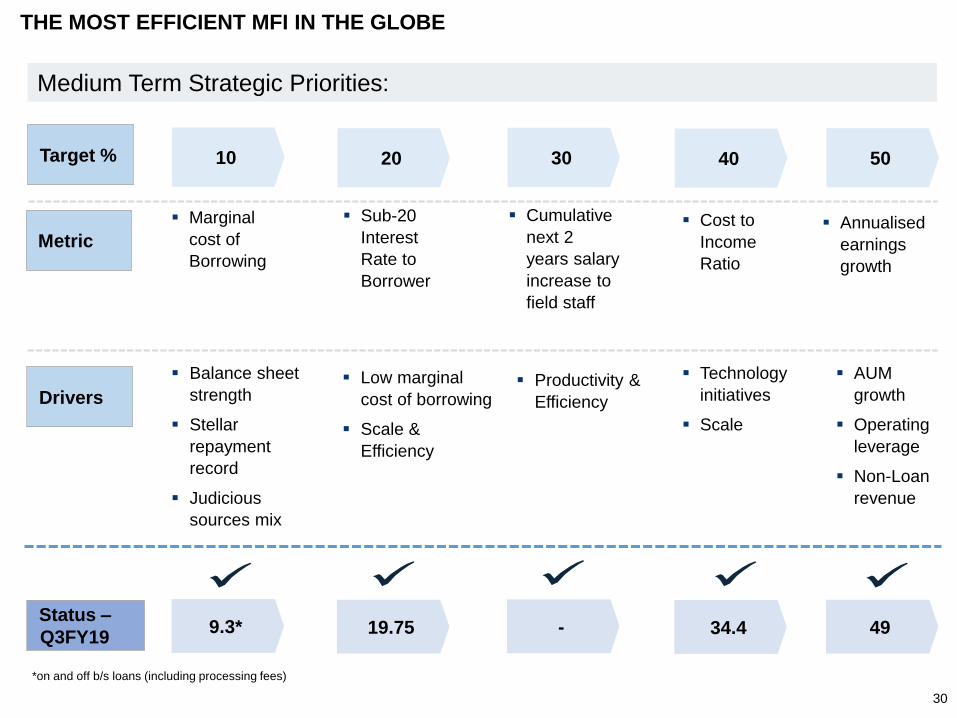
THE MOST EFFICIENT MFI IN THE GLOBE
10
Metric
▪ Sub-20
Interest
Rate to
Borrower
▪ Cost to
Income
Ratio
▪ Balance sheet
strength
▪ Stellar
repayment
record
▪ Judicious
sources mix
▪ Technology
initiatives
▪ Scale
▪ AUM
growth
▪ Operating
leverage
▪ Non-Loan
revenue
Drivers
▪ Marginal
cost of
Borrowing
▪ Cumulative
next 2
years salary
increase to
field staff
Target %
▪ Annualised
earnings
growth
Medium Term Strategic Priorities:
20 30 40 50
▪ Low marginal
cost of borrowing
▪ Scale &
Efficiency
▪ Productivity &
Efficiency
Status –
Q3FY199.3* 19.75 - 34.4 49
*on and off b/s loans (including processing fees)
30
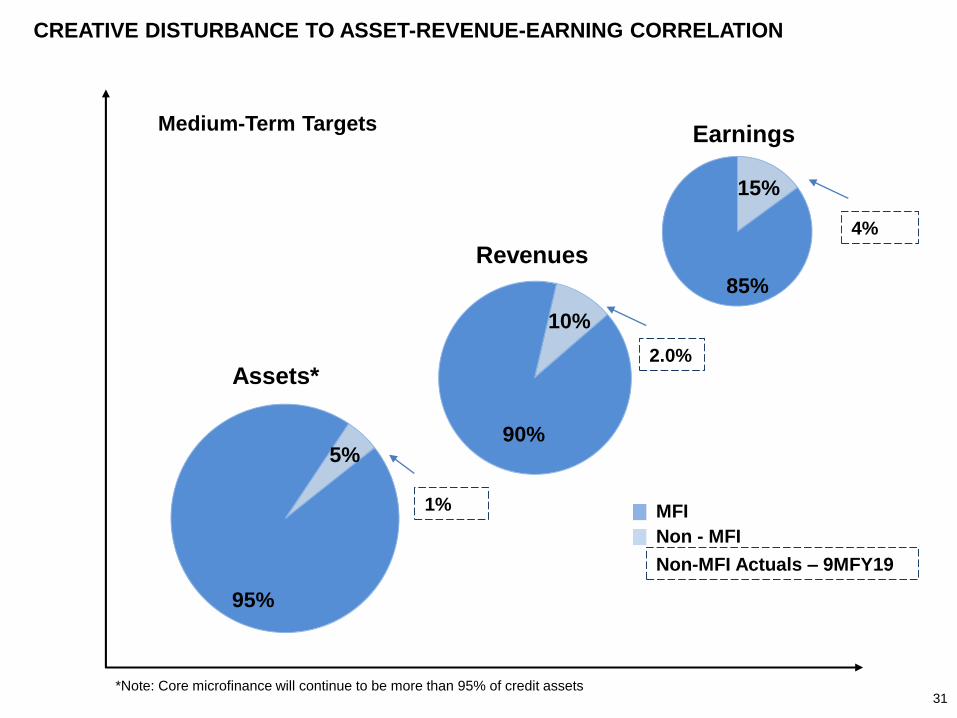
CREATIVE DISTURBANCE TO ASSET-REVENUE-EARNING CORRELATION
10%
90%
Revenues
5%
95%
Assets*
15%
85%
Earnings
*Note: Core microfinance will continue to be more than 95% of credit assets
Medium-Term Targets
MFI
Non - MFI
Non-MFI Actuals – 9MFY19
2.0%
1%
31
4%
PILOT ON RETAIL DISTRIBUTION
SERVICE POINTS (RDSP)
32
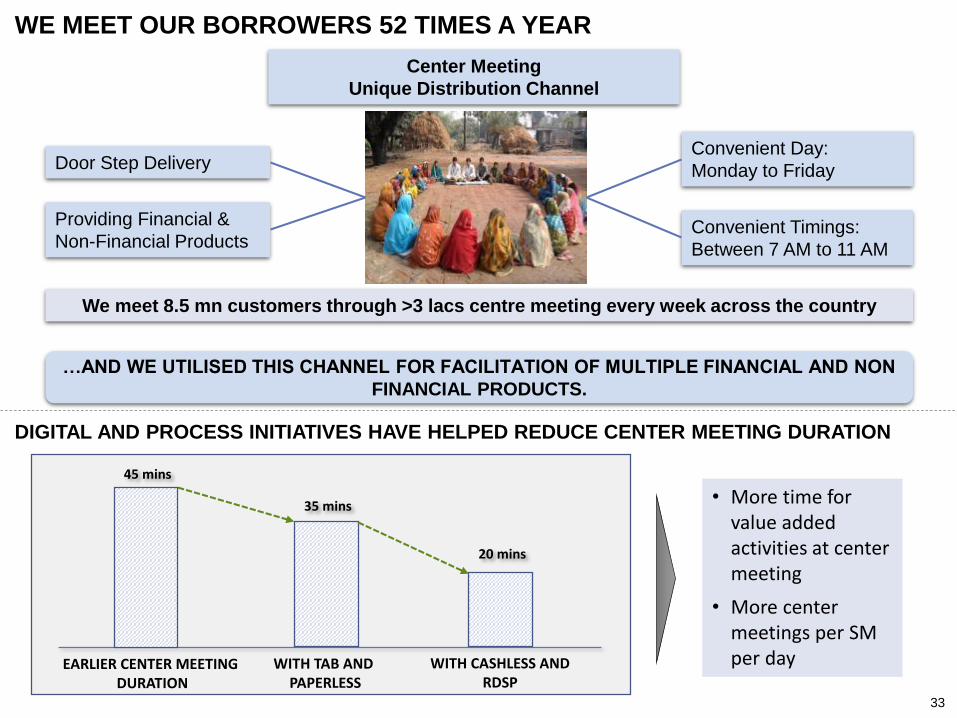
WE MEET OUR BORROWERS 52 TIMES A YEAR
Door Step Delivery
We meet 8.5 mn customers through >3 lacs centre meeting every week across the country
Center Meeting
Unique Distribution Channel
Convenient Day:
Monday to Friday
Convenient Timings:
Between 7 AM to 11 AM
Providing Financial &
Non-Financial Products
…AND WE UTILISED THIS CHANNEL FOR FACILITATION OF MULTIPLE FINANCIAL AND NON
FINANCIAL PRODUCTS.
33
DIGITAL AND PROCESS INITIATIVES HAVE HELPED REDUCE CENTER MEETING DURATION
EARLIER CENTER MEETINGDURATION
45 mins
WITH TAB AND PAPERLESS
35 mins
WITH CASHLESS AND RDSP
20 mins
• More time for value added activities at center meeting
• More center meetings per SM per day
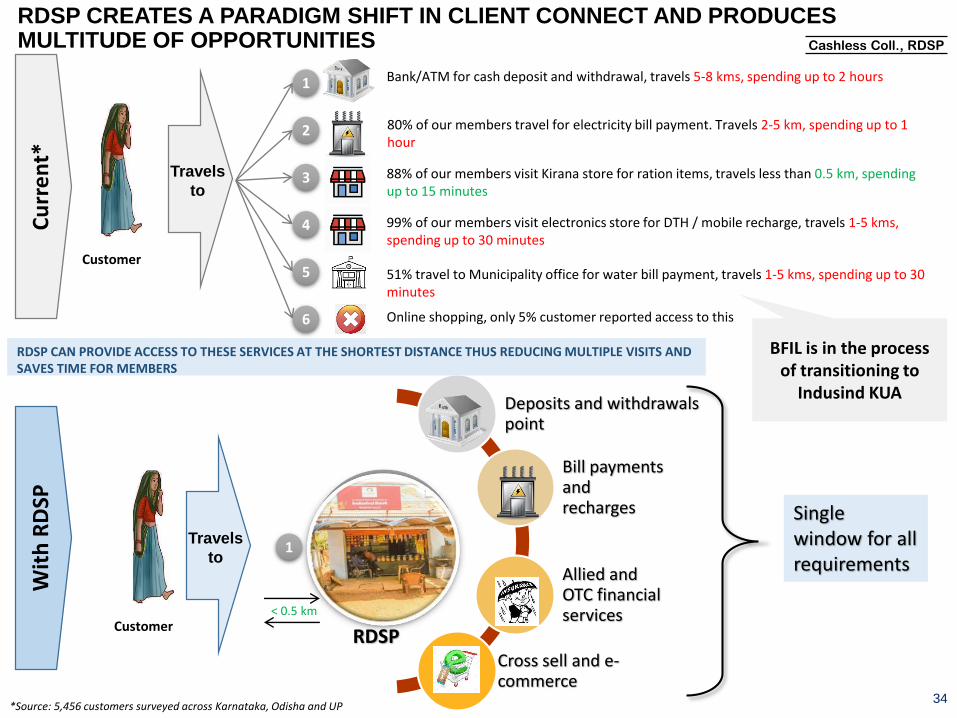
Deposits and withdrawals point
Bill payments and recharges
Allied and OTC financial services
Cross sell and e-commerce
RDSP CREATES A PARADIGM SHIFT IN CLIENT CONNECT AND PRODUCES MULTITUDE OF OPPORTUNITIES
34
Customer
Cu
rre
nt*
Wit
h R
DSP
80% of our members travel for electricity bill payment. Travels 2-5 km, spending up to 1 hour
88% of our members visit Kirana store for ration items, travels less than 0.5 km, spending up to 15 minutes
Travels
to
99% of our members visit electronics store for DTH / mobile recharge, travels 1-5 kms, spending up to 30 minutes
51% travel to Municipality office for water bill payment, travels 1-5 kms, spending up to 30 minutes
Bank/ATM for cash deposit and withdrawal, travels 5-8 kms, spending up to 2 hours
Online shopping, only 5% customer reported access to this
1
2
3
4
5
6
Customer
Travels
to
RDSP
Single window for all requirements
< 0.5 km
1
RDSP CAN PROVIDE ACCESS TO THESE SERVICES AT THE SHORTEST DISTANCE THUS REDUCING MULTIPLE VISITS AND SAVES TIME FOR MEMBERS
*Source: 5,456 customers surveyed across Karnataka, Odisha and UP
Cashless Coll., RDSP
BFIL is in the process of transitioning to
Indusind KUA
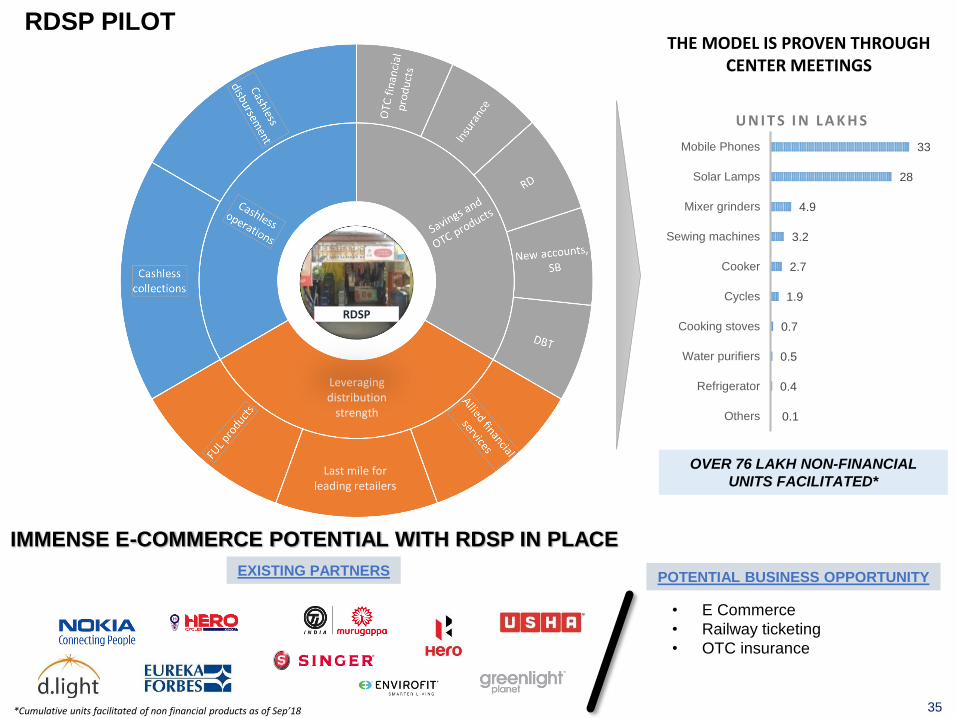
RDSP PILOT
35
Leveraging distribution
strength
Last mile for leading retailers
THE MODEL IS PROVEN THROUGH CENTER MEETINGS
IMMENSE E-COMMERCE POTENTIAL WITH RDSP IN PLACE
EXISTING PARTNERS POTENTIAL BUSINESS OPPORTUNITY
OVER 76 LAKH NON-FINANCIAL
UNITS FACILITATED*
*Cumulative units facilitated of non financial products as of Sep’18
RDSP
• E Commerce
• Railway ticketing
• OTC insurance
0.1
0.4
0.5
0.7
1.9
2.7
3.2
4.9
28
33
Others
Refrigerator
Water purifiers
Cooking stoves
Cycles
Cooker
Sewing machines
Mixer grinders
Solar Lamps
Mobile Phones
U N I T S I N L A K H S
UPDATE ON CASHLESS
DISBURSEMENT
36
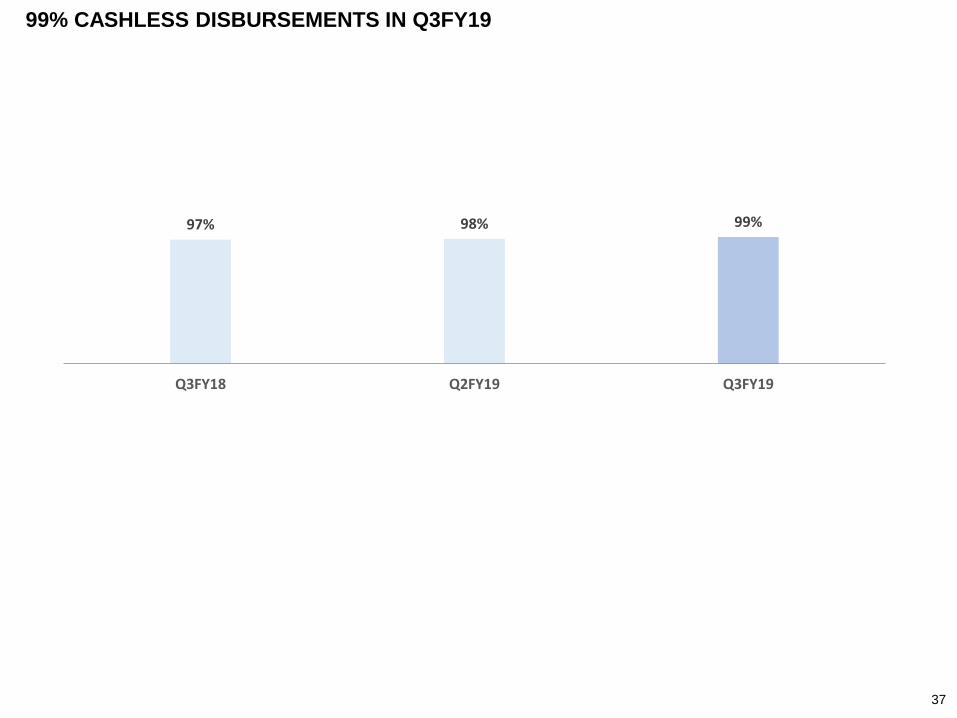
97% 98% 99%
0%10%20%30%40%50%60%70%80%90%
Q3FY18 Q2FY19 Q3FY19
37
99% CASHLESS DISBURSEMENTS IN Q3FY19
LOANS FOR HOME IMPROVEMENT &
TWO-WHEELER (PILOT)
38
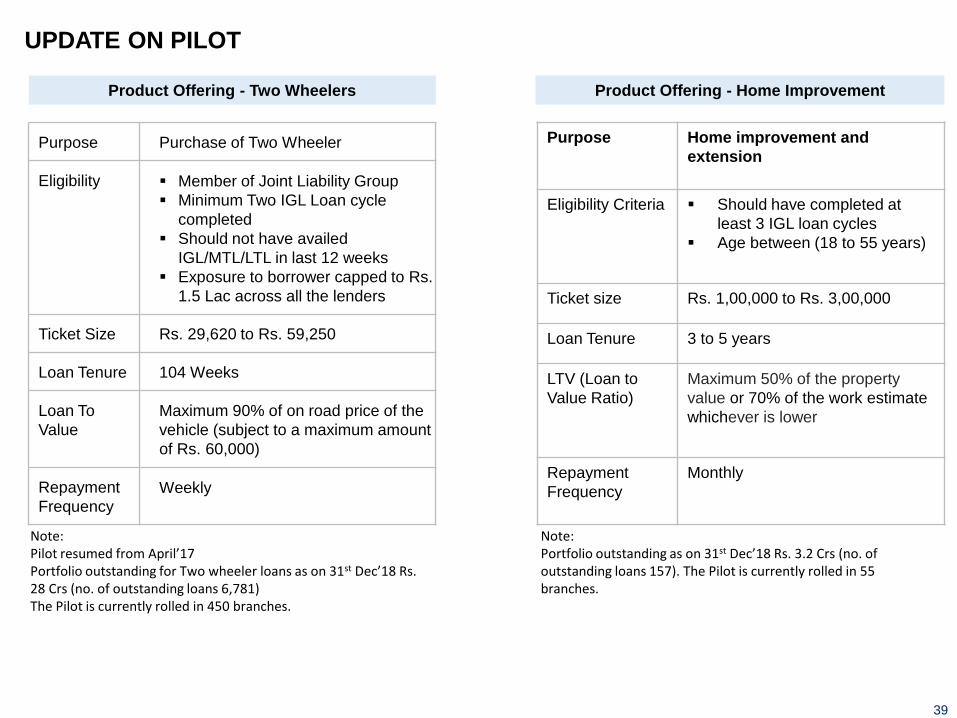
UPDATE ON PILOT
Purpose Purchase of Two Wheeler
Eligibility ▪ Member of Joint Liability Group
▪ Minimum Two IGL Loan cycle
completed
▪ Should not have availed
IGL/MTL/LTL in last 12 weeks
▪ Exposure to borrower capped to Rs.
1.5 Lac across all the lenders
Ticket Size Rs. 29,620 to Rs. 59,250
Loan Tenure 104 Weeks
Loan To
Value
Maximum 90% of on road price of the
vehicle (subject to a maximum amount
of Rs. 60,000)
Repayment
Frequency
Weekly
39
Note: Pilot resumed from April’17Portfolio outstanding for Two wheeler loans as on 31st Dec’18 Rs. 28 Crs (no. of outstanding loans 6,781)The Pilot is currently rolled in 450 branches.
Purpose Home improvement and
extension
Eligibility Criteria ▪ Should have completed at
least 3 IGL loan cycles
▪ Age between (18 to 55 years)
Ticket size Rs. 1,00,000 to Rs. 3,00,000
Loan Tenure 3 to 5 years
LTV (Loan to
Value Ratio)
Maximum 50% of the property
value or 70% of the work estimate
whichever is lower
Repayment
Frequency
Monthly
Product Offering - Home Improvement
Note: Portfolio outstanding as on 31st Dec’18 Rs. 3.2 Crs (no. of outstanding loans 157). The Pilot is currently rolled in 55 branches.
Product Offering - Two Wheelers
Q3FY19
PERFORMANCE HIGHLIGHTS
40
Operational
Efficiency
Financial
Efficiency
P&L Impact
Key Balance
Sheet Figures
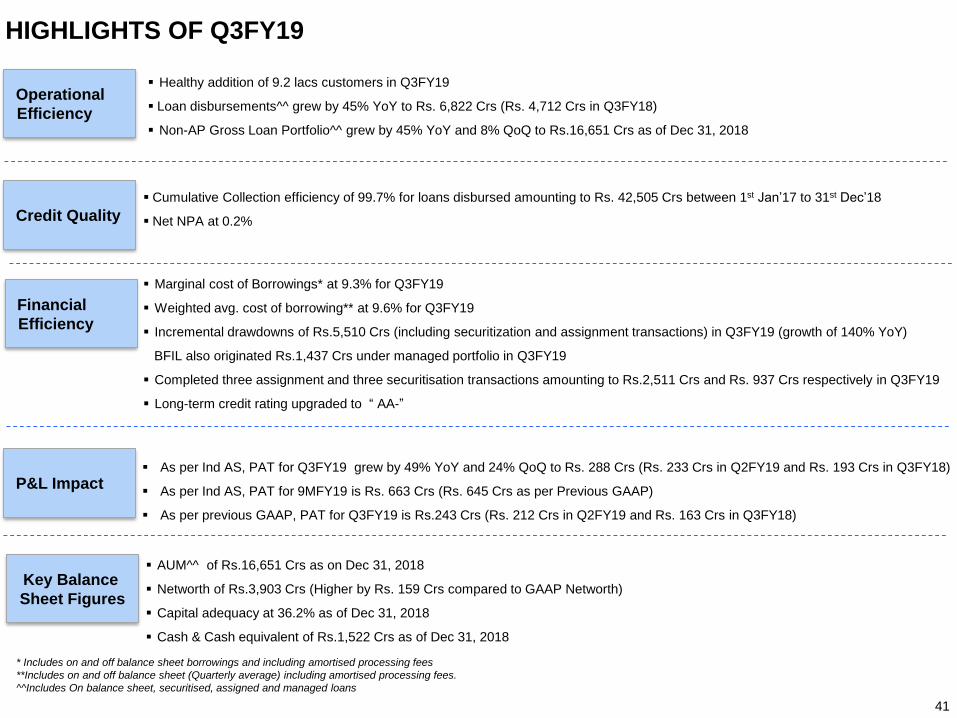
▪ As per Ind AS, PAT for Q3FY19 grew by 49% YoY and 24% QoQ to Rs. 288 Crs (Rs. 233 Crs in Q2FY19 and Rs. 193 Crs in Q3FY18)
▪ As per Ind AS, PAT for 9MFY19 is Rs. 663 Crs (Rs. 645 Crs as per Previous GAAP)
▪ As per previous GAAP, PAT for Q3FY19 is Rs.243 Crs (Rs. 212 Crs in Q2FY19 and Rs. 163 Crs in Q3FY18)
▪ Marginal cost of Borrowings* at 9.3% for Q3FY19
▪ Weighted avg. cost of borrowing** at 9.6% for Q3FY19
▪ Incremental drawdowns of Rs.5,510 Crs (including securitization and assignment transactions) in Q3FY19 (growth of 140% YoY)
BFIL also originated Rs.1,437 Crs under managed portfolio in Q3FY19
▪ Completed three assignment and three securitisation transactions amounting to Rs.2,511 Crs and Rs. 937 Crs respectively in Q3FY19
▪ Long-term credit rating upgraded to “ AA-”
▪ Healthy addition of 9.2 lacs customers in Q3FY19
▪ Loan disbursements^^ grew by 45% YoY to Rs. 6,822 Crs (Rs. 4,712 Crs in Q3FY18)
▪ Non-AP Gross Loan Portfolio^^ grew by 45% YoY and 8% QoQ to Rs.16,651 Crs as of Dec 31, 2018
▪ AUM^^ of Rs.16,651 Crs as on Dec 31, 2018
▪ Networth of Rs.3,903 Crs (Higher by Rs. 159 Crs compared to GAAP Networth)
▪ Capital adequacy at 36.2% as of Dec 31, 2018
▪ Cash & Cash equivalent of Rs.1,522 Crs as of Dec 31, 2018
41
* Includes on and off balance sheet borrowings and including amortised processing fees
**Includes on and off balance sheet (Quarterly average) including amortised processing fees.
^^Includes On balance sheet, securitised, assigned and managed loans
HIGHLIGHTS OF Q3FY19
Credit Quality
▪ Cumulative Collection efficiency of 99.7% for loans disbursed amounting to Rs. 42,505 Crs between 1st Jan’17 to 31st Dec’18
▪ Net NPA at 0.2%
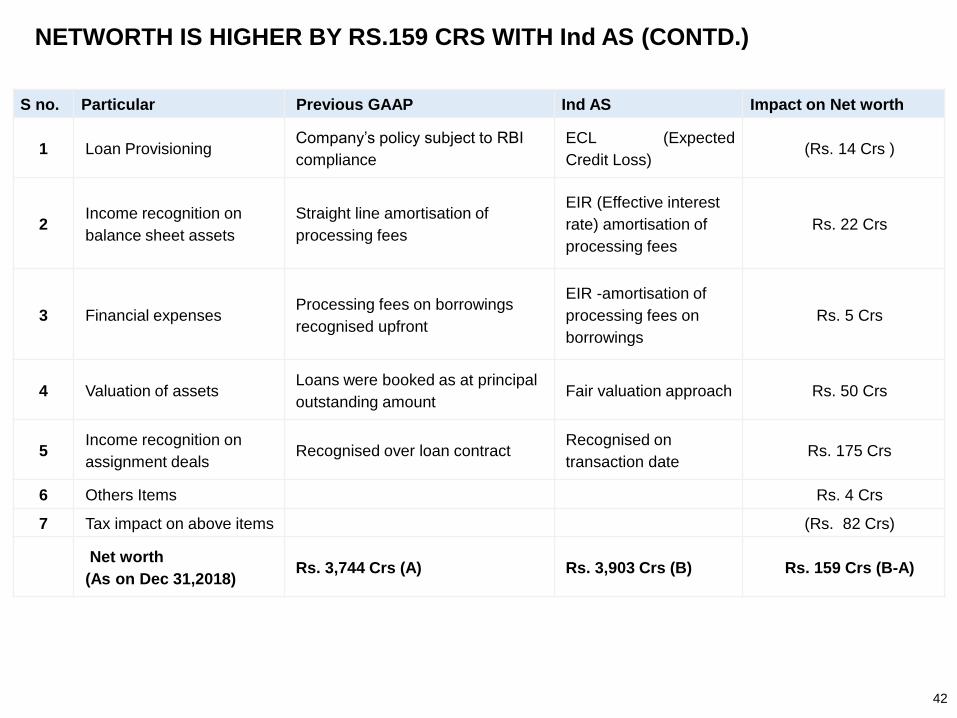
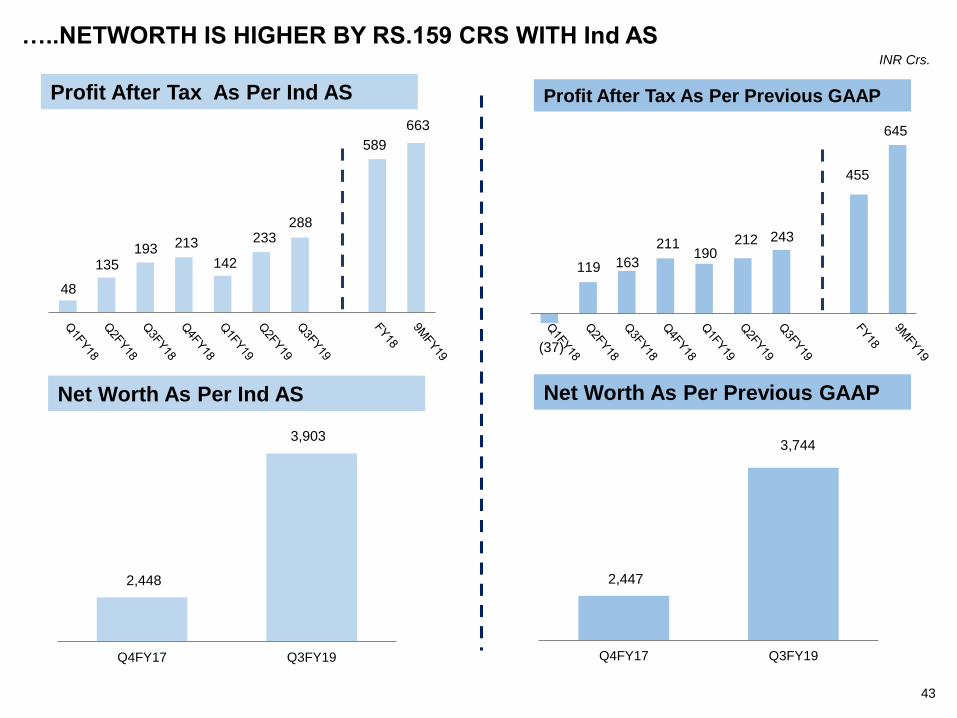
NETWORTH IS HIGHER BY RS.159 CRS WITH Ind AS (CONTD.)
42
S no. Particular Previous GAAP Ind AS Impact on Net worth
1 Loan Provisioning Company’s policy subject to RBI
compliance
ECL (Expected
Credit Loss)(Rs. 14 Crs )
2Income recognition on
balance sheet assets
Straight line amortisation of
processing fees
EIR (Effective interest
rate) amortisation of
processing fees
Rs. 22 Crs
3 Financial expenses Processing fees on borrowings
recognised upfront
EIR -amortisation of
processing fees on
borrowings
Rs. 5 Crs
4 Valuation of assetsLoans were booked as at principal
outstanding amountFair valuation approach Rs. 50 Crs
5Income recognition on
assignment dealsRecognised over loan contract
Recognised on
transaction dateRs. 175 Crs
6 Others Items Rs. 4 Crs
7 Tax impact on above items (Rs. 82 Crs)
Net worth
(As on Dec 31,2018)Rs. 3,744 Crs (A) Rs. 3,903 Crs (B) Rs. 159 Crs (B-A)
2,447
3,744
Q4FY17 Q3FY19
…..NETWORTH IS HIGHER BY RS.159 CRS WITH Ind AS
43
Profit After Tax As Per Previous GAAPProfit After Tax As Per Ind AS
INR Crs.
Net Worth As Per Previous GAAPNet Worth As Per Ind AS
(37)
119 163
211 190
212 243
455
645
48
135 193 213
142
233 288
589
663
2,448
3,903
Q4FY17 Q3FY19
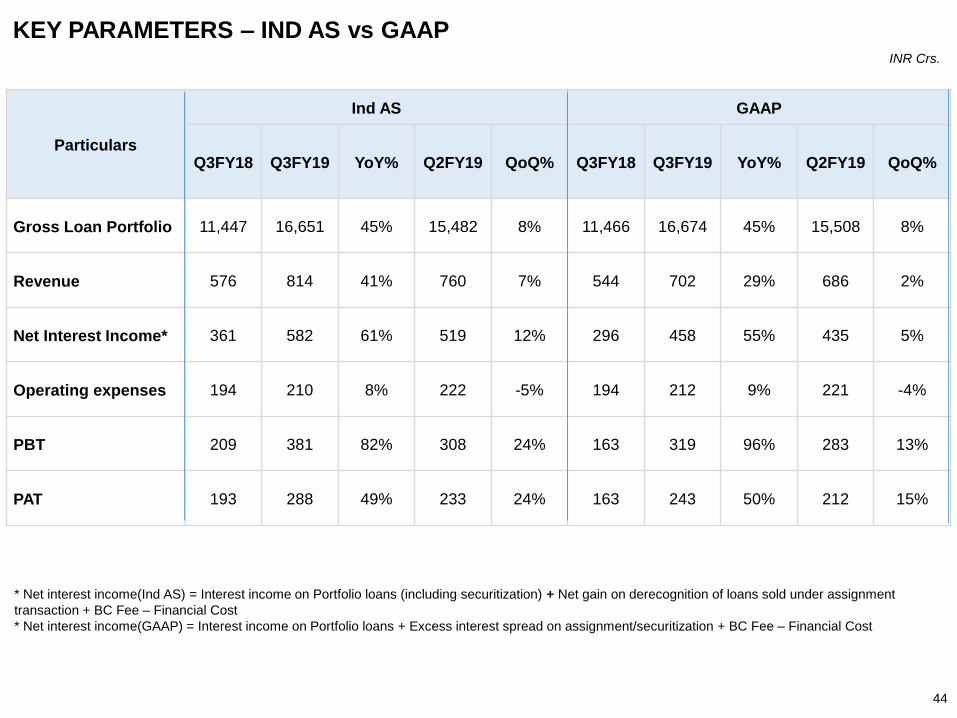
KEY PARAMETERS – IND AS vs GAAP
44
* Net interest income(Ind AS) = Interest income on Portfolio loans (including securitization) + Net gain on derecognition of loans sold under assignment
transaction + BC Fee – Financial Cost
* Net interest income(GAAP) = Interest income on Portfolio loans + Excess interest spread on assignment/securitization + BC Fee – Financial Cost
INR Crs.
Particulars
Ind AS GAAP
Q3FY18 Q3FY19 YoY% Q2FY19 QoQ% Q3FY18 Q3FY19 YoY% Q2FY19 QoQ%
Gross Loan Portfolio 11,447 16,651 45% 15,482 8% 11,466 16,674 45% 15,508 8%
Revenue 576 814 41% 760 7% 544 702 29% 686 2%
Net Interest Income* 361 582 61% 519 12% 296 458 55% 435 5%
Operating expenses 194 210 8% 222 -5% 194 212 9% 221 -4%
PBT 209 381 82% 308 24% 163 319 96% 283 13%
PAT 193 288 49% 233 24% 163 243 50% 212 15%
OPERATIONAL HIGHLIGHTS
45
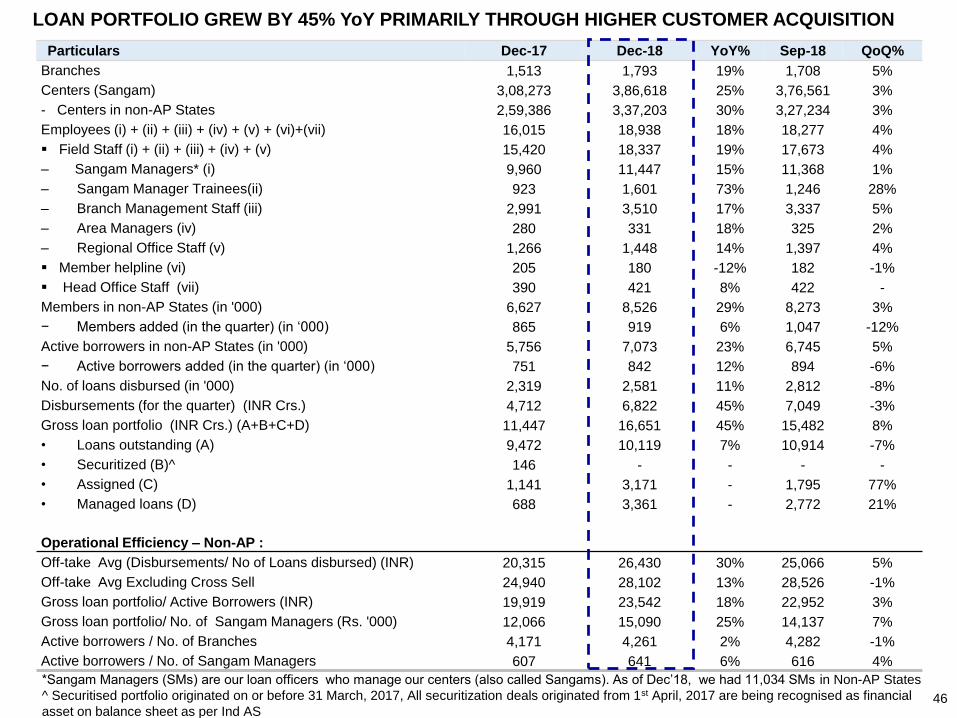
LOAN PORTFOLIO GREW BY 45% YoY PRIMARILY THROUGH HIGHER CUSTOMER ACQUISITION
Particulars Dec-17 Dec-18 YoY% Sep-18 QoQ%
Branches 1,513 1,793 19% 1,708 5%
Centers (Sangam) 3,08,273 3,86,618 25% 3,76,561 3%
- Centers in non-AP States 2,59,386 3,37,203 30% 3,27,234 3%
Employees (i) + (ii) + (iii) + (iv) + (v) + (vi)+(vii) 16,015 18,938 18% 18,277 4%
▪ Field Staff (i) + (ii) + (iii) + (iv) + (v) 15,420 18,337 19% 17,673 4%
– Sangam Managers* (i) 9,960 11,447 15% 11,368 1%
– Sangam Manager Trainees(ii) 923 1,601 73% 1,246 28%
– Branch Management Staff (iii) 2,991 3,510 17% 3,337 5%
– Area Managers (iv) 280 331 18% 325 2%
– Regional Office Staff (v) 1,266 1,448 14% 1,397 4%
▪ Member helpline (vi) 205 180 -12% 182 -1%
▪ Head Office Staff (vii) 390 421 8% 422 -
Members in non-AP States (in '000) 6,627 8,526 29% 8,273 3%
− Members added (in the quarter) (in ‘000) 865 919 6% 1,047 -12%
Active borrowers in non-AP States (in '000) 5,756 7,073 23% 6,745 5%
− Active borrowers added (in the quarter) (in ‘000) 751 842 12% 894 -6%
No. of loans disbursed (in '000) 2,319 2,581 11% 2,812 -8%
Disbursements (for the quarter) (INR Crs.) 4,712 6,822 45% 7,049 -3%
Gross loan portfolio (INR Crs.) (A+B+C+D) 11,447 16,651 45% 15,482 8%
• Loans outstanding (A) 9,472 10,119 7% 10,914 -7%
• Securitized (B)^ 146 - - - -
• Assigned (C) 1,141 3,171 - 1,795 77%
• Managed loans (D) 688 3,361 - 2,772 21%
Operational Efficiency – Non-AP :
Off-take Avg (Disbursements/ No of Loans disbursed) (INR) 20,315 26,430 30% 25,066 5%
Off-take Avg Excluding Cross Sell 24,940 28,102 13% 28,526 -1%
Gross loan portfolio/ Active Borrowers (INR) 19,919 23,542 18% 22,952 3%
Gross loan portfolio/ No. of Sangam Managers (Rs. '000) 12,066 15,090 25% 14,137 7%
Active borrowers / No. of Branches 4,171 4,261 2% 4,282 -1%
Active borrowers / No. of Sangam Managers 607 641 6% 616 4%
*Sangam Managers (SMs) are our loan officers who manage our centers (also called Sangams). As of Dec’18, we had 11,034 SMs in Non-AP States
^ Securitised portfolio originated on or before 31 March, 2017, All securitization deals originated from 1st April, 2017 are being recognised as financial
asset on balance sheet as per Ind AS46
47
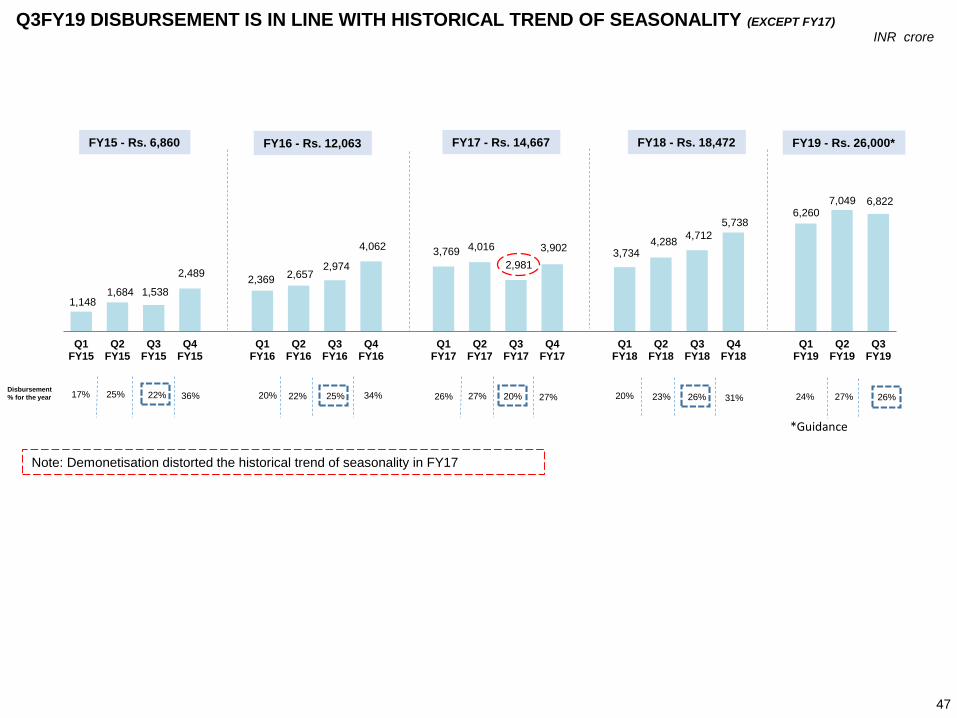
INR crore
1,148 1,684 1,538
2,489 2,369
2,657 2,974
4,062 3,769 4,016
2,981
3,902 3,734
4,288 4,712
5,738 6,260
7,049 6,822
Q1FY15
Q2FY15
Q3FY15
Q4FY15
Q1FY16
Q2FY16
Q3FY16
Q4FY16
Q1FY17
Q2FY17
Q3FY17
Q4FY17
Q1FY18
Q2FY18
Q3FY18
Q4FY18
Q1FY19
Q2FY19
Q3FY19
Disbursement
% for the year 17% 25% 22% 36%
FY16 - Rs. 12,063
Q3FY19 DISBURSEMENT IS IN LINE WITH HISTORICAL TREND OF SEASONALITY (EXCEPT FY17)
FY15 - Rs. 6,860 FY18 - Rs. 18,472FY17 - Rs. 14,667
20% 22% 25% 34% 26% 27% 20% 27% 20%
Note: Demonetisation distorted the historical trend of seasonality in FY17
23% 26%
FY19 - Rs. 26,000*
31% 24%
*Guidance
27% 26%
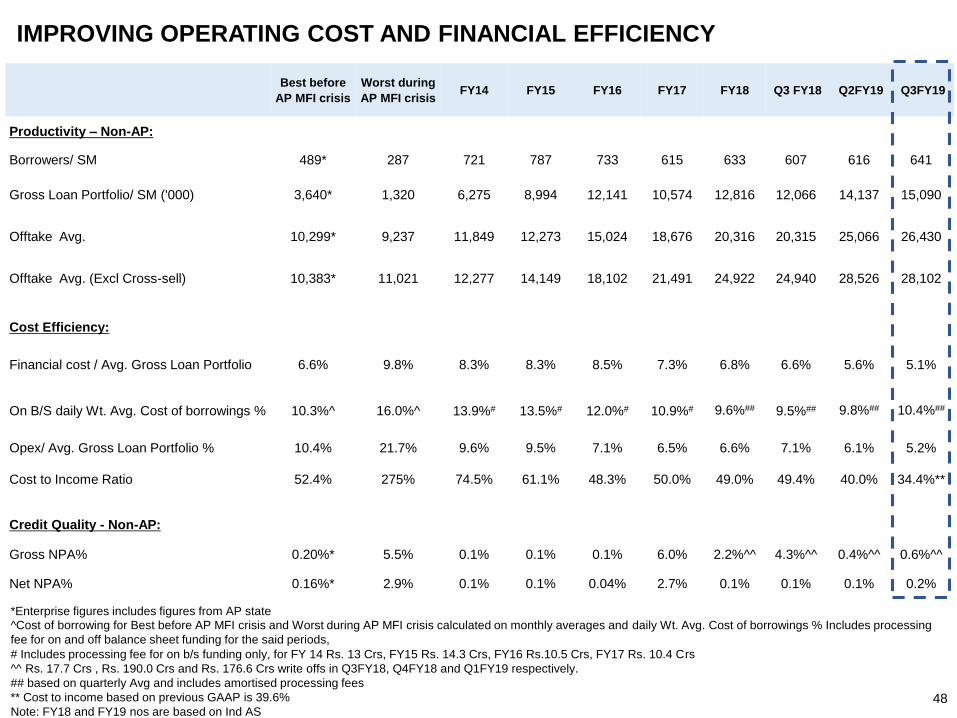
IMPROVING OPERATING COST AND FINANCIAL EFFICIENCY
Best before
AP MFI crisis
Worst during
AP MFI crisisFY14 FY15 FY16 FY17 FY18 Q3 FY18 Q2FY19 Q3FY19
Productivity – Non-AP:
Borrowers/ SM 489* 287 721 787 733 615 633 607 616 641
Gross Loan Portfolio/ SM ('000) 3,640* 1,320 6,275 8,994 12,141 10,574 12,816 12,066 14,137 15,090
Offtake Avg. 10,299* 9,237 11,849 12,273 15,024 18,676 20,316 20,315 25,066 26,430
Offtake Avg. (Excl Cross-sell) 10,383* 11,021 12,277 14,149 18,102 21,491 24,922 24,940 28,526 28,102
Cost Efficiency:
Financial cost / Avg. Gross Loan Portfolio 6.6% 9.8% 8.3% 8.3% 8.5% 7.3% 6.8% 6.6% 5.6% 5.1%
On B/S daily Wt. Avg. Cost of borrowings % 10.3%^ 16.0%^ 13.9%# 13.5%# 12.0%# 10.9%# 9.6%## 9.5%## 9.8%## 10.4%##
Opex/ Avg. Gross Loan Portfolio % 10.4% 21.7% 9.6% 9.5% 7.1% 6.5% 6.6% 7.1% 6.1% 5.2%
Cost to Income Ratio 52.4% 275% 74.5% 61.1% 48.3% 50.0% 49.0% 49.4% 40.0% 34.4%**
Credit Quality - Non-AP:
Gross NPA% 0.20%* 5.5% 0.1% 0.1% 0.1% 6.0% 2.2%^^ 4.3%^^ 0.4%^^ 0.6%^^
Net NPA% 0.16%* 2.9% 0.1% 0.1% 0.04% 2.7% 0.1% 0.1% 0.1% 0.2%
*Enterprise figures includes figures from AP state
^Cost of borrowing for Best before AP MFI crisis and Worst during AP MFI crisis calculated on monthly averages and daily Wt. Avg. Cost of borrowings % Includes processing
fee for on and off balance sheet funding for the said periods,
# Includes processing fee for on b/s funding only, for FY 14 Rs. 13 Crs, FY15 Rs. 14.3 Crs, FY16 Rs.10.5 Crs, FY17 Rs. 10.4 Crs
^^ Rs. 17.7 Crs , Rs. 190.0 Crs and Rs. 176.6 Crs write offs in Q3FY18, Q4FY18 and Q1FY19 respectively.
## based on quarterly Avg and includes amortised processing fees
** Cost to income based on previous GAAP is 39.6%
Note: FY18 and FY19 nos are based on Ind AS48
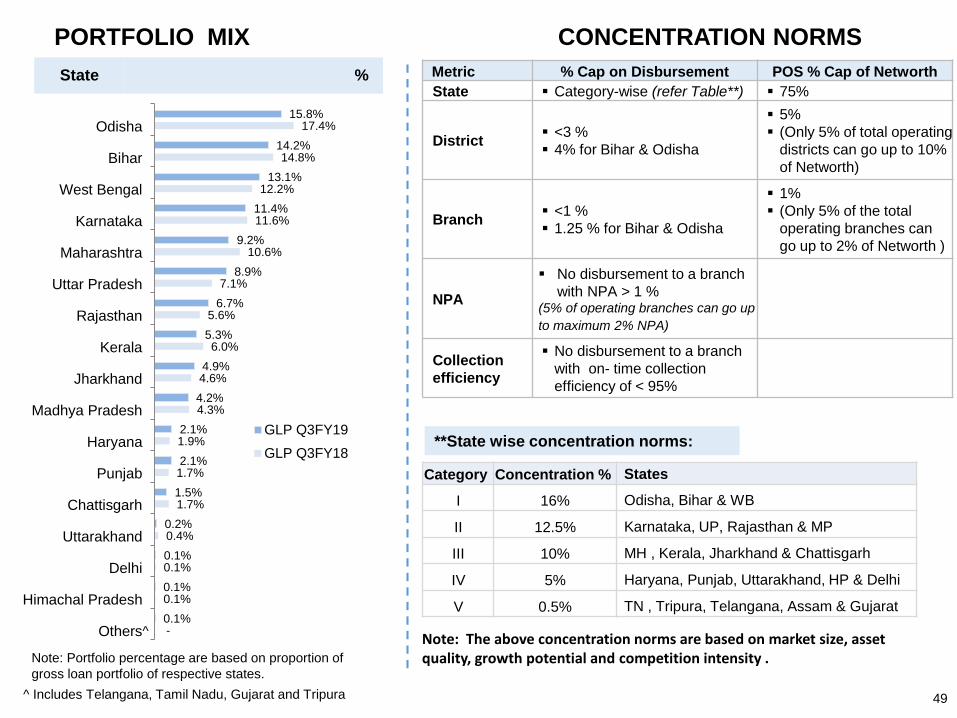
PORTFOLIO MIX CONCENTRATION NORMS
Metric % Cap on Disbursement POS % Cap of Networth
State ▪ Category-wise (refer Table**) ▪ 75%
District ▪ <3 %
▪ 4% for Bihar & Odisha
▪ 5%
▪ (Only 5% of total operating
districts can go up to 10%
of Networth)
Branch ▪ <1 %
▪ 1.25 % for Bihar & Odisha
▪ 1%
▪ (Only 5% of the total
operating branches can
go up to 2% of Networth )
NPA
▪ No disbursement to a branch
with NPA > 1 %(5% of operating branches can go up
to maximum 2% NPA)
Collection
efficiency
▪ No disbursement to a branch
with on- time collection
efficiency of < 95%
State %
49
Category Concentration % States
I 16% Odisha, Bihar & WB
II 12.5% Karnataka, UP, Rajasthan & MP
III 10% MH , Kerala, Jharkhand & Chattisgarh
IV 5% Haryana, Punjab, Uttarakhand, HP & Delhi
V 0.5% TN , Tripura, Telangana, Assam & Gujarat
**State wise concentration norms:
Note: The above concentration norms are based on market size, asset quality, growth potential and competition intensity .Note: Portfolio percentage are based on proportion of
gross loan portfolio of respective states.
^ Includes Telangana, Tamil Nadu, Gujarat and Tripura
-
0.1%
0.1%
0.4%
1.7%
1.7%
1.9%
4.3%
4.6%
6.0%
5.6%
7.1%
10.6%
11.6%
12.2%
14.8%
17.4%
0.1%
0.1%
0.1%
0.2%
1.5%
2.1%
2.1%
4.2%
4.9%
5.3%
6.7%
8.9%
9.2%
11.4%
13.1%
14.2%
15.8%
Others
Himachal Pradesh
Delhi
Uttarakhand
Chattisgarh
Punjab
Haryana
Madhya Pradesh
Jharkhand
Kerala
Rajasthan
Uttar Pradesh
Maharashtra
Karnataka
West Bengal
Bihar
Odisha
GLP Q3FY19
GLP Q3FY18
^
*As of Dec’18
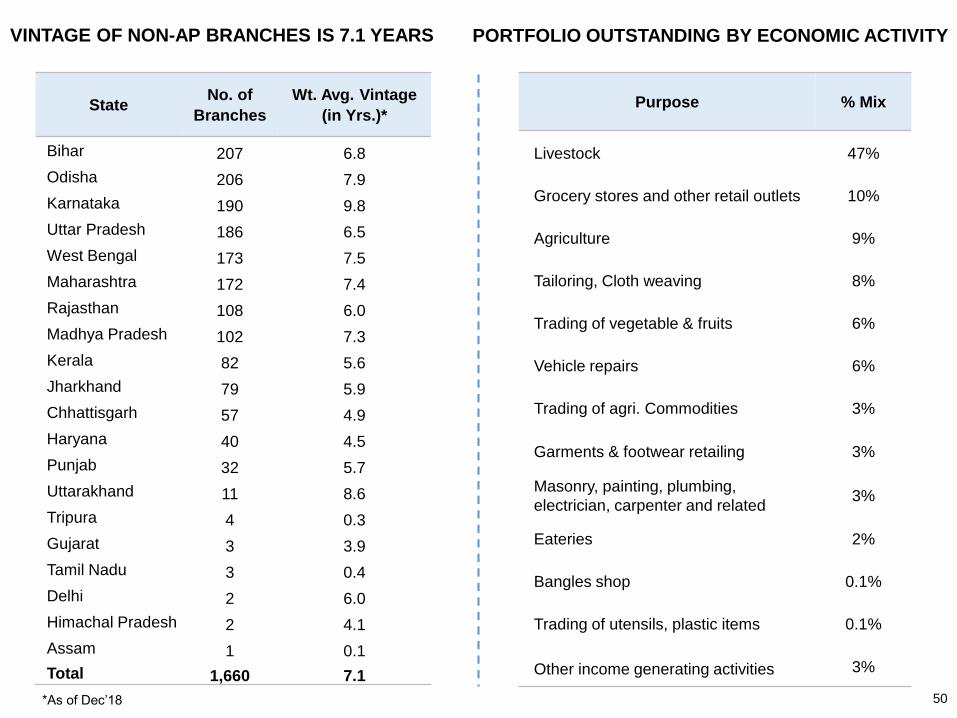
VINTAGE OF NON-AP BRANCHES IS 7.1 YEARS PORTFOLIO OUTSTANDING BY ECONOMIC ACTIVITY
StateNo. of
Branches
Wt. Avg. Vintage
(in Yrs.)*
Bihar 207 6.8
Odisha 206 7.9
Karnataka 190 9.8
Uttar Pradesh 186 6.5
West Bengal 173 7.5
Maharashtra 172 7.4
Rajasthan 108 6.0
Madhya Pradesh 102 7.3
Kerala 82 5.6
Jharkhand 79 5.9
Chhattisgarh 57 4.9
Haryana 40 4.5
Punjab 32 5.7
Uttarakhand 11 8.6
Tripura 4 0.3
Gujarat 3 3.9
Tamil Nadu 3 0.4
Delhi 2 6.0
Himachal Pradesh 2 4.1
Assam 1 0.1
Total 1,660 7.1
Purpose % Mix
Livestock 47%
Grocery stores and other retail outlets 10%
Agriculture 9%
Tailoring, Cloth weaving 8%
Trading of vegetable & fruits 6%
Vehicle repairs 6%
Trading of agri. Commodities 3%
Garments & footwear retailing 3%
Masonry, painting, plumbing,
electrician, carpenter and related3%
Eateries 2%
Bangles shop 0.1%
Trading of utensils, plastic items 0.1%
Other income generating activities 3%
50
INDUSTRY UPDATE ON CREDIT
QUALITY
51
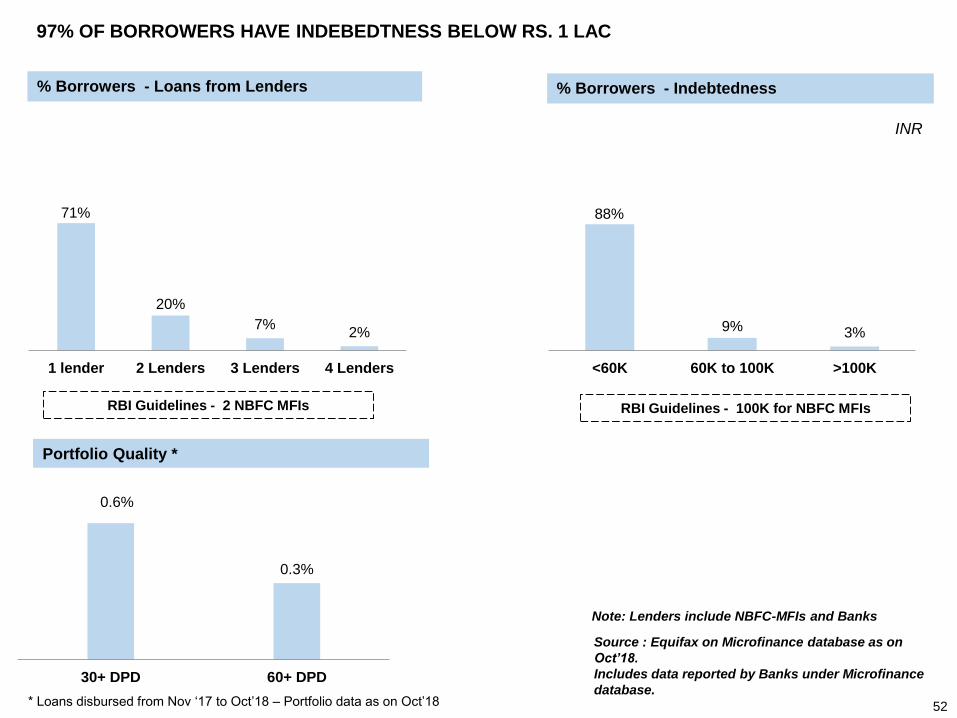
0.6%
0.3%
30+ DPD 60+ DPD
97% OF BORROWERS HAVE INDEBEDTNESS BELOW RS. 1 LAC
% Borrowers - Indebtedness
Portfolio Quality *
% Borrowers - Loans from Lenders
52
71%
20%
7%2%
1 lender 2 Lenders 3 Lenders 4 Lenders
Source : Equifax on Microfinance database as on
Oct’18.
Includes data reported by Banks under Microfinance
database.
88%
9% 3%
<60K 60K to 100K >100K
RBI Guidelines - 2 NBFC MFIs RBI Guidelines - 100K for NBFC MFIs
Note: Lenders include NBFC-MFIs and Banks
INR
* Loans disbursed from Nov ‘17 to Oct’18 – Portfolio data as on Oct’18
REVIEW OF FINANCIALS
53
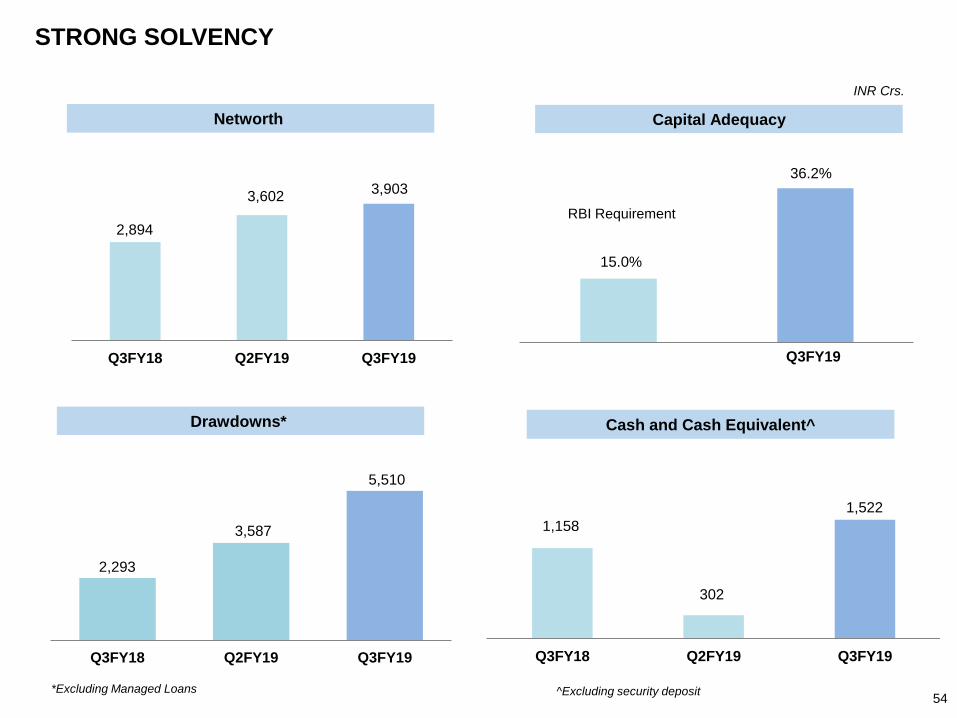
STRONG SOLVENCY
INR Crs.
Capital AdequacyNetworth
Cash and Cash Equivalent^Drawdowns*
^Excluding security deposit
15.0%
RBI Requirement
Q3FY19
36.2%
2,293
3,587
5,510
Q3FY18 Q2FY19 Q3FY19
2,894
3,602 3,903
Q3FY18 Q2FY19 Q3FY19
*Excluding Managed Loans
1,158
302
1,522
Q3FY18 Q2FY19 Q3FY19
54
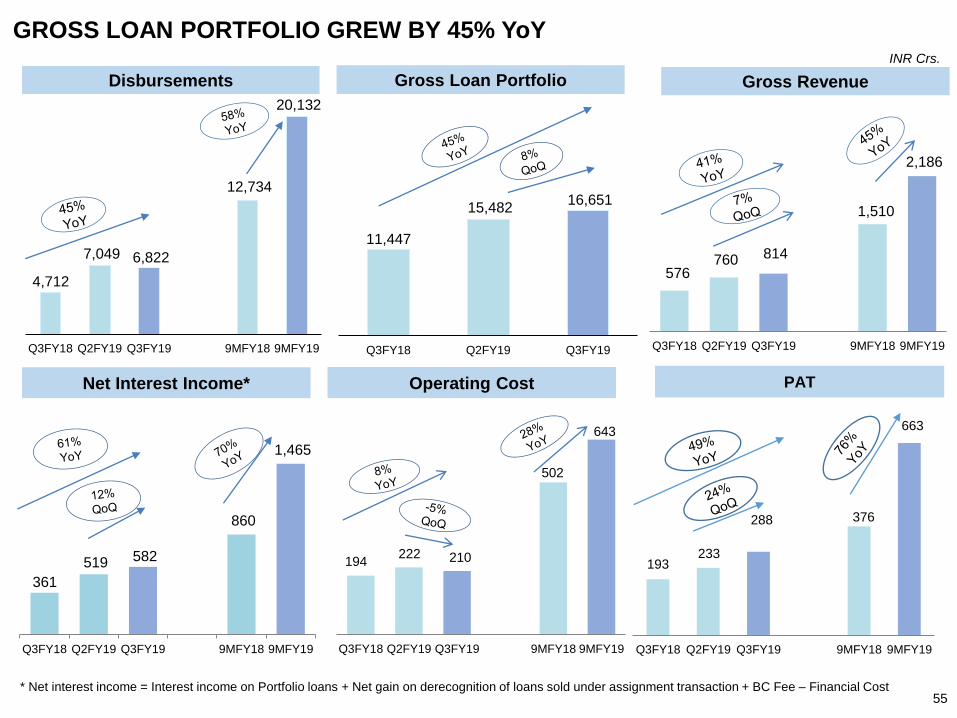
4,712
7,049 6,822
12,734
20,132
Q3FY18 Q2FY19 Q3FY19 9MFY18 9MFY19
193 233
288 376
663
Q3FY18 Q2FY19 Q3FY19 9MFY18 9MFY19
194 222 210
502
643
Q3FY18 Q2FY19 Q3FY19 9MFY18 9MFY19
GROSS LOAN PORTFOLIO GREW BY 45% YoY
55
PATOperating CostNet Interest Income*
* Net interest income = Interest income on Portfolio loans + Net gain on derecognition of loans sold under assignment transaction + BC Fee – Financial Cost
Disbursements Gross Loan Portfolio Gross Revenue
INR Crs.
11,447
15,482 16,651
Q3FY18 Q2FY19 Q3FY19
576 760 814
1,510
2,186
Q3FY18 Q2FY19 Q3FY19 9MFY18 9MFY19
361
519 582
860
1,465
Q3FY18 Q2FY19 Q3FY19 9MFY18 9MFY19
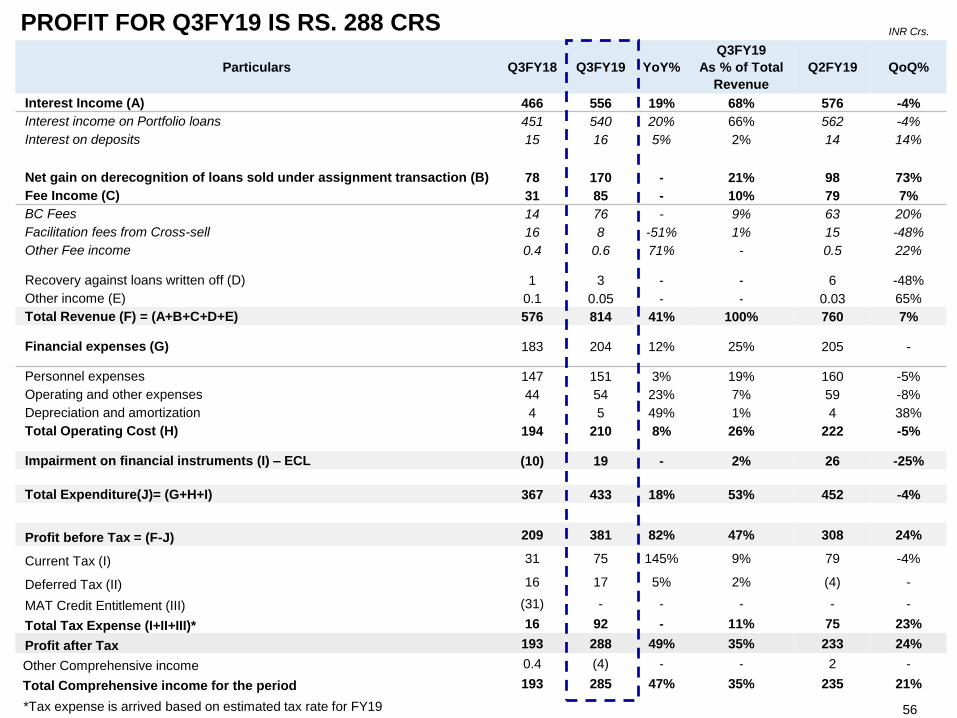
Particulars Q3FY18 Q3FY19 YoY%
Q3FY19
As % of Total
Revenue
Q2FY19 QoQ%
Interest Income (A) 466 556 19% 68% 576 -4%
Interest income on Portfolio loans 451 540 20% 66% 562 -4%
Interest on deposits 15 16 5% 2% 14 14%
Net gain on derecognition of loans sold under assignment transaction (B) 78 170 - 21% 98 73%
Fee Income (C) 31 85 - 10% 79 7%
BC Fees 14 76 - 9% 63 20%
Facilitation fees from Cross-sell 16 8 -51% 1% 15 -48%
Other Fee income 0.4 0.6 71% - 0.5 22%
Recovery against loans written off (D) 1 3 - - 6 -48%
Other income (E) 0.1 0.05 - - 0.03 65%
Total Revenue (F) = (A+B+C+D+E) 576 814 41% 100% 760 7%
Financial expenses (G) 183 204 12% 25% 205 -
Personnel expenses 147 151 3% 19% 160 -5%
Operating and other expenses 44 54 23% 7% 59 -8%
Depreciation and amortization 4 5 49% 1% 4 38%
Total Operating Cost (H) 194 210 8% 26% 222 -5%
Impairment on financial instruments (I) – ECL (10) 19 - 2% 26 -25%
Total Expenditure(J)= (G+H+I) 367 433 18% 53% 452 -4%
Profit before Tax = (F-J) 209 381 82% 47% 308 24%
Current Tax (I) 31 75 145% 9% 79 -4%
Deferred Tax (II) 16 17 5% 2% (4) -
MAT Credit Entitlement (III) (31) - - - - -
Total Tax Expense (I+II+III)* 16 92 - 11% 75 23%
Profit after Tax 193 288 49% 35% 233 24%
Other Comprehensive income 0.4 (4) - - 2 -
Total Comprehensive income for the period 193 285 47% 35% 235 21%
INR Crs.
56
PROFIT FOR Q3FY19 IS RS. 288 CRS
*Tax expense is arrived based on estimated tax rate for FY19
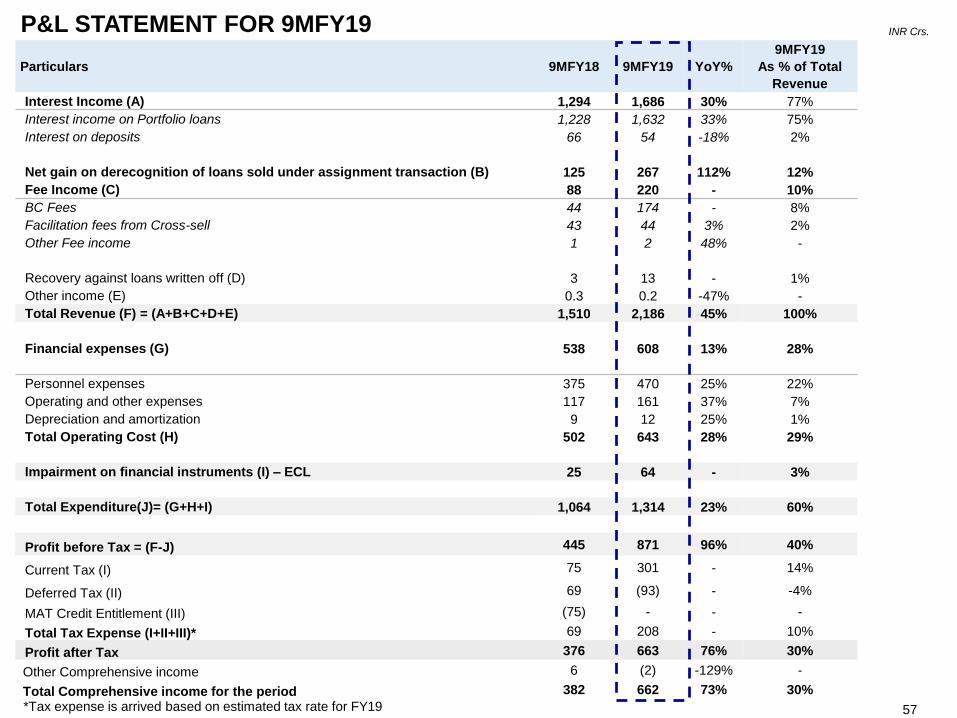
Particulars 9MFY18 9MFY19 YoY%
9MFY19
As % of Total
Revenue
Interest Income (A) 1,294 1,686 30% 77%
Interest income on Portfolio loans 1,228 1,632 33% 75%
Interest on deposits 66 54 -18% 2%
Net gain on derecognition of loans sold under assignment transaction (B) 125 267 112% 12%
Fee Income (C) 88 220 - 10%
BC Fees 44 174 - 8%
Facilitation fees from Cross-sell 43 44 3% 2%
Other Fee income 1 2 48% -
Recovery against loans written off (D) 3 13 - 1%
Other income (E) 0.3 0.2 -47% -
Total Revenue (F) = (A+B+C+D+E) 1,510 2,186 45% 100%
Financial expenses (G) 538 608 13% 28%
Personnel expenses 375 470 25% 22%
Operating and other expenses 117 161 37% 7%
Depreciation and amortization 9 12 25% 1%
Total Operating Cost (H) 502 643 28% 29%
Impairment on financial instruments (I) – ECL 25 64 - 3%
Total Expenditure(J)= (G+H+I) 1,064 1,314 23% 60%
Profit before Tax = (F-J) 445 871 96% 40%
Current Tax (I) 75 301 - 14%
Deferred Tax (II) 69 (93) - -4%
MAT Credit Entitlement (III) (75) - - -
Total Tax Expense (I+II+III)* 69 208 - 10%
Profit after Tax 376 663 76% 30%
Other Comprehensive income 6 (2) -129% -
Total Comprehensive income for the period 382 662 73% 30%
INR Crs.
57
P&L STATEMENT FOR 9MFY19
*Tax expense is arrived based on estimated tax rate for FY19
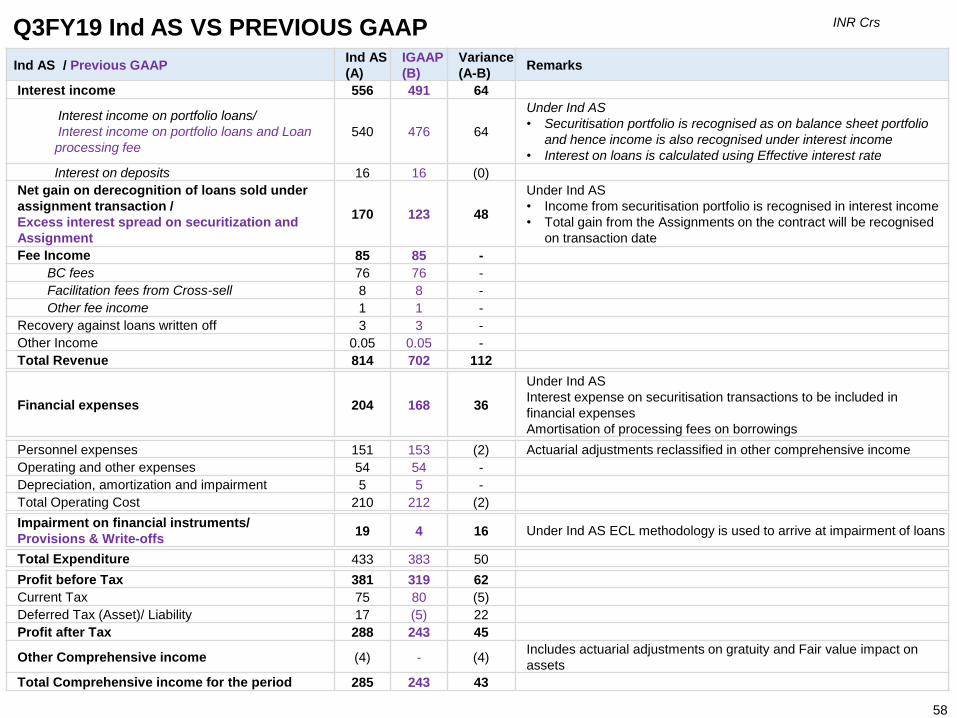
Q3FY19 Ind AS VS PREVIOUS GAAP
58
Ind AS / Previous GAAPInd AS
(A)
IGAAP
(B)
Variance
(A-B)Remarks
Interest income 556 491 64
Interest income on portfolio loans/
Interest income on portfolio loans and Loan
processing fee
540 476 64
Under Ind AS
• Securitisation portfolio is recognised as on balance sheet portfolio
and hence income is also recognised under interest income
• Interest on loans is calculated using Effective interest rate
Interest on deposits 16 16 (0)
Net gain on derecognition of loans sold under
assignment transaction /
Excess interest spread on securitization and
Assignment
170 123 48
Under Ind AS
• Income from securitisation portfolio is recognised in interest income
• Total gain from the Assignments on the contract will be recognised
on transaction date
Fee Income 85 85 -
BC fees 76 76 -
Facilitation fees from Cross-sell 8 8 -
Other fee income 1 1 -
Recovery against loans written off 3 3 -
Other Income 0.05 0.05 -
Total Revenue 814 702 112
Financial expenses 204 168 36
Under Ind AS
Interest expense on securitisation transactions to be included in
financial expenses
Amortisation of processing fees on borrowings
Personnel expenses 151 153 (2) Actuarial adjustments reclassified in other comprehensive income
Operating and other expenses 54 54 -
Depreciation, amortization and impairment 5 5 -
Total Operating Cost 210 212 (2)
Impairment on financial instruments/
Provisions & Write-offs19 4 16 Under Ind AS ECL methodology is used to arrive at impairment of loans
Total Expenditure 433 383 50
Profit before Tax 381 319 62
Current Tax 75 80 (5)
Deferred Tax (Asset)/ Liability 17 (5) 22
Profit after Tax 288 243 45
Other Comprehensive income (4) - (4)Includes actuarial adjustments on gratuity and Fair value impact on
assets
Total Comprehensive income for the period 285 243 43
INR Crs
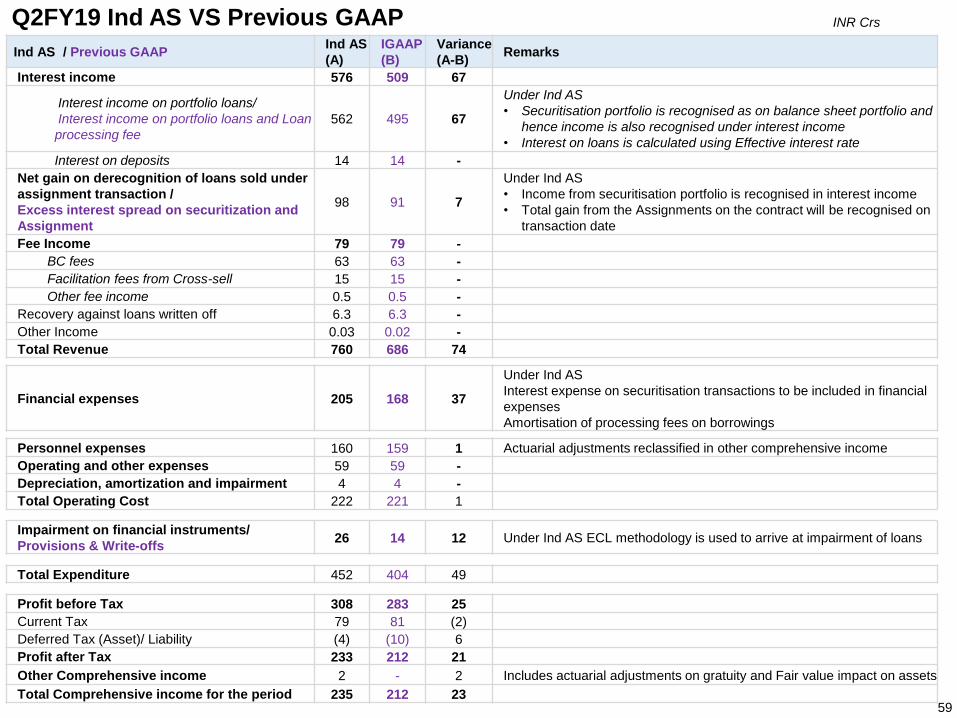
Q2FY19 Ind AS VS Previous GAAP
59
Ind AS / Previous GAAPInd AS
(A)
IGAAP
(B)
Variance
(A-B)Remarks
Interest income 576 509 67
Interest income on portfolio loans/
Interest income on portfolio loans and Loan
processing fee
562 495 67
Under Ind AS
• Securitisation portfolio is recognised as on balance sheet portfolio and
hence income is also recognised under interest income
• Interest on loans is calculated using Effective interest rate
Interest on deposits 14 14 -
Net gain on derecognition of loans sold under
assignment transaction /
Excess interest spread on securitization and
Assignment
98 91 7
Under Ind AS
• Income from securitisation portfolio is recognised in interest income
• Total gain from the Assignments on the contract will be recognised on
transaction date
Fee Income 79 79 -
BC fees 63 63 -
Facilitation fees from Cross-sell 15 15 -
Other fee income 0.5 0.5 -
Recovery against loans written off 6.3 6.3 -
Other Income 0.03 0.02 -
Total Revenue 760 686 74
Financial expenses 205 168 37
Under Ind AS
Interest expense on securitisation transactions to be included in financial
expenses
Amortisation of processing fees on borrowings
Personnel expenses 160 159 1 Actuarial adjustments reclassified in other comprehensive income
Operating and other expenses 59 59 -
Depreciation, amortization and impairment 4 4 -
Total Operating Cost 222 221 1
Impairment on financial instruments/
Provisions & Write-offs26 14 12 Under Ind AS ECL methodology is used to arrive at impairment of loans
Total Expenditure 452 404 49
Profit before Tax 308 283 25
Current Tax 79 81 (2)
Deferred Tax (Asset)/ Liability (4) (10) 6
Profit after Tax 233 212 21
Other Comprehensive income 2 - 2 Includes actuarial adjustments on gratuity and Fair value impact on assets
Total Comprehensive income for the period 235 212 23
INR Crs
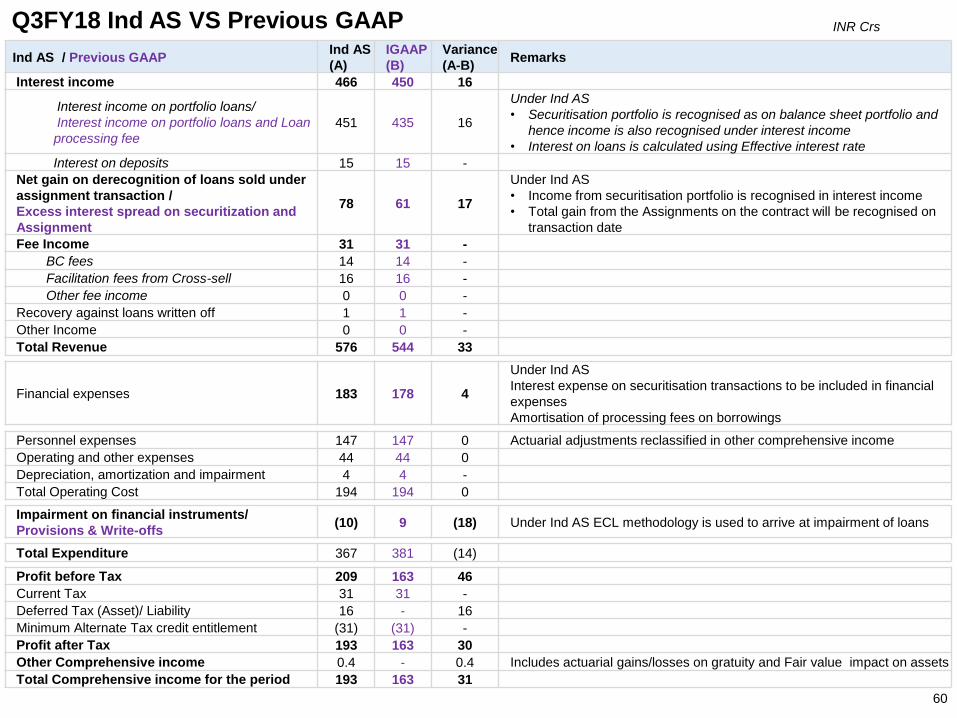
Q3FY18 Ind AS VS Previous GAAP
60
Ind AS / Previous GAAPInd AS
(A)
IGAAP
(B)
Variance
(A-B)Remarks
Interest income 466 450 16
Interest income on portfolio loans/
Interest income on portfolio loans and Loan
processing fee
451 435 16
Under Ind AS
• Securitisation portfolio is recognised as on balance sheet portfolio and
hence income is also recognised under interest income
• Interest on loans is calculated using Effective interest rate
Interest on deposits 15 15 -
Net gain on derecognition of loans sold under
assignment transaction /
Excess interest spread on securitization and
Assignment
78 61 17
Under Ind AS
• Income from securitisation portfolio is recognised in interest income
• Total gain from the Assignments on the contract will be recognised on
transaction date
Fee Income 31 31 -
BC fees 14 14 -
Facilitation fees from Cross-sell 16 16 -
Other fee income 0 0 -
Recovery against loans written off 1 1 -
Other Income 0 0 -
Total Revenue 576 544 33
Financial expenses 183 178 4
Under Ind AS
Interest expense on securitisation transactions to be included in financial
expenses
Amortisation of processing fees on borrowings
Personnel expenses 147 147 0 Actuarial adjustments reclassified in other comprehensive income
Operating and other expenses 44 44 0
Depreciation, amortization and impairment 4 4 -
Total Operating Cost 194 194 0
Impairment on financial instruments/
Provisions & Write-offs(10) 9 (18) Under Ind AS ECL methodology is used to arrive at impairment of loans
Total Expenditure 367 381 (14)
Profit before Tax 209 163 46
Current Tax 31 31 -
Deferred Tax (Asset)/ Liability 16 - 16
Minimum Alternate Tax credit entitlement (31) (31) -
Profit after Tax 193 163 30
Other Comprehensive income 0.4 - 0.4 Includes actuarial gains/losses on gratuity and Fair value impact on assets
Total Comprehensive income for the period 193 163 31
INR Crs
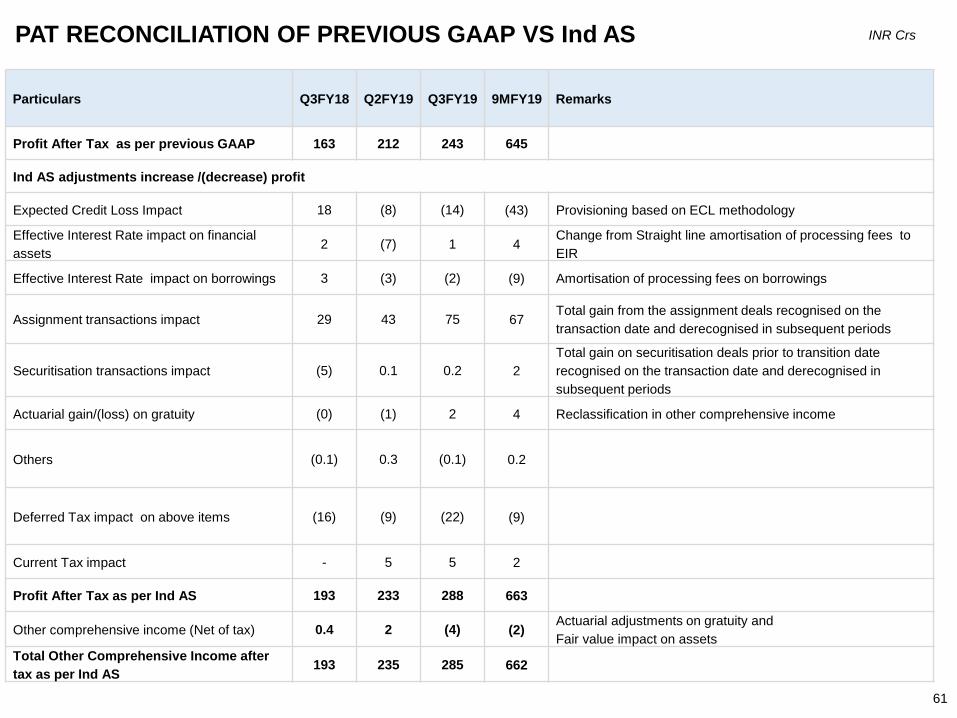
PAT RECONCILIATION OF PREVIOUS GAAP VS Ind AS
61
Particulars Q3FY18 Q2FY19 Q3FY19 9MFY19 Remarks
Profit After Tax as per previous GAAP 163 212 243 645
Ind AS adjustments increase /(decrease) profit
Expected Credit Loss Impact 18 (8) (14) (43) Provisioning based on ECL methodology
Effective Interest Rate impact on financial
assets2 (7) 1 4
Change from Straight line amortisation of processing fees to
EIR
Effective Interest Rate impact on borrowings 3 (3) (2) (9) Amortisation of processing fees on borrowings
Assignment transactions impact 29 43 75 67Total gain from the assignment deals recognised on the
transaction date and derecognised in subsequent periods
Securitisation transactions impact (5) 0.1 0.2 2
Total gain on securitisation deals prior to transition date
recognised on the transaction date and derecognised in
subsequent periods
Actuarial gain/(loss) on gratuity (0) (1) 2 4 Reclassification in other comprehensive income
Others (0.1) 0.3 (0.1) 0.2
Deferred Tax impact on above items (16) (9) (22) (9)
Current Tax impact - 5 5 2
Profit After Tax as per Ind AS 193 233 288 663
Other comprehensive income (Net of tax) 0.4 2 (4) (2)Actuarial adjustments on gratuity and
Fair value impact on assets
Total Other Comprehensive Income after
tax as per Ind AS193 235 285 662
INR Crs
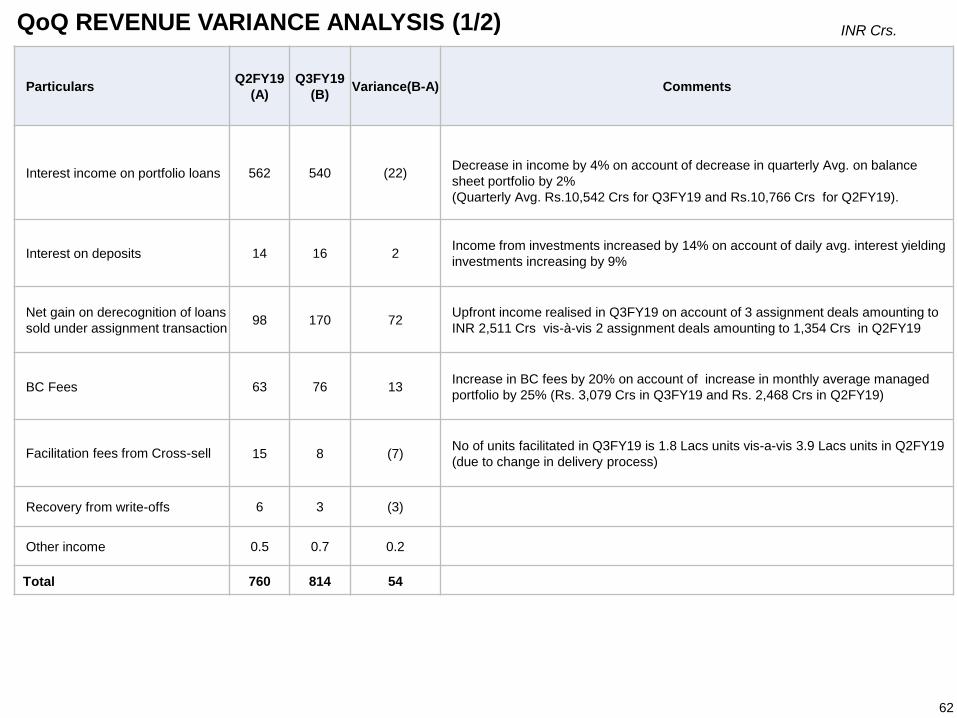
QoQ REVENUE VARIANCE ANALYSIS (1/2)
62
ParticularsQ2FY19
(A)
Q3FY19
(B)Variance(B-A) Comments
Interest income on portfolio loans 562 540 (22)Decrease in income by 4% on account of decrease in quarterly Avg. on balance
sheet portfolio by 2%
(Quarterly Avg. Rs.10,542 Crs for Q3FY19 and Rs.10,766 Crs for Q2FY19).
Interest on deposits 14 16 2Income from investments increased by 14% on account of daily avg. interest yielding
investments increasing by 9%
Net gain on derecognition of loans
sold under assignment transaction98 170 72
Upfront income realised in Q3FY19 on account of 3 assignment deals amounting to
INR 2,511 Crs vis-à-vis 2 assignment deals amounting to 1,354 Crs in Q2FY19
BC Fees 63 76 13Increase in BC fees by 20% on account of increase in monthly average managed
portfolio by 25% (Rs. 3,079 Crs in Q3FY19 and Rs. 2,468 Crs in Q2FY19)
Facilitation fees from Cross-sell 15 8 (7)No of units facilitated in Q3FY19 is 1.8 Lacs units vis-a-vis 3.9 Lacs units in Q2FY19
(due to change in delivery process)
Recovery from write-offs 6 3 (3)
Other income 0.5 0.7 0.2
Total 760 814 54
INR Crs.
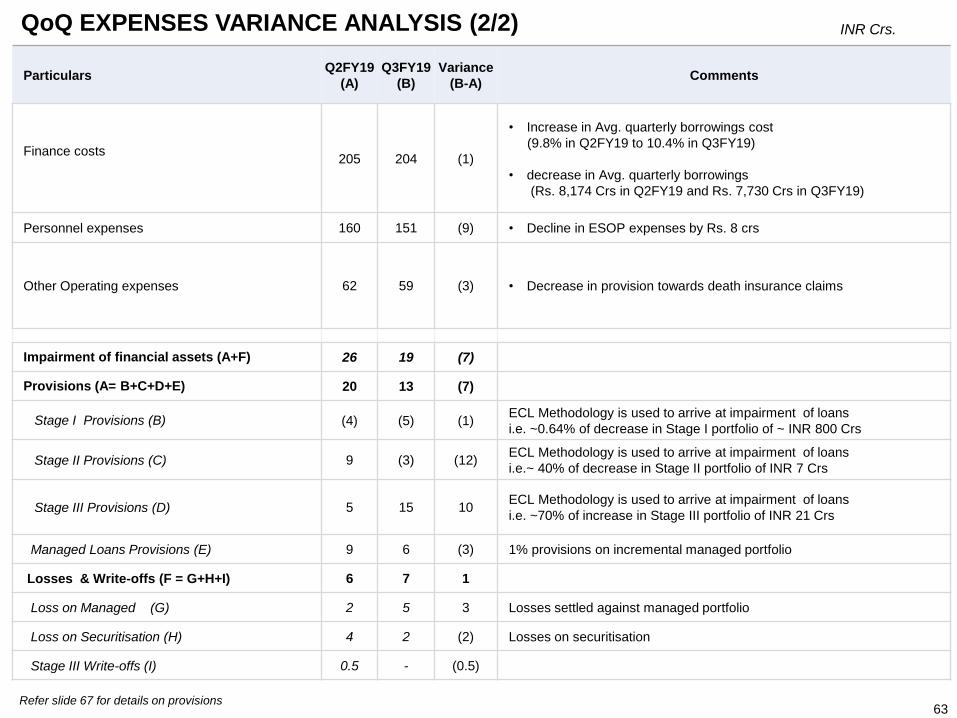
ParticularsQ2FY19
(A)
Q3FY19
(B)
Variance
(B-A)Comments
Finance costs 205 204 (1)
• Increase in Avg. quarterly borrowings cost
(9.8% in Q2FY19 to 10.4% in Q3FY19)
• decrease in Avg. quarterly borrowings
(Rs. 8,174 Crs in Q2FY19 and Rs. 7,730 Crs in Q3FY19)
Personnel expenses 160 151 (9) • Decline in ESOP expenses by Rs. 8 crs
Other Operating expenses 62 59 (3) • Decrease in provision towards death insurance claims
Impairment of financial assets (A+F) 26 19 (7)
Provisions (A= B+C+D+E) 20 13 (7)
Stage I Provisions (B) (4) (5) (1)ECL Methodology is used to arrive at impairment of loans
i.e. ~0.64% of decrease in Stage I portfolio of ~ INR 800 Crs
Stage II Provisions (C) 9 (3) (12)ECL Methodology is used to arrive at impairment of loans
i.e.~ 40% of decrease in Stage II portfolio of INR 7 Crs
Stage III Provisions (D) 5 15 10ECL Methodology is used to arrive at impairment of loans
i.e. ~70% of increase in Stage III portfolio of INR 21 Crs
Managed Loans Provisions (E) 9 6 (3) 1% provisions on incremental managed portfolio
Losses & Write-offs (F = G+H+I) 6 7 1
Loss on Managed (G) 2 5 3 Losses settled against managed portfolio
Loss on Securitisation (H) 4 2 (2) Losses on securitisation
Stage III Write-offs (I) 0.5 - (0.5)
QoQ EXPENSES VARIANCE ANALYSIS (2/2)
63
INR Crs.
Refer slide 67 for details on provisions
EXPECTED CREDIT LOSS APPROACH
64
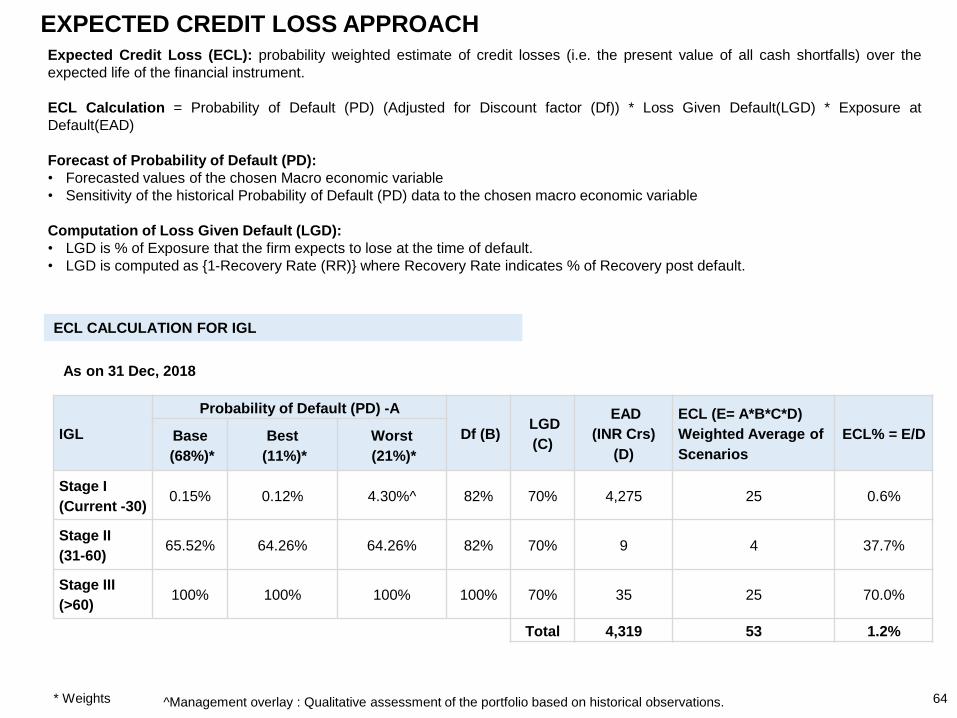
Expected Credit Loss (ECL): probability weighted estimate of credit losses (i.e. the present value of all cash shortfalls) over the
expected life of the financial instrument.
ECL Calculation = Probability of Default (PD) (Adjusted for Discount factor (Df)) * Loss Given Default(LGD) * Exposure at
Default(EAD)
Forecast of Probability of Default (PD):
• Forecasted values of the chosen Macro economic variable
• Sensitivity of the historical Probability of Default (PD) data to the chosen macro economic variable
Computation of Loss Given Default (LGD):
• LGD is % of Exposure that the firm expects to lose at the time of default.
• LGD is computed as {1-Recovery Rate (RR)} where Recovery Rate indicates % of Recovery post default.
ECL CALCULATION FOR IGL
As on 31 Dec, 2018
IGL
Probability of Default (PD) -A
Df (B)LGD
(C)
EAD
(INR Crs)
(D)
ECL (E= A*B*C*D)
Weighted Average of
Scenarios
ECL% = E/DBase
(68%)*
Best
(11%)*
Worst
(21%)*
Stage I
(Current -30)0.15% 0.12% 4.30%^ 82% 70% 4,275 25 0.6%
Stage II
(31-60)65.52% 64.26% 64.26% 82% 70% 9 4 37.7%
Stage III
(>60)100% 100% 100% 100% 70% 35 25 70.0%
Total 4,319 53 1.2%
^Management overlay : Qualitative assessment of the portfolio based on historical observations.* Weights
65
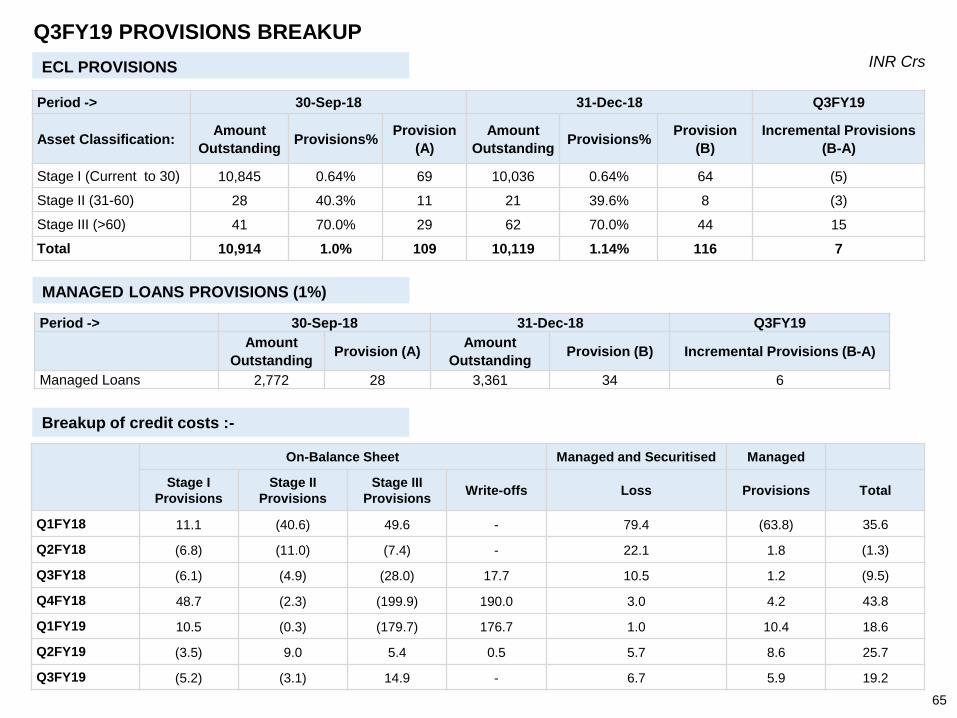
Period -> 30-Sep-18 31-Dec-18 Q3FY19
Asset Classification:Amount
OutstandingProvisions%
Provision
(A)
Amount
OutstandingProvisions%
Provision
(B)
Incremental Provisions
(B-A)
Stage I (Current to 30) 10,845 0.64% 69 10,036 0.64% 64 (5)
Stage II (31-60) 28 40.3% 11 21 39.6% 8 (3)
Stage III (>60) 41 70.0% 29 62 70.0% 44 15
Total 10,914 1.0% 109 10,119 1.14% 116 7
INR Crs
Q3FY19 PROVISIONS BREAKUP
Period -> 30-Sep-18 31-Dec-18 Q3FY19
Amount
OutstandingProvision (A)
Amount
OutstandingProvision (B) Incremental Provisions (B-A)
Managed Loans 2,772 28 3,361 34 6
ECL PROVISIONS
MANAGED LOANS PROVISIONS (1%)
On-Balance Sheet Managed and Securitised Managed
Stage I
Provisions
Stage II
Provisions
Stage III
ProvisionsWrite-offs Loss Provisions Total
Q1FY18 11.1 (40.6) 49.6 - 79.4 (63.8) 35.6
Q2FY18 (6.8) (11.0) (7.4) - 22.1 1.8 (1.3)
Q3FY18 (6.1) (4.9) (28.0) 17.7 10.5 1.2 (9.5)
Q4FY18 48.7 (2.3) (199.9) 190.0 3.0 4.2 43.8
Q1FY19 10.5 (0.3) (179.7) 176.7 1.0 10.4 18.6
Q2FY19 (3.5) 9.0 5.4 0.5 5.7 8.6 25.7
Q3FY19 (5.2) (3.1) 14.9 - 6.7 5.9 19.2
Breakup of credit costs :-
TAX IMPACT UNDER Ind AS
66
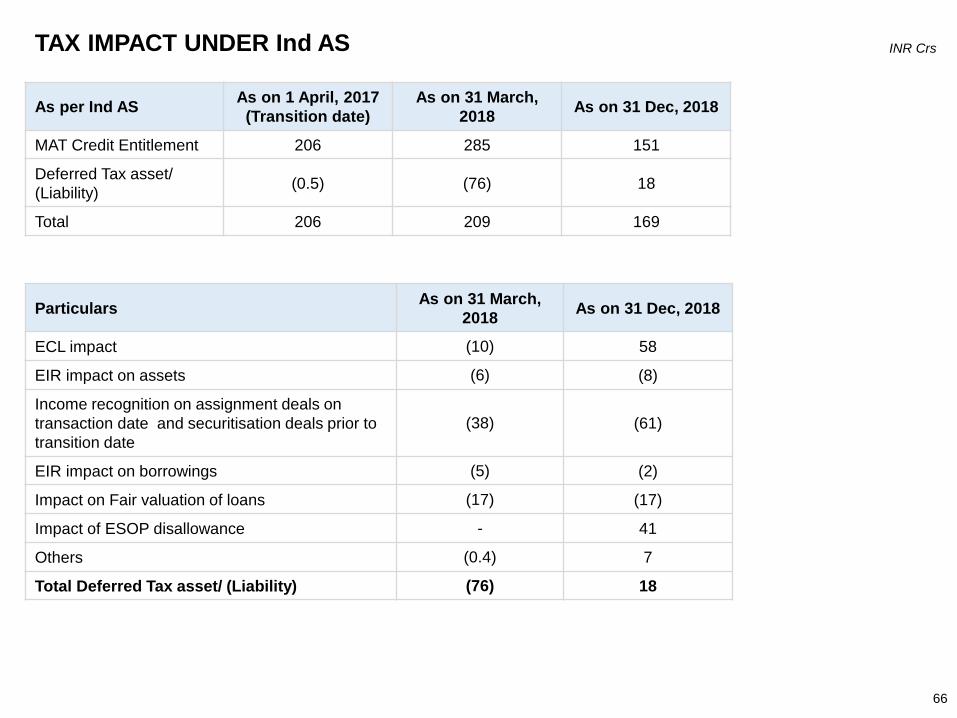
As per Ind ASAs on 1 April, 2017
(Transition date)
As on 31 March,
2018As on 31 Dec, 2018
MAT Credit Entitlement 206 285 151
Deferred Tax asset/
(Liability)(0.5) (76) 18
Total 206 209 169
INR Crs
ParticularsAs on 31 March,
2018As on 31 Dec, 2018
ECL impact (10) 58
EIR impact on assets (6) (8)
Income recognition on assignment deals on
transaction date and securitisation deals prior to
transition date
(38) (61)
EIR impact on borrowings (5) (2)
Impact on Fair valuation of loans (17) (17)
Impact of ESOP disallowance - 41
Others (0.4) 7
Total Deferred Tax asset/ (Liability) (76) 18
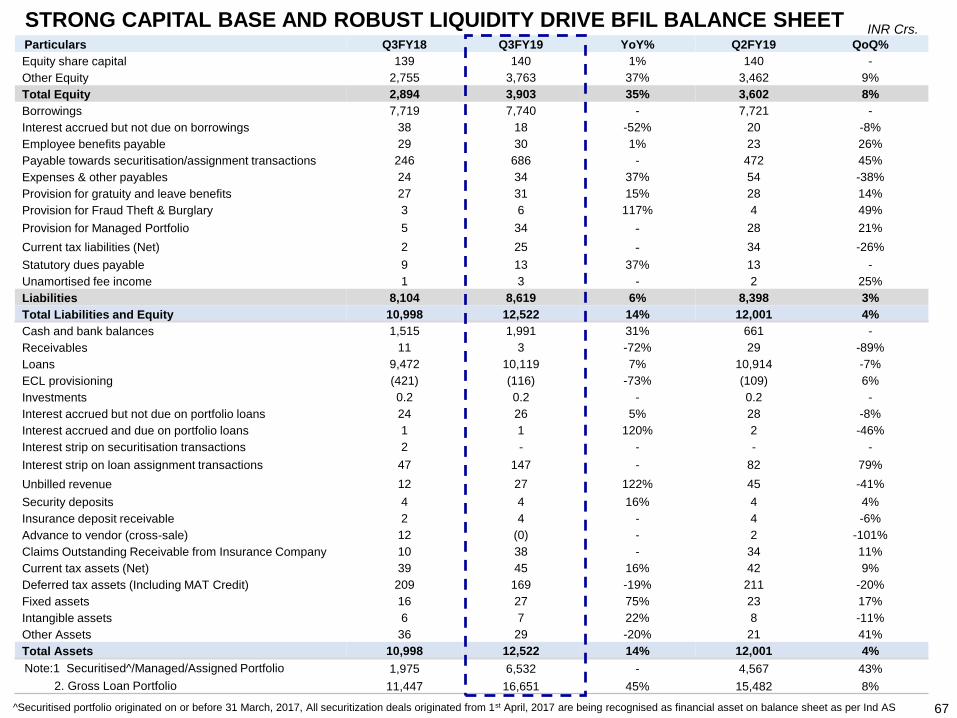
STRONG CAPITAL BASE AND ROBUST LIQUIDITY DRIVE BFIL BALANCE SHEETParticulars Q3FY18 Q3FY19 YoY% Q2FY19 QoQ%
Equity share capital 139 140 1% 140 -
Other Equity 2,755 3,763 37% 3,462 9%
Total Equity 2,894 3,903 35% 3,602 8%
Borrowings 7,719 7,740 - 7,721 -
Interest accrued but not due on borrowings 38 18 -52% 20 -8%
Employee benefits payable 29 30 1% 23 26%
Payable towards securitisation/assignment transactions 246 686 - 472 45%
Expenses & other payables 24 34 37% 54 -38%
Provision for gratuity and leave benefits 27 31 15% 28 14%
Provision for Fraud Theft & Burglary 3 6 117% 4 49%
Provision for Managed Portfolio 5 34 - 28 21%
Current tax liabilities (Net) 2 25 - 34 -26%
Statutory dues payable 9 13 37% 13 -
Unamortised fee income 1 3 - 2 25%
Liabilities 8,104 8,619 6% 8,398 3%
Total Liabilities and Equity 10,998 12,522 14% 12,001 4%
Cash and bank balances 1,515 1,991 31% 661 -
Receivables 11 3 -72% 29 -89%
Loans 9,472 10,119 7% 10,914 -7%
ECL provisioning (421) (116) -73% (109) 6%
Investments 0.2 0.2 - 0.2 -
Interest accrued but not due on portfolio loans 24 26 5% 28 -8%
Interest accrued and due on portfolio loans 1 1 120% 2 -46%
Interest strip on securitisation transactions 2 - - - -
Interest strip on loan assignment transactions 47 147 - 82 79%
Unbilled revenue 12 27 122% 45 -41%
Security deposits 4 4 16% 4 4%
Insurance deposit receivable 2 4 - 4 -6%
Advance to vendor (cross-sale) 12 (0) - 2 -101%
Claims Outstanding Receivable from Insurance Company 10 38 - 34 11%
Current tax assets (Net) 39 45 16% 42 9%
Deferred tax assets (Including MAT Credit) 209 169 -19% 211 -20%
Fixed assets 16 27 75% 23 17%
Intangible assets 6 7 22% 8 -11%
Other Assets 36 29 -20% 21 41%
Total Assets 10,998 12,522 14% 12,001 4%
Note:1 Securitised^/Managed/Assigned Portfolio 1,975 6,532 - 4,567 43%
2. Gross Loan Portfolio 11,447 16,651 45% 15,482 8%
INR Crs.
67^Securitised portfolio originated on or before 31 March, 2017, All securitization deals originated from 1st April, 2017 are being recognised as financial asset on balance sheet as per Ind AS
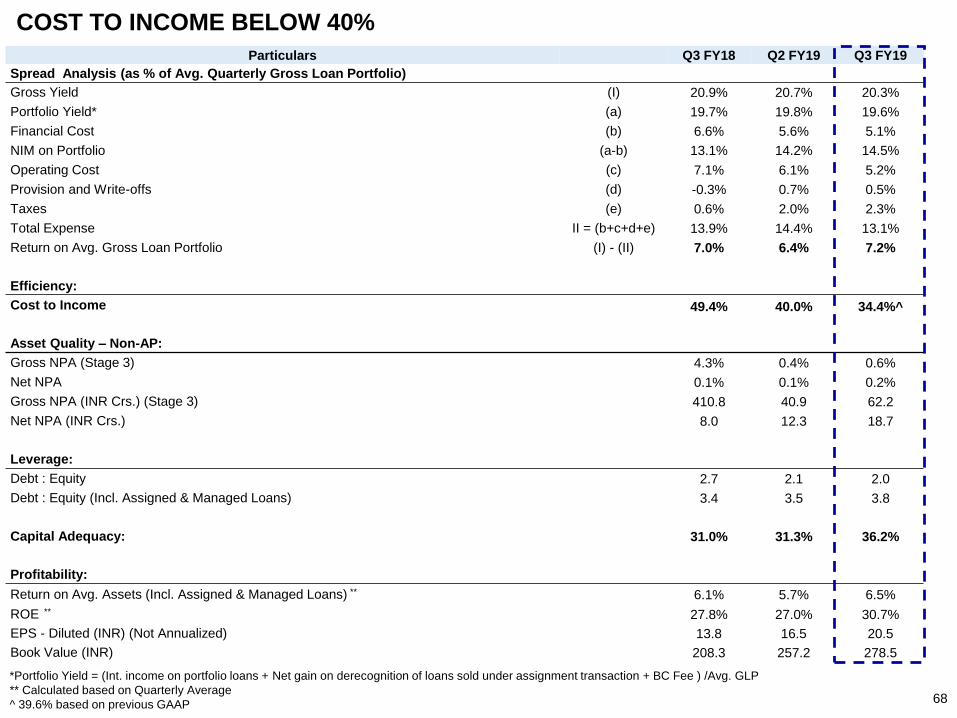
COST TO INCOME BELOW 40%
Particulars Q3 FY18 Q2 FY19 Q3 FY19
Spread Analysis (as % of Avg. Quarterly Gross Loan Portfolio)
Gross Yield (I) 20.9% 20.7% 20.3%
Portfolio Yield* (a) 19.7% 19.8% 19.6%
Financial Cost (b) 6.6% 5.6% 5.1%
NIM on Portfolio (a-b) 13.1% 14.2% 14.5%
Operating Cost (c) 7.1% 6.1% 5.2%
Provision and Write-offs (d) -0.3% 0.7% 0.5%
Taxes (e) 0.6% 2.0% 2.3%
Total Expense II = (b+c+d+e) 13.9% 14.4% 13.1%
Return on Avg. Gross Loan Portfolio (I) - (II) 7.0% 6.4% 7.2%
Efficiency:
Cost to Income 49.4% 40.0% 34.4%^
Asset Quality – Non-AP:
Gross NPA (Stage 3) 4.3% 0.4% 0.6%
Net NPA 0.1% 0.1% 0.2%
Gross NPA (INR Crs.) (Stage 3) 410.8 40.9 62.2
Net NPA (INR Crs.) 8.0 12.3 18.7
Leverage:
Debt : Equity 2.7 2.1 2.0
Debt : Equity (Incl. Assigned & Managed Loans) 3.4 3.5 3.8
Capital Adequacy: 31.0% 31.3% 36.2%
Profitability:
Return on Avg. Assets (Incl. Assigned & Managed Loans) ** 6.1% 5.7% 6.5%
ROE ** 27.8% 27.0% 30.7%
EPS - Diluted (INR) (Not Annualized) 13.8 16.5 20.5
Book Value (INR) 208.3 257.2 278.5
*Portfolio Yield = (Int. income on portfolio loans + Net gain on derecognition of loans sold under assignment transaction + BC Fee ) /Avg. GLP
** Calculated based on Quarterly Average
^ 39.6% based on previous GAAP 68
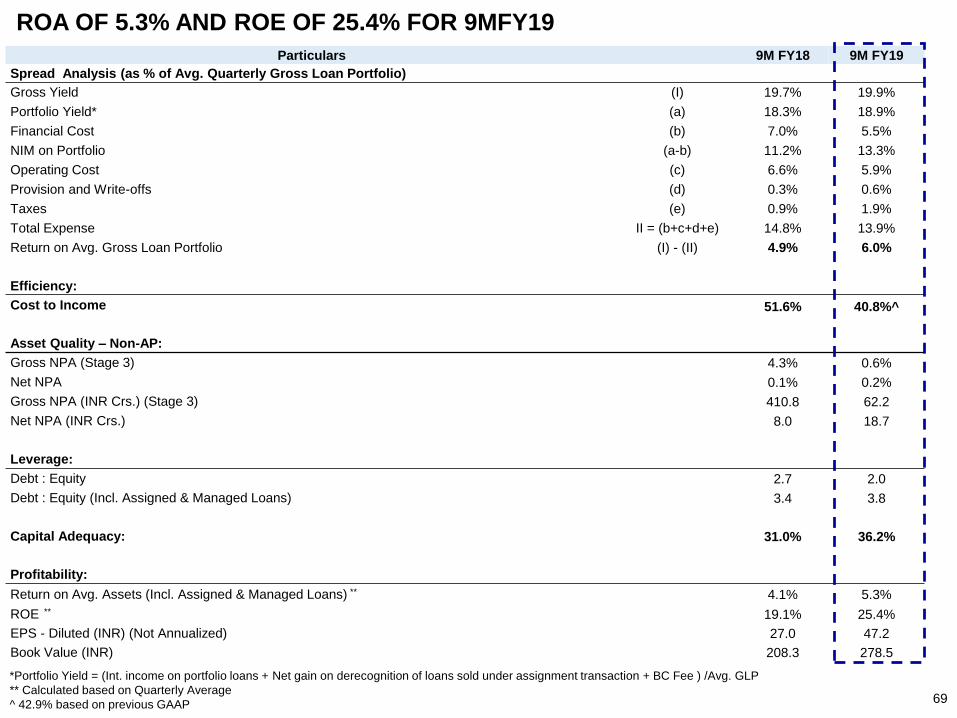
*Portfolio Yield = (Int. income on portfolio loans + Net gain on derecognition of loans sold under assignment transaction + BC Fee ) /Avg. GLP
** Calculated based on Quarterly Average
^ 42.9% based on previous GAAP
ROA OF 5.3% AND ROE OF 25.4% FOR 9MFY19
Particulars 9M FY18 9M FY19
Spread Analysis (as % of Avg. Quarterly Gross Loan Portfolio)
Gross Yield (I) 19.7% 19.9%
Portfolio Yield* (a) 18.3% 18.9%
Financial Cost (b) 7.0% 5.5%
NIM on Portfolio (a-b) 11.2% 13.3%
Operating Cost (c) 6.6% 5.9%
Provision and Write-offs (d) 0.3% 0.6%
Taxes (e) 0.9% 1.9%
Total Expense II = (b+c+d+e) 14.8% 13.9%
Return on Avg. Gross Loan Portfolio (I) - (II) 4.9% 6.0%
Efficiency:
Cost to Income 51.6% 40.8%^
Asset Quality – Non-AP:
Gross NPA (Stage 3) 4.3% 0.6%
Net NPA 0.1% 0.2%
Gross NPA (INR Crs.) (Stage 3) 410.8 62.2
Net NPA (INR Crs.) 8.0 18.7
Leverage:
Debt : Equity 2.7 2.0
Debt : Equity (Incl. Assigned & Managed Loans) 3.4 3.8
Capital Adequacy: 31.0% 36.2%
Profitability:
Return on Avg. Assets (Incl. Assigned & Managed Loans) ** 4.1% 5.3%
ROE ** 19.1% 25.4%
EPS - Diluted (INR) (Not Annualized) 27.0 47.2
Book Value (INR) 208.3 278.5
69
FINANCIAL ARCHITECTURE
70
Q3FY18 % MixQ2FY1
9% Mix
Q3FY1
9% Mix
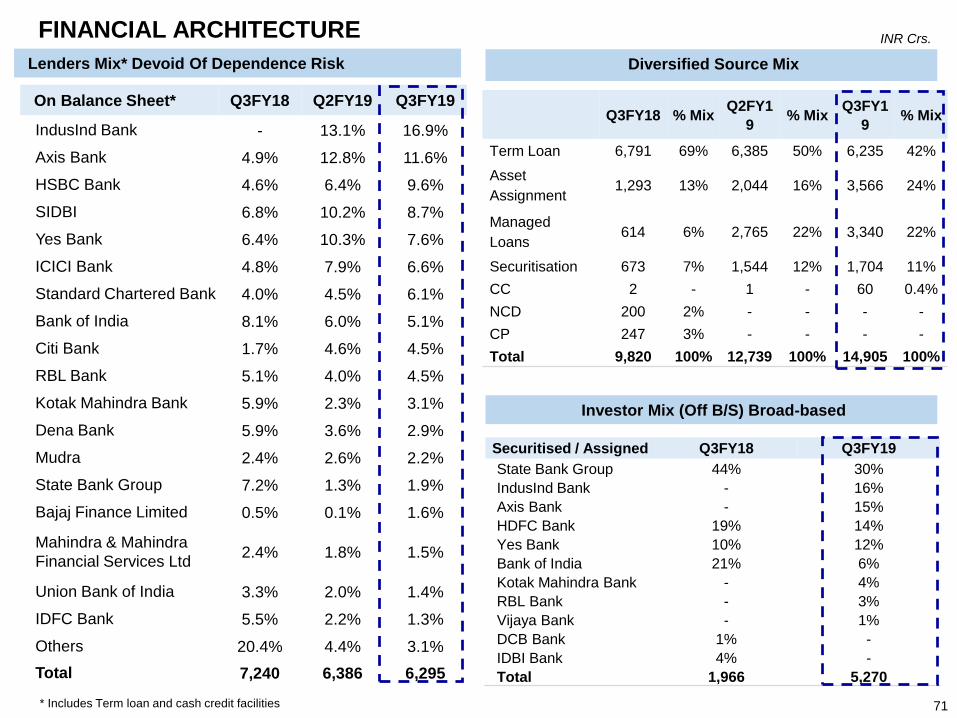
Term Loan 6,791 69% 6,385 50% 6,235 42%
Asset
Assignment1,293 13% 2,044 16% 3,566 24%
Managed
Loans614 6% 2,765 22% 3,340 22%
Securitisation 673 7% 1,544 12% 1,704 11%
CC 2 - 1 - 60 0.4%
NCD 200 2% - - - -
CP 247 3% - - - -
Total 9,820 100% 12,739 100% 14,905 100%
On Balance Sheet* Q3FY18 Q2FY19 Q3FY19
IndusInd Bank - 13.1% 16.9%
Axis Bank 4.9% 12.8% 11.6%
HSBC Bank 4.6% 6.4% 9.6%
SIDBI 6.8% 10.2% 8.7%
Yes Bank 6.4% 10.3% 7.6%
ICICI Bank 4.8% 7.9% 6.6%
Standard Chartered Bank 4.0% 4.5% 6.1%
Bank of India 8.1% 6.0% 5.1%
Citi Bank 1.7% 4.6% 4.5%
RBL Bank 5.1% 4.0% 4.5%
Kotak Mahindra Bank 5.9% 2.3% 3.1%
Dena Bank 5.9% 3.6% 2.9%
Mudra 2.4% 2.6% 2.2%
State Bank Group 7.2% 1.3% 1.9%
Bajaj Finance Limited 0.5% 0.1% 1.6%
Mahindra & Mahindra
Financial Services Ltd2.4% 1.8% 1.5%
Union Bank of India 3.3% 2.0% 1.4%
IDFC Bank 5.5% 2.2% 1.3%
Others 20.4% 4.4% 3.1%
Total 7,240 6,386 6,295
Lenders Mix* Devoid Of Dependence Risk
* Includes Term loan and cash credit facilities
FINANCIAL ARCHITECTURE
Diversified Source Mix
Investor Mix (Off B/S) Broad-based
INR Crs.
71
Securitised / Assigned Q3FY18 Q3FY19
State Bank Group 44% 30%
IndusInd Bank - 16%
Axis Bank - 15%
HDFC Bank 19% 14%
Yes Bank 10% 12%
Bank of India 21% 6%
Kotak Mahindra Bank - 4%
RBL Bank - 3%
Vijaya Bank - 1%
DCB Bank 1% -
IDBI Bank 4% -
Total 1,966 5,270
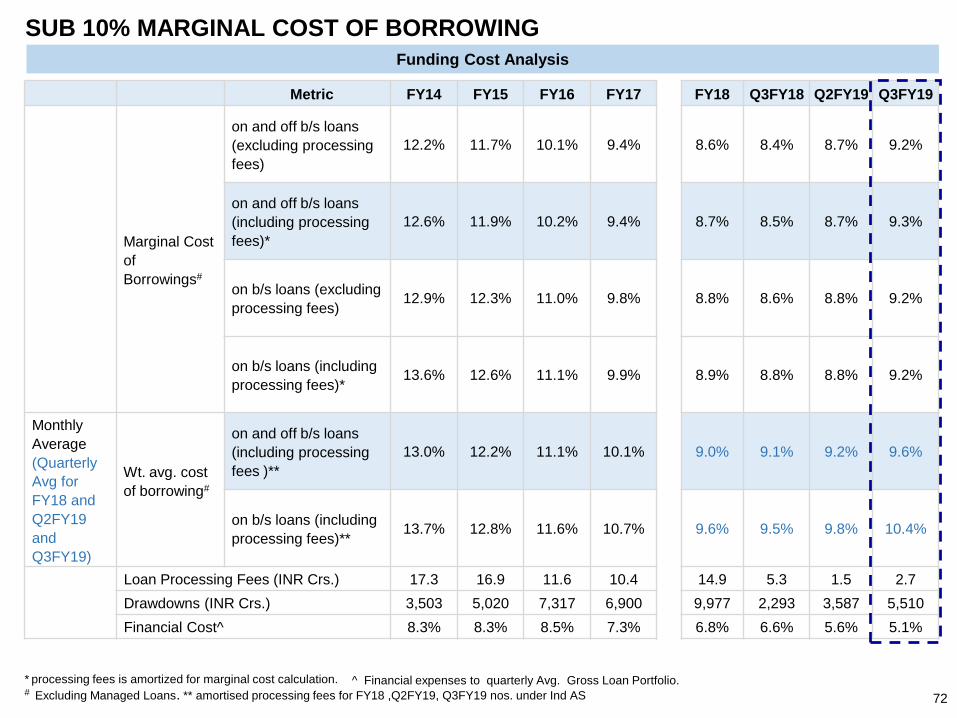
SUB 10% MARGINAL COST OF BORROWING
* processing fees is amortized for marginal cost calculation.# Excluding Managed Loans. ** amortised processing fees for FY18 ,Q2FY19, Q3FY19 nos. under Ind AS
Metric FY14 FY15 FY16 FY17 FY18 Q3FY18 Q2FY19 Q3FY19
Marginal Cost
of
Borrowings#
on and off b/s loans
(excluding processing
fees)
12.2% 11.7% 10.1% 9.4% 8.6% 8.4% 8.7% 9.2%
on and off b/s loans
(including processing
fees)*
12.6% 11.9% 10.2% 9.4% 8.7% 8.5% 8.7% 9.3%
on b/s loans (excluding
processing fees)12.9% 12.3% 11.0% 9.8% 8.8% 8.6% 8.8% 9.2%
on b/s loans (including
processing fees)*13.6% 12.6% 11.1% 9.9% 8.9% 8.8% 8.8% 9.2%
Monthly
Average
(Quarterly
Avg for
FY18 and
Q2FY19
and
Q3FY19)
Wt. avg. cost
of borrowing#
on and off b/s loans
(including processing
fees )**
13.0% 12.2% 11.1% 10.1% 9.0% 9.1% 9.2% 9.6%
on b/s loans (including
processing fees)**13.7% 12.8% 11.6% 10.7% 9.6% 9.5% 9.8% 10.4%
Loan Processing Fees (INR Crs.) 17.3 16.9 11.6 10.4 14.9 5.3 1.5 2.7
Drawdowns (INR Crs.) 3,503 5,020 7,317 6,900 9,977 2,293 3,587 5,510
Financial Cost^ 8.3% 8.3% 8.5% 7.3% 6.8% 6.6% 5.6% 5.1%
Funding Cost Analysis
^ Financial expenses to quarterly Avg. Gross Loan Portfolio.
72
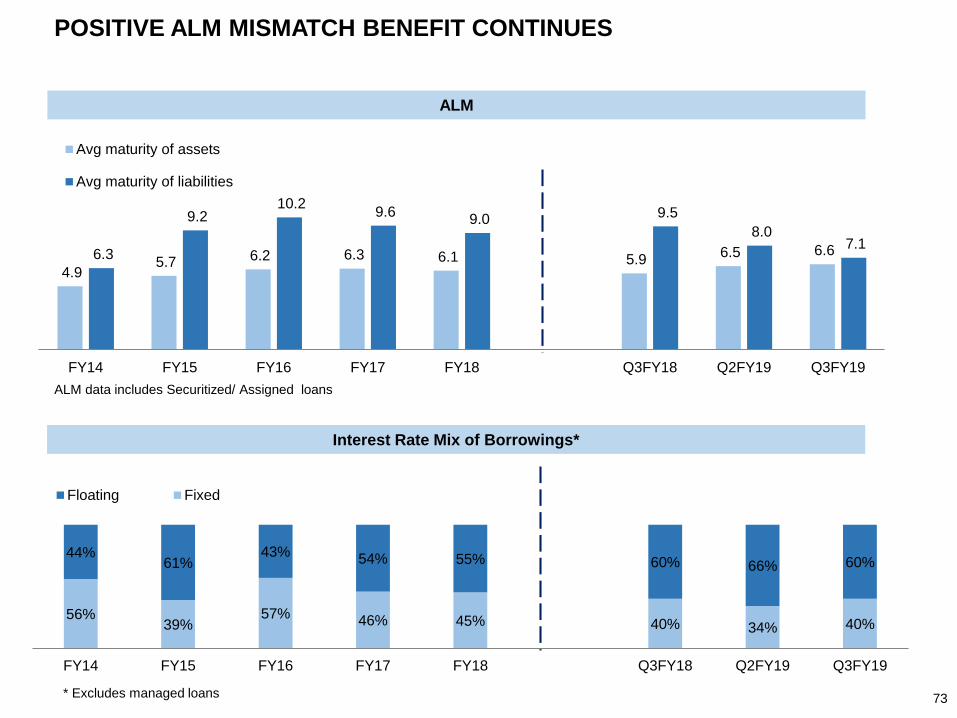
POSITIVE ALM MISMATCH BENEFIT CONTINUES
56%39%
57% 46% 45% 40% 34% 40%
44%61%
43%54% 55% 60% 66% 60%
FY14 FY15 FY16 FY17 FY18 Q3FY18 Q2FY19 Q3FY19
Floating Fixed
* Excludes managed loans
ALM data includes Securitized/ Assigned loans
ALM
4.9 5.7 6.2 6.3 6.1 5.9
6.5 6.6 6.3
9.2 10.2
9.6 9.0 9.5
8.0 7.1
FY14 FY15 FY16 FY17 FY18 Q3FY18 Q2FY19 Q3FY19
Avg maturity of assets
Avg maturity of liabilities
Interest Rate Mix of Borrowings*
73
74
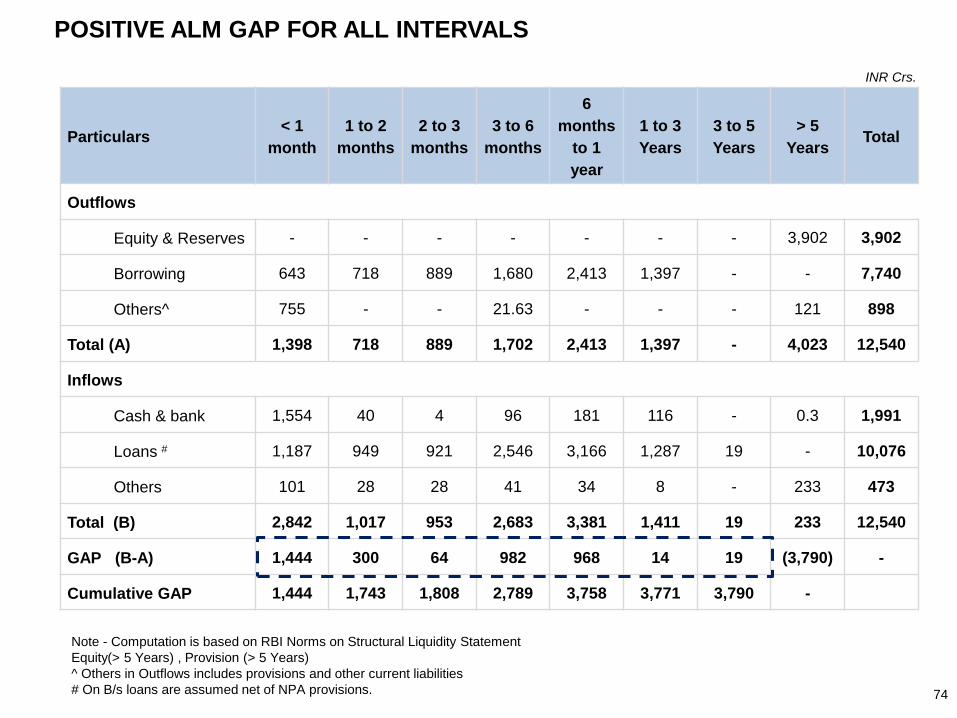
POSITIVE ALM GAP FOR ALL INTERVALS
Particulars< 1
month
1 to 2
months
2 to 3
months
3 to 6
months
6
months
to 1
year
1 to 3
Years
3 to 5
Years
> 5
YearsTotal
Outflows
Equity & Reserves - - - - - - - 3,902 3,902
Borrowing 643 718 889 1,680 2,413 1,397 - - 7,740
Others^ 755 - - 21.63 - - - 121 898
Total (A) 1,398 718 889 1,702 2,413 1,397 - 4,023 12,540
Inflows
Cash & bank 1,554 40 4 96 181 116 - 0.3 1,991
Loans # 1,187 949 921 2,546 3,166 1,287 19 - 10,076
Others 101 28 28 41 34 8 - 233 473
Total (B) 2,842 1,017 953 2,683 3,381 1,411 19 233 12,540
GAP (B-A) 1,444 300 64 982 968 14 19 (3,790) -
Cumulative GAP 1,444 1,743 1,808 2,789 3,758 3,771 3,790 -
INR Crs.
Note - Computation is based on RBI Norms on Structural Liquidity Statement
Equity(> 5 Years) , Provision (> 5 Years)
^ Others in Outflows includes provisions and other current liabilities
# On B/s loans are assumed net of NPA provisions.
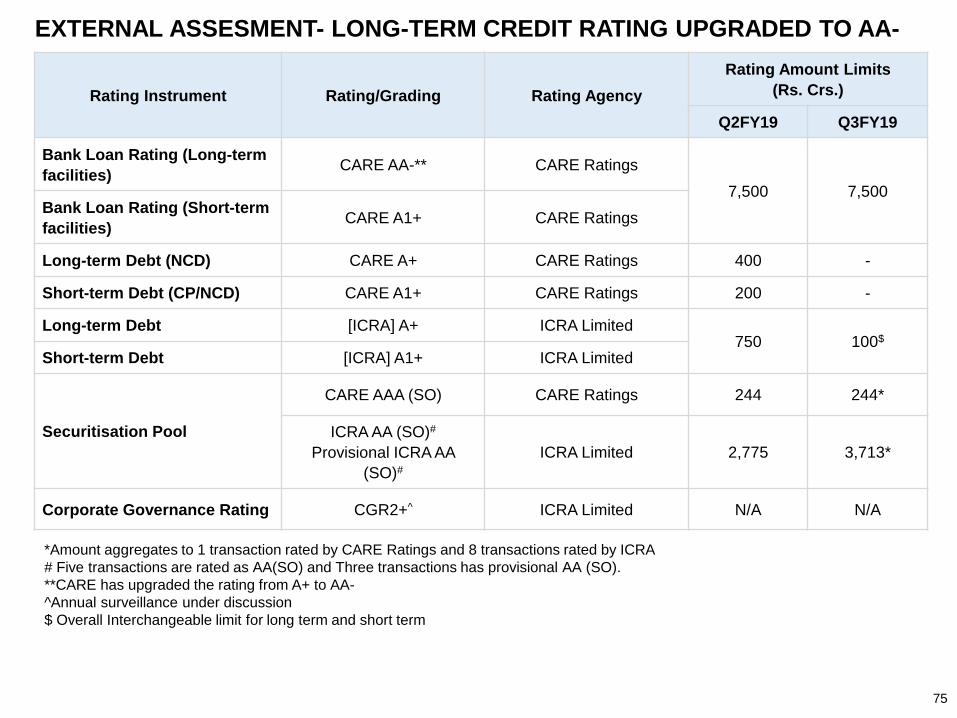
EXTERNAL ASSESMENT- LONG-TERM CREDIT RATING UPGRADED TO AA-
Rating Instrument Rating/Grading Rating Agency
Rating Amount Limits
(Rs. Crs.)
Q2FY19 Q3FY19
Bank Loan Rating (Long-term
facilities)CARE AA-** CARE Ratings
7,500 7,500Bank Loan Rating (Short-term
facilities)CARE A1+ CARE Ratings
Long-term Debt (NCD) CARE A+ CARE Ratings 400 -
Short-term Debt (CP/NCD) CARE A1+ CARE Ratings 200 -
Long-term Debt [ICRA] A+ ICRA Limited750 100$
Short-term Debt [ICRA] A1+ ICRA Limited
Securitisation Pool
CARE AAA (SO) CARE Ratings 244 244*
ICRA AA (SO)#
Provisional ICRA AA
(SO)#
ICRA Limited 2,775 3,713*
Corporate Governance Rating CGR2+^ ICRA Limited N/A N/A
75
*Amount aggregates to 1 transaction rated by CARE Ratings and 8 transactions rated by ICRA
# Five transactions are rated as AA(SO) and Three transactions has provisional AA (SO).
**CARE has upgraded the rating from A+ to AA-
^Annual surveillance under discussion
$ Overall Interchangeable limit for long term and short term
RISK MANAGEMENT
76
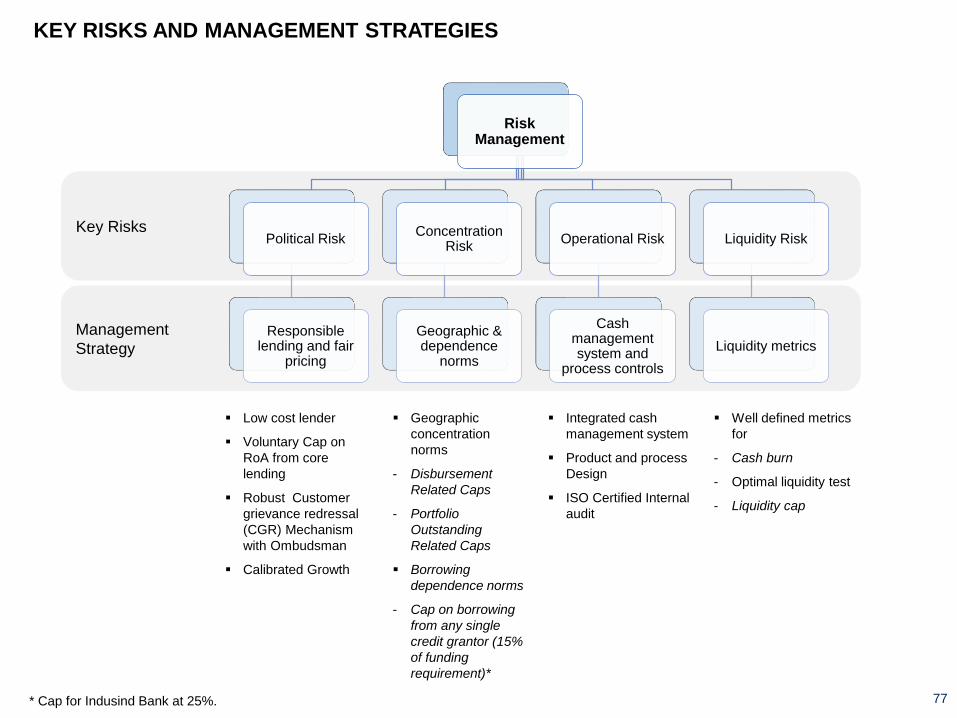
KEY RISKS AND MANAGEMENT STRATEGIES
Management
Strategy
Key Risks
Risk Management
Political Risk
Responsible lending and fair
pricing
Concentration Risk
Geographic & dependence
norms
Operational Risk
Cash management system and
process controls
Liquidity Risk
Liquidity metrics
▪ Low cost lender
▪ Voluntary Cap on
RoA from core
lending
▪ Robust Customer
grievance redressal
(CGR) Mechanism
with Ombudsman
▪ Calibrated Growth
▪ Geographic
concentration
norms
- Disbursement
Related Caps
- Portfolio
Outstanding
Related Caps
▪ Borrowing
dependence norms
- Cap on borrowing
from any single
credit grantor (15%
of funding
requirement)*
▪ Integrated cash
management system
▪ Product and process
Design
▪ ISO Certified Internal
audit
▪ Well defined metrics
for
- Cash burn
- Optimal liquidity test
- Liquidity cap
77* Cap for Indusind Bank at 25%.

CAPITAL STRUCTURE
78
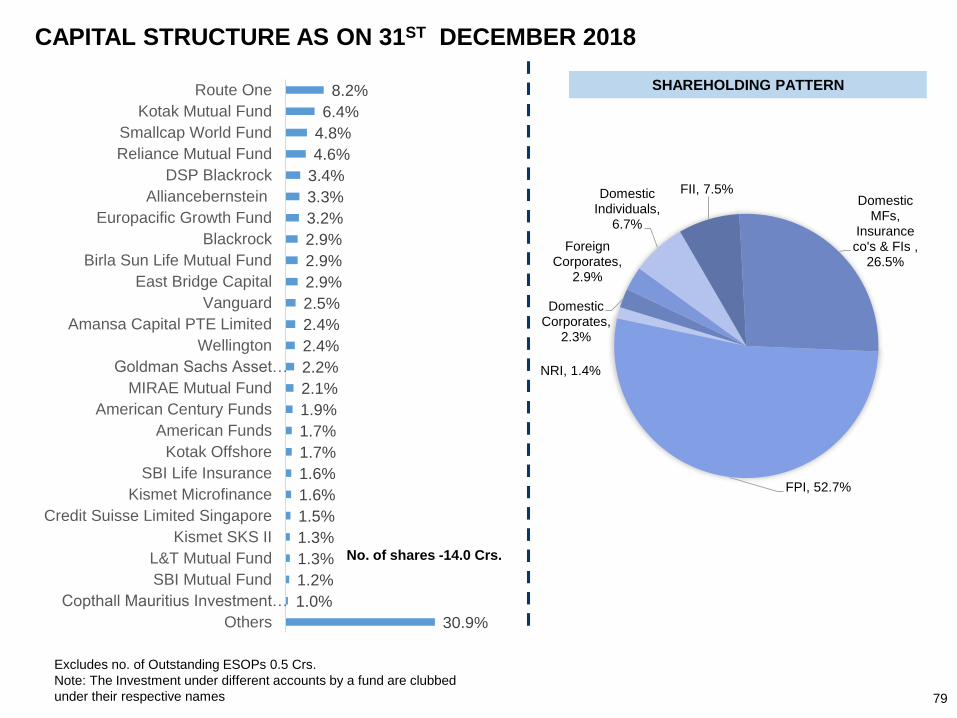
CAPITAL STRUCTURE AS ON 31ST DECEMBER 2018
Excludes no. of Outstanding ESOPs 0.5 Crs.
Note: The Investment under different accounts by a fund are clubbed
under their respective names 79
30.9%
1.0%
1.2%
1.3%
1.3%
1.5%
1.6%
1.6%
1.7%
1.7%
1.9%
2.1%
2.2%
2.4%
2.4%
2.5%
2.9%
2.9%
2.9%
3.2%
3.3%
3.4%
4.6%
4.8%
6.4%
8.2%
Others
Copthall Mauritius Investment…
SBI Mutual Fund
L&T Mutual Fund
Kismet SKS II
Credit Suisse Limited Singapore
Kismet Microfinance
SBI Life Insurance
Kotak Offshore
American Funds
American Century Funds
MIRAE Mutual Fund
Goldman Sachs Asset…
Wellington
Amansa Capital PTE Limited
Vanguard
East Bridge Capital
Birla Sun Life Mutual Fund
Blackrock
Europacific Growth Fund
Alliancebernstein
DSP Blackrock
Reliance Mutual Fund
Smallcap World Fund
Kotak Mutual Fund
Route One
No. of shares -14.0 Crs.
SHAREHOLDING PATTERN
NRI, 1.4%
Domestic Corporates,
2.3%
Foreign Corporates,
2.9%
Domestic Individuals,
6.7%
FII, 7.5%Domestic
MFs, Insurance co's & FIs ,
26.5%
FPI, 52.7%
ANNEXURES
80
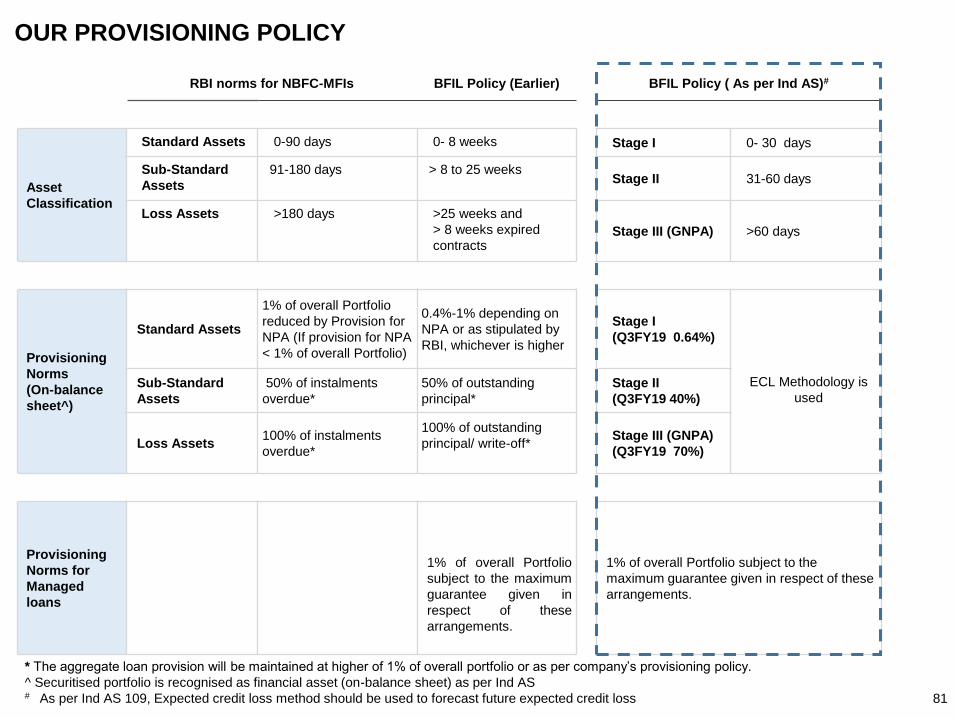
OUR PROVISIONING POLICY
RBI norms for NBFC-MFIs BFIL Policy (Earlier) BFIL Policy ( As per Ind AS)#
Asset
Classification
Standard Assets 0-90 days 0- 8 weeks Stage I 0- 30 days
Sub-Standard
Assets
91-180 days > 8 to 25 weeksStage II 31-60 days
Loss Assets >180 days >25 weeks and
> 8 weeks expired
contractsStage III (GNPA) >60 days
Provisioning
Norms
(On-balance
sheet^)
Standard Assets
1% of overall Portfolio
reduced by Provision for
NPA (If provision for NPA
< 1% of overall Portfolio)
0.4%-1% depending on
NPA or as stipulated by
RBI, whichever is higher
Stage I
(Q3FY19 0.64%)
ECL Methodology is
usedSub-Standard
Assets
50% of instalments
overdue*
50% of outstanding
principal*
Stage II
(Q3FY19 40%)
Loss Assets100% of instalments
overdue*
100% of outstanding
principal/ write-off*Stage III (GNPA)
(Q3FY19 70%)
Provisioning
Norms for
Managed
loans
1% of overall Portfolio
subject to the maximum
guarantee given in
respect of these
arrangements.
1% of overall Portfolio subject to the
maximum guarantee given in respect of these
arrangements.
* The aggregate loan provision will be maintained at higher of 1% of overall portfolio or as per company’s provisioning policy.
^ Securitised portfolio is recognised as financial asset (on-balance sheet) as per Ind AS# As per Ind AS 109, Expected credit loss method should be used to forecast future expected credit loss 81

ANNEXURES - OPERATIONS
82
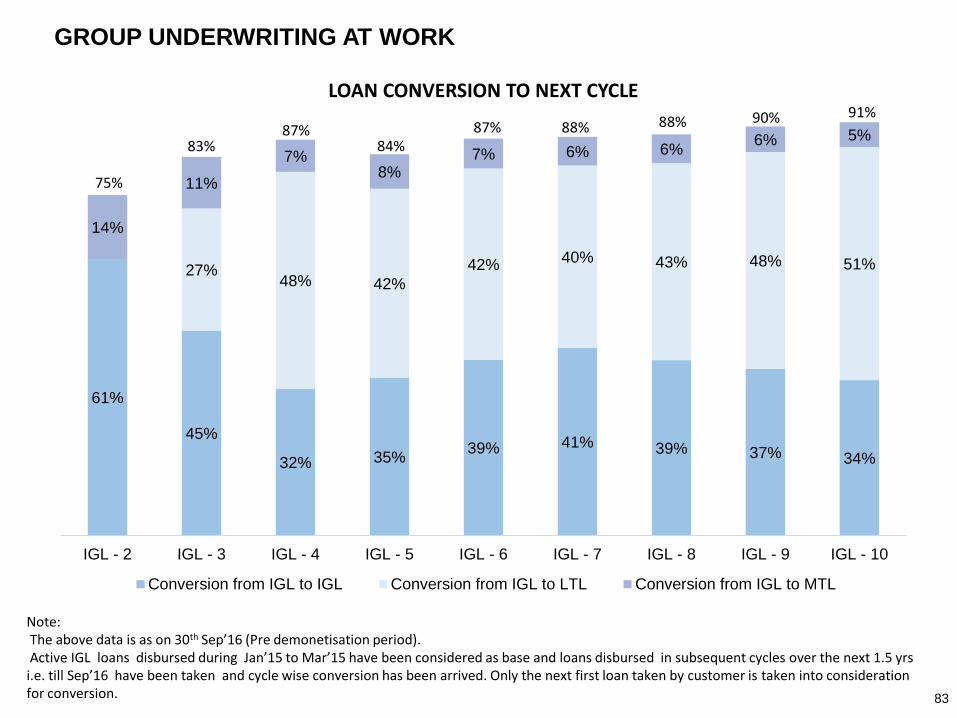
GROUP UNDERWRITING AT WORK
61%
45%
32% 35%39% 41% 39% 37% 34%
27%48% 42%
42% 40% 43% 48% 51%
14%
11%
7%8%
7% 6% 6%6% 5%
IGL - 2 IGL - 3 IGL - 4 IGL - 5 IGL - 6 IGL - 7 IGL - 8 IGL - 9 IGL - 10
Conversion from IGL to IGL Conversion from IGL to LTL Conversion from IGL to MTL
LOAN CONVERSION TO NEXT CYCLE
75%
87%84%
87% 88% 88% 90% 91%
83%
Note:The above data is as on 30th Sep’16 (Pre demonetisation period).Active IGL loans disbursed during Jan’15 to Mar’15 have been considered as base and loans disbursed in subsequent cycles over the next 1.5 yrs i.e. till Sep’16 have been taken and cycle wise conversion has been arrived. Only the next first loan taken by customer is taken into consideration for conversion. 83
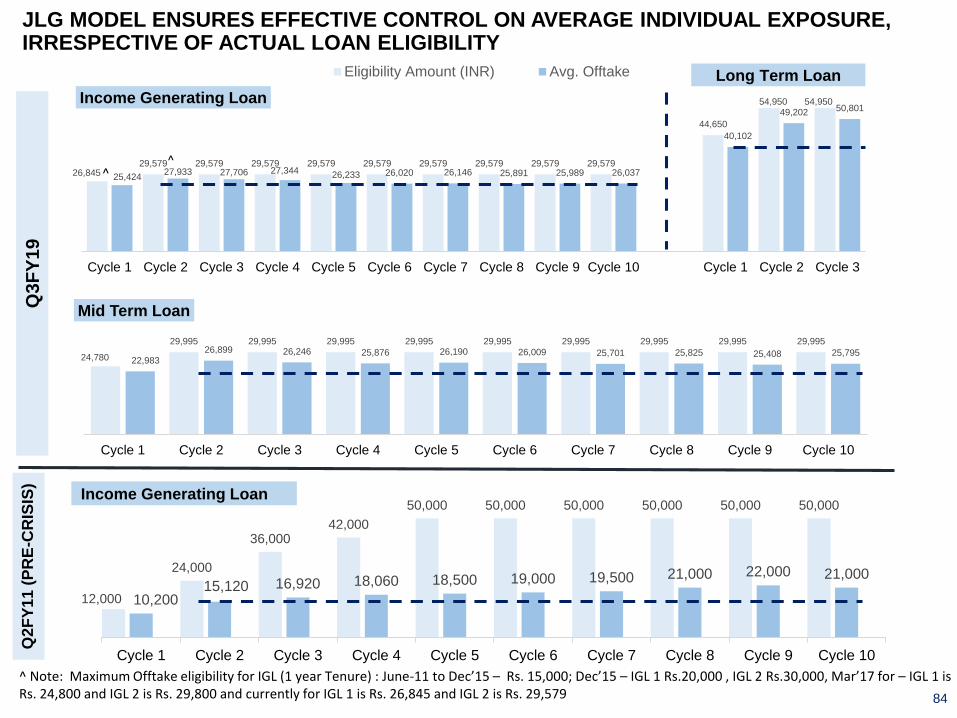
JLG MODEL ENSURES EFFECTIVE CONTROL ON AVERAGE INDIVIDUAL EXPOSURE, IRRESPECTIVE OF ACTUAL LOAN ELIGIBILITY
26,84529,579 29,579 29,579 29,579 29,579 29,579 29,579 29,579 29,579
44,650
54,950 54,950
25,42427,933 27,706 27,344 26,233 26,020 26,146 25,891 25,989 26,037
40,102
49,202 50,801
-5,000
5,000
15,000
25,000
35,000
45,000
55,000
Cycle 1 Cycle 2 Cycle 3 Cycle 4 Cycle 5 Cycle 6 Cycle 7 Cycle 8 Cycle 9 Cycle 10 Cycle 1 Cycle 2 Cycle 3
Income Generating Loan
Eligibility Amount (INR) Avg. Offtake Long Term Loan
Q3
FY
19
12,000
24,000
36,00042,000
50,000 50,000 50,000 50,000 50,000 50,000
10,20015,120 16,920 18,060 18,500 19,000 19,500 21,000 22,000 21,000
Cycle 1 Cycle 2 Cycle 3 Cycle 4 Cycle 5 Cycle 6 Cycle 7 Cycle 8 Cycle 9 Cycle 10
^ Note: Maximum Offtake eligibility for IGL (1 year Tenure) : June-11 to Dec’15 – Rs. 15,000; Dec’15 – IGL 1 Rs.20,000 , IGL 2 Rs.30,000, Mar’17 for – IGL 1 is Rs. 24,800 and IGL 2 is Rs. 29,800 and currently for IGL 1 is Rs. 26,845 and IGL 2 is Rs. 29,579
Q2
FY
11
(P
RE
-CR
ISIS
)
^^
84
24,780
29,995 29,995 29,995 29,995 29,995 29,995 29,995 29,995 29,995
22,98326,899 26,246 25,876 26,190 26,009 25,701 25,825 25,408 25,795
Cycle 1 Cycle 2 Cycle 3 Cycle 4 Cycle 5 Cycle 6 Cycle 7 Cycle 8 Cycle 9 Cycle 10
Mid Term Loan
Income Generating Loan
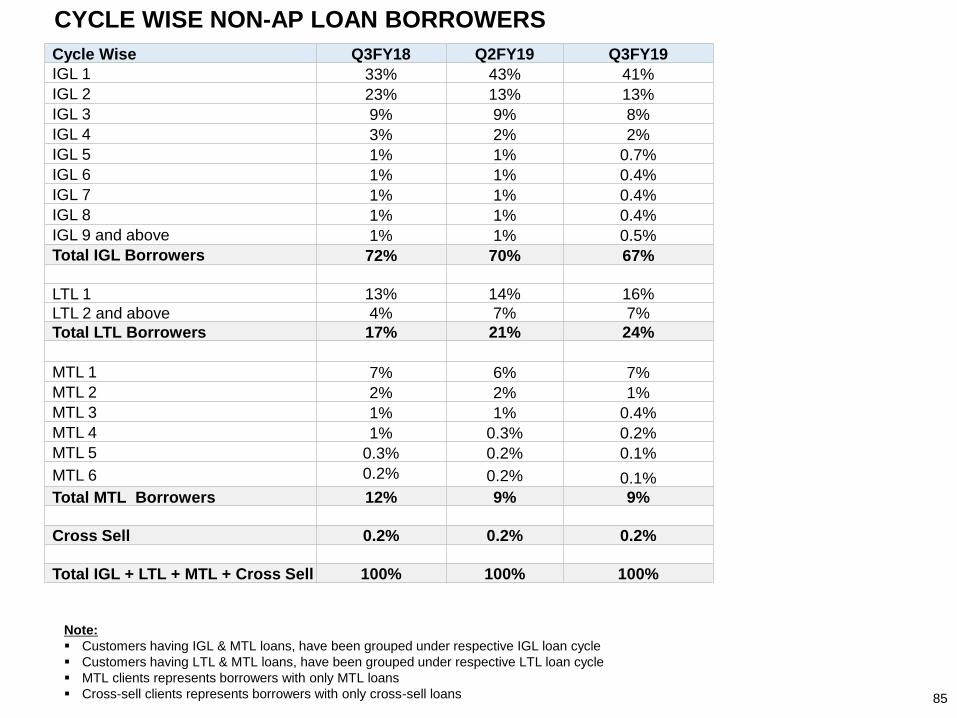
CYCLE WISE NON-AP LOAN BORROWERS
Cycle Wise Q3FY18 Q2FY19 Q3FY19
IGL 1 33% 43% 41%
IGL 2 23% 13% 13%
IGL 3 9% 9% 8%
IGL 4 3% 2% 2%
IGL 5 1% 1% 0.7%
IGL 6 1% 1% 0.4%
IGL 7 1% 1% 0.4%
IGL 8 1% 1% 0.4%
IGL 9 and above 1% 1% 0.5%
Total IGL Borrowers 72% 70% 67%
LTL 1 13% 14% 16%
LTL 2 and above 4% 7% 7%
Total LTL Borrowers 17% 21% 24%
MTL 1 7% 6% 7%
MTL 2 2% 2% 1%
MTL 3 1% 1% 0.4%
MTL 4 1% 0.3% 0.2%
MTL 5 0.3% 0.2% 0.1%
MTL 6 0.2% 0.2% 0.1%
Total MTL Borrowers 12% 9% 9%
Cross Sell 0.2% 0.2% 0.2%
Total IGL + LTL + MTL + Cross Sell 100% 100% 100%
Note:
▪ Customers having IGL & MTL loans, have been grouped under respective IGL loan cycle
▪ Customers having LTL & MTL loans, have been grouped under respective LTL loan cycle
▪ MTL clients represents borrowers with only MTL loans
▪ Cross-sell clients represents borrowers with only cross-sell loans 85
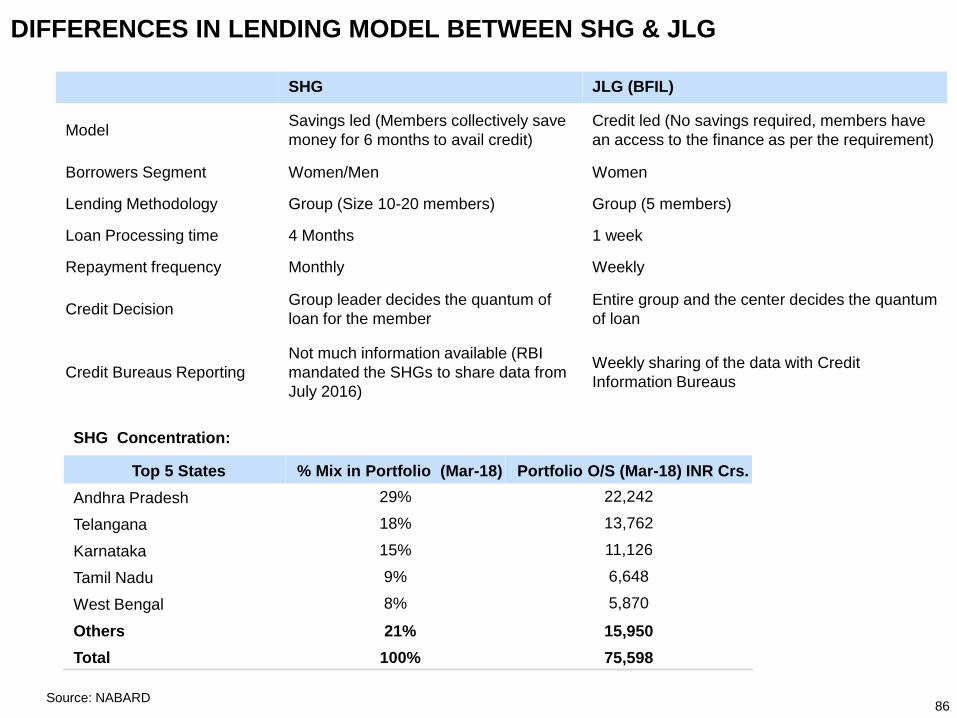
DIFFERENCES IN LENDING MODEL BETWEEN SHG & JLG
SHG JLG (BFIL)
ModelSavings led (Members collectively save
money for 6 months to avail credit)
Credit led (No savings required, members have
an access to the finance as per the requirement)
Borrowers Segment Women/Men Women
Lending Methodology Group (Size 10-20 members) Group (5 members)
Loan Processing time 4 Months 1 week
Repayment frequency Monthly Weekly
Credit DecisionGroup leader decides the quantum of
loan for the member
Entire group and the center decides the quantum
of loan
Credit Bureaus Reporting
Not much information available (RBI
mandated the SHGs to share data from
July 2016)
Weekly sharing of the data with Credit
Information Bureaus
Top 5 States % Mix in Portfolio (Mar-18) Portfolio O/S (Mar-18) INR Crs.
Andhra Pradesh 29% 22,242
Telangana 18% 13,762
Karnataka 15% 11,126
Tamil Nadu 9% 6,648
West Bengal 8% 5,870
Others 21% 15,950
Total 100% 75,598
SHG Concentration:
Source: NABARD86
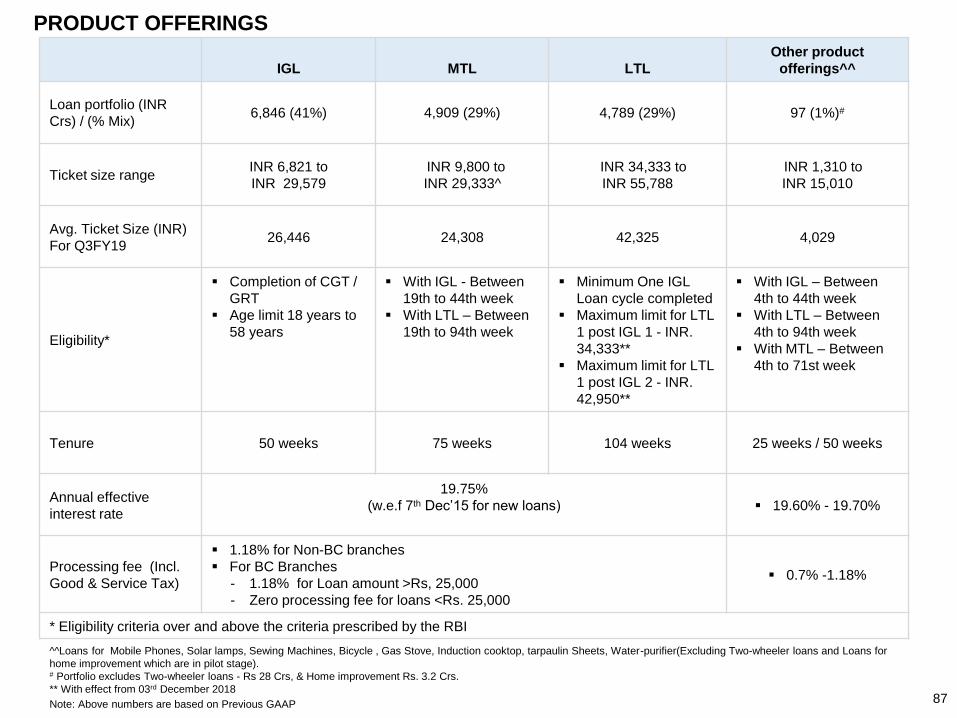
IGL MTL LTL
Other product
offerings^^
Loan portfolio (INR
Crs) / (% Mix)6,846 (41%) 4,909 (29%) 4,789 (29%) 97 (1%)#
Ticket size rangeINR 6,821 to
INR 29,579
INR 9,800 to
INR 29,333^
INR 34,333 to
INR 55,788
INR 1,310 to
INR 15,010
Avg. Ticket Size (INR)
For Q3FY1926,446 24,308 42,325 4,029
Eligibility*
▪ Completion of CGT /
GRT
▪ Age limit 18 years to
58 years
▪ With IGL - Between
19th to 44th week
▪ With LTL – Between
19th to 94th week
▪ Minimum One IGL
Loan cycle completed
▪ Maximum limit for LTL
1 post IGL 1 - INR.
34,333**
▪ Maximum limit for LTL
1 post IGL 2 - INR.
42,950**
▪ With IGL – Between
4th to 44th week
▪ With LTL – Between
4th to 94th week
▪ With MTL – Between
4th to 71st week
Tenure 50 weeks 75 weeks 104 weeks 25 weeks / 50 weeks
Annual effective
interest rate
19.75%
(w.e.f 7th Dec’15 for new loans) ▪ 19.60% - 19.70%
Processing fee (Incl.
Good & Service Tax)
▪ 1.18% for Non-BC branches
▪ For BC Branches
- 1.18% for Loan amount >Rs, 25,000
- Zero processing fee for loans <Rs. 25,000
▪ 0.7% -1.18%
* Eligibility criteria over and above the criteria prescribed by the RBI
^^Loans for Mobile Phones, Solar lamps, Sewing Machines, Bicycle , Gas Stove, Induction cooktop, tarpaulin Sheets, Water-purifier(Excluding Two-wheeler loans and Loans for
home improvement which are in pilot stage).# Portfolio excludes Two-wheeler loans - Rs 28 Crs, & Home improvement Rs. 3.2 Crs.
** With effect from 03rd December 2018
PRODUCT OFFERINGS
87Note: Above numbers are based on Previous GAAP
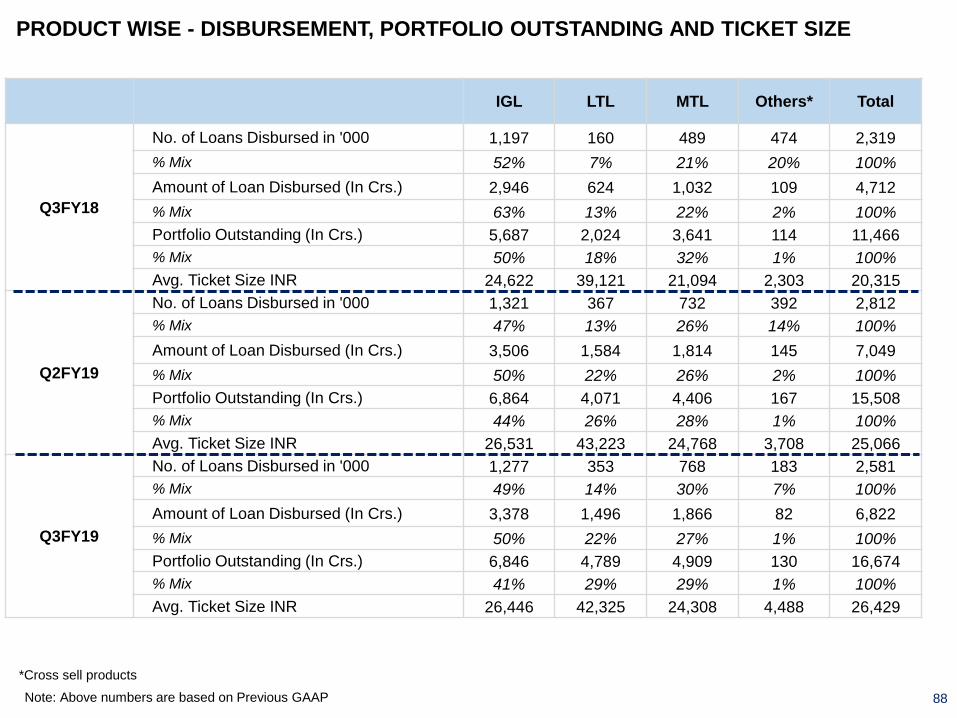
PRODUCT WISE - DISBURSEMENT, PORTFOLIO OUTSTANDING AND TICKET SIZE
88
IGL LTL MTL Others* Total
Q3FY18
No. of Loans Disbursed in '000 1,197 160 489 474 2,319
% Mix 52% 7% 21% 20% 100%
Amount of Loan Disbursed (In Crs.) 2,946 624 1,032 109 4,712
% Mix 63% 13% 22% 2% 100%
Portfolio Outstanding (In Crs.) 5,687 2,024 3,641 114 11,466
% Mix 50% 18% 32% 1% 100%
Avg. Ticket Size INR 24,622 39,121 21,094 2,303 20,315
Q2FY19
No. of Loans Disbursed in '000 1,321 367 732 392 2,812
% Mix 47% 13% 26% 14% 100%
Amount of Loan Disbursed (In Crs.) 3,506 1,584 1,814 145 7,049
% Mix 50% 22% 26% 2% 100%
Portfolio Outstanding (In Crs.) 6,864 4,071 4,406 167 15,508
% Mix 44% 26% 28% 1% 100%
Avg. Ticket Size INR 26,531 43,223 24,768 3,708 25,066
Q3FY19
No. of Loans Disbursed in '000 1,277 353 768 183 2,581
% Mix 49% 14% 30% 7% 100%
Amount of Loan Disbursed (In Crs.) 3,378 1,496 1,866 82 6,822
% Mix 50% 22% 27% 1% 100%
Portfolio Outstanding (In Crs.) 6,846 4,789 4,909 130 16,674
% Mix 41% 29% 29% 1% 100%
Avg. Ticket Size INR 26,446 42,325 24,308 4,488 26,429
*Cross sell products
Note: Above numbers are based on Previous GAAP
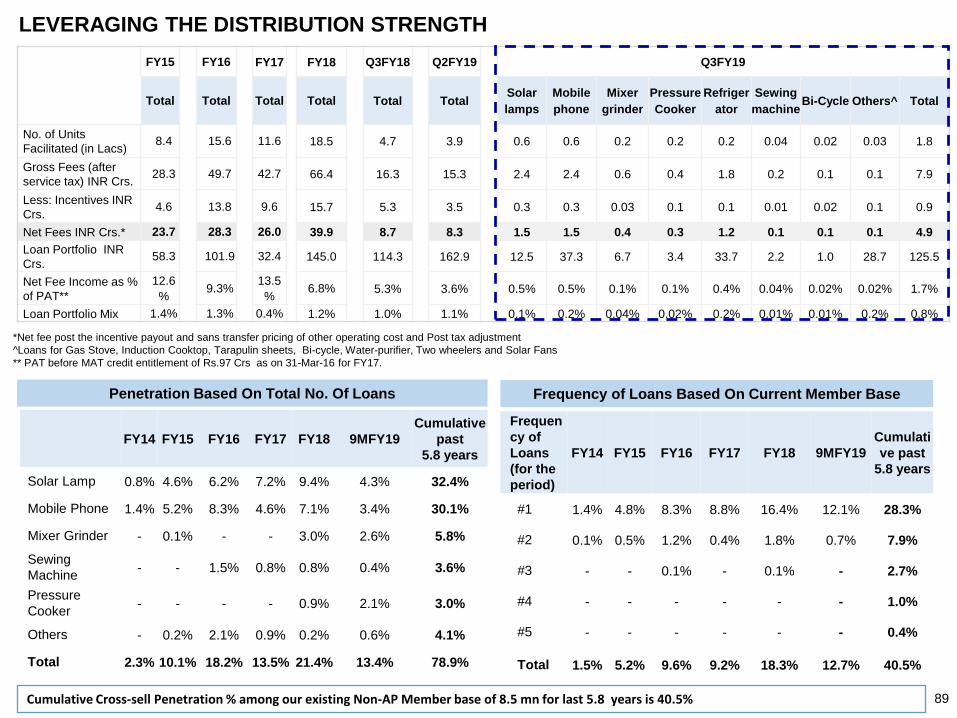
LEVERAGING THE DISTRIBUTION STRENGTH
FY15 FY16 FY17 FY18 Q3FY18 Q2FY19 Q3FY19
Total Total Total Total Total TotalSolar
lamps
Mobile
phone
Mixer
grinder
Pressure
Cooker
Refriger
ator
Sewing
machineBi-Cycle Others^ Total
No. of Units
Facilitated (in Lacs)8.4 15.6 11.6 18.5 4.7 3.9 0.6 0.6 0.2 0.2 0.2 0.04 0.02 0.03 1.8
Gross Fees (after
service tax) INR Crs.28.3 49.7 42.7 66.4 16.3 15.3 2.4 2.4 0.6 0.4 1.8 0.2 0.1 0.1 7.9
Less: Incentives INR
Crs.4.6 13.8 9.6 15.7 5.3 3.5 0.3 0.3 0.03 0.1 0.1 0.01 0.02 0.1 0.9
Net Fees INR Crs.* 23.7 28.3 26.0 39.9 8.7 8.3 1.5 1.5 0.4 0.3 1.2 0.1 0.1 0.1 4.9
Loan Portfolio INR
Crs.58.3 101.9 32.4 145.0 114.3 162.9 12.5 37.3 6.7 3.4 33.7 2.2 1.0 28.7 125.5
Net Fee Income as %
of PAT**
12.6
%9.3%
13.5
%6.8% 5.3% 3.6% 0.5% 0.5% 0.1% 0.1% 0.4% 0.04% 0.02% 0.02% 1.7%
Loan Portfolio Mix 1.4% 1.3% 0.4% 1.2% 1.0% 1.1% 0.1% 0.2% 0.04% 0.02% 0.2% 0.01% 0.01% 0.2% 0.8%
*Net fee post the incentive payout and sans transfer pricing of other operating cost and Post tax adjustment
^Loans for Gas Stove, Induction Cooktop, Tarapulin sheets, Bi-cycle, Water-purifier, Two wheelers and Solar Fans
** PAT before MAT credit entitlement of Rs.97 Crs as on 31-Mar-16 for FY17.
Cumulative Cross-sell Penetration % among our existing Non-AP Member base of 8.5 mn for last 5.8 years is 40.5%
Frequen
cy of
Loans
(for the
period)
FY14 FY15 FY16 FY17 FY18 9MFY19
Cumulati
ve past
5.8 years
#1 1.4% 4.8% 8.3% 8.8% 16.4% 12.1% 28.3%
#2 0.1% 0.5% 1.2% 0.4% 1.8% 0.7% 7.9%
#3 - - 0.1% - 0.1% - 2.7%
#4 - - - - - - 1.0%
#5 - - - - - - 0.4%
Total 1.5% 5.2% 9.6% 9.2% 18.3% 12.7% 40.5%
Penetration Based On Total No. Of Loans Frequency of Loans Based On Current Member Base
FY14 FY15 FY16 FY17 FY18 9MFY19
Cumulative
past
5.8 years
Solar Lamp 0.8% 4.6% 6.2% 7.2% 9.4% 4.3% 32.4%
Mobile Phone 1.4% 5.2% 8.3% 4.6% 7.1% 3.4% 30.1%
Mixer Grinder - 0.1% - - 3.0% 2.6% 5.8%
Sewing
Machine- - 1.5% 0.8% 0.8% 0.4% 3.6%
Pressure
Cooker- - - - 0.9% 2.1% 3.0%
Others - 0.2% 2.1% 0.9% 0.2% 0.6% 4.1%
Total 2.3% 10.1% 18.2% 13.5% 21.4% 13.4% 78.9%
89
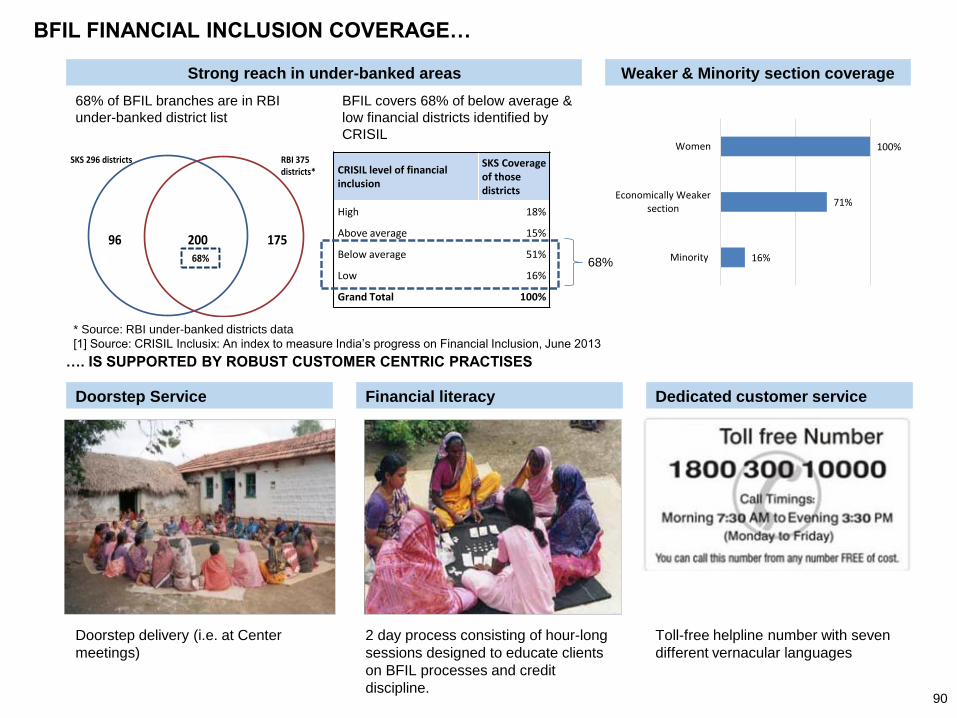
BFIL FINANCIAL INCLUSION COVERAGE…
Doorstep Service Financial literacy Dedicated customer service
Doorstep delivery (i.e. at Center
meetings)
2 day process consisting of hour-long
sessions designed to educate clients
on BFIL processes and credit
discipline.
Toll-free helpline number with seven
different vernacular languages
Strong reach in under-banked areas Weaker & Minority section coverage
68% of BFIL branches are in RBI
under-banked district list
BFIL covers 68% of below average &
low financial districts identified by
CRISIL
20096 175
SKS 296 districts RBI 375 districts*
68%
68% of SKS branches are in RBI under-banked districts list SKS covers 68% of below average & low financial inclusion districts identified by Crisil
CRISIL level of financial inclusion
SKS Coverage of thosedistricts
High 18%
Above average 15%
Below average 51%
Low 16%
Grand Total 100%
68%
Weaker & Minority section coverage
16%
71%
100%
Minority
Economically Weakersection
Women
…. IS SUPPORTED BY ROBUST CUSTOMER CENTRIC PRACTISES
* Source: RBI under-banked districts data
[1] Source: CRISIL Inclusix: An index to measure India’s progress on Financial Inclusion, June 2013
90
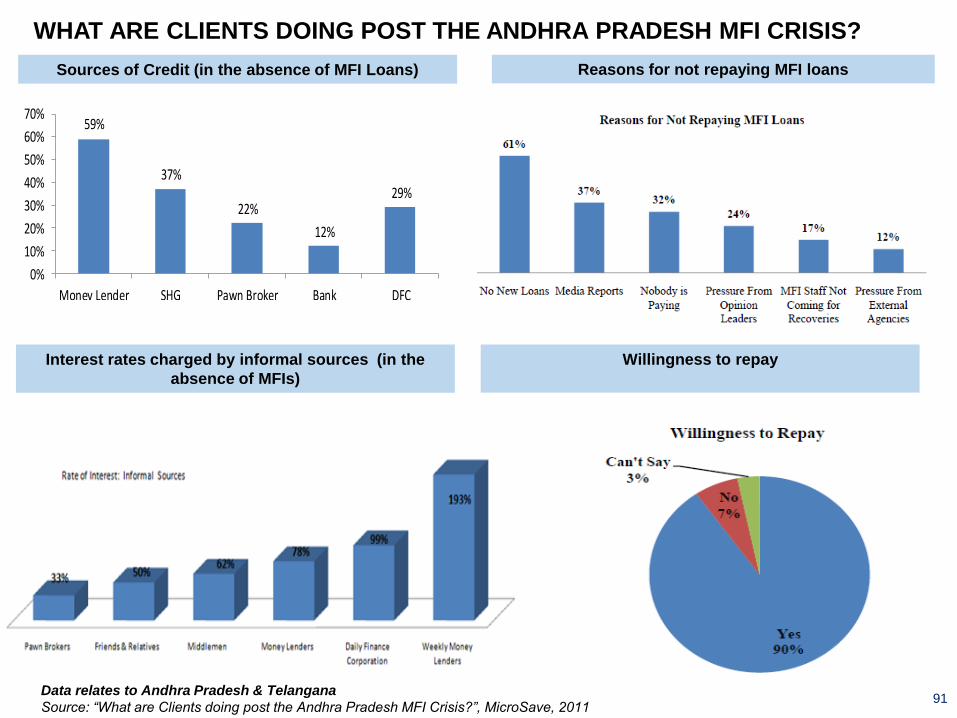
WHAT ARE CLIENTS DOING POST THE ANDHRA PRADESH MFI CRISIS?
Interest rates charged by informal sources (in the
absence of MFIs)
Willingness to repay
Data relates to Andhra Pradesh & Telangana
Source: “What are Clients doing post the Andhra Pradesh MFI Crisis?”, MicroSave, 2011
59%
37%
22%
12%
29%
0%
10%
20%
30%
40%
50%
60%
70%
Money Lender SHG Pawn Broker Bank DFC
Sources of Credit (in the absence of MFI Loans) Reasons for not repaying MFI loans
91
ANNEXURES - FINANCIALS
92
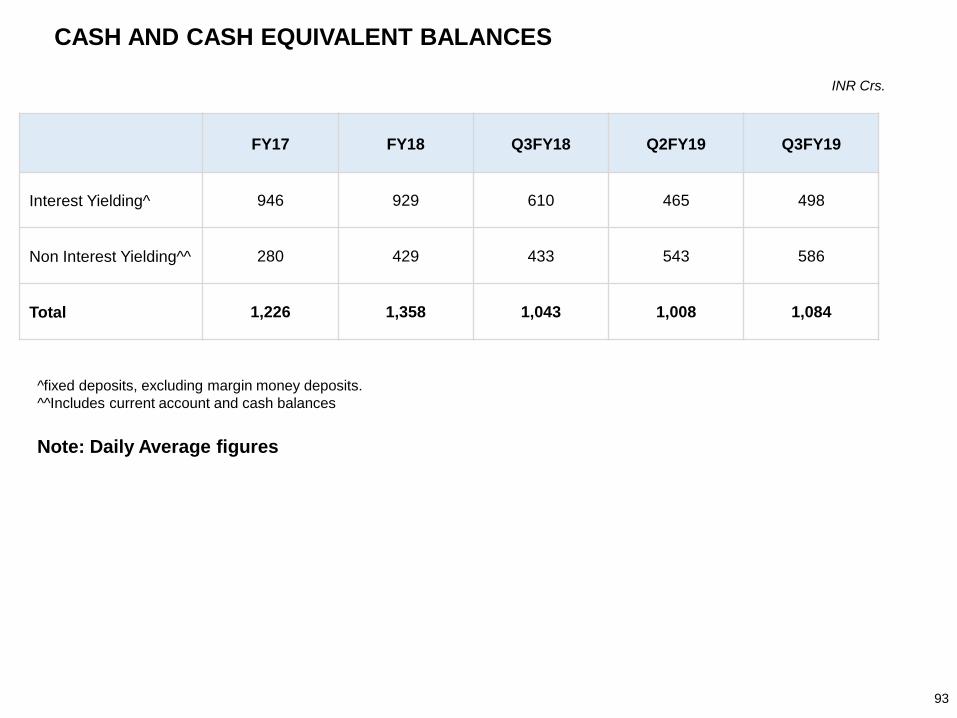
CASH AND CASH EQUIVALENT BALANCES
INR Crs.
FY17 FY18 Q3FY18 Q2FY19 Q3FY19
Interest Yielding^ 946 929 610 465 498
Non Interest Yielding^^ 280 429 433 543 586
Total 1,226 1,358 1,043 1,008 1,084
^fixed deposits, excluding margin money deposits.
^^Includes current account and cash balances
Note: Daily Average figures
93
ANNEXURES - TECHNOLOGY
94
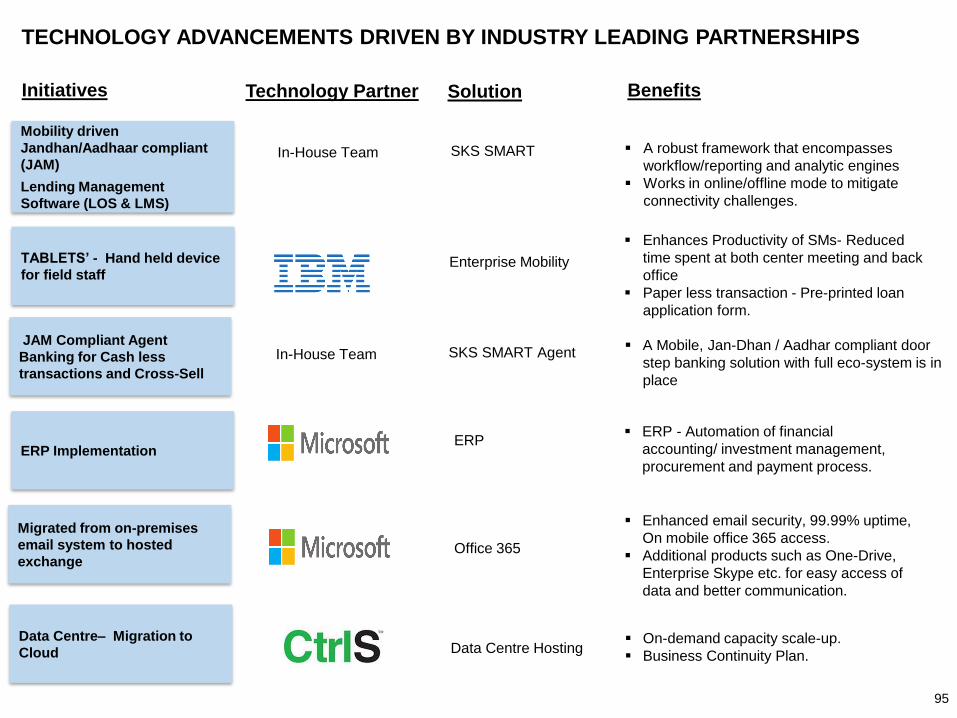
Initiatives SolutionTechnology Partner Benefits
Mobility driven
Jandhan/Aadhaar compliant
(JAM)
Lending Management
Software (LOS & LMS)
TABLETS’ - Hand held device
for field staff
Migrated from on-premises
email system to hosted
exchange
Data Centre– Migration to
Cloud
ERP Implementation
In-House Team SKS SMART
Enterprise Mobility
Office 365
Data Centre Hosting
ERP
▪ Enhances Productivity of SMs- Reduced
time spent at both center meeting and back
office
▪ Paper less transaction - Pre-printed loan
application form.
▪ Enhanced email security, 99.99% uptime,
On mobile office 365 access.
▪ Additional products such as One-Drive,
Enterprise Skype etc. for easy access of
data and better communication.
▪ On-demand capacity scale-up.
▪ Business Continuity Plan.
▪ A robust framework that encompasses
workflow/reporting and analytic engines
▪ Works in online/offline mode to mitigate
connectivity challenges.
▪ ERP - Automation of financial
accounting/ investment management,
procurement and payment process.
TECHNOLOGY ADVANCEMENTS DRIVEN BY INDUSTRY LEADING PARTNERSHIPS
95
JAM Compliant Agent
Banking for Cash less
transactions and Cross-Sell
In-House Team SKS SMART Agent▪ A Mobile, Jan-Dhan / Aadhar compliant door
step banking solution with full eco-system is in
place
ANNEXURES – HR
96
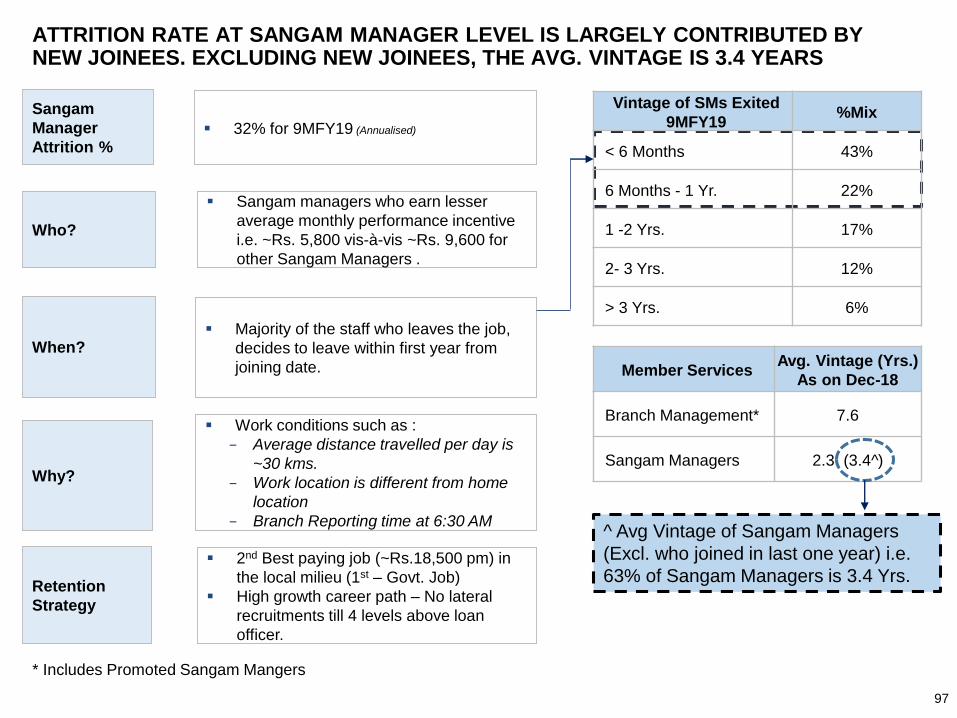
Member ServicesAvg. Vintage (Yrs.)
As on Dec-18
Branch Management* 7.6
Sangam Managers 2.3 (3.4^)
Vintage of SMs Exited
9MFY19%Mix
< 6 Months 43%
6 Months - 1 Yr. 22%
1 -2 Yrs. 17%
2- 3 Yrs. 12%
> 3 Yrs. 6%
Who?
When?
Sangam
Manager
Attrition %
Why?
Retention
Strategy
▪ 32% for 9MFY19 (Annualised)
▪ Sangam managers who earn lesser
average monthly performance incentive
i.e. ~Rs. 5,800 vis-à-vis ~Rs. 9,600 for
other Sangam Managers .
▪ Majority of the staff who leaves the job,
decides to leave within first year from
joining date.
▪ Work conditions such as :
− Average distance travelled per day is
~30 kms.
− Work location is different from home
location
− Branch Reporting time at 6:30 AM
▪ 2nd Best paying job (~Rs.18,500 pm) in
the local milieu (1st – Govt. Job)
▪ High growth career path – No lateral
recruitments till 4 levels above loan
officer.
ATTRITION RATE AT SANGAM MANAGER LEVEL IS LARGELY CONTRIBUTED BY NEW JOINEES. EXCLUDING NEW JOINEES, THE AVG. VINTAGE IS 3.4 YEARS
* Includes Promoted Sangam Mangers
^ Avg Vintage of Sangam Managers
(Excl. who joined in last one year) i.e.
63% of Sangam Managers is 3.4 Yrs.
97

ANNEXURES - COMPLIANCE
98
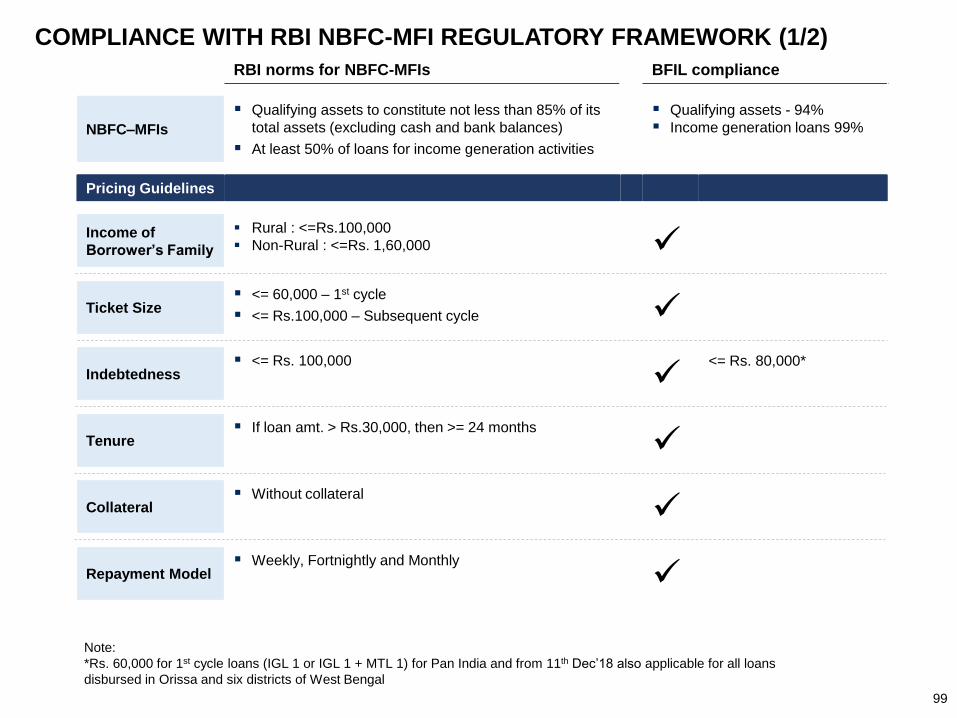
COMPLIANCE WITH RBI NBFC-MFI REGULATORY FRAMEWORK (1/2)
RBI norms for NBFC-MFIs BFIL compliance
NBFC–MFIs
▪ Qualifying assets to constitute not less than 85% of its
total assets (excluding cash and bank balances)
▪ At least 50% of loans for income generation activities
▪ Qualifying assets - 94%
▪ Income generation loans 99%
Pricing Guidelines
Income of
Borrower’s Family
▪ Rural : <=Rs.100,000
▪ Non-Rural : <=Rs. 1,60,000 ✓
Ticket Size▪ <= 60,000 – 1st cycle
▪ <= Rs.100,000 – Subsequent cycle ✓
Indebtedness▪ <= Rs. 100,000
✓<= Rs. 80,000*
Tenure▪ If loan amt. > Rs.30,000, then >= 24 months
✓
Collateral▪ Without collateral
✓
Repayment Model▪ Weekly, Fortnightly and Monthly
✓
99
Note:
*Rs. 60,000 for 1st cycle loans (IGL 1 or IGL 1 + MTL 1) for Pan India and from 11th Dec’18 also applicable for all loans
disbursed in Orissa and six districts of West Bengal
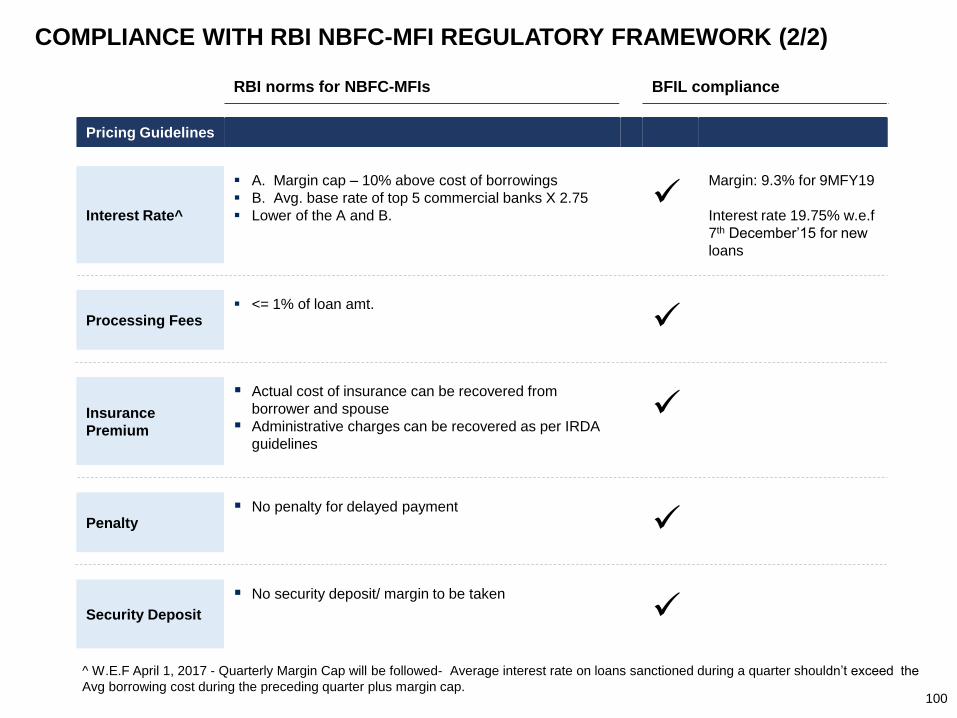
^ W.E.F April 1, 2017 - Quarterly Margin Cap will be followed- Average interest rate on loans sanctioned during a quarter shouldn’t exceed the
Avg borrowing cost during the preceding quarter plus margin cap.
COMPLIANCE WITH RBI NBFC-MFI REGULATORY FRAMEWORK (2/2)
RBI norms for NBFC-MFIs BFIL compliance
Pricing Guidelines
Interest Rate^
▪ A. Margin cap – 10% above cost of borrowings
▪ B. Avg. base rate of top 5 commercial banks X 2.75
▪ Lower of the A and B.✓
Margin: 9.3% for 9MFY19
Interest rate 19.75% w.e.f
7th December’15 for new
loans
Processing Fees▪ <= 1% of loan amt.
✓
Insurance
Premium
▪ Actual cost of insurance can be recovered from
borrower and spouse
▪ Administrative charges can be recovered as per IRDA
guidelines
✓
Penalty▪ No penalty for delayed payment
✓
Security Deposit
▪ No security deposit/ margin to be taken
✓
100
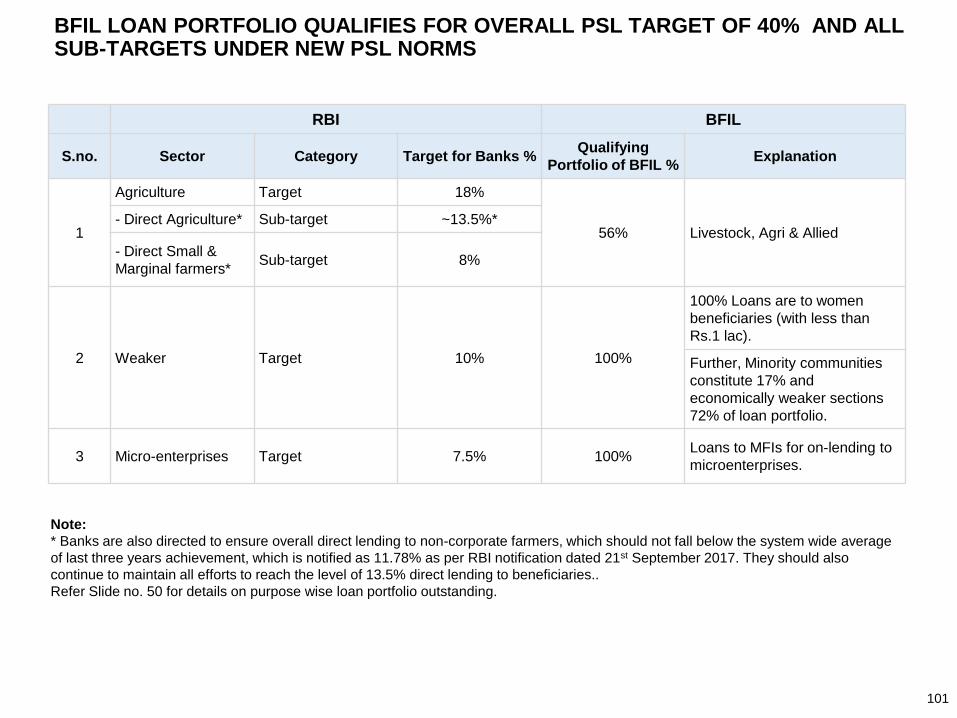
Note:
* Banks are also directed to ensure overall direct lending to non-corporate farmers, which should not fall below the system wide average
of last three years achievement, which is notified as 11.78% as per RBI notification dated 21st September 2017. They should also
continue to maintain all efforts to reach the level of 13.5% direct lending to beneficiaries..
Refer Slide no. 50 for details on purpose wise loan portfolio outstanding.
RBI BFIL
S.no. Sector Category Target for Banks %Qualifying
Portfolio of BFIL %Explanation
1
Agriculture Target 18%
56% Livestock, Agri & Allied- Direct Agriculture* Sub-target ~13.5%*
- Direct Small &
Marginal farmers*Sub-target 8%
2 Weaker Target 10% 100%
100% Loans are to women
beneficiaries (with less than
Rs.1 lac).
Further, Minority communities
constitute 17% and
economically weaker sections
72% of loan portfolio.
3 Micro-enterprises Target 7.5% 100%Loans to MFIs for on-lending to
microenterprises.
BFIL LOAN PORTFOLIO QUALIFIES FOR OVERALL PSL TARGET OF 40% AND ALL SUB-TARGETS UNDER NEW PSL NORMS
101
ANNEXURES – INTERNAL AUDIT
102
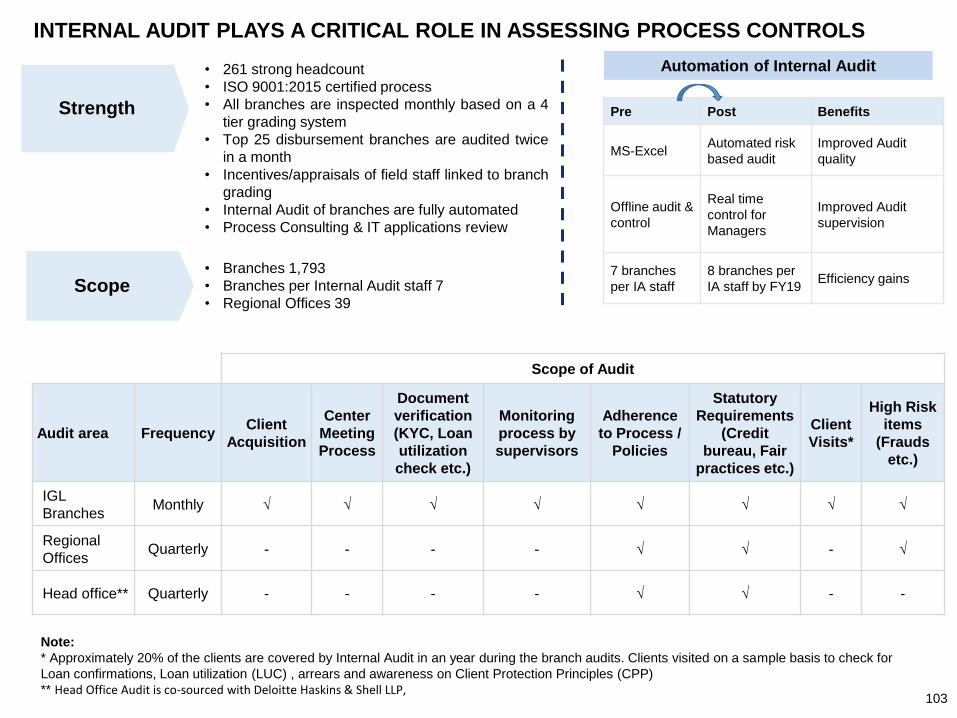
INTERNAL AUDIT PLAYS A CRITICAL ROLE IN ASSESSING PROCESS CONTROLS
Note:
* Approximately 20% of the clients are covered by Internal Audit in an year during the branch audits. Clients visited on a sample basis to check for
Loan confirmations, Loan utilization (LUC) , arrears and awareness on Client Protection Principles (CPP)
** Head Office Audit is co-sourced with Deloitte Haskins & Shell LLP,
• 261 strong headcount
• ISO 9001:2015 certified process
• All branches are inspected monthly based on a 4
tier grading system
• Top 25 disbursement branches are audited twice
in a month
• Incentives/appraisals of field staff linked to branch
grading
• Internal Audit of branches are fully automated
• Process Consulting & IT applications review
Strength
• Branches 1,793
• Branches per Internal Audit staff 7
• Regional Offices 39Scope
Scope of Audit
Audit area FrequencyClient
Acquisition
Center
Meeting
Process
Document
verification
(KYC, Loan
utilization
check etc.)
Monitoring
process by
supervisors
Adherence
to Process /
Policies
Statutory
Requirements
(Credit
bureau, Fair
practices etc.)
Client
Visits*
High Risk
items
(Frauds
etc.)
IGL
BranchesMonthly √ √ √ √ √ √ √ √
Regional
OfficesQuarterly - - - - √ √ - √
Head office** Quarterly - - - - √ √ - -
103
Pre Post Benefits
MS-Excel Automated risk
based audit
Improved Audit
quality
Offline audit &
control
Real time
control for
Managers
Improved Audit
supervision
7 branches
per IA staff
8 branches per
IA staff by FY19Efficiency gains
Automation of Internal Audit