Embed Size (px)
Citation preview

The Pennsylvania State University
The Graduate School
Department of Materials Science and Engineering
BIAS ELECTRIC FIELD DEPENDENCE OF HIGH POWER CHARACTERSTICS IN PZT
PIEZOELECTRIC CERAMICS
A Thesis in
Materials Science and Engineering
by
Anushka Bansal
2017 Anushka Bansal
Submitted in Partial Fulfillment
of the Requirements
for the Degree of
Master of Science
August 2017
ii
The thesis of Anushka Bansal was reviewed and approved* by the following:
Kenji Uchino
Professor of Electrical Engineering
Thesis Advisor
Joan Redwing
Professor of Materials Science and Engineering,
Chemical Engineering and Electrical Engineering
Associate Director, Materials Research Institute
Qiming Zhang
Distinguished Professor of Electrical Engineering
Suzanne E. Mohney Professor of Materials Science and Engineering Chair, Intercollege Materials Science and Engineering Graduate Degree Program
*Signatures are on file in the Graduate School
iii
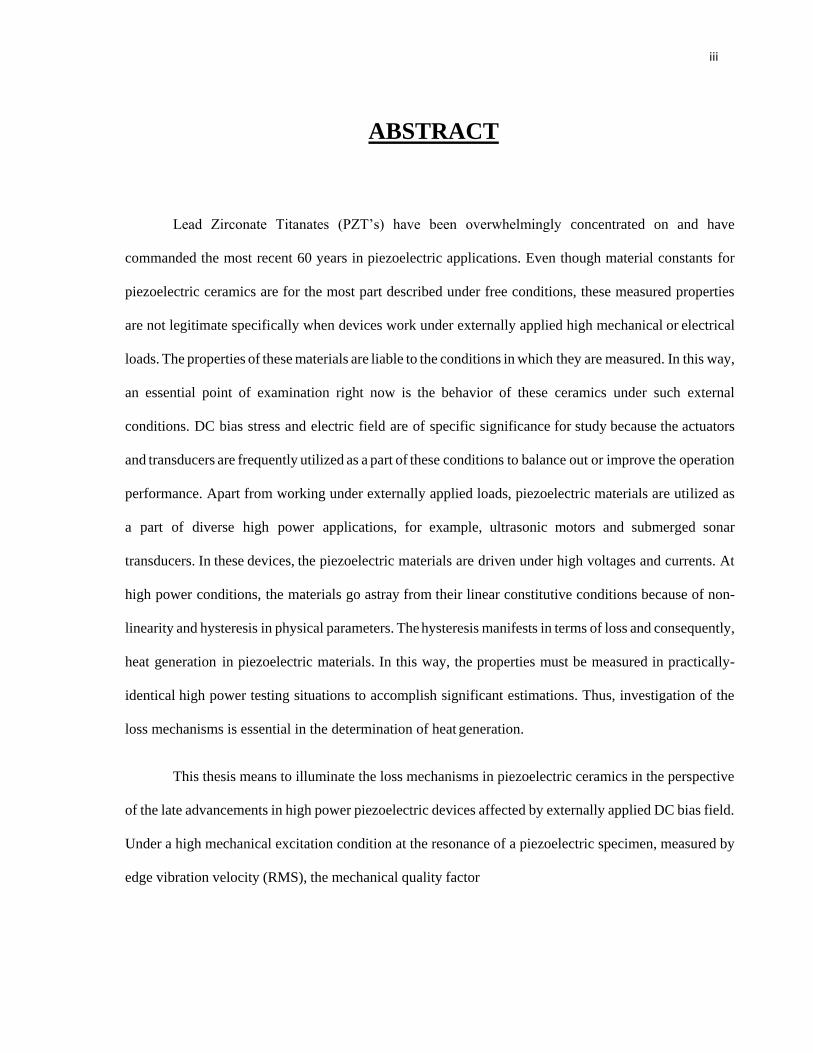
ABSTRACT
Lead Zirconate Titanates (PZT’s) have been overwhelmingly concentrated on and have
commanded the most recent 60 years in piezoelectric applications. Even though material constants for
piezoelectric ceramics are for the most part described under free conditions, these measured properties
are not legitimate specifically when devices work under externally applied high mechanical or electrical
loads. The properties of these materials are liable to the conditions in which they are measured. In this way,
an essential point of examination right now is the behavior of these ceramics under such external
conditions. DC bias stress and electric field are of specific significance for study because the actuators
and transducers are frequently utilized as a part of these conditions to balance out or improve the operation
performance. Apart from working under externally applied loads, piezoelectric materials are utilized as
a part of diverse high power applications, for example, ultrasonic motors and submerged sonar
transducers. In these devices, the piezoelectric materials are driven under high voltages and currents. At
high power conditions, the materials go astray from their linear constitutive conditions because of non-
linearity and hysteresis in physical parameters. The hysteresis manifests in terms of loss and consequently,
heat generation in piezoelectric materials. In this way, the properties must be measured in practically-
identical high power testing situations to accomplish significant estimations. Thus, investigation of the
loss mechanisms is essential in the determination of heat generation.
This thesis means to illuminate the loss mechanisms in piezoelectric ceramics in the perspective
of the late advancements in high power piezoelectric devices affected by externally applied DC bias field.
Under a high mechanical excitation condition at the resonance of a piezoelectric specimen, measured by
edge vibration velocity (RMS), the mechanical quality factor

iv
Qm degraded by 22% per 0.1 m/s of the vibration velocity increment for the soft PZT, while 17% per 0.1
m/s for the hard PZT under a DC bias field of 300 V/mm. However, it increased by 3.1% per 100 V/mm
for the soft and 1.7% per 100 V/mm for the hard PZT with the applied positive DC bias field under a
constant vibration velocity of 0.3 m/s. The high-power properties deviated significantly from the ones
measured under low power conditions (15% increase in elastic compliance whereas Qm degraded by a
factor of 2 under a DC bias field of 100 V/mm). Therefore, this study concludes that the deterioration of
the mechanical quality factor Qm with an increase in vibration velocity can be recovered by externally
applying positive DC bias field. The DC bias field 200 V/mm exhibits an almost equivalent “opposite”
change rate to the vibration velocity of 100 mm/sec.
Also, to investigate the loss mechanisms, the three losses (dielectric, elastic and piezoelectric
losses) were determined under low and high power conditions. Mechanical loss tan φ’ displayed a change
of 2.5% per 100V/mm for soft PZT and 1.1% per 100V/mm for the hard PZT, whereas the dielectric loss
showed a change of nearly 1.5% per 100V/mm for soft PZT and 0.4% per 100V/mm for hard PZT. It is
notable that the piezoelectric loss tan θ’ can be decreased most effectively under the positive DC bias
field (3.1% per 100 V/mm for the soft PZT and 1.9% per 100 V/mm for the hard PZT), than the elastic
or dielectric losses. Another noteworthy point is the two-step mechanism observed in hard PZT, a bend
of the slope is observed in the elastic loss tan φ’ on the vibration velocity change, while a bend of the
slope in the dielectric constant is observed on the DC bias field change. This may suggest a sort of
threshold value in terms of mechanical stress or electrical field for stabilizing/unstabilizing the domain
wall motions.
v
TABLE OF CONTENTS
List of Figures ................................................................................................................................ vi
List of Tables ................................................................................................................................ vii
Acknowledgements ..................................................................................................................... viii
Outline ............................................................................................................................................ ix
Chapter 1 Background .................................................................................................................. 1
1.1 Piezoelectricity ....................................................................................................................... 1
1.2 Properties of Piezoelectric Ceramics ..................................................................................... 3
1.3 Losses under High Power Conditions .................................................................................... 8
1.4 Losses under External DC Bias Field .................................................................................... 9
Chapter 2 Characterization Methods ........................................................................................ 12
2.1 Piezoelectric Resonance & Anti-resonance ......................................................................... 12
2.2 Low Power Characterization ................................................................................................ 14
2.3 High Power Characterization ............................................................................................... 16
Chapter 3 Motivation ................................................................................................................... 21
Chapter 4 Experimental Procedures .......................................................................................... 24
1.1 Sample Selection .................................................................................................................. 24
1.2 Electrical Characterization System ...................................................................................... 24
Chapter 5 Experimental Results ................................................................................................. 26
5.1 High Power Measurements without DC Bias Field ............................................................. 27
5.1.1 Elastic Compliance & Elastic Loss .......................................................................... 27
5.1.2 Dielectric Permittivity .............................................................................................. 29
5.1.3 Piezoelectric Constant & Piezoelectric Loss ............................................................ 30
5.2 Low Power Measurements ................................................................................................... 32
5.2.1 Elastic Compliance & Elastic Loss .......................................................................... 33
5.2.2 Dielectric Permittivity .............................................................................................. 34
5.2.3 Piezoelectric Constant & Piezoelectric Loss ........................................................... 37
5.3 High Power Measurements under DC Bias Field ................................................................ 38
Chapter 6 Discussions & Summary ............................................................................................ 41
Chapter 7 Future Research Topics ............................................................................................. 46
Bibliography ................................................................................................................................. 48

vi
LIST OF FIGURES
Figure 1.1.1 Relationship between materials that possess piezoelectricity, pyroelectricity and
ferroelectricity .................................................................................................................................. 2
Figure 1.1.2 (a) Direct piezoelectric effect and (b) converse piezoelectric effect ............................ 4
Figure 1.2.1 (a) x-X (short circuit), (b) D-E (stress-free), (c) x-E (stress-free) and (d) D-X
(open circuit) .................................................................................................................................... 7
Figure 1.3.1 Heat generation in a piezoelectric ceramic at resonance conditions. ......................... ..9
Figure 1.4.1 Various results obtained by researchers to obtain the dielectric constant, elastic
constant and piezoelectric constant as a function of DC bias field over the years ......................... 11
Figure 2.1.1 Various geometries for piezoelectric ceramics .......................................................... 13
Figure 2.2.1 A rectangular PZT plate with all the dimensions marked (L: length, b: width,
a: thickness) ................................................................................................................................... 15
Figure 2.2.2 3 dB bandwidth method to calculate QA at the resonance frequency ....................... 15
Figure 3.3.1 Conditions for Burst Mode (a) Short circuit (b) Open circuit .................................... 20
Figure 3.1 (a) Qm as a function of time for different PZTs & P-E hysteretic response for hard
PZT at different time intervals (b) Hysteresis curve shape change with time, showing the
internal bias field generation .......................................................................................................... 22
Figure 4.2.1 The High-Power Characterization System (HiPoCS) ................................................ 25
Figure 5.1 P-E hysteresis loop for hard and soft PZT’s ................................................................. 26
Figure 5.1.1 Elastic compliance change with vibration velocity under zero DC Bias ................... 27
Figure5.1.2 Quality factor at A type and B type resonance for (a) PIC 144 (b) PIC 255 .............. 28
Figure 5.1.3 Elastic loss under zero DC Bias ................................................................................. 29
Figure 5.1.4 Relative Permittivity at zero DC Bias under high power conditions ......................... 30
Figure 5.1.5 (a) Electromechanical coupling factor under zero DC Bias (b) Piezoelectric constant under
zero DC Bias .................................................................................................................................. 31
Figure 5.1.6 Piezoelectric loss under zero DC Bias ....................................................................... 32
Figure 5.2.1 Dielectric permittivity and the corresponding loss at 1kHz frequency for (a) Hard PZT (b)
Soft PZT ......................................................................................................................................... 34

vii
Figure 5.2.2 Type A and Type B resonance frequency change for (a) Hard PZT (b) Soft PZT .... 35
Figure 5.2.3 Electromechanical Coupling factor variation with the applied DC Bias field ........... 36
Figure 5.2.4 Elastic compliance and the corresponding loss for (a) Hard PZT (b) Soft PZT ........ 36
Figure 5.2.5 Quality factor variation at fA and fB with applied DC bias field for (a) Hard PZT (b) Soft
PZT ................................................................................................................................................ 37
Figure 5.2.6 Variation of Piezoelectric complex with applied DC bias field for (a) Hard PZT (b) Soft
PZT ................................................................................................................................................ 38
Figure 5.3.1 High power properties for hard PZT (a) Elastic compliances (b) Elastic loss ........... 39
Figure 5.3.2 High power properties for soft PZT (a) Elastic compliance (b) Elastic loss ............. 40
Figure 6.1 3D plot showing the variation of elastic loss for PZT's as a function of DC Bias field and
vibration velocity for (a) Hard PZT (b) Soft PZT .......................................................................... 44
viii
LIST OF TABLES
Table 1 Table comparing two methods of characterization ........................................................... 18
Table 2 Table showing the change in material properties with applied positive DC bias field and
vibration velocity ........................................................................................................................... 45
ix
ACKNOWLEDGEMENTS
First, I would like to express sincere gratitude to my advisor, Dr. Kenji Uchino for giving me the
opportunity to work with him throughout my graduate years. It was an honor to be under his personal and
academic guidance. He provided me the courage and enthusiasm for conducting research. He has been
very supportive towards my research and has provided valuable comments when I got stuck. He also
encouraged me to engage in collaborative research. I would also like to thank Office of Naval Research
for supporting this study with their funding through Dr. Kenji Uchino.
I would like to extend my appreciation to my master’s thesis committee members: Prof. Joan
Redwing and Prof. Qiming Zhang for taking their time and contributing to my thesis. Their valuable
comments and suggestions lead to various new approaches and made my thesis broader from the
fundamental materials science viewpoint.
I would also like to thank to my past ICAT colleague Dr. Husain Shekhani for providing
additional aspects to my research. Also, Maryam Majzoubi and Minkyu Choi for being there, not just as
coworkers, but also as friends when I needed them. My thesis would not be possible without the
collaboration in the past years with Mr. Eberhard Hennig and Dr. Timo Scholehwar from PI ceramics. I
would like to extend my thanks to them for not only providing me samples but many scientific discussions
that helped me throughout.
Last but not the least, I would also like to thank all my family members and friends. My family,
especially my parents, Mukund and Manju Bansal and my brother Yashasvi Bansal gave me their support
when I needed them the most. Feeling the warmth of my family helped me to keep my courage when I was
down. My friends at Penn State made the graduate life more fun and less stressful.

x
OUTLINE
The first chapter reviews the fundamentals of the piezoelectricity and gives examples of
piezoelectric materials. Initially, piezoelectric materials will be explained in chronological order. Then,
piezoelectric materials will be grouped into three depending on the structure. Also, origin of losses in
piezoelectric ceramics (i.e. mechanical, dielectric, and piezoelectric) through hysteresis will be outlined
later in the section. After this, importance of measuring high power properties and external constraints in
piezoelectric materials will be explained.
The second chapter gives a summary of different electrical characterization techniques. In the
first part, mechanical quality factor at resonance and antiresonance will be introduced. In the latter half,
different techniques that could be used to completely characterize the ceramics will be explained.
Complete characterization of the piezoelectric ceramic includes calculating the mechanical quality factor,
electromechanical coupling factor, both “real” and “imaginary” parts of dielectric permittivity, elastic
compliance and piezoelectric constant. The electrical characterization in this thesis have been performed
under two power level: low power (0.5-1 Vrms/mm) and high power (>1Vrms/mm) conditions. Low power
characterization using Continuous Admittance Spectrum method will then be described later. At the end,
high power characterization using Burst mode will be explained.
The third chapter explains the motivation and objectives of the work performed. It briefly reviews
the path of thinking involved in carrying out the current research work. It explains the conditions under
which material properties were measured earlier and the critical need to measure the material coefficients
under externally applied mechanical and electrical constraints.
xi
Next, in the fourth chapter, the experimental method for continuous admittance spectrum analysis
for low power measurements have been described. Also, experimental method for Burst mode technique
to measure high power properties have been described. In this section, the focus is on obtaining
measurements of low and high power measurements on piezoelectric materials in k31 vibration modes.
Based on the experimental techniques developed, the results for low power performance and high
power performance piezoelectric ceramics are summarized in chapter 5.
The last chapter is a synopsis of the results explained in the dissertation. The summary will also
include conclusions followed by a broad range of recommended future work in chapter.
1
Chapter 1
Background
1.1 Piezoelectricity:
The disclosure of the capacity of crystals, for example, Quartz, Topaz and Rochelle Salt, among
others, to generate electric charge when subjected to mechanical stress is ascribed to the Curie brothers
who observed this interest at some point in 1880[1]. This phenomenon was immediately named
piezoelectricity, to discern it from at the time already established thoughts of friction based electricity
and pyroelectricity. The converse phenomenon, however, was not discovered but rather
thermodynamically predicted one year later, and after that immediately demonstrated experimentally. [2]
A dielectric material (dielectric for short) is an electrical insulator that can be polarized by an applied
electric field. In such dielectrics, when an electric field is applied, electrical charges are attracted to
different directions, due to the nature of electrostatic interactions. In lieu of this movement, electric
dipoles are generated all throughout the material. This phenomenon is known as electric polarization. .
In ionic dielectric materials, the constituent atoms are charged (ionized) in a certain orientation and
magnitude. These materials can store charge due to the electric charge per unit area called dielectric
displacement D and dielectric polarization P.[3] It can be represented by the given equation:
𝐷 = 휀0𝐸 + 𝑃 = 휀휀0𝐸 (1.1.1)
where ε0 is the permittivity in vacuum (ε0=8.854 x 10⁻¹² F/m) and ε is the material’s relative permittivity.
There are seven crystal systems based on the degree of symmetry: triclinic, monoclinic, orthorhombic,
tetragonal, trigonal (rhombohedral), hexagonal and cubic. These basic crystal systems are classified into
32 point groups per the crystallographic symmetry. [4] Out of these, 21 are non-centrosymmetric (no
inversion center). Among those 21 point groups, except group 432, crystals

2
having all other point groups exhibit “piezoelectric” effect. [5] 10 out of 20 non- centrosymmetric point
groups have a spontaneous polarization. These polar point groups that have a finite polarization possess
both piezoelectric and pyroelectric effects. Temperature dependence of the spontaneous polarization in
the crystal creates ‘pyroelectricity’. For such crystals, temperature change creates an electric charge on
the surface of the crystals as a result of the change in the spontaneous polarization. These materials show
natural spontaneous polarization (Ps) in the structure without the application of an electric field. Materials
possess spontaneous polarization below a specific temperature, which is the Curie temperature (Tc). If
the spontaneous polarization of a pyroelectric material can be reversed, then the material is called,
ferroelectric. [6] Relationship between these materials exists as shown in Fig. 1.1.1.
Figure 1.1.1 Relationship between materials that possess piezoelectricity, pyroelectricity and ferroelectricity.
Piezoelectricity is a coupling phenomenon between electrical energy and mechanical energy
which emerges from the non-centrosymmetric unit cell. These materials develop surface charges in
response to an applied pressure (direct piezoelectric effect), and create mechanical strain in response to an
applied electric field (converse piezoelectric effect), which can then be used for sensing and actuating
purpose respectively. [7] The direct as well as converse piezoelectric effects can be visualized
in Fig. 1.1.2.
3
𝑖𝑗
𝑚𝑘
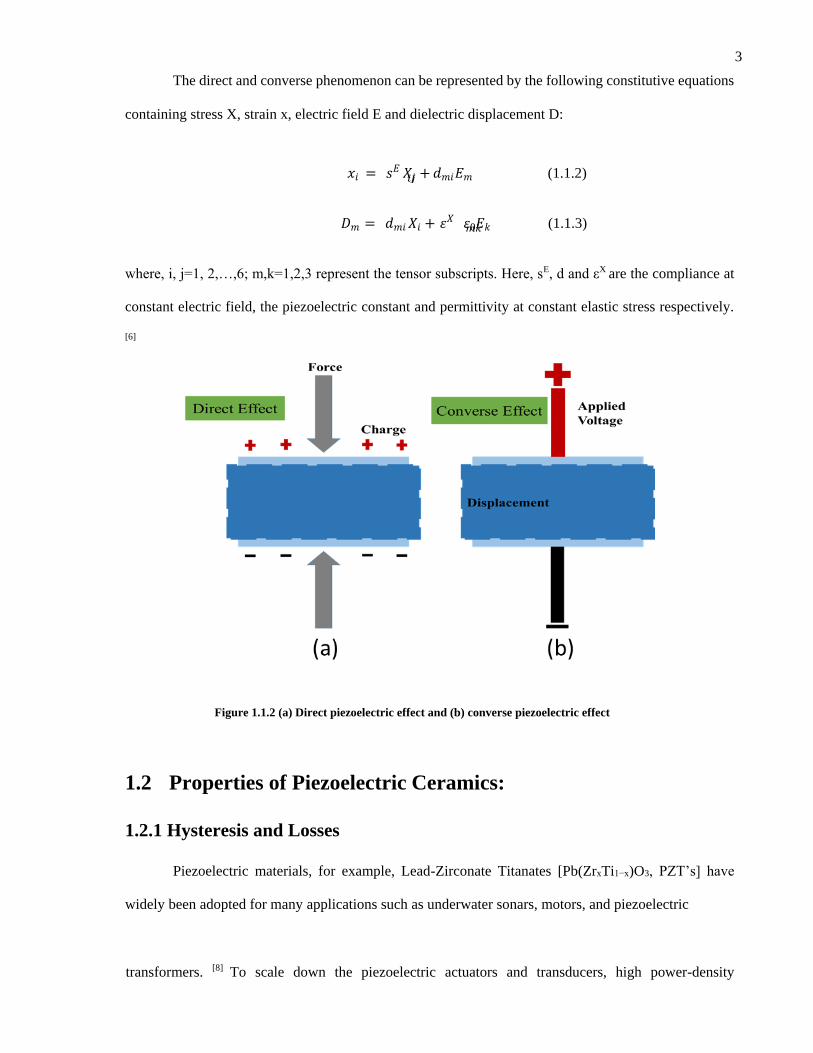
The direct and converse phenomenon can be represented by the following constitutive equations
containing stress X, strain x, electric field E and dielectric displacement D:
𝑥𝑖 = 𝑠𝐸 𝑋𝑗 + 𝑑𝑚𝑖 𝐸𝑚 (1.1.2)
𝐷𝑚 = 𝑑𝑚𝑖 𝑋𝑖 + 휀𝑋 휀0𝐸𝑘 (1.1.3)
where, i, j=1, 2,…,6; m,k=1,2,3 represent the tensor subscripts. Here, sE, d and εX are the compliance at
constant electric field, the piezoelectric constant and permittivity at constant elastic stress respectively.
[6]
Figure 1.1.2 (a) Direct piezoelectric effect and (b) converse piezoelectric effect
1.2 Properties of Piezoelectric Ceramics:
1.2.1 Hysteresis and Losses
Piezoelectric materials, for example, Lead-Zirconate Titanates [Pb(ZrxTi1−x)O3, PZT’s] have
widely been adopted for many applications such as underwater sonars, motors, and piezoelectric
transformers. [8] To scale down the piezoelectric actuators and transducers, high power-density

4
piezoelectric material developments are required for realizing the same level of mechanical vibration
energy in a smaller specimen, without temperature ascend through internallosses. [9] The efficiency and
reliability of piezoelectric materials are directly related with their hysteresis or loss characteristics. The
hysteresis is a critical issue in precise positioning under off- resonance working conditions for
piezoelectric applications. Particularly, in resonance applications, loss or hysteresis generates noteworthy
amount of heat in the piezoelectric material because of the heat accumulation in a short period. There are
three types of losses; mechanical loss, dielectric loss and piezoelectric loss. [10] Ikeda clarified the basic
loss mechanisms in piezoelectric ceramics by dismissing the piezoelectric loss. Loss mechanisms were
further clarified by introduction of complex physical parameters. Late research by Uchino and Hirose
made an exhaustive explanation of the loss mechanisms and calculation of the loss parameters in
piezoelectric ceramics. [11], [12] Each loss component is categorized into intensive and extensive groups.
Per IUPAC (The International Union of Pure, and Applied Chemistry), extensive parameter depends on the
volume of the material, while intensive parameter is the ratio of two extensive ones, and therefore, is
independent on the volume of the material. Consequently, stress (X) and electric field (E) are intensive
parameters, which are externally controllable; while strain (x) and dielectric displacement (D) (or
polarization (P)) are extensive parameters, which are internally determined in the material. The
“intensive” or “extensive” dielectric, elastic, piezoelectric losses are defined as a time lag measured under
X, E constant (or free), or under x, D (or P) constant conditions, respectively. Formulations with time
delay (phase lag) can be represented as follows:
)'tan1(* jXX , (1.2.1) )tan1(* jxx , (1.2.4)
)'tan1(* jss EE , (1.2.2) )tan1(* jcc DD , (1.2.5)
)'tan1(* jdd , (1.2.3) )tan1(* jhh . (1.2.6)
Here, j is the imaginary notation, εX is the dielectric constant under constant stress, βx is the inverse dielectric
constant under constant strain, sE is the elastic compliance under constant electric
field, cD is the elastic stiffness under constant electric displacement, d is the piezoelectric constant, and h is the

5
inverse piezoelectric charge constant. Note that the tensor components of β is not just an inverse value of ε, but
an inverse tensor component of the ε matrix in a 3D model. The extensive losses appear in a constraint condition
such as mechanically-clamped or electrically-open circuit, and are often used to discuss the physical materials
performance. The intensive (prime) tangents should have the negative sign, while the extensive (non-prime)
tangents take the positive sign, so that both tangents can keep the positive sign as experimentally determined
values in general. The loss tangent value should be much smaller than 1 (less than 0.1 in practice) in this
complex parameter usage, and means a phase/time lag of the output parameter (such as P) from the input
parameter (such as E). The phase lags, which were explained above, can be observed experimentally (Fig.
1.2.1). It shows experimentally observed hysteresis curves for strain (x) – stress (X) (short-circuit condition),
dielectric displacement (D) – electric field (E) (stress-free condition), strain (x) – electric field (E) (stress-free
condition) and dielectric displacement (D) – stress (X) (open-circuit condition). These phase lags are defined
as intensive losses. Note that the hysteresis areas on x – E or D – X domains are not directly related with the
piezoelectric loss, but with coupled loss with elastic or dielectric losses, as indicated on the figures.
Figure 1.2.1 (a) x-X (short circuit), (b) D-E (stress-free), (c) x-E (stress-free) and (d) D-X (open circuit)
When there is no phase lag (δ=0), all stored electric energy is recovered after a full cycle with 100%
efficiency. Since the hysteresis corresponds to loss, the area inside the hysteresis loop, Fig. 1.2.1 (a) corresponds
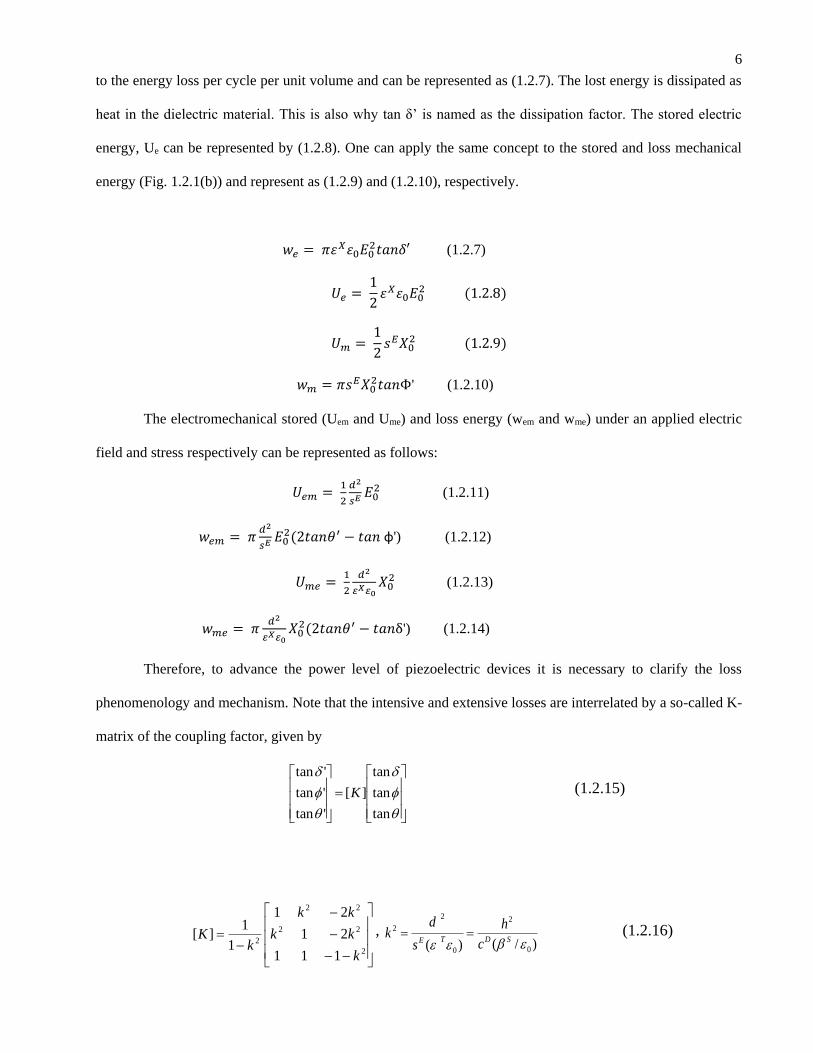
6
to the energy loss per cycle per unit volume and can be represented as (1.2.7). The lost energy is dissipated as
heat in the dielectric material. This is also why tan δ’ is named as the dissipation factor. The stored electric
energy, Ue can be represented by (1.2.8). One can apply the same concept to the stored and loss mechanical
energy (Fig. 1.2.1(b)) and represent as (1.2.9) and (1.2.10), respectively.
𝑤𝑒 = 𝜋휀𝑋휀0𝐸02𝑡𝑎𝑛𝛿′ (1.2.7)
𝑈𝑒 = 1
2휀𝑋휀0𝐸0
2 (1.2.8)
𝑈𝑚 = 1
2𝑠𝐸𝑋0
2 (1.2.9)
𝑤𝑚 = 𝜋𝑠𝐸𝑋02𝑡𝑎𝑛Φ' (1.2.10)
The electromechanical stored (Uem and Ume) and loss energy (wem and wme) under an applied electric
field and stress respectively can be represented as follows:
𝑈𝑒𝑚 = 1
2
𝑑2
𝑠𝐸 𝐸02 (1.2.11)
𝑤𝑒𝑚 = 𝜋𝑑2
𝑠𝐸 𝐸02(2𝑡𝑎𝑛𝜃′ − 𝑡𝑎𝑛 φ') (1.2.12)
𝑈𝑚𝑒 = 1
2
𝑑2
𝜀𝑋𝜀0𝑋0
2 (1.2.13)
𝑤𝑚𝑒 = 𝜋𝑑2
𝜀𝑋𝜀0𝑋0
2(2𝑡𝑎𝑛𝜃′ − 𝑡𝑎𝑛δ') (1.2.14)
Therefore, to advance the power level of piezoelectric devices it is necessary to clarify the loss
phenomenology and mechanism. Note that the intensive and extensive losses are interrelated by a so-called K-
matrix of the coupling factor, given by
tan
tan
tan
][
'tan
'tan
'tan
K (1.2.15)
2
22
22
2
111
21
21
1
1][
k
kk
kk
kK ,
)/()( 0
2
0
2
2
SDTE c
h
s
dk (1.2.16)

7
Intensive loss components of the three can be obtained from the resonance and anti-resonance
mechanical quality factors in the k31 mode, while the extensive loss components can be obtained from the
mechanical quality factors in the k33 mode. In this thesis, to make the situation simplest, we will be focusing on
the intensive losses. However, extensive losses can be determined indirectly using the K matrix.
Mechanical quality factors also play a significant role in the loss study of piezoelectrics. They are
basically related to dielectric, elastic and piezoelectric loss factors. Besides, a higher quality factor at the
antiresonance is usually observed in the PZT based piezoelectric materials, in comparison with the resonance
quality factor. However, the previous theory without considering the piezoelectric loss factor could not explain
the deviation of the resonance quality factor QA and antiresonance quality factor QB explicitly. IEEE Std. only
provided the method to derive QA based on the equivalent circuit, and assumed that the resonance quality factor
is equal to the antiresonance quality factor from a traditional thought. Quality factor (Q) compares the time
constant for decay of a resonating system’s amplitude to its resonance period. It is generally defined as:
𝑄 = 2𝜋 𝐸𝑛𝑒𝑟𝑔𝑦 𝑆𝑡𝑜𝑟𝑒𝑑
𝑎𝑣𝑒𝑟𝑎𝑔𝑒 𝑒𝑛𝑒𝑟𝑔𝑦 𝑑𝑖𝑠𝑠𝑖𝑝𝑎𝑡𝑒𝑑 𝑝𝑒𝑟 𝑐𝑦𝑐𝑙𝑒
(1.2.17)

8
1.3 Losses under High Power Conditions
The drive to miniaturize components and the search for higher efficiency in battery operated
devices are driving the development of piezoelectric components to replace less efficient electromagnetic
analogs. [13], [14] All these new piezoelectric devices are operated at resonance, since on off-resonance
ceramics requires high electric voltage/electric field for a certain magnitude of strain (0.1%). Benefitting
from amplification of the strain that occurs at the resonance under a reasonably
small electric field to obtain the highest vibration amplitudes/velocities for a similar level of strain
(0.1%). In this condition, excited vibration amplitudes are substantially high and significant heat is
generated through losses, which limit the usable vibration amplitude level of the piezoelectric. A simple
rule of thumb-figure-of-merit is the maximum vibration velocity. This can be viewed as a figure to
evaluate the maximum mechanical energy density generated in a piezoelectric ceramic material,
while limiting the temperature rise in the piezoelectric 20oC higher than room temperature. [13] - [17] Note
that the practical upper-limit of vibration velocity is restricted by heat generation, since above a certain
vibration level increasing hysteretic effects (increasing losses) result in thermal instability. Though the
off-resonance driven piezoelectrics generate heat in a rather homogeneous matter in a specimen, the
resonance-driven piezoelectrics generate heat in an inhomogeneous manner. The temperature profile
follows the strain distribution and the heat is concentrated at the nodal points. Temperature difference of
20 degrees from room temperature is observed typically within a 10 % of the sample size in the
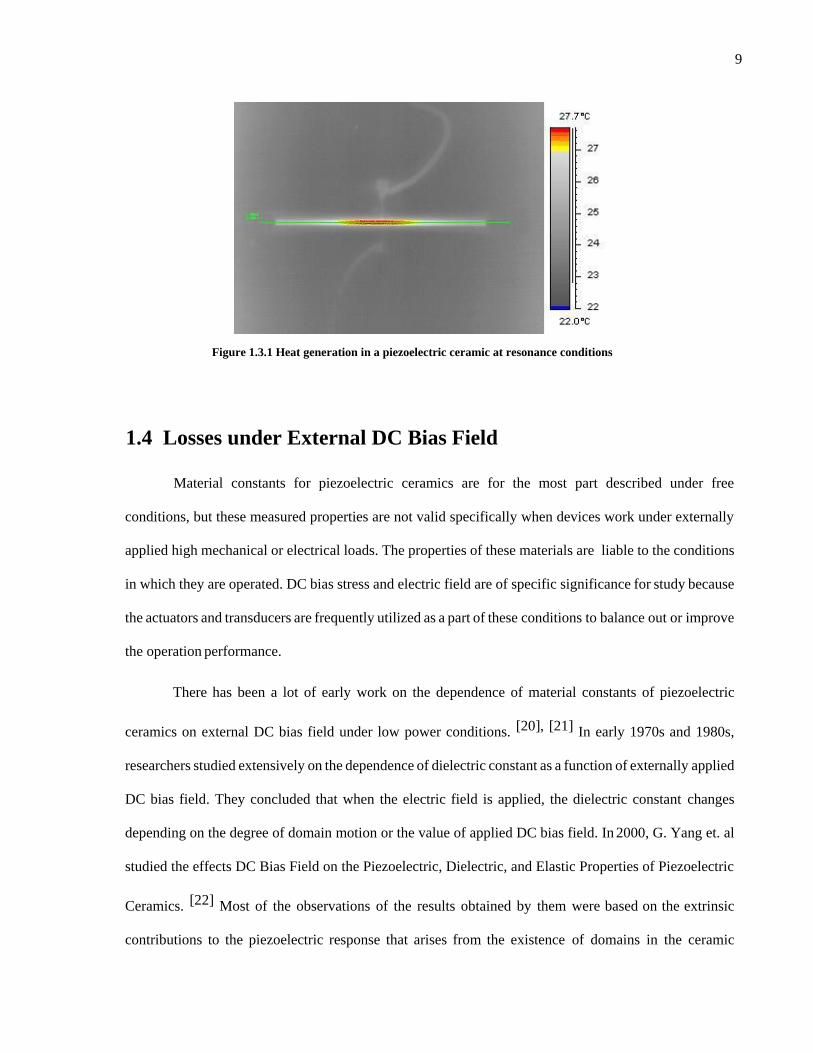
piezoelectric (fig. 1.3.1). Thus, significant attention must be paid to the generated heat (losses), as it might
result in premature failure of the actuator.
9
Figure 1.3.1 Heat generation in a piezoelectric ceramic at resonance conditions
1.4 Losses under External DC Bias Field
Material constants for piezoelectric ceramics are for the most part described under free
conditions, but these measured properties are not valid specifically when devices work under externally
applied high mechanical or electrical loads. The properties of these materials are liable to the conditions
in which they are operated. DC bias stress and electric field are of specific significance for study because
the actuators and transducers are frequently utilized as a part of these conditions to balance out or improve
the operation performance.
There has been a lot of early work on the dependence of material constants of piezoelectric
ceramics on external DC bias field under low power conditions. [20], [21] In early 1970s and 1980s,
researchers studied extensively on the dependence of dielectric constant as a function of externally applied
DC bias field. They concluded that when the electric field is applied, the dielectric constant changes
depending on the degree of domain motion or the value of applied DC bias field. In 2000, G. Yang et. al
studied the effects DC Bias Field on the Piezoelectric, Dielectric, and Elastic Properties of Piezoelectric
Ceramics. [22] Most of the observations of the results obtained by them were based on the extrinsic
contributions to the piezoelectric response that arises from the existence of domains in the ceramic

10
materials. They showed that the piezoelectric d33 constant shows a slight decrease when a positive DC
bias is applied on the specimen. Over the entire range of negative DC bias that was applied, the value of
d33 for the hard PZT increased significantly and no drop in the value of d33 was observed. In the case of
soft PZT, they found that significant depoling started even at the low bias field of - 0.5 MV/m. They
concluded that, in applications where a large driving field must be applied to piezoelectric materials, the
field dependent non-linearity plays an important role. For soft materials, the occurrence of depoling should
be considered if the material is likely to be subjected to a negative field. Also in 2003, similar work was
performed by A. J Masys et. al. They studied the strain levels in ferroelectric ceramics as a function of
electric field and determined the piezoelectric coefficients d33, d31, and d15 of different types of PZT
ceramics as a function of electric field. [21] They concluded that in general, for both hard and soft PZT,
the piezoelectric coefficient showed significant nonlinearity with increasing field strength. Higher d
coefficients were realized with the application of a negative dc bias. However, depoling and repoling
occurred in soft PZT under high bias fields. Positive bias fields resulted in a slight decrease in the
d coefficients due to domain wall pinning. Also, in 2003, Q. M Wang et. al directly studied the effect of
DC bias field on the complex piezoelectric, dielectric and elastic coefficients of a piezoelectric ceramic
resonator under various DC bias field. [23] It has been found that with DC bias increasing, elastic
compliance, piezoelectric coefficient and dielectric permittivity decrease with approximately linear
relationships. Since the resonance frequency of the piezoelectric resonator changes with the applied DC
bias field, it is suggested that the DC bias field can be used for frequency tuning or frequency–temperature
stability control in device applications. Various results obtained by the researchers over the years have
been plotted in fig 1.4.1.

11
Figure 1.4.1 Various results obtained by researchers to obtain the dielectric constant, elastic constant and
piezoelectric constant as a function of DC bias field over the years.
Although much work has been performed in order the evaluate the material constants for the
piezoelectric constants at low power, little work has been performed to measure the losses under
different external conditions. Thus, it becomes need of the hour to evaluate the loss behavior for the
piezoelectric ceramics at low and as well as high power conditions.
12
Chapter 2
Characterization Methods
In piezoelectric studies, materials characterization is trailed by both electrical and mechanical
characterization. Piezoelectric materials, for example, PZT, Lead Titanate (PbTiO3), have been broadly
utilized as sensors, actuators, transducers also, resonators for some electromechanical applications.
Properties of piezoelectric materials are essential parameters in materials determination for device outline
and manufacture. For the most part, a total characterization of piezoelectric materials incorporates the
assurance of piezoelectric coefficients, dielectric permittivity, elastic coefficients, mechanical quality
factor, and electromechanical coupling coefficients. These properties are generally measured by the
methods suggested by the IEEE norms. However, it has been brought up that the IEEE standard strategy
is not appropriate to characterize loss behavior in piezoelectric materials. Precise characterization ought
to treat all the previously mentioned materials coefficients as complex numbers so that the loss component
can be measured. Generally, economically accessible analyzers or meters e.g. impedance analyzers, d33
and LCR meters are utilized to measure low power properties. However, they cannot be used to measure
high power performance of the device. The ICAT group at The Penn State University has been working
extensively to characterize the ceramics under high power conditions by developing special
characterization methodology, HiPoCS (High Power Piezoelectric Characterization System). ICAT
designed system have been used to carry out experiments for this work. This chaptergives an overview of
the methods used for characterizing the ceramic at both low as well as high power conditions.
2.1 Piezoelectric Resonance & Antiresonance
Presently, characterization of piezoelectric ceramics includes fundamentally working at
resonance, antiresonance and off resonance conditions. Before hopping on to the formulae for computing
real and imaginary parts of the elastic, piezoelectric and dielectric complex, it turns out to be
13
essential to comprehend the importance of the diverse conditions under which measurements are
performed.
The resonance state of a piezoelectric oscillator is characterized as the condition where a
oscillating input voltage instigates a greatest current response. The antiresonance state of a piezoelectric
component is characterized as the condition in which a swaying input current results in a most extreme
voltage response. When an electric field is applied to the piezoelectric ceramic, along the polarization
direction, then as per the Poisson’s ratio, the material expands in one direction and contracts in the
perpendicular direction. Accordingly, this example can display methods of vibration along the thickness,
length, and width. Resonance and Antiresonance are either mechanical resonance or electromechanical
coupling resonance modes. The mechanical resonance frequency is related just with the sound speed in
the material and the geometry. The thickness extensional mode (k33 mode) experiences mechanical
resonance at the electrical antiresonance frequency comparing to the consistent D condition, while the
length extensional mode (k31 mode) experiences mechanical resonance at the electrical resonance
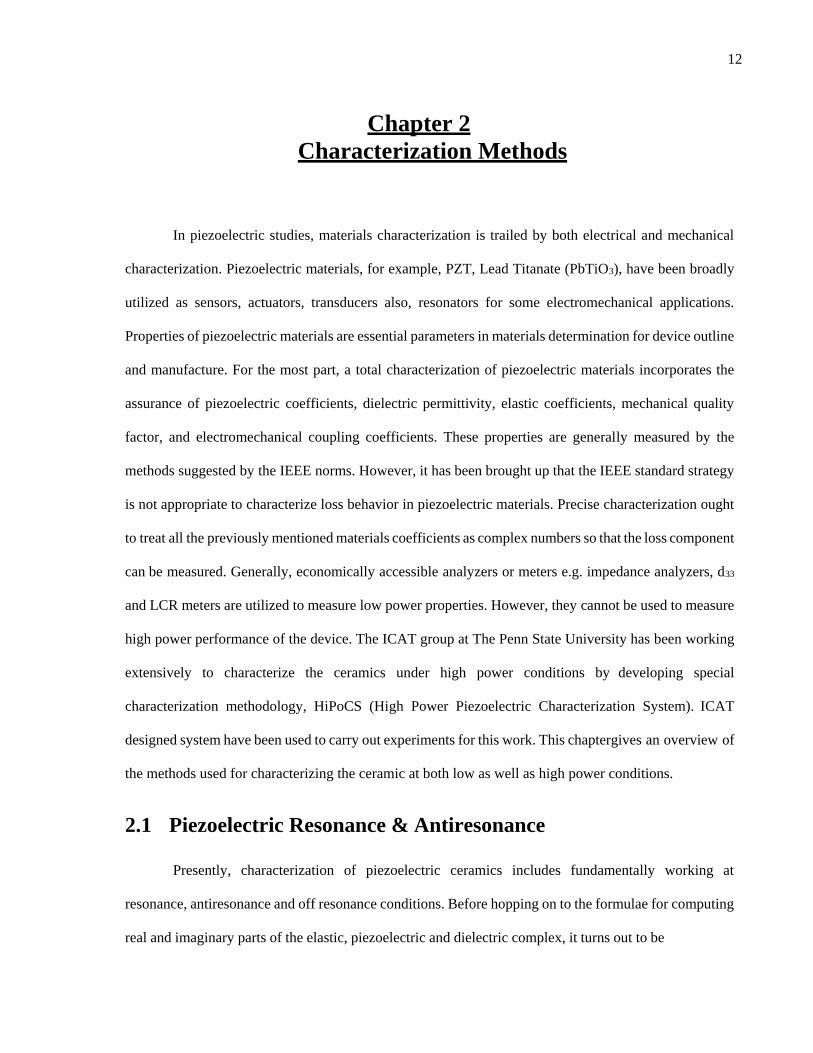
frequency because of the steady E, which then changes the sound speed in the material. The extensional
type resonators of k31; k33; and kp are the most widely recognized extensional vibration modes
utilized for piezoelectric devices. The geometries for each of these resonators is given in Fig. 2.1.1.
However, only k31 is examined in this work.
Figure 2.1.1 Various geometries for piezoelectric ceramics

14
2.2 Low Power Characterization
Low power properties were measured using continuous admittance spectrum method. Now, one
may think of a thought of only a basic characterization like low power characterization used in
commercially available analyzers with constant input voltage method. This is not perfect since when we
deal with a constant voltage, the piezoelectric materials tend to give large nonlinear elastic behavior ju st
around the resonance area. The issue is that amid the frequency sweep, there is a jump phenomenon on
voltage and current around the resonance. This jump phenomenon is because of the expanded elastic non-
linearity of piezoelectric material as the driving level (e.g. current) increments This issue can be overcome
by making estimations under consistent vibration velocity instead of constant voltage with an enhanced
equal circuit by embracing the proportionate constants for every vibration level. This method also
revealed the anti-resonance region in the frequency spectra.
The properties were calculated from the continuous admittance spectrum sweeping from slightly
below resonance frequency to slightly above the antiresonance frequency by keeping the vibration
velocity (i.e., constant stored mechanical energy). [30]
Mechanical quality factor at the resonance as well as antiresonance (QA and QB respectively) for
the k31 mode (fig. 3.2.1) was calculated based on the frequency difference between two frequencies
corresponding to the 3 dB below the admittance resonance peak and the impedance anti-resonance peak.
Taking narrow frequency range close to the resonance (fig. 2.2.2) and anti-resonance, we can define the
resonance quality factor (QA) and the anti-resonance quality factor (QB) as shown in equation (3.2.1). In
this research, the difference between two quality factors, QA and QB calculated at resonance and
antiresonance respectively was investigated.
𝑄𝐴,31 = 𝑓𝐴
𝑓1− 𝑓2 and 𝑄𝐵,31 =
𝑓𝐵
𝑓1− 𝑓2 (2.2.1)
where fA and f B are the resonance and antiresonance frequencies respecively; f1- f2 is the 3dB bandwidth.
15
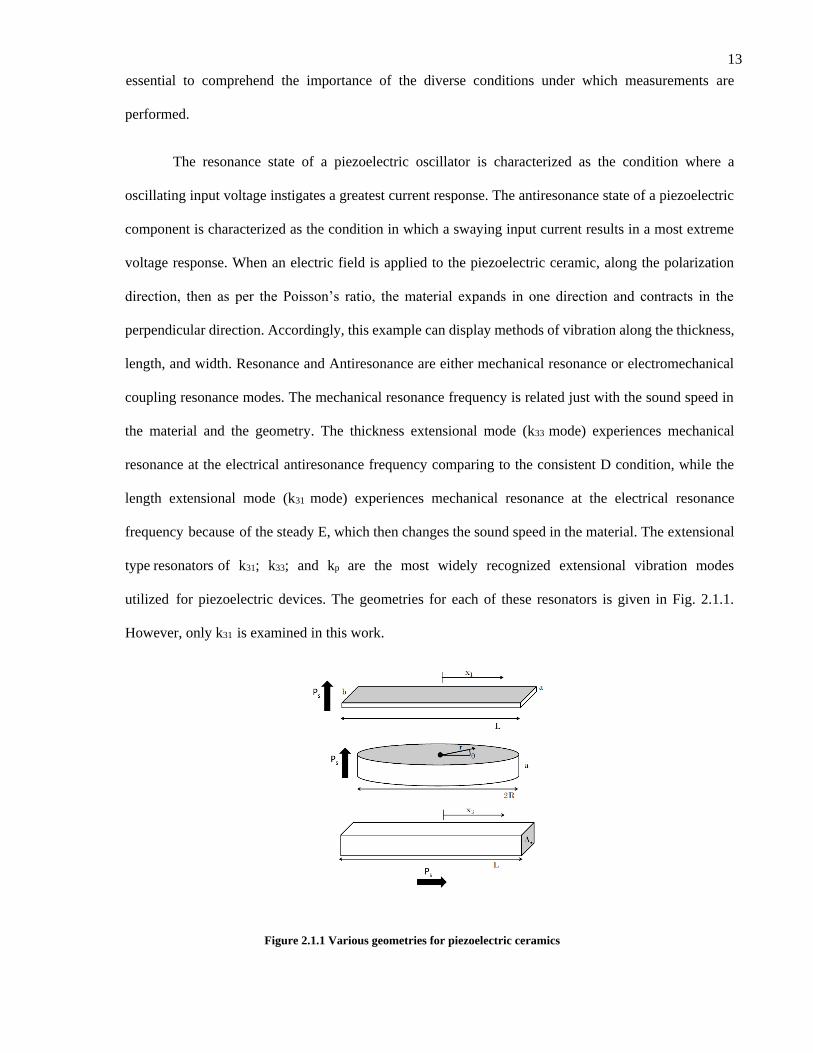
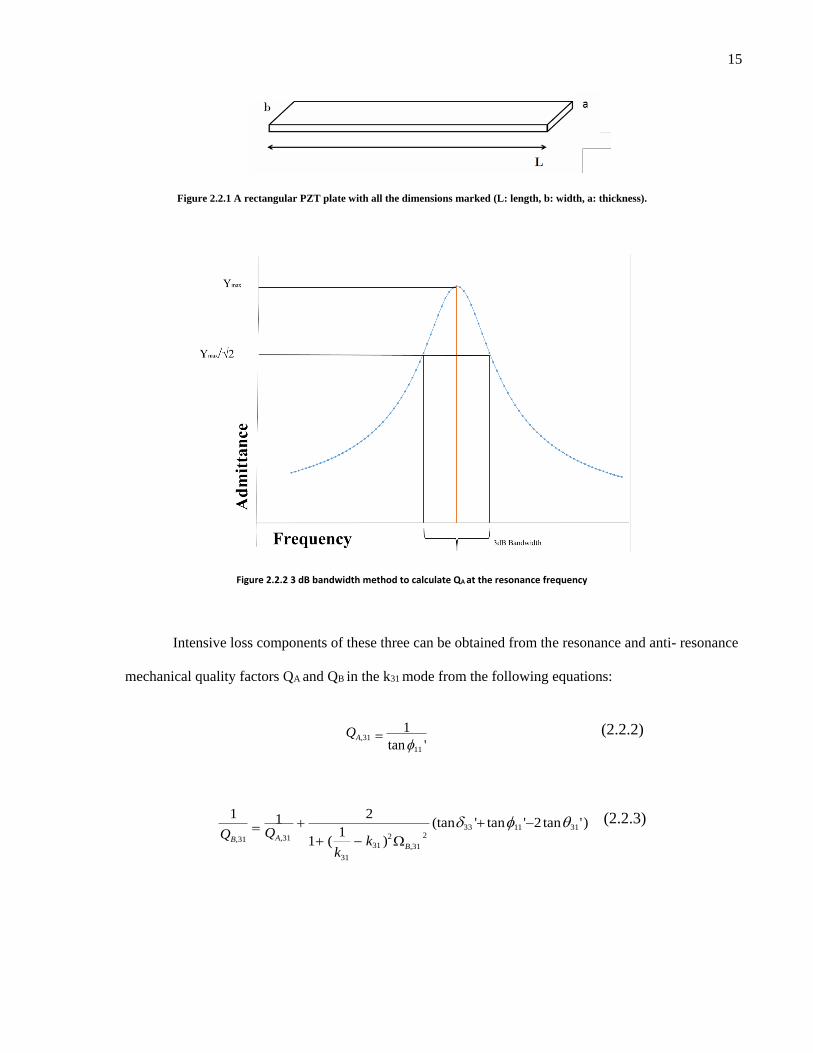
Figure 2.2.1 A rectangular PZT plate with all the dimensions marked (L: length, b: width, a: thickness).
Figure 2.2.2 3 dB bandwidth method to calculate QA at the resonance frequency
Intensive loss components of these three can be obtained from the resonance and anti- resonance
mechanical quality factors QA and QB in the k31 mode from the following equations:
QA,31 1
tan 11 ' (2.2.2)
1
QB,31
1
QA,31
1 (
1
k31
2
k31 )
B,31
(tan 33 ' tan 11 '2 tan 31 ' ) (2.2.3)
2 2

16
Here k31 is the electromechanical coupling factor, tanδ33’, tanϕ11’, tanθ31’ are loss factors for ε33T, s11
E,
d31, respectively. The parameter ΩB,31 is proportional to the anti-resonance frequency ωb:
E
bB
v
l
11
31,2
(2.2.4)
where v11E is the sound velocity of the material in the direction of length L, ρ is the density and is given by
𝑣11𝐸 = 1
√(𝜌𝑠11𝐸 )⁄ .
The elastic compliance 𝑠11𝐸 can be calculated from the resonance frequency as
𝑠11𝐸 = 1
((2𝐿𝑓𝐴)2𝜌⁄ (2.2.5)
The electromechanical coupling factor k31 is defined by:
)( 03311
2
312
31
XEs
dk (2.2.6)
where d31 is the piezoelectric constant, s11E is the elastic compliance at a constant electric field, ε33
T is the
free (unclamped) permittivity, ε0 is the permittivity in vacuum. Electromechanical coupling factor k31 can
be calculated from the resonance and antiresonance frequencies as
𝑘312 =
𝛱
2
𝑓𝐵𝑓𝐴
.tan(𝛱
2
𝑓𝐵−𝑓𝐴𝑓𝐴
)
1+𝛱
2
𝑓𝐵𝑓𝐴
.tan(𝛱
2
𝑓𝐵−𝑓𝐴𝑓𝐴
) (2.2.7)
Now, to obtain tan φ’, QA is measured and inverse value gives elastic loss. Then, knowing tan δ’ from
the LCR meter at the off-resonance frequency, evaluating QB, we can calculate tan θ’ using Eq. 2.2.3.
2.3 High Power Characterization
Dielectric and electromechanical properties of piezoelectric materials are typically reported
under low electric signal conditions. This is due to the ease of measurements with standard characterization
instruments (e.g. impedance analyzers and LCR meters). These instruments are usually
17
capable of making measurements between 0.5 Vrms/mm and 1 Vrms /mm. This type of characterization is
called low power electrical characterization due to its low excitation conditions. However, in reality,
piezoelectric devices face higher driving conditions (high power) at their service conditions. Particularly,
piezoelectric materials driven under resonance dissipate more and undistributed heat compared to the
ones driven under off-resonance. Furthermore, when high driving conditions meet with resonance
drive, substantial amount of heat is generated on the nodal point in the materials due to the increased losses.
Materials’ properties change when they are driven under high power levels. For example when the material
is under high driving levels (e.g. vibration level (v)), hysteresis loss tends to increase and the mechanical
quality factor (Qm) degrades accompanied by the temperature increase (ΔT). The temperature increase is
proportional to the driving level and above a certain level, temperature starts to increase in proportion to
the power. These relations lead the vibration amplitude to be the main figure of merit when high power
materials are studied. The less affected (less Qm degradation, less ΔT increase) by the higher vibration
amplitudes the material is, the better the high-power performance will be. Consequently, solely the low
power characterization is not sufficient to examine the piezoelectric materials’ properties because we
cannot observe the change in the piezoelectric properties as in the real working conditions. Subsequently,
a characterization technique should be developed to analyze the high power performance of the
piezoelectric ceramic. [24], [25]
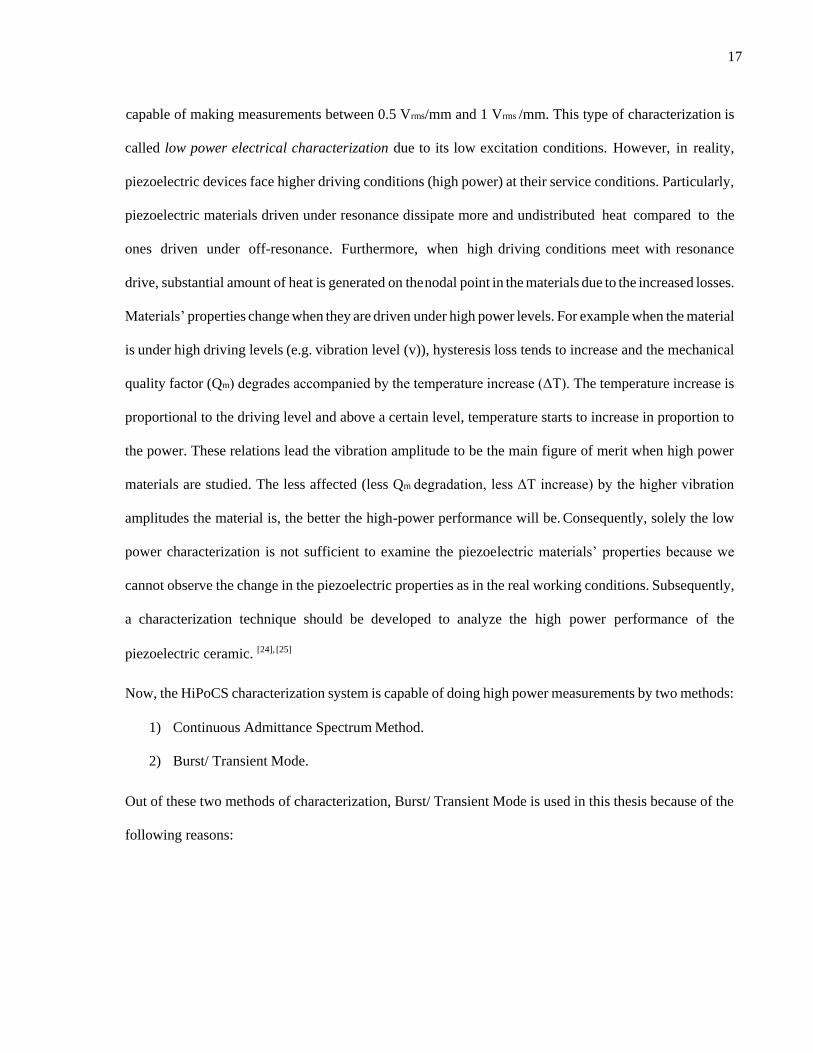
Now, the HiPoCS characterization system is capable of doing high power measurements by two methods:
1) Continuous Admittance Spectrum Method.
2) Burst/ Transient Mode.
Out of these two methods of characterization, Burst/ Transient Mode is used in this thesis because of the
following reasons:

18
Table 1 Table comparing two methods of characterization
Spectrum analysis is primary electrical excitation method, while the burst mode is mechanical
excitation method. Since we would like to eliminate the temperature rise effect in our scientific analysis
viewpoint, we adopted primarily the burst mode for high power characterization. However, from the
industrial/practical application viewpoint, there is some criticism on the burst mode, because this method
does not include practical temperature rise in the performance evaluation.
In the Burst Mode, the ceramic is initially electrically driven at its resonance (or antiresonance)
frequency for a small number of cycles (typically around 10 – 100 cycles) to excite the mechanical
vibration. [25] Because of the short period excitation (less than 1 ms), practical temperature rise does not
occur in the sample (less than 0.02°C) even under a high vibration excitation. Then, either a short or open
circuit condition is imposed after removing or isolating the excitation electric power. In this case, when
the sample oscillates at the resonance frequency and the short-circuit condition is imposed, rendered
current is proportional to the vibration velocity (i.e., the ratio provides Force Factor A). Whereas, when
an open-circuit condition is imposed, generated voltage is proportional to the vibration displacement (the
ratio provides Voltage Factor B), and the oscillation frequency is the antiresonance frequency. By
measuring the rate of signal decay, the quality factor at the resonance or antiresonance can be calculated
using the formula (Eq. 2.3.1):
𝑄 = 2𝜋𝑓
2 ln(𝑣1𝑣2
)
(𝑡2 − 𝑡1)
(2.3.1)
Where v1 and v2 are vibration velocity at two different decay time, t1 and t2 (typically with t2 - t1 = 1

19
– 3 vibration cycles). Very short measuring time (~5 sec) for obtaining full physical parameters (via
LabView software) as a function of vibration velocity under the short- or open-circuit condition is an
additional attractive point in the burst mode method.
We summarize here how to determine the “real” parameters, dielectric permittivity, elastic
compliance and piezoelectric constant from the burst method in the case of a k31 plate as shown in fig.
2.2.1. Here, L is the length, b, the width and a, the height of the PZT ceramic plate. The force factor A31 is
calculated as the ratio of the short-circuit current i0 over the vibration velocity v0 at the plate length edge
in the resonance, and is given by Eq. (2.3.2).
𝐴31 = 𝑖0
𝑣0= −2𝑏
𝑑31
𝑠11𝐸 (2.3.2)
While, the voltage factor B31 is the relationship between the open-circuit voltage and displacement at the
plate length edge at the antiresonance, expressed by Eq. 2.3.3).
𝐵31 = 𝑉0
𝑢0 =
2𝑎
𝐿
𝑑31
𝑠11𝐸 𝜀0𝜀33
𝑥 . (2.3.3)
It is important to note that we can obtain longitudinally-clamped permittivity 휀33𝑥 휀0 (effective
damped permittivity) at the resonance-antiresonance frequency range (not at the off-resonance) from the
ratio of the force factor A31 over the voltage factor B31 in the following formula (Eq. 2.3.4):
휀0휀33𝑋 (1 − 𝑘31
2) = 휀0휀33𝑥 =
𝐴31
𝐵31
𝑎
𝐿𝑏 (2.3.4)
Thus, free permittivity 휀33𝑋 can be calculated from the relationship with the electromechanical
coupling factor. The determination of the permittivity at the resonance frequency is another attractive point
of the burst method. Note that the burst mode measurement is not associated with heat generation
(temperature rise can be estimated less than 0.02°C) even under very high vibration velocity. [26]

20
Figure 3.3.1 Conditions for Burst Mode (a) Short circuit (b) Open circuit
21
Chapter 3
Motivation
This thesis aims to give comprehensive understanding of loss behavior mechanisms in the
piezoelectric ceramics under externally applied DC Bias field at low (0.5-1 Vrms/mm) as well as high
power conditions (>1Vrms/mm). It also gives a comparative analysis between ‘hard’ and ‘soft’ PZT’s and
contrast the response to the externally applied electric field of the two.
Piezoelectric materials such as Lead-Zirconate Titanates [Pb(ZrxTi1−x)O3, PZT’s] have been
widely adopted for many applications such as underwater sonars, motors, and piezoelectric transformers.
They have widely been contemplated and possess excellent piezoelectric properties. Modifications of
PZT are widely commercialized for various applications. That is the reason PZT has commanded the
piezoelectric applications since its revelation in the 1950s. A lot of research has been performed to
measure losses in different modes. Yet, there has been an almost no exploration on the effect of external
mechanical or external boundary conditions. Even though material constants for piezoelectric ceramics
are generally depicted under free conditions, these measured properties are not valid when devices work
under externally applied mechanical or electrical loads. The properties of these materials are obligated to
the conditions in which they are associated. Along these lines, a basic purpose of examination right now
is the lead/conduct of these ceramics under different conditions. DC Bias stress and electric field are of
particular importance for study because the actuators and transducers are often used as a part of these
conditions to balance out or improve the operation performance.

22
Regarding the bias electric field effect, previous reports clarified the stabilization mechanism of
the high power performance in “Hard” Pb(Zr,Ti)O3 (PZT)-based ceramics in terms of the “internal” bias
field. As shown in Fig. 3.1(a), the mechanical quality factor Qm in the hard PZT increases rather gradually
after the electric poling process (~2 hours) to reach to the value higher than 1000, while the soft PZT
does not change the Qm value with time lapse. Also, the polarization versus electric field hysteresis curve
change with the time lapse, where the internal “positive” electric field is created in an “aged” sample [Fig.
3.1(b)]. Accordingly, we proposed that the high Qm is primarily triggered by the “internal” bias field,
which may be attributed to the defect dipoles originated from a slow rate of oxygen ion diffusion after the
poling. To further explore the loss mechanism in PZT’s, instead of the “internal” bias field in hard PZT,
we studied the “external” bias field effect in both hard and soft PZT’s in this thesis.
Figure 3.1 (a) Qm as a function of time for different PZTs & P-E hysteretic response for hard PZT at different time
intervals; (b) Hysteresis curve shape change with time, showing the internal bias field generation.
Likewise, piezoelectric material’s properties are typically reported at low excitation conditions
(0.5-1 Vrms/mm). Piezoelectric ceramics behave distinctively when they are excited at high levels. High
excitation conditions cause piezoelectric ceramics to build their temperature (self-

23
heating) due to the increased losses particularly when they are driven under resonance conditions. This
phenomenon becomes very critical when piezoelectric ceramics are continuously used in high power
applications such as sonars, medical (e.g. therapeutic) ultrasound and piezoelectric transformers.
Therefore, there is a definite requirement for understanding piezoelectric ceramics’ high power
characteristics to anticipate their actual performance in an application.
Different from the previous studies, this research aims at developing the loss mechanisms in
piezoelectric ceramics in the k31 mode based on the experimental method of determining losses from the
continuous admittance spectrum analysis. Moreover, this study extends over loss dependence on the form
factors (k31 mode) in ‘hard’ and ‘soft’ piezoelectric ceramics. In addition, the study is extended to perform
high power characterization apart from the low power studies. Although low power characterization
techniques are favored in light of the fact that they are speedy and permit simple perception of desired
electrical properties of the material. In actuality, piezoelectric devices confront higher driving conditions
(high power) at their operating conditions. Materials' properties change when they are driven under high
power levels. Therefore, this work will reflect the magnitude of difference in the properties and
performance of the piezoelectric device under low and high power conditions.

24
33
Chapter 4
Experimental Procedures
4.1 Sample Selection
We used PIC 144 and PIC 255 as hard and soft PZT’s, respectively, in this study. These PZT ceramic
plates were prepared in the R&D Department, PI Ceramic GmbH (Lindenstrasse, 07589 Lederhose,
Germany). All the plate samples (5pieces for each) with size of 40mm long x 5 mm wide x 0.5 mm thick
were silver-electroded on 40 mm x 5 mm face. Hard PZT was electrically poled at 800C for 6 hours
whereas soft PZT was electrically poled at 70˚C for 10 hours along the thickness in 0.5 mm.
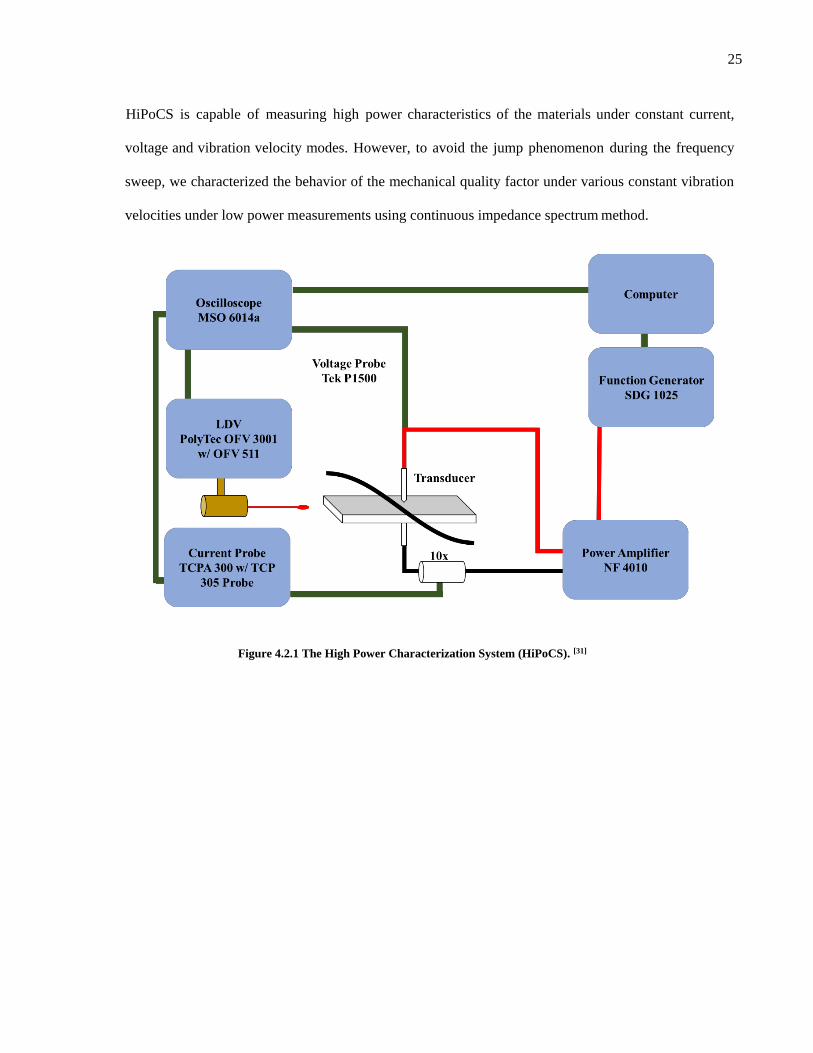
4.2 Electrical Characterization System
High power characteristics of the PZT rectangular plates were measured by a high-power
characterization system (HiPoCS), which was developed by our group (Fig. 4.2.1). An amplitude
controlled sinusoidal signal was produced by a function generator (HP 33120A) and amplified (NF 4010).
The sample current was detected by a clamp-on AC current sensor (Tektronix TCP 305). The voltage,
current and displacement waveforms of the piezoelectric disks/transformers were monitored by two
digitizing oscilloscopes (Tektronix TDS 29 3014B) and logged by a personal computer using a software
interference (LabVIEW®). The temperature on the sample’s nodal point was measured by an infrared spot
thermometer (Hioki 3445). [28], [29] In parallel, the permittivity 휀𝑇 was measured at 1 kHz (off-resonance)
by an LCR meter [SR715, Stanford Research Systems, Inc., Sunnyvale, CA]. Also, DC Bias field was
applied externally using an external amplifier. Here, the bias field direction is denoted “positive” when
the field is applied along the polarization direction. The range of the externally applied DC bias field
varies from -160 to +320V/mm (less than 1/4 of the coercive field). Vibration amplitudes on the edge of
the piezoelectric rectangular plates was measured with laser interferometer (Polytec OFV 511). The
25
HiPoCS is capable of measuring high power characteristics of the materials under constant current,
voltage and vibration velocity modes. However, to avoid the jump phenomenon during the frequency
sweep, we characterized the behavior of the mechanical quality factor under various constant vibration
velocities under low power measurements using continuous impedance spectrum method.
Figure 4.2.1 The High Power Characterization System (HiPoCS). [31]

26
Chapter 5
Experimental Results
At first, P-E loop measurements were performed for both the hard as well as soft PZT’s. Figure
5.1. 1 shows the polarization versus electric field hysteresis curves at 10 Hz for hard (PIC 144) and so ft
(PIC 255)PZT’s (roughly 10 weeks aged). In comparison with a symmetric curve for the soft PZ T, we
observed a positively biased hysteresis (Ebias≈ 700 V/mm) curve in the hard PZT sample which verified
the earlier argument about internal DC bias field already present in the hard PZT piezoelectric ceramics.
The derivative of the P-E curve provides permittivity at a low frequency of 10 Hz, which is inserted in
Fig. 5.2.1 and discussed later.
Figure 5.1 P-E hysteresis loop for hard and soft PZT’s

27
5.1 High Power Measurements without DC Bias Field
At first, high power measurements were performed without applying external DC bias to evaluate
the change of material’s properties with the vibration velocity itself (no influence of external DC bias
field). These measurements were performed using the Burst mode again.
5.1.1 Elastic Compliance and Elastic Loss
Figure 5.1.1 shows the elastic compliance change with the vibration velocity calculated from the
resonance frequency (from Eq. (3.2.5)), measured for the hard (PIC 144) and soft (PIC
255) PZT’s. Both samples exhibit a nearly linear compliance increase, where the change rate (3% per 0.1
m/s) for the hard PZT is less than the rate (5% per 0.1 m/s) for the soft PZT.
Figure 5.1.1 Elastic compliance change with vibration velocity under zero DC Bias
Figure 5.1.2(a) and 5.1.2(b) shows the quality factors at the A type resonance QA and at the B type
resonance (i.e., antiresonance) QB under zero DC Bias for the hard PZT (PIC 144) and soft PZT (PIC
255) samples, respectively (Eq. (3.2.1)). QB is always larger than QA in both hard and
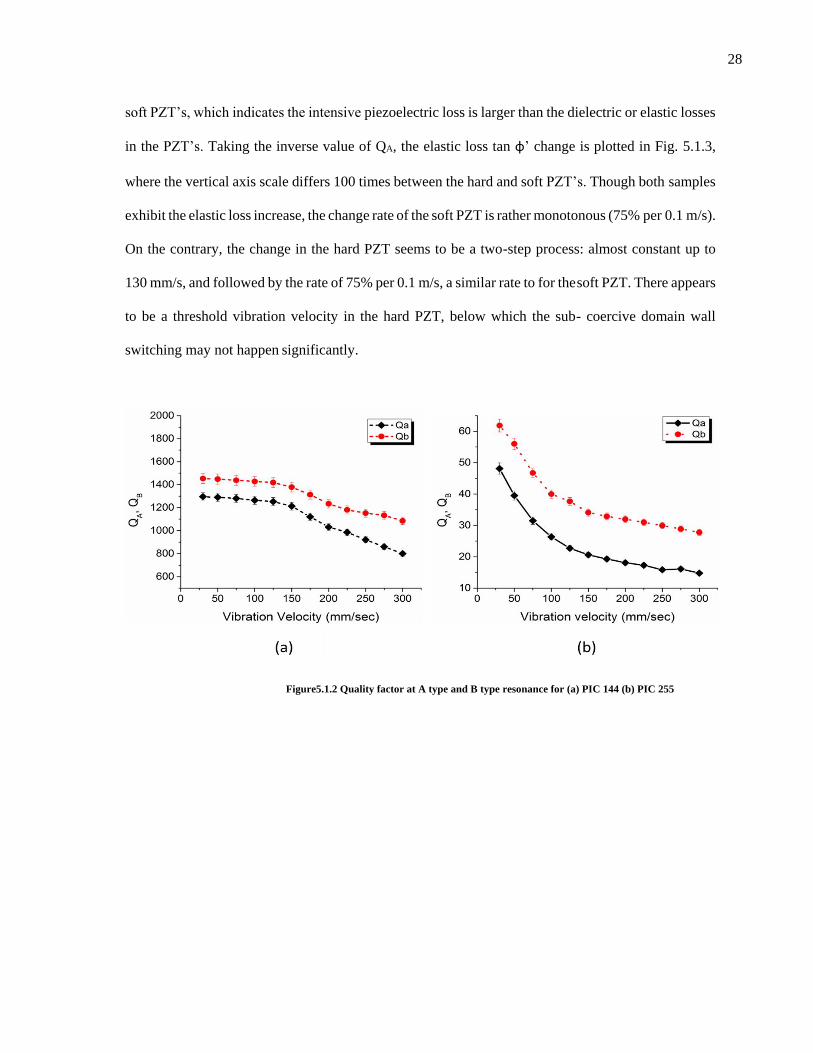
28
soft PZT’s, which indicates the intensive piezoelectric loss is larger than the dielectric or elastic losses
in the PZT’s. Taking the inverse value of QA, the elastic loss tan φ’ change is plotted in Fig. 5.1.3,
where the vertical axis scale differs 100 times between the hard and soft PZT’s. Though both samples
exhibit the elastic loss increase, the change rate of the soft PZT is rather monotonous (75% per 0.1 m/s).
On the contrary, the change in the hard PZT seems to be a two-step process: almost constant up to
130 mm/s, and followed by the rate of 75% per 0.1 m/s, a similar rate to for the soft PZT. There appears
to be a threshold vibration velocity in the hard PZT, below which the sub- coercive domain wall
switching may not happen significantly.
Figure5.1.2 Quality factor at A type and B type resonance for (a) PIC 144 (b) PIC 255

29
Figure 5.1.3 Elastic loss under zero DC Bias
5.1.2 Dielectric Permittivity
The dielectric permittivity at high power conditions was determined from Eqs. 3.3.3 and 3.3.4.
Figure 5.1.4 shows longitudinally clamped (or effective damped) permittivity 휀33𝑥 and free permittivity
휀33𝑇 (calculated from the relation 휀33
𝑥 =휀33𝑇 (1 – k31
2) with the k31 value obtained in the next section) as a
function of vibration velocity for the both soft and hard PZT’s. For comparison, 휀33𝑇 measured at 1 kHz
(off-resonance) by LCR meter is also plotted. It was observed that the calculated permittivity 휀33𝑇 at the
resonance (high frequency) is slightly lower than the one at the off-resonance 1 kHz, which is probably
related to the general frequency dependence of the permittivity, supported by the 휀33𝑇 values of 1230
(Hard) and 1610 (Soft) at 10 Hz in Fig. 5.2.1. It is noteworthy that the clamped permittivity 휀33𝑥 also
shows the increase with an increase in vibration velocity, which may be explained by the fact that this
“clamp” does not mean complete clamp, but just 1D longitudinal clamp. However, since we have not
established the method yet for obtaining the dielectric loss at the resonance frequency, this paper adopts
tan δ’ = 0.002 and 0.027 at the off-resonance (1kHz) for the hard and soft PZT’s, respectively, for the
loss analysis described below.

30
Figure 5.1.4 Relative Permittivity at zero DC Bias under high power conditions
5.1.3 Piezoelectric Constant and Piezoelectric Loss
Figure 5.1.5(a) and 5.1.5(b) shows the electromechanical coupling factor k31 and piezoelectric
constant d31 change with vibration velocity for the hard and soft PZT’s. The electromechanical coupling
factor for both samples increased, the change rate (3.5% per 0.1 m/s) for the hard PZT is less than the
rate (5.3% per 0.1 m/s) for the soft PZT. Also, the piezoelectric constant increased with increasing
vibration velocity. The change rate was lower for the hard PZT (2.7% per 0.1m/s) than the soft PZT
(5.1% per 0.1 m/sec).

31
Figure 5.1.5 (a) Electromechanical coupling factor under zero DC Bias (b) Piezoelectric constant under zero DC
Bias
The intensive piezoelectric loss was determined from the mechanical quality factors QA and
plotted in Fig. 5.1.6. Note the vertical scale difference of 10 times between the hard and soft PZT’s.
The piezoelectric loss increases in general with vibration velocity. However, the change ratio is
different. The piezoelectric loss increased by a very small factor for the hard PZT (20% per 0.1m/s)
than the soft PZT (70% per 0.1m/s), which is one order of magnitude larger than the dielectric and
elastic loss variation rates. It is important to note that the piezoelectric loss tan θ’ increases almost
linearly with vibration velocity, but there seems to be two steps in the change of mechanical loss tan
φ’ in the case of hard PZT: almost constant up to 130 mm/s, and followed by the rate of 75% per 0.1
m/s, similar rate to the soft PZT. This reason is under consideration from the domain dynamics
viewpoint.

32
Figure 5.1.6 Piezoelectric loss under zero DC Bias
5.2 Low Power Measurements
As explained in Chapter 3 in detail, low power measurements (driving at a very small vibration
velocity) were performed under externally applied DC bias field. DC bias field was varied from -160V/mm
to +320V/mm using an external amplifier. The measurements were performed using Continuous
Admittance spectrum method utilizing HiPoCS system. Also, the properties and the losses were
calculated utilizing the formulae discussed in Chapter 3 for this specific technique.
Though the low power measurements under external DC bias field have been reported by several
researchers, we performed similar experiments on the hard and soft PZT’s to perform a comparative
study between low and high power measurements. Since the vibration velocity was
33
less than 30 mm/sec, we did not observe the heat generation more than 1°C even at the resonance
frequency range for both hard and soft PZT’s.
5.2.1 Dielectric Permittivity & Dielectric Loss
Figure 5.2.1 (a) and 5.2.1(b) shows the dielectric permittivity and dielectric loss measured with
the LCR meter at an off-resonance frequency of 1kHz (much lower than the resonance frequency ~40
kHz). As it can be seen from Fig. 5.2.1, the dielectric constant change was - 0.8% for the hard PZT and -
1.7% per 100 V/mm for the soft PZT for a positive bias field and 0.5% for hard PZT and 1.2% for soft
PZT in the case of a negative bias field. Also, the dielectric constant change was - 0.8% for the hard PZT
and - 1.7% per 100 V/mm for the soft PZT. As a reference, permittivity at 10 Hz as a function of DC bias
field is plotted, calculated from the derivative of the P-E hysteresis curve shown in fig. 5.2.1. The
dielectric permittivity at 10 Hz is larger than that at 1 kHz in both the hard and soft PZT’s, which mainly
caused by the different measuring methods, but a frequency dependency of the permittivity cannot be
excluded at the moment. The dielectric permittivity at 10 Hz is larger than that at 1 kHz in both the hard
and soft PZT’s, which suggests the frequency dependency of the permittivity. In this low frequency
permittivity, however, a steeper bend seems to happen around 200 V/mm and 100 V/mm for the hard and
soft PZT’s, which may indicate a sort of threshold of the domain wall dynamics, suggesting a two-step
mechanism in terms of the DC bias field. The intensive dielectric loss tan δ’ (note one order of magnitude
difference between the hard and soft PZT’s) shows a decreasing tendency with DC bias field with a
similar bend around 200 V/mm. Though both samples did not exhibit significant dielectric loss decrease,
the change rate (- 0.4% per 100 V/mm) of the hard PZT is less than the rate (- 1.5% per 100 V/mm) of the
soft PZT.

34
Figure 5.2.1 Dielectric permittivity and the corresponding loss at 1kHz frequency for (a) Hard PZT (b) Soft PZT.
5.2.2 Elastic Compliance and Elastic Loss
Admittance spectrum method was adopted for measuring low power properties under an external
electric field. High power admittance spectrum under an external field is still under consideration,
because of the serious heat generation around the resonance/antiresonance region, which restricts the
accurate Qm determination. Figure 5.2.2 shows A type resonance and B type resonance (i.e.,
antiresonance) frequency changes with the DC bias field. Both frequencies increase monotonously with
the DC field. Note that the frequency difference Δf = fB– fA does not change significantly, which results
in almost constant value of electromechanical coupling factor k31 (the change within the error bar in Fig.
5.2.3). The increase in the resonance frequency by around 1.5% for both the hard and soft PZT’s was
observed with increasing DC bias field, which leads to the dependence of the elastic compliance in Fig.
5.2.4 for the hard (a) and the soft PZT’s (b). The % change in elastic compliance was - 0.7% per 100
V/mm for the hard PZT, in comparison to - 1.7% for the soft PZT for positive bias field and 0.5% for hard
PZT and 1.4% for soft PZT in the case of negative bias field. The elastic compliance decrease with the
positive DC bias field indicates that
35
the PZT ceramics gets hardened as the DC Bias field is applied whereas effect of negative DC bias
field is completely opposite.
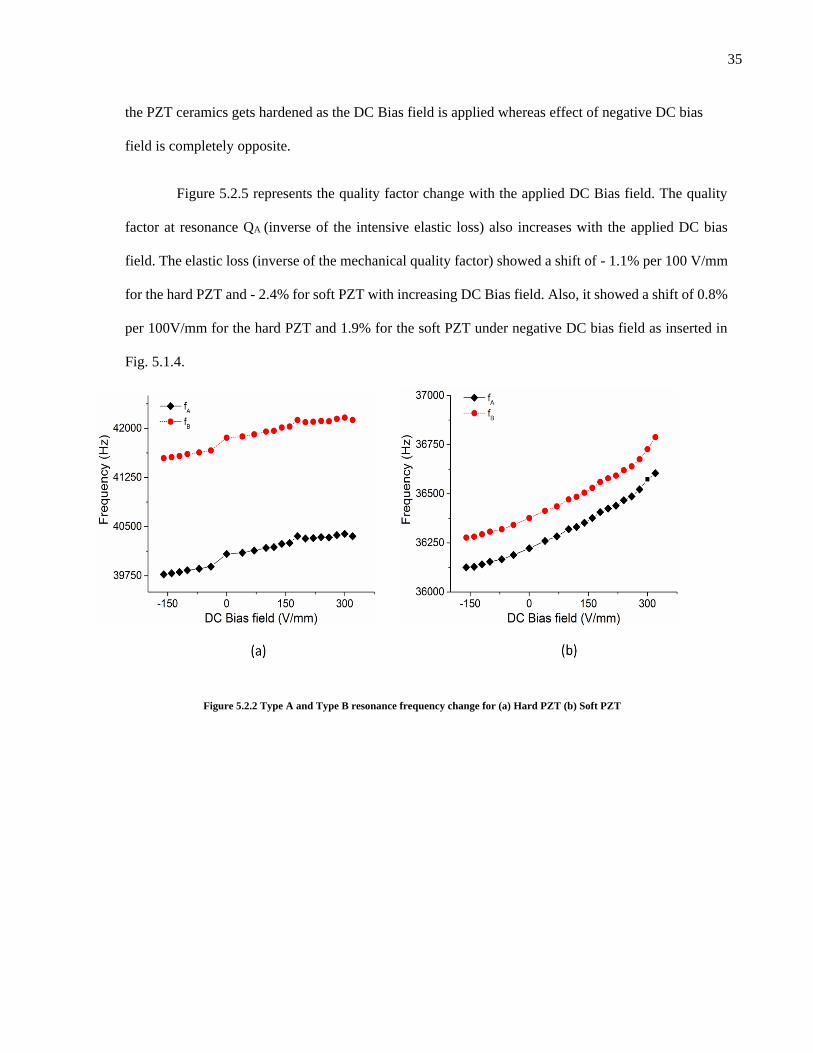
Figure 5.2.5 represents the quality factor change with the applied DC Bias field. The quality
factor at resonance QA (inverse of the intensive elastic loss) also increases with the applied DC bias
field. The elastic loss (inverse of the mechanical quality factor) showed a shift of - 1.1% per 100 V/mm
for the hard PZT and - 2.4% for soft PZT with increasing DC Bias field. Also, it showed a shift of 0.8%
per 100V/mm for the hard PZT and 1.9% for the soft PZT under negative DC bias field as inserted in
Fig. 5.1.4.
Figure 5.2.2 Type A and Type B resonance frequency change for (a) Hard PZT (b) Soft PZT

36
Figure 5.2.3 Electromechanical Coupling factor variation with the applied DC Bias field
Figure 5.2.4 Elastic compliance and the corresponding loss for (a) Hard PZT (b) Soft PZT.

37
Figure 5.2.5 Quality factor variation at fA and fB with applied DC bias field for (a) Hard PZT (b) Soft PZT
5.2.3 Piezoelectric Constant and Piezoelectric Loss
In addition to the quality factor QA at the resonance condition, mechanical quality factor QB was
also measured at the anti-resonance condition under DC bias field and plotted in Fig. 5.2.5. Thus, the
piezoelectric constant and loss were determined from Eq. (5) as a function of the DC bias field (Fig. 5.2.6).
The piezoelectric constant decrease for the hard PZT (- 1% per 100 V/mm) was less than for the soft PZT
(- 1.5% per 100 V/mm) under a positive DC bias field. Also, apart from the real parameter, piezoelectric
loss change of the hard PZT was again smaller (- 1.9% per 100 V/mm) for the hard PZT as compared to
the soft PZT (- 3.1%). For negative DC bias field, the piezoelectric constant increase for the hard PZT
(0.7% per 100 V/mm) was less than for the soft PZT (1.2% per 100 V/mm). Apart from that, piezoelectric
loss change of the hard PZT was again smaller (1.5% per 100 V/mm) for the hard PZT as compared to the
soft PZT (2.8% per 100V/mm). Also, it has been shown here that piezoelectric complex decreases with
positive DC bias field which is just exactly opposite to the effect of negative DC Bias field.

38
Figure 5.2.6 Variation of Piezoelectric complex with applied DC bias field for (a) Hard PZT (b) Soft PZT
5.3 High Power Measurements under DC Bias Field
High power measurements were conducted under externally applied DC bias field using the
burst mode. Because the open-circuit burst drive was not available (external DC bias effect cannot
be measured), only the short-circuit (under a constant Ebias) burst drive could be achieved. The elastic
compliance, as well as the elastic loss for both samples were measured as a function of vibration
velocities at various levels of externally applied DC bias field. Figures 5.3.1 and 5.3.2 shows
respective two graphs demonstrating the variation of the elastic properties and the elastic loss tan φ’
for the hard and soft PZT’s. Positive DC bias field provided a decrease in both elastic compliance
and loss. The % elastic loss decrease per 100 V/mm was noted to be - 2.5% for the hard PZT, whereas
- 3.0% for the soft PZT under 30 mm/sec, which significantly increased - 3.5% for the hard and -
4.2% for the soft under 300 mm/sec. More precisely, the decrease rate is enhanced as the vibration
velocity is increased for both the hard and soft PZT’s. The elastic compliance

39
increased with the rate of 2.9% for the hard PZT and 4.8% per 100 mm/sec for the soft PZT at a small
DC bias field of 50 V/mm., while, as the DC bias field was increased to 300 V/mm, the % decrease in
elastic compliance per 100 mm/sec was - 0.7% for the hard PZT and - 1.7% for the soft PZT. The %
elastic loss decrease per 100 V/mm was noted to be - 2.5% for the hard PZT whereas
- 3.0% for the soft PZT under 30 mm/sec, which are significantly enhanced to - 3.5% for the hard and -
4.2% for the soft under 300 mm/sec.
Likewise, it turns out to be essential to consider that negative DC bias field gives very nearly
an equivalent and inverse change in the change of properties. It means that both elastic compliance and
loss decreases with positive DC bias field which is just exactly opposite to the effect of negative DC
Bias field. In conclusion, the external DC bias field affects more drastically to stabilize the high-power
vibration excitation in the case of a positive bias field and destabilizes in the case of a negative bias
field. Regarding the antiresonance measurement for determining the piezoelectric and dielectric losses,
we will report an alternative way in successive papers.
Figure 5.3.1 High power properties for hard PZT (a) Elastic compliances (b) Elastic loss

40
Figure 5.3.2 High power properties for soft PZT (a) Elastic compliance (b) Elastic lo

41
Chapter 6
Discussions and Summary
In this thesis, the dependency of dielectric, elastic and piezoelectric coefficients (real parameters
and imaginary losses) on the vibration velocity and DC bias field comprehensibly was studied. Note that as
the piezoelectric ceramic is driven at a high vibration velocity, introducing AC stress is intoduced in the
material. Table 1 summarizes the material’s coefficients change with the vibration velocity and DC electric
field. Note that these results are not associated with any temperature rise during the measurements. It has
been found that with the vibration velocity increase, the dielectric constant, elastic compliance,
piezoelectric coefficient, and their corresponding losses increase for both the hard and soft PZT’s. However,
the change is more pronounced in the soft PZT as compared to the hard PZT. To the contrary the influence
of a DC bias field depends strongly of the direction of the field with respect to the original poling field. A
positive DC bias electric field affects in a way, that is, decrease in the dielectric constant, elastic compliance,
piezoelectric coefficient and their corresponding losses, whereas a negative DC bias field affects in an
completely opposite way. The decrease rate of these physical parameters under small vibration level is
enhanced under large vibration level, as shown in the third column in Table 1. This situation can be
visualized in the 3D plot in Fig. 18, showing the dependence of elastic loss tan φ’ on the externally applied
DC bias field and the vibration velocity at the k31 sample length edge in the hard (PIC 144) and soft (PIC
255) PZT. In comparison with a relatively smooth plane contour for the soft PZT, a clear bend on the
contour plane is observed for the hard PZT. We can find the intensive elastic loss tan φ’ shows two different
trends under vibration velocity and DC bias field; increase with the vibration velocity (domain wall
destabilization) and decrease with positive DC bias field (domain wall stabilization). Roughly speaking,
the vibration velocity 100 mm/s (+3% and

42
5% change in s11E for the hard and soft PZT’s) exhibits the almost equivalent “opposite” change rate (‒1.7% ×
2 and ‒2.3% × 2 change in s11E for the hard and soft PZT’s) of 200 V/m DC electric field.
This equivalency can be understood roughly as follows. Like the off-resonance analysis in Ref. 20, the
external stress X1 is roughly estimated with the external electric field E3 by
X1 = (d31/s11E )E3 (6.1)
Conversely, the electric field induced by the stress is estimated by
E3 = (d31/ε0ε33X )X1. (or X1 = (ε0ε33
X /d31)E3) (6.2)
Since the electromechanical coupling factor d31
√ε0ε33X s11
E is not equal to 1, d31/s11
E ≠ ε0ε33X /d31. Thus, we adopt a
geometric average relationship for evaluating the equivalency:
X1 = ‒ √ε0ε33
X
s11E E3 (6.3)
The sign “‒” stands for the opposite effect owing to the transversal piezoelectric effect (i.e., d31 < 0). We may
extend this relationship at the resonance by multiplying the mechanical quality factor Qm:
| X1 | = Qm √ε0ε33
X
s11E |E3 | (6.5)
Using practical values for the hard PZT (s11E = 12 x 10-12, ε33
X = 1100 and Qm = 1200) and E3 = 200 V/m, X1
becomes 6.8 x 10⁶ N/m2. On the other hand, the relation between the maximum X1,rms (at the k31 plate sample
center) and vibration velocity v1,rms (at the sample edge) is given by[19]
X1,rms = √ρ
s11E v1,rms (6.6)
Using practical values for the hard PZT (ρ = 7.5 x 10³ and s11E = 12 x 10-12) again, v1,rms = 100 mm/s
43
provides X1,rms = 2.5 x 10⁶ N/m2 or X1,peak = 4.0 x 10⁶ N/m2, which shows a reasonable agreement (in the same
order) with the value estimated by Eq. (6.4).
Another noteworthy point is the two-step mechanisms observed in the hard PZT: a bend of the slope
can be observed in the elastic loss tan φ’ on the vibration velocity change, while a bend of the slope in the
dielectric constant 휀33𝑋 and dielectric loss tan δ’ is observed on the DC bias field change. This may suggest a
sort of threshold value in terms of mechanical stress or electrical field in the hard PZT for
stabilizing/destabilizing the domain wall motions. This may suggest a sort of domain stabilization threshold,
and the detailed analysis of the results will be reported in successive papers.

44
Figure 6.1 3D plot showing the variation of elastic loss for PZT's as a function of DC Bias field and vibration
velocity for (a) Hard PZT (b) Soft PZT
(a)
(b)
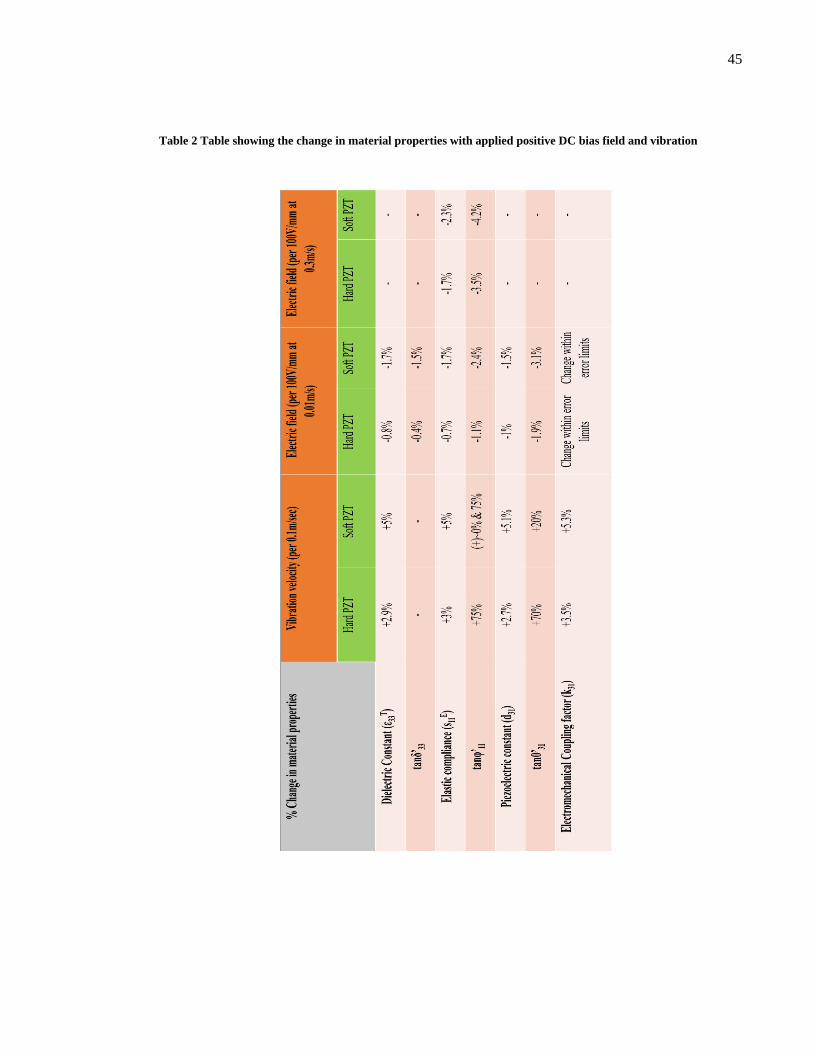
45
Table 2 Table showing the change in material properties with applied positive DC bias field and vibration

46
Chapter 7
Future Research Topics
Piezoelectric ceramics such as Lead-Zirconia Titanates [Pb(ZrxTi1−x)O3, PZT’s] have continued
to dominate the market for a very long time now owing to its excellent properties and enormous
application such as ultrasonic transducers, actuators, sensors etc. However, properties and performance
of the device depends on the application it is being used in. Therefore, there is a critical need to measure
the properties of the piezoelectric ceramic under different external electrical and mechanical boundary
conditions. This thesis showed the effect of externally applied DC bias field (one of electrical boundary
conditions) on the properties. Apart from this boundary condition, there is another major boundary
condition which needs immediate analysis. Langevin transducer, one of the most used transducer, works
under externally applied stress. This external boundary conditions must largely change the performance
of the device. There is still less understanding on the effect of mechanical boundary conditions on the
properties of piezoelectric ceramics and could be one of the future works to do.
The effect of the temperature on the high power performance can also be investigated by using
the burst mode at different temperatures. These possible advances would create a better understanding of
high power characteristics of the piezoelectric materials. Therefore, extra modifications can be done in
the existing piezoelectric material systems to enhance high power characteristics.

47
Domain wall study of the piezoelectric ceramics under different externally applied electrical or
mechanical boundary conditions is also another interesting area to be worked to understand the physical
phenomenon of the loss behavior.

48
Bibliography
[1] Lu, Chao, and Alvin Warren Czanderna, eds. Applications of piezoelectric quartz crystal
microbalances. Vol. 7. Elsevier, 2012.
[2] Munn, R. W. "Thermodynamic and physical properties of solids in electric fields." Journal of
Physics C: Solid State Physics 6.22 (1973): 3213.
[3] Rodel, W. Jo, K. T. Seifert, E. M. Anton, and T. Granzow: J. Am. Ceram. Soc. 92 (2009)
yang1153.
[4] C. Kittel: Introduction to Solid State Physics (John Wiley & Sons, Inc., Hoboken, 2005) 8th
ed.
[5] K. Uchino, Ferroelectric Devices (CRC Presss, 2000)
[6] K. Uchino, J. Zheng, Y. H. Chen, X. Du, S. Hirose, and S. Takahashi: IEEE Trans. UFFC 48
(2001).
[7] P. Home, T. Teaching, and C. Woodford, “Piezoelectricity,” pp. 1–7, 2016.
[8] D. Wang, J. S. Chen, "Progress on the Applications of Piezoelectric Materials in Sensors",
Materials Science Forum, Vol. 848, pp. 749-756, 2016.
[9] H.N. Shekhani, K. Uchino, “Characterization of Mechanical Loss in Piezoelectric Materials
Using Temperature & Vibration Measurements,” J. of American Ceramic Society, vol. 97, pp.
2810–2814, 2014.
[10] T. Ikeda: Fundamentals of Piezoelectricity (Oxford University Press, 1990).
[11] “Dielectric, elastic and Piezoelectric losses in Piezoelectric Materials; Gordon E. Martin Naval
Undersea Center San Diego, California, 92132,” 1954.
[12] A. M. Bolkisev, V. L. Karlash, and N. A. Shul, “Temperature Dependence of the properties of
piezoelectric ceramics,” Soviet Applied Mechanics 20.7 (1984): 650-653.
[13] D. Damjanovic, “Materials for high temperature piezoelectric transducers,” Curr. Opin. Solid
State Mater. Sci., vol. 3, no. 5, pp. 469–473, 1998.

49
[14] K. Uchino, “Materials issues in design and performance of piezoelectric actuators: an overview,”
Acta Mater., vol. 46, no. 11, pp. 3745–3753, 1998.
[15] H. N. Shekhani and K. Uchino, “Evaluation of the mechanical quality factor under high power
conditions in piezoelectric ceramics from electrical power,” J. Eur. Ceram. Soc., vol. 35, no. 2,
pp. 541–544, 2015.
[16] H. N. Shekhani, E. A. Gurdal, S. O. Ural, and K. Uchino, “Analysis of High Power Behavior in
Piezoelectric Ceramics from a Mechanical Energy Density Perspective,” ArXiv ID: 1605.06685.
[17] B. Li, G. Li, S. Zhao, L. Zhang, and A. Ding, “Characterization of the high-power piezoelectric
properties of PMnN–PZT ceramics using constant voltage and pulse drive methods,” J. Phys. D.
Appl. Phys., vol. 38, no. 13, pp. 2265–2270, 2005.
[18] B. Fu, T. Li, and Y. Xie, “Model-based diagnosis for pre-stress of langevin transducers,”
2009 IEEE Circuits Syst. Int. Conf. Test. Diagnosis, ICTD’09, pp. 1–4, 2009.
[19] K. Adachi et al., “Development of Bolt-Clamped Langevin-Type Transducer Factor for
Excitation of Large Torsional Vibration with High Mechanical Quality.” Jpn. J. Appl. Phys., vol.
33, no. 2, pp. 1182-1188, 1994.
[20] Y. Gao, K. Uchino, and D. Viehland, “Time dependence of the mechanical quality factor in
‘hard’ lead zirconate titanate ceramics: development of an internal dipolar field and high power
origin,” Japanese J. Appl. Physics, vol. 45, no. 12, pp. 9119–9124, 2006.
[21] A. J. Masys, W. Ren, G. Yang, and B. K. Mukherjee, “Piezoelectric strain in lead zirconate titante
ceramics as a function of electric field, frequency, and dc bias,” J. Appl. Phys., vol. 94, no. 2, pp.
1155–1162, 2003.
[22] Yang, G., et al. "Effects of uniaxial stress and DC bias field on the piezoelectric, dielectric, and
elastic properties of piezoelectric ceramics." Ultrasonics Symposium, 2000 IEEE. Vol. 2. IEEE,
2000.
[23] Wang, Qing-Ming, et al. "Effect of DC bias field on the complex materials coefficients of
piezoelectric resonators." Sensors and Actuators A: Physical 109.1 (2003).
[24] S. Priya, S. O. Ural, H. W. Kim, K. Uchino, and T. Ezaki: Jpn. J. Appl. Phys. 43 (2004)
[25] S. Priya, H. Kim, and K. Uchino: Design Consideration for Nonlead Piezoelectric Transformers
The Pennsylvania State University (MRI, International Center for Actuators and Transducers,
University Park, 2003).
[26] K. Ishii, N. Akimoto, S. Tashirio, and H. Igarashi: J. Eur. Ceram. Soc. 19 (1999).
[27] S.Hirose, Y. Yamayoshi, M. Taga, and H. Shimizu: Jpn. J. Appl. Phys. 30 (1991).
[28] S. Takahashi, Y. Sasaki, S. Hirose, and K. Uchino: Jpn. J. Appl. Phys. 34 (1995).

50
[29] H. Iwasaki, and T. Ikeda: J. Phys. Soc. Jpn. 18 (1963).
[30] Majzoubi, Maryam, et al. "Advanced methodology for measuring the extensive elastic
compliance and mechanical loss directly in k31 mode piezoelectric ceramic plates." J. of Appl.
Phys 120.22 (2016).
[31] H. Shekhani, T. Scholehwar, E. Hennig, and K. Uchino, “High Power Characterization of
Piezoelectric Ceramics Using the Burst/Transient Method with Resonance and Antiresonance
Analysis,” J. Am. Ceram. Soc., Vol 10., pp. 1–21 (2016).


![Temperature Dependence of Faraday Effect-Induced Bias ...€¦ · compensation approach [24,25]. The Faraday effect-induced bias errors of two polarizations in PM fiber possess opposite](https://img.pdfslide.net/doc/110x75/5eb9fb1470563321217ab2a1/temperature-dependence-of-faraday-effect-induced-bias-compensation-approach.jpg)