Embed Size (px)
Citation preview
1
Electric properties of carbon nano-onion/polyaniline composites: a combined
electric modulus and ac conductivity study
Anthony N. Papathanassiou a,
*, Olena Mykhailivb, Luis Echegoyen
c, Ilias Sakellis
a
and Marta E. Plonska-Brzezinska b,
*
(a) National and Kaposdistrian University of Athens, Physics Department, Solid State
Physics Section, Panepistimiopolis, GR 15784 Athens, Greece
(b) University of Bialystok, Institute of Chemistry, Hurtowa 1, 15-399 Bialystok, Poland
(c) University of Texas at El Paso, Department of Chemistry, 500 W. University Ave., El
Paso, TX 79968 USA
Abstract
The complex electric modulus and the ac conductivity of carbon nano-
onion/polyaniline composites were studied from 1 mHz to 1 MHz at isothermal
conditions ranging from 15 K to room temperature. The temperature dependence of
the electric modulus and the dc conductivity analyses indicate a couple of hopping
mechanisms. The distinction between thermally activated processes and the
determination of cross-over temperature were achieved by exploring the temperature
dependence of the fractional exponent of the dispersive ac conductivity and the
bifurcation of the scaled ac conductivity isotherms. The results are analyzed by
combining the granular metal model(inter-grain charge tunneling of extended electron
states located within mesoscopic highly conducting polyaniline grains) and a 3D
Mott variable range hopping model (phonon assisted tunneling within the carbon
nano-onions and clusters).
PACS indexes:81.05.ub; 77.84.Lf; 72.80.Le; 77.22.Gm
Keywords: Carbon nano-onions, Onion-like Carbon, Polyaniline, Composites,
Electric modulus, Electrical conductivity
*Corresponding authors; e-mail address: [email protected],

2
1. Introduction
Carbon nano-onions (CNOs) are spherical multi-layer carbon structures
composed of concentric fullerenes similar to Russian dolls. The effective surface
areas of CNOs are considerably larger than those of other allotropes of carbons, such
as carbon nanotubes, graphene, graphite, etc [1, 2]. Electrically percolating
composites consisting of a polymer matrix filled with carbon nanostructures have
been studied to obtain optimum electrical, electromagnetic, mechanical and thermal
properties [3]. Recently, the effect of CNO loading on the dielectric and electric
properties of composites was investigated [4, 5, 6]. For different composites, the
concentrations of the carbon nano-particles and their percolation threshold (i.e., the
critical concentration for which a continuous conduction network is available to
electric charge carriers) were studied. Interestingly, it was found that the presence of
CNOs induced huge capacitance effects (visualized as intense static dielectric
constant values), coexisting with the percolation network [7]. The investigation of the
role of CNOs as composite fillers at high weight ratio is largely unexplored and
requires further experimental and theoretical work.
The CNO and conducting polymer (CP) composites are highly conducting due
to the conjugated bond structures of the CP and the intrinsic electronic properties of
the CNOs. Quantum mechanical tunnelling assisted by phonons occurs in the
inhomogeneous structure of the CP and the defected structure of the CNO. The
composites are promising efficient electrode materials for energy storage super-
capacitors [8, 9] and for biocompatible electrodes [10, 11, 12]. The multi-layered
carbon arrays yield large capacitance values, a property related to charge storage,
while a conductivity percolation network permits charge transfer to occur along the
specimen. Alternatively, the water-dispersed composites may form materials with
hydrophilic hydrogels, yielding soft electrodes that are compatible with tissues or
organs in order to emit or collect electric signals (charge flow) stemming from
biological processes. An insight at the microscopic scale IS crucial for technological
applications. The knowledge of electric charge transport mechanism at the
microscopic scale, facilitates optimization of the carbon nano-onion/polyaniline
(CNO/PANI) composite properties as super-capacitor electrode materials, by tuning
the efficiency of individual microscopic conduction mechanisms by proper physico-

3
chemical treatments (i.e., by doping or de-doping, the structural and electrical
modification etc.).
Polyaniline exists in a variety of forms that differ in chemical and physical
properties. The three principal forms are: leucoemeraldine (LE, benzenoid structure),
emeraldine (EM, combination of quinoid and benzenoid structure), and pernigraniline
(PE, quinoid structure) [13, 14]. The colours change during the redox transformations
of polymer: yellow green blue [15], depending on the polymerization method.
The green protonated EM exhibits semiconductor behaviour [16], where protonated
polyaniline can be converted to a non-conducting blue emeraldine base form [17].
Recently, we have focused on the synthesis of the CNO/PANI composites including
the green protonated EM form, using an in-situ chemical oxidative polymerization
method. The procedure for the preparation of the CNO/PANI composites has already
been reported in previous studies [18, 19]. Initially, CNOs were functionalized with
phenyleneamine-terminated groups (4-aminobenzoic acid). This functionalization
reaction led to a pronounced increase of the solubility of the CNOs in the protic
solvents. The green protonated conducting emeraldine form of polyaniline was
attached to the terminal groups in an aqueous acidic solution. The reaction led to the
CNO/PANI composites with core-shell structures, which was confirmed using
transmission electron microscopy studies [19]. The modified carbon nano-onion
structures had the particles with diameters between 8-20 nm [19]. The size is
indicative of the formation of a relatively thin and uniform layer with a 1-4 nm
thickness around the carbon nano-onions.
To study the chemical composition of the CNO/PANI composites, we applied
Broadband Dielectric Spectroscopy (BDS) in the frequency range from 1 mHz to 1
MHz at temperatures from 15 K to room temperature. Compressed disk-shaped pellets
of 4 mm diameter and 0.4 mm thickness were prepared with an IR press. Two thin
indium foils were mechanically attached and squeezed on the parallel surfaces
(comparative BDS scans at room temperature were done with various electrode
materials such as bronze, gold, platinum, etc to test electrode effects). Indium, being a
soft metal, can make good contact with the specimens’ surfaces [7]. The indium-
specimen-indium ‘sandwich’ was placed in a capacitor type sample holder of a high-
4
vacuum liquid helium cryostat (ROK, Leybold-Hereaeus) operating from 15 K to
room temperature. Temperatures were stabilized by a LTC 60 temperature controller.
Complex permittivity measurements were recorded at frequencies ranging from 1
mHz to 1 MHz with a Solartron SI 1260 Gain-Phase Frequency Response Analyzer,
and a Broadband Dielectric Converter (Novocontrol). The data acquisition system
was monitored by the WinDeta (Novocontrol) software. [7, 20, 21]. The temperature
evolution of the complex electric modulus and the ac conductivity were studied. The
use of the electric modulus investigation suppresses undesirable capacitance effects
due to electrode contacts and provides a clear view of dc conduction and dipole
relaxation. Ac conductivity vs. frequency measurements trace different spatio-
temporal scales of electric charge flow and the formation of the percolation cluster.
Isotherms ranging over a broad range of temperature can unravel different
conductivity mechanisms (since each one of them, exhibit different temperature
dependences).
2. Theoretical background
The complex electric modulus M* is defined as the inverse of the complex
permittivity ε* [22, 23, 24]:
)(*1)(*M (1)
where ω is the angular frequency (ω = 2πf; f denotes the frequency) [and 1i ].
The real and imaginary parts of M* are correlated with the corresponding ones for ε*
through the following relations:
22 )](''[)]('[
)(')('M
(2)
22 )](''[)]('[
)('')(''M
(3)
The electric modulus for a material exhibiting dc conductivity σ0 (i.e., σ(ω) = σ0 and
εs = ε, where εs and are the low (static) and high frequency limits of the relative
dielectric permittivity, respectively) is:

5
22
2
111
sss iMM
i
iM)(*M (4)
where ss /M 1 and 0 / is the so-called ‘conductivity relaxation time’. Eq.
(4) yields:
2
2
1
sM)('M (5)
21
sM)(''M (6)
A plot of )(''M against logω yields a Debye-like peak with a maximum at
/1f2 ,0,0 . The latter, combined with equation 0/ , yields:
)2(f 0,0 (7)
While complex permittivity measurements may suffer from undesirable low
frequency space charge capacitance contributions, the complex electric modulus
formalism suppressed them and permits a clear study of dc conductivity vs.
temperature by studying the temperature evolution of a conductivity relaxation peak.
If the dc conductivity mechanism co-exists with a dielectric relaxation
mechanism (namely ‘dipolar’) characterized by a relaxation time d , the electric
modulus function takes the form:
d
dss
i
iMM
i
iM)(*M
11 (8)
ote that, for the simple case of a Debye relaxation, τd is related to the (true) dielectric
relaxation time τε, by τd=(Ms/M)τε. Accordingly, dc conductivity and dielectric
relaxation mechanisms contribute as distinct peaks in a M΄΄(ω) representation.

6
The complex conductivity is interconnected to ε*(ω) according to the relation
)(*)(* 0 i [25]. The real part of the complex conductivity σ΄(ω) relates
to the electric charge flow of various spatio-temporal scales and roughly described by
an empirical relation proposed earlier [26, 27]:
nA)( 0 (9)
where A is a constant and n is the so-called fractional exponent, which is a positive
number usually equal or lower than unity (sometimes larger than 1). In the low
frequency limit, σ΄(ω) = σ0. Above a crossover frequency c , the conductivity
becomes frequency-dispersive, as carriers are making better usage of shorter
pathways provided [28, 29]. The temperature (and composition) dependence of the
parameters of Eq. (9) were applied to determine electric charge transport dynamics
[30, 31, 32]. n is related to the dimensionality of the system using percolation theory
[33]. For ionic materials, n depends only on the dimensionality of the conduction
system [34]. Ac conductivity isotherms of strongly disordered solids that share
common dynamics usually superimpose on a single master curve, when 0/)( is
plotted against c / , where c is a frequency that signals the transition from the
low frequency dc regime to the dispersive (frequency-dependent) one [35, 36]. The
scaling function that best fits the overlapping data-sets is independent of temperature.
A commonly used scaling function is that proposed by Almond and West [37]:
Nc0 1)(' (10)
where N is a fractional exponent and c is the angular frequency for which n
c0 A ;
i.e., n/
c A/1
0 .
3. Results and discussion
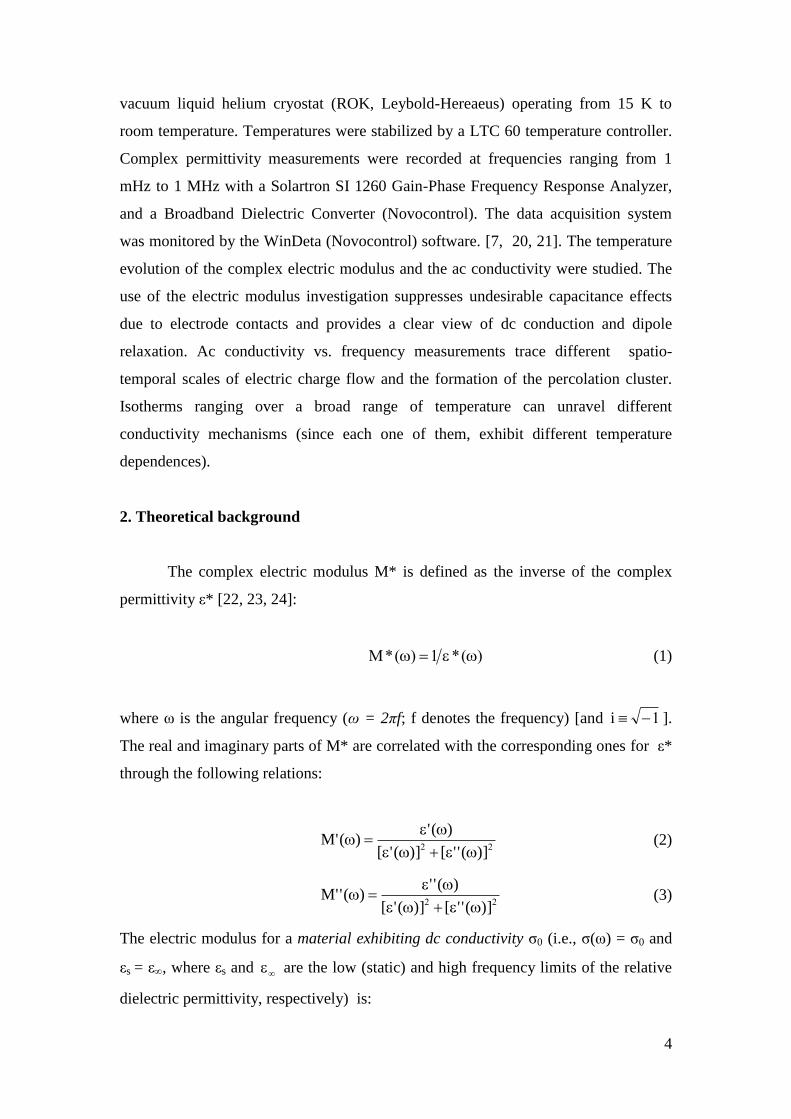
The imaginary part of the complex permittivity ε΄΄ consists of an intense dc
conductivity component and a Cole-Cole dielectric relaxation peak (Figure 1). The
relaxation dynamics of the latter has been discussed in previous work [7]. The dc

7
component appears as a peak in the M΄΄representation, overlapping with the dielectric
relaxation peak. According to theory as determined in the preceding section, this peak
is shifted towards higher frequency (beyond the highest available working frequency)
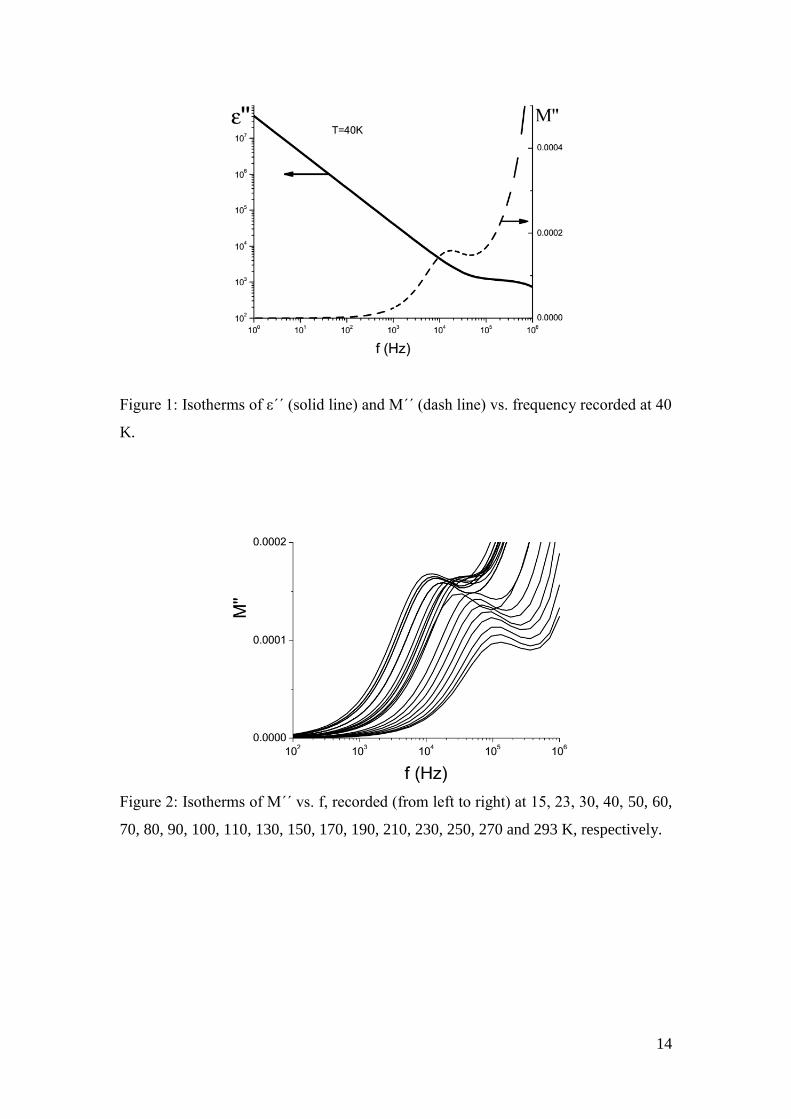
relative to its location in the ε΄΄(f) representation. The temperature dependence of Μ΄
and Μ΄΄are depicted in Figures 2 and 3, respectively.
The mass ratio of CNO to PANI in the composite was 1:1. Thus, a single dc
conductivity measurement at a given temperature (such as room temperature)
provides an effective conductivity value that contains many discrete (and unresolved)
conduction contributions. The different conductivity mechanisms depend mainly on
temperature. Therefore, different conductivity mechanisms can be distinguished by
measuring over a broad temperature region (from 15 K to 294 K). In Figure 4,
isotherms of σ΄(ω) are depicted.
The dc conductivity is estimated from ac conductivity vs. frequency
measurements as follows. At any temperature, the ac conductivity consists of a low
frequency plateau (which is dominated by the dc conductivity σ0). The measured σ0 is
suppressed as the temperature decreases, indicating that conduction is thermally
activated. Theoretical expressions for the temperature dependence of the dc
conductivity σ0(T), can easily modify the M΄΄(T) expressions, as in Eq. (7), under the
condition that is practically constant. Figure 5 indicates a linear relation between
logσ0 and logf0,σ (data points correspond to these temperatures of which the isotherm
BDS data were collected).
3.1 Evidence for two hopping conductivity mechanisms
Arrhenius diagrams of a dynamic quantity (such as conductivity, relaxation
time, diffusivity, etc) vs. reciprocal temperature have are often used to discriminate
between different mechanisms [38] and have an estimate of the apparent activation
energy value. In Figure 6, σ0(T) plotted as a function of 1/kT, respectively. Fits of
the data obtained using a linear combination of a temperature-independent component
and two exponential constituents:

8
kT/EexpSkT/EexpSS)T( 221100 (11)
where S0 and F0,σ denote the temperature independent terms due to coherent
tunneling, and S1and S2 are pre-exponential constants and Eσ1 and Eσ2 denote apparent
activation energies, respectively. Note that it was essential to take into account the
first constant term in order to fit the whole set of data points efficiently. The fitting
parameters to Eq. (11) are: S0 = (1.1±0.7)x10-5
S/cm, S1 = (2.3±0.3)x10-3
S/cm,
S2=(4.5±0.7)x10-5
S/cm, meV)(E 3551 and meVE )24(2 . The low
activation energy is attributed to hopping transport along the percolation network
formed by the conductive CNOs, while the high activation energy mechanism is
ascribed to hopping transport through the less conductive PANI phase. The transition
temperature was around 115K. This temperature cross-over has also been observed in
polymer matrices accommodating various carbon nano-structures. The complex
conductivity studies in the carbon nanotubes/carbon nano-onions/polyurethane
(CNT/CNO/PU) and the CNO/PU composites [5] and multiwall carbon nanotubes
(MWCNT)/poly(methyl methacrylate (PMMA) [39] indicated that the dielectric
permittivity and electrical conductivity are most pronouncedly reduced below 100 K.
The cross-over from one mode of conduction to another,(at 115 K) is
supported by the analyses of the conductivity curves. Eq. (7) was fitted to the σ΄(f)
data points plotted in Figure 4, and the fractional exponent n was obtained. For
percolative transport along a percolation network in a disordered material, the
fractional exponent increases from its room temperature value to higher values
systematically when temperature is reduced (or remains constant) [40]. In Figure 7,
where n(T) is depicted, we observe that the high temperature n(T) values are around
0.96, while the low temperature ones around 0.81. This indicated that two different
modes of electric charge transport operate, in agreement with the findings of the
electric modulus and the dc conductivity dependencies. The transition temperature
was around 115 K. In Figure 8, the ac conductivity isotherms were scaled following
the Almond-West approach. Scaled plots below and above 115K superimpose on two
different master curves, respectively, appearing as a ’bifurcation’ of the right hand
side of Figure9. The transition temperature signs a ‘bifurcation’ in the scaling
representation; each branch evidences about a change in conduction dynamics.

9
3.2 Microscopic models
Arrhenius plots and the temperature dependence of the fractional exponent of
the frequency-dependent ac conductivity indicate a cross-over temperature for electric
charge transport at 115K. Therefore, at least two components contribute to fit the
temperature dependence of the dc conductivity and the conductivity relaxation
frequency.
The structure of conducting PANI is inhomogeneous resembling that of a
granular metal. Coupling between PANI chains form highly conducting regions or
bundles, in which, wave functions are extended in three dimensions [41]. Charge
tunneling occurs between mesoscopic metallic islands hosted by a less conductive
polyaniline environment, in which the charging energy is high [42, 43]. For low
electric fields, dc conduction proceeds by phon on assisted tunneling through the
effective potential barrier set by the insulating host matrix. The temperature
dependence of the dc conductivity is described by the granular metal (GM) model [44,
45]:
)TT(expA)T(/
GM,GMGM,
21
00 (12)
where AGM is a constant and T0,GM is a parameter related to the height of the effective
potential barrier. The nominator T0,GM is determined by the size of conducing grains
(or clusters) and separation among them according to [46]:
)d/s(5.0
)d/s(
k
U8T
2
GM,0
(13)
where d is the average diameter of the conducting grains, s the average length of the
depleted zone between the grains and U the dynamic energy of the Coulomb
repulsion of two electrons at a distance equal to the size of the monomer, which is
roughly equal to 2 eV [45, 46].

10
Eqs. (7) and (12) yield:
)TT(expA)T(f/
GM,GM,,GM,,
21
000 (14)
where )2/(AA GMGM,,0 .
The Mott-Davis variable range hopping (VRH) model is commonly used for
describing the temperature dependence of the electrical conductivity in carbon
allotropes [46], whereas a T-γ
dependence is predicted (γ = 1/2, 1/3 and ¼ for 1D, 2D
and 3D electric charge transport, respectively). The dimensionality is related to
theshape and symmetry of the carbon structures (i.e., γ=1/2 describes commonly low
temperature dc conductivity in carbon nanotubes) [47]. The spherical shape of CNOs
favors 3D hopping occurs, in accordance with experimental observations in fullerenes
[48], for which a T-1/4
dependence (3D hopping) was determined [49],
)TT(expA)T(/
VRH,VRHVRH,
41
00 (15)
T0, VRH is a constant proportional to the density of states at the Fermi level N(EF) and
))E(kNL/(CT F
3
0VRH, where L denotes the radius of the localized wave function
decay of the charge carriers [49 - 52], q is the electron’s electric charge and C is a
dimensional constant )1.18C( . VRHA is assumed to be practically constant. The
average hopping length is 4/1
F))E(kTN8/(L9R . . The last two relations,
combine to:
41VRH,0 )TC8/(T9LR (16)
Eqs. (7) and (15) can be re-written as:
)TT(exp))/(A()T(f/
VRH,VRHVRH,,
41
00 2 (17)

11
where )2/(,,0 VRHVRH AA .Note that while GM and VRH involve quantum
mechanical tunneling assisted by phonons, the first extend electron states existing in
mesoscopic ‘metallic’ grains, while the latter mechanism refers to localized states
centered at the different positions in the band gap.
Lnσ0 and lnf0,σ are plotted against 1/T in Figures 10 and 11, respectively. The
fitting functions are:
)T()T(*)T( GM,0VRH,00 (18)
where σ* is assumed to be temperature independent term (related to a coherent
tunneling), and:
)T(f)T(ff)T(f GM,,0VRH,,0
*
,0,0 (19)
where *
,0 f denotes a temperature independent term. The fitting procedure indicated
that the constant terms σ* and *
,0f are zero within fitting errors. The fitting
parameters of the dc conductivity equation (Eq. (18)) are:
cm/S10)6.03.5(A 4
GM
, K)4003300(T GM,0 , cm/S10)410(A 6
VRH
and K)80220(T VRH,0 . For the conductivity relaxation equation (Eq. (19)) the
values are: Hz10)6.01.2(A 6
,0 , K)4003000(T GM,0 ,
Hz10)49(A 4
VRH,,0 and K)80270(T VRH,0 . Note that apart from the T-1/4
dependence for the VRH term, used in the above mentioned fitting, we also checked
for T-1/2
or T-1/3
dependencies, but the fitting was rather poor, compared with that
when 3D hopping was assumed.
According to the granular metal (GM) model, the ratio of the average9
separation spacing s over the mean diameter of a conducting grain can be estimated
through eq. (13). By replacing in eq. (13) the values of T0,GM obtained from the fitting
proceduer, U=2 eV we get a n 10.d/s . The diameter d of CNOs ranges from 8 to

12
20 nm [7[, thus, the effective grain separation d ranges from about 0.8 to 2 nm.
Furthermore, the fitting parameters of the VRH model can yield an estimate of the
mean hopping distance of electric charge carriers, according to eq. (16). Using the
fitting parameter T0,VRH found above, setting C=18.1 and taking the length constant
of electron function to be of the order of the CNO diameter L ranging from 8 to 20
nm [7], we get hopping distance values ranging from 4 -10 nm at room temperature..
Note that, when a fractional exponent is smaller than 1, relaxation time shows
deviations from Arrhenius as a Vogel-Fulcher-Tamman (VFT) for involving atomic
or molecular scale relaxation [52 - 54]. Since electron conducting polymers exhibit an
opposite curvature than that predicted from VFT, its modification based on physical
arguments would stimulate research on the probable extension of a novel generalized
VFT law, that can describe relaxation in organic semi-conductors.
4. Conclusions
The temperature dependence of the complex electric modulus and the ac
conductivity of CNO/PANI composites, studied from 1 mHz to 1 MHz under
isothermal conditions ranging from 15 K to room temperature, indicate two phonon
assisted quantum mechanical tunneling processes. One is associated with inter-grain
hopping of extended electronic states in mesoscopic highly conducting PANI grains
hosted in a less conducting PANI environment, while, the other is ascribed to 3D
hopping within CNOs and clusters. Electric modulus and dc conductivity analyses
indicate a crossover temperature at 115 K. The ac conductivity fractional exponent
studies and the bifurcating scaling of these isotherms suggested that this transition is
roughly around 115 K, respectively. Based on the present results, the electrical
properties of the CNOs/PANI can be optimized further for usage as super-capacitor
electrodes by tuning the individual conductivity mechanisms with proper doping and
structural modification of the composites.
cknowledgements
We gratefully acknowledge the financial support of the National Science Centre,
Poland (grant No.2012/05/E/ST5/03800) to M.E.P.-B. L.E. thanks the Robert A.

13
Welch Foundation for an endowed chair, grant #AH-0033 and the US NSF, grants:
DMR-1205302 and CHE-1408865.
14
Figure 1: Isotherms of ε΄΄ (solid line) and M΄΄ (dash line) vs. frequency recorded at 40
K.
Figure 2: Isotherms of M΄΄ vs. f, recorded (from left to right) at 15, 23, 30, 40, 50, 60,
70, 80, 90, 100, 110, 130, 150, 170, 190, 210, 230, 250, 270 and 293 K, respectively.

15
Figure 3: Isotherms of M΄ vs. f, recorded (from top to bottom) at 15, 23, 30, 40, 50,
60, 70, 80, 90, 100, 110, 130, 150, 170, 190, 210, 230, 250, 270 and 293 K,
respectively.
Figure 4: The real part of the ac conductivity σ΄(ω), recorded isothermally at the same
temperatures depicted in Figure 3. (bottom line: 15 K; upper line: room temperature).

16
Figure 5: The logarithm of the conductivity relaxation frequency obtained from the
maxima of M΄΄(f) isotherms vs. the logarithm of the dc conductivity determined by
fitting eq. (9) to σ΄(f) isotherms. The straight line best fits the data points.
Figure 6: σ0 vs 1/kT. The line is the best fit of Eq. (11) to the data points.

17
Figure 7: The fractional exponent n of the power-law dispersive ac conductivity
described by Eq. (7) vs. the temperature where isotherms of σ΄(f) were recorded.
Figure 8: Scaling of σ΄ isotherms depicted in Figure 4. The critical frequency fc is
determined according to Almond and West. Isotherms above and below 115 K
superimpose on two distinct master curves, respectively, which ‘bifurcate’ at high
frequencies, indicating different electric charge transport dynamics.

18
Figure 9: The natural logarithm of the dc conductivity σ0, determined from the fitting
Eq. (7) to the σ΄(f) data, as a function of reciprocal temperature. Solid line is the best
fit of Eq. (17) to the data points.
Figure 10: The natural logarithm of the relaxation conductivity frequency f0,σ vs.
reciprocal temperature. Solid line is the best fit of Eq. (19) to the data points.

19
References
[1] D. Ugarte, Curling and closure of graphitic networks under electron-beam
irradiation, Nature 359 (1992) 707-709
[2] J. L. Delgado, M. A. Herranza and N. Martı, J. Mater. Chem. 18, 1417 (2008)
[3] F. Quin and C. Brosseau, J. A review and analysis of microwave absorption in
polymer composites filled with carbonaceous particles, Appl. Phys.111 (2012)
061301
[4] J. Matcukevic, J. Kranauskaife, J. Banys, S. Moseenkov, J Kusnetsov and O.
Shenderova, Metal-insulator transition and size dependent electrical
percolation in onion-like carbon/polydimethylsiloxane composites, J. Appl.
Phys. 115 (2014) 213702-213705
[5] I. Kranausskaite, J. M. Matcutkevic, J. Banys, E. Talik, V. Kurnetsov, N. Nun,
and O. Shenderova, Synergy effects in the electrical conductivity behavior of
onion-like carbon and multiwalled carbon nanotubes composites Phys. Stat.
Solidi B1-5 (2015) doi: 10.1002/pssb.251451745
[6] J. Matcutkevic,K. Glemza, V. Kuznetsov, V. Borjanovic and O. Shenderova,
Dielectric properties of Onion-like Carbon composites, Lithuanian J. Phys.53
(2013) 238-243
[7] A N. Papathanassiou, M. E. Plonska-Brzezinska, O. Mykhailiv, L. Echegoyen
and I. Sakellis, Combined high permittivity and high electrical conduc-tivity
of carbon nano-onion/polyaniline composites, Synth. Metals, 209 (2015) 583-
587
[8] O. Mykhailiv, M. Imierska, M. Petelczyc, L. Echegoyen, M. E. Plonska-
Brzezinska. Chemical vs. electrochemical synthesis of carbon nano-
onion/polypyrrole composites for supercapacitor electrodes. Chem. Eur. J. ,
21 (2015) 5783-5793
[9] M. E. Plonska-Brzezinska, L. Echegoyen, Carbon Nano-onions in
Supercapacitor Electrodes: Recent Developments and Applications. J Mater.
Chem A, 1 (2013) 13703-13714
[10] M. E. Plonska-Brzezinska, M. Lewandowski, M. Błaszyk, A. Molina-Ontoria,
T. Luciński, L. Echegoyen. Synthesis and Properties of Carbon Nano-
Onion/PEDOT:PSS composites. ChemPhysChem, 13 (2012) 4134-4141

20
[11] J. Breczko, M. E. Plonska-Brzezinska, L. Echegoyen. Electrochemical oxidation
and determination of dopamine in the presence of uric and ascorbic acids
using CNOs/PDDA composite. Electrochim. Acta, 72 (2012) 61-67
[12] J. Breczko, K. Winkler, M. E. Plonska-Brzezinska, A. Villalta-Cerdas, L.
Echegoyen. Electrochemical Properties of Composites Containing Small
Carbon Nano-Onions and Solid Polyelectrolytes. J. Mater. Chem., 20 (2010)
7761-7768
[13] A. Baba, S. J. Tian, F. Stefani, C. J. Xia, Z. H. Wang, R. C. Advincula, D.
Johansmann, W. Knoll, Electropolymerization and doping/dedoping properties
of polyaniline thin films as studied by electrochemical-surface plasmon
spectroscopy and by the quartz crystal microbalance, J. Electroanal. Chem.
562 (2004) 95-103
[14] M. K. Wang, F. Zhao, Z. H. Guo, Y. L. Wang, S. J. Dong, Polyaniline-coated
carbon particles and their electrode behavior in organic carbonate electrolyte,
J. Electroanal. Chem., 570 (2004) 201-208
[15] G. Inzelt Conducting Polymers. A New Era in Electrochemistry. Springer-
Verlag Berlin Heidelberg (2008) pp. 169-265
[16] Y. Jang, C. Zhao, D. Cui, J. Hou, M. Wan, M. Xu, Polyaniline/polypropylene
film composites with high electric conductivity and good mechanical
properties, J. Appl. Polym. Sci. 56 (1995) 831-836
[17] M. Panhuis, R. Sainz, P. C. Innis, L. A. P. Kane-Maguire, A. M. Benito, M. T.
Martinez, S. E. Moulton, G. G. Wallace, W. K. Maser, Optically Active
Polymer Carbon Nanotube Composite, J. Phys. Chem. B, 109 (2005) 22725-
22729
[18] M. E. Plonska-Brzezinska, J. Breczko, B. Palys, L. Echegoyen. Supercapacitors
Based on Carbon Nanostructure/Polyaniline Composites, ChemPhysChem , 14
(2013) 116-124
[19] M. E. Plonska-Brzezinska, J. Mazurczyk, J. Breczko, B. Palys, A. Lapinski,
L. Echegoyen. Preparation and Characterization of First Composites
Containing Small Carbon Nano-Onions and Polyaniline. Chem. Eur. J., 18
(2012) 2600-2608
[20] A.N. Papathanassiou, I.Sakellis, J. Grammatikakis, E Vitoratosand S.
Sakkopoulos, Exploring electrical conductivity within mesoscopic phases of
semi-conducting PEDOT:PSS films by Broadband Dielectric Spectroscopy,
, Appl. Phys. Lett., 103 (2013) 123304-8

21
[21] A.N. Papathanassiou, I. Sakellis, S. Taccola, E. Vitoratosand S. Sakkopoulos,
Broadband Dielectric Spectroscopy Investigation of the Electrical and
Structural Heterogeneity of Optically Transparent Organic Semiconductor
Films, Materials Today: Proceedings, 2 (2015) 4217-4222
[22] P. B. Macedo, C. T. Moynihan, and R. Bose, The Role of Ionic Diffusion in ...
Conductors, Phys. Chem. Glasses, 13 (1972) 171-179
[23] M. Hodge, K. L. Ngai, C. T. Moynihan, The electric modulus formalism , J.
Non-Cryst. Solids, 351 (2005) 104-109
[24] C. A. Angell, Dynamic processes in ionic glasses, Chem. Rev., 90 (1990)
523529
[25] E. Kremer and A. Schonhals, Broadband DielectricSpectroscopy, Chapter 1,
Springer-Verlag, Berlin-Heidelberg-New York ((2003)
[26] A. K. Jonscher, The `universal' dielectric response, Nature 267 (1977) 637-
679
[27] D. Almond, G. K. Duncan, and A. R. West, The determination of hopping
rates and carrier concentrations in ionic conductors by a new analysis of ac
conductivity, Solid State Ionics, 8 (1983) 159-164
[28] A. N. Papathanassiou, I. Sakellisand J. Grammatikakis, Universal frequency-
dependent ac conductivity of conducting polymer networks, Appl. Phys. Lett.
91 (2007) 122911-12295
[29] I. Sakellis, A.N. Papathanassiou, and J. Grammatikakis, Scaling and
universality of ac conductivity and dielectric response in disordered materials:
complex conductivity and permittivity scaling functions derived from the
pressure depedent response, Appl. Phys. Lett. 97 (2010), 041913-6
[30] A.N. Papathanassiou, Novel feature of the universal power law dispersion of
the ac conductivity in disordered matter, J. Non-Cryst. Solids, 352 (2006)
5444-5445
[31] A.N. Papathanassiou, I. Sakellis, J. Grammatikakis, S. Sakkopoulos, E.
Vitoratosand E. Dalas, Low frequency a.c. conductivity of fresh and thermally
aged polypyrrole-polyaniline conductive blends, SyntheticMetals, 42 (2004)
81-86
[32] A.N. Papathanassiou, The power law dependence of the ac conductivity on
frequency in amorphous solids, J. Phys. D: Appl. Phys., 35 (2002) L88-89
22
[33] A. G. Hunt, Ac hopping conduction: Perspective from percolation
theory, Philos. Mag. B, 81 (2001) 875913
[34] A. Hunt, The low frequency conductivity of the Fermi glass, J. Phys.:
Condens. Matter, 4 (1992) 6957-6970
[35] J. Dyre, P. Maas, B. Roling and D. Sidebottom, Fundamental questions
relating to ion conduction in disordered solids , Rep. Progr. Phys., 72 (2009)
046501-046510
[36] I. Sakellis, On the origin of time-temperature superposition in disordered
solids, Apll. Phys. Lett., 98 (2011) 072904-6
[37] D. P. Almond and A. R. West, Mobile ion concentrations in solid electrolytes
from an analysis of ac conductivity, Solid State Ionics, 9 (1983) 277-282
[38] F. Stickel, E. W. Fischer and R. Richert, Dynamics of Glass-Forming
Liquids. I. Temperature-Derivative Analysis of Dielectric Relaxation Data, J.
Chem. Phys., 102 (1995) 6251-6257
[39] H.M. Kim, M.- S. Choi and J. Joo, Phys. Rev. B , 74, (2006) 054202
[40] J. C. Dyre and T. B. Schrøder, Universality of ac conduction in disordered
solids, Rev. Mod. Phys. 72 (2000) 873-892
[41] A.J. Epstein, A.G. MacDiarmid and J.P. Pouge, Spin Dynamics and
Conductivity in Polyaniline, Phys. Rev. Lett., 65 (1990) 664-665
[42] A. B. Kaiser, Systematic conductivity behavior in conducting polymers:
Effects of heterogeneous disorder, Adv. Mater., 13 (2001) 927-941
[43] S. Sakkopoulos, E. Vitoratos and E. Dalas, Synth. Metals92, 63 (1998)
[44] P. Sheng, B. Abelesand, Y. Arie, Hopping Conductivity in Granular Metals,
Phys. Rev. Lett., 31 (1973) 44-47
[45] P. Sheng and J. Klafter, Hopping conductivity in granular disordered systems,
Phys. Rev. B, 27 (1983) 2583-2586
[46] L. Zuppiroli, M.N. Bussac, S. Paschen, O. Chauvet and L. Forro, Hopping in
disordered conducting polymers, Phys. Rev. B, 50 (1994) 5196-5200; B.
Sixou, N. Mermilliod and J.P. Travers, Aging effects on the transport
properties in conducting polymer polypyrrole, Phys. Rev. B. 53 (1996) 4509-
4519

23
[47] H. M. Kim, M. S. Choi, J. Joo, S. J. Cho and H. S. Yoon, Complexity in
charge transport for multiwalled carbon nanotube and poly(methyl
methacrylate) composites, Phys. Rev. B, 74 (2006) 054202-6
[48] M. Núñez-Regueiro, O. Bethoux J.-M. Mignot, P. Monceau, P. Bernier, C.
Fabre and A. Rassat, Electrical Resistivity of Fullerenes at High Pressures,
EPL, 21 (1993) 49-53
[49] N. F. Mott, Conduction in non-crystalline materials, Phil. Mag., 19 (1969)
835-852; .G. Austin and N. F. Mott, Polarons in crystalline and non-crystalline
materialsAdv. Physics, 18 (1969) 41-102
[50] A.N. Papathanassiou, I. Sakellis, J. Grammatikakis, S. Sakkopoulos, E.
Vitoratos and E. Dalas, An insight into the localization of charge carriers in
conducting polyaniline by analyzing Thermally Stimulated Depolarization
signals, d State Commun. 125, (2003) 95-99
[51] A.N. Papathanassiou, The power law dependence of the ac conductivity on
frequency in amorphous solids, J. Phys. D: Appl. Phys. 35 (2002) L88-L89
[52] K. Trachenko, Slow dynamics and stress relaxation in a liquid as an elastic
medium, Phys. Rev. B 75 (2007) 212201
[53] K. Trachenko and V. V. Brazkin, Understanding the problem of glass transition
on the basis of elastic waves in a liquid, J. Phys.: Condensed Matter, 21 (2009)
425104
[54] K. Trachenko and V. V. Brazkin, Collective modes and thermodynamics of the
liquid state, Rep. Prog. Phys. 79 (2015) 016502