Embed Size (px)
Citation preview
BIG DATA DISCOVERY SCIENCE

Big Data for Discovery Science(BDDS)
“What can we do today that we couldn’t do before.”
Arthur Toga, PI
Sept. 30, 2016
Santa Rosa, CA
10/6/2016 BIG DATA DISCOVERY SCIENCE 2

BDDS Platform – Integrated Tools for Discovery
10/6/2016 3
BIG DATA for DISCOVERY SCIENCE

BDDS Case Studies
• Data Aggregation• Sex/AD• Statins
• TReNA• Ben Heavner, Ravi Madduri
• PheWAS• Carl Kesselman, Lu Zhao
• BDDS Demos this afternoon• Dry Creek Valley I
10/6/2016 BIG DATA DISCOVERY SCIENCE 4

Farrer 1997 Meta-Analysis
10/6/2016 5BIG DATA for DISCOVERY SCIENCE
ε3/ε3 ε3/ε4
OR ≈ 1(men)
OR ≈ 1.5(women)
ε3/ε4
ε3/ε3
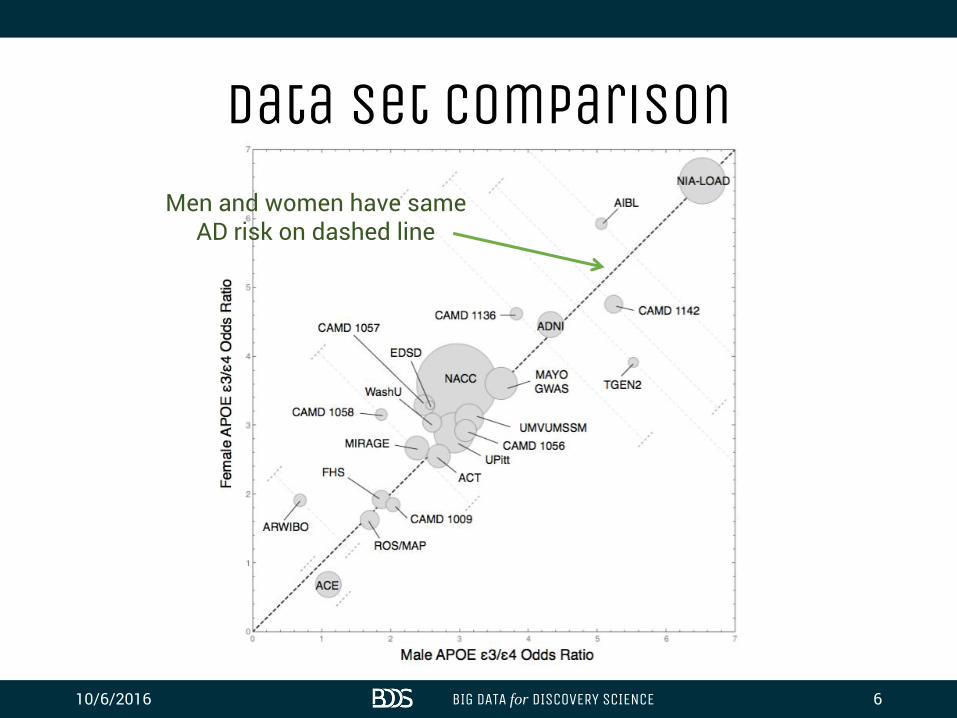
Data Set Comparison
10/6/2016 6BIG DATA for DISCOVERY SCIENCE
Men and women have sameAD risk on dashed line
Background and objective
• Statins are widely prescribed to treat high cholesterol in men and women
• However, lipophilic statins enter the brain and may impact brain cholesterol that plays a critical role in brain functioning, like estrogen production
• Objective: to understand the relationship between lipophilic statin use and gender on the brain, cognition, and Alzheimer’s disease

Statin users vs, non-usersHR: 0.91, CI: 0.68-1.22
Statin users vs, non-usersHR: 1.69, CI: 1.21-2.34
Results – Clinical Conversion

BIG DATA DISCOVERY SCIENCE
DNase FootprintingAnalysis using BDDS tools and services

Biological Motivation:Two puzzling observations
10/6/2016 BIG DATA DISCOVERY SCIENCE 13
Image credits:http://software.broadinstitute.org/software/igv/MutationDataNature Methods 13, 9–10 (2016) doi:10.1038/nmeth.3692
Genomic Analysis Gene Expression Analysis
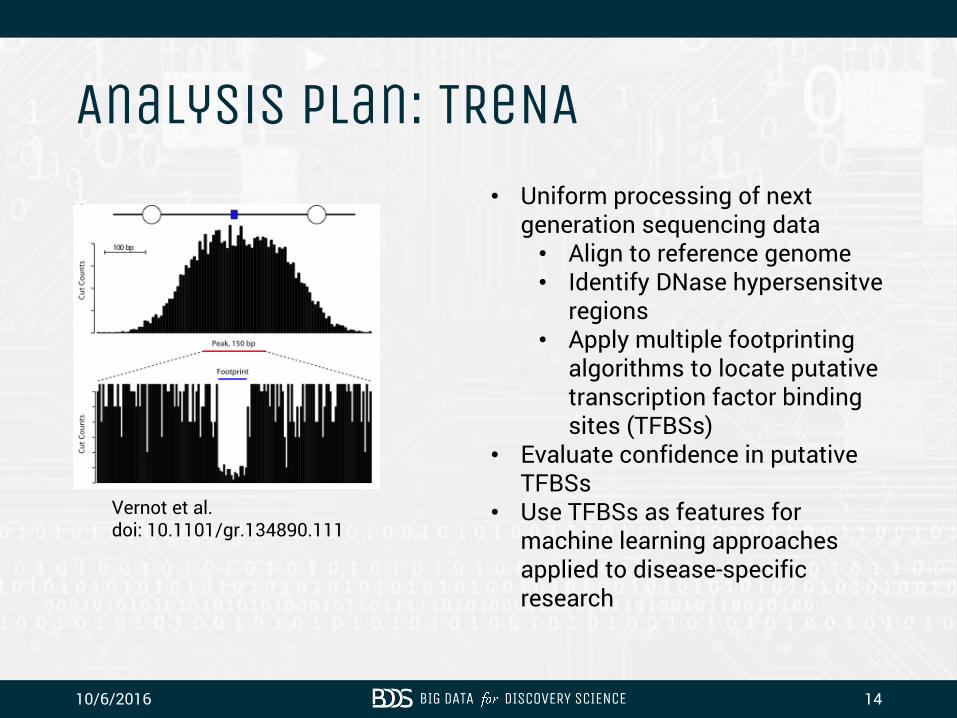
Analysis plan: TReNA
10/6/2016 BIG DATA DISCOVERY SCIENCE 14
Vernot et al. doi: 10.1101/gr.134890.111
• Uniform processing of next generation sequencing data
• Align to reference genome• Identify DNase hypersensitve
regions• Apply multiple footprinting
algorithms to locate putative transcription factor binding sites (TFBSs)
• Evaluate confidence in putative TFBSs
• Use TFBSs as features for machine learning approaches applied to disease-specific research

Primary data source: ENCODE
10/6/2016 BIG DATA DISCOVERY SCIENCE 15
www.encodeproject.org
Big Data Challenges: TReNA
10/6/2016 BIG DATA DISCOVERY SCIENCE 16
• Gathering raw data from public repository• Identifying raw data objects• Transferring data objects• Scalable data analysis
• Integrating data from disparate sources• Providing results for downstream analysis

BDDS Solutions: Enabling TReNA – BDBag
10/6/2016 BIG DATA DISCOVERY SCIENCE 17
https://github.com/ini-bdds/bdbag

BDDS Solutions: Enabling TReNA – ENCODE To BDBag
10/6/2016 BIG DATA DISCOVERY SCIENCE 18
http://encode.bdbag.org/

BDDS Solutions: Enabling TReNA - minids
10/6/2016 BIG DATA DISCOVERY SCIENCE 19
https://github.com/ini-bdds/minid

BDDS Solutions: Enabling TReNA – BDDS Galaxy
10/6/2016 BIG DATA DISCOVERY SCIENCE 20
https://bdds.globusgenomics.org/

BDDS Solutions: Enabling TReNA
• BDBags and BDBag Tooling
• ENCODE to BDBag Web Service
• minids and minid Tooling
• Cloud based Data Transfers
• BDDS Galaxy Analytics Platform
10/6/2016 BIG DATA DISCOVERY SCIENCE 21

Implementing the DNaseHypersensitivity Workflow on the BDDS Galaxy Platform
10/6/2016 BIG DATA DISCOVERY SCIENCE 22

10/6/2016 BIG DATA DISCOVERY SCIENCE 23
BDDS Data
1. Create a Query
2. Query
Encode to BDBagService
3. Query
BDDS Analysis Services4. BD Bag MinID
BDDS ERMRestService TRN
BDDS GalaxyService
BDBAG
5. Execute Big Data Analysis pipelines
6. Results
7. Publish Results
BDDS Publication
Service
8. Index Results
CEL
FASTQ
BDBAG
Plan Overview

DNaseFootprintingData ProcessingWorkflow
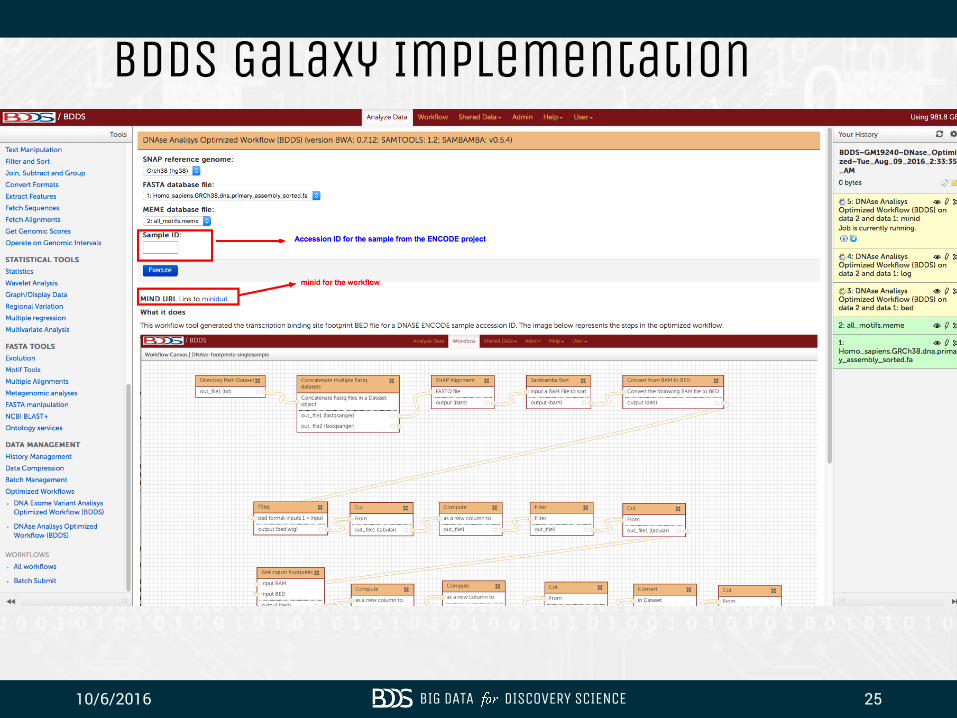
10/6/2016 BIG DATA DISCOVERY SCIENCE 25
BDDS Galaxy Implementation

10/6/2016 BIG DATA DISCOVERY SCIENCE 26
TRN Model is working given tissue-specific TFBS counts from TFBS counts in promoters and corresponding gene expression data.

10/6/2016 BIG DATA DISCOVERY SCIENCE 27

10/6/2016 BIG DATA DISCOVERY SCIENCE 28
Publishing Results

What can we do today that we couldn’t do before?• Generate BDBags containing researcher-defined
subsets of ENCODE data• Uniquely identify ENCODE data sets using minids• Copy data directly from ENCODE to BDDS Galaxy
platform by specifying minid• Run complex DNase footprinting analysis
workflow on Galaxy platform with full provenance• Uniquely identify workflow instantiation with
minid• Return analysis results in BDBag with minid
10/6/2016 BIG DATA DISCOVERY SCIENCE 29

BDDS Tools used in the TReNAApproach• Minids and Minid Tooling
• BDBags and BDBag Tooling
• ENCODE to BDBag Web Service
• Cloud based Data Transfers between ENCODE and BDDS Galaxy
• BDDS Galaxy Cloud-based Analytics Platform
10/6/2016 BIG DATA DISCOVERY SCIENCE 31

A Platform for Phenome Wide Association Studies (PheWAS)

Neuroimaging PheWAS
• What is PheWAS?• One SNP -> a wide variety of neuroimaging
phenotypes (inverse of GWAS)
• Why PheWAS?• Unbiasedly validates GWAS/single-phenotype
studies findings and explores new system-level genetic associations.
• Challenges • Complexity, heterogeneity, and volume of the data
• Complex and sophisticated brain image processing
• Multiple-comparison correction
• Result visualization
10/6/2016 33BIG DATA for DISCOVERY SCIENCE

• PheWAS findings (Zhao,…, Toga, Nat Neurosci, submitted)
10/6/2016 34BIG DATA for DISCOVERY SCIENCE
Shaw, Molecular Psychiatry
(2009) 14, 348–355Raznahan, Neuroimage (2011) 57,
1517-23

Image PheWAS
1. Assemble Data Collections
2. Identify subjects with images and extract images
3. Compute image phenotypes• Use Freesurfer with different atlases and computed
measures
4. Associate Freesurfer results with each subject.
5. Quality control on derived data. Rerun on bad results
6. Identify subset of subjects that have variant of interest in SNP being considered
7. Collect up all phenotype data associated with identified subset
8. Do correlation analysis of phenotypes for the SNP to look for predictive correlations.

Bags bridge the gap between tools
10/6/2016 36BIG DATA for DISCOVERY SCIENCE
5. Query for specific imaging
information based on the
derived genetic data
Raw Brain
MRI data
Processed
MRI data
6. Create
new bags of
derived data
7. Transfer
bags out for
publication
Genetic
Data
Brain
MRI
ERMrest
Process imaging data
dbGaP
1. Query and
discover data
(wherever it is)
2. Create
bags
3. Query for
genetic data
from 6 chipsets
PLINK format
genetic data
Alleles per
subject
4. Create
new bags of
derived dataAlignm
ent
Files
After step 6
628 subjects

Assemble Data Collections
• …create bag with references to dbGap
• Log into dbGap and resolve references
• Assemble results in local directory
• Validate bag
• Ingest bag into catalog

Philadelphia Neurodevelopmental Consortium
• 8719 subjects in study• Baseline clinical elements
• 6 different SNP array chipsets resulting in a combined set of 1,873,486 distinct SNPs (out of a possible 85 million in the human genome).
• The total combinatorial space of the genomic data is 5,435,533,460 (SNP, subject, allele) tuples across the 8719 subjects
• 997 of the subjects have MRI imaging data

Managing data collections

Export Bags for Phenotype calculation
• Bag structure used to collect data sets, along with description of what should be computing
• Collect results of calculation into bag and reingest
• Parcellation process generates 381 distinct regional measurements per subject, for a total of 370,641 regional neuro-anatomical measurements
• Surface-based model generates > 2 millions local measurements per subject, for a total of > 2 billions local neuro-anatomical measurements
• Image data for the 997 subjects consists of 70930 files (including derived images) @ 666GB

Details on one data element

QC on derived data

Complex data relationships…

NeuroimagingPheWAS Toolbox

What can we do now we couldn’t do before?
• Broad survey for true system-level genetic associations across the whole population
• All kinds of imaging genome data and processing
• Not just for PNC, PING
• Extensible to other phenotypes, not just FreeSurfer
• Build more complex studies the previously possible
• e.g. TRENA + PheWAS
• Reproducible, complex, multistep big-data analysis
10/6/2016 45BIG DATA for DISCOVERY SCIENCE
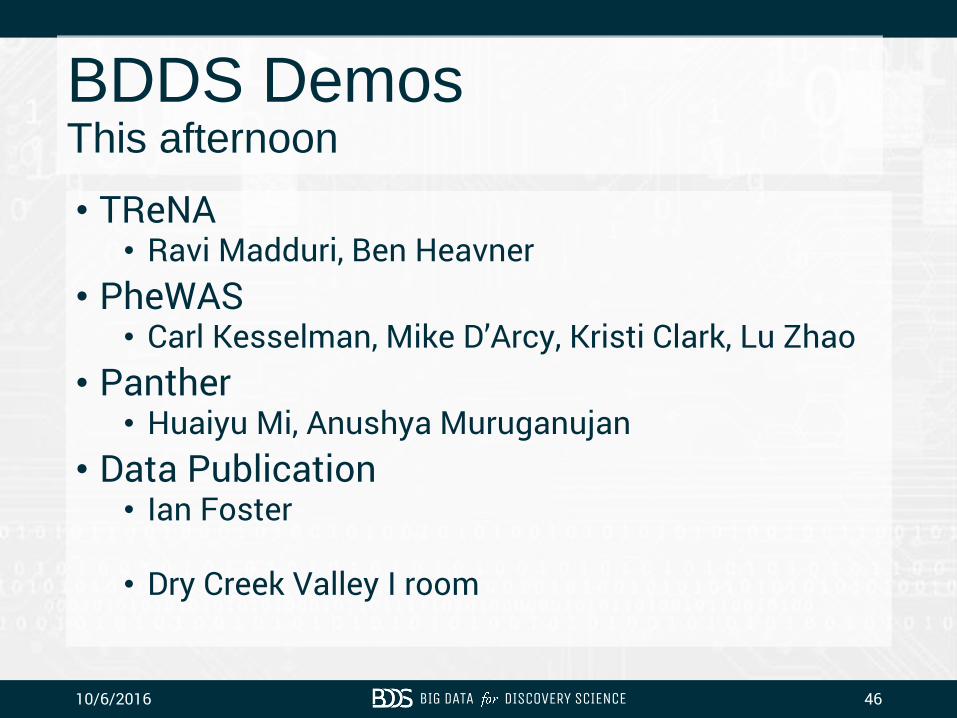
BDDS Demos This afternoon
• TReNA• Ravi Madduri, Ben Heavner
• PheWAS• Carl Kesselman, Mike D’Arcy, Kristi Clark, Lu Zhao
• Panther• Huaiyu Mi, Anushya Muruganujan
• Data Publication• Ian Foster
• Dry Creek Valley I room
10/6/2016 BIG DATA DISCOVERY SCIENCE 46