Embed Size (px)
Citation preview

Hello colleagues,
Ameriprise advisors are growing their practices at industry-leading rates though a wide variety of strategies – one effective method is the internal acquisition of other Ameriprise practices. As a firm, we are committed to supporting that process for both buyer and seller with a goal to improve the support and resources that we provide to the practice valuation and purchase process. To help us do that, we commissioned a refreshed study in 2019 from a third-party firm. In that study, we found that Ameriprise practices sold for an 18.8% premium over the price of similar practices at competing firms in the industry. Your practice is one of your largest and most important assets – we are pleased to provide you with key information and supporting details from that study. I encourage you to read the enclosed whitepaper “The Value of Supported Independence”.
If you have any questions about the study, please contact [email protected]
Thank you for all you do,
Bill Williams Executive Vice President, Ameriprise Franchise Group
For advisor and institutional use only. Not intended for inspection by, or distribution or quotation to the general public.
© 2020 Ameriprise Financial, Inc. All rights reserved.
The Value of Supported IndependenceA Study by Succession Resource Group, Inc. 2019
Table of Contents
About This Study 1
About The Author 1
Introduction 2
Methodology 4
Market Status 5
Findings 6
Key Value Drivers and Detractors 7
Conclusion 8
Definitions 9
Appendix 10

1Copyright © 2019 Succession Resource Group | [email protected] | 503.427.9910
About This Study
The purpose of this study is to compare the values generated from the sale of Ameriprise franchises (referred to herein as the “Ameriprise Franchises”) to those practices sold by advisors affiliated with independent broker-dealers and/or registered investment advisors other than Ameriprise Franchises (referred to herein as the “Industry Peers”). The study is limited to comparing the sale of entire practices and therefore excludes sales of segments of a client base (e.g. partial book sales), as well as staged succession plans where a business is sold in multiple equity transactions. The time frame for conducting this comparison is restricted to transactions completed in 2017 and 2018. The study provides insight related to possible causes for the observed higher or lower values between the two groups based on the author’s expertise facilitating sales of practices with both the Industry Peers as well as Ameriprise Franchises.
Sucession Resource Group (SRG) was commissioned and paid by Ameriprise Financial Services, Inc. to conduct this study. Such payments were made prior to SRG beginning the analysis to ensure SRG was able to provide an objective and unbiased analysis and report. Ameriprise did not attempt to bias or influence the results of the analysis, nor was the compensation for conducting this study related in any way to a specific or desired outcome. SRG was commissioned to conduct this same analysis in 2013 under the same name. This analysis and report are intended to serve as an update to the previous analysis.
About The Author
Recognized as a 2019 Industry Awards winner by WealthManagement.com1, and ranked as one of the fastest growing private companies in 2017 and 20192, Succession Resource Group, Inc. (SRG) is a neutral third-party consulting firm with decades of combined industry experience, specialized in helping financial professionals value, protect, merge/acquire, and transition their business.
SRG’s expertise in the financial services industry includes: valuation, business formation/setup, employment best practices, M&A deal negotiations, and equity strategies.
SRG is built on a team of professionals who educate and problem-solve for its clients, preserving their legacy for future generations and helping them maximize the value of their business. Having completed more than 5,000 business valuations, hundreds of acquisitions/sales, contingency plans, and more than 200 unique succession plans for advisors, SRG knows how to think outside the box to create customized solutions and the experience to ensure its clients make every decision with full information.
1. https://www.successionresource.com/succession-resource-group-wins-2019-wealthmanagement-com-industry-award-succession-ownership-transition-services/
2. https://www.successionresource.com/succession-resource-group-ranked-in-oregons-top-100-fastest-growing-companies-by-portland-business-journal/ https://www.successionresource.com/succession-resource-group-wins-2019-wealthmanagement-com-industry-award-succession-ownership-transition-services/ https://www.successionresource.com/succession-resource-group-ranks-2019-inc-5000-list-americas-fastest-growing-private-companies/

2Copyright © 2019 Succession Resource Group | [email protected] | 503.427.9910
Introduction
Before the early 2000s, the idea of having “equity” in an advisor’s book of business that one could transfer to a peer in exchange for value was not even a consideration. As the first generation of independent advisor’s built their businesses and began nearing the point of retirement, more and more began to consider what they would do with their clients when they were ready to retire, and deals began happening. Yet, throughout the mid-2000s, many advisors maintained a healthy skepticism that their book of business could be transferred successfully to another advisor.
Fast forward 20 years to present day, it is now common practice for advisors to track and manage the value/equity in their business. Advisors are now actively including the business in their personal retirement plans and maximizing value leading up to retirement.
The value of financial advisor practices is tracked and published annually by Succession Resource Group, and universally, reported values have steadily risen every year (see Figure 1) due to robust demand and increasing availability of financing. Average values observed and reported by SRG have reached record levels, with a 2.68x recurring gross revenue multiple for 2018. Based on 2018 SRG data, the average buyer-to-seller ratio reached an all-time high with 48 buyers for every seller, and 3.5 offers per seller on average.
Figure 1: Average Multiples of Revenue
0.5
1.0
1.5
2.0
2.5
3.0
2.39
1.00
2013
2.55
1.01
2014
Recurring Revenue Multiple Non-Recurring Revenue
2.60
1.10
2015
2.60
1.00
2016
2.62
0.90
2017
2.68
0.88
2018
3Copyright © 2019 Succession Resource Group | [email protected] | 503.427.9910
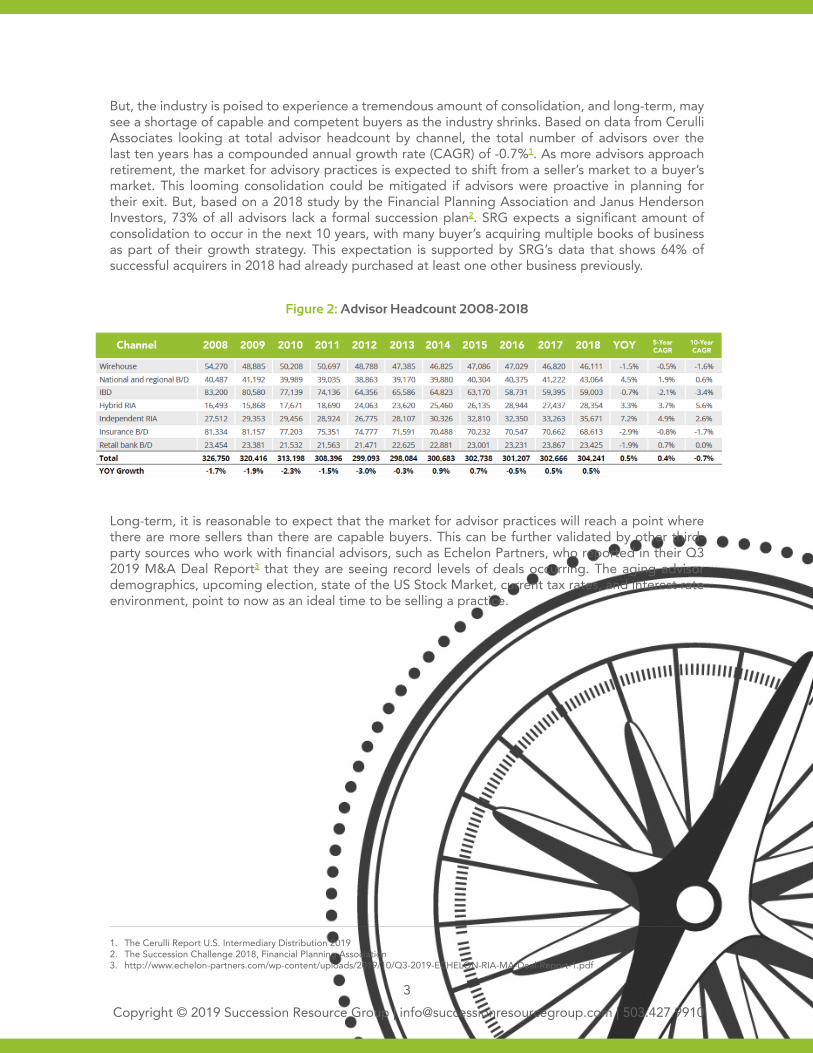
But, the industry is poised to experience a tremendous amount of consolidation, and long-term, may see a shortage of capable and competent buyers as the industry shrinks. Based on data from Cerulli Associates looking at total advisor headcount by channel, the total number of advisors over the last ten years has a compounded annual growth rate (CAGR) of -0.7%1. As more advisors approach retirement, the market for advisory practices is expected to shift from a seller’s market to a buyer’s market. This looming consolidation could be mitigated if advisors were proactive in planning for their exit. But, based on a 2018 study by the Financial Planning Association and Janus Henderson Investors, 73% of all advisors lack a formal succession plan2. SRG expects a significant amount of consolidation to occur in the next 10 years, with many buyer’s acquiring multiple books of business as part of their growth strategy. This expectation is supported by SRG’s data that shows 64% of successful acquirers in 2018 had already purchased at least one other business previously.
Long-term, it is reasonable to expect that the market for advisor practices will reach a point where there are more sellers than there are capable buyers. This can be further validated by other third-party sources who work with financial advisors, such as Echelon Partners, who reported in their Q3 2019 M&A Deal Report3 that they are seeing record levels of deals occurring. The aging advisor demographics, upcoming election, state of the US Stock Market, current tax rates, and interest rate environment, point to now as an ideal time to be selling a practice.
1. The Cerulli Report U.S. Intermediary Distribution 20192. The Succession Challenge 2018, Financial Planning Association 3. http://www.echelon-partners.com/wp-content/uploads/2019/10/Q3-2019-ECHELON-RIA-MA-Deal-Report-1.pdf
Channel 2008 2009 2010 2011 2012 2013 2014 2015 2016 2017 2018 YOY 5-YearCAGR
10-YearCAGR
Figure 2: Advisor Headcount 2008-2018

4Copyright © 2019 Succession Resource Group | [email protected] | 503.427.9910
Methodology
The transaction data used in this study was obtained from two sources:
1. SRG’s internal database of financial advisor practice sales, excluding Ameriprise Franchises. This includes transaction data in which SRG facilitated as well as transaction data from external sources provided to SRG from other independent broker-dealers and lenders. This data shall be referred to in this study as the “Peer Group”; and
2. Ameriprise Franchises advisor practice sales. This includes transaction data from SRG’s internal database and transactions provided by Ameriprise Financial Services, Inc. Data provided by Ameriprise Financial Services, Inc. was obtained by surveying all of its advisors that completed a transaction in 2017 or 2018. SRG received the unfiltered results of such analysis for the purposes of conducting this analysis. This data shall be referred to as “Ameriprise Franchises”.
The total amount of transactions considered in this analysis consisted of 246 transactions occurring in 2017 and 2018. From this dataset, SRG then removed all outlier transactions based upon those deals that had incomplete and or inconsistent transaction data. The breakout of this data can be referenced further in the Appendix.
Every deal used in this study involved the sale of an entire business between two unrelated and willing third parties and does not include any partial book sales or internal sales to partners/successors. For this analysis, SRG held the non-recurring revenue multiple constant at 0.88x, which was the industry average for 2018 as published by SRG.
The study previously conducted in 2013 under the same name used the same methodology.
5Copyright © 2019 Succession Resource Group | [email protected] | 503.427.9910
Market Status2017-2018 Transaction Comparison
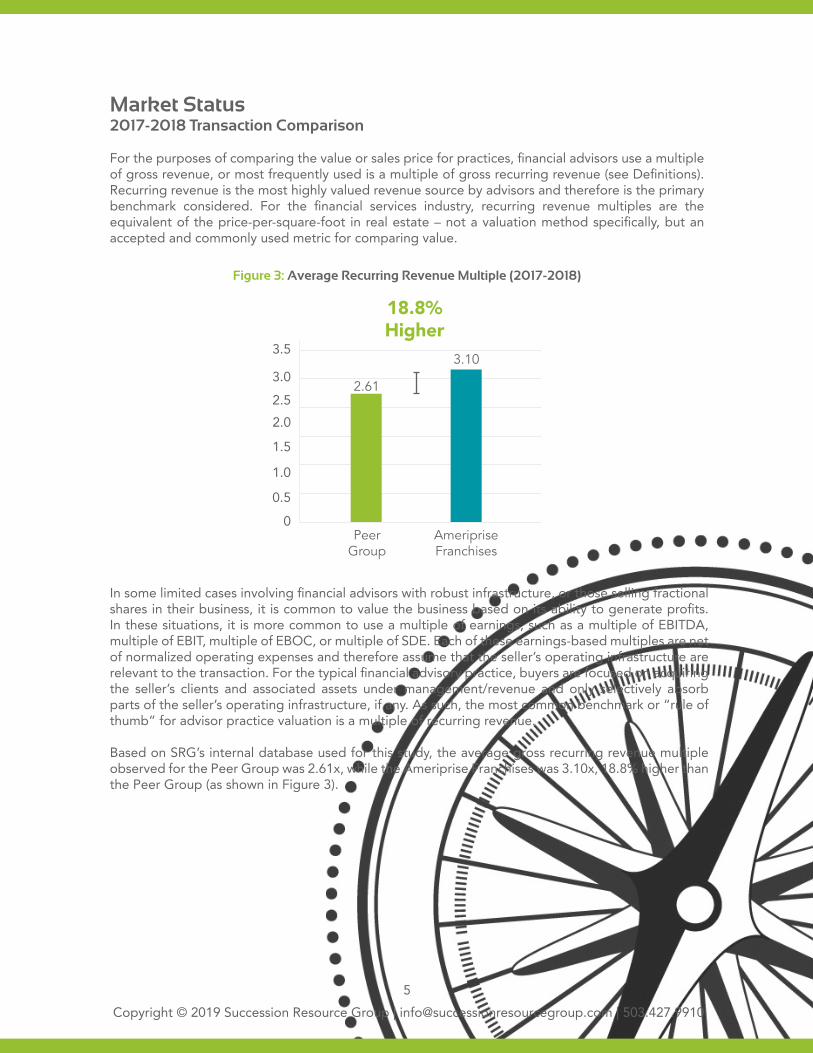
For the purposes of comparing the value or sales price for practices, financial advisors use a multiple of gross revenue, or most frequently used is a multiple of gross recurring revenue (see Definitions). Recurring revenue is the most highly valued revenue source by advisors and therefore is the primary benchmark considered. For the financial services industry, recurring revenue multiples are the equivalent of the price-per-square-foot in real estate – not a valuation method specifically, but an accepted and commonly used metric for comparing value.
Figure 3: Average Recurring Revenue Multiple (2017-2018)
In some limited cases involving financial advisors with robust infrastructure, or those selling fractional shares in their business, it is common to value the business based on its ability to generate profits. In these situations, it is more common to use a multiple of earnings, such as a multiple of EBITDA, multiple of EBIT, multiple of EBOC, or multiple of SDE. Each of these earnings-based multiples are net of normalized operating expenses and therefore assume that the seller’s operating infrastructure are relevant to the transaction. For the typical financial advisory practice, buyers are focused on acquiring the seller’s clients and associated assets under management/revenue and only selectively absorb parts of the seller’s operating infrastructure, if any. As such, the most common benchmark or “rule of thumb” for advisor practice valuation is a multiple of recurring revenue.
Based on SRG’s internal database used for this study, the average gross recurring revenue multiple observed for the Peer Group was 2.61x, while the Ameriprise Franchises was 3.10x, 18.8% higher than the Peer Group (as shown in Figure 3).
Ameriprise Franchises
0
0.5
1.0
1.5
2.02.5
3.10
2.61
Peer Group
3.0
3.5
18.8% Higher

6Copyright © 2019 Succession Resource Group | [email protected] | 503.427.9910
Findings
The recurring revenue multiple for 2017 and 2018, as well as 2013 (when this study was previously conducted), shows a consistent and growing premium paid for Ameriprise Franchises, as shown in Figure 4. The Ameriprise Franchises have sold at a premium relative to the Peer Group every year measured, with an 18.5% (2.95x / 2.49x) increase in Ameriprise recurring revenue multiples from 2013 to 2018 as compared to the Peer Group which grew at only 5.1% (2.46x / 2.34x) during the same period.
Larger practices showed a slightly higher recurring revenue multiple and premium for Ameriprise Franchises relative to the Peer Group. As indicated in the Appendix, during the 2017 to 2018 period measured, Ameriprise Franchises with $500,000 of gross revenue or more, sold for an average recurring multiple of 3.13x. This is 21.8% higher than the Peer Group with $500,000 of gross revenue or more, which sold for an average recurring multiple of 2.57x.
The Ameriprise Franchises transactions are from one franchise advisor to another existing or newly affiliated Ameriprise advisor. These “intra broker-dealer deals” have shown a historical propensity to have significantly less risk which could lead to higher premiums. When a selling advisor sells to a buyer with a different broker-dealer and/or registered investment advisor, the seller must work with the buyer to move the seller’s licenses and registration to the new firm, as well as obtain new agreements with the buyer and each client – resulting in higher risk than the internal sale.
To ensure the premium observed for Ameriprise Franchises (compared to its Peer Group) is not
Based on the analysis of the data, the combination of previously stated facts, and those summarized below, SRG has concluded that Ameriprise Franchises in 2017 and 2018, as well as restating the results of the analysis completed in 2013, sold for a premium over those of their Peer Group.
Figure 4: Historical Recurring Revenue Multiple (2013, 2017-2018)
Industry Peers
Ameriprise Franchises
premium18.6%
premium19.9%
premium6.4%
2013 2017 20180
0.51.01.52.02.53.03.5
2.34 2.492.79
3.312.95
2.46
(Previous Study)
/
simply attributable to selling internal, SRG compared the Ameriprise Franchises recurring revenue multiple to the intra broker-dealer Peer Group transactions. The results of this analysis revealed that the intra broker-dealer Peer Group in 2017-2018 sold for an average recurring revenue multiple of 2.55x as compared to the Ameriprise Franchises transactions, resulting in 3.10x. This shows that even when considering transactions happening within the same broker-dealer, Ameriprise Franchises received a 21.6% (3.10x 2.55x) premium over the intra broker-dealer Peer Group transactions.

7Copyright © 2019 Succession Resource Group | [email protected] | 503.427.9910
Key Value Drivers and Detractors
There are numerous possible explanations as to why Ameriprise Franchises, on average, sold for more than their Peer Group but no specific conclusions one can definitively infer from the data used in this study. However, it is the opinion of the author, that the following factors contribute to practice value and are possible explanations for the premium Ameriprise Franchises observed relative to its Peer Group:
• Robust Network: There is a pattern showing greater multiples for firms like Ameriprise Financial Services, Inc. that have and support a robust network for buying and selling practices versus those that do not. Broker-dealers of this size have hundreds of advisors nationwide, making intra broker-dealer transactions easier.
• Internal Support and Discussion: Ameriprise Financial Services, Inc. actively promotes the topic of “practice equity” and business valuation throughout an advisor’s career and supports value building best practices through a combination of local Field Leaders and the utilization of neutral third-party experts like SRG. As a result, Ameriprise franchises expect to sell their business and spend time throughout their career focusing on building a business that has value and is transferable.
• Technology and Reporting: Buyers tend to offer higher multiples when data is comprehensive, easily interpreted, and available through standardized and verifiable reports and dashboards – areas where Ameriprise Financial Services, Inc. appears to excel. Ameriprise Financial Services, Inc. provides numerous reports and dashboards that make key metrics involved with evaluating a practice for purchase easily available to its franchises – resulting in these key practice metrics being viewed by advisors on a regular basis. It also provides a system referred to as TotalView for example, which allows advisors using the platform with clients, to track and monitor the outside assets a client may have that are not currently on the Ameriprise platform, but could roll-over at their retirement. When TotalView is used consistently by an advisor with their clients, SRG has seen specific examples of buyers paying a premium based on the ability to project future earning potential from a practice.
• Qualified Buyers: SRG’s work representing advisors selling their practices shows that sellers have a preference for buyers that are experienced (based on years in the industry, previous acquisition experience, and credentials). The transactions reviewed for the Peer Group and the Ameriprise Franchises show a significant difference in the level of buyer experience. Ameriprise buyers had 20 years of experience, 80% had previous acquisition experience on average, and 64% had their CFP® designation. The Peer Group was less experienced by all measures, with 18 years of experience, 61% had prior acquisition experience, on 48% had their CFP® designation. Experienced buyers are more likely to understand the M&A environment due to their experience managing cash flow, transferring clients, and growing the acquired practice.
• Transferability and Retention Rates: Values received by selling advisors are largely a function of risk. Practices that have a greater perceived risk by the buyer will receive lower values. Client attrition risk is a function of the strength of the relationship between client and advisor, as well as the amount of continuity during a transition. Ameriprise’s internal track record of successful purchase and sales (based on feedback from Ameriprise Franchises interviewed for this study), combined with the company’s national brand, consistency of systems amongst its advisor population, reporting and processes from one franchise to the next, and localized field leadership to help provide support, have created a market where there is less perceived risk by buyers.

8Copyright © 2019 Succession Resource Group | [email protected] | 503.427.9910
Conclusion
Many advisors today consider their practice to be their most valuable asset, now exceeding their retirement portfolios, personal assets, and even real estate in value. This new trend of understanding and managing the practice’s value is prompting advisors to receive annual valuations to track, monitor, and build better practices that receive a premium upon selling. Ameriprise Financial Services, Inc. was one of the first broker-dealers in the industry to recognize the positive results of partnering with their advisors to build the value of their franchises. This effort has produced measurable results – as previously published in 2013, Ameriprise Franchises sold on average for a 17.50% premium, which has increased to an 18.8% premium in 2017-2018 relative to their Peer Group (Figure 3).
The market for buying and selling a financial services practice has changed over the last two decades. An advisor was rarely able to sell his or her business 20 years ago on a revenue-sharing arrangement. Advisors today are factoring the value of their practice into their retirement plans. With advanced planning, advisors now can track and influence the value of their business well in advance of their retirement. Advisors considering the sale of their business in the next decade should focus on key value drivers, like shifting to a recurring revenue model, focusing on automating business/client service processes, building an efficient and profitable business, and partnering with a broker-dealer that can/will help provide an ecosystem that supports building and transferring the value of a practice while utilizing neutral third-party industry experts. With almost 1/3 of advisors expected to be retiring in the next decade, it is reasonable to expect significant premiums paid for the most attractive and well-positioned practices for sale.

9Copyright © 2019 Succession Resource Group | [email protected] | 503.427.9910
Definitions
• EBIT: Refers to earnings before interest and taxes. EBIT is a multiple of earnings calculation.
• EBITDA: Refers to earnings before interest, taxes, depreciation, and amortization. EBITDA is a multiple of earnings calculation.
• EBOC: Refers to earnings before owner’s compensation. EBOC is a multiple of earnings calculation.
• Gross Dealer Concession (GDC): Total revenue earned by the advisor before any broker-dealer fees/overrides, if applicable.
• Gross Revenue: Total revenue earned and received by the advisor, net of any broker-dealer fees/overrides.
• Intra Broker-Dealer Deals: Transactions between advisors within the same broker-dealer.
• Multiple of Gross Revenue: Ratio that is used to measure a company’s value based on its gross revenue. Calculated by dividing the sales price by the seller’s total revenue. Calculated as follows:
• Multiple of Gross Recurring Revenue: Ratio that is used to measure a company’s value based on its gross recurring revenue. Calculated as follows:
• Non-Recurring Revenue: All Revenue that is not Recurring Revenue, including but not limited to revenue from irregular one-time events such as commissions from the sale of financial services products.
• Non-Recurring Revenue Multiple: Ratio that is used to measure a company’s value based on its non-recurring revenue. For purposes of this study, we have used 0.88x multiple.
• Recurring Revenue: Recurring revenue refers to revenue that is generated without regard to specific activities required of a business to create such revenue. Examples of recurring revenue would include advisory fees, annuity trails, 12b-1s, insurance renewals, financial planning (to the extent such services are provided and billed annually), or overrides.
• SDE: Refers to seller’s discretionary earnings. SDE is normalized earnings before owner’s compensation, and other owner discretionary expenses and benefits.
Sales Price
Gross Revenue
Sales Price- (Non-Recurring Revenue x Non-Recurring Revenue Multiple)
Gross Revenue

10Copyright © 2019 Succession Resource Group | [email protected] | 503.427.9910
Appendix
The following is a summary of the data and results. Certain excerpts of this data have been included and cited within this report.
Source Data › Total Transactions in Dataset Analyzed: 246 transactions occurring in 2017-2018
› Total Peer Group Transactions in Dataset Analyzed (excluding Ameriprise): 65 » Total Peer Group Transactions Removed from Consideration: 6 » Total Peer Group Transactions Considered: 59
› Total Ameriprise Franchises Transactions in Dataset Analyzed: 181 » Total Ameriprise Franchises Transactions Removed from Consideration: 87 » Total Ameriprise Franchises Transactions Considered: 94
Value Comparison › Peer Group recurring revenue multiple 2017-2018: 2.61x › Ameriprise Franchises recurring revenue multiple 2017-2018: 3.10x
› Peer Group recurring revenue multiple 2017-2018 ($500,000 GDC+): 2.57x › Ameriprise Franchises recurring revenue multiple 2017-2018 ($500,000 GDC+): 3.13x
» 38 Peer Group practices had $500,000 GDC or more » 59 Ameriprise Franchises had $500,000 GDC or more
› Intra broker-dealer Peer Group recurring revenue multiple 2017-2018: 2.55x › Ameriprise Franchises recurring revenue multiple 2017-2018: 3.10x
› Peer Group GDC multiple 2017: 2.21 › Ameriprise Franchises GDC multiple 2017: 2.25
› Peer Group GDC multiple 2018: 2.09 › Ameriprise Franchises GDC multiple 2018: 2.13
Buyer Comparison › Experience
» Peer Group: 18 years of experience » Ameriprise Franchises: 20 years of experience
› Acquisition Experience: » Peer Group: 61% have acquisition experience » Ameriprise Franchises: 80% have acquisition experience
› Credentials: » Peer Group: 48% have their CFP® designation » Ameriprise Franchises: 64% have their CFP® designation

11Copyright © 2019 Succession Resource Group | [email protected] | 503.427.9910
Chart 1: Data Distribution - Seller GDC
Chart 2: Data Distribution Sale Price
Peer Group
Ameriprise Franchises
Chart 3: Sources of Revenue (2017-2018)
Less than $500,000
$500,001 to $1,000,000
$1,000,001 to $3,000,000 $3,000,001+
40%35%30%25%20%15%10%5%0%
34%
8%
36%
22%
34%
7%
22%
37%
Less than $500,000
$500,001 to $1,000,000
$1,000,001 to $2,000,000 $2,000,001+
80%70%60%50%40%30%20%10%0%
64%
0%
13%23%
71%
2%10%
17%
Peer Group
Ameriprise Franchises
Ameriprise Franchises
23%
77%
Peer Group
15%
85%
Peer Group (Recurring Revenue)
Non-Recurring Revenue
Ameriprise Franchises (Recurring Revenue)

12Copyright © 2019 Succession Resource Group | [email protected] | 503.427.9910
Chart 4: Historical Comparison - Average Gross Revenue Multiple
Chart 5: Historical Comparison - Recurring and Non-Recurring Multiples
Peer Group (Recurring Revenue)
Peer Group & Ameriprise Franchises(Non-Recurring Revenue)
Ameriprise Franchises (Recurring Revenue)
0.50
1.00
1.50
2.00
2.50
3.00
3.50
2013 2017 2018
2.34
2.792.46
3.312.95
0.9 0.88
2.49
1.01
2013(Previous Study)
(Previous Study)
2017 20180
0.5
1.0
1.5
2.0
2.5
1.852.17 2.21 2.25
2.132.09 Peer Group
Ameriprise Franchises