Embed Size (px)
Citation preview

1 3
Cell. Mol. Life Sci. (2013) 70:1965–1984DOI 10.1007/s00018-012-1226-8 Cellular and Molecular Life Sciences
RESEARCH ARTICLE
Bimodal processing of olfactory information in an amphibian nose: odor responses segregate into a medial and a lateral stream
Sebastian Gliem · Adnan S. Syed · Alfredo Sansone · Eugen Kludt · Evangelia Tantalaki · Thomas Hassenklöver · Sigrun I. Korsching · Ivan Manzini
Received: 5 October 2012 / Revised: 26 November 2012 / Accepted: 27 November 2012 / Published online: 27 December 2012 © The Author(s) 2012. This article is published with open access at Springerlink.com
class I odorant receptors (ORs) mimic the spatial distribu-tion observed for the medial stream, whereas a trace amine-associated receptor closely parallels the spatial pattern of the lateral odor-processing stream. Other olfactory recep-tors (some class I odorant receptors and vomeronasal type 1 receptors) and odor responses (to bile acids, amines) were not lateralized, the latter not even in the olfactory bulb, suggesting an incomplete segregation. Thus, the olfactory system of X. laevis exhibits an intermediate stage of seg-regation and as such appears well suited to investigate the molecular driving forces behind olfactory regionalization.
Keywords Xenopus laevis · Olfactory receptor neurons · taar genes · v1r genes · or class I and class II genes · G proteins
AbbreviationsMOE Main olfactory epitheliumVNO Vomeronasal organORs Odorant receptorsV1Rs Vomeronasal receptors of type 1V2Rs Vomeronasal receptors of type 2AOB Accessory olfactory bulbMOB Main olfactory bulbTAARs Trace amine-associated receptorsORNs Olfactory receptor neurons
Introduction
The neuronal representation of odors in mammals gener-ally relies heavily on segregation in subsystems that differ anatomically, functionally, and molecularly [1–3]. The two largest subsystems are the main olfactory epithelium (MOE) and the vomeronasal organ (VNO). The MOE contains
Abstract In contrast to the single sensory surface present in teleost fishes, several spatially segregated subsystems with distinct molecular and functional characteristics define the mammalian olfactory system. However, the evolutionary steps of that transition remain unknown. Here we analyzed the olfactory system of an early diverging tetrapod, the amphibian Xenopus laevis, and report for the first time the existence of two odor-processing streams, sharply segre-gated in the main olfactory bulb and partially segregated in the olfactory epithelium of pre-metamorphic larvae. A lateral odor-processing stream is formed by microvillous receptor neurons and is characterized by amino acid responses and Gαo/Gαi as probable signal transducers, whereas a medial stream formed by ciliated receptor neurons is characterized by responses to alcohols, aldehydes, and ketones, and Gαolf/cAMP as probable signal transducers. To reveal candidates for the olfactory receptors underlying these two streams, the spatial distribution of 12 genes from four olfactory recep-tor gene families was determined. Several class II and some
S. Gliem and A. S. Syed are shared first authors, S. I. Korsching and I. Manzini are shared senior authors.
S. Gliem · A. Sansone · E. Kludt Department of Neurophysiology and Cellular Biophysics, University of Göttingen, Humboldtallee 23, 37073 Göttingen, Germany
A. S. Syed · S. I. Korsching Department of Genetics, University of Cologne, Zülpicher Strasse 47a, 50674 Köln, Germany
E. Tantalaki · T. Hassenklöver · I. Manzini (*) Cluster of Excellence “Nanoscale Microscopy and Molecular Physiology of the Brain (CNMPB)”, Department of Neurophysiology and Cellular Biophysics, University of Göttingen, Humboldtallee 23, 37073 Göttingen, Germanye-mail: [email protected]

1966 S. Gliem et al.
1 3
mostly ciliated neurons expressing the G protein Gαolf and odorant receptors (ORs) that segregate in several distinct expression zones, with class I odorant receptors stringently restricted to one of these zones. The VNO contains two sharply delineated populations of microvillous neurons, a basal layer expressing vomeronasal receptors of type 2 (V2Rs) and Gαo, and an apical layer expressing vomero-nasal receptors of type 1 (V1Rs) and Gαi. The Grüneberg ganglion and the septal organ of Masera constitute two addi-tional olfactory organs [4]. All these sensory surfaces have discrete target areas, the VNO in the accessory olfactory bulb (AOB) and all others within the main olfactory bulb (MOB). Interestingly, lungfish, the closest living relatives of tetrapods, possess several vomeronasal primordia, which share a target region in the olfactory bulb [5, 6]. It is not known whether these primordia are derived from a common ancestral structure in lobe-finned fishes or whether they rep-resent lineage-specific specializations.
In contrast, ray-finned fishes including macrosmatic species [7] possess a single olfactory sensory surface and a common olfactory bulb. Nevertheless, the two main sensory neuron populations, ciliated and microvillous neurons, as well as the main olfactory receptor families and correspond-ing G proteins all are found in the teleost fish olfactory system intermingled in the shared sensory surface [8–10]. Within the olfactory bulb, the target regions of ciliated and microvillous neurons are somewhat segregated, but are still massively intertwined [11, 12].
Xenopus laevis, as an early diverging tetrapod, is evolu-tionarily much closer to mammals than lungfish, and this also holds true for the structural design of its MOE and VNO. However, Xenopus larvae still exhibit a fully aquatic life style. The transition from aquatic to airborne olfaction within the tetrapod lineage likely required a major recon-struction of the olfactory system. The inverse transition necessitated by the secondarily aquatic life style of whales and dolphins did not succeed well, as cetaceans are by and large anosmic species [13]. It is unclear whether the segregation in different subsystems was required by the evolutionary transition to airborne olfaction. Alternatively, the tendency to segregate olfactory functions may long precede this transition. In this case, one would expect evi-dence of segregation at the molecular and functional level already in the larval olfactory system of X. laevis. Some physiological aspects of the larval Xenopus olfactory system have already been examined (for a review see [14]). Prelimi-nary information about the larval expression of one vome-ronasal and some odorant receptors is available ([15, 16], respectively), and the olfactory receptor gene repertoires of a closely related species, X. tropicalis, have been established [17]. However, there has been no attempt so far to corre-late molecular analysis and physiological function. Here we examined the spatial distribution of olfactory receptor
molecules, associated G proteins, and odor responsiveness in the main sensory surface and the olfactory bulb as well as the nose–brain connections at the same defined stage in Xenopus larval development shortly before the onset of metamorphosis. We identified a lateral stream of odor-pro-cessing characterized by responses to amino acids, the pres-ence of Gαo/Gαi and the expression of trace amine-associ-ated receptors (TAARs), which is segregated from a medial stream of odor processing, characterized by expression of class II ORs, responses to alcohols, aldehydes, and ketones and presence of Gαolf. We report that significant spatial seg-regation of odor processing occurs already in the sensory surface and that segregation of these two odor streams is enhanced in the olfactory bulb.
Materials and methods
Tracing of neuronal processes
For visualization of glomerular clusters (see also [18]) in the MOB of larval X. laevis, axons of olfactory receptor neurons (ORNs) were labeled using biocytin (ε-biotinoyl-l-lysine, Molecular Probes, Leiden, The Netherlands). All procedures for animal handling and tissue dissections were carried out according to the guidelines of the Göttingen University Committee for Ethics in Animal Experimenta-tion. Briefly, animals (stages 50–54; staged after [19]) were anesthetized with 0.02 % MS-222 (Sigma, Deisenhofen, Germany) for at least 1 min to produce complete immobil-ity. Subsequently, small crystals of biocytin were placed into both nasal cavities, platinum electrodes (0.22 mm in diam-eter) were inserted into the cavities and square pulses with alternating polarity (30 V, 20 ms, 12 pulses at 1 Hz) were applied to facilitate biocytin intake into ORNs. To allow anterograde axonal transport of the dye, the animals were then kept in water tanks at low light levels for approximately 1 day. The animals were then cooled to produce complete immobility, killed by transection of the brain at its transition to the spinal cord, and fixed in 4 % formaldehyde solution for 2 h at room temperature. A block of tissue containing the olfactory organs, olfactory nerves, and the forebrain was then excised and processed as described below.
To visualize the epithelial location of ORNs that project to the lateral or medial glomerular clusters, ORN axons of the lateral and medial axonal tracts were labeled by elec-troporation of biocytin. Briefly, a block of tissue (see above) was excised, and all tissue ventral to the olfactory bulb was cut off to get access to the axonal sorting zone. The olfactory nerve and the olfactory organs were left intact. The explant was subsequently transferred to a recording chamber filled with bath solution and a patch pipette (resistance 5–8 MΩ) filled with bath solution saturated with biocytin (Molecular

1967Bimodal processing of olfactory information
1 3
Probes) was carefully inserted into the axonal tract close to its glomerular target region. Lateral and medial axonal tracts of the left and right MOB were, respectively, labeled. Electroporation was performed by application of square pulses (100 V, 20 ms, 12 pulses at 1 Hz). The tissue block was then kept in bath solution for 4 h to allow retrograde axonal transport of biocytin and was subsequently fixed in 4 % formaldehyde solution for 2 h at room temperature.
The formaldehyde-fixed preparations were washed in PBS, embedded in 5 % low-melting point agarose (Sigma) and sectioned at 70 μm on a vibratome (Leica VT 1200S, Bensheim, Germany). The sections were then washed with PBS containing 0.2 % Triton X-100 (PBS-TX) for 15 min and incubated with Alexa Fluor 488 conjugated avidin (100 μg/ml in PBS-TX; MoBiTec, Göttingen, Germany) for 2 h at room temperature. The sections were then washed in PBS for 15 min, transferred to slides, and mounted in mount-ing medium (Dako, Hamburg, Germany). All tissue sections were viewed using a confocal laser-scanning microscope (LSM 510/Axiovert 100 M, Zeiss, Jena, Germany).
Preparations of acute slices of the MOE and nose–brain preparations
Larval X. laevis (stages 50–54) were killed as described above. For slices of the MOE, a block of tissue containing the olfactory organs, the olfactory nerves, and the forebrain was cut. The tissue was then glued onto the stage of the vibroslicer, cut horizontally into a 150-μm-thick slice, and kept in bath solution. For low magnification imaging of axon terminals in whole olfactory bulbs, tadpoles were anesthe-tized and ORNs were stained with Fluo-4 10 kDa dextran (Molecular Probes) via electroporation (as described above for biocytin). At least 24 h later, the animals were killed and tissue blocks containing the olfactory systems were excised. The connective tissue covering the ventral side of the tel-encephalon was removed prior to confocal microscopy. For
imaging individual glomeruli, we used nose–brain prepara-tions with the dorsal surface of the olfactory bulbs removed using the vibroslicer. The olfactory organs and the olfactory nerves were left intact. For a more detailed description of these preparations, see earlier work of our lab [20, 21].
Solutions, staining protocol, and stimulus application
The bath solution consisted of (in mM): 98 NaCl, 2 KCl, 1 CaCl2, 2 MgCl2, 5 glucose, 5 Na-pyruvate, 10 HEPES, 230 mOsmol/l, pH 7.8. All bath solution chemicals were purchased from Merck (Darmstadt, Germany) or Sigma and were of the highest purity available. Tissue preparations (see above) were transferred to a recording chamber, and bath solution containing 50 μM Fluo-4/AM (Molecular Probes) was added. Fluo-4/AM was dissolved in DMSO (Sigma) and Pluronic F-127 (Molecular Probes). The final concen-trations of DMSO and Pluronic F-127 did not exceed 0.5 and 0.1 %, respectively. Cells of the MOE and the olfac-tory bulb of larval X. laevis express multidrug transporters [22, 23] with a wide substrate spectrum, including calcium-indicator dyes. To avoid transporter-mediated destaining of the slices, 50 μM MK571 (Alexis Biochemicals, Grünberg, Germany), an inhibitor of multidrug transporters, was added to the incubation solution. The preparations were incubated on a shaker at room temperature for 35 min. As odorants, we used a mixture of alcohols, aldehydes, and ketones, and mixtures of amines, bile acids (obtained from crude ox bile), and amino acids, all purchased from Sigma (listed in Table 1). Furthermore, we used forskolin (Sigma) as an activator of adenylate cyclase. The odorant mixtures were dissolved in bath solution (stocks of 10–50 mM) and used at a final concentration of 100–200 μM. Forskolin was dissolved in DMSO (stock of 10 mM) and used at a final con-centration of 50 μM. In all experiments, the odorant mixtures were repeatedly applied in random order at a minimal interstimulus interval of 2 min. Bath solution was applied
Table 1 Components of odorant mixtures
Odorant mixture Componentsa
Amino acids (AA) (nose–brain prep) l-Proline, l-valine, l-leucine, l-isoleucine, l-methionine, glycine, l-alanine, l-serine, l-threonine, l-cysteine, l-arginine, l-lysine, l-histidine, l-tryptophan, l-phenylalanine
Amino acids (AA) (MOE acute slices) l-Proline, l-valine, l-leucine, l-isoleucine, l-methionine, glycine, l-alanine, l-serine, l-threonine, l-cysteine, l-asparagine, l-glutamine, l-arginine, l-lysine, l-histidine, l-glutamate, l-aspartate, l-tryptophane, l-phenylalanine
Bile acids (BA) (main components) Taurocholic acid, glycocholic acid, cholic acid, deoxycholic acid
Amines (AM) 2-Phenylethylamine, tyramine, butylamine, cyclohexylamine, hexylamine, 3-methylbutylamine, N,N-dimethylethylamine, 2-methylbutylamine, 1-formylpiperidine, 2-methylpiperidine, N-ethylcyclohexylamine, 1-ethylpiperidine, piperidine
Mixture of alcohols, ketones and aldehydes (AL) α-Terpineol, β-ionone, β-phenylethylalcohol, γ-phenylpropylalcohol, Citral
a All components used at a final concentration of 100–200 μM
1968 S. Gliem et al.
1 3
by gravity feed from a storage syringe through a funnel drug applicator to the recording chamber. The tip of the applica-tor was placed directly above the MOE. The odorants and forskolin were applied into the funnel without stopping the flow. Outflow was through a syringe needle placed close to the MOE.
Ca2+ imaging and data evaluation
Changes of intracellular calcium concentrations of indi-vidual ORNs or glomeruli were monitored using a laser-scanning confocal microscope (LSM 510/Axiovert 100 M, Zeiss). Fluorescence images (excitation at 488 nm; emis-sion >505 nm) of the MOE (acute slice of the MOE) or the olfactory bulb (nose–brain preparations) were acquired at 1.27 Hz and 786-ms exposure time per image with ten images taken as control images before the onset of stimulus application. The thickness of the optical slices excluded fluo-rescence detection from more than one cell layer or glomer-ulus. Image analysis was performed using custom programs written in MATLAB (MathWorks, Natick, MA, USA). To facilitate selection of regions of interest, a “pixel correla-tion map” was obtained by calculating the cross- correlation between the fluorescence signals of a pixel to that of its immediate neighbors and by then displaying the resulting value as a grayscale map [24]. The fluorescence changes for individual regions of interest (ORNs or glomeruli) are given as ΔF/F values. For more detailed information, see our previous work [25]. For whole olfactory bulb imag-ing, low-resolution ΔF/F data was processed using a Gauss-ian filter and is presented as a semi-transparent overlay of the peak response onto the olfactory bulb structure.
In order to quantify the spatial distribution of ORNs responding to amino acids or forskolin, the MOE was sub-divided into three parts with equal length of the enclos-ing borders (see Fig. 3a) using the image-processing and analysis tool ImageJ (http://rsbweb.nih.gov/ij/). Cells with particular response specificities were counted in each of the three MOE subdivisions.
Immunohistochemistry
The following antibodies were used: Gαolf/s (Santa Cruz Biotech, cat-no. sc-383, lot H1409); Gαi3 (Santa Cruz Biotech, cat-no. sc-262, lot E0710, also cross-reacting with other Gαi proteins according to manufacturer information); Gαo (Abcam, Ab35150, lot GR39385-1); Gαq/11 (Santa Cruz Biotech, cat-no. sc-46972, lot A0208); Gαq (Santa Cruz Bio-tech, cat-no. sc-393, lot D0510); anti-tubulin (acetyl K40, Abcam, Ab11323, lot 6-11B-1); Alexa Fluor 488 goat anti-mouse (MoBiTec, cat-no. AZA11001); Alexa Fluor 546 goat anti-mouse (MoBiTec, cat-no. AZA11003); Alexa Fluor 488 goat anti-rabbit (MoBiTec, cat-no. AZA11008); Alexa Fluor
546 goat anti-rabbit (MoBiTec, cat-no. AZA11010); Alexa Fluor 488 rabbit anti-goat (MoBiTec, cat-no. A11078).
Antisera directed against the G protein α-subunits Gαolf/s, Gαo and Gαi were used to localize different subsets of receptor neurons (see [15, 26, 27]) in the olfactory organ of larval X. laevis and to determine their projection pattern into the olfactory bulb. In some cases, ORNs were visualized by retrograde biocytin labeling (see [28]). Gαq/11 and Gαq only stained non-sensory supporting cells (data not shown).
Larval X. laevis (stages 50–54) were killed as described above. Tissue blocks (see above) were fixed in 4 % formal-dehyde solution for 2 h at room temperature, equilibrated in 30 % saccharose, and embedded in Jung tissue freezing medium (Leica) for cryosectioning (10–20 μm sections). Sections were washed in PBS-TX, and non-specific bind-ing was blocked with 3 % normal goat serum (ICN, Aurora, OH, USA) for Gαi stainings, or 3 % bovine serum albu-min (Sigma) for Gαolf/s and Gαq/11 stainings, or 2 % bovine serum albumin for Gαo and Gαq, in PBS-TX for 1 h. The sections were then incubated overnight at 4 °C with the primary antibodies (1:200) diluted in the respective block-ing solution/PBS. Primary antibodies were washed off with PBS and the respective fluorophore-coupled secondary anti-bodies were applied at a dilution of 1:500 in 1 % blocking solution/PBS for 2 h at room temperature. The secondary antibodies were then washed off in several changes of PBS. To allocate signaling molecule expression to either cili-ated or microvillous ORNs, we performed double-labeling experiments with antibodies against Gαolf/s, Gαi and Gαo together with antibodies against tubulin (ciliary marker; 1:2,000) or fluorophore-coupled phalloidin (marker for microvilli; 1:250; Alexa Fluor 488 coupled to phalloidin, MoBiTec, cat-no. AZA12379; Alexa Fluor 546 coupled to phalloidin, MoBiTec, cat-no. AZA22283). All prepara-tions were then transferred to slides, mounted in mounting medium (Dako) and viewed using a confocal laser-scanning microscope (LSM 780/upright Axio Examiner Z1, Zeiss). Optical sections were processed using ZEN software (Zeiss) and displayed as maximum intensity projections.
In order to quantify the spatial distribution of G protein-like immunoreactivity, we subdivided the MOE as described in the section above, and summed up the G protein-related fluorescence intensity values of the entire area of each sub-division of the MOE.
Western-blot analysis
Western blots were performed to test the specificity of anti-bodies directed against mammalian G alpha protein subu-nits Gαolf/s, Gαo and Gαi in larval X. laevis. Tissue from the olfactory organs and the olfactory bulb from larval X. laevis (stages 43–45, 52–54 and 64–66) was collected and immediately conserved in liquid nitrogen. The frozen

1969Bimodal processing of olfactory information
1 3
tissue samples were then homogenized using a glass homog-enizer in lysis buffer containing 10 mM Tris/HCl, pH 7.4, 0.1 % SDS, 1 mM EDTA pH 8.0, 1 % Triton X100, and a protease inhibitor mixture (Sigma). The lysate was centri-fuged at 10,000 × g for 1 min, and the protein content in the supernatant was quantified by BCA assay (Thermo Scien-tific, Rockford, USA). Equal amounts of protein (30 μg per lane) were separated in 10 % SDS-PAGE gels under reduc-ing conditions and then transferred to Amersham Hybond-ECL nitrocellulose membranes (GE Healthcare, Little Chal-font, England) for Western-blot analysis. The membranes were blocked with 5 % non-fat dry milk in PBS-Tween 20 (137 mM NaCl, 2.7 mM KCl, 8 mM Na2HPO4, 1.46 mM KH2PO4, 0.05 % Tween 20, pH 7.4) and incubated overnight at 4 °C with 1:1,000 dilution of the primary antibodies (anti-Gαolf/s, anti-Gαo and anti-Gαi, for details see above). Blots were washed three times with PBS Tween 20 and probed with horseradish peroxidase (HRP)-conjugated secondary antibodies (Dianova, anti-rabbit) for 1 h at a concentration of 1:2,000 at room temperature. The blots were washed again three times with PBS Tween 20, developed using Ace-Glow chemiluminescence substrate (peqlab, Erlangen, Ger-many) and analyzed by Bio1D software (Vilber Lourmat, Eberhardzell, Germany). The experiments revealed bands in the range of the appropriate molecular weight.
In situ hybridization
Xenopus laevis genomic DNA was extracted using stand-ard protocols and used for PCR-mediated cloning. For this study, 12 genes from four olfactory receptor families were used. Primers were designed using published sequence infor-mation for the OR class l (xb242, xr116, or52d1) and OR class ll (xb180, xb177, xgen147) receptor genes, ([16, 29]; Mezler and Breer, GenBank entries). Primers were designed for two v1r genes (v1r10, v1r11) reported in [27], and one v1r gene (v1r6) was cloned using the homology approach with v1r6 in X. tropicalis. The X. laevis v1r6 turned out to share 92 % amino acid sequence identity with its ortholog in X. tropicalis. For two TAAR (taar1, taar4a) and one v2r gene (xv2r E-1), we used the primer set described in [30] and [15], respectively. The primer sequences we used were: xr116 (5′-GTGACTCTCCTCTGCTACTT-3′, 5′-AGTAAAAACCGTCCGTCTTG-3′), xb242 (5′-ACCA ATGCAGTGGTATTAGTG-3′, 5′-TGGGTACTAGATTTG TGCTCG-3′), or52d1 (5′-GAYTCYTTCATCMTYATGCTG ATG-3′, 5′-CHAWTARRTGRGTGGTACAGGT-3′), xb180 (5′-AATGAAGGAGCCACAATGTAC-3′, 5′-GCAATAATG AGTACGCCAATG-3′), xb177 (5′-TTACCTTCTGATAAT CTGGGAG-3′, 5′-AGCAACAATGGACAATACAAC-3′), xgen147 (5′-CAGTRATGTCCTWTGACAG-3′, 5′-TCCC GGTATTGGACACTATC-3′), v1r11 (5′-AGYCAACCTC ATACTCTACC-3′, 5′-TCTGTCTGTGCTCCTTTTGC-3′),
v1r10 (5′-CAGTTTGCTCAGCTGTTATCAG-3′, 5′-GTSA GATAGTCCRTGTCACAG-3′), v1r6 (5′-TCATTCTCAAT GCCCGTACA-3′, 5′-CCAAAACCATTAGCCCAACA-3′), taar1 (5′-GCCTTCACAATGGTATTTCTGG-3′, 5′-CCT ATCTCTGCTTCGGGACAC-3′), taar4a (ACTTGGTCTG TTTCCTGTGTGTTTT-3′, 5′-TGGAAACTATGGTGGTT ATGTACAAG-3′), xv2r E-1 (5′-TGAGCTTCCTCCTCCT TGTC-3′, 5′-GGTAATGTCCGAGCTAAAAATGC-3′).
Resulting fragment lengths varied from 200 to 500 bp. All the genes were cloned into pDrive (Qiagen, Hilden, Germany) and later confirmed by sequencing. Antisense probes for in situ hybridization were derived from the cloned DNA by PCR, using the same primer sequences, but one of them with a T3 (TATTAACCCTCACTAAAGG-GAA) promoter site attached to the 5′-end. Digoxigenin (DIG) was incorporated into the probes according to the DIG RNA labeling kit supplier protocol (Roche Molecular Biochemicals, Mannheim, Germany). Olfactory organ tis-sue blocks were prepared as described for immunohisto-chemistry. Cryostat sections of 10–12 μm were obtained and postfixed in 4 % paraformaldehyde for 10–15 min at room temperature.
Hybridizations were performed overnight at 60 °C using standard protocols. Anti-DIG primary antibodies coupled to alkaline phosphatase (Roche Molecular Biochemicals) and NBT-BCIP (Roche Molecular Biochemicals) were used for signal detection.
In order to quantify the spatial distribution of olfactory receptor genes, the MOE was subdivided into three parts as described above. Areas were nearly identical for the subre-gion close to the VNO (medial region) and the intermediate region (36 and 35 %, respectively), but somewhat less for the lateral region, most distant from the VNO (29 %). Half of the in situ experiments were randomized and cell count was done blindly with respect to the genes involved. No difference in the results from non-randomized evaluation was seen.
Results
The lateral and medial glomerular cluster exhibit distinctly different odor-response profiles
We analyzed the medial-to-lateral spatial distribution of olfactory bulb responses to four main odor groups of aquatic animals, amino acids (feeding stimulants, [31, 32]), amines (also food signals, [32, 33]), bile acids (social interactions, [31, 32, 34]) and alcohols, aldehydes, and ketones [35]. In addition, we analyzed olfactory bulb responses upon mucosal application of forskolin, an activator of the cAMP-dependent transduction pathway of ORNs.
In low magnification views of the whole olfactory bulb (Fig. 1a), application of amino acids and forskolin to the

1970 S. Gliem et al.
1 3
intact olfactory organ induced transient increases of Ca2+-dependent fluorescence of Fluo-4 in the neuropil of the glomerular layer (Fig. 1b). Amino acids preferentially induced responses in the lateral cluster, whereas forskolin elicited activity predominantly in the medial cluster. For analysis of individual glomeruli, we used nose–brain prep-arations with the surface of the olfactory bulbs removed. Odor-responsive structures were first allocated to one of the known glomerular clusters of the MOB (see Fig. 1a).
We then focused on the responding neuropil and repeated the odorant application to verify that the responding spots were individual, clearly delineated glomeruli with the typi-cal fine structure (Fig. 1c, pseudocolored and grayscale images). The reproducibility of glomerular responses was verified in nearly all cases by repeating the odorant appli-cation at least twice. The signals were odor-specific, since application of bath solution alone never evoked a compa-rable response (see Fig. 1c).

1971Bimodal processing of olfactory information
1 3
As representative examples, we show the response char-acteristics of two glomeruli to all four odor groups (Fig. 1c). The first glomerulus, a component of the medial cluster, reacts only to amines, the second glomerulus, situated in the lateral cluster, only to amino acids. In total, we analyzed odor responses of 80 glomeruli that could be clearly allo-cated to a glomerular cluster (n = 32, nose–brain prepara-tions; 42, 15, and 23 glomeruli for lateral, intermediate, and medial cluster, respectively; Fig. 1d). Thirty-three glomeruli were tested with all four odor groups, and of these, the large majority reacted only to a single of the four odor groups (Fig. 1e). Of the 24 monoresponsive glomeruli, seven reacted to the mixture of amino acids, six to bile acids, seven to amines, and four to the mixture of alcohols, alde-hydes, and ketones. With one exception, the odor responses of the remaining nine glomeruli were restricted to two out of four odor groups. Amine responses were found to co-exist with all three other odor groups, likewise for bile acids, however we never found a glomerulus that reacted to both amino acids and alcohols, aldehydes, and ketones (Fig. 1e).
Clear positional preferences were seen already in the overview of the whole olfactory bulb for amino acid and forskolin responses: amino acid responses were nearly
exclusively found in the lateral cluster, while forskolin responses showed a complementary restriction to the medial cluster (Fig. 1b). This result was confirmed by the examina-tion of single glomeruli at higher magnification, where we found an almost exclusive location of amino acid-respon-sive glomeruli in the lateral cluster (Fig. 1d), consistent with previous observations [18, 36]. Moreover, the glomeruli responsive to alcohols, aldehydes, and ketones were almost exclusively located in the other large cluster, the medial glo-merular cluster (Fig. 1d). In contrast, bile acid- and amine-responsive glomeruli were more broadly distributed, and were found in all three cluster regions, lateral, intermediate and medial (Fig. 1d).
Lateral and medial glomerular cluster in the olfactory bulb are innervated by spatially segregated populations of receptor neurons
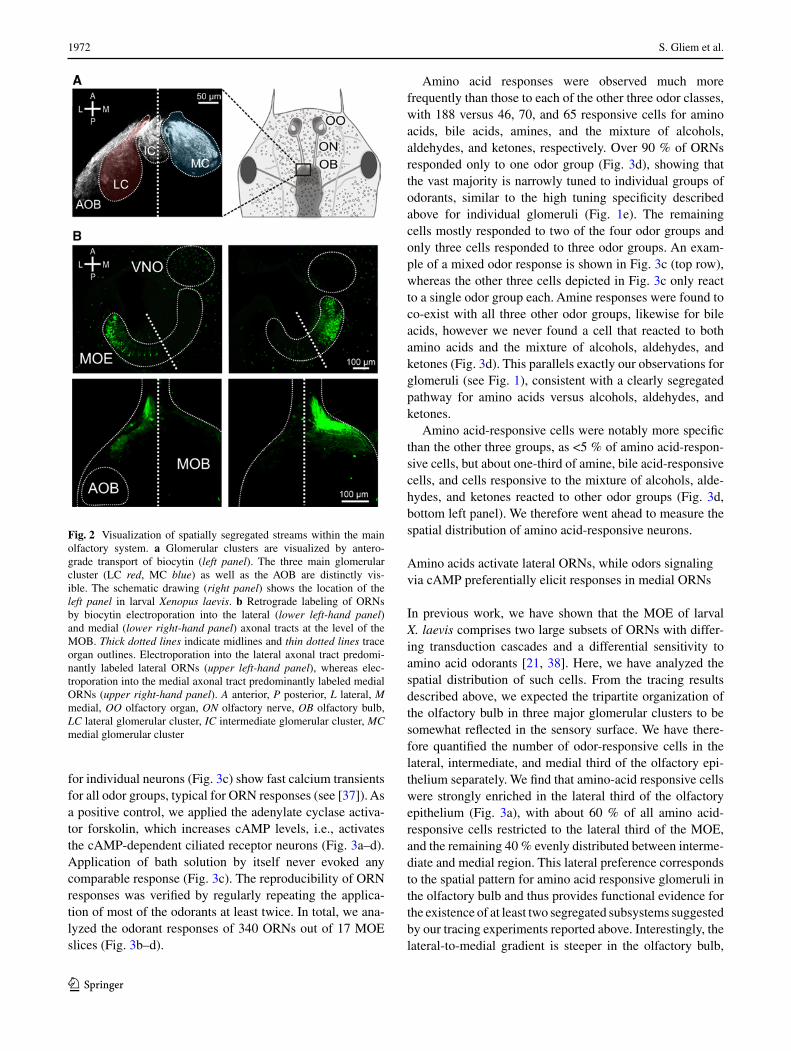
To what extent is the functional segregation apparent in the glomerular response patterns in the olfactory bulb already present in the sensory surface? To analyze this question we used retrograde tracing of biocytin from the axonal tracts emerging from the lateral and medial cluster (Fig. 2a) at very lateral and very medial positions, respectively. For lat-eral injections, the large majority of biocytin-labeled somata were situated in the lateral part of the MOE, but occasion-ally cells were also found in the medial region (Fig. 2b). For medial injections, the distribution of labeled somata was the inverse, i.e., the vast majority were positioned in the medial part of the MOE and only rarely were cells found in the lateral region (Fig. 2b). These findings show that the seg-regation apparent in the olfactory bulb is already present in the olfactory epithelium, some overlap of the two subsys-tems notwithstanding. These two spatially segregated ORN projection paths will be named lateral and medial stream throughout the manuscript.
The existence of these two subsystems suggests that the receptor neuron sub-populations projecting to the lateral and the medial cluster of glomeruli should have distinct response properties, reflecting that of the respective glomerular clusters. Thus we proceeded to measure calcium responses of individual ORNs in situ using acute slices of the MOE stained with the calcium-indicator dye Fluo-4.
Most receptor neurons are specific for one of the four odor groups
We detected sparse populations of responsive receptor neurons for all four odor groups tested for glomerular responses (Fig. 3a, b). For amino acids and amines, this cor-roborates earlier observations [28, 30], whereas responses to bile acids and the mixture of alcohols, aldehydes, and ketones had not been examined so far. Representative traces obtained
Fig. 1 Odorant responses in the glomerular layer of the main olfac-tory bulb. a Schematical representation of the nose–brain prepara-tion (left panel) and the three main glomerular clusters of the MOB (right panel). b Whole-mount olfactory bulb preparation stained with Fluo-4 dextran showing the three main clusters of the MOB (upper panel; LC red, MC blue). Application of amino acids preferentially induced an increase in Ca2+-dependent fluorescence in the lateral cluster (intermediate panel), whereas forskolin elicited activity pre-dominantly in the medial cluster (lower panel). A representative example of seven separate experiments is shown. c Sequence of three pseudocolored images showing calcium transients of an individual glomerulus situated in the medial cluster upon application of amines. The images were taken before stimulus application, at the peak of the response and after return to the baseline fluorescence (from left to right). The fine glomerular structure of the activated glomerulus was visualized by a grayscale correlation map (rightmost image; see “Materials and methods” for details). The time courses of the [Ca2+]i transients of the glomerulus, evoked by mucosal application of the different odorant groups are given below the images. The lower group of pictures shows an individual glomerulus, situated in the lateral cluster, responsive solely to amino acids (same explanation as above). d Histogram showing the location of odorant-responsive glomeruli (n = 80 glomeruli from 32 nose–brain preparations). e Out of 33 glomeruli tested for their responsiveness to all four odorant groups, 24 responded to one odorant group, eight responded to two odor-ant groups, and one glomerulus to three odorant groups (left panel). Odorant profiles of multiresponsive glomeruli are shown in the right panel. All odorants were applied at a final concentration of 200 μM, forskolin was applied at a final concentration of 50 μM. A anterior, P posterior, L lateral, M medial, OO olfactory organ, ON olfactory nerve, OB olfactory bulb, AA amino acids, AL alcohols, ketones, and aldehydes, AM amines, BA bile acids, FO forskolin, LC lateral glomerular cluster, IC intermediate glomerular cluster, MC medial glomerular cluster, V lateral ventricle, control application of bath solution
◂
1972 S. Gliem et al.
1 3
for individual neurons (Fig. 3c) show fast calcium transients for all odor groups, typical for ORN responses (see [37]). As a positive control, we applied the adenylate cyclase activa-tor forskolin, which increases cAMP levels, i.e., activates the cAMP-dependent ciliated receptor neurons (Fig. 3a–d). Application of bath solution by itself never evoked any comparable response (Fig. 3c). The reproducibility of ORN responses was verified by regularly repeating the applica-tion of most of the odorants at least twice. In total, we ana-lyzed the odorant responses of 340 ORNs out of 17 MOE slices (Fig. 3b–d).
Amino acid responses were observed much more frequently than those to each of the other three odor classes, with 188 versus 46, 70, and 65 responsive cells for amino acids, bile acids, amines, and the mixture of alcohols, aldehydes, and ketones, respectively. Over 90 % of ORNs responded only to one odor group (Fig. 3d), showing that the vast majority is narrowly tuned to individual groups of odorants, similar to the high tuning specificity described above for individual glomeruli (Fig. 1e). The remaining cells mostly responded to two of the four odor groups and only three cells responded to three odor groups. An exam-ple of a mixed odor response is shown in Fig. 3c (top row), whereas the other three cells depicted in Fig. 3c only react to a single odor group each. Amine responses were found to co-exist with all three other odor groups, likewise for bile acids, however we never found a cell that reacted to both amino acids and the mixture of alcohols, aldehydes, and ketones (Fig. 3d). This parallels exactly our observations for glomeruli (see Fig. 1), consistent with a clearly segregated pathway for amino acids versus alcohols, aldehydes, and ketones.
Amino acid-responsive cells were notably more specific than the other three groups, as <5 % of amino acid-respon-sive cells, but about one-third of amine, bile acid-responsive cells, and cells responsive to the mixture of alcohols, alde-hydes, and ketones reacted to other odor groups (Fig. 3d, bottom left panel). We therefore went ahead to measure the spatial distribution of amino acid-responsive neurons.
Amino acids activate lateral ORNs, while odors signaling via cAMP preferentially elicit responses in medial ORNs
In previous work, we have shown that the MOE of larval X. laevis comprises two large subsets of ORNs with differ-ing transduction cascades and a differential sensitivity to amino acid odorants [21, 38]. Here, we have analyzed the spatial distribution of such cells. From the tracing results described above, we expected the tripartite organization of the olfactory bulb in three major glomerular clusters to be somewhat reflected in the sensory surface. We have there-fore quantified the number of odor-responsive cells in the lateral, intermediate, and medial third of the olfactory epi-thelium separately. We find that amino-acid responsive cells were strongly enriched in the lateral third of the olfactory epithelium (Fig. 3a), with about 60 % of all amino acid-responsive cells restricted to the lateral third of the MOE, and the remaining 40 % evenly distributed between interme-diate and medial region. This lateral preference corresponds to the spatial pattern for amino acid responsive glomeruli in the olfactory bulb and thus provides functional evidence for the existence of at least two segregated subsystems suggested by our tracing experiments reported above. Interestingly, the lateral-to-medial gradient is steeper in the olfactory bulb,
Fig. 2 Visualization of spatially segregated streams within the main olfactory system. a Glomerular clusters are visualized by antero-grade transport of biocytin (left panel). The three main glomerular cluster (LC red, MC blue) as well as the AOB are distinctly vis-ible. The schematic drawing (right panel) shows the location of the left panel in larval Xenopus laevis. b Retrograde labeling of ORNs by biocytin electroporation into the lateral (lower left-hand panel) and medial (lower right-hand panel) axonal tracts at the level of the MOB. Thick dotted lines indicate midlines and thin dotted lines trace organ outlines. Electroporation into the lateral axonal tract predomi-nantly labeled lateral ORNs (upper left-hand panel), whereas elec-troporation into the medial axonal tract predominantly labeled medial ORNs (upper right-hand panel). A anterior, P posterior, L lateral, M medial, OO olfactory organ, ON olfactory nerve, OB olfactory bulb, LC lateral glomerular cluster, IC intermediate glomerular cluster, MC medial glomerular cluster

1973Bimodal processing of olfactory information
1 3
where not a single amino acid-responsive glomerulus was observed in the medial cluster (Fig. 1d), pointing to further sorting-out within the olfactory nerve connecting MOE and olfactory bulb.
Cells responding to the mixture of alcohols, aldehydes, and ketones appeared to exhibit a preferentially medial loca-tion, while responses to bile acids as well as amines seemed more evenly distributed through all regions of the olfactory
epithelium (data not shown). However, due to low cell num-bers, quantification was not reliably possible in these cases. We have therefore chosen to analyze the spatial distribu-tion of cells responding to forskolin, as a summary measure for neurons transducing odor signals via cAMP. From our olfactory bulb responses (see Fig. 1) and from comparison with other species, these may be expected to include three of the four odor groups tested here, amines, bile acids, and
Fig. 3 Odorant responses at the level of the main olfactory epithe-lium. a Acute slice preparation of the whole MOE stained with Fluo-4 (image acquired at rest). The red ovals indicate somata of indi-vidual ORNs that responded to the mixture of amino acids (100 μM). Quantitative evaluation (right panel) shows more amino acid-respon-sive cells in the lateral third of the MOE compared to intermediate and medial segments (n = 116 ORNs from 13 acute slices of the MOE). The blue ovals indicate somata of forskolin-responsive cells (50 μM) of the same slice preparation. Significantly more forskolin-responsive cells were located in the medial and intermediate third of the MOE compared to its lateral third (n = 600 ORNs from 14 acute slices of the olfactory epithelium). Statistical analysis was performed using a t test; *p < 0.05, **p < 0.01; error bars show SEM. b Acute slice preparation of the MOE stained with Fluo-4 (image acquired at rest). Field of view does not cover the whole MOE. The colored ovals indicate somata of individual ORNs that responded to the mix-
ture of alcohols, aldehydes, and ketones (yellow), amines (green), bile acids (magenta), amino acids (red) or to forskolin (blue). All odorants were applied at a final concentration of 200 μM, forskolin at a final concentration of 50 μM. c Time courses of [Ca2+]i transients of four responsive ORNs of this slice. d Out of 340 ORNs tested (n = 17 acute slices), 314 responded to only one odorant group whereas 23 responded to two odorant groups and three to three odorant groups (upper left panel). The exact odorant profile of multiresponsive cells is shown in the upper right panel. The histogram in the lower left-hand panel gives the frequencies of correlated responses to the tested odorant groups. The lower right-hand panel gives the correlation of odorant- and forskolin-sensitivity of individual ORNs. L lateral, M medial, AA amino acids, AL alcohols, ketones, and aldehydes, AM mixture of amines, BA mixture of bile acids, FO forskolin, control application of bath solution

1974 S. Gliem et al.
1 3
alcohols, aldehydes, ketones [12, 39, 40]. Amino acids are expected to mostly signal via a cAMP-independent mecha-nism [12, 41]; but see [11].
We found forskolin-responsive cells to be moderately depleted in the lateral segment, with no difference between intermediate and medial segments (Fig. 3a). Thus, the for-skolin response was inversely distributed to the amino acid response. In terms of absolute numbers of cells counted, the lateral depletion of forskolin is very similar to the lateral enrichment of amino acid-responsive cells, consistent with the notion that these two pathways are strictly segregated and may amount to most or all of olfactory signaling in the MOE.
The analysis of traces originating from individual cells confirms this prediction of exclusivity between amino acid response and forskolin response (Fig. 3c, d). Virtually all amino acid-sensitive ORNs did not respond to forskolin and virtually all ORNs responsive to the mixture of alcohols, aldehydes, and ketones were sensitive to forskolin (Fig. 3d, bottom right panel). Interestingly, while the large majority of bile acid- and amine-responsive cells were activated by forskolin, about one-fourth were not, suggesting that bile acid- as well as amine-responsive cell groups are not homo-geneous, but contain cells signaling via cAMP as well as via a cAMP-independent pathway. This heterogeneity of bile acid- and amine-responsive receptor neurons may explain their broader spatial distribution and less narrow chemical tuning compared to the two other groups.
The lateral sensory surface contains microvillous neurons that express Gαi and Gαo, whereas the medial region contains ciliated neurons that express Gαolf/s
In the mammalian olfactory system, two main signal trans-duction pathways are known. One is the so-called canonical pathway, which uses Gαolf and cAMP, and is found in cili-ated receptor neurons; the other uses Gαi or Gαo and is found in microvillous neurons [2]. Our results with forskolin, detailed above, suggest that the medial subsystem, which is responsive to alcohols, aldehydes, and ketones, signals via cAMP and therefore might be in ciliated receptor neurons, whereas the amino acid-responsive lateral subsystem may be expected to reside in microvillous receptor neurons. To test these hypotheses, we have analyzed the spatial distribu-tion of G proteins both in the olfactory epithelium and the olfactory bulb, alone and in combination with markers for cilia and microvilli (Figs. 4, 5). The latter was necessary, because in larval X. laevis the processes of microvillous and ciliated receptor neurons are not much different in length and can therefore not be distinguished unequivocally by morphology (data not shown; see also [42]).
For immunohistochemical localization, we employed antibodies against Gαi, Gαo and Gαolf/s, whose specificity
was confirmed in Western blots of olfactory bulb and olfac-tory organ (Fig. 5). All three antibodies stain the apical sur-face, i.e., the apical endings of ORNs, as well as axons in the olfactory nerve and olfactory bulb (Fig. 5a, d and g), but not the cell somata.
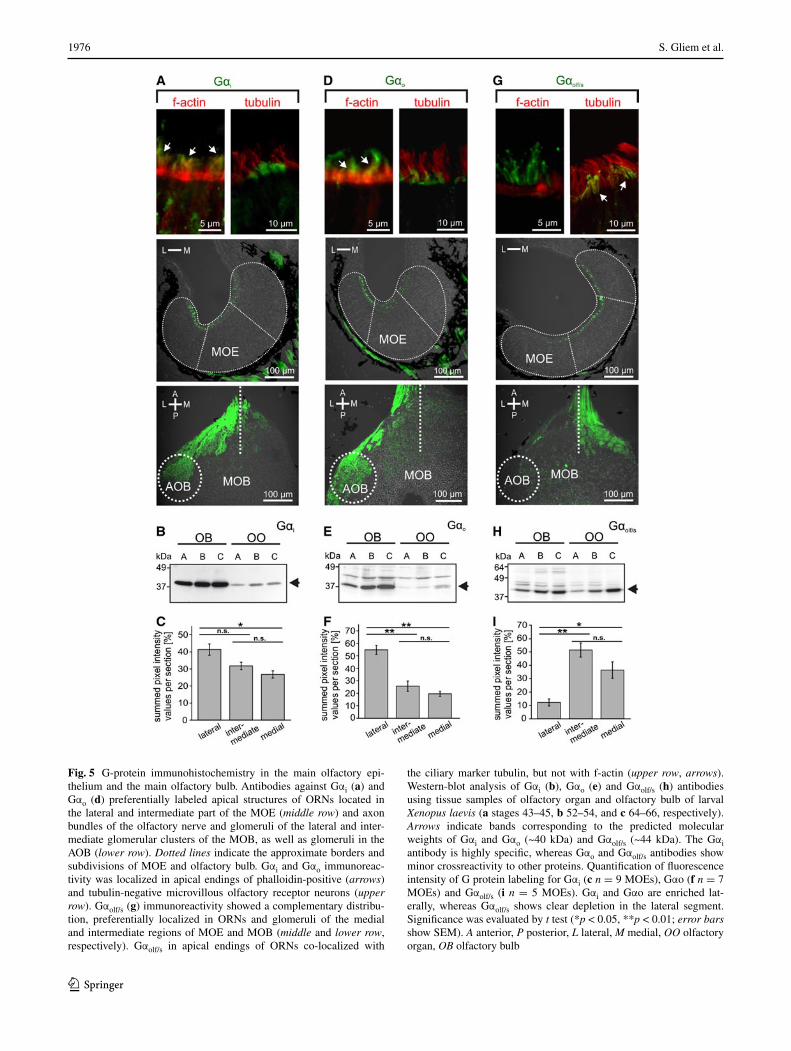
Gαi-like and Gαo-like immunoreactivity showed a graded distribution, decreasing from the lateral to medial area of the MOE (Fig. 5a, c, d, f). A drastically different distribu-tion was observed for Gαolf/s-like immunoreactivity, which was strongly enriched in the medial and intermediate part of the MOE, but very minor in the lateral part (Fig. 5g, i). The distributions in the olfactory bulb are even more sharply delineated, with Gαi and Gαo nearly exclusively restricted to the lateral glomerular cluster (and the AOB), and Gαolf/s restricted to glomeruli of the medial and intermediate glo-merular cluster (Fig. 5a, d, g; bottom panels). A similar seg-regation is already seen in the olfactory nerve layer of the olfactory bulb, with the Gαi and Gαo containing fibers pref-erentially located in the lateral part and the Gαolf/s contain-ing fibers preferentially located in the medial part (Fig. 5a, d, g; bottom panels). Thus, considerable sorting out occurs en route to the olfactory bulb, consistent with the sorting out seen for amino acid-responsive and forskolin-responsive neurons (Figs. 1, 2, 3). These data suggest that the lateral stream signals via Gαi and Gαo and the medial stream may signal via Gαolf/s.
To establish the cell types expressing the respective G proteins, we used phalloidin, a marker for f-actin that is abundant in microvilli [43] and antibodies against tubulin as a ciliary marker [44]. Both markers label the whole sensory as well as non-sensory epithelium (Fig. 4), due to the pres-ence of microvilli and cilia also in supporting and non-sen-sory cells [42]. Double-labeling experiments with G protein antibodies revealed that both Gαi-like and Gαo-like immu-noreactivity are restricted to the apical endings of microvil-lous ORNs (Fig. 5a, d, upper panel), whereas Gαolf/s-labeled structures could be identified as cilia of ORNs (Fig. 5g, upper panel).
Our data suggest the medial olfactory stream to be com-posed of ciliated receptor neurons and the lateral stream to consist of microvillous receptor neurons.
Microvillous and ciliated receptor neuron populations are expected to express different receptor families. As a first step in linking such molecular features to the two streams, we cloned 12 genes from the four olfactory receptor gene families of X. laevis and investigated their spatial distribu-tion within the olfactory epithelium by in situ hybridization.
Sparse expression patterns of or class I, or class II, v1r and taar genes in the larval MOE
We performed in situ hybridizations with members of or class I and II, v1r, v2r, and taar olfactory receptor gene

1975Bimodal processing of olfactory information
1 3
families, using RNA probes for a total of 12 different genes. We show that taar1 was not expressed in the sensory surface (Fig. 6j), and thus may have a non-olfactory role in Xenopus, as has been reported for mammalian and fish orthologs of taar1 [45, 46].
The v2r probe was chosen for its extensive crossreactiv-ity with many closely related v2r genes. The probe covers a highly conserved region of the v2r gene and a MSA (Mul-tiple Sequence Alignment) search in the X. tropicalis V2R repertoire finds 75 family members with sequence identity 94 % and above (data not shown). This probe labels a dense population of cells in the VNO (Fig. 6l), presumably due to extended cross-reactivity. However, expression is nearly absent from the MOE, and only occasionally a labeled cell
was observed (data not shown, see also [15], well below the expression frequency observed for single receptor genes of about 1–2 cells/section. Due to this near absence in the MOE, genes detected by this probe are not candidates for mediating odor responses in the MOE. In contrast, all v1r, class I and II or genes and one taar gene examined were absent from the VNO and found exclusively within the MOE (Fig. 6), exhibiting sparse expression patterns charac-teristic of individual olfactory receptor genes [47] and simi-lar to adult, post-metamorphic expression patterns, which have been reported for some of these genes [16, 27, 29]. For or and taar genes, an expression in the MOE is expected, as both fish and mammals show this pattern. The MOE-specific V1R expression parallels the situation in
Fig. 4 Tubulin and actin identify cilia and microvilli, respectively. a Antibodies against tubulin and a marker of f-actin (phalloidin) both labeled structures in the whole MOE and in the adjacent non-sensory epithelium (NSE; tubulin, left-hand panel; f-actin, right-hand panel). b Higher magnifications of the apical MOE show cilia labeled with antibodies against tubulin (left-hand panel), micro-villi labeled with phalloidin (middle panel), and a double-labeled MOE (right-hand panel). c ORNs and their pro-cesses were visualized by nerve backfills with biocytin and double labeled with antibodies against tubulin (left panel, cili-ated neuron, the arrow points to cilia), and phalloidin (middle and right panels, microvillous neurons, arrows point to olfac-tory knobs). Another backfilled neuron with somewhat longer processes (asterisk) was not labeled by phalloidin, i.e., it is a ciliated neuron
1976 S. Gliem et al.
1 3
Fig. 5 G-protein immunohistochemistry in the main olfactory epi-thelium and the main olfactory bulb. Antibodies against Gαi (a) and Gαo (d) preferentially labeled apical structures of ORNs located in the lateral and intermediate part of the MOE (middle row) and axon bundles of the olfactory nerve and glomeruli of the lateral and inter-mediate glomerular clusters of the MOB, as well as glomeruli in the AOB (lower row). Dotted lines indicate the approximate borders and subdivisions of MOE and olfactory bulb. Gαi and Gαo immunoreac-tivity was localized in apical endings of phalloidin-positive (arrows) and tubulin-negative microvillous olfactory receptor neurons (upper row). Gαolf/s (g) immunoreactivity showed a complementary distribu-tion, preferentially localized in ORNs and glomeruli of the medial and intermediate regions of MOE and MOB (middle and lower row, respectively). Gαolf/s in apical endings of ORNs co-localized with
the ciliary marker tubulin, but not with f-actin (upper row, arrows). Western-blot analysis of Gαi (b), Gαo (e) and Gαolf/s (h) antibodies using tissue samples of olfactory organ and olfactory bulb of larval Xenopus laevis (a stages 43–45, b 52–54, and c 64–66, respectively). Arrows indicate bands corresponding to the predicted molecular weights of Gαi and Gαo (~40 kDa) and Gαolf/s (~44 kDa). The Gαi antibody is highly specific, whereas Gαo and Gαolf/s antibodies show minor crossreactivity to other proteins. Quantification of fluorescence intensity of G protein labeling for Gαi (c n = 9 MOEs), Gαo (f n = 7 MOEs) and Gαolf/s (i n = 5 MOEs). Gαi and Gαo are enriched lat-erally, whereas Gαolf/s shows clear depletion in the lateral segment. Significance was evaluated by t test (*p < 0.05, **p < 0.01; error bars show SEM). A anterior, P posterior, L lateral, M medial, OO olfactory organ, OB olfactory bulb

1977Bimodal processing of olfactory information
1 3
teleost fish, but not in mammals, which express v1r genes generally in the VNO, with few exceptions [48–50]. Thus, the amphibian VNO appears to represent a transition state, morphologically clearly a distinct organ like the mammalian one, but molecularly in an intermediate stage compared to the mammalian VNO.
Spatial distribution of several or genes parallels that of the medial odor processing stream
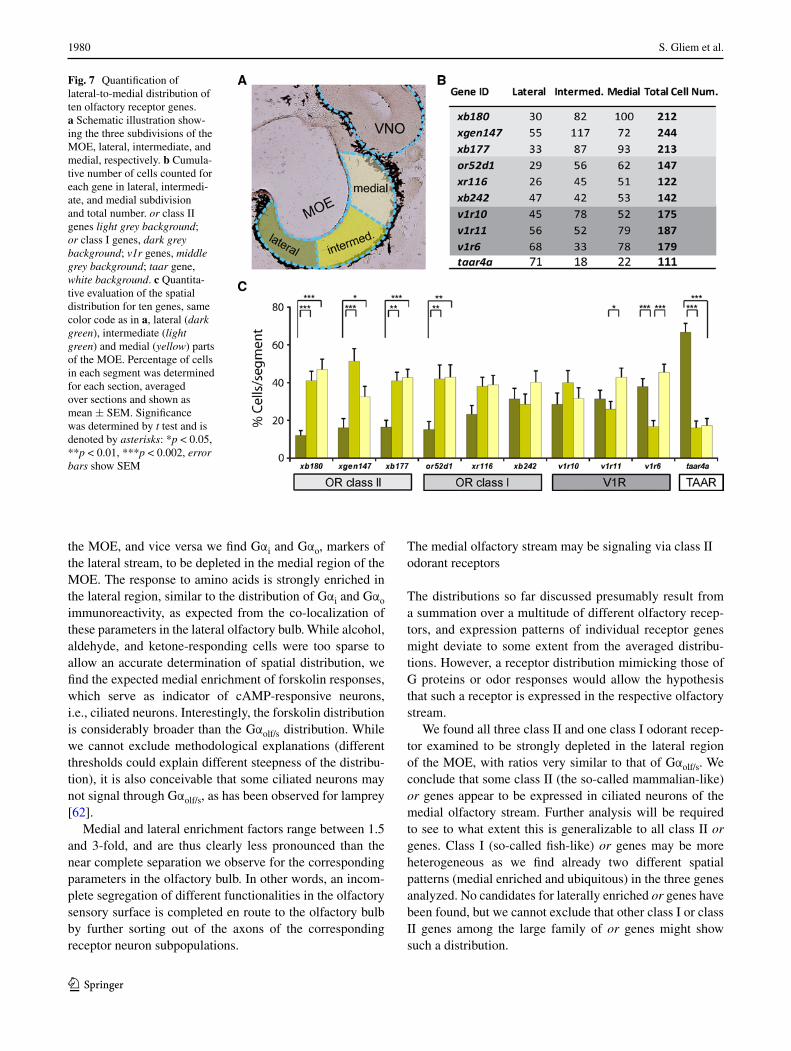
To compare the spatial expression patterns of olfactory receptor genes in the MOE with the previously identified lateral and medial odor processing streams, we quantified the expression frequency for ten different genes by in situ hybridization, applying the previously used subdivision into medial, intermediate, and lateral regions (Fig. 7). About 100 tissue sections were evaluated per gene, resulting in counts of over 100–200 labeled cells per gene. These experiments showed clear and highly significant differences in the spatial distribution of individual olfactory receptor genes.
Notable was a group of genes showing strong and sig-nificant depletion in the lateral third of the MOE (p < 0.01, Fig. 7). This group encompasses all three class II or genes examined and one of the class I or genes. Another class I or gene shows the same tendency, which, however, does not reach significance. This expression pattern is very similar to the spatial patterns observed for the medial odor processing stream described above, consistent with class II and at least some class I ORs underlying the odor responses associated with the medial stream.
At least one class I or and one v1r gene are distributed rather evenly between the three subdivisions of the MOE. Such expression patterns could be part of either the lateral or the medial stream, due to the broad and partly overlapping nature of both streams, and therefore no tentative assign-ment to either of these streams is possible. Interestingly, another v1r gene, v1r6, shows a distribution not encoun-tered for any of the odor responses and G proteins exam-ined, namely a pronounced depletion in the intermediate region, highly significant in comparison to both the lateral and the medial region. The third v1r gene, v1r11, exhibits a similar pattern, which however, only reaches significance in the intermediate-to-medial comparison.
The spatial distribution of the taar gene parallels that of the lateral odor processing stream
Somewhat unexpectedly, the taar gene investigated showed a very pronounced lateral enrichment (Fig. 7), very similar to the spatial distribution of amino acid responses (Fig. 3). Thus, the taar gene might be a candidate for mediating amino acid responses. However, the taar gene family in Xenopus comprises just three genes [46], one of which is not
expressed in the olfactory system (Fig. 6j), which is much less than expected judging from the frequency and diversity of reported amino acid responses [28].
Since a fish V2R has been shown to bind amino acids [51, 52], this large family appeared to be a good candidate for additional receptors with a lateral enrichment.
However, the V2R subclade examined here using a broadly cross-reactive probe very rarely shows any expres-sion in the MOE (data not shown). Furthermore, expression patterns for several genes from other V2R subclades also do not parallel the amino acid response pattern (A.S., S.I.K., unpublished observation).
Taken together, the medial olfactory stream is character-ized by expression of class II or and at least some class I or genes in ciliated ORNs that are activated by, among others, alcohols, aldehydes and ketones and signal via Gαolf/s (Fig. 8, blue hues). The lateral olfactory stream responds, among others, to amino acids, and signals via Gαi and Gαo (Fig. 8, red hues). Its olfactory receptors could include taar genes. Interestingly, neuronal responses to bile acids and amines may be carried by both streams (Fig. 8, green hues).
Discussion
The building principles structuring the olfactory sense of teleost fishes are very different from that of terrestrial mam-mals. Spatial segregation into different olfactory subsystems and distinct segregation even within such subsystems are a hallmark of mammals [2], whereas a single sensory surface with little segregation is observed in the olfactory system of teleost fishes [53]. It is not known how this major reor-ganization of the olfactory system took place during evo-lution of terrestrial vertebrates. The presence of an acces-sory olfactory system in lungfish [5, 6], a close relative of tetrapods, might indicate that this structure arose early in the evolution of lobe-finned fishes. However, the vomerona-sal primordia of lungfish are morphologically very different from the VNO of mammals and may well have arisen as lineage-specific specializations. The pronounced topogra-phy of the projection from MOE to olfactory bulb observed in some cartilaginous fish [54] appears to be an example of such lineage-specific specialization, since neither mammals nor teleost fish exhibit this feature.
Here we have examined the olfactory system of the amphibian X. laevis, an early diverging tetrapod. We focused this analysis on the larval olfactory system, since adults have undergone complex restructuring during metamorphosis, making them less suitable for comparison to the mamma-lian (and teleost) olfactory system. Furthermore, Xenopus larvae are fully aquatic, allowing the comparison of aquatic with terrestrial tetrapods. Their olfactory epithelium shows clear morphological separation into two subsystems, the
1978 S. Gliem et al.
1 3
MOE and the VNO [42, 55], but the MOE still appears to be much more heterogeneous than the MOE of mammals [15, 27]. We have quantitatively analyzed several molecular and
functional parameters within the MOE and olfactory bulb of X. laevis to establish the degree of segregation in this olfac-tory subsystem.

1979Bimodal processing of olfactory information
1 3
Incomplete segregation of the vomeronasal system from the main sensory system
Most amphibian species, including Xenopus, have both a MOE and a VNO [42, 56]. We have used a broadly crossre-active probe hybridizing with at least 75 different v2r genes and find nearly exclusive expression in the VNO. The occa-sional labeled cells in the MOE most likely represent fuzzy targeting of these v2r genes since the frequency of MOE expression is well below that of other individual receptor genes. The expression pattern we observed is similar to the one observed for some v2r genes in larval and adult X. laevis [15]. We estimate that our probe samples roughly one-fifth of the Xenopus V2R repertoire [57]. Several other v2r genes we have examined show VNO-specific expression as well (A.S. and S.I.K., unpublished observation). In con-trast, we found the v1r-like receptor genes to be expressed exclusively in the MOE, like their teleost counterparts (ora genes, [58]), and unlike the mammalian v1r genes, which are mostly restricted to the VNO ([2], for exceptions see [48, 49]). This expression is retained during the complex morphological reorganization taking place during metamor-phosis (cf. [27]).
Taken together, the vomeronasal system appears to have originated as a segregated system for V2R-expressing neu-rons only. This opens the fascinating possibility that some time after the divergence of amphibians from the tetrapod lineage V1R-expressing neurons may have been repro-grammed for targeting the VNO.
G proteins in the MOB define the medial and lateral streams
Anatomically, three large and one small ventromedial glo-merular cluster can be distinguished in the larval X. laevis olfactory bulb [18, 59]. Such glomerular clusters also have been described in other lower vertebrates (see [12, 60–62]). We have shown that the lateral and medial cluster are distin-guished by their exclusive and complementary expression
of G proteins, non-overlapping afferent pattern at extreme lateral and medial positions, as well as exclusive and com-plementary responses to two odor groups, amino acids and alcohols, aldehydes and ketones. The intermediate cluster appears to be a transition zone, with mixed identity. These results confirm and extend earlier results by some of the authors [18].
The sharp segregation of Gαolf/s and Gαi/Gαo protein expression into a medial and a lateral half of the MOB shows that these G proteins demarcate the medial and the lateral olfactory stream, respectively. The co-expression of Gαolf/s with tubulin, a marker of ciliated neurons, shows the medial stream to be composed of ciliated ORNs. Correspondingly, the co-expression of Gαi and Gαo with phalloidin, a marker for f-actin, shows microvillous ORNs as a main component of the lateral odor processing stream. This is reminiscent of similar G protein spatial patterns in the lamprey and gold-fish olfactory system [62, 63], although the segregation is less strict for the fish olfactory system.
Odor responses to amino acids and alcohols, aldehydes, and ketones are strictly segregated to the lateral and the medial stream, respectively
The complete absence of amino acid-responding glomeruli in the medial olfactory bulb, and the complementary total absence of alcohol, aldehyde, and ketone-responding glo-meruli in the lateral olfactory bulb show that there are clear-cut functional differences between the medial and lateral olfactory processing stream. It is worth pointing out that this is not valid for all odor groups, as amines and bile acids are represented in both streams and indeed we find both forskolin-sensitive (cAMP-dependent) and forskolin-insensitive neurons in these two odor groups. Nevertheless, we can conclude that responses to amino acids in X. laevis are carried exclusively by microvillous receptor neurons and that responses to alcohols, ketones, and aldehydes are carried exclusively by ciliated receptor neurons. For amino acids, this corresponds to the situation in fishes ([12, 41] but see [11, 32, 33, 64, 65]) and for alcohols, aldehydes, and ketones it is very reminiscent of the mammalian situation [66]. The distribution of amine and bile acid responses to both streams appears to be less specific than in fish (catfish: [11]; zebrafish: [33]; goldfish: [32], but see salmon: [67]), but has some parallels in the mammalian system, where, e.g., amines have been found to elicit responses both in the main and the accessory olfactory system [68].
The lateral and medial olfactory streams are partially segregated already in the sensory surface
We observe Gαolf/s, the marker of the medial stream to be strongly depleted, but not absent in the lateral region of
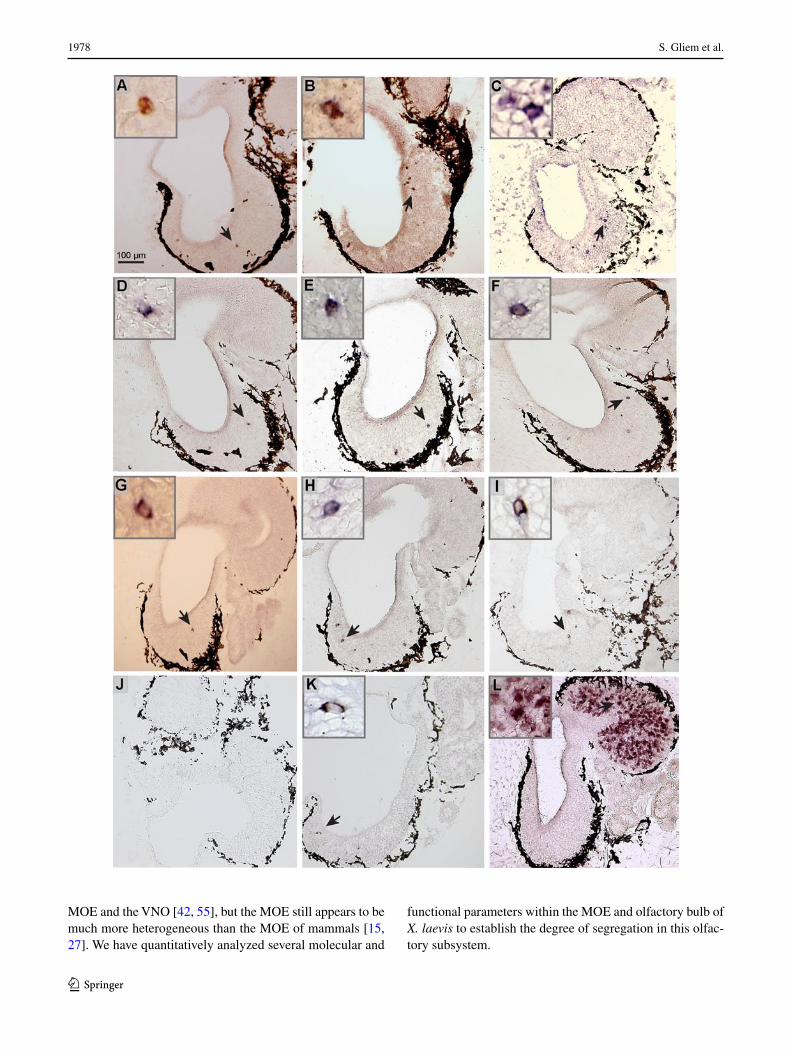
Fig. 6 Spatial expression patterns of olfactory receptor genes from the different families. Twelve genes from four olfactory receptor families were cloned by PCR using either the published Xenopus laevis sequence information for the primer or degenerated primer based on the Xenopus tropicalis sequence. The clones were con-firmed by sequencing and riboprobes were prepared. In situ hybridi-zation (a–l) was performed under stringent conditions, using cryostat sections of larval Xenopus nose tissue, which encompassed both the MOE and the VNO. Insets show enlargements of cells marked by arrow. Class I or genes (a xr116, b xb242, c or52d1); class II or genes (d xb180, e xb177, f xgen147); v1r genes (g v1r10, h v1r11, i v1r6); taar genes (j taar1, k taar4a); l v2r gene xv2r E-1. Results for xr116 and xgen147 are consistent with in situ hybridization results obtained by Mezler and coworkers [16] for similar larval stages, and the result for xv2r E-1 is consistent with reports by Hagino-Yamagi-shi and coworkers [15]
◂
1980 S. Gliem et al.
1 3
the MOE, and vice versa we find Gαi and Gαo, markers of the lateral stream, to be depleted in the medial region of the MOE. The response to amino acids is strongly enriched in the lateral region, similar to the distribution of Gαi and Gαo immunoreactivity, as expected from the co-localization of these parameters in the lateral olfactory bulb. While alcohol, aldehyde, and ketone-responding cells were too sparse to allow an accurate determination of spatial distribution, we find the expected medial enrichment of forskolin responses, which serve as indicator of cAMP-responsive neurons, i.e., ciliated neurons. Interestingly, the forskolin distribution is considerably broader than the Gαolf/s distribution. While we cannot exclude methodological explanations (different thresholds could explain different steepness of the distribu-tion), it is also conceivable that some ciliated neurons may not signal through Gαolf/s, as has been observed for lamprey [62].
Medial and lateral enrichment factors range between 1.5 and 3-fold, and are thus clearly less pronounced than the near complete separation we observe for the corresponding parameters in the olfactory bulb. In other words, an incom-plete segregation of different functionalities in the olfactory sensory surface is completed en route to the olfactory bulb by further sorting out of the axons of the corresponding receptor neuron subpopulations.
The medial olfactory stream may be signaling via class II odorant receptors
The distributions so far discussed presumably result from a summation over a multitude of different olfactory recep-tors, and expression patterns of individual receptor genes might deviate to some extent from the averaged distribu-tions. However, a receptor distribution mimicking those of G proteins or odor responses would allow the hypothesis that such a receptor is expressed in the respective olfactory stream.
We found all three class II and one class I odorant recep-tor examined to be strongly depleted in the lateral region of the MOE, with ratios very similar to that of Gαolf/s. We conclude that some class II (the so-called mammalian-like) or genes appear to be expressed in ciliated neurons of the medial olfactory stream. Further analysis will be required to see to what extent this is generalizable to all class II or genes. Class I (so-called fish-like) or genes may be more heterogeneous as we find already two different spatial patterns (medial enriched and ubiquitous) in the three genes analyzed. No candidates for laterally enriched or genes have been found, but we cannot exclude that other class I or class II genes among the large family of or genes might show such a distribution.
Fig. 7 Quantification of lateral-to-medial distribution of ten olfactory receptor genes. a Schematic illustration show-ing the three subdivisions of the MOE, lateral, intermediate, and medial, respectively. b Cumula-tive number of cells counted for each gene in lateral, intermedi-ate, and medial subdivision and total number. or class II genes light grey background; or class I genes, dark grey background; v1r genes, middle grey background; taar gene, white background. c Quantita-tive evaluation of the spatial distribution for ten genes, same color code as in a, lateral (dark green), intermediate (light green) and medial (yellow) parts of the MOE. Percentage of cells in each segment was determined for each section, averaged over sections and shown as mean ± SEM. Significance was determined by t test and is denoted by asterisks: *p < 0.05, **p < 0.01, ***p < 0.002, error bars show SEM

1981Bimodal processing of olfactory information
1 3
A taar gene as candidate for the lateral odor-processing stream
Our data do suggest taar4a as a receptor gene candidate for the lateral olfactory stream. This came unexpectedly, since ligands for mammalian taar genes are believed to be mainly amines [45], which exhibit major biochemical differences to amino acids. In this context, it will be interesting to search for ligands of the Xenopus taar genes. Furthermore, responses to amino acids are much more frequent than that to the other three odor groups examined, and also very diverse [28], argu-ing for a sizable group of receptors dedicated to their detec-tion, and not just two genes (of the three taar genes present in Xenopus, taar1 is not expressed in the olfactory system).
The v2r gene family would appear to contain plausible candidates, since it contains over 300 genes in Xenopus [57], and one v2r receptor has been shown to be an amino acid receptor in two fish species [51, 52]. However, our probe, crossreacting with at least 75 different V2Rs and rep-resenting the largest subclade of the Xenopus V2R family [57], shows nearly exclusive expression in the VNO, con-sistent with findings by Hagino-Yamagishi and coworkers [15]. The occasional labeled cells in the MOE observed by us as well as others [15] are too rare to explain a major
reactivity of this tissue. Furthermore, expression patterns for several genes from other V2R subclades also do not parallel the amino acid response pattern (A.S., S.I.K., unpublished observation). However, a truly comprehensive analysis of olfactory receptor families each comprising several hundred genes (Xenopus or, v2r genes, see [57, 69, 70]) is not fea-sible, and so the molecular nature of at least the majority of amino acid receptors remains an open question for now.
The fourth olfactory receptor gene family, v1r genes appear to be unlikely candidates for generating the com-plete lateral stream, as this rather small population of about two dozen receptors [57, 58] does not appear large enough. Moreover, the three representatives examined here show no lateral enrichment, but in two cases a near homogene-ous distribution, and in one case a new pattern, a depletion restricted to the intermediate segment.
Xenopus laevis shows absence of correlation between aquatic life style and spatial segregation tendency
The present study revealed the existence of two distinct olfactory subsystems within the main olfactory system of larval X. laevis. A lateral and a medial odor-processing stream show clearly diverging odorant sensitivities, distinct
Fig. 8 Schematic representation of the lateral and medial olfactory stream in larval Xenopus laevis. a Spatial distributions observed in the MOE. The lateral stream (red hues) is characterized by amino acid responses (left panel), taar receptors (middle panel) and Gαi/Gαo (right panel). The medial stream (blue hues) is represented by forskolin responses, all or class II and some or class I receptors, and expression of Gαolf/s. Some receptors (green hues) are homogenously distributed or show a depletion in the intermediate region (v1r genes). b Spatial distributions observed in the MOB. The lateral stream (red hues) is characterized by amino acid responses (left panel), and
expression of Gαi/Gαo (right panel). The medial stream (blue hues) is represented by responses to alcohols, ketones, aldehydes and for-skolin, and expression of Gαolf/s. Responses to other odors (bile acids, amines, green hues) are rather homogenously distributed. ON olfac-tory nerve, V1R vomeronasal receptor genes of type 1, V2R vome-ronasal receptor genes of type 2, OR I odorant receptor genes class I, OR II odorant receptor genes class II, TAAR trace amine-associ-ated receptors, AA mixture of amino acids, AL mixture of alcohols, ketones and aldehydes, AM mixture of amines, BA mixture of bile acids, FO forskolin
1982 S. Gliem et al.
1 3
transduction mechanisms with differing G proteins, recep-tor neurons with different morphology (microvillous vs. cil-iated), as well as differences in the expression frequencies of olfactory receptor genes, notwithstanding the absence of lateralization for some odor responses and receptors. These lateral and medial processing streams should not be confused with the segregation of the adult olfactory epi-thelium into a lateral and a medial diverticulum, which express class I and class II olfactory receptors, respectively [29]. During metamorphosis, complex reorganizations take place, and while the medial enrichment of larval or class II receptors is reminiscent of their expression in the medial diverticulum (also named principal cavity, or air nose) in the adult, the ubiquitous or medially enriched distribution of larval or class I receptors is clearly different from their restricted expression in the adult lateral diverticulum (other names are middle cavity, water nose). The presence of a vomeronasal epithelium in the adult medial diverticulum (posterolateral area of the principal cavity; see [71]) also has no parallel in the larval olfactory system [15].
Since the transition from aqueous to airborne olfaction has not yet occurred for the fully aquatic tadpoles of X. laevis, the distinct, if limited, tendency to spatial seg-regation appears unrelated to this transition and indeed may be an inherent characteristic of evolution in the lobe-finned fish lineage, cf. [5, 6]. In the ray-finned lineage there exist very few data concerning spatial segregation in the epithelium, but expression of or genes shows radi-ally symmetric domains [53] unlike the left/right asymme-try observed here. Backtracing from small regions of the zebrafish olfactory bulb results in widespread labeled cells in the olfactory epithelium [72], unlike the more restricted distributions of backtraced neurons observed here. In con-clusion, the olfactory system of X. laevis shows distinct, but incomplete segregation in the main olfactory system and thus appears well suited to investigate the molecular driving forces behind such olfactory regionalization.
Acknowledgments The authors thank Gudrun Federkeil, Chris-tina Patzelt, and Mehmet Saltürk for expert technical help. We are grateful to Ashiq Hussain for introducing A.S. to the wet lab. Chris-tian Muchowski and Mehmet Saltürk both kindly have provided two clones for in situ hybridization. The authors would also like to thank the reviewers for their valuable comments and suggestions. This work was supported by DFG Schwerpunktprogramm 1392 (I.M. and S.K.) and DFG Cluster of Excellence “Nanoscale Microscopy and Molecu-lar Physiology of the Brain” (I.M.).
Conflict of interest The authors declare that they have no conflicts of interest.
Open Access This article is distributed under the terms of the Crea-tive Commons Attribution License which permits any use, distribution, and reproduction in any medium, provided the original author(s) and the source are credited.
References
1. Mombaerts P (2004) Genes and ligands for odorant, vomeronasal and taste receptors. Nat Rev Neurosci 5:263–278
2. Munger SD, Leinders-Zufall T, Zufall F (2009) Subsystem organization of the mammalian sense of smell. Annu Rev Physiol 71:115–140
3. Mori K, Sakano H (2011) How is the olfactory map formed and interpreted in the mammalian brain? Annu Rev Neurosci 34:467–499
4. Grüneberg H (1973) A ganglion probably belonging to the N. ter-minalis system in the nasal mucosa of the mouse. Z Anat Entwick-lungsgesch 140:39–52
5. Gonzalez A, Morona R, Lopez JM, Moreno N, Northcutt RG (2010) Lungfishes, like tetrapods, possess a vomeronasal system. Front Neuroanat 4. Art no 130
6. Nakamuta S, Nakamuta N, Taniguchi K, Taniguchi K (2012) Histological and ultrastructural characteristics of the primor-dial vomeronasal organ in lungfish. Anat Rec (Hoboken) 295: 481–491
7. Taniguchi K, Saito S, Taniguchi K (2011) Phylogenic outline of the olfactory system in vertebrates. J Vet Med Sci 73:139–147
8. Hamdani el H, Doving KB (2007) The functional organization of the fish olfactory system. Prog Neurobiol 82:80–86
9. Korsching S (2009) The molecular evolution of teleost olfactory receptor gene families. Results Probl Cell Differ 47:37–55
10. Oka Y, Korsching SI (2011) Shared and unique G alpha proteins in the zebrafish versus mammalian senses of taste and smell. Chem Senses 36:357–365
11. Hansen A, Rolen SH, Anderson K, Morita Y, Caprio J et al (2003) Correlation between olfactory receptor cell type and function in the channel catfish. J Neurosci 23:9328–9339
12. Sato Y, Miyasaka N, Yoshihara Y (2005) Mutually exclusive glomerular innervation by two distinct types of olfactory sen-sory neurons revealed in transgenic zebrafish. J Neurosci 25: 4889–4897
13. Hayden S, Bekaert M, Crider TA, Mariani S, Murphy WJ et al (2010) Ecological adaptation determines functional mammalian olfactory subgenomes. Genome Res 20:1–9
14. Manzini I, Schild D (2010) Olfactory Coding in Larvae of the African Clawed Frog Xenopus laevis. In: Menini A (ed) The Neu-robiology of Olfaction. Chap 4, CRC Press, Boca Raton
15. Hagino-Yamagishi K, Moriya K, Kubo H, Wakabayashi Y, Isobe N et al (2004) Expression of vomeronasal receptor genes in Xeno-pus laevis. J Comp Neurol 472:246–256
16. Mezler M, Konzelmann S, Freitag J, Rössler P, Breer H (1999) Expression of olfactory receptors during development in Xenopus laevis. J Exp Biol 202:365–376
17. Ji Y, Zhang Z, Hu Y (2009) The repertoire of G-protein-coupled receptors in Xenopus tropicalis. BMC Genomics 10:263
18. Manzini I, Heermann S, Czesnik D, Brase C, Schild D et al (2007) Presynaptic protein distribution and odour mapping in glomeruli of the olfactory bulb of Xenopus laevis tadpoles. Eur J Neurosci 26:925–934
19. Nieuwkoop PD, Faber J (1994) Normal table of Xenopus laevis (Daudin). Garland Publishing, Inc., New York
20. Czesnik D, Rössler W, Kirchner F, Gennerich A, Schild D (2003) Neuronal representation of odourants in the olfactory bulb of Xen-opus laevis tadpoles. Eur J Neurosci 17:113–118
21. Manzini I, Schild D (2003) cAMP-independent olfactory trans-duction of amino acids in Xenopus laevis tadpoles. J Physiol 551:115–123
22. Manzini I, Schild D (2003) Multidrug resistance transporters in the olfactory receptor neurons of Xenopus laevis tadpoles. J Phys-iol 546:375–385
1983Bimodal processing of olfactory information
1 3
23. Manzini I, Schweer TS, Schild D (2008) Improved fluorescent (calcium indicator) dye uptake in brain slices by blocking multid-rug resistance transporters. J Neurosci Methods 167:140–147
24. Junek S, Chen TW, Alevra M, Schild D (2009) Activity correlation imaging: visualizing function and structure of neuronal popula-tions. Biophys J 96:3801–3809
25. Hassenklöver T, Kurtanska S, Bartoszek I, Junek S, Schild D et al (2008) Nucleotide-induced Ca2+ signaling in sustentacular sup-porting cells of the olfactory epithelium. Glia 56:1614–1624
26. Mezler M, Fleischer J, Conzelmann S, Korchi A, Widmayer P et al (2001) Identification of a nonmammalian Golf subtype: functional role in olfactory signaling of airborne odorants in Xenopus laevis. J Comp Neurol 439:400–410
27. Date-Ito A, Ohara H, Ichikawa M, Mori Y, Hagino-Yamagishi K (2008) Xenopus V1R vomeronasal receptor family is expressed in the main olfactory system. Chem Senses 33:339–346
28. Manzini I, Schild D (2004) Classes and narrowing selectivity of olfactory receptor neurons of Xenopus laevis tadpoles. J Gen Physiol 123:99–107
29. Freitag J, Krieger J, Strotmann J, Breer H (1995) Two classes of olfactory receptors in Xenopus laevis. Neuron 15:1383–1392
30. Gliem S, Schild D, Manzini I (2009) Highly specific responses to amine odorants of individual olfactory receptor neurons in situ. Eur J Neurosci 29:2315–2326
31. Carr WES, Derby CD (1986) Chemically stimulated feeding-behavior in marine animals—importance of chemical-mixtures and involvement of mixture interactions. J Chem Ecol 12:989–1011
32. Rolen SH, Sorensen PW, Mattson D, Caprio J (2003) Polyamines as olfactory stimuli in the goldfish Carassius auratus. J Exp Biol 206:1683–1696
33. Michel WC, Sanderson MJ, Olson JK, Lipschitz DL (2003) Evidence of a novel transduction pathway mediating detection of polyamines by the zebrafish olfactory system. J Exp Biol 206:1697–1706
34. Sorensen PW, Caprio J (1998) Chemoreception. In: Evans DH (ed) The physiology of fishes. CRC Press, Boca Raton, pp 251–261
35. Altner H (1962) Untersuchungen über Leistungen und Bau der Nase des südafrikanischen Krallenfrosches Xenopus laevis (Dau-din, 1803). Z Vlg Physiol 45:272–306
36. Manzini I, Brase C, Chen TW, Schild D (2007) Response profiles to amino acid odorants of olfactory glomeruli in larval Xenopus laevis. J Physiol 581:567–579
37. Touhara K (2002) Odor discrimination by G protein-coupled olfactory receptors. Microsc Res Tech 58:135–141
38. Manzini I, Rössler W, Schild D (2002) cAMP-independent responses of olfactory neurons in Xenopus laevis tadpoles and their projection onto olfactory bulb neurons. J Physiol 545:475–484
39. Friedrich RW, Korsching SI (1998) Chemotopic, combinatorial, and noncombinatorial odorant representations in the olfactory bulb revealed using a voltage-sensitive axon tracer. J Neurosci 18:9977–9988
40. Korsching SI (2001) Odor maps in the brain: spatial aspects of odor representation in sensory surface and olfactory bulb. Cell Mol Life Sci 58:520–530
41. Friedrich RW, Korsching SI (1997) Combinatorial and chemo-topic odorant coding in the zebrafish olfactory bulb visualized by optical imaging. Neuron 18:737–752
42. Hansen A, Reiss JO, Gentry CL, Burd GD (1998) Ultrastructure of the olfactory organ in the clawed frog, Xenopus laevis, during lar-val development and metamorphosis. J Comp Neurol 398:273–288
43. Wieland T (1987) 50 years of phalloidine: its discovery, char-acterization and current and future applications in cell research. Naturwissenschaften 74:367–373
44. Corbit KC, Aanstad P, Singla V, Norman AR, Stainier DY et al (2005) Vertebrate smoothened functions at the primary cilium. Nature 437:1018–1021
45. Liberles SD, Buck LB (2006) A second class of chemosensory receptors in the olfactory epithelium. Nature 442:645–650
46. Hussain A, Saraiva LR, Korsching SI (2009) Positive Darwinian selection and the birth of an olfactory receptor clade in teleosts. Proc Natl Acad Sci USA 106:4313–4318
47. Strotmann J, Wanner I, Helfrich T, Beck A, Meinken C et al (1994) Olfactory neurones expressing distinct odorant receptor subtypes are spatially segregated in the nasal neuroepithelium. Cell Tissue Res 276:429–438
48. Karunadasa DK, Chapman C, Bicknell RJ (2006) Expression of pheromone receptor gene families during olfactory development in the mouse: expression of a V1 receptor in the main olfactory epithelium. Eur J Neurosci 23:2563–2572
49. Wakabayashi Y, Mori Y, Ichikawa M, Yazaki K, Hagino-Yamagi-shi K (2002) A putative pheromone receptor gene is expressed in two distinct olfactory organs in goats. Chem Senses 27:207–213
50. Rodriguez I, Greer CA, Mok MY, Mombaerts P (2000) A putative pheromone receptor gene expressed in human olfactory mucosa. Nat Genet 26:18–19
51. Speca DJ, Lin DM, Sorensen PW, Isacoff EY, Ngai J et al (1999) Functional identification of a goldfish odorant receptor. Neuron 23:487–498
52. Luu P, Acher F, Bertrand HO, Fan J, Ngai J (2004) Molecular determinants of ligand selectivity in a vertebrate odorant receptor. J Neurosci 24:10128–10137
53. Weth F, Nadler W, Korsching S (1996) Nested expression domains for odorant receptors in zebrafish olfactory epithelium. Proc Natl Acad Sci USA 93:13321–13326
54. Meredith T, Hansen A (2010) Hemi-bulb organization in the elas-mobrach brain. Chem Senses 35:A85
55. Oikawa T, Suzuki K, Saito TR, Takahashi KW, Taniguchi K (1998) Fine structure of three types of olfactory organs in Xenopus laevis. Anat Rec 252:301–310
56. Taniguchi K, Saito S, Oikawa T, Taniguchi K (2008) Phylogenic aspects of the amphibian dual olfactory system. J Vet Med Sci 70:1–9
57. Shi P, Zhang J (2007) Comparative genomic analysis identifies an evolutionary shift of vomeronasal receptor gene repertoires in the vertebrate transition from water to land. Genome Res 17: 166–174
58. Saraiva LR, Korsching SI (2007) A novel olfactory receptor gene family in teleost fish. Genome Res 17:1448–1457
59. Gaudin A, Gascuel J (2005) 3D atlas describing the ontogenic evolution of the primary olfactory projections in the olfactory bulb of Xenopus laevis. J Comp Neurol 489:403–424
60. Riddle DR, Wong LD, Oakley B (1993) Lectin identification of olfactory receptor neuron subclasses with segregated central pro-jections. J Neurosci 13:3018–3033
61. Baier H, Korsching S (1994) Olfactory glomeruli in the zebrafish form an invariant pattern and are identifiable across animals. J Neurosci 14:219–230
62. Frontini A, Zaidi AU, Hua H, Wolak TP, Greer CA et al (2003) Glomerular territories in the olfactory bulb from the larval stage of the sea lamprey Petromyzon marinus. J Comp Neurol 465: 27–37
63. Hansen A, Anderson KT, Finger TE (2004) Differential distri-bution of olfactory receptor neurons in goldfish: structural and molecular correlates. J Comp Neurol 477:347–359
64. Lo YH, Bradley TM, Rhoads DE (1993) Stimulation of Ca(2+)-regulated olfactory phospholipase C by amino acids. Biochemis-try 32:12358–12362
65. Ma L, Michel WC (1998) Drugs affecting phospholipase C-medi-ated signal transduction block the olfactory cyclic nucleotide-gated current of adult zebrafish. J Neurophysiol 79:1183–1192
66. Johnson BA, Leon M (2007) Chemotopic odorant coding in a mammalian olfactory system. J Comp Neurol 503:1–34
1984 S. Gliem et al.
1 3
67. Lo YH, Bellis SL, Cheng LJ, Pang J, Bradley TM et al (1994) Signal transduction for taurocholic acid in the olfactory system of Atlantic salmon. Chem Senses 19:371–380
68. Tirindelli R, Dibattista M, Pifferi S, Menini A (2009) From phero-mones to behavior. Physiol Rev 89:921–956
69. Niimura Y, Nei M (2005) Evolutionary dynamics of olfactory receptor genes in fishes and tetrapods. Proc Natl Acad Sci USA 102:6039–6044
70. Shi P, Zhang J (2009) Extraordinary diversity of chemosensory receptor gene repertoires among vertebrates. Results Probl Cell Differ 47:1–23
71. Föske H (1934) Das Geruchsorgan von Xenopus laevis. Z Anat Entwicklungsgesch 103:519–550
72. Baier H, Rotter S, Korsching S (1994) Connectional topography in the zebrafish olfactory system: random positions but regular spacing of sensory neurons projecting to an individual glomeru-lus. Proc Natl Acad Sci USA 91:11646–11650