Embed Size (px)
Citation preview
Bio-economic modelling of conversion from
conventional to organic arable farming
1

PROMOTOR
Prof. dr. ir. R.B.M. Huirne Hoogleraar Agrarische Bedrijfseconomie
Wageningen Universiteit
CO-PROMOTOR
Dr. ir. P.B.M. Berentsen Universitair docent bij de leerstoelgroep
Bedrijfseconomie
Wageningen Universiteit
SAMENSTELLING PROMOTIECOMMISSIE
Prof.dr.ir. A.J. Oskam Wageningen Universiteit
Dr. K. Takács-György Szent István University, Hungary
Dr. ir. M.K. van Ittersum Wageningen Universiteit
Dr. ir. J.A.C. Meijs Biologica, Utrecht
Dit onderzoek is uitgevoerd binnen de Mansholt Graduate School
2
Szvetlána Ács
Bio-economic modelling of conversion from
conventional to organic arable farming
Proefschrift
ter verkrijging van de graad van doctor
op gezag van de rector magnificus
van Wageningen Universiteit,
prof.dr. M.J. Kropff,
in het openbaar te verdedigen
op vrijdag 8 september 2006
des namiddags te 16.00 uur in de Aula
3

Bio-economic modelling of conversion from conventional to organic arable farming
PhD-thesis Wageningen University – With references – With summaries in English and
Dutch
Szvetlana Acs, 2006
ISBN: 90-8504-481-2
4
Abstract Acs, S., 2006. Bio-economic modelling of conversion from conventional to organic farming. PhD Thesis, Wageningen University, The Netherlands, 152 pp.
Growing environmental concern in society combined with policy stimuli has encouraged
farmers to switch from conventional to organic production methods. However, despite the
growing concern not many farmers made the switch from conventional to organic production.
In order to stimulate the conversion, policy makers need more information about the process
of conversion. The main objective of this research was to gain insight into the decision of
Dutch arable farms to convert from conventional to organic production. The main method
used was to develop a modelling approach that can be used for (1) analyzing the conversion
from conventional to organic arable farming systems from an economic and environmental
point of view and (2) determining the effects of influential factors and policies on the choice
of farmers to convert from conventional to organic farming systems. The study was applied
for a typical arable farm in the central clay region in the Netherlands. First, a comparison of
the conventional and organic arable farming system was made from technical, economic and
environmental point of view by developing linear programming (LP) models for both farming
systems. The results show that organic farming leads to less intensive land use, better
environmental and better economic results. Second, based on these two LP models, the
conversion period between conventional and organic farming was included in the model by
means of dynamic linear programming model (DLP). The results show that using a ten years
planning horizon, despite the economically difficult conversion period, organic farming is still
more attractive from economic point of view. However, in the case when additional
constraints are included the conversion to organic farming is not always economically
optimal. Next, special attention was given to the effect of future yield and price uncertainty
before, during and after the conversion years. For this purpose a discrete stochastic dynamic
utility-efficient programming (DUEP) model was developed based on DLP model. The results
showed that for a risk-averse farmer conversion is not optimal, unless policy incentives are
applied such as taxes on pesticides or fertilizers or subsidies on organic products, or unless the
market prices for organic products get more stable.
Keywords: Organic Farming, Arable Farming, Conversion Process, Bio-economic Modelling,
Linear Programming, Dynamic Linear Programming, Dynamic Utility-Efficient
Programming, Risk Attitude, Yield and Price Risk, The Netherlands
5

6
Preface
Budapest, Summer 2000 was the first time I met Ruud Huirne, who later that year, in
Autumn, welcomed me to the Business Economics Group at Wageningen University as an
Erasmus student. The nice working environment, the international atmosphere and good
opportunities for sports and other activities made me attached to Wageningen within a short
time. After a few months working in the group, Ruud gave me the opportunity to start a PhD
project, which I was very happy to accept. Ruud as a promoter and Paul Berentsen as a co-
promoter and daily supervisor gave me enormous support during these years. Ruud, I would
like to thank you for your kind hospitality since my first day in Wageningen, for giving me
the opportunity to join your research group and for your excellent scientific guidance and
valuable advices. Paul, thank you that your door was always open and you were always ready
to help whatever problem I faced. I cannot express how much your unique direct daily
supervision and useful advices helped me to tackle the problems during my PhD. Thank you a
lot, I am very grateful for that. I would like to thank also Marco de Wolf from Applied Plant
Research who helped me with the collection of the data for my project and with whom I
became friends during these visits. Furthermore, I would like to thank Brian Hardaker and
Wijnand Sukkel for their valuable comments on my thesis articles. I would like to give many
thanks to my Hungarian supervisor, Katalin Takács-György, who cared a lot about my project
and my personal development, and gave great support with her advices.
I would like to thank all my colleagues at the Business Economics Group for
introducing me to the Dutch environment and helping me with various practical matters.
Especially, I would like to thank Martin, Ilya and Bouda with whom I could share both my
happy and sad moments, in professional and personal life as well. Special thank goes to
Martin who helped me not only with technical problems but he was partner in sports, and he
also gave me moral support through our deep talks during coffee breaks. Also special thanks
for Ilya, who was a great support and with whom next to sport activities I tackled the
difficulties of the NAKE courses at late evenings and many long weekends. Besides, I would
like to thank Ron, who often dropped by my office with some jokes, which always made me
smile, even if they had no sense at all.
I would like to express my gratitude to all my friends I met in Wageningen, especially,
Maarten Paul, Frank, Pablo, Ajay, Willy, James and Armelle, who were always there for me. I
would like to thank my sport colleagues: John at the Sportcentre de Bongerd for his positive
7
radiation and Buis and Ejal for their “keihard” trainings, who were trying to keep me fit.
Special thanks for my trainer at home in Hungary, Zsolt Somogyi, who gave me lots of
strength during my visits and encouraged me to continue my sport life at high level next to
my thesis and education. Many thanks to the Hungarian Community in Wageningen
(WaMBaK – Wageningeni Magyarok Baráti Köre), who brought a piece of home by
organizing common dinners, cultural, sport, travelling and other activities. Especially thanks
for Kova, Toto, Orsi, Zsófi, Dénes, Szilvi, Kriszta, Árpi and András.
I would like to thank my friend Olga for the endless positive energy she gave me
during these years. Her presence always cheered me up and calmed me down when I had deep
periods or seemingly unsolvable problems. Special thanks for Bernardo, Tamás and Daisy
who gave me enormous support, especially in the last, most difficult period of my PhD. Many
thanks go also to my friends in Hungary, especially Ildi, Gábor, Picur, Imipapa, Ernő, Ili,
Gábor (Loksa), Anikó, Ági, Mütyi and Attila who were always there for me, waiting and
supporting even if I was away for years.
I would like to give special thanks to my paranimphs: Oxana and Károly. Many thanks
for Oxana who has been a very valuable friend since we first met at the university in Hungary.
I was happy to have her next to me also as a colleague all these years during my PhD. I
always appreciated her openness and our long, warm talks in our secret language. Special
thanks for Károly, who was not only my best support and closest friend, but who was also as a
“family” for me during these years. I cannot express how grateful I am to him for that.
Finally, I would like to give an enormous thank for the contribution of my family,
especially my parents, Nella Fedotovna and Ervin Ács who have always been there for me
and who supported me from home. Anyu és Apu, köszönöm, hogy a hosszú, külföldön töltött
évek során végig mellettem álltatok és türelemmel viseltétek távollétemet. A tőletek kapott
rengeteg szeretet, biztatás, bölcs tanács és lelki támogatás nagyon sokat jelentett számomra,
hogy sikeresen befejezhessem tanulmányaimat. Köszönöm!
There are many people I could not list here and I would like to thank for contributing
to my work and to my personal development during these years.
THANK YOU!
Szvetlána Ács
Wageningen, July, 2006
8

9
Contents
Chapter 1 General introduction.......................................................................................... 13
1.1 Background and scope ............................................................................................... 15 1.2 Motives and barriers for conversion........................................................................... 16 1.3 Conversion process .................................................................................................... 17 1.4 Objective of the research............................................................................................ 18 1.5 Outline of the thesis.................................................................................................... 20
Chapter 2 Modelling conventional and organic farming; a literature review................ 23
2.1 Introduction ............................................................................................................... 25 2.2 Defining organic farming and conversion to organic farming.................................. 26
2.2.1 Aims and definitions of organic farming ......................................................... 26 2.2.2 Practical aspects of organic farming ................................................................ 27 2.2.3 Conversion aspects of organic farming............................................................ 27 2.2.4 Growth of the organic farming sector .............................................................. 29
2.3 Modelling conventional and organic farming ........................................................... 33 2.3.1 Empirical modelling......................................................................................... 34 2.3.2 Normative modelling........................................................................................ 37
2.4 Discussion and conclusion ........................................................................................ 39 Chapter 3 Comparison of conventional and organic arable farming systems in the
Netherlands by means of bio-economic modelling ......................................... 47 3.1 Introduction ............................................................................................................... 49 3.2 Model specification and data used for conventional and organic arable farms ........ 50
3.2.1 General structure .............................................................................................. 50 3.2.2 Land.................................................................................................................. 52 3.2.3 Crop activities .................................................................................................. 52 3.2.4 Rotation requirements ...................................................................................... 54 3.2.5 Labour .............................................................................................................. 55 3.2.6 Nutrient requirement and supply...................................................................... 56 3.2.7 Environmental policy ....................................................................................... 57 3.2.8 Organic matter.................................................................................................. 58 3.2.9 Pesticides.......................................................................................................... 58 3.2.10 Fixed costs...................................................................................................... 58
3.3 Results ....................................................................................................................... 59 3.3.1 Technical results............................................................................................... 59 3.3.2 Economic results .............................................................................................. 61 3.3.3 Environmental results....................................................................................... 62 3.3.4 Sensitivity analysis........................................................................................... 64
3.4 Discussion and outlook ............................................................................................. 65 3.4.1 Conversion period ............................................................................................ 65 3.4.2 Hired labour...................................................................................................... 66 3.4.3 Yield and price risk .......................................................................................... 66
10
Chapter 4 Conversion to organic arable farming in the Netherlands: a dynamic linear programming analysis....................................................................................... 71
4.1 Introduction ............................................................................................................... 73 4.2 Method ...................................................................................................................... 74
4.2.1.Model specification .......................................................................................... 74 4.2.2 Input data for the model ................................................................................... 76 4.2.3 Model output .................................................................................................... 79 4.2.4 Input data for the model ................................................................................... 79
4.3 Results of the DLP model ......................................................................................... 80 4.3.1 Optimal cropping plan...................................................................................... 80 4.3.2 Technical results............................................................................................... 82 4.3.3 Economic results ............................................................................................. 84 4.3.4 Sensitivity analysis........................................................................................... 86
4.4 Discussion and conclusion ....................................................................................... 88 Chapter 5 Effect of yield and price uncertainty on conversion from conventional to
organic farming ................................................................................................. 93 5.1 Introduction ............................................................................................................... 95 5.2 Method ...................................................................................................................... 96
5.2.1 Inclusion of risk in a mathematical programming model ................................ 96 5.2.2 General structure of the model ......................................................................... 98 5.2.3 Activities and constraints ............................................................................... 100 5.2.4 Data ................................................................................................................ 102 5.2.5 Setup of calculations ...................................................................................... 105
5.3 Results ..................................................................................................................... 106 5.3.1 Basic results of DUEP model......................................................................... 106 5.3.2 Sensitivity analysis......................................................................................... 108
5.4 Discussion and conclusion ...................................................................................... 110 Chapter 6 General discussion............................................................................................ 115
6.1 Methodological issues ............................................................................................. 117 6.2 Methodological issues ............................................................................................. 118
6.2.1 Farm level approach ....................................................................................... 118 6.2.2 Empirical vs. normative approach.................................................................. 118 6.2.3 The use of LP-, DLP- and DUEP -models ..................................................... 119 6.2.4 Data issues on farm modelling ....................................................................... 121
6.3 Results ..................................................................................................................... 122 6.3.1 Economic results ............................................................................................ 122 6.3.2 Price and yield risk......................................................................................... 122 6.3.3 Environmental results..................................................................................... 124 6.3.4 Policy implications......................................................................................... 124
6.4 Main conclusions..................................................................................................... 126 Summary ........................................................................................................................... 131 Samenvatting ........................................................................................................................ 139 Publications........................................................................................................................... 145 About the Author ................................................................................................................. 151
11

12

13
Chapter 1
General introduction

General Introduction
1.1 Background and scope
Society and governments in many countries show an increasing concern about food
production due to environmental problems, animal welfare and human health problems
(Walker et al., 2005; Weersink & Wossink, 2005; Wolf at al., 2005; Tilman et al., 2002).
Environmental problems related to agriculture are often related to flows of nutrients (nitrogen
and phosphate) to the environment and emissions of ammonia and carbon dioxide that
contribute to the acid rain problem and the greenhouse effect. Human health problems are
apparent through the occasional finding of residues from e.g. pesticides and herbicides in
food. These environmental and human health problems in the food chain have induced many
governments in the world to promote more sustainable farming systems. Organic farming is
recognised in the European Union as one possible way to improve the sustainability of
agriculture (Rigby & Cáceres, 2001; Padel et al., 2002). The main aim of organic farming is
to create a sustainable agricultual production system including economic, environmental and
social sustainability (Padel, 2001). In organic farming, maximum reliance is placed on self-
regulating ecological or biological processes and renewable resources, whereas reliance on
external inputs is reduced as far as possible (Lampkin, 1994). Organic farming claims to have
the potential to provide benefits in terms of environmental protection, conservation of non-
renewable resources, improved food quality, reduction in output of surplus products and the
reorientation of agriculture towards areas of market demand (Lampkin, 1994). Some
European governments have recognized these potential benefits and responded to them by
encouraging farmers to adopt organic farming practices, either directly through financial
incentives or indirectly through support of research, extension and marketing initiatives.
Organic farming in the European Union (EU) showed rapid growth in the last few
decades due to policy incentives and consumer demand (Dabbert et al, 2004). However, the
overall significance of organic farming in the EU context is still quite small in terms of land
area used. In 2004 it was 3.5% of the total EU utilised agricultural area (UAA) (FIBL, 2005).
In some member states, such as in the Netherlands, the rapid growth in the nineties has
slowed down after the end of the century. In the Netherlands, as in many European countries,
an action plan was developed to promote organic agriculture (Yussefi & Willer, 2002). In
2000 the Dutch government set an ambitious target that by 2005 five percent and by 2010 ten
percent of the total agricultural area should be organically managed (Melita, 2001). However,
the conversion from conventional to organic farming was progressing more slowly and in
2005 the organic land area was only 2.49% (Eurostat, 2006). In spite of this, the target of ten
15
Chapter 1
percent by 2010 still remains (MINLNV, 2005). In order to stimulate the conversion, policy
makers need more detailed information about the process of conversion. Factors that motivate
and hamper the conversion of farms have to be investigated in more detail.
After livestock production, which occupies 57% of the total UAA, arable farming is
the second most important sector in the Netherlands in terms of utilized land area, with 25%
of the total UAA (LEI, 2005). The largest sector in organic farming in the Netherlands is the
livestock production sector with 44.8% of organic UAA, followed by horticulture and arable
farming sector with 24% and 22%, respectively. The remaining part of the organic area is
occupied by fruit and other organic production such as mushrooms, planting materials and
herbs. The biggest share of organic area for livestock production can be explained, besides by
the increasing consumer demand, by the relatively easier conversion of dairy farmers to
organic production compared to the conversion of other sectors (Melita 2001). The arable
sector requires more attention because it is unclear why some farms converted and others
converted back during the last few years, reducing the level of initial growth considerably.
1.2 Motives and barriers for conversion
Based on literature, the factors that motivate the conversion can be distinguished as economic
and non-economic factors. Economic motives include attempts to solve existing financial
problems as well as the desire to secure the long-term existence of the farm. They cover cost
saving through organic production as well as premium price marketing (Lampkin 1994;
MacRae, R.J. 1990; Lockeretz & Madden, 1987). Non-economic motives include husbandry
and technical reasons and personal reasons (Padel, 2001). Husbandry and technical concerns
include animal welfare and animal health problems, soil fertility and erosion problems.
Personal reasons include general concerns about food quality, stewardship, conservation,
environment and rural development, and in some cases personal and family health problems.
Motives to convert to organic farming are different between types of farmers (Darnhofer et
al., 2005) and have changed over time from husbandry related concerns to economic reasons,
from religious and philosophical concerns to environmental and political ones (Padel, 2001).
Although economic motives are not the most important motives for the farmers to convert, it
is widely seen as an important factor determining the acceptance of organic farming by
conventional farmers (Lampkin & Padel, 1994). Therefore, information about economic
performance is essential for individuals as well as for policy decision-making.
16
General Introduction
Factors that hamper the conversion can be grouped in production, market,
institutional and social barriers. The main production barriers include lack of technical and
financial information and higher perceived risk associated with conversion (Padel, 2001;
Padel & Lampkin, 1994). Besides these financial difficulties during the conversion period,
increased labour need in organic production, yield uncertainty during and after the conversion
and learning process are also considered important production factors that hamper the
conversion (Padel, 2001; Padel & Lampkin, 1994; Van Mansvelt & Mulder, 1993). Market
barriers include uncertainty concerning future market availability for organic products and
price risk due to the small-scale, immature nature of organic market and the lack of
government intervention to stabilise prices (Lampkin & Padel, 1994). Institutional barriers
include refusal of loans and insurance for organic products, legislative and certification
constraints (Padel, 2001). Social barriers are a fear to become an outsider or to get involved in
intergenerational conflicts; however, this is becoming less relevant with the increase of social
acceptance of organic farming in general (Lampkin & Padel, 1994).
1.3 Conversion process
A key factor inhibiting conversion to organic farming, despite the premium market and the
other benefits, is concern about the implications of conversion. A period of two years, known
as the conversion or transition period, is needed to change a farm from conventional to
organic. During this period the farmer should aim to (Lampkin & Padel, 1994):
• Change the management to maintain animal and plant health with the limited inputs
available according to organic production standards;
• Build up soil fertility by establishing a rotation with legumes so that crops can be
produced without synthetic nitrogen fertilizer or large amounts of purchased manures.
The necessary changes depend on the conventional cropping intensity and the condition of the
farm before conversion. Conversion is a complex process involving a high degree of
innovation and learning of the farmer, as well as temporary income loss. Extra costs follow
from conversion-related investments in machinery and/or buildings and information gathering
expenses. A loss of revenue arises from yield reductions, due to biological and learning
processes, which is not compensated by premium prices during the statutory two-year
conversion period.
17
Chapter 1
Another problem arises from the fact that farmers, who would decide to convert and
make these investments, do not have a guarantee that their income will be higher in the long
run. This means that farmers besides the conversion difficulties have to deal with the problem
of future yield and market price uncertainty of their produced organic products (Padel 2001;
Dabbert & Madden 1986).
In this research the focus is on economic performance and difficulties of conversion of
a typical conventional arable farm converting to organic production system given the current
institutional and policy regulatory environment in the Netherlands. Several constraining
factors during conversion process and the effect of yield and price uncertainty during and
after the conversion period on income and conversion planning are investigated in more
detail.
1.4 Objective of the research
The study aims to gain more insight in the economics of conversion. Many empirical studies
using data analysis has been done already, therefore the focus here is on the analysis of
conversion from a normative point of view. This research attempts to answer the following
three sub-questions:
1. Why do the farmers not convert?
2. What are the important influential factors of conversion? What is the magnitude of
them?
3. What types of incentives can be useful to stimulate conversion?
The main objective of this research was to answer the above questions by means of (1)
developing a modelling approach that can be used for analyzing the conversion from
conventional to organic arable farming systems from economic and environmental point of
view and (2) determining the effects of influential factors and policies (incentives) on the
choice of farmers to convert from conventional to organic farming systems. The models were
developed for a typical arable farm in the central clay region in the Netherlands. This region
has been chosen because the most organic arable farms are situated here and because of
availability of data.
18
General Introduction
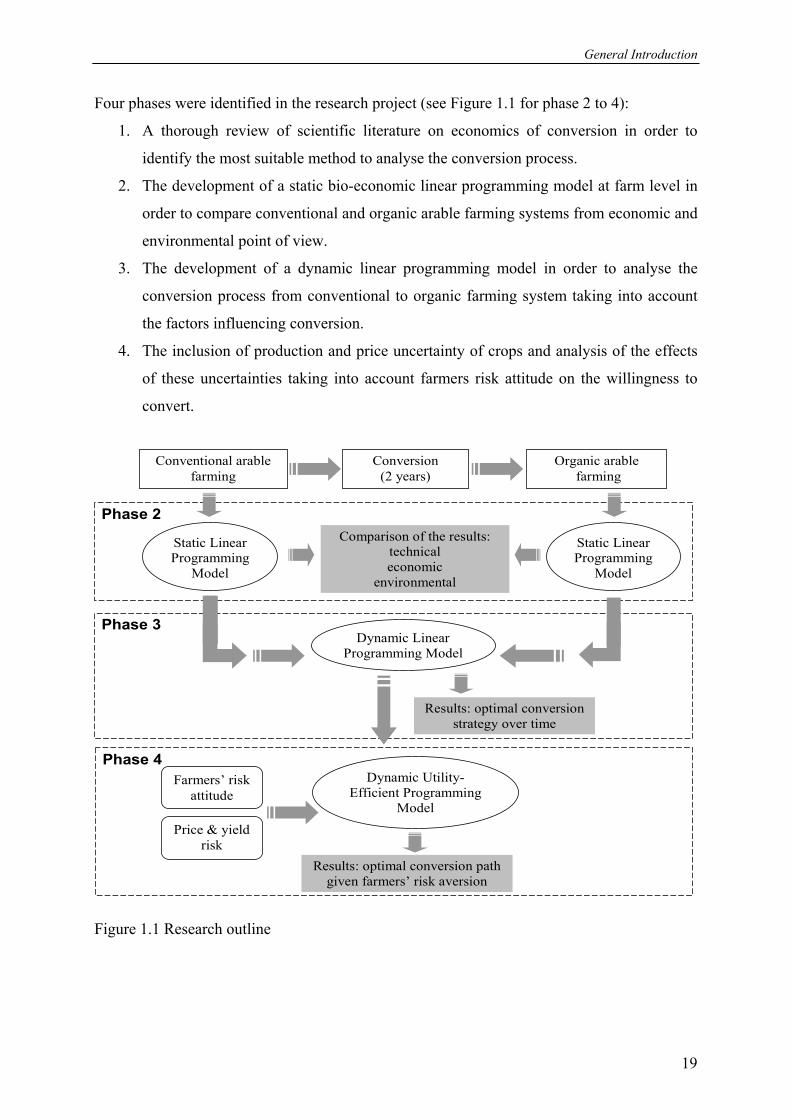
Four phases were identified in the research project (see Figure 1.1 for phase 2 to 4):
1. A thorough review of scientific literature on economics of conversion in order to
identify the most suitable method to analyse the conversion process.
2. The development of a static bio-economic linear programming model at farm level in
order to compare conventional and organic arable farming systems from economic and
environmental point of view.
3. The development of a dynamic linear programming model in order to analyse the
conversion process from conventional to organic farming system taking into account
the factors influencing conversion.
4. The inclusion of production and price uncertainty of crops and analysis of the effects
of these uncertainties taking into account farmers risk attitude on the willingness to
convert.
Conventional arable farming
Organic arable farming
Conversion (2 years)
Dynamic Utility- Efficient Programming
Model Price & yield
risk
Farmers’ risk attitude
Phase 2
Phase 3
Phase 4
Results: optimal conversion path given farmers’ risk aversion
Comparison of the results: technical economic
environmental
Results: optimal conversion strategy over time
Dynamic Linear Programming Model
Static Linear Programming
Model
Static Linear Programming
Model
Figure 1.1 Research outline
19
Chapter 1
1.5 Outline of the thesis
In Chapter 2 a review of scientific literature on the evaluation of technical, economic and
environmental implications of conversion from conventional towards more sustainable
production, i.e. organic farming is presented. Methods and results of different studies are
compared and the advantages and disadvantages of different approaches (empirical and
normative) are analysed and discussed to determine their suitability for modelling conversion
at farm level.
In Chapter 3 a comparison of the conventional and organic arable farming system is
made by using a normalised situation (same area, soil type, climate, etc.). The chapter
describes a linear programming model of a conventional arable farm and of an organic arable
farm in the central clay region of the Netherlands. The setup of these two models is presented
and the technical, economic and environmental results are analysed and compared (see Figure
1.1).
In Chapter 4 the conversion period between conventional and organic farming is
included in the model by means of dynamic linear programming model (DLP) (see Figure
1.1). The DLP describes the conversion process of a farm over time by maximizing the net
present value over a ten-year planning horizon. In this chapter the model is presented and
next, it is used to analyse different factors influencing the conversion, such as extra
depreciation costs, hired labour availability, organic market price uncertainty and minimum
labour income requirement.
In Chapter 5 yield and price uncertainty before, during and after the conversion years
is included in the DLP model of Chapter 4 (see Figure 1.1). The developed discrete stochastic
dynamic utility-efficient programming (DUEP) model is described. This model maximizes
the expected utility of the farmer depending on the farmers’ risk attitude. Uncertainty is based
on average group results in practice for a number of years. The results of the model for a basic
situation are presented and analysed followed by the results of a sensitivity analysis for
different factors such as policy incentives, market stabilization for organic products or
learning effect of farmers.
In Chapter 6 the methodological issues of the thesis and the applicability of the
method, interpretation of the results and comparison of the results with that of other studies
are discussed. Further, some policy implications on organic farming support are put forward.
Finally, the chapter ends with main conclusions of the thesis.
20
General Introduction
References
Dabbert S., Häring, A. M. & Zanoli, R.,2004. Organic Farming. Policies and Prospects. Zed
Books; London, UK. 169 p.
Dabbert, S. and Madden, P., 1986. The transition to organic agriculture: A multi-year
simulation model of a Pennsylvania farm. American Journal of Alternative Agriculture
1(13), p. 99-107.
Darnhofer, I., Schneeberger, W., and Freyer, B., 2005. Converting or not converting to
organic farming in Austria: Farmer types and their rationale. Agriculture and Human
Values 22, p. 39-52.
Eurostat, 2006. European Commission. Agricultural Statistics.
http://ec.europa.eu/comm/agriculture/agrista/index_en.htm Accessed 28 March 2006.
FIBL, 2005. Organic farming in Europe. Research Institute of Organic Agriculture.
www.fibl.org Accessed 28 February 2006
Lampkin, N.H., 1994. Organic farming: sustainable agriculture in practice. In N.H. Lampkin
and S. Padel eds, The economics of organic farming: an international perspective.
Wallingford: CAB International, 454 p.
Lampkin, N.H. and Padel., S., 1994. The economics of organic farming: an international
perspective. CAB International, Wallingford, UK. 454 p..
Lockeretz, W. and Madden, P., 1987. Midwestern organic farming: a ten-year follow-up.
American Journal of Alternative Agriculture 2 (2), p. 57-63.
MacRae, R.J., Hill, S.B., Mehuys, G.R. and Henning, J., 1990. Farm scale agronomic and
economic conversion from conventional to sustainable agriculture. Advances in
Agronomy 43, p.155-198.
Van Mansvelt J. D. and Mulder, J.A., 1993. European features for sustainable development: a
contribution to the dialogue, Landscape and Urban Planning 27, Issues 2-4, p. 67-90.
Melita, F., 2001. Organic Farming in the Netherlands – Country Reports.
<http://www.organic-europe.net/country_reports/netherlands/default.asp>
Accessed 23 April 2006.
MINLNV, 2005. Ministry of Agriculture, Nature and Food Quality http://www.nlpekagr.com/
Accessed 20 April 2006.
Padel, S., 2001. Conversion to organic farming: A typical example of the diffusion of an
innovation? Sociologia Ruralis 41 (1), p. 40-61.
21
Chapter 1
Padel, S. and Lampkin, N.H., 1994. Conversion to organic farming: An overview. Pp. 454 in
N.H. Lampkin and S. Padel eds, The economics of organic farming: an international
perspective. Wallingford: CAB International, 454 p.
Padel, S., Lampkin, N. H., Dabbert, S., and Foster, C., 2002. Organic farming policy in the
European Union. Advances in the Economics of Environmental Resources, 4, 169-194.
Rigby D., Cáceres, D., 2001. Organic farming and the sustainability of agricultural systems.
Agricultural Systems, 68, 21-40.
Tilman, D., K.G. Cassman, P.A. Matson, R. Naylor, S., 2002. Agricultural sustainability and
intensive production practices, Nature 418, p 671-677.
Weersink, A. and Wossink, A., 2005. Lessons from agri-environmental policies in other
countries in dealing with salinity in Austraila. Australian Journal of Experimental
Agriculture, 45, p. 1481-1493.
Wolf, J, Rötter, R. And Oenema, O., 2005. Nutrient emission models in environmental policy
evaluation at different scales – Experience form the Netherlands. Agriculture,
Ecosystems and Environment 105, p.291-306.
Walker, P., Rhubart-Berg, P., McKenzie, S., Kelling, K., Lawrence, R. S., 2005. Public
health implications of meat production and consumption. Public Health Nutrition. 8 (4),
p. 348-356.
Yussefi, M. and Willer, H., 2002. Organic Agriculture Worldwide 2002: Statistics and Future
Prospects. SÖL (Foundation of Ecology and Agriculture), Bad Dürkheim, 166 p.
22
23
Chapter 2
Modelling conventional and organic farming; a literature review
S. Acs1, P.B.M. Berentsen1 and R.B.M. Huirne1,2
1 Business Economics, Department of Social Sciences, Wageningen University, Wageningen
2 Animal Sciences Group, Lelystad
Wageningen Journal of Life Sciences, NJAS 53-1, 2005

Chapter 2
Abstract
Literature shows a significant development of organic farming in Europe but with
considerable differences between countries. These depend on general agricultural policy (the
set of regulations and laws), specific policy incentives, and also on differences in consumer
behaviour. This paper reviews scientific literature on the evaluation of the technical,
economic and environmental aspects of conversion from conventional towards organic
production. The methods and results of empirical and normative modelling studies at the farm
level, with special regard to farm management and policy, are analysed. Empirical modelling
studies show the importance of incentives and agricultural policy, and the usefulness of
integrated modelling for determining the effects of different policies on farm management.
Normative modelling shows the effects of new policy instruments and technology, and allows
the high level of detail needed for what-if analysis. Normative models of conversion to
organic farming confirm the importance of incentives and the agricultural policy context.
24

Modelling conventional and organic farming; a literature review
2.1 Introduction
Organic farming claims to have the potential to provide benefits in terms of environmental
protection, conservation of non-renewable resources, improved food quality, reduction in
output of surplus products and the reorientation of agriculture towards areas of market
demand (Lampkin, 1990). Some European governments have recognized these potential
benefits and responded to them by encouraging farmers to adopt organic farming practices,
either directly through financial incentives or indirectly through support of research, extension
and marketing initiatives. However, farmers’ decisions on whether or not to make the switch
from conventional to organic farming have not been studied extensively thus far.
The study reported in this paper is a part of a larger project that focuses on developing a
farm-level model that can be used to support farmers and government in the transition process
from conventional to organic farming systems in economic and environmental terms. The
model will be used to determine the effects of different policies on the conversion to organic
farming systems.
The objective of this paper is to present a review of scientific literature on the evaluation
of technical, economic and environmental implications of conversion from conventional
towards more sustainable production, i.e. organic farming. Methods and results of different
studies will be compared and the advantages and disadvantages of different approaches will
be analysed.
The paper starts with definitions of organic farming and the way these definitions are
operationalized into policy. Next, some data and background information concerning the
history of organic farming in the EU and in the Netherlands are given. After that, empirical
and normative modelling research is analysed to determine their suitability for modelling
conversion from conventional to organic farming. This analysis is based on articles in peer-
reviewed scientific journals. Finally, conclusions will be drawn concerning modelling of
conversion from conventional towards organic farming.
25
Chapter 2
2.2 Defining organic farming and conversion to organic farming
2.2.1. Aims and definitions of organic farming
There are many definitions of organic farming. Mannion (1995) refers to it as a holistic view
of agriculture that aims to reflect the profound interrelationship between farm biota,
agricultural production and the overall environment. Scofield (1986) stresses that organic
farming does not simply refer to the use of living materials, but emphasises the concept of
‘wholeness’, implying the “systematic connection or co-ordination of parts in one whole.” As
Scofield points out, the concerns that motivated the early adopters of organic farming, include
issues of soil health and structure, the exhaustible nature of artificial fertilizers, and human
health.
According to the Codex Alimentarius (Le Guillou & Scharpé, 2001), organic farming
involves holistic production management systems (for crops and livestock) emphasizing the
use of management practices in preference to the use of on-farm inputs. This is accomplished
by using, where and when possible, cultural, biological and mechanical methods in preference
to synthetic materials.
One of the most significant expositions of the aims and principles of organic farming is
presented in the International Federation of Organic Agriculture Movement’s basic standards
for production and processing (Anon., 2002). In the words of the principle aims of IFOAM,
organic farming even involves a clear vision of a major change in society in order to make
organic farming possible:
“(…) to interact in a constructive and life-enhancing way with natural systems and
cycles; (…) to consider the wider social and ecological impact of the organic
production and processing system; (…) to progress toward an entire production,
processing and distribution chain which is both socially and ecologically responsible.”
Lampkin & Padel (1994) provide a more operational definition of organic farming. They state
that the aim of organic farming is:
“to create integrated, humane, environmentally and economically sustainable
agricultural production systems, which maximize reliance on farm-derived renewable
resources and the management of ecological and biological processes and interactions,
so as to provide acceptable levels of crop, livestock and human nutrition, protection
26
Modelling conventional and organic farming; a literature review
from pests and diseases, and an appropriate return to the human and other resources
employed”.
In some respects, this definition stands as the complete opposite to conventional productivist
agriculture, which implies extensive use of artificial inputs such as fertilizers and pesticides
designed to increase productivity in food production.
2.2.2. Practical aspects of organic farming
Some practical consequences of organic farming concerning crop and livestock production
can be described by the following.
In crop production, the soil fertility and the biological activity should be maintained by
use of green manure, leguminous plants and an ample crop rotation scheme. Fertilising takes
place with manure of organic origin – no synthetic fertilizer is allowed. For crop protection
against pests and diseases, besides ample crop rotation schemes, natural enemies are used.
Weed control is based on the selection of varieties and mechanical protection methods.
Livestock production focuses on animal welfare, animal health care and organic feeding.
Farm animals must be kept in a natural way with sufficient run-out, space, light and litter in
the stable. For each animal minimum indoor and outdoor room should be available. Nutrition,
care and housing should offer the animals an optimal natural resistance against diseases.
Natural and homeopathic medicines have preference. The foodstuffs should be organically
produced, and only a restricted number of additives is allowed (CABI, 2004).
2.2.3. Conversion aspects of organic farming
The agri-environmental measures introduced by EU Council Regulation 2078/92 (Anon.,
1992) encourage conversion to and maintenance of organic farming by providing financial
compensation to farmers for any losses incurred during conversion. In the European Union,
organic production of agricultural products is regulated by Council Regulation 2092/91
(Anon., 1991). This regulation sets out strict requirements which must be met before
agricultural products, whether produced in the EU or imported from third countries, can be
marketed as organic. In particular, it severely restricts the range of products that can be used
for fertilizing and for plant pest and disease control, and requires each member state to set up
27

Chapter 2
a certification body and an inspection system to certify compliance with these principles. The
principles must normally have been followed for at least two years before sowing or, in the
case of perennial crops, at least three years before harvesting, before the products can be sold
as organic. During this period the farm is said to be ‘in conversion’ (Hau & Joaris, 1999).
Two types of conversion can be distinguished (Lampkin & Padel, 1994):
1. Staged (step-by-step) conversion. Every year a certain area of the farm is converted to
organic farming. Some certification bodies do not accept this type of conversion.
2. Single-step conversion. The whole farm converts to organic farming at the same
moment. This enables the farm to gain access to premium prices sooner, but means
that all the risks, learning costs and financial impacts of conversion are concentrated
into a short period of time, while for arable farming rotation disadvantages can arise
because not all of the farm can be put in fertility-building crops at the same time.
In the case of livestock production, the animals also have to be converted from conventional
to organic production. The conversion period depends on the animal type and varies from 6
weeks for layers to 12 months for meat cattle (Anon., 2004).
Lampkin and Padel (1994) drew some general conclusions about conversion based on
their EU-wide study. During the conversion (transition) period a farmer should aim to:
1. Improve soil fertility by establishing a rotation with legumes, so that crops can be
produced without inorganic nitrogen fertilizer or large amounts of purchased manure;
2. Adjust the stocking rate to the natural carrying capacity of the farm, so that livestock
can be kept without large amounts of purchased concentrates and/or forage;
3. Change the management system to maintain animal and plant health with the limited
inputs available according to organic production standards.
Necessary changes depend on the intensity and the condition of the farm before conversion.
Usually some investment in machinery and/or buildings is required in order to meet organic
standards. After the conversion period the farmer can apply for full organic certification and
will usually be allowed to use a symbol and gain access to premium prices when available.
In the early 1990s, an analysis of the experiences of farmers who had converted their
farms to organic systems indicated that the main problem (Lampkin, 1990) encountered
during the conversion process is:
1. Shortage of forage on livestock farms (due to a reduction in yields and increased
reliance on home-grown forage);
2. Excess protein in rations of livestock herds leading in some instances to health
problems;
28
Modelling conventional and organic farming; a literature review
3. Problems with weed control (notably docks, couch and thistles);
4. High workloads in peak periods;
5. Financial difficulties due to lack of access to price premiums until conversion is
complete, conversion-related investments and ‘disinvestments’ and information-
gathering costs for production and marketing (Lampkin & Padel, 1994).
2.2.4. Growth of the organic farming sector
During the 1980s, organic farming received political attention in many European countries
through political recognition of the production system (i.e., standards, certification systems
and labels ) (Lampkin et al., 1999a). Public financial support for organic farmers was
introduced for the first time in Europe (in Denmark) in 1987 to cover economic losses during
the two-year conversion period (Michelsen, 2001). During the 1990s, political interest in
organic farming moved to the level of the EU, which introduced a common set of production
standards for organic plant production in 1991 (EU Regulation 2092/91) (Anon., 1991). In
1999 this was supplemented by common standards for organic livestock production (EU
Regulation 1804/99) (Anon., 1999) and by an option for financial support of organic farmers.
The latter followed from the measures accompanying the reform of the Common Agricultural
Policy in 1992 (EU Regulation 2078/92) (Anon., 1992). In the following years, member states
implemented various organic farming policies according to this legislative framework
(Lampkin et al., 1999a). Since 1999, organic farmers in all EU countries have been receiving
support under the agri-environmental programmes that are granted under the rural
development regulation of Agenda 2000 (Häring & Dabbert, 2004).
In the Netherlands, among different subsidy regulations of the Ministry of Agriculture,
Nature and Food Quality relevant to organic farming, there is a regulation supporting the
conversion to organic production (Regeling Stimulering Biologische Productiemethode,
RSBP). The RSBP is implemented by Dienst Landelijke Service (LASER). This regulation
provides financial support during the conversion period in order to compensate the loss in
income, according to the Conversion Scheme (Lampkin et al., 1999a). However, there is an
additional condition that one must produce organically for at least five years. The subsidy is
given per five years per hectare. For the future development of organic farming in the
Netherlands, as in some other European countries, an action plan was developed to promote
organic agriculture. As part of this action plan, marketing of organic products, advisory
29
Chapter 2
services and consumer information is supported (Yussefi & Willer, 2002). The action plan
developed by the Dutch government (Plan van Aanpak Biologische Landbouw 2001–2004) in
2000 includes an important target. Five percent of the total agricultural area should be
organically managed by the year 2005 and 10% by the year 2010 (Yussefi & Willer, 2002).
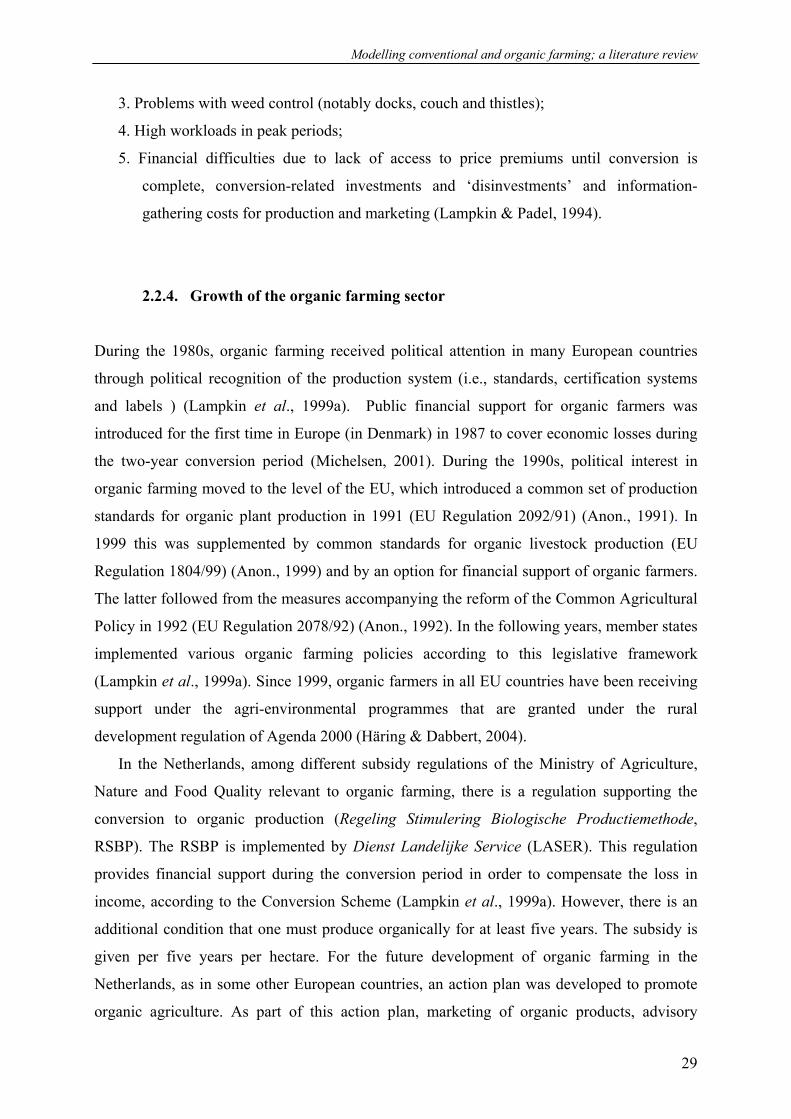
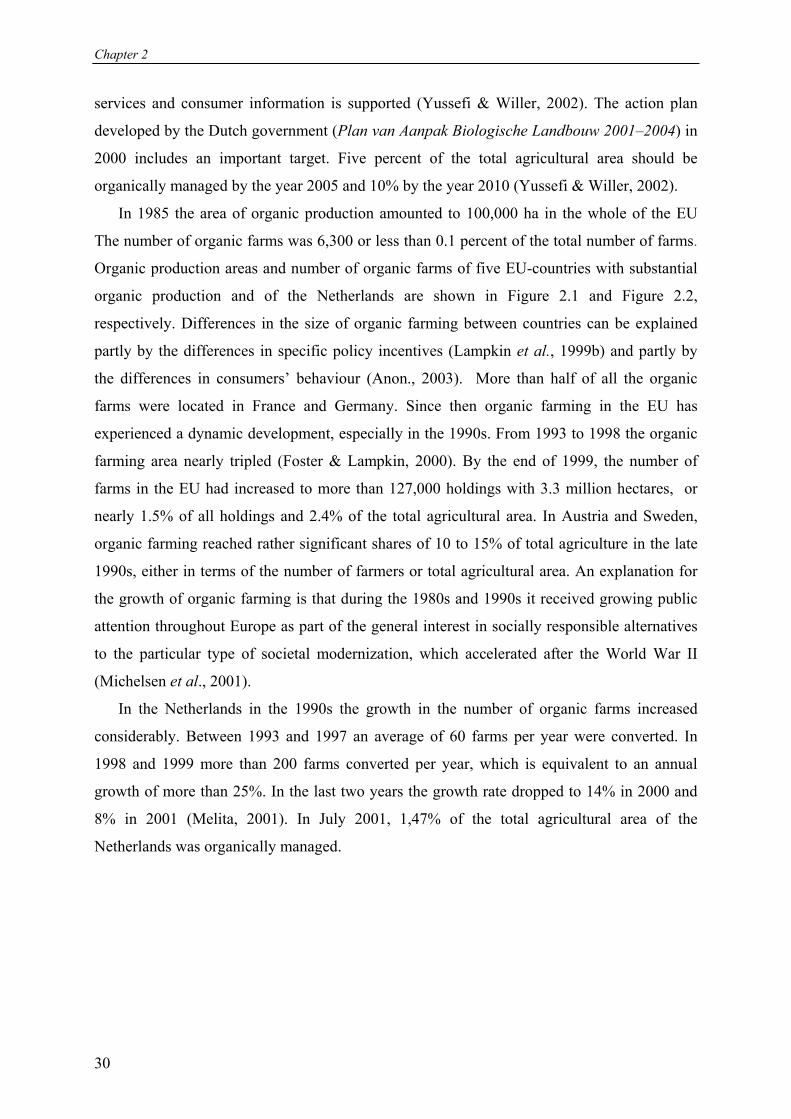
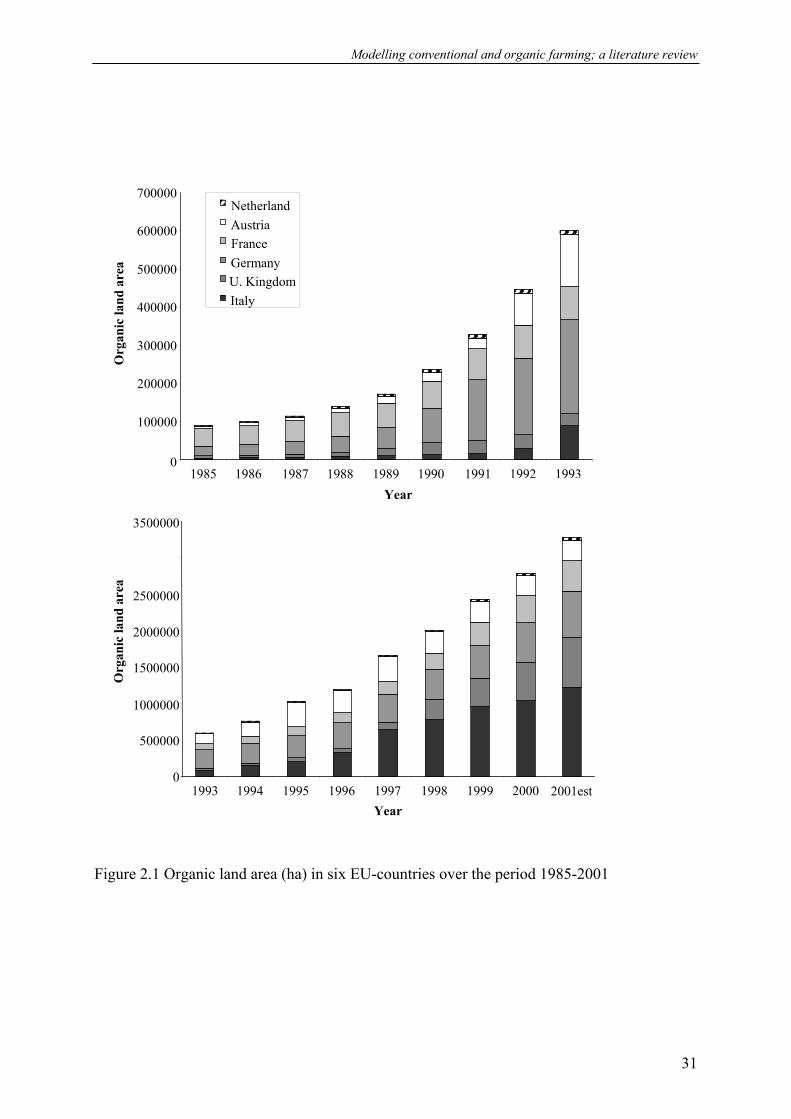
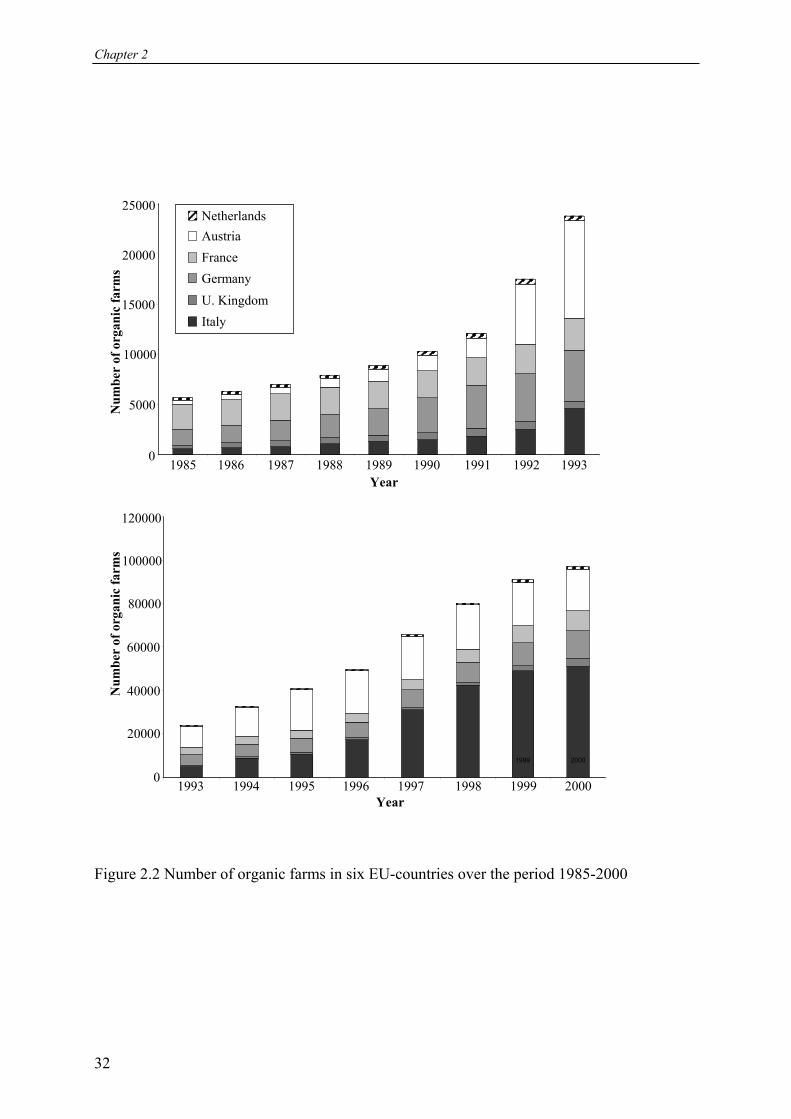
In 1985 the area of organic production amounted to 100,000 ha in the whole of the EU
The number of organic farms was 6,300 or less than 0.1 percent of the total number of farms.
Organic production areas and number of organic farms of five EU-countries with substantial
organic production and of the Netherlands are shown in Figure 2.1 and Figure 2.2,
respectively. Differences in the size of organic farming between countries can be explained
partly by the differences in specific policy incentives (Lampkin et al., 1999b) and partly by
the differences in consumers’ behaviour (Anon., 2003). More than half of all the organic
farms were located in France and Germany. Since then organic farming in the EU has
experienced a dynamic development, especially in the 1990s. From 1993 to 1998 the organic
farming area nearly tripled (Foster & Lampkin, 2000). By the end of 1999, the number of
farms in the EU had increased to more than 127,000 holdings with 3.3 million hectares, or
nearly 1.5% of all holdings and 2.4% of the total agricultural area. In Austria and Sweden,
organic farming reached rather significant shares of 10 to 15% of total agriculture in the late
1990s, either in terms of the number of farmers or total agricultural area. An explanation for
the growth of organic farming is that during the 1980s and 1990s it received growing public
attention throughout Europe as part of the general interest in socially responsible alternatives
to the particular type of societal modernization, which accelerated after the World War II
(Michelsen et al., 2001).
In the Netherlands in the 1990s the growth in the number of organic farms increased
considerably. Between 1993 and 1997 an average of 60 farms per year were converted. In
1998 and 1999 more than 200 farms converted per year, which is equivalent to an annual
growth of more than 25%. In the last two years the growth rate dropped to 14% in 2000 and
8% in 2001 (Melita, 2001). In July 2001, 1,47% of the total agricultural area of the
Netherlands was organically managed.
30
Modelling conventional and organic farming; a literature review
Italy U. Kingdom Germany France Austria Netherland
700000
600000
500000
400000
300000
200000
100000
0
Org
anic
land
are
a
1992 19931985 1986 1987 1988 1989 1990 1991
Year
3500000
2500000
2000000
1500000
1000000
500000
0
Org
anic
land
are
a
1993 1994 1995 1996 1997 1998 1999 2000 2001est Year
Figure 2.1 Organic land area (ha) in six EU-countries over the period 1985-2001
31
Chapter 2
Italy U. Kingdom Germany FranceAustriaNetherlands
25000
20000
5000
10
1
Num
ber
of o
rgan
ic fa
rms
5000
000
0
1985 1986 1987 1988 1989Year
1990 1991 1992 1993
2000 1999
2000 1999
19981997Year
1993 1994 1995 1996
120000
00000
40000
60000
80000
1
Num
ber
of o
rgan
ic fa
rms
20000
0
Figure 2.2 Number of organic farms in six EU-countries over the period 1985-2000
32
Modelling conventional and organic farming; a literature review
2.3 Modelling conventional and organic farming
When the relationship between agricultural production methods and economic and
environmental sustainability at the farm level is examined we can distinguish two main
categories of models: empirical and normative models.
Empirical models are understood here as econometric models. Econometric models are
statistical representations of farm-level systems, often as aggregate systems of equations for
input demand and output supply. Econometric models allow for statistical testing of economic
and/or technical relationships (Pindyck & Rubinfeld, 1998; Wallace & Moss, 2002).
Normative models are mechanistic optimization and simulation models. Optimization and
simulation models are both systems of equations and/or inequalities designed to replicate
farm-level activities related to production, marketing and finance. A distinction often made
between optimization and simulation models is that the former involve explicitly the
specification of an objective function (e.g. profit maximization), while this is not the case for
simulation models (Hazell & Norton, 1986; Weersink et al., 2002).
Farm modelling, both empirical and normative, is an important tool for farm planning and
extension, research planning and evaluation, and policy analysis (Klein & Narayanan, 1992).
Lee (1983) distinguishes three specific needs of farm modelling: (1) understanding likely
responses of farms to specific economic conditions and policy provisions, (2) understanding
the likely distributive effects of these conditions and provisions, and (3) providing additional
detail and likely behavioural responses not well specified in macro models. According to
these purposes of farm modelling two main types of farm model can be distinguished:
1. Models to support farm management;
2. Models to support policy making.
Models to support farm management concern particular effects of different management
practices on the income of the farmer and on the environment. They analyse how different
input combinations and constraints influence the output results of the farm.
Models that focus on policy analysis aim to clarify the effect of different policy
instruments on management decisions and through it on economics and environment (Baum
& Schertz 1983). In such a way different policy alternatives can be compared. Alternatives
include, for example, taxes, subsidies, transferable permit schemes, insurance and credit
instruments (Falconer, 1998; Oskam et al., 1998).
33
Chapter 2
2.3.1 Empirical modelling
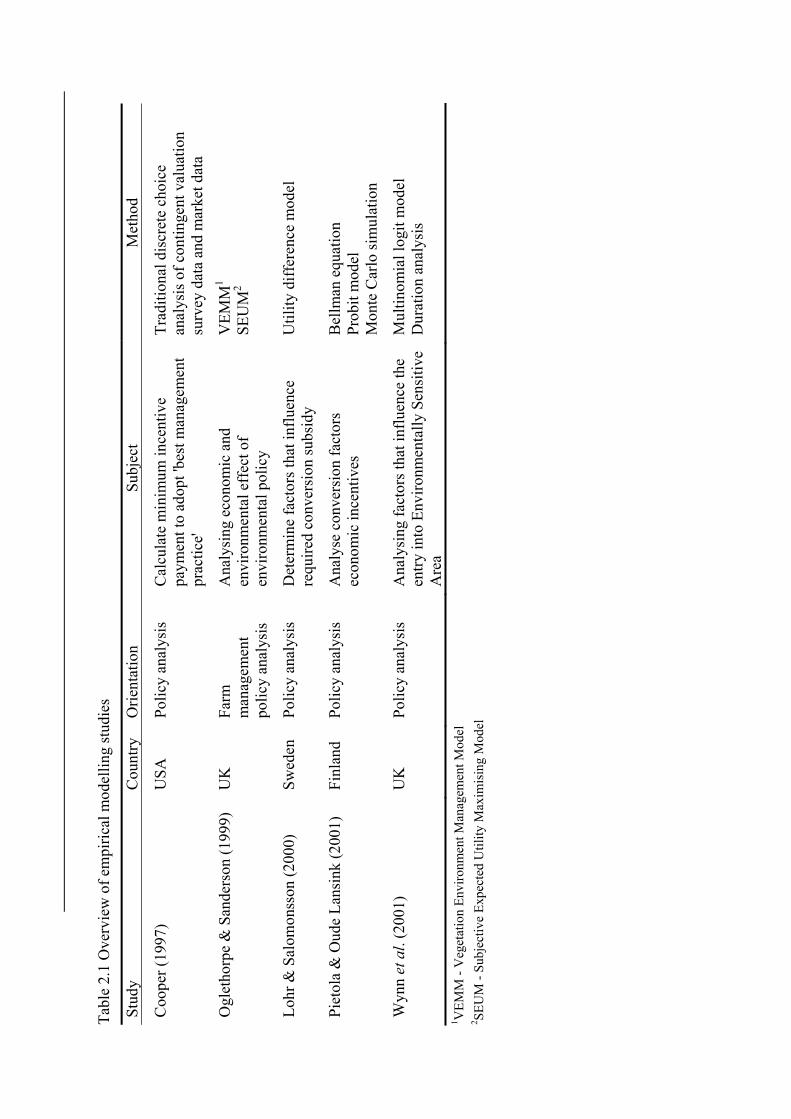
There are many econometric studies dealing with economic and environmental aspects of
conversion to more sustainable farming systems such as organic farming. They are
summarised in Table 2.1, and it is clear that the majority of the reviewed econometric studies
are oriented towards supporting policy making.
Cooper (1997) made an attempt to estimate the minimum incentive payments a farmer
would require in order to adopt more environmentally friendly “best management practices”
(BMPs). This was done by using contingent valuation method (CVM) survey data (farmers’
responses concerning the adoption of BMPs given hypothetical incentive payment values per
acre) in combination with actual market data (farmers’ actual responses on the amount of
incentive payments) from four watershed regions in the United States. Combining actual
market data with the CVM data adds information to the analysis, thereby most likely
increasing the reliability of the results compared to analysing the CVM data only. Traditional
discrete choice analysis was applied to analyse the combined data. Adoption rates (percentage
of farmers adopting BMP) predicted with the combined data model are significantly higher
than those predicted using the traditional discrete choice analysis based on CVM data only.
Hence, the author concluded that using traditional CVM analysis results to determine
payments to attain a given level of adoption is likely to result in overpayment.
Oglethorpe and Sanderson (1999) aimed to explain how a utility maximising economic
modelling framework can be linked to an ecological modelling system in order to do ex ante
assessment of the ecological impact of certain key agricultural management parameters. Two
models, Subjective Expected Utility Maximising Model (SEUM) and Vegetation
Environmental Management Model (VEEM) were initially developed for independent
analyses. Data pertaining to a survey of farm sites were used to analyse the types of
relationships which emerge between agricultural management parameters and grassland
vegetation. A specific case-study site was selected for assessment of ecological and economic
performance of potential policy scenarios. The results of the analysis highlight the high
relevance of such an integrated modelling system for environmental policy decision support.
34
Cha
pter
2
Tabl
e 2.
1 O
verv
iew
of e
mpi
rical
mod
ellin
g st
udie
s
35
Stud
yC
ount
ry
Orie
ntat
ion
Subj
ect
Met
hod
Coo
per (
1997
) U
SA
Polic
y an
alys
is
Cal
cula
te m
inim
um in
cent
ive
paym
ent t
o ad
opt '
best
man
agem
ent
prac
tice'
Trad
ition
al d
iscr
ete
choi
ce
anal
ysis
of c
ontin
gent
val
uatio
n su
rvey
dat
a an
d m
arke
t dat
a
Ogl
etho
rpe
& S
ande
rson
(199
9)
UK
Fa
rm
man
agem
ent
polic
y an
alys
is
Ana
lysi
ng e
cono
mic
and
en
viro
nmen
tal e
ffec
t of
envi
ronm
enta
l pol
icy
VEM
M1
SEU
M2
Lohr
& S
alom
onss
on (2
000)
Sw
eden
Po
licy
anal
ysis
D
eter
min
e fa
ctor
s tha
t inf
luen
ce
requ
ired
conv
ersi
on su
bsid
y
Util
ity d
iffer
ence
mod
el
Piet
ola
& O
ude
Lans
ink
(200
1)
Finl
and
Polic
y an
alys
is
Ana
lyse
con
vers
ion
fact
ors
econ
omic
ince
ntiv
es
Bel
lman
equ
atio
n Pr
obit
mod
el
Mon
te C
arlo
sim
ulat
ion
Wyn
n et
al.
(200
1)
UK
Po
licy
anal
ysis
A
naly
sing
fact
ors t
hat i
nflu
ence
the
entry
into
Env
ironm
enta
lly S
ensi
tive
Are
a
Mul
tinom
ial l
ogit
mod
el
Dur
atio
n an
alys
is
1 VEM
M -
Veg
etat
ion
Envi
ronm
ent M
anag
emen
t Mod
el
2 SEU
M -
Subj
ectiv
e Ex
pect
ed U
tility
Max
imis
ing
Mod
el
Chapter 2
36
Lohr and Salomonsson (2000) focused on analysing the factors that determine whether a
subsidy is required to motivate organic conversion by using a utility difference model with
Swedish data. Survey data were collected by questionnaires. Several hypotheses were tested
related to factors that affect the necessity of subsidy for conversion. Results showed that
farmers requiring higher subsidies managed larger, less-diversified farms, and were more
concerned with the quality of organic inspection and of technical advice. Access to more
market outlets and information sources substituted for subsidy level in the farmers’ utility
function. From these results Lohr and Salomonsson concluded that services rather than
subsidies may be used to encourage conversion to organic agriculture.
Pietola and Oude Lansink (2001) focused on analysing the factors determining the choice
between conventional and organic farming technology in Finland and on the probability of
choice given these factors. They examined farmers’ responses to economic incentives that aim
to stimulate a switch to organic farming technology, using data on observed farmer behaviour.
A Bellman equation was used to analyse the factors determining the choice between
conventional and organic farming technology. The choice probabilities were estimated in a
closed form by an endogenous Probit-type switching model using maximum likelihood
estimation (MLE). Finally a Monte Carlo simulation was applied to simulate maximized
random return streams. The results suggested that decreasing output prices in conventional
production and increasing direct subsidies trigger the switch to organic farming. The switch is
also more likely on farms having large land areas and low yields. Intensive livestock
production and labour-intensive production have a lower probability of switching to organic
farming. The results of this study can help in designing policies that target farmers’ choice of
production technology.
Wynn et al. (2001) aimed to model the entry decisions of farmers and the speed of entry
to Environmentally Sensitive Areas (ESA) in Scotland. A multinomial logit model was used
for modelling entry decisions and a duration analysis was made to quantify the relative speed
at which the farmers joined the ESA scheme. Models were based on a survey of 490 farmers
sampled from across all ten ESAs in Scotland. The rather straightforward results indicated
that non-entrants were less aware of and less informed about the scheme than entrants.
Furthermore, the probability of entry was increased when the scheme prescription fitted the
farm situation and when the costs of compliance were low. The duration analysis suggested
several factors accelerating scheme entry: an interest in conservation, more adequate
information and more extensive systems. They concluded that the logit and duration models

Modelling conventional and organic farming; a literature review
were reasonably successful in explaining the probability and speed of entry to the scheme,
respectively.
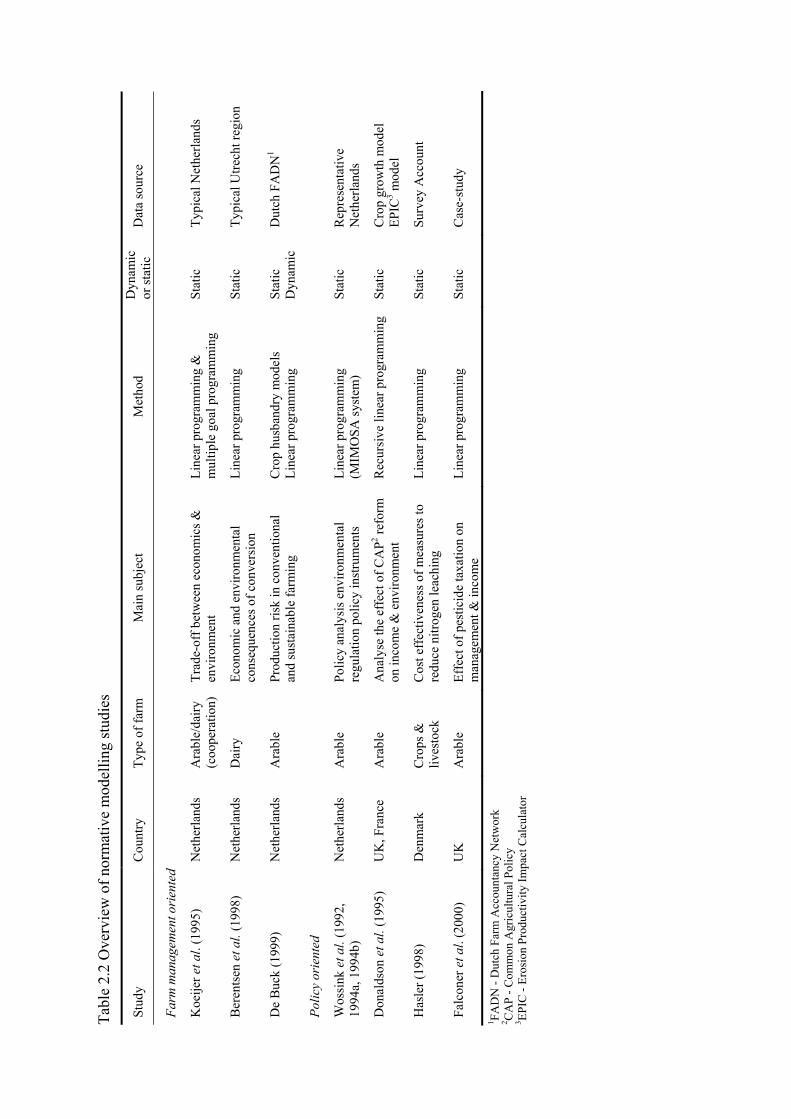
2.3.2 Normative modelling
In the reviewed studies concerning normative modelling models supporting farm management
and models supporting policy making are found (see Table 2.2).
In the first management-oriented study De Koeijer et al. (1995) examined whether mixed
farming systems offer more perspectives for an economically and environmentally sustainable
agriculture than specialized farms. They used static linear programming to analyse the effect
of an intensive co-operation between two specialized farms and also multiple goal
programming to determine the trade-off between income and environmental pollution in
several farming systems. They concluded that intensive co-operation between arable and dairy
farm offers important economic advantages.
Berentsen et al. (1998) aimed to quantify economic and environmental consequences for
intensive and extensive dairy farms typical for the province of Utrecht, the Netherlands, when
converting to organic dairy farming. For this analysis a static linear programming model was
used with the objective function of maximising labour income of the farm. From the results it
appeared that the extensive farm benefited from conversion while the intensive farm lost
income. The environmental consequences of intensive and extensive dairy farming systems
were quite different. The environmental consequences for the organic farms showed a much
lower nitrogen surplus (nitrogen fixation was left out) and a phosphate surplus that was at best
equal to that of the conventional farm. Especially on the extensive farm manure from other
farms was needed to supply nitrogen. Due to fixed ratios between phosphate and nitrogen in
manure this leads to overfertilization with phosphate.
De Buck et al. (1999) analysed the role of risk in the adoption by farmers of new systems
by means of a model that determines differences in production risks between conventional
and sustainable farming systems. The model consists of two main parts: (1) crop husbandry
models (HMs) for several husbandry activities at the crop level, and (2) an LP model at the
farm level. The HMs generate management tracks by means of decision rules, based on the
tactics in crop husbandry and weather uncertainty. Combining outcomes of the HMs, the LP
model selects optimal management tracks on an annual basis. In the LP model, tactics are re-
assessed by means of the HMs, using information of the LP solution. This iterative procedure
enables production risks of conventional and sustainable farming systems to be compared,
37
Chapter 2
considering fixed, allocatable resources for the whole farm firm. The model can be used (1) to
estimate risks of different farming systems, omitting innovations in the sector, using all
possible natural conditions as model input, (2) to objectively compare farming systems under
similar farm and management situations and (3) to evaluate new techniques on their suitability
for a farming system. This paper shows that these methods are very useful and flexible in
linking agro-ecological knowledge with farm management models. The authors concluded
that, ideally, an optimising algorithm for the HM modules, consisting of dynamic networks,
would be Dynamic Programming.
The other group of normative models is policy-oriented. In several studies Wossink et al.
(1992) and Wossink and Renkema (1994a, 1994b) used a static linear programming model
with an environmental component (nutrient loss and pesticide use) to evaluate the effects of
alternative environmental policy instruments (such as taxes, subsidies and transferable
pollution licenses), and to examine how environmental, price and market policies change
arable farming at the farm and regional level. They concluded that linear programming is a
good tool for analysing the interactions between production intensity, environmental aspects
and farm income, and for comparing the implications of different policy options at farm level.
Donaldson et al. (1995) examined the effects of Common Agricultural Policy (CAP)
price changes on income and environment on arable farms in two regions, in south-east
England and south-west France. For this policy analysis an integrated agronomic and
economic model was used. An agronomic crop growth model was used to generate yield and
pollution data. These data were incorporated into the economic recursive linear programming
model. The economic model was run from 1990/91 to 1994/95 in recursive fashion. The
results indicated that modal farms in both regions did not have lower incomes following
implementation of CAP reforms in 1992/93 as compared to the previous years. However, in
reality farms in south-east England appear to be penalised by the reforms when compared to
the ‘no reform’ situation. In the French situation, farm income was higher with CAP reform
than without. In south-east England the farms appeared to be penalized by the reforms when
compared to the ‘no reform’ situation. Donaldson et al. attributed this to the fact that crop
yields in this region were 40% higher than those used to calculate the average regional yields
(used in the calculation of area payments). In the French model, farm income was higher with
CAP reform than without as a result of the very high area payment on some of the irrigated
crops, and the much lower discrepancy between actual yields in the region and those yields
used to calculate the area payments. With CAP reforms, modelling results of reality indicated
an increased area of lower (10-30%) nitrogen-input crop production in both cases. This is
38
Modelling conventional and organic farming; a literature review
Environmental-economic farm modelling is considered a useful instrument for gaining
insights into the interactions of production management, environmental aspects and farm
income, and for comparing the implications of different policy instruments. The number of
recent scientific publications dealing with this type of modelling, however, is not really high.
This type of research is typically carried out in north-western European countries such as the
Netherlands and UK. The number of studies dealing with conversion from conventional
towards organic farming is even lower. Most of the studies deal with analysing the
consequences of farming practices or political measures.
2.4 Discussion and conclusion
Falconer and Hodge (2000) aimed to evaluate the implications of pesticide taxation on
the management practices of farmers by using a static linear programming model for a case-
study arable farm. The effects of input taxation on pesticide use and income of the farmers
were analysed. The model suggested that pesticide use could be reduced significantly while
actually increasing farm income through conversion to low-input farming. They concluded
that if producers adhere to current systems, a pesticide tax at politically acceptable levels
introduced as a stand-alone measure would perform poorly. Pesticide taxation should be part
of a package of measures including, in particular, education and training to encourage and
assist farming system change.
Hasler (1998) made an analysis of environmental policy measures aimed at reducing
nitrogen leaching at the farm level for typical Danish crop farms and livestock holdings. The
objective was to estimate the cost-effectiveness of the measures (four different levy rates on
commercial nitrogen fertilizer) in reducing nitrogen leaching. Cost-effectiveness was
expressed as costs per kg reduction in nitrogen leaching. The reductions in nitrogen leaching
levels from the measures were compared with the political target. Hasler used static linear and
non-linear programming to model the effects of levies on nitrogen leaching. The results
indicated that the imposition of levies on commercial nitrogen fertilizer would provide
incentives for reducing fertilization and for substituting of commercial nitrogen fertilizer with
livestock manure.
associated with lower rates of nitrate loss. The authors concluded that this approach, which
combines a crop growth model with an economic linear programming model, was very
suitable for identifying the effect of relative price changes resulting from the CAP reform on
farmers’ resource allocation.
39
40
Tabl
e 2.
2 O
verv
iew
of n
orm
ativ
e m
odel
ling
stud
ies
Stud
y C
ount
ry
Type
of f
arm
M
ain
subj
ect
Met
hod
Dyn
amic
or
stat
ic
Dat
a so
urce
Farm
man
agem
ent o
rien
ted
Stat
ic
Typ
Stat
ic
Rep
e
tic
Sut
Koe
ijer e
t al.
(199
5)
Net
herla
nds
Ara
ble/
dairy
(c
oope
ratio
n)
Trad
e-of
f bet
wee
n ec
onom
ics &
en
viro
nmen
t Li
near
pro
gram
min
g &
m
ultip
le g
oal p
rogr
amm
ing
ical
Net
herla
nds
Ber
ents
en e
t al.
(199
8)
Net
herla
nds
Dai
ry
Econ
omic
and
env
ironm
enta
l co
nseq
uenc
es o
f con
vers
ion
Line
ar p
rogr
amm
ing
Stat
ic
Typi
cal U
trech
t reg
ion
De
Buc
k (1
999)
N
ethe
rland
s A
rabl
e Pr
oduc
tion
risk
in c
onve
ntio
nal
and
sust
aina
ble
farm
ing
Cro
p hu
sban
dry
mod
els
Line
ar p
rogr
amm
ing
Stat
ic
Dyn
amic
D
utch
FA
DN
1
Polic
y or
ient
ed
Wos
sink
et a
l. (1
992,
19
94a,
199
4b)
Net
herla
nds
Ara
ble
Polic
y an
alys
is e
nviro
nmen
tal
regu
latio
n po
licy
inst
rum
ents
Line
ar p
rogr
amm
ing
(MIM
OSA
syst
em)
rese
ntat
ivN
ethe
rland
s
Don
alds
on e
t al.
(199
5)
UK
, Fra
nce
Ara
ble
Ana
lyse
the
effe
ct o
f CA
P2 refo
rm
on in
com
e &
env
ironm
ent
Rec
ursi
ve li
near
pro
gram
min
g St
atic
C
rop
grow
th m
odel
EP
IC3 m
odel
Has
ler (
1998
) D
enm
ark
Cro
ps &
liv
esto
ck
Cos
t eff
ectiv
enes
s of m
easu
res t
o re
duce
nitr
ogen
leac
hing
Line
ar p
rogr
amm
ing
Sta
rvey
Acc
oun
Falc
oner
et a
l. (2
000)
U
K
Ara
ble
Effe
ct o
f pes
ticid
e ta
xatio
n on
m
anag
emen
t & in
com
e Li
near
pro
gram
min
g St
atic
C
ase-
stud
y
1 FAD
N -
Dut
ch F
arm
Acc
ount
ancy
Net
wor
k 2 C
AP
- Com
mon
Agr
icul
tura
l Pol
icy
3 EPIC
- Er
osio
n Pr
oduc
tivity
Impa
ct C
alcu
lato
r
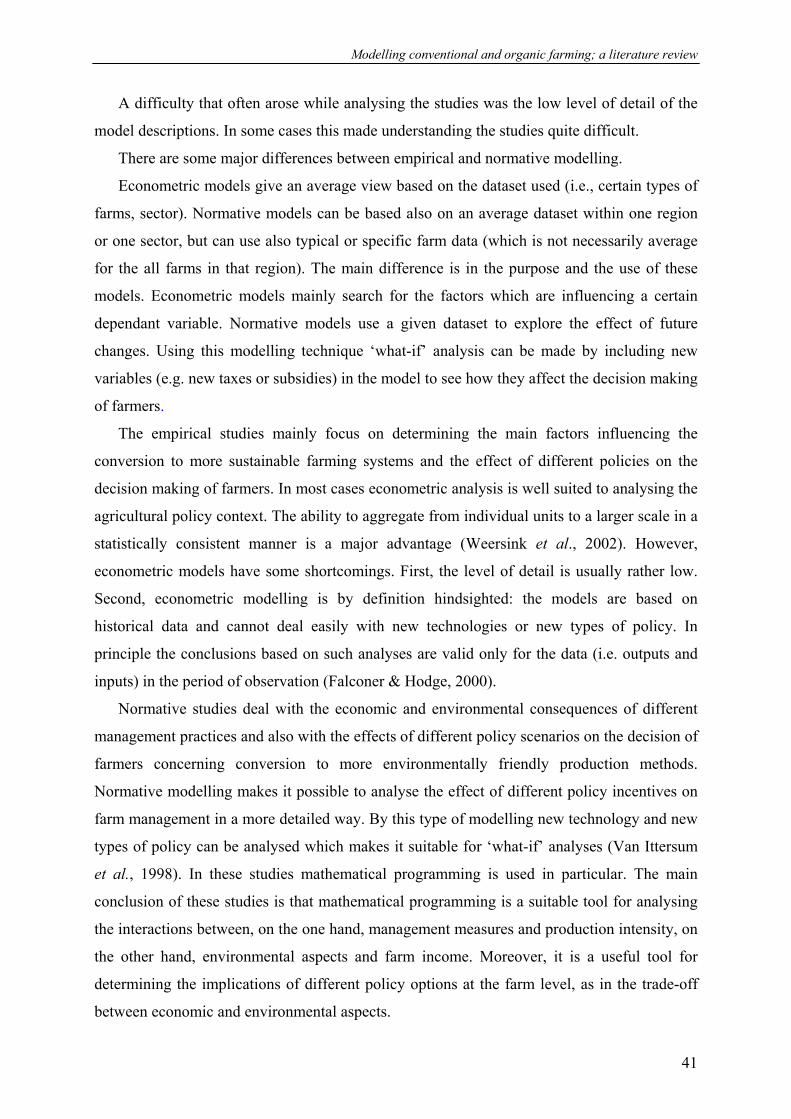
Modelling conventional and organic farming; a literature review
A difficulty that often arose while analysing the studies was the low level of detail of the
model descriptions. In some cases this made understanding the studies quite difficult.
There are some major differences between empirical and normative modelling.
Econometric models give an average view based on the dataset used (i.e., certain types of
farms, sector). Normative models can be based also on an average dataset within one region
or one sector, but can use also typical or specific farm data (which is not necessarily average
for the all farms in that region). The main difference is in the purpose and the use of these
models. Econometric models mainly search for the factors which are influencing a certain
dependant variable. Normative models use a given dataset to explore the effect of future
changes. Using this modelling technique ‘what-if’ analysis can be made by including new
variables (e.g. new taxes or subsidies) in the model to see how they affect the decision making
of farmers.
The empirical studies mainly focus on determining the main factors influencing the
conversion to more sustainable farming systems and the effect of different policies on the
decision making of farmers. In most cases econometric analysis is well suited to analysing the
agricultural policy context. The ability to aggregate from individual units to a larger scale in a
statistically consistent manner is a major advantage (Weersink et al., 2002). However,
econometric models have some shortcomings. First, the level of detail is usually rather low.
Second, econometric modelling is by definition hindsighted: the models are based on
historical data and cannot deal easily with new technologies or new types of policy. In
principle the conclusions based on such analyses are valid only for the data (i.e. outputs and
inputs) in the period of observation (Falconer & Hodge, 2000).
Normative studies deal with the economic and environmental consequences of different
management practices and also with the effects of different policy scenarios on the decision of
farmers concerning conversion to more environmentally friendly production methods.
Normative modelling makes it possible to analyse the effect of different policy incentives on
farm management in a more detailed way. By this type of modelling new technology and new
types of policy can be analysed which makes it suitable for ‘what-if’ analyses (Van Ittersum
et al., 1998). In these studies mathematical programming is used in particular. The main
conclusion of these studies is that mathematical programming is a suitable tool for analysing
the interactions between, on the one hand, management measures and production intensity, on
the other hand, environmental aspects and farm income. Moreover, it is a useful tool for
determining the implications of different policy options at the farm level, as in the trade-off
between economic and environmental aspects.
41

Chapter 2
The majority of the normative studies did not include time in the model. For modelling
conversion of farms from conventional to organic farming systems the inclusion of time is
however important. There are two main reasons for inclusion of the time aspect. One reason is
that there is a possibility for farmers to switch stepwise (in case of crop farming), which gives
them more time to learn the new production method. It also ensures income through still
allowing production of conventional products next to the in-conversion products (which still
sell for conventional prices but must be produced organically) during the conversion period.
By modelling over time it is possible to see in which year what area of certain crops would be
the best to produce (i.e. from an economic or/and environmental point of view) in an organic
way and how it would develop over the years. The other reason is that there is the possibility
of analysing the effect of different policy incentives before, during and after the conversion
period. In a dynamic model these instruments can be included (e.g. different amounts of taxes
or subsidies in a certain year of the conversion). In accordance with Sparkers et al. (2003) it
can be stated that for this reason dynamic linear programming is very suitable for modelling
the conversion period of farms. The requirement of economic and environmental objectives
can be covered by the use of multiple objectives in a linear programming model (Zander &
Kächele, 1999; Ten Berge, 2000; Kropff et al., 2001).
From the analysis it appears that farmers also include considerations other than strictly
economic ones in the decision whether or not to convert. Especially, behavioural aspects, like,
the risk attitude and risk perception of farmers are important to mention. These aspects could
be included in a linear programming model using quadratic risk programming or dynamic
stochastic programming methods (Hardaker et al., 2004).
42
Modelling conventional and organic farming; a literature review
References
Anonymous, 1991. Council Regulation (EEC) No 2092/91. CONSLEG, 1991R2092-
01/05/2004. Office for Official Publications of the European Communities, Brussels,
94 p.
Anonymous, 1992. State of Application of Regulation (EEC) No. 2078/92. Evaluation of
Agri-Environment Programmes. European Commission DG VI.
<http://europa.eu.int/comm/agriculture/envir/programs/evalrep/text_en.pdf> Accessed
12 December 2004.
Anonymous, 1999. Council Regulation (EC) No 1804/1999. Official Journal of European
Communities L 222, 24/08/1999 p. 01-28.
Anonymous, 2002. IFOAM Basic Standards for Organic Production and Processing.
International Federation of Organic Agriculture Movements (IFOAM), Victoria,
Canada, 68 p.
<http://www.ifoam.org/standard/norms/ibs.pdf> Accessed 12 December 2004.
Anonymous, 2003. The organic Market in Switzerland and the European Union (2nd edition).
Swiss Import Promotion Programme (SIPPO) and Research Institute of Organic
Agriculture (FIBL), Zürich/Frick, 132 p.
Anonymous, 2004. Database of organic standards in the EU. CAB International.
<http://www.organic-research.com/LawsRegs/db/db_intro.asp>
Accessed 10 December 2004.
Baum, K.H. and L.P. Schertz, 1983. Modeling Farm Decisions for Policy Analysis.
Westview Press, Boulder, Colorado, 418 p.
Berentsen, P.B.M., G.W.J. Giesen and M.M.F.H. Schneiders, 1998. Conversion from
conventional to biological dairy farming: Economic and environmental consequences
at farm level. Biological Agriculture and Horticulture 16, p. 311–328.
Cooper, J.C., 1997. Combining actual and contingent behaviour data to model farmer
adoption of water quality protection practices. Journal of Agricultural and Resource
Economics 22, p. 30–43.
De Buck, A.J., E. M. T. Hendrix and H. B. Schoorlemmer, 1999. Analysing production and
environmental risks in arable farming systems: A mathematical approach. European
Journal of Operational Research 119, (2), p. 416-426.
De Koeijer, T.J., L.A. Renkema and J.J.M Van Mensvoort, 1995. Environmental-economic
analysis of mixed crop-livestock farming. Agricultural Systems 48, p. 515–530.
43
Chapter 2
Donaldson, A.B., G. Flichman and J.P.G. Webster, 1995. Integrating agronomic and
economic models for policy analysis at the farm level: the impact of CAP reform in
two European regions. Agricultural Systems 48, p. 163–178.
Falconer, K., 1998. Managing diffuse environmental contamination from agricultural
pesticides: an economic perspective on issues and policy options, with particular
reference to Europe. Agriculture Ecosystems and Environment 69. p. 37–54.
Falconer, K. & I. Hodge, 2000. Using economic incentives for pesticide usage reductions:
responsiveness to input taxation and agricultural systems. Agricultural Systems 63, p.
175–194.
Foster, C. and N. Lampkin, 2000. European Organic Production Statistics 1993–1998. EU-
Project FAIR3-CT96-1794: Organic Farming and the CAP. University of Hohenheim,
Stuttgart, 66 p.
Hardaker, J.B., R.B.M. Huirne, J.R. Anderson and G. Lien, 2004. Coping with risk in
Agriculture. Second edition. CABI Publishing, Oxfordshire, 332 p.
Hasler, B., 1998. Analysis or environmental policy measures aimed at reducing nitrogen
leaching at the farm level. Environmental Pollution 102, S1, p. 749–754.
Hazell, P.B.R. and R.D. Norton, 1986. Mathematical Programming for Economic Analysis in
Agriculture. MacMillan, New York, 400 p.
Hau, P. and A. Joaris, 1999. Organic Farming. Agriculture and Environment. The European
Commission
<http://europa.eu.int/comm/agriculture/envir/report/en/organ_en/report_en.htm>
Accessed 20 November 2004.
Häring, A.M. and S. Dabbert, 2004. Organic farming and measures of European agricultural
policy. Organic Farming in Europe: Economics and Policy, Vol. 11, University of
Hohenheim, Stuttgart, 243 p.
Klein, K.K. and S. Narayanan, 1992. Farm level models: A review of developments, concepts
and applications in Canada. Canadian Journal of Agricultural Economics 40, p. 351–
368.
Kropff, M.J., J. Bouma, J.W. Jones, 2001. Systems approaches for the design of sustainable
agro-ecosystems. Agricultural Systems 70, p. 367-393.
Lampkin, N., 1990. Organic Farming. Farming Press, Ipswich, 701 p.
Lampkin, N.H. and S. Padel, 1994. The economics of organic farming: an international
perspective. CAB International, Wallingford, 454 pp.
44
Modelling conventional and organic farming; a literature review
Lampkin, N., C. Foster and S. Padel, 1999a. The policy and regulatory environment for
organic farming in Europe: country reports. Organic Farming in Europe: Economics
and Policy, Vol. 2., University of Hohenheim, Stuttgart, 428 p.
Lampkin, N., C. Foster, S. Padel and P. Midmore, 1999b. The policy and regulatory
environment for organic farming in Europe: country reports. Organic Farming in
Europe: Economics and Policy, Vol. 1., University of Hohenheim, Stuttgart, 166 p.
Lee, J.E., 1983. A perspective on the evaluation and status of micromodeling in agricultural
economics. In: K.H. Baum & L.P. Schertz (Eds), Modeling Farm Decisions for Policy
Analysis. Westview Press, Boulder, Colorado, p.1-9.
Le Guillou, G. and A. Scharpé, 2001. Organic Farming: Guide to Community Rules.
European Commission, Luxembourg, 28 p.
Lohr, L. and L. Salomonsson, 2000. Conversion subsidies for organic production: results from
Sweden and lesson for the United States. Agricultural Economics 22, p. 133–146.
Mannion, A.M., 1995. Agriculture and Environmental Change: Temporal and Spatial
Dimensions. Wiley, Chichester, 405 p.
Melita, F., 2001. Organic Farming in the Netherlands – Country Reports.
<http://www.organic-europe.net/country_reports/netherlands/default.asp> Accessed
25 November 2004.
Michelsen, J., 2001. Recent development and political acceptance of organic farming in
Europe. Sociologia Ruralis 4, p. 3–20.
Michelsen, J., K. Lynggaard, S. Padel and C. Foster, 2001. Organic farming development and
agriculture institutions in Europe: A study of six countries. Organic Farming in
Europe: Economics and Policy, Vol. 9., University of Hohenheim, Stuttgart, 179 p.
Oglethorpe, D.R. and R.A. Sanderson, 1999. An ecological-economic model for agri-
environmental policy analysis. Ecological Economics 28, p. 245–66.
Oskam, A.J., R.A.N. Vijftigschild, C. Graveland, Y.K. Dam, J. Van Frouw and M.D.C.
Proost, 1998. Additional EU Policy Instruments for Plant Protection Products.
Wageningen Pers, Wageningen, 297 p.
Pietola, K. S. & A. Oude., Lansink, 2001. Farmer response to policies promoting organic
farming technologies in Finland. European Review of Agricultural Economics 28, p.
1–15.
Pindyck, R.S. and D.L. Rubinfeld, 1998. Econometric Models and Economic Forecasts (4th
edition). McGraw-Hill, New York, 625 pp.
45
Chapter 2
Scofield, A., 1986. Organic farming – the origin of the name. Biological Agriculture and
Horticulture 4, p. 1–5.
Sparkers D.L., P. Wilson and S.K. Huxham. 2003. Organic conversion strategies for stockless
farming. University of Nottingham, HGCA Project report No. 307, 49 p.
Ten Berge, H.F.M., M.K. Van Ittersum, W.A.H. Rossing, G.W.J. Van De Ven, J. Schans and
P.A.C.M. Van De Sanden, 2000. Farming options for the Netherlands explored by
multi-objective modelling. European Journal of Agronomy 13, p. 263–277.
Van Ittersum, M.K., Rabbinge, R. and Van Latesteijn, H.C., 1998. Exploratory land use
studies and their role in strategic policy making. Agricultural Systems 58, p. 309-330.
Wallace, M.T. and J.E. Moss, 2002. Farmer decision-making with conflicting goals: a
recursive strategic programming analysis. Journal of Agricultural Economics 53, p.
82–100.
Weersink, A., S. Jeffrey and D. Pannell, 2002. Farm-level modeling for bigger issues. Review
of Agricultural Economics 24, p. 123–140.
Wossink, G.A.A. and J.A. Renkema, 1994a. Farm economic modelling of integrated plant
production. In: P.C. Struik, W.J. Vredenburg & J.A. Renkema (Eds), Plant Production
on the Threshold of a New Century. Proceedings of the International Conference at the
Occasion of the 75th Anniversary of the Wageningen Agricultural University,
Wageningen, the Netherlands. Wageningen, 28 June – 1 July, 1993. Kluwer,
Dordrecht, p. 23–36.
Wossink, G.A.A. and J.A. Renkema, 1994b. Analysis of future change in Dutch arable
farming: A farm economics approach. European Review of Agricultural Economics
21, p. 95–112.
Wossink, G.A.A., T.J. De Koeijer and J.A. Renkema, 1992. Environmental-economic policy
assessment: Farm Economic Approach. Agricultural Systems 39, p. 421–438.
Wynn, G., B. Crabtree and J. Potts, 2001. Modelling farmer entry into the Environmentally
Sensitive Area Schemes in Scotland. Journal of Agricultural Economics 52, p. 65–82.
Yussefi, M. and H. Willer, 2002. Organic Agriculture Worldwide 2002: Statistics and Future
Prospects. SÖL (Foundation of Ecology and Agriculture), Bad Dürkheim, 157 p.
Zander, P. and H. Kächele, 1999. Modelling multiple objectives of land use for sustainable
development. Agricultural Systems 59, p. 311–235.
46
47
Chapter 3
Comparison of conventional and organic arable farming systems in the Netherlands by means of bio-economic modelling
S. Acs1, P.B.M. Berentsen1, M. de Wolf 2 and R.B.M. Huirne1,3
1 Business Economics, Department of Social Sciences, Wageningen University, Wageningen
2 Applied Plant Research, Lelystad 3 Animal Sciences Group, Lelystad
Accepted for publication in Biological Agriculture and Horticulture

Chapter 3
Abstract
Growing environmental concern in society combined with policy stimuli has encouraged
farmers to switch from conventional to organic production technologies. However, so far not
many have made this switch. This raises the question, what could lie behind the decisions of
farmers concerning conversion. A first step in studying this decision is to compare farming
results in an organic situation with conventional farm results from technical, economic and
environmental point of view. In this paper a linear programming model of a conventional
arable farm and an organic arable farm are presented. The models include environmental
externalities such as losses of nutrients and pesticide use, the levels of which can be
influenced by using different production structures (cropping plans). With the conventional
model two different crop rotations (3-year and 4-year), and with the organic model one
rotation (6-year) are analysed and the results of these three situations are compared. The
example farm modelled is typical for the central clay region in The Netherlands. The results
show that organic farming leads to less intensive land use, better environmental results and
better economic results. Expenditure on hired labour is much higher in organic farming
which also leads to higher variable costs. Prices for organic products are higher than for
similar conventional products, but lower yields and the less intensive cropping plan mitigates
the effects on total revenues.
48
Comparison of conventional and organic arable farming systems by means of bio-economic modelling
3.1 Introduction
Organic farming is recognized in the European Union as one possible way to improve the
sustainability of agriculture (Häring et al., 2001; Rigby & Cáceres, 2001; Padel et al., 2002).
Growing environmental concern in society combined with policy stimuli and economic
prospects has encouraged farmers to switch from conventional to organic production
technologies.
During the 1990s the organic sector in the European Union grew rapidly to 3% of
agricultural area in 2000, caused in part by policy support measures in member states and the
EU (Padel et al., 2002). In the Netherlands, as in many European countries, an action plan
was developed to promote organic agriculture. As part of this action plan, marketing of
organic products, advisory services and consumer information is supported (Yussefi & Willer,
2002). In 2000, the Dutch government set an ambitious target that by 2005 5% and by 2010
10% of the total agricultural area is to be organically managed (Melita, 2001). However in
2002 this figure was only about 2.19% (Willer & Yusselfi, 2004). The conversion from
conventional to organic farming systems is progressing more slowly than the Government
expected.
There are several factors that can influence the willingness of farmers to convert, such
as economic and non-economic factors. Economic factors are crucial for farmers who want to
stay in business. So an important question is whether organic farming performs better from an
economic point of view than conventional farming, that is, within the stricter environmental
constraints.
Many studies have dealt with the comparison, based on empirical results, of these two
farming systems (Lampkin & Padel, 1994). Selection of the groups in such research has a
strong influence on the results. The problem in these studies is that farms are compared that
have different size, location and soil type. This does not give sufficient information about
what happen if a particular farmer decides to convert.
In this paper, the two farming systems are compared by using a normalized situation
(same area, soil type, climate, etc.). The objective of this paper is to make the comparison by
use of a linear programming model. The model was applied to an example farm in the central
clay region of the Netherlands. This farm can be considered a representative arable farm for
this major arable region. The setup of these two models is presented and the technical,
economic and environmental results are compared.
49
Chapter 3
50
3.2 Model specification and data used for conventional and organic arable farms
3.2.1. General structure
The general structure of the conventional and organic arable farm models is shown in Table
3.1 and has the mathematical form of the standard linear programming model (Hazell &
Norton, 1986):
Maximise {Z = c’x}
Subject to Ax ≤ b
and x ≥ 0
where:
x = vector of activities
c = vector of gross margins or costs per unit of activity
A = matrix of technical coefficients
b = vector of right hand side values
The groups of activities are shown at the top of the Table 3.1 under eight headings: production
activities representing different crops, seasonal labour, purchase of fertilizer and manure,
activities for calculating nutrient surplus, organic matter input and pesticide use.
The rows of the matrix indicate the type and form of the constraints included: land
availability, rotation restrictions, supply and demand of fixed and of seasonal labour, nutrient
balance calculation for MINAS (Dutch Mineral Accounting System) regulation, maximum
manure input restriction for MTAS (Manure Transfer Agreement System) regulation, several
counting rows for pesticide use and organic matter input to the farm.
The main difference between the two models is that purchase of fertilizer and pesticide
concerns only conventional production. Purchase of pesticides is included in the activity ‘crop
production for sale’. In the case of organic farming the fertilizing constraint includes only
manure in addition to N-fixation by certain crops. More detailed differences between
activities and constraints of the two models will be explained in the next section
.
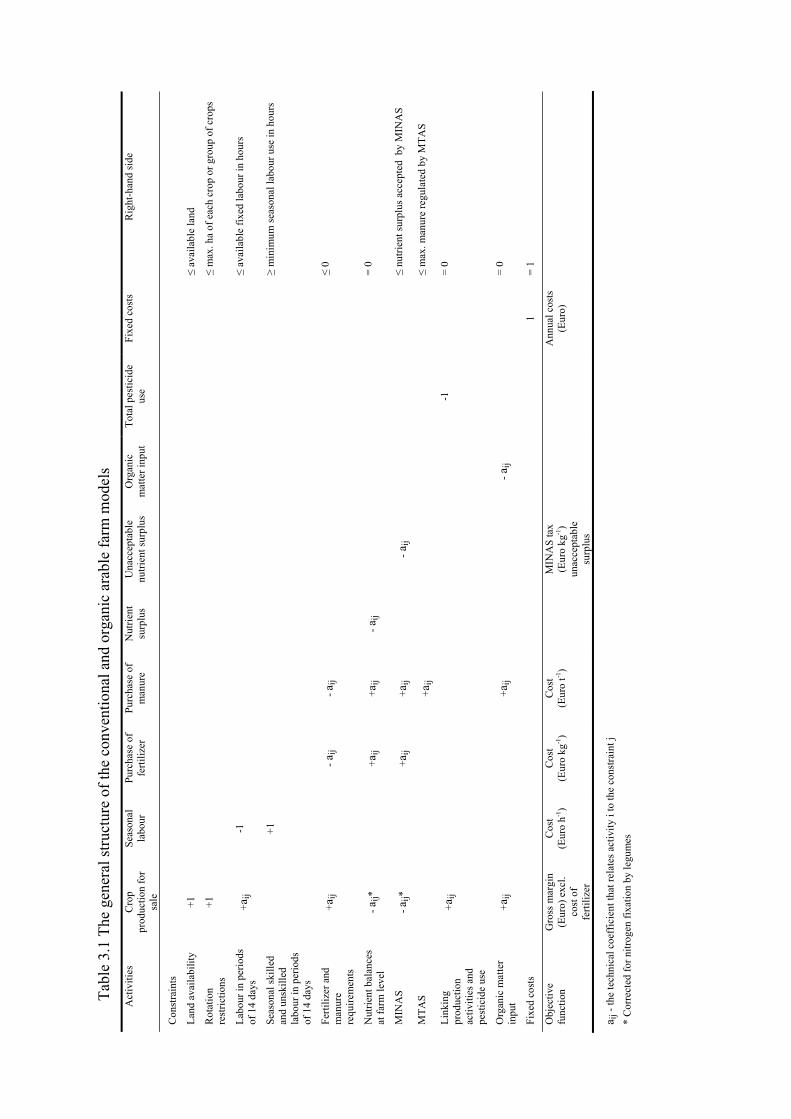
51
Act
iviti
es
Cro
p
Tabl
e 3.
1 Th
e ge
nera
l stru
ctur
e of
the
conv
entio
nal a
nd o
rgan
ic a
rabl
e fa
rm m
odel
s
prod
uctio
n fo
r sa
le
Seas
onal
la
bour
Pu
rcha
se o
f fe
rtiliz
er
Purc
hase
of
man
ure
Nut
rient
su
rplu
s U
nacc
epta
ble
nutri
ent s
urpl
us
Org
anic
m
atte
r inp
ut
Tota
l pes
ticid
e us
e Fi
xed
cost
s R
ight
-han
d si
de
Con
str
ai
nts
avai
labi
lity
+1
+1
+1
=
0
MTA
S
=
=
0
M
IN
Land
≤ av
aila
ble
land
Rot
atio
n re
stric
tions
≤ m
ax. h
a of
eac
h cr
op o
r gro
up o
f cro
ps
Labo
ur in
per
iods
of
14
days
+ aij
-1
≤
avai
labl
e fix
ed la
bour
in h
ours
Seas
onal
skill
ed
and
unsk
illed
la
bour
in p
erio
ds
of 1
4 da
ys
≥ m
inim
um se
ason
al la
bour
use
in h
ours
Ferti
lizer
and
m
anur
e re
quire
men
ts
+aij
- a
ij- a
ij
≤ 0
Nut
rient
bal
ance
s at
farm
leve
l
- aij*
+aij
+aij
- aij
MIN
AS
- aij*
+aij
+aij
- a
ij
≤
nutri
ent s
urpl
us a
ccep
ted
by
MIN
AS
+ aij
≤ m
ax. m
anur
e re
gula
ted
by M
TAS
Link
ing
prod
uctio
n ac
tiviti
es a
nd
pest
icid
e us
e
+aij
-10
Org
anic
mat
ter
inpu
t +a
ij
+a
ij
- a
ij
Fixe
d co
sts
1
= 1
Obj
ectiv
e fu
nctio
n G
ross
mar
gin
(Eur
o) e
xcl.
cost
of
ferti
lizer
Cos
t (E
uro
h-1)
Cos
t (E
uro
kg-1
) C
ost
(Eur
o t-1
) A
S ta
x(E
uro
kg
-1
) un
acce
ptab
le
surp
lus
Ann
ual c
osts
(E
uro)
a ij -
the
tech
nica
l coe
ffic
ient
that
rela
tes a
ctiv
ity i
to th
e co
nstra
int j
*
Cor
rect
ed fo
r nitr
ogen
fixa
tion
by le
gum
es

Chapter 3
52
The objective function of the LP model is to maximize the gross margin, i.e. total
returns from crops sold minus variable costs, including fertilizer, pesticides, variable
operations, seasonal labour and MINAS tax on unacceptable surplus. The fixed costs based on
the costs of a farm with average land area and typical cropping plan for the region, are
calculated separately from the LP model. The output of the model includes the corresponding
optimal production plan, labour use, manure and fertilizer purchase, pesticide use and
environmental effects of both farming systems.
To get the optimal solution for the LP model, CPLEX solver was used in GAMS
(General Algebraic Modelling System) programming language. It should be noted that the
LP-model is very flexible and can be easily adjusted (objective function, constraints,
coefficients) to reflect any other region or situation.
3.2.2. Land
The farm analysed is typical for the central clay region, which is one of the major arable
farming areas in the Netherlands. In this region after the land had been reclaimed from the
sea, farm size ranged from 12 to 48 ha. Nowadays, 48 ha farms characterize the region. The
available total land area for production per farm is a limiting resource factor for the farmers.
In our analysis, the size and soil type of the example farm is therefore 48 ha and clay soil,
respectively.
3.2.3. Crop activities
There are several crops which can be grown on the example farm in this area. Typical crops in
the region selected for the conventional model include winter wheat, spring barley, seed and
ware potato, sugar beet, seed onion and carrot. The organic model includes besides these
crops, which are grown in an organic way, the following crops: spring wheat, winter barley,
kidney bean, green pea, alfalfa, celeriac and grass-clover. In order to both maintain the
organic matter content of the soil and fix nitrogen available after the main crop, green manure
is also part of the rotation. Therefore, after cereals winter radish is grown in the conventional
farm situation and clover in the organic situation. In the organic case also grass is used as
green manure after kidney bean, sugar beet and seed potato.
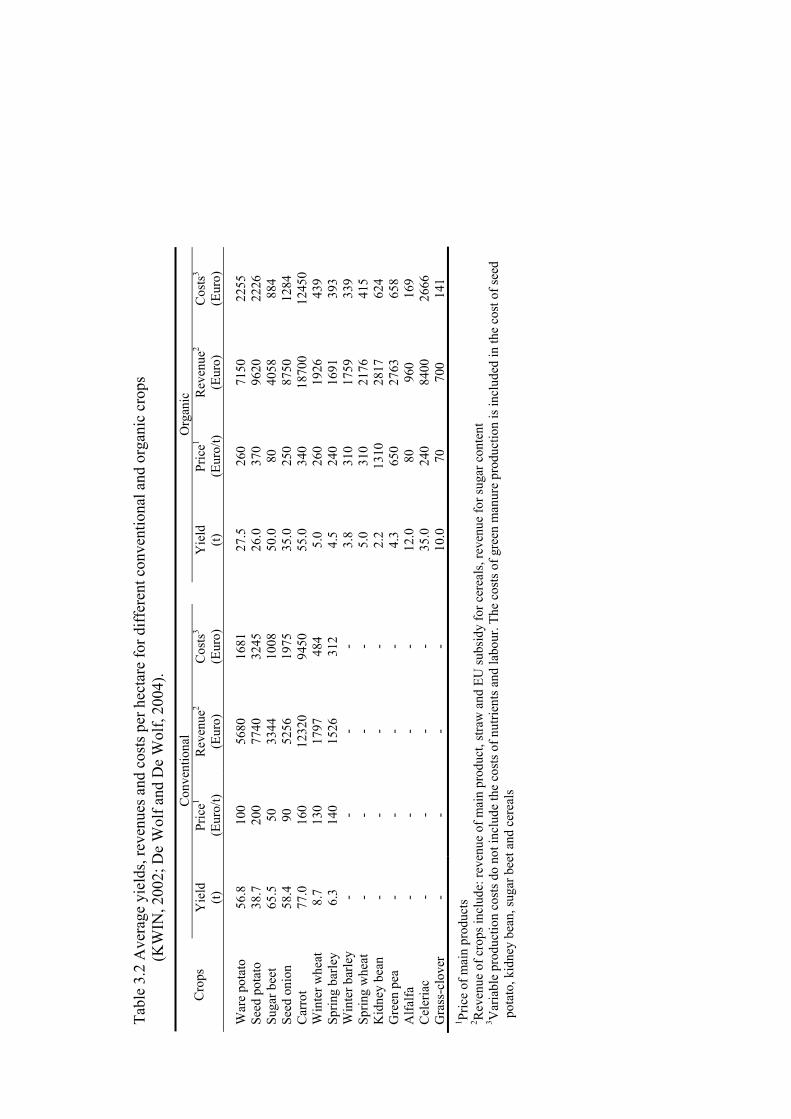
53
c
Tabl
e 3.
2 A
vera
ge y
ield
s, re
venu
es a
nd c
osts
per
hec
tare
for d
iffer
ent c
onve
ntio
nal a
nd o
rgan
ic c
rops
(KW
IN, 2
002;
De
Wol
f and
De
Wol
f, 20
04).
Con
vent
iona
l
Org
ani
Cro
ps
Yie
ld
(t)
Pric
e1
(Eur
o/t)
Rev
enue
2
(Eur
o)
Cos
ts3
(Eur
o)
Y
ield
(t)
Pr
ice1
(Eur
o/t)
Rev
enue
2
(Eur
o)
Cos
ts3
(Eur
o)
War
e po
tato
56
.8
0 56
.5
0
71
.7
0 77
.0
0
96
.5
50
33
.0
80
40
4
.0
0 12
20
.0
0 18
00
50
7
0 17
4
0
0 19
9
3
0 15
2
5
0 16
3
- -
- .0
80
0
9 C
eler
iac
- -
- -
.0
0
- -
-
.0
70
0 1
1080
1681
2726
5022
55Se
ed p
otat
o
3820
4032
4526
3720
2226
Suga
rbee
t65
4410
0850
5888
Seed
oni
on
58
.4
90
5256
19
75
35
.0
250
8750
12
84
Car
rot
7716
394
5055
347
124
Win
ter w
heat
8.13
9748
5.26
2643
Sprin
g ba
rley
6.14
2631
4.24
9139
Win
ter b
arle
y -
- -
-
3.8
310
1759
33
9 Sp
ring
whe
at
- -
- -
5.
0 31
0 21
76
415
Kid
ney
bean
-
- -
-
2.2
1310
28
17
624
Gre
en p
ea
- -
- -
4.
3 65
0 27
63
658
Alfa
lfa
-
1296
1635
2484
0026
66G
rass
-clo
ver
- 10
7014
1 Pric
e of
mai
n pr
oduc
ts
2 Rev
enue
of c
rops
incl
ude:
reve
nue
of m
ain
prod
uct,
stra
w a
nd E
U su
bsid
y fo
r cer
eals
, rev
enue
for s
ugar
con
tent
3 V
aria
ble
prod
uctio
n co
sts d
o no
t inc
lude
the
cost
s of n
utrie
nts a
nd la
bour
. The
cos
ts o
f gre
en m
anur
e pr
oduc
tion
is in
clud
ed in
the
cost
of s
eed
p
otat
o, k
idne
y be
an, s
ugar
bee
t and
cer
eals
Chapter 3
The input data concerning costs and revenues, crop yield, nutrient and pesticide use
per crop on central clay soil for conventional crops were based on the Quantitative
Information Handbook (KWIN, 2002). For organic crops these data were obtained partly from
KWIN (2002) and partly from Applied Plant Research (PPO) (De Wolf and De Wolf, 2004).
The data are ‘normalized’ values for an average 48-ha farm. The nutrient content of crops was
obtained from Anonymous (1996).
Yields, revenues and costs for different conventional and organic crops are shown in
Table 3.2. The first group of crops can be produced in a conventional and in an organic way,
respectively. The second group of crops can be produced organically only. The revenues of
the crops are calculated by multiplication of crop prices and yield per crop. The costs of crop
production include costs of seeds and pot plants, pesticides, in the conventional case, and
energy use, costs of contract work and other costs such as interest, insurance and N-mineral
sampling.
3.2.4. Rotation requirements
Most of the conventional farmers in this region use 3-year or 4-year crop rotation on their
land. Other crop rotations, i.e. 5-year or 6-year, also can be found but they are not typical for
the region. The conventional LP model was set to choose between 3-year and 4-year crop
rotation situations. For the organic model 6-year crop rotation was chosen, which
characterises the organic farms in this area.
The design of a diverse crop rotation is the key to crop nutrition, weed, pest and
disease control (Stockdale et al., 2001). For agronomic reasons rotation restrictions were set
for both individual crops and for groups of crops. Rotation constraints of conventional and
organic individual crops can be seen in Table 3.3 (Loon et al., 1993; Bus et al., 1996, Visser
& Zwanepol, 1993; Schoneveld & Zwanepol, 1991; Westerdijk & Zwanepol, 1994). Rotation
constraints concerning organic farming are stricter than those for conventional farming.
Concerning conventional groups of crops: root crops were restricted to 75% of the
cultivated area (Darwinkel, 1997; Timmer, 1999). For the groups of organic crops: root crops
(ware and seed potato, sugar beet, seed onion, carrot and celeriac) and mow crops (cereals,
kidney bean, green pea, alfalfa and grass-clover) can be cultivated separately on half of the
area. Green legumes (green pea and alfalfa) and dry legumes (kidney bean) are set to the
maximum of 4-year and 6-year of the cultivated area, respectively (Wijnands & Dekking,
2002a).
54
Comparison of conventional and organic arable farming systems by means of bio-economic modelling
Table 3.3 Rotation constraints of individual conventional and organic crops in % of the land area used
Crops Conventional Organic
Ware potato 33.3 16.7 Seed potato 33.3 16.7 Sugar beet 25.0 25.0 Seed onion 20.0 16.7 Carrot 20.0 16.7 Winter wheat 100.0 50.0 Spring barley 100.0 50.0 Winter barley - 50.0 Spring wheat - 50.0 Kidney bean - 16.7 Green pea - 16.7 Alfalfa - 33.3 Celeriac - 16.7 Grass-clover - 100.0
While designing crop rotation it is important to take into account the effect of crops on
the yields of the subsequent crops in the rotation, especially in organic farming (Lampkin &
Padel, 1994). These effects are implicitly included in the model as the data follow from an
average crop sequence. Due to lack of data individual crop effects could not be included in the
model.
3.2.5. Labour
Most field operations on crops (land preparation, planting/sowing, crop care, hand weeding
and harvesting) have to be performed during a particular period of the year. Therefore, the
year is divided into periods of 2 weeks. The amount of available family labour is assumed to
be 1.1 full-time labour unit or 2255 h year-1 (De Wolf & De Wolf, 2004), which is an average
family labour supply in this region for a 48 ha land area. The supply of family labour per
period is assumed to be constant over the year. However, in peak periods the model can use a
maximum of 158 h fortnight-1 by assuming that one labour unit works12 h day-1 (72 h week-1)
excluding Sunday.
Apart from family labour there is the option of hiring seasonal labour. It is assumed
that the supply of hired labour is not restricted by the total regional supply. Seasonal labour
can be employed any time of the year for 9 Euro h-1 and 18 Euro h-1 for unskilled
(youth/students) and skilled labour, respectively (CAO, 2002). For some field operations for
55
Chapter 3
both farming systems, compulsory skilled or unskilled labour is needed, due to the fact that
some farming activities require a minimum of two or more persons working at the same time.
In that case, there is a minimum constraint for using hired labour for certain periods of each
cropping activity. Information about the requirement per crop for skilled and unskilled labour
and labour wages was gathered from Applied Plant Research (PPO) (De Wolf & De Wolf,
2004).
The requirements for general work were derived from Schoorlemmer & Krikke
(1997). They give a standard of 400 h farm-1 year-1, plus 10 h ha-1 for arable farms and 15 h
ha-1 for vegetable farms. Organic farms are considered to have a similar need for general work
as vegetable farms, according to the high amount of labour used and number of crops grown
on the farm (De Wolf & De Wolf, 2004). General work can be done whenever there is a
surplus of labour.
3.2.6. Nutrient requirement and supply
Data for the nutrient requirements of the conventional cropping (nitrogen (N), phosphate
(P2O5) and potassium (K2O)) were taken from Van Dijk (2003). In the case of organic crops,
phosphate and potassium requirements were calculated by the balance method: requirement =
removal by products + safety margin – deposition. For phosphate, 20 kg ha-1, and for
potassium, 40 kg ha-1, safety margin is used (De Wolf & De Wolf, 2004).
For nutrient supply, besides fertilizer purchase, various types of manure can be used:
cattle, pig and poultry manure in the conventional situations and, in addition, cattle stable
manure in the organic situation. In the organic farming all manure types have to satisfy the
requirement that manure be produced organically, which in the model is associated with
higher manure price. Certain types of mineral fertilizers are also permitted to use in organic
farming (Skal, 2006). However, due to low applicability of these fertilizers in practice in the
Netherlands (KWIN, 2002), this option is not included in the model. N-fixation can bring in
nitrogen by cultivating kidney bean, green pea, alfalfa and grass clover. With the use of
various manure types the model can optimize the NPK-supply. The price of manure for the
conventional farm is assumed to be zero according to the current market situation and the
price of fertilizer is 0.55 Euro kg-1 N, 0.52 Euro kg-1 P2O5 and 0.31 Euro kg-1 K2O. For
manure of organic origin the price is 9.08 Euro t-1 of manure (KWIN, 2002). Spreading of
manure assumed to be done by contract workers. The cost of it for both farms is 4.54 Euro t-1
(KWIN, 2002).
56

Comparison of conventional and organic arable farming systems by means of bio-economic modelling
The nutrient content of each type of manure was gathered from PPO and the effective
nitrogen content was calculated by use of the working coefficient for nitrogen in manure (Van
Dijk, 2003). For sugar beet and seed onion in organic farming, the manure should be supplied
in autumn in order to have a good start for the crops at the beginning of the season. This
means that the working coefficient for nitrogen from manure will be lower.
3.2.7. Environmental policy
In the Netherlands, environmental regulation has existed for a number of years. The relevant
regulations for arable farming are Dutch Mineral Accounting System (MINAS) and Manure
Transfer Agreement System (MTAS) regulations. MINAS focuses on the restriction of
nutrient surpluses within the farm, specifically nitrogen and phosphate, and states an
acceptable level of surplus at the hectare level (100 kg N and 25 kg P2O5 in year 2002). The
total acceptable surplus at farm level is subtracted from the actual total surplus which leaves
the unacceptable surplus. The farmer has to pay a levy in Euro kg-1 of unacceptable surplus,
which is 2.3 Euro kg-1 in the case of nitrogen and 9 Euro kg-1 in the case of phosphate
(MANMF, 2004). MTAS sets a limit to the amount of manure that can be used on the farm.
This limit is based on N content and is 170 kg N from manure per ha.
The models include a number of rows that register the losses of nitrogen, phosphate
and potassium to the environment. Real nutrient balances at farm level calculate the total
amount of nutrient input and output, and consequently, total nutrient losses. Input comes from
seeds, fertilizer, in the conventional case, manure and N-fixation. Output is the amount of
nutrient content in the crop, which leaves the farm.
In the case of MINAS the input and output calculation is different from the real
nutrient balance calculation. In MINAS N-fixation and the nutrient output by crops are based
on standards. N-fixation for kidney beans amounts to 30 kg ha-1, for green pea 50 kg ha-1, for
alfalfa 160 kg h-1 and for grass-clover no nitrogen fixation is calculated. For nutrient output
MINAS uses a standard of 165 kg ha-1 for N and 65 kg ha-1 for P2O5 for all crops excluding
alfalfa and grass-clover, where the standard is 5.8 kg N, 1,4 kg t-1 P2O5 and 5.9 kg N, 1,4 kg
P2O5 ton-1 of dry matter content, respectively (MANMF, 2004). Compared with the real
nutrient balance calculation MINAS does not include phosphate fertilizer input and the input
coming through the deposition and seeds for cropping. In the models both real and MINAS
nutrient balance calculation is included in order to analyze the differences at farm level.
57
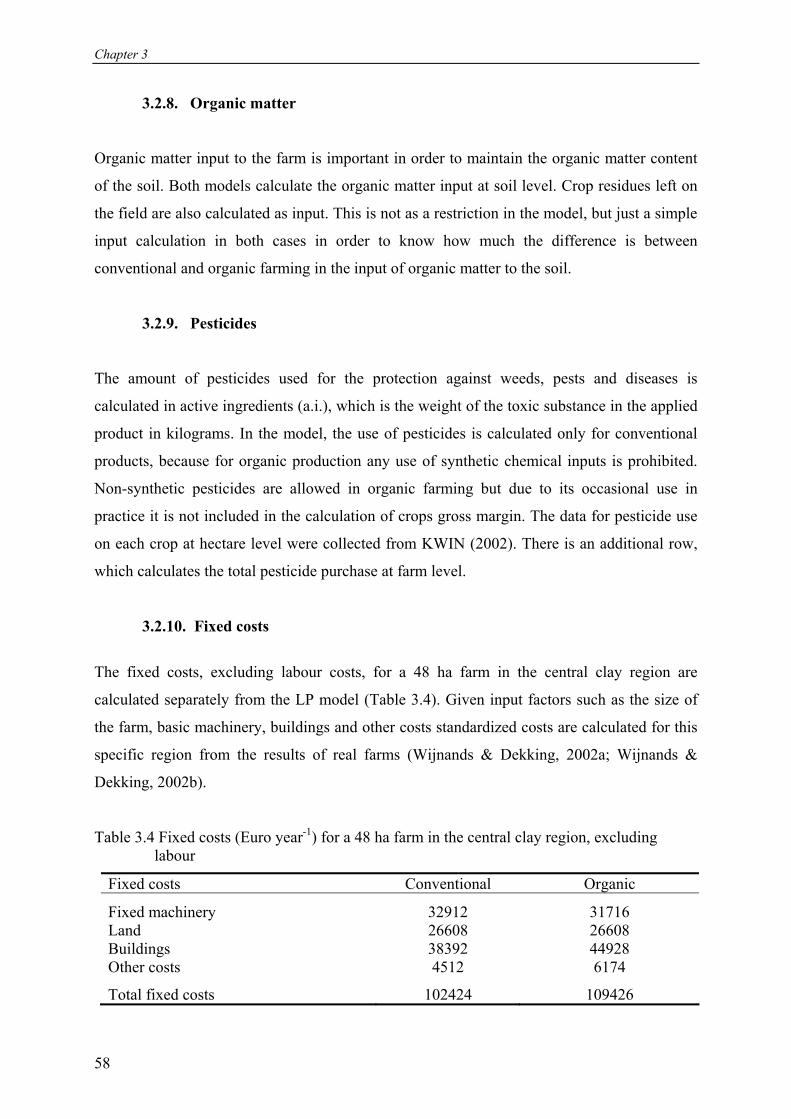
Chapter 3
3.2.8. Organic matter
Organic matter input to the farm is important in order to maintain the organic matter content
of the soil. Both models calculate the organic matter input at soil level. Crop residues left on
the field are also calculated as input. This is not as a restriction in the model, but just a simple
input calculation in both cases in order to know how much the difference is between
conventional and organic farming in the input of organic matter to the soil.
3.2.9. Pesticides
The amount of pesticides used for the protection against weeds, pests and diseases is
calculated in active ingredients (a.i.), which is the weight of the toxic substance in the applied
product in kilograms. In the model, the use of pesticides is calculated only for conventional
products, because for organic production any use of synthetic chemical inputs is prohibited.
Non-synthetic pesticides are allowed in organic farming but due to its occasional use in
practice it is not included in the calculation of crops gross margin. The data for pesticide use
on each crop at hectare level were collected from KWIN (2002). There is an additional row,
which calculates the total pesticide purchase at farm level.
3.2.10. Fixed costs
The fixed costs, excluding labour costs, for a 48 ha farm in the central clay region are
calculated separately from the LP model (Table 3.4). Given input factors such as the size of
the farm, basic machinery, buildings and other costs standardized costs are calculated for this
specific region from the results of real farms (Wijnands & Dekking, 2002a; Wijnands &
Dekking, 2002b).
Table 3.4 Fixed costs (Euro year-1) for a 48 ha farm in the central clay region, excluding labour
Fixed costs Conventional Organic
Fixed machinery 32912 31716 Land 26608 26608 Buildings 38392 44928 Other costs 4512 6174
Total fixed costs 102424 109426
58

Comparison of conventional and organic arable farming systems by means of bio-economic modelling
The fixed costs, excluding labour, are 102 424 Euro year-1 in case of a conventional
farm and 109 426 Euro year-1 in case of an organic farm. The costs include the cost of land,
buildings, fixed machinery and other costs such as maintenance of ditches as contract work
and other general costs per farm. The difference between these two farm setups comes from
basic differences in cropping plans between conventional and organic farming, different
machinery settings, e.g. no use of chemical equipment in organic farming, and other building
requirements, e.g. storage.
3.3 Results
In order to compare conventional and organic farming under current policy and environmental
regulations in the Netherlands, three situations are analysed and compared using the same
example farm. There are two optimal situations calculated for the example farm using the
conventional farm model (3-year and 4-year crop rotation) and one using the organic farm
model (6-year crop rotation). Technical, economic and environmental results of these
situations are analysed and compared.
3.3.1 Technical results
The optimal production plans for conventional and organic farm models in 3-year, 4-year and
6-year crop rotation plans are presented in Table 3.5. In all three situations seed onion is
produced on the maximum area because of its high gross margin. Seed potato also has high
gross margin per hectare but, because of its higher labour need compared to ware potato, and
due to the total household labour limit (2255 h year-1), in both conventional situations seed
potato is produced only on a part of the potato grown area. The rest is occupied by less labour
intensive ware potato. Furthermore, rotation restrictions on root crops (75 and 50% in the
conventional and the organic case, respectively) and on individual crops determine the
cropping plan.
59
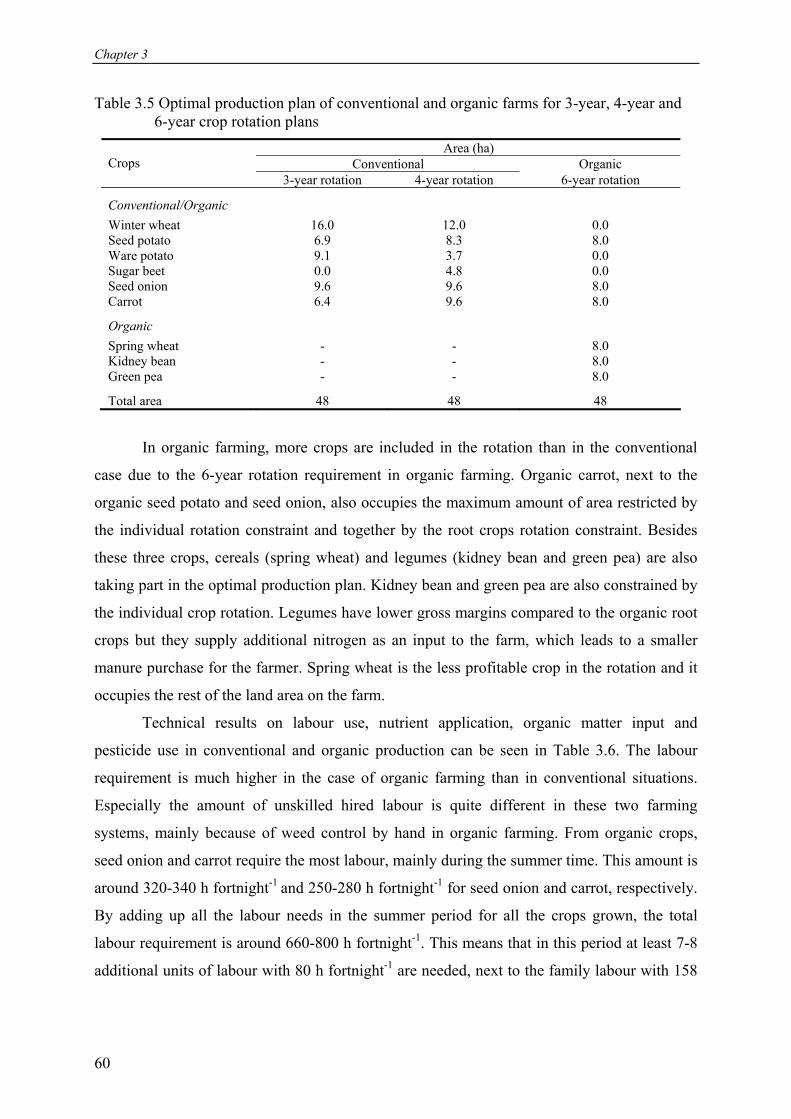
Chapter 3
Table 3.5 Optimal production plan of conventional and organic farms for 3-year, 4-year and 6-year crop rotation plans
Area (ha) Conventional Organic Crops
3-year rotation 4-year rotation 6-year rotation
Conventional/Organic
Winter wheat
16.0
12.0
0.0 Seed potato 6.9 8.3 8.0 Ware potato 9.1 3.7 0.0 Sugar beet 0.0 4.8 0.0 Seed onion 9.6 9.6 8.0 Carrot 6.4 9.6 8.0
Organic
Spring wheat - - 8.0 Kidney bean - - 8.0 Green pea - - 8.0
Total area 48 48 48
In organic farming, more crops are included in the rotation than in the conventional
case due to the 6-year rotation requirement in organic farming. Organic carrot, next to the
organic seed potato and seed onion, also occupies the maximum amount of area restricted by
the individual rotation constraint and together by the root crops rotation constraint. Besides
these three crops, cereals (spring wheat) and legumes (kidney bean and green pea) are also
taking part in the optimal production plan. Kidney bean and green pea are also constrained by
the individual crop rotation. Legumes have lower gross margins compared to the organic root
crops but they supply additional nitrogen as an input to the farm, which leads to a smaller
manure purchase for the farmer. Spring wheat is the less profitable crop in the rotation and it
occupies the rest of the land area on the farm.
Technical results on labour use, nutrient application, organic matter input and
pesticide use in conventional and organic production can be seen in Table 3.6. The labour
requirement is much higher in the case of organic farming than in conventional situations.
Especially the amount of unskilled hired labour is quite different in these two farming
systems, mainly because of weed control by hand in organic farming. From organic crops,
seed onion and carrot require the most labour, mainly during the summer time. This amount is
around 320-340 h fortnight-1 and 250-280 h fortnight-1 for seed onion and carrot, respectively.
By adding up all the labour needs in the summer period for all the crops grown, the total
labour requirement is around 660-800 h fortnight-1. This means that in this period at least 7-8
additional units of labour with 80 h fortnight-1 are needed, next to the family labour with 158
60
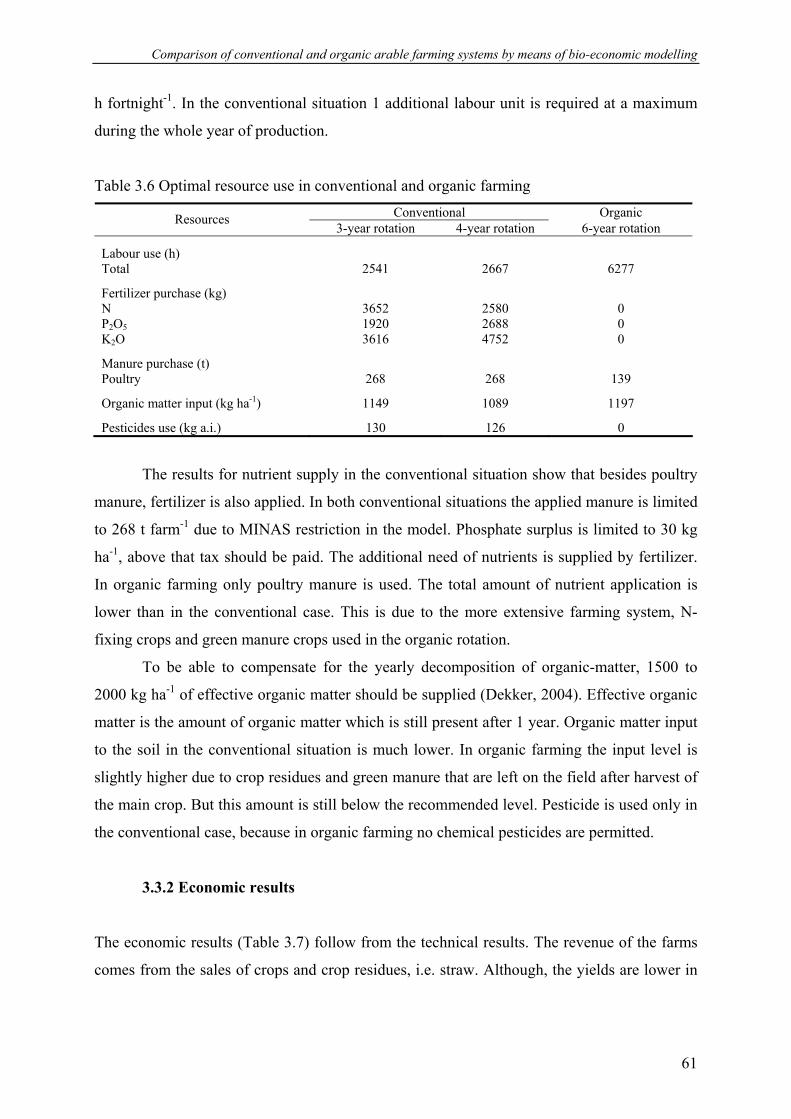
Comparison of conventional and organic arable farming systems by means of bio-economic modelling
h fortnight-1. In the conventional situation 1 additional labour unit is required at a maximum
during the whole year of production.
Table 3.6 Optimal resource use in conventional and organic farming Conventional Organic Resources
3-year rotation 4-year rotation 6-year rotation
Labour use (h) Total 2541 2667 6277
Fertilizer purchase (kg) N 3652 2580 0 P2O5 1920 2688 0 K2O 3616 4752 0
Manure purchase (t) Poultry 268 268 139
Organic matter input (kg ha-1) 1149 1089 1197
Pesticides use (kg a.i.) 130 126 0
The results for nutrient supply in the conventional situation show that besides poultry
manure, fertilizer is also applied. In both conventional situations the applied manure is limited
to 268 t farm-1 due to MINAS restriction in the model. Phosphate surplus is limited to 30 kg
ha-1, above that tax should be paid. The additional need of nutrients is supplied by fertilizer.
In organic farming only poultry manure is used. The total amount of nutrient application is
lower than in the conventional case. This is due to the more extensive farming system, N-
fixing crops and green manure crops used in the organic rotation.
To be able to compensate for the yearly decomposition of organic-matter, 1500 to
2000 kg ha-1 of effective organic matter should be supplied (Dekker, 2004). Effective organic
matter is the amount of organic matter which is still present after 1 year. Organic matter input
to the soil in the conventional situation is much lower. In organic farming the input level is
slightly higher due to crop residues and green manure that are left on the field after harvest of
the main crop. But this amount is still below the recommended level. Pesticide is used only in
the conventional case, because in organic farming no chemical pesticides are permitted.
3.3.2 Economic results
The economic results (Table 3.7) follow from the technical results. The revenue of the farms
comes from the sales of crops and crop residues, i.e. straw. Although, the yields are lower in
61

Chapter 3
organic farming, the higher prices for organic products are resulting in higher returns from
organic crop production compared to that in conventional situation.
Table 3.7 Optimal resource use in conventional and organic farming Economic results (Euro year-1)
Conventional Organic Component 3-year rotation 4-year rotation 6-year rotation
Revenue Returns from crops 263118 291664 358609
Costs Costs of crop production 124839 153526 141252 Hired labour 5049 6606 41992 Manure and fertiliser 5346 5508 1894 Total variable costs 135234 165640 185138
Gross margin 127884 126024 173471 Gross margin (Euro ha-1) (2664) (2625) (3614)
Fixed costs 102424 102424 109426
Family labour income 25460 23600 64045 Family labour income (Euro ha-1) (530) (492) (1334)
The costs of organic crop production are approximately the same as in conventional
farming. Important cash crops such as seed potato and seed onion have lower, but other crops
such as carrot have higher production costs than in the conventional situation. In organic
farming the cost of hired labour is about seven times higher than in conventional farming, but
the costs for manure and fertilizer are lower due to the more extensive farming and no
fertilizer use.
The difference between the returns and variable costs is higher in organic farming than
in conventional situations. This difference leads to higher gross margin in organic than in
conventional farming. Given the fixed costs, which are slightly higher in organic farming, a
family labour income which results is considerably higher in organic farming.
3.3.3 Environmental results
Nutrient balance and losses of nitrogen and phosphate in kg ha-1 in both organic and
conventional situation are shown in Table 3.8. Real nutrient surplus is calculated as the
difference between total nutrient input by manure, fertilizer, seeds, deposition and N-fixation
at farm level and output with each crop from the farm. For MINAS, input via manure,
62
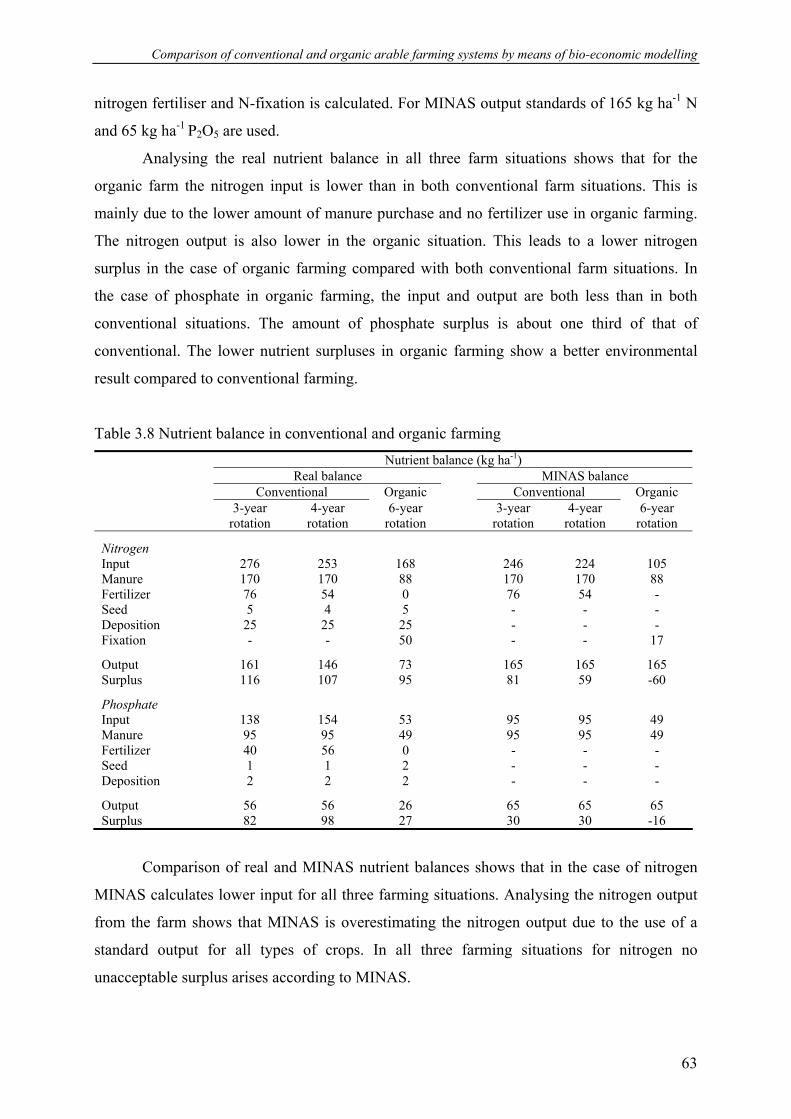
Comparison of conventional and organic arable farming systems by means of bio-economic modelling
nitrogen fertiliser and N-fixation is calculated. For MINAS output standards of 165 kg ha-1 N
and 65 kg ha-1 P2O5 are used.
Analysing the real nutrient balance in all three farm situations shows that for the
organic farm the nitrogen input is lower than in both conventional farm situations. This is
mainly due to the lower amount of manure purchase and no fertilizer use in organic farming.
The nitrogen output is also lower in the organic situation. This leads to a lower nitrogen
surplus in the case of organic farming compared with both conventional farm situations. In
the case of phosphate in organic farming, the input and output are both less than in both
conventional situations. The amount of phosphate surplus is about one third of that of
conventional. The lower nutrient surpluses in organic farming show a better environmental
result compared to conventional farming.
Table 3.8 Nutrient balance in conventional and organic farming Nutrient balance (kg ha-1) Real balance MINAS balance Conventional Organic Conventional Organic 3-year
rotation 4-year
rotation 6-year
rotation 3-year
rotation 4-year
rotation 6-year
rotation
Nitrogen Input 276 253 168 246 224 105 Manure 170 170 88 170 170 88 Fertilizer 76 54 0 76 54 - Seed 5 4 5 - - - Deposition 25 25 25 - - - Fixation - - 50 - - 17
Output 161 146 73 165 165 165 Surplus 116 107 95 81 59 -60
Phosphate Input 138 154 53 95 95 49 Manure 95 95 49 95 95 49 Fertilizer 40 56 0 - - - Seed 1 1 2 - - - Deposition 2 2 2 - - -
Output 56 56 26 65 65 65 Surplus 82 98 27 30 30 -16
Comparison of real and MINAS nutrient balances shows that in the case of nitrogen
MINAS calculates lower input for all three farming situations. Analysing the nitrogen output
from the farm shows that MINAS is overestimating the nitrogen output due to the use of a
standard output for all types of crops. In all three farming situations for nitrogen no
unacceptable surplus arises according to MINAS.
63

Chapter 3
In the case of phosphate, the MINAS system calculates lower input, it does not include
phosphate from fertilizer purchase, and overestimates the amount of output, especially in
organic farming. In both conventional situations the amount of manure is limited by MINAS.
A maximum 30 kg ha-1 surplus is allowed, above this amount nutrient tax is charged to the
farmer for every extra kilogram of surplus. In this situation it is more profitable to apply
artificial fertilizer to fulfil the nutrient requirement of the grown crops. In general the real
nutrient surpluses in conventional farming are higher than that calculated by MINAS.
3.3.4 Sensitivity analysis
The stability of the optimal plan of the model follows from the analysis of shadow prices in
the model output results and by making sensitivity analyses. Shadow prices of different crops
show by how much crops not currently in the optimal plan should be more profitable in order
to get into the optimal production plan of the model. The resulting shadow prices show that
the revenues from crops that are not in the optimal plan should be substantially higher in order
to be included in the optimal production plan. This is concerning all three farming situations.
The shadow price of land in the organic farming model shows that if the farmer has one
more hectare of land then his/her income will increase by 3401 Euro. In the case of
conventional farming this shadow price is 2604 Euro and 2559 Euro for 3-year and 4-year
rotations, respectively. In reality, rent of an extra hectare of land is less than 1000 Euro, which
means it would be profitable to get some additional area for cultivation if available. These
results also show that the land is one of the strongest constraints in the model.
Sensitivity analysis of the wage for hired labour show a slight effect on the cropping plan
of both conventional farm situations. By decreasing the unskilled labour wage, more hectares
of seed potato get into the optimal plan instead of ware potato. Seed potato is more labour
intensive and has higher gross margin in Euro ha-1 than ware potato. The increase of labour
wage has the opposite effect on the cropping plan. In the organic situation a decrease of
unskilled labour wage has no effect on the optimal cropping plan, but an increase brings more
hectares of cereals instead of carrot into the production plan. From shadow prices and
sensitivity analysis we can conclude that changes in prices and production parameters do not
have much effect on the optimal production plan.
64
Comparison of conventional and organic arable farming systems by means of bio-economic modelling
3.4 Discussion and outlook
Representative results from organic farming in practice are only available for recent years, as
organic farming on a large scale is a recent phenomenon. Representative results from 1999-
2002, published by the Agricultural Economics Research Institute (2003), show that income
from organic arable farms is higher than from conventional arable farms. The difference
varies from some 30000 Euro in 2001 to only some 2000 in 2002. This is considerably
smaller than the difference resulting from the model calculations. Detailed results show that
prices of crops vary considerably over the years, both for conventional and organic farming.
Furthermore, especially with regard to organic farming, the average cropping plan in practice
differs considerably from the cropping plan in the model results. In practice the area of crops
with high profit, and probably high risk, is lower than in the model results. A final reason for
the smaller income difference between the practice and the model of organic farming is its
smaller scale. In 2002 the average organic arable farm in the Netherlands used 41 ha, whereas
the average conventional farm used 46 ha.
The conclusion that organic farming is more profitable than conventional farming
follows also from studies carried out in other European countries and the United States, which
show higher revenues and lower variable costs in organic production. (Langley at al., 1983;
Van Mansvelt & Mulder, 1993); Stockdale et al., 2001; Mahoney et al., 2004). From this the
question arises: why do not more farmers convert? The answer to this question has to do with
a number of factors. Factors influencing the economic performance of the farm like the
financial difficulty of the conversion period from conventional to organic farming, the need
for more hired labour in organic production, the risk and uncertainty of yields and market
prices during and after conversion (Van Mansvelt & Mulder, 1993; Lampkin & Padel, 1994).
Besides these economic factors social pressures (i.e, community peer pressures,
intergenerational pressures), institutional pressures (i.e. banks, landlords), learning process on
the part of the farmer and ideological aspects can also be important factors that hamper
conversion (Padel, 2001; Schifferstein & Ophuis, 1998; Lampkin & Padel, 1994). In this
discussion the focus is on factors related to economic performance of the farm.
3.4.1 Conversion period
The conversion period is one of the main problem for the farmer wanting to convert to
organic farming (Sparkes et al., 2003). It takes 2 years, during which crops must be grown in
65

Chapter 3
an organic way but can be sold only at conventional product prices. During this period also a
lot of changes investments and disinvestments are needed which can cause financial problems
for the farmer. Longer rotations with fewer cash crops, a basis for organic management,
means that especially in the conversion period income problems can arise (Van Mansvelt &
Mulder, 1993). The effect on income of conversion to organic production depends also on the
farm type and location. Extensive farms in marginal regions are more likely to benefit from
conversion than intensive farms in fertile regions (Dabbert et al., 2004). According to some
research in the Netherlands (Hoorweg, 2002), the payback time after conversion to organic
arable farming depends on the farmers’ initial situation. Farmers with short crop rotations (3-
year) have a longer payback period then those who have longer (4-year or 5-year) crop
rotations. This is because more specialized farms have to invest more, especially in
machinery, to convert to more extensive 6-year organic crop rotation.
3.4.2 Hired labour
In organic farming the labour need is much higher than that of conventional farms. Problems
mainly arise from the willingness of farmers to work with more employees on the farm. The
organization also requires more skills of the entrepreneur. In some regions, where there is a
lot of organic farming or other labour intense crops, the availability of labour can also be a
problem. This is mainly because of the low skill requirements and the usually boring work,
mainly by hand, which must be done on organic farms, i.e. weed and pests control, harvesting
by hand. The willingness of people, even schoolchildren, to do this kind of work is quite low
(De Wolf & De Wolf, 2004).
3.4.3 Yield and price risk
In the Netherlands the yield risk of organic farming is usually higher than that of conventional
farming (LEI, 2004; Van Bueren et al., 2002). This is due mainly to a lower nitrogen-input
and in some cases to pests and diseases (Van Bueren et al., 2002). A 50% less yield in organic
farming for a cash crop such as seed potato would bring down the labour income from 64040
to 25560 Euro farm-1 year-1 in organic farming, which is close to the labour income level of
conventional farming. The fact that yields in organic agriculture fluctuate much more than in
conventional systems according to Van Bueren et al. (2002) has been considered one of the
most important factors that limits the growth of the organic market share. However, according
66

Comparison of conventional and organic arable farming systems by means of bio-economic modelling
to Lamkin & Padel (1994) the conclusion that organic yields fluctuate more than in
conventional systems is not certainly a ‘fact’, there is evidence the opposite direction.
Uncertainty about the organic market access is a problem which can inhibit farmers
from converting to organic farming. Prices fluctuate considerably due to organic market
conditions such as the small-scale and the immature nature of the organic market and the lack
of government intervention to stabilise prices (Lampkin and Padel, 1994). If, after the
conversion period, farmers cannot sell their products as organic for higher prices, after they
have produced it in an organic way, their income would also drop considerably. At the
moment in The Netherlands the market for some organic products is saturated. Lately, many
farmers have converted to organic farming and there is now overproduction, meaning that
they cannot sell their products at organic prices as assumed in our organic model, but only at
lower prices. Lower prices make organic farming less attractive. Model calculations showed
that if organic farmer would get conventional prices for all his organically produced products
then the labour income would decrease to -72312 Euro instead of 64040 Euro, with seed
potato (8ha), sugar beet (8ha), seed onion (8ha), spring wheat (12 ha) and alfalfa (12 ha) in
the crop rotation
Considering all the above mentioned factors influencing conversion to organic production
further research is needed in order to study the decision to convert from conventional to
organic farming. The factors mentioned in the discussion should be taken into account while
studying the decision. A static comparison of the two farming systems may lead to unrealistic
conclusions about the decision to convert as it ignores important factors, such as conversion
process and uncertainty of future yields and future market prices.
67

Chapter 3
References
Agricultural Economics Research Institute, 2003. Landbouw-Economisch Bericht 2003.
Agricultural Economics Research Institute; The Hague, The Netherlands.
Anonymous, 1996. Kiezen uit Gehalten 3. Forfaitaire gehalten voor de
Mineralenboekhouding. Publicatie IKC-Landbouw. Mineralenboekhouding Den
Haag, The Hague, The Netherlands.
Bus, C.B., van Loon, C.D. and Veerman, A., 1996. Teelt van pootaardappelen.
Teelthandleiding nr. 72. PAGV, Lelystad.
CAO, 2002. CAO Landbouw. Collectieve Arbeidsovereenkomst, 2002.
Darwinkel, A., 1997. Teelt van wintertarwe. Teelthandleiding nr. 76. PAGV, Lelystad.
Dabbert S., Häring, A. M. and Zanoli, R., 2004. Organic Farming. Policies and Prospects.
Zed Books; London, UK.
De Wolf, M. & De Wolf, P., 2004. Personal communication. Praktijkonderzoek Plant en
Omgeving, Lelystad
Dekker, P., 2004. Personal communication. Praktijkonderzoek Plant en Omgeving,
Lelystad.
Hazell, P.B.R. and Norton, R.D., 1986. Mathematical Programming for Economic
Analysis in Agriculture. Macmillan Publishing Company, New York.
Häring A., Dabbert, S. Offermann, F. and Nieberg, H., 2001. Benefits of Prganic Farming
for Society. European Conference – Organic Food and Farming, 10-11 May 2001,
Copenhagen, Denmark.
Hoorweg, M., 2002. Regionale Perspectieven voor biologische akkerbouw – met een
omschakelingsplan voor een intensief pootaardappelbedrijf in het Noordelijk
kleigebied, Wageningen, The Netherlands.
KWIN, 2002. Kwantitatieve Informatie Akkerbouw en Vollegrondsgroenteteelt.
Praktijkonderzoek Plant en Omgeving 2002, Lelystad, The Netherlands.
Lampkin, N.H. and Padel., S., 1994. The economics of organic farming: an international
perspective. CAB International, Wallingford, UK.
Langley, J. A., Heady, E. O. and Olson, K. D., 1983. The macro implications of a
complete transformation of U.S. agricultural production to organic farming practices,
Agriculture, Ecosystems & Environment 10 (4), p. 323-333.
LEI, 2004. Land- en tuinbouwcijfers 2004, Agricultural Economics Research Institute
(LEI), Centraal Bureau voor de Statistiek (CBS). The Hague, The Netherlands
68
Comparison of conventional and organic arable farming systems by means of bio-economic modelling
Loon, van C.D., Veerman, A. and Bus, C., 1993. Teelt van consumptie-aardappelen.
Teelthandleiding nr 57. PAGV, Lelystad.
Mahoney P.R., Olson, K.D., Porter, P.M., Huggins, D.R., Perillo, C.A. and Kent
Crookston, R., 2004. Profitability of organic cropping systems in southwestern
Minnesota, Renewable Agriculture and Food Systems 19 (1), p. 35-46.
MANMF - Ministry of Agriculture, Nature Management and Fisheries, 2004.
Wetsvoorstel aanpassing verliesnormen naar Tweede Kamer,
<www.minlnv.nl/persberichten/Mestloket>, Accessed 28 January 2004
Melita, F., 2001. Organic Farming in the Netherlands – Country Reports.
<http://www.organic-europe.net/country_reports/netherlands/default.asp>
Accessed 25 November 2004
Padel, S., Lampkin, N. H., Dabbert, S. and Foster, C., 2002. Organic farming policy in the
European Union. Advances in the Economics of Environmental Resources 4, p. 169-
194.
Padel, S., 2001. Conversion to organic farming: A typical example of the diffusion of an
innovation? Sociologia Ruralis 41 (1), p. 40-61.
Rigby D., Cáceres, D., 2001. Organic farming and the sustainability of agricultural
systems. Agricultural Systems, 68, p. 21-40.
Schifferstein, H. N. J. and Oude Ophuis, P. A. M., 1998. Health-related determinants of
organic food consumption in the Netherlands, Food Quality and Preference 9 (3), p.
119-133.
Schoneveld, J.A., and Zwanepol, S., 1991. Teelt van peen. Teelhandleiding nr. 36. PAGV,
Lelystad, The Netherlands.
Schoorlemmer, H.B. and Krikke, A.T., 1997. Bedrijfsbegroten in de akkerbouw en de
vollegrondsgroenteteelt. Publicatie nr. 84. PAGV, Lelystad, The Netherlands.
Skal, 2006. Fertilizers, manure and pesticides. Certification Organic Production.
www.skal.nl Accessed 29 April 2006.
Sparkes, D.L., Wilson, P. and Huxham, S.K., 2003. Organic conversion strategies for
stockless farming. Project report no. 307. University of Nottingham, School of
Biosciences, Loughborough, Leicestershire LE 12 5 RD, UK. Accessed 23 October
2004. http://www.hgca.com/ftpaccess/docs/projectreports/report307.pdf
Stockdale, E. A., Lampkin, N. H., Hovi, M., Keatinge, R., Lennartsson, E. K. M.,
Macdonald, D. W., Padel, S., Tattersall, F. H., Wolfe, M. S. and Watson, C. A.,
69
Chapter 3
2001. Agronomic and environmental implications of organic farming systems,
Advances in Agronomy, Academic Press, 70, p. 261-262.
Timmer, R,D., 1999. Teelt van zomergerst. Teelthandleiding nr. 87. PAGV, Lelystad, The
Netherlands.
Van Bueren, E.T.L., Struik, P.C. and Jacobsen, E., 2002. Ecological concepts in organic
farming and their consequences for an organic crop ideotype. Netherlands Journal of
Agricultural Science, 50, p.1-26.
Van Dijk, W., 2003. Adviesbasis voor de bemesting van akkerbouw- en
vollegrondsgroentengewassen, PPO 307., Lelystad, The Netherlands.
Van Mansvelt J. D. and Mulder, J.A., 1993. European features for sustainable
development: a contribution to the dialogue, Landscape and Urban Planning 27 (2-
4), p. 67-90.
Visser, de C.L.M., and Zwanepol, S., 1993. Teelt van zaaiuien. Teelthandleiding nr. 52.
PAGV, Lelystad, The Netherlands.
Westerdijk, C.E., and Zwanepol, S., 1994. Teelt van suikerbieten. Teelthandleiding nr. 64.
PAGV, Lelystad, The Netherlands.
Wijnands, F.G. and Dekking, A.J., 2002a. Biologische akkerbouw. centrale zeeklei. PPO-
Bedrijfssystemen – 2002, no 1. PPO, Lelystad, The Netherlands.
Wijnands, F.G. and Dekking, A.J., 2002b. Geïntegreerde akkerbouw, centrale zeeklei.
PPO-Bedrijfssystemen 2002 no4. PPO, Lelystad, The Netherlands.
Willer, H and Yusselfi, M., 2004. The World of Organic Agricutlure - Statistics and
Emerging Trends - 2004, International Federation of Organic Agriculture
Movements (IFOAM), Bonn, Germany.
Yussefi, M. and Willer, H., 2002. Organic Agriculture Worldwide 2002: Statistics and
Future Prospects. SÖL (Foundation of Ecology and Agriculture), Bad Dürkheim,
Germany.
70
71
Chapter 4
Conversion to organic arable farming in the Netherlands:
a dynamic linear programming analysis
S. Acs1, P.B.M. Berentsen1 and R.B.M. Huirne1,2
1 Business Economics, Department of Social Sciences, Wageningen University, Wageningen
2 Animal Sciences Group, Lelystad
Submitted to Agricultural Systems
Chapter 4
Abstract
Several studies show that organic farming is more profitable than conventional farming.
However, in reality not many farmers convert to organic farming. Policy makers and farmers
do not have clear insight into factors which hamper or stimulate the conversion to organic
farming. The objective of this paper is to develop a dynamic linear programming model to
analyse the effects of different limiting factors on the conversion process of farms over time.
The model is developed for a typical arable farm in the Netherlands central clay region, and
is based on two static liner programming models (conventional and organic). The objective of
the model is to maximise the net present value over a ten-year planning horizon. There are
three phases in the model: conventional, conversion and organic farming. The solution of the
model provides a decision strategy for the farmer for the whole planning horizon for each
year. It provides the optimal cropping plan, labour allocation, nutrient and pesticide
purchase, nutrient losses, organic matter input, and information on production costs and
revenues. It shows whether partial or complete conversion, one-step, or stepwise conversion
is more profitable. The results of the analysis of a basic scenario show that conversion to
organic farming is more profitable than staying conventional. In order to arrive at the actual
profitable phase of organic farming the farmer has to pass through the economically difficult
two-year conversion period. Sensitivity analysis shows that if depreciation 25% higher than
conventional fixed costs occurs due to machinery made superfluous by conversion, conversion
is less profitable than staying conventional. Also the availability of hired labour, which can
be constrained in peak periods, has a strong effect on the cropping plan and the amount of
area converted. Further analysis shows that a slight drop (2%) in organic prices lowers the
labour income of the farmer and makes conversion less profitable than conventional farming.
For farmers a minimum labour income can be required to ‘survive’. The analysis shows that
constraint on minimum labour income makes stepwise conversion the best way for farmers to
overcome economic difficulties during conversion.
72
Conversion to organic arable farming in the Netherlands: a dynamic linear programming analysis
4.1 Introduction
One of the policies of the Dutch government is to increase the area of organic production.
However, there is a great lack of information among policy makers and farmers on the
economic potential of organic arable production in the Netherlands. Analysing conventional
and organic arable farming systems separately has resulted in many studies showing that
organic farming in several cases is more profitable than conventional farming (Eltun et al.,
2003.; Mahoney et al., 2004; Acs et al., 2006). But, actually, not many farmers are converting
organic farming system. In Acs et al. (2006) several factors were mentioned that might
influence the decision of farmers to convert to organic production. In this study the focus is
made on factors influencing the economic performance of the farm such as financial difficulty
in the conversion period due to lack of access to premium prices, investment costs of new
machinery/buildings and extra depreciation costs for subsequently unused fixed capital
(disinvestment); effect of the “learning curve”: information-gathering costs of starting organic
production and marketing, and consequent lower revenues due to management inefficiency
(lower yields) in the first years of conversion; labour availability constraint in peak periods
due to the greater labour requirement in organic farming; risk associated with future yield
and market price uncertainty for organic products. All these reasons are well known, but not
many studies have examined the actual extent to which they can affect the conversion
decision.
Different modelling approaches have been used to study conversion, but the majority of
normative studies have not included the time aspect in the model (Acs et al., 2005). The
inclusion of time is however important for two reasons. First, the conversion process from
conventional to organic farming takes at least two years. Besides one-step conversion
(conversion of all land area at once), farmers can also choose stepwise conversion. This gives
farmers more time to adapt to the new production method and ensures income by still
allowing production of conventional products next to the in-conversion products during the
conversion period. The second reason for including the time dimension is to analyse the effect
of different policy incentives before, during and after the conversion period.
Acs et al. (2006) analysed conventional and organic arable farming in the Netherlands
from a technical, economic and environmental point of view. This study showed that in
equilibrium states organic farming is much more profitable than conventional. The current
paper includes in the model the conversion period between conventional and established
73

Chapter 4
organic farming. Consequently, the resulting dynamic linear programming model describes
the conversion process of a farm over time. The model is presented and next, it is used to
analyse different factors influencing the conversion as mentioned above, such as extra
depreciation costs, hired labour availability, organic market price uncertainty and minimum
labour income requirement.
4.2 Method
4.2.1. Model specification
In order to analyse the conversion from a conventional to organic farming system over
time a Dynamic Linear Programming (DLP) model was developed for a typical arable farm in
the central clay region of the Netherlands. The general structure of the dynamic linear
programming model is summarised as follows (Hazell & Norton, 1986):
Maximise , where [∑ −=t tttt fxcZ )'(δ ] ( ) 1)1/(1 −+= t
t iδ (1)
Subject to: ttt bxA ≤
and 0≥tx
where:
Z – discounted labour income
t – year [1, …., 10]
i – discount rate
x – vector of activities
c – vector of gross margins or costs per unit of activity
f – vector of fixed costs per year
A – matrix of technical coefficients
b – vector of right-hand side value
Activities and constraints are included in each period (year) for all the relevant
decisions and many of them are duplicated from one year to the next (e.g., annual crop
74
Conversion to organic arable farming in the Netherlands: a dynamic linear programming analysis
activities). The link between the years is provided by the conversion of the land area and the
objective function.
The planning horizon has been arbitrarily limited to ten years in order to examine the
conversion process of the farm. Ten years is long enough not to influence the results of
conversion – usually conversion is completed after 3-6 years (MacRae et al., 1990). The
conversion itself takes two years if the farmer decides to convert at once, but longer in the
case of stepwise conversion. This means that in this planning horizon the farm will or will not
(partially or completely) convert, depending on the sum of the discounted labour income
calculated over the 10 years.
The activities in the model are production activities representing different crops,
seasonal labour, purchase of fertiliser and manure, activities calculating nutrient surplus,
organic matter input and pesticide use.
The constraints of the model are land availability, rotation restrictions, conversion
restrictions, supply and demand of household and seasonal labour, nutrient balance
calculation for MINAS (Dutch Mineral Accounting System) regulation, maximum manure
input restriction for MTAS (Manure Transfer Agreement System) regulation, several counting
rows for pesticide use and organic matter input to the farm.
There are some technical constraints on the dynamic aspect of the model. The first
year in the model is restricted to conventional production only. This restriction was imposed
in order to compare the conventional production plan with the conversion and organic
production plan. From the second year on the model can convert to organic production. In
case land goes into conversion, it will be so for two years, and then become organic land area.
The model determines how much land should go from conventional into conversion. In the
model the conversion is restricted to a one-way direction, excluding the possibility of
converting back to a conventional system.
The objective function of the model is to maximise the sum of discounted labour
income over the 10-year planning horizon, where the annual labour income is discounted to
the 1st year. In the basic scenario we assume a 4% discount rate. Labour income includes
revenues from crops produced, minus variable and fixed costs. Variable costs are direct crop-
production costs (variable operations, pesticide use, energy use, contract work, marketing
costs and other costs), costs of purchased nutrients (manure and fertilisers), hired labour costs
and nutrient taxes. Fixed costs include costs of land, machinery and buildings.
The DLP model was built in GAMS (General Algebraic Modelling System)
programming language and solved by the CoinCbc solver.
75
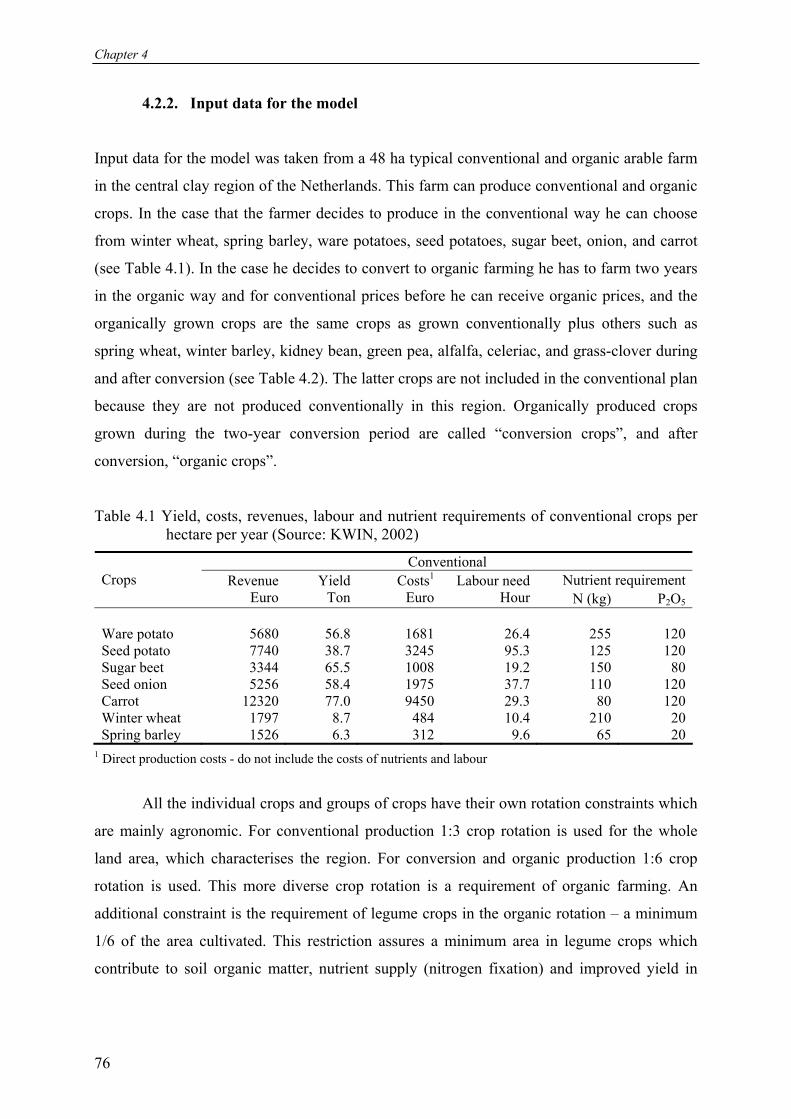
Chapter 4
4.2.2. Input data for the model
Input data for the model was taken from a 48 ha typical conventional and organic arable farm
in the central clay region of the Netherlands. This farm can produce conventional and organic
crops. In the case that the farmer decides to produce in the conventional way he can choose
from winter wheat, spring barley, ware potatoes, seed potatoes, sugar beet, onion, and carrot
(see Table 4.1). In the case he decides to convert to organic farming he has to farm two years
in the organic way and for conventional prices before he can receive organic prices, and the
organically grown crops are the same crops as grown conventionally plus others such as
spring wheat, winter barley, kidney bean, green pea, alfalfa, celeriac, and grass-clover during
and after conversion (see Table 4.2). The latter crops are not included in the conventional plan
because they are not produced conventionally in this region. Organically produced crops
grown during the two-year conversion period are called “conversion crops”, and after
conversion, “organic crops”.
Table 4.1 Yield, costs, revenues, labour and nutrient requirements of conventional crops per hectare per year (Source: KWIN, 2002)
Conventional Nutrient requirementCrops Revenue
Euro Yield
TonCosts1
EuroLabour need
Hour N (kg) P2O5
Ware potato 5680 56.8 1681 26.4 255 120Seed potato 7740 38.7 3245 95.3 125 120Sugar beet 3344 65.5 1008 19.2 150 80Seed onion 5256 58.4 1975 37.7 110 120Carrot 12320 77.0 9450 29.3 80 120Winter wheat 1797 8.7 484 10.4 210 20Spring barley 1526 6.3 312 9.6 65 20
1 Direct production costs - do not include the costs of nutrients and labour
All the individual crops and groups of crops have their own rotation constraints which
are mainly agronomic. For conventional production 1:3 crop rotation is used for the whole
land area, which characterises the region. For conversion and organic production 1:6 crop
rotation is used. This more diverse crop rotation is a requirement of organic farming. An
additional constraint is the requirement of legume crops in the organic rotation – a minimum
1/6 of the area cultivated. This restriction assures a minimum area in legume crops which
contribute to soil organic matter, nutrient supply (nitrogen fixation) and improved yield in
76
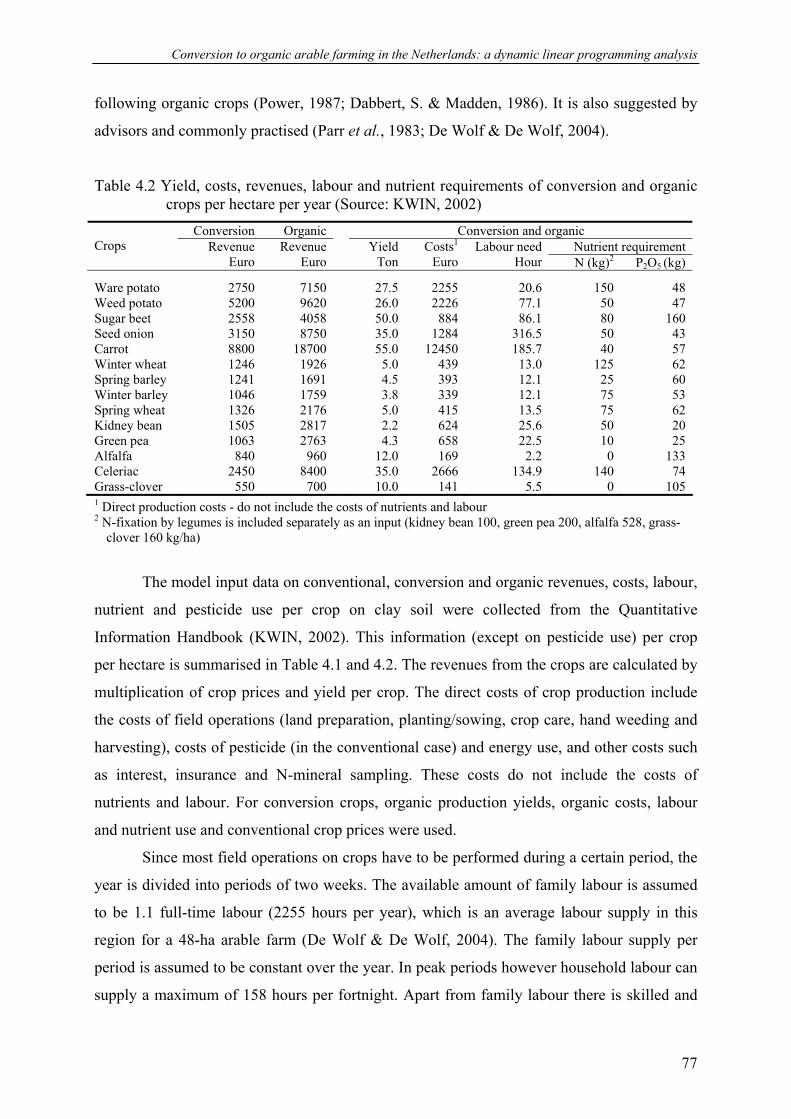
Conversion to organic arable farming in the Netherlands: a dynamic linear programming analysis
following organic crops (Power, 1987; Dabbert, S. & Madden, 1986). It is also suggested by
advisors and commonly practised (Parr et al., 1983; De Wolf & De Wolf, 2004).
Table 4.2 Yield, costs, revenues, labour and nutrient requirements of conversion and organic crops per hectare per year (Source: KWIN, 2002)
Conversion Organic Conversion and organic Nutrient requirement Crops Revenue
Euro Revenue
Euro Yield Ton
Costs1
Euro Labour need
Hour N (kg)2 P2O5 (kg)
Ware potato 2750 7150 27.5 2255 20.6 150 48 Weed potato 5200 9620 26.0 2226 77.1 50 47 Sugar beet 2558 4058 50.0 884 86.1 80 160 Seed onion 3150 8750 35.0 1284 316.5 50 43 Carrot 8800 18700 55.0 12450 185.7 40 57 Winter wheat 1246 1926 5.0 439 13.0 125 62 Spring barley 1241 1691 4.5 393 12.1 25 60 Winter barley 1046 1759 3.8 339 12.1 75 53 Spring wheat 1326 2176 5.0 415 13.5 75 62 Kidney bean 1505 2817 2.2 624 25.6 50 20 Green pea 1063 2763 4.3 658 22.5 10 25 Alfalfa 840 960 12.0 169 2.2 0 133 Celeriac 2450 8400 35.0 2666 134.9 140 74 Grass-clover 550 700 10.0 141 5.5 0 105
1 Direct production costs - do not include the costs of nutrients and labour 2 N-fixation by legumes is included separately as an input (kidney bean 100, green pea 200, alfalfa 528, grass-
clover 160 kg/ha)
The model input data on conventional, conversion and organic revenues, costs, labour,
nutrient and pesticide use per crop on clay soil were collected from the Quantitative
Information Handbook (KWIN, 2002). This information (except on pesticide use) per crop
per hectare is summarised in Table 4.1 and 4.2. The revenues from the crops are calculated by
multiplication of crop prices and yield per crop. The direct costs of crop production include
the costs of field operations (land preparation, planting/sowing, crop care, hand weeding and
harvesting), costs of pesticide (in the conventional case) and energy use, and other costs such
as interest, insurance and N-mineral sampling. These costs do not include the costs of
nutrients and labour. For conversion crops, organic production yields, organic costs, labour
and nutrient use and conventional crop prices were used.
Since most field operations on crops have to be performed during a certain period, the
year is divided into periods of two weeks. The available amount of family labour is assumed
to be 1.1 full-time labour (2255 hours per year), which is an average labour supply in this
region for a 48-ha arable farm (De Wolf & De Wolf, 2004). The family labour supply per
period is assumed to be constant over the year. In peak periods however household labour can
supply a maximum of 158 hours per fortnight. Apart from family labour there is skilled and
77
Chapter 4
unskilled seasonal hired labour. Hired labour can be employed any time of the year for
different field operations (land preparation, planting/sowing, crop care, hand weeding and
harvesting). There are operations which need more qualified labour (skilled labour), while for
others unqualified labour (i.e., youth, students) can also be used. Household labour is assumed
to be skilled. Some operations require at least two persons working at the same time, which
results in a minimum constraint on the hired labour needed for skilled and unskilled labour.
The costs of hired labour differ: 18 Euro/hour is paid for skilled and 9 Euro/hour for unskilled
labour (CAO, 2002).
In general organic crops require significantly more labour than conventional crops,
mainly due to the greater amount of work done by hand (i.e., weed control, pest control,
harvesting by hand) increased crop supervision etc. However, some crops such as seed and
ware potato need less labour in organic production, since hand weeding is less work than
chemical application. This greater labour demand also means more general work for farmers,
i.e. maintenance of machinery, fields, administration: 1120 hours per farm in conversion and
organic production years compared to 800 hours in conventional farming (Schoorlemmer &
Krikke, 1997; De Wolf & De Wolf, 2004). In the basic scenario it is assumed that the
availability of hired labour is unrestricted, and that there is no additional need for the family
labour to get extra information/education concerning organic production methods, which
requires more time and costs during the conversion period (no “learning curve” effect).
The fixed costs, based on those of a farm in this region with a 48-ha land area – basic
machinery, buildings and typical cropping plans – are calculated separately from the LP
model. These costs are related to the type of farming: conventional fixed costs (102424
Euro/year) are valid for conventional production and organic fixed costs (109426 Euro/year),
for conversion and organic production years (Wijnands & Dekking, 2002a, Wijnands &
Dekking, 2002b). There was no distinction made between conversion and organic fixed costs
because fixed costs mainly depend on the production method used and the average cropping
plan on the farm. In this case, in both conversion and organic production, the organic
production method is applied.
In order to convert to organic farming farmers have to adjust their technology to the
new production system and invest in new machinery/buildings. Machinery made superfluous
by conversion can cause disinvestment if there is little or no possibility of selling them. In the
basic scenario however is assumed that no disinvestment takes place.
78
Conversion to organic arable farming in the Netherlands: a dynamic linear programming analysis
More detailed information concerning input data on rotation constraints, household
labour use, fixed costs, nutrient balance, and organic matter input in conventional and organic
production methods can be found in Acs et al. (2006).
4.2.3. Model output
The solution of the model provides a decision strategy at the farm level, including the number
of hectares of each crop to be grown every year, and how many hectares to convert in the case
of conversion. Next to the optimal production plan it provides information on labour
allocation, nutrient and pesticide purchase, nutrient losses, organic matter input to the farm
and the economic consequences of production.
4.2.4. Input data for the model
First, calculations are made for the basic scenario as discussed in the previous sections. Next,
a sensitivity analysis determines the effects of some additional limiting factors on the results
by means of parametric programming. In this analysis the break-even point, farm conversion
or non-conversion, and the type of conversion (partial or complete, and one-step or stepwise)
is determined.
Disinvestment
The assumption was made that, in the basic scenario, no disinvestment occurs during
conversion from conventional to organic farming. With disinvestment the farmer has to
calculate an extra depreciation cost, which means an increase in fixed costs during the years
after switching to organic production. To investigate the effect of extra depreciation costs on
the farmer’s labour income and on the decision whether to convert or not to organic farming a
new scenario is analysed, called “disinvestment”. In this scenario an extra depreciation cost
for the conversion years (two years after the switch) were applied. The break-even point is
determined by a stepwise increase in the extra depreciation costs.
Hired seasonal labour availability
In the basic model no limit on hired-labour availability was assumed. In some regions (with a
lot of organic farming or other labour-intense activities) the availability of labour can be a
problem, mainly because of the low skill requirements and the usually boring work (done
79

Chapter 4
mainly by hand) on organic farms. In order to analyse the effect of the seasonal labour
availability in the region, the hired-labour availability is stepwise increased per fortnight. This
new scenario is called the “hired-labour limit”.
Lower organic prices
In the basic scenario it was assumed that the farmer gets higher prices for organic products
than for conventional, and that the prices are certain. However, in practice, organic market
uncertainty and price risk is an important factor in the decision to convert or not. In order to
analyse how a drop in prices (i.e., the farmer cannot receive higher organic prices) would
influence the conversion, a “lower organic price” scenario is tested. The prices of organic
products are decreased stepwise.
Minimum labour income requirement
In the basic set-up of the model, we assumed no minimum labour income requirement for the
whole planning horizon. However financial difficulty during conversion to organic farming
can be substantial due to lower yields and higher costs. To test this, a minimum bound is set
for the labour income for each year. In order to find the break-even point at which the farmer
switches to organic production, this minimum bound is increased stepwise. This scenario is
called “minimum labour income”.
4.3 Results of the DLP model
The results of the basic model are described as follows. First, the optimal cropping plan from
the model is presented. Second, the technical results (such as labour, nutrients and pesticide
use) are analysed. Third, economic results are examined. Next the results of the sensitivity
analysis are presented. The environmental results of the conventional and organic farming as
such are described in Acs et al. (2006).
4.3.1 Optimal cropping plan
The optimal cropping plan of the farm over a 10-year planning horizon can be seen in Table
4.3. The optimal strategy for the farm would be to convert the whole land area to organic
production in the second year (the first year is fixed as conventional). This means two years
80
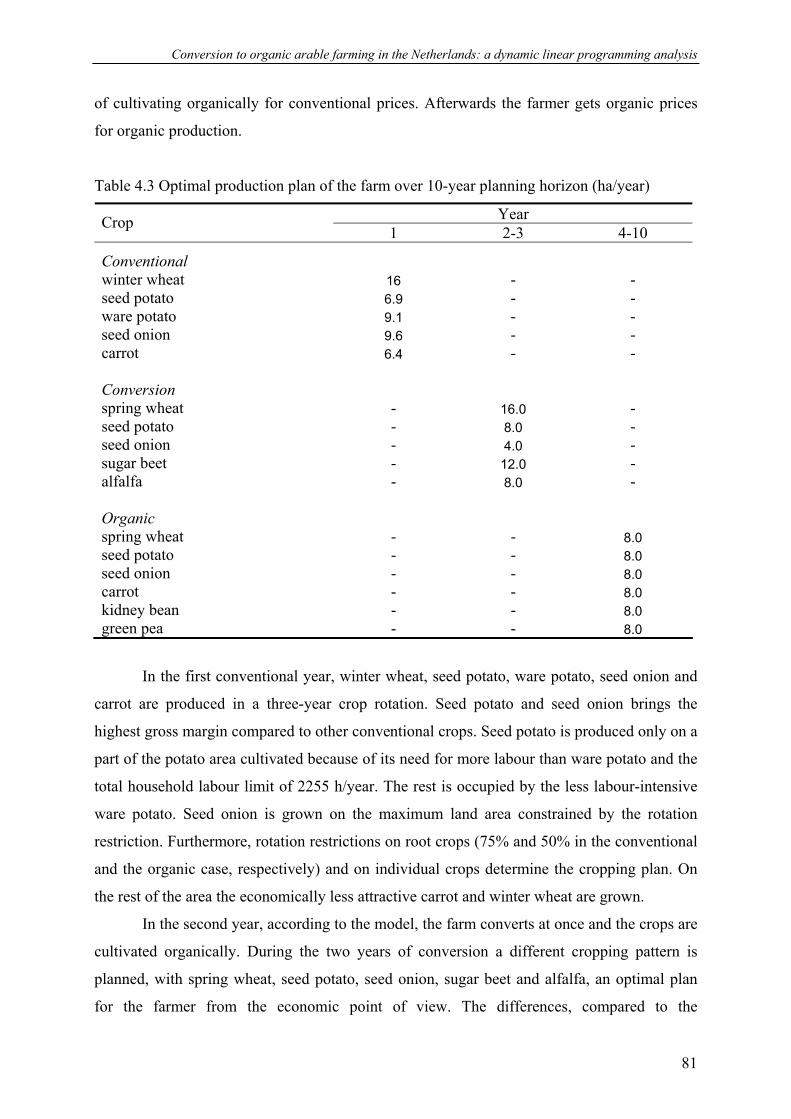
Conversion to organic arable farming in the Netherlands: a dynamic linear programming analysis
of cultivating organically for conventional prices. Afterwards the farmer gets organic prices
for organic production.
Table 4.3 Optimal production plan of the farm over 10-year planning horizon (ha/year)
Year Crop 1 2-3 4-10
Conventional winter wheat 16 - - seed potato 6.9 - - ware potato 9.1 - - seed onion 9.6 - - carrot 6.4 - - Conversion spring wheat - 16.0 - seed potato - 8.0 - seed onion - 4.0 - sugar beet - 12.0 - alfalfa - 8.0 - Organic spring wheat - - 8.0 seed potato - - 8.0 seed onion - - 8.0 carrot - - 8.0 kidney bean - - 8.0 green pea - - 8.0
In the first conventional year, winter wheat, seed potato, ware potato, seed onion and
carrot are produced in a three-year crop rotation. Seed potato and seed onion brings the
highest gross margin compared to other conventional crops. Seed potato is produced only on a
part of the potato area cultivated because of its need for more labour than ware potato and the
total household labour limit of 2255 h/year. The rest is occupied by the less labour-intensive
ware potato. Seed onion is grown on the maximum land area constrained by the rotation
restriction. Furthermore, rotation restrictions on root crops (75% and 50% in the conventional
and the organic case, respectively) and on individual crops determine the cropping plan. On
the rest of the area the economically less attractive carrot and winter wheat are grown.
In the second year, according to the model, the farm converts at once and the crops are
cultivated organically. During the two years of conversion a different cropping pattern is
planned, with spring wheat, seed potato, seed onion, sugar beet and alfalfa, an optimal plan
for the farmer from the economic point of view. The differences, compared to the
81
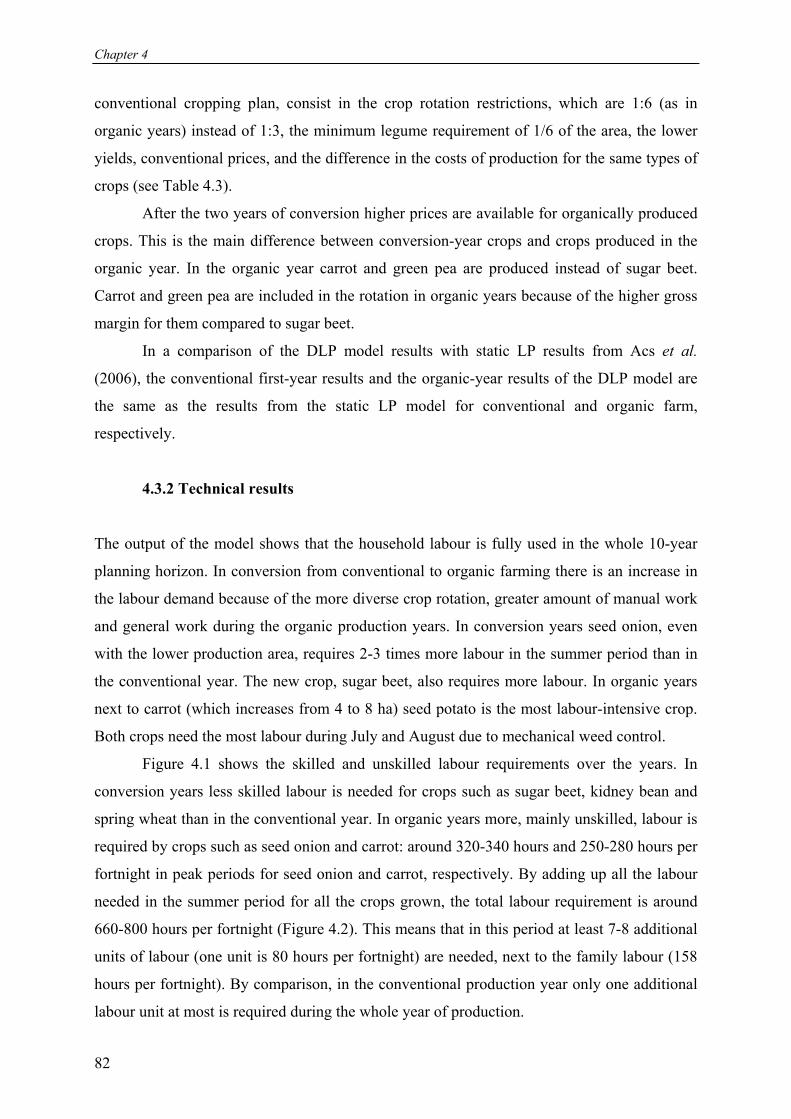
Chapter 4
conventional cropping plan, consist in the crop rotation restrictions, which are 1:6 (as in
organic years) instead of 1:3, the minimum legume requirement of 1/6 of the area, the lower
yields, conventional prices, and the difference in the costs of production for the same types of
crops (see Table 4.3).
After the two years of conversion higher prices are available for organically produced
crops. This is the main difference between conversion-year crops and crops produced in the
organic year. In the organic year carrot and green pea are produced instead of sugar beet.
Carrot and green pea are included in the rotation in organic years because of the higher gross
margin for them compared to sugar beet.
In a comparison of the DLP model results with static LP results from Acs et al.
(2006), the conventional first-year results and the organic-year results of the DLP model are
the same as the results from the static LP model for conventional and organic farm,
respectively.
4.3.2 Technical results
The output of the model shows that the household labour is fully used in the whole 10-year
planning horizon. In conversion from conventional to organic farming there is an increase in
the labour demand because of the more diverse crop rotation, greater amount of manual work
and general work during the organic production years. In conversion years seed onion, even
with the lower production area, requires 2-3 times more labour in the summer period than in
the conventional year. The new crop, sugar beet, also requires more labour. In organic years
next to carrot (which increases from 4 to 8 ha) seed potato is the most labour-intensive crop.
Both crops need the most labour during July and August due to mechanical weed control.
Figure 4.1 shows the skilled and unskilled labour requirements over the years. In
conversion years less skilled labour is needed for crops such as sugar beet, kidney bean and
spring wheat than in the conventional year. In organic years more, mainly unskilled, labour is
required by crops such as seed onion and carrot: around 320-340 hours and 250-280 hours per
fortnight in peak periods for seed onion and carrot, respectively. By adding up all the labour
needed in the summer period for all the crops grown, the total labour requirement is around
660-800 hours per fortnight (Figure 4.2). This means that in this period at least 7-8 additional
units of labour (one unit is 80 hours per fortnight) are needed, next to the family labour (158
hours per fortnight). By comparison, in the conventional production year only one additional
labour unit at most is required during the whole year of production.
82
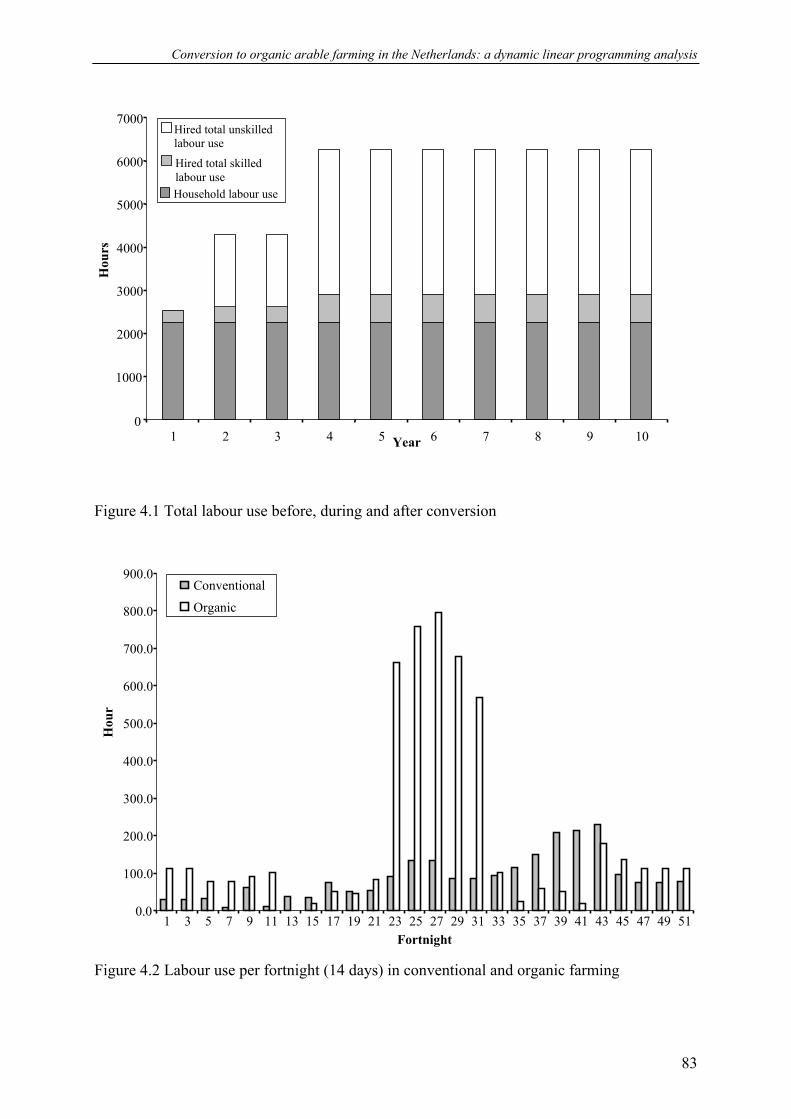
Conversion to organic arable farming in the Netherlands: a dynamic linear programming analysis
7000 Hired total unskilled labour use
83
Figure 4.1 Total labour use before, during and after conversion
Figure 4.2 Labour use per fortnight (14 days) in conventional and organic farming
0.0
100.0
200.0
300.0
400.0
500.0
600.0
700.0
800.0
900.0
1 3 5 7 9 11 13 15 17 19 21 23 25 27 29 31 33 35 37 39 41 43 45 47 49 51
Hou
r
Conventional
Organic
Fortnight
Year
Hou
rs
0
1000
2000
3000
4000
5000
6000 Hired total skilled labour use Household labour use
1 2 3 4 5 6 7 8 9 10
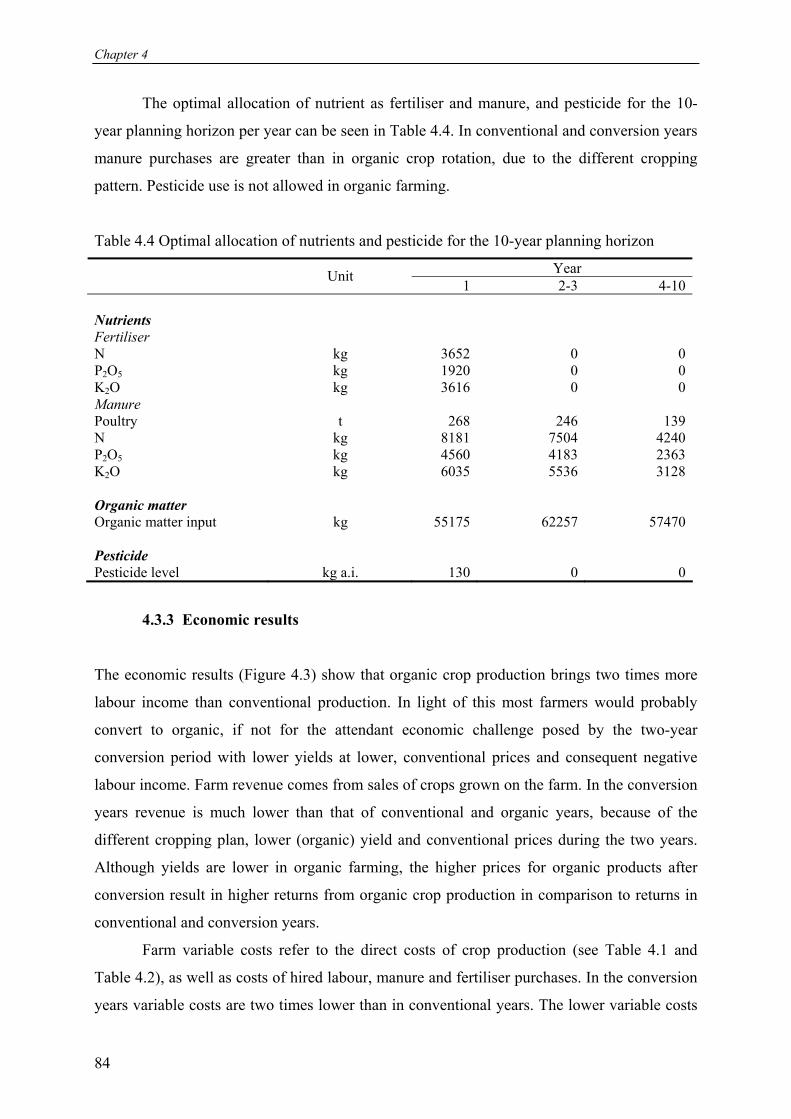
Chapter 4
The optimal allocation of nutrient as fertiliser and manure, and pesticide for the 10-
year planning horizon per year can be seen in Table 4.4. In conventional and conversion years
manure purchases are greater than in organic crop rotation, due to the different cropping
pattern. Pesticide use is not allowed in organic farming.
Table 4.4 Optimal allocation of nutrients and pesticide for the 10-year planning horizon
Year
Unit 1 2-3 4-10
Nutrients Fertiliser N kg 3652 0 0P2O5 kg 1920 0 0K2O kg 3616 0 0Manure Poultry t 268 246 139N kg 8181 7504 4240P2O5 kg 4560 4183 2363K2O kg 6035 5536 3128 Organic matter Organic matter input kg 55175 62257 57470 Pesticide Pesticide level kg a.i. 130 0 0
4.3.3 Economic results
The economic results (Figure 4.3) show that organic crop production brings two times more
labour income than conventional production. In light of this most farmers would probably
convert to organic, if not for the attendant economic challenge posed by the two-year
conversion period with lower yields at lower, conventional prices and consequent negative
labour income. Farm revenue comes from sales of crops grown on the farm. In the conversion
years revenue is much lower than that of conventional and organic years, because of the
different cropping plan, lower (organic) yield and conventional prices during the two years.
Although yields are lower in organic farming, the higher prices for organic products after
conversion result in higher returns from organic crop production in comparison to returns in
conventional and conversion years.
Farm variable costs refer to the direct costs of crop production (see Table 4.1 and
Table 4.2), as well as costs of hired labour, manure and fertiliser purchases. In the conversion
years variable costs are two times lower than in conventional years. The lower variable costs
84
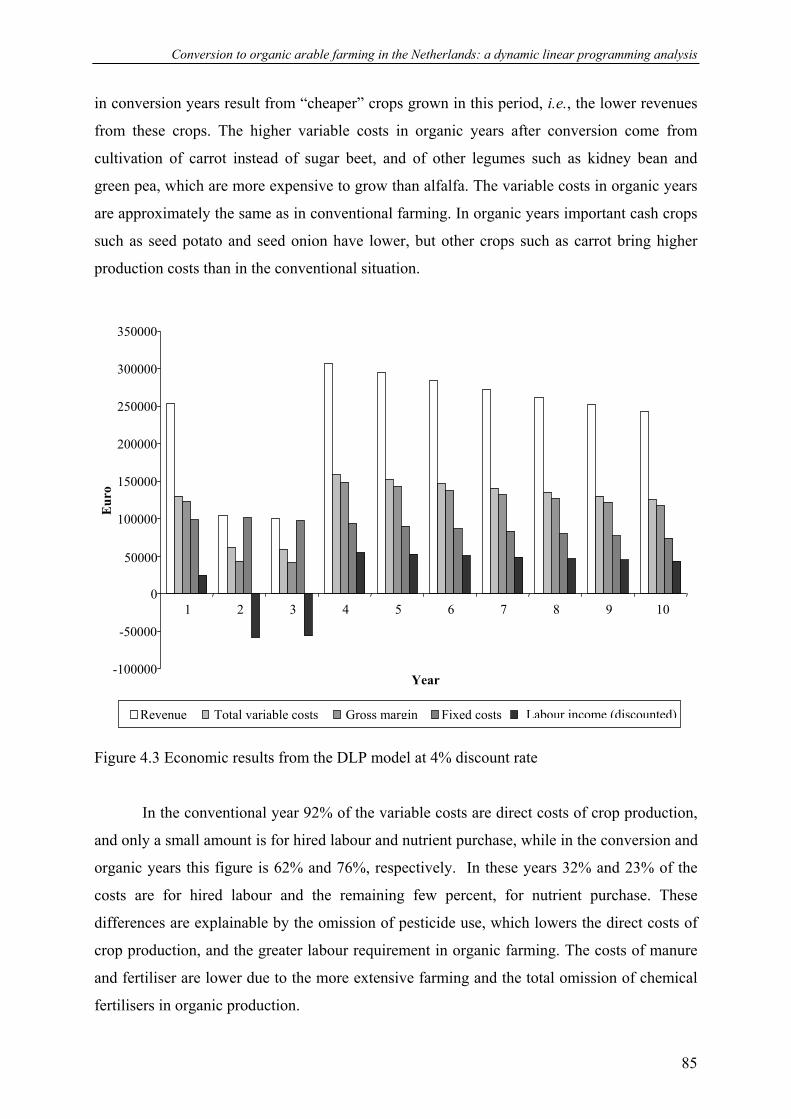
Conversion to organic arable farming in the Netherlands: a dynamic linear programming analysis
in conversion years result from “cheaper” crops grown in this period, i.e., the lower revenues
from these crops. The higher variable costs in organic years after conversion come from
cultivation of carrot instead of sugar beet, and of other legumes such as kidney bean and
green pea, which are more expensive to grow than alfalfa. The variable costs in organic years
are approximately the same as in conventional farming. In organic years important cash crops
such as seed potato and seed onion have lower, but other crops such as carrot bring higher
production costs than in the conventional situation.
350000
300000
250000
200000
150000
Eur
o
100000
50000
0 1 2 3 4 5 6 7 8 9 10
-50000
-100000 Year
Labour income (discounted)Revenue Total variable costs Gross margin Fixed costs
Figure 4.3 Economic results from the DLP model at 4% discount rate
In the conventional year 92% of the variable costs are direct costs of crop production,
and only a small amount is for hired labour and nutrient purchase, while in the conversion and
organic years this figure is 62% and 76%, respectively. In these years 32% and 23% of the
costs are for hired labour and the remaining few percent, for nutrient purchase. These
differences are explainable by the omission of pesticide use, which lowers the direct costs of
crop production, and the greater labour requirement in organic farming. The costs of manure
and fertiliser are lower due to the more extensive farming and the total omission of chemical
fertilisers in organic production.
85
Chapter 4
From the economic results the payback period for organic conversion (the time needed
to repay initial investments) (Barry et al., 2000), can be calculated. In this case it is the
number of years required to repay the costs of conversion by growing organically instead of
conventionally. In the current situation this period is 8 years from the moment of the switch to
organic farming.
4.3.4 Sensitivity analysis
Sensitivity analysis was used to determine the effects of four limiting factors on the basic
model results by means of parametric programming. In this analysis the break-even points,
whether the farm converts or not, and the type of conversion (partial or complete, and one-
step or stepwise) were determined. The main results can be seen in Table 4.5.
Table 4.5 Ranges in different types of conversion for four different situations Disinvestment Hired-labour limit Lower organic
price Minimum labour
income Break-even points % of conventional
fixed costs hour/fortnight % reduction Euro
Complete conversion (basic) 0 - 25% ≥ 400* 0 - 2% ≤ -20000**
Partial conversion - 160 - 400 - -20000 to 0** No conversion ≥ 25% 0 - 160 ≥ 2% ≥ 0
*cropping plan differs from the basic situation **stepwise conversion
The first limiting factor in the analysis is called “disinvestment”. Extra depreciation
was assumed to last for two years after the switch to organic farming. If the extra depreciation
cost is between 0-25% of the conventional fixed costs, then complete conversion takes place.
The results differ from the basic scenario only in the amount of discounted labour income,
which falls as extra depreciation costs rise. If the extra depreciation cost is higher than 25% of
the conventional fixed costs, then there is no conversion to organic farming. In the case of
conversion, only one-step and complete conversion takes place.
The second limiting factor in the analysis is called “hired-labour limit”. In this
scenario a restriction was put on hired-labour availability per fortnight in hours. The basic
scenario remains unchanged when the hired-labour availability is higher than 640
hours/fortnight, that is, 8 labour units (where 80 hours = 1 hired-labour unit). If more than 400
hours/fortnight hired labour available, then there is still total conversion to organic farming,
but in that case the cropping plan differs from the basic scenario. Celeriac is added to the
86

Conversion to organic arable farming in the Netherlands: a dynamic linear programming analysis
rotation, which taking a part of the area of seed onion. The latter requires more than twice as
much labour, especially during peak periods. If 160 to 400 hours/fortnight of hired labour
available, then there is partial conversion to organic farming (58-95% of the total cultivated
land area). The conversion and organic cropping plan differs from the basic scenario. In
conversion years, besides the current conversion crops, celeriac is added to the crop rotation.
This means less cultivation of seed onion, which is more labour intensive than celeriac. In
organic years instead of seed onion celeriac is cultivated. If there is 0-160 hours/fortnight
hired labour available then there is no conversion to organic farming. In the case of
conversion, it is one-step conversion.
The third limiting factor in the analysis is called “lower organic price”. In this scenario
the effects of the reduction of organic product prices are analysed. If the prices for all organic
products drop less than 2%, then there is still total conversion to organic farming. The results
are the same as in the basic scenario; only the revenues are lower for organic products. If the
prices for all organic products drop more than 2%, then there is no conversion to organic
farming. In the case of conversion, it is one-step conversion. Partial conversion is not an
optimal solution for any level of organic price reduction.
60area converted in 4-5 year area converted in 2-3 year 50
Are
a co
nver
ted
(ha)
40
30
20
10
0 0 -70000 -60000 -50000 -40000 -30000 -20000 -10000
Minimum labour income requirement (Euro/year)
Figure 4.4 Effect of minimum labour income requirement on conversion
The fourth limiting factor in the analysis is called “minimum labour income”. In this
scenario a minimum constraint was put on the minimum labour income requirement. If the
labour income is lower than -20000 Euro/year then there is complete conversion to organic
87

Chapter 4
farming. If the minimum labour income requirement is higher than -20000 but lower than 0
Euro/year, then there is partial conversion to organic farming (92% of the total cultivated land
area). If it is higher than 0 Euro/year then there is no conversion to organic farming. In the
case of conversion, it is stepwise conversion. Figure 4.4 shows the area converted in the 2nd-
3rd years and 4th-5th years for each minimum labour income requirement level. In all these
cases the cropping plan remains the same and proportional to the basic scenario.
4.4 Discussion and conclusion
This study is based on a typical farm characteristic of the central clay region of the
Netherlands. The study illustrates by using DLP model how a conversion from conventional
to organic farming could occur. The results of the analysis of the basic scenario show that, in
the long run, conversion to organic farming is more profitable. However, in order to get this
higher income the farmer has to “survive” the economically difficult two-year conversion
period of lower yields and conventional prices.
If additional constraints are included in the analysis, conversion to organic farming is
not always economically optimal. The results of the analysis show that extra depreciation
costs lower the labour income during the conversion period. If these costs are high enough
(>25%), conversion becomes less profitable than conventional farming. The availability of
hired labour has a strong effect on the cropping plan and the area converted. This means that
the regional labour supply should be taken into account in decisions on conversion to organic
farming. The model is quite sensitive to organic price changes. A slight drop in prices (>2%)
makes conversion less profitable than conventional farming. A constraint on the minimum
labour income requirement suggests that stepwise conversion is best to overcome the
economic difficulties of the conversion period.
The model is based largely on average empirical data, and incorporates only specific
average production technology, which, in reality, can differ among farms, which might obtain
different prices, costs, yields, and incomes. The most profitable rotations change as the prices
of crops and inputs change, and this could also influence a decision on conversion to organic
farming. The analyses of such parameter changes however lie beyond the scope of this study.
Further, this modelling approach involves approximations and assumptions. For
instance, yields, costs and resource requirements for organic crop rotations during a
conversion period can only be estimated, because experience is limited. In our study we used
88

Conversion to organic arable farming in the Netherlands: a dynamic linear programming analysis
organic yields, costs and resource requirements for conversion years. Further studies should
be done analysing the effect of yield loss and its change over time during and after the
conversion period. Nutrient requirements during the conversion phase were also assumed to
be the same as for organic years, but a farmer could incur higher costs during conversion, for
example, for additional weed-control cultivation, and this would further decrease profits
during the conversion years.
The planning horizon was arbitrarily set to 10 years. A period of 20 years could be
argued for example if the farmer who has to decide would be of the age of around forty and
would want to stay in business for some 20 years. Additional calculations with a time horizon
of 20 years do not result in a change of the optimal cropping plan. However, the economic
consequence of using a longer time horizon shows a large increase in the difference between
the discounted labour income from conversion and from staying conventional. The difference
increases from 45,239 Euro for a 10 years time horizon to 256,658 Euro for a 20 years time
horizon. Also the sensitivity analysis is influenced by the time horizon. Prices of organic
products, for example, could be 6.5% lower in stead of 2% for a 10 years horizon before the
optimal decision would be to stay conventional. An important argument against a longer time
horizon is the increasing uncertainty about future supply and demand of both conventional
and organic products and about the consequential product prices. Not every farmer would
want to base the decision to convert on expectations about product prices using a 20 years
time horizon.
Nevertheless, the conversion to organic farming has a positive economic result in the
basic scenario of the model. After the inclusion of additional constraints such as extra
depreciation costs or lower prices for organic products however, conversion from
conventional to organic farming does become less attractive. In this situation governmental
incentives (e.g., taxes on chemical use, subsidies to organic production, investment subsidies
for machinery and buildings, tax benefits or income support during the conversion period)
might be helpful to motivate farmers to convert. The DLP model developed here could be
useful in future investigations of the effects of different economic incentives.
89
Chapter 4
References
Acs, S., Berentsen, P.B.M. and Huirne, R.B.M., 2005. Modelling conventional and organic
farming, a literature review. Wageningen Journal of Life Sciences, NJAS 53-1.
Acs, S., Berentsen, P.B.M., de Wolf, M., and Huirne, R.B.M., 2006. Comparison of
conventional and organic arable farming systems in the Netherlands by means of bio-
economic modelling. Accepted for publication in Biological Agriculture and
Horticulture.
Barry, P.J., Ellinger, P.N., Hopkin, J.A., Bake, C.B., 2000. Financial Management in
Agriculture. Sixth Edition, Interstate Publishers, INC., U.S.A, 678 p.
CAO, 2002. CAO Landbouw. Collectieve Arbeidsovereenkomst, 2002.
Dabbert, S., Madden, P., 1986. The transition to organic agriculture: A multi-year simulation
model of a Pennsylvania farm. American Journal of Alternative Agriculture. 1(13), p.
99-107.
De Wolf, M., De Wolf, P., 2004. Personal communication. Praktijkonderzoek Plant en
Omgeving, Lelystad.
Eltun, R., Korsæth, A., Nordheim, O., 2002. A comparison of environmental, soil fertility,
yield, and economical effects in six cropping systems based on an 8-year experiment
in Norway. Agriculture, Ecosystems & Environment, Vol. 90 (2), p. 155-168.
Hazell, P.B.R., Norton, R.D., 1986. Mathematical Programming for Economic Analysis in
Agriculture. Macmillan Publishing Company, New York.
KWIN 2002. Quantitative Information Handbook (In Dutch) (Kwantitatieve Informatie
Akkerbouw en Vollegrondsgroenteteelt. Praktijkonderzoek Plant en Omgeving) 2002,
Lelystad, The Netherlands.
MacRae, R., Hill, S., Mehuys, G., Henning, J., 1990. Farm-scale agronomic and economic
conversion from conventional to sustainable agriculture. Advances in Agronomy 43,
p. 155-198.
Mahoney P.R., Olson, K.D., Porter, P.M., Huggins, D.R., Perillo, C.A. and Kent Crookston,
R., 2004. Profitability of organic cropping systems in south-western Minnesota,
Renewable Agriculture and Food Systems 19 (1), 1, p. 35-46.
Parr, J.F., Papendick, R.I., and Youngberg, I.G., 1983. Organic farming in the United States:
Principles and perspectives. Agro-ecosystems 8, p. 183-201.
Power J.F., 1987, “Legumes: their potential role in agricultural production”, American
Journal of Alternative Agriculture 2 (2), p. 69-73.
90
Conversion to organic arable farming in the Netherlands: a dynamic linear programming analysis
Schoorlemmer, H.B., Krikke, A.T., 1997. Bedrijfsbegroten in de akkerbouw en de
vollegrondsgroenteteelt. Publicatie nr. 84. PAGV, Lelystad.
Wijnands, F.G. and Dekking, A.J.G., 2002a. Biologische akkerbouw, centrale zeeklei. PPO-
Bedrijfssystemen – 2002, no 1. PPO, Lelystad.
Wijnands, F.G. and Dekking, A.J., 2002b. Geïntegreerde akkerbouw, centrale zeeklei. PPO-
Bedrijfssystemen 2002, no 4. PPO, Lelystad.
Yussefi, M. and Willer, H., 2002. Organic Agriculture Worldwide 2002: Statistics and Future
Prospects. SÖL (Foundation of Ecology and Agriculture), Bad Dürkheim, 157pp.
91

92

93
Chapter 5
Effect of yield and price uncertainty on conversion from conventional to organic farming
S. Acs1, P.B.M. Berentsen1 and R.B.M. Huirne1,2
1 Business Economics, Department of Social Sciences, Wageningen University, Wageningen
2 Animal Sciences Group, Lelystad
Submitted to American Journal of Agricultural Economics
Chapter 5
Abstract
Although the benefits of organic farming are already well know, the conversion to organic
farming does not proceed as the Dutch government expected. In order to investigate the
conversion decisions of Dutch arable farms a discrete stochastic dynamic utility-efficiency
programming (DUEP) model is developed with special attention for yield and price risk of
conventional, conversion and organic crops. The model maximizes the expected utility of the
farmer depending on the farmers’ risk attitude. The DUEP model is based on a previously
developed dynamic linear programming (DLP) model that maximized the labour income of
conversion from conventional to organic farming over a ten-year planning horizon. The
DUEP model was used to model a typical farm for the central clay region in the Netherlands.
The results show, that for a risk-neutral farmer it is optimal to convert to organic farming.
However, for a risk-averse farmer it is only optimal to convert if policy incentives are applied
such as taxes on pesticides or subsidies on conversion, or if the market for the organic
products gets more stable.
94

Effect of yield and price uncertainty on conversion from conventional to organic farming
5.1 Introduction
Increased consumer awareness of food safety issues and environmental concerns in Europe
has contributed to the growth of organic farming over the last few decades. However, the
overall significance of organic farming in the European context is still quite small in terms of
land area used. In 2002 it represented slightly more than 3 percent of the total EU utilised
agricultural area (UAA) (Lampkin, 2002). In some Member States, such as in the
Netherlands, the rapid growth in the nineties has slowed down after the end of the century.
The desired target of five percent organic area of the UAA in 2005, set by the Dutch
government in 2000, was not reached. It was only 2.47 percent (Eurostat, 2006). However, the
target of ten percent by 2010 still remains (MINLNV, 2005). In order to reach the target more
insight is needed into factors which hamper and stimulate the conversion of farms.
Previous studies showed that organic arable farms can achieve very similar or even
higher income levels than comparable conventional farms. (Langley et al., 1983; Offermann
& Nieberg, 2000; Morris et al., 2001; Acs et al., 2006a; Acs et al., 2006b). These results
cannot explain the stagnation of conversion over the last years. An aspect that needs more
attention in the models is uncertainty concerning yields and prices, which poses a risk to
farmers. Furthermore, it has been common to assume, often implicitly, that decision makers
are indifferent to risk and uncertainty. However, assuming no risk aversion seems to be not
the best option when it is well known that risk aversion is widespread (Hardaker et al., 2004).
Some studies suggest that the main sources of risk for both conventional and organic
farmers are the output price and production risk (Martin, 1996; Harwood et al., 1999;
Meuwissen et al., 2001). In arable farming in the Netherlands there is a large variation
between the years in crops’ gross margin of conventional, conversion and organic crops (LEI,
2004). This is mainly caused by large revenue (yield and output price) variation across the
years. Differences in variation between conventional, conversion and organic crops are caused
mainly by different management practices (i.e. restrictions on pesticide use and fertilizer) and
by different market opportunities and prices for the products (Lampkin & Padel, 1994; Pannel
et al., 2000). This suggests that it is important to take into account the variation of revenue
while analysing the conversion to organic farming.
There is quite some literature on inclusion of risk in agricultural farm models
(Hardaker et al., 2004). To incorporate uncertainty in a mathematical programming model,
two frequently used modelling practices can be taken into account. One is quadratic risk
programming (QRP) and the other is utility-efficient programming (UEP) model. They both
95
Chapter 5
maximise expected income of a risk averse decision maker subject to a set of resource and
other constraints (Markowitz, 1952; Freund, 1956; Hardaker et al., 2004). The advantage of
QRP is that it requires only a vector of means and the variance-covariance matrix of the
revenues (depending on yields and prices) per unit of possible cropping activities. However,
the properties of QRP, such as the normality distribution assumption on crop related yields
and prices (net revenues), and the use of quadratic utility function are not necessarily
appropriate (Hardaker et al., 2004). In contrast, UEP, as a non-parametric method, is free of
distribution assumptions and includes the joint distribution of yield and prices by means of so-
called “states of nature” (specific combinations and probabilities of possible outcomes). In
contrast to QRP, in UEP a number of types of utility function can be incorporated. Utility-
efficient programming was applied by Flaten and Gudbrand (2006) on organic dairy farms but
the model was used to predict one year. In this paper the previously developed dynamic linear
programming model (Acs et al., 2006b) is extended with price and yield risk and a utility
maximizing objective function (i.e. dynamic utility-efficient programming model).
The objective of this paper is to describe the developed model and to apply it, to the
conversion process from conventional to organic farming, taking into account the risk of yield
and price variation before, during and after the conversion years.
The paper starts with the description of the model. Here the inclusion of risk in the
mathematical programming model, the general structure of the model, and the activities and
constraints are described. Next, the data and the set up of the calculations are presented. Then,
the results of the model for a basic situation are presented and analysed followed by a
sensitivity analysis for different factors. The paper ends, with a discussion on the method and
the results.
5.2 Method
5.2.1. Inclusion of risk in a mathematical programming model
In order to include risk in a mathematical programming model, two issues have to be taken
into account: i) the uncertainty of the risky events, which can occur in the future; ii) the
attitude of the farmer towards these risky events. The uncertainty in the model is represented
by the probabilities of occurrence of each event. Each event represents a state of nature. The
attitude towards risk is expressed by an assumed utility function of the farmer.
96

Effect of yield and price uncertainty on conversion from conventional to organic farming
The arable farmer has the choice to stay conventional, to convert part of his land or
convert all the land to organic production. The conversion period takes two years. The farmer
can also choose to convert the land at once or step-wise (converting in parts). In the model
only one-way conversion is permitted. It is assumed that if once the farmer decides to convert
(a certain area) no backward conversion can take place.
When assuming certainty, one average state can be included in the model, as it was
done in the previous DLP model (Acs et al., 2006b). While including risky outcomes more
states should be taken into account. Each stage – conventional, conversion and organic – has
its own uncertainty. In the DUEP model, the states of nature are represented by the revenues
of crops for a number of individual years depending on crop yield and price for the particular
year. Each of the alternative states of nature occurs with a certain probability.
Most people are risk averse when faced with significantly risky incomes or wealth
outcomes (Hardaker et al., 2004). A person who is risk averse is willing to forgo some
expected income for a reduction in risk, the range of acceptable trade-off depending on how
risk averse that individual is. This trade-off can be included by converting expected income to
the utility of the individual, which means that his attitude towards risk is included. Conversion
of income to utility is done by using a utility function.
In utility-efficient programming, any convenient form of utility function can be used
to represent the farmers’ preferences (Patten et al., 1988). Preferences vary between farmers;
therefore, different assumptions can be used on their risk attitude in the range from risk
neutral to extreme risk aversion. The assumption of risk aversion requires a concave utility
function. In our analysis the common negative exponential function is used (Hardaker et al.,
2004): , where U is the utility of a certain person, Ra is the risk aversion
coefficient of that particular person and z is the labour income. Concavity of this function is
ensured, since, U’(z) > 0, and U”(z) < 0. This function exhibits constant absolute risk
aversion. This means that preferences between payoffs (labour income) are unchanged if a
constant amount is added to or subtracted from all payoffs.
zRaU *exp1 −−=
According to Anderson and Dillon (1992) the degree of risk aversion of any individual
with respect to wealth (w) may be characterized in terms of the relative risk aversion
coefficient. The coefficient of relative risk aversion can be calculated as
, where U”(w) and U’(w) represent the second and first derivatives,
respectively, of the utility function of a person with respect to wealth (U(w)) (Mas-Colell et
al., 1995). This means that the risk aversion is reflected by the curvature of the individual’s
( ) )('/)('' wUwwUwRr −=
97

Chapter 5
utility function. The relative risk aversion can be grouped as follows (Anderson and Dillon
1992):
Rr(w)=0, risk neutral;
Rr(w)=0.5, hardly risk averse at all;
Rr(w)=1.0, somewhat risk averse (normal);
Rr(w)=2.0, rather risk averse;
Rr(w)=3.0, very risk averse;
Rr(w)=4.0, extremely risk averse.
Since the utility function used includes the absolute risk aversion coefficient Ra, a
relationship is required between Ra(w) and Rr(w). Hardaker et al. (2004) showed that
Ra(w)=Rr(w)/w in which w is the wealth measure. Concerning the wealth measure w,
congruence is required between this measure and the consequences of the decision to be
analysed (Hardaker et al., 2004). This means that if the consequence of the decision is
measured in terms of farm income, some kind of standardised farm income should be used as
wealth measure w.
5.2.2. General structure of the model
The general structure of the dynamic utility-efficient programming model of the farm is
formulated as follows:
∑=S
ySySS RaCREVUpUMaxE ),,(][ , Ra varied S ∈[Sc, St, So] (1)
subject to:
yyy bxA ≤ (2)
0≥yx (3)
Where
E[U] – expected utility
S – states of nature; S ∈[Sc, St, So]
Sc – states of nature of conventional crops [Sc1, Sc2, …, Sc10]
St – states of nature of conversion (transition) crops [St1, St2]
98
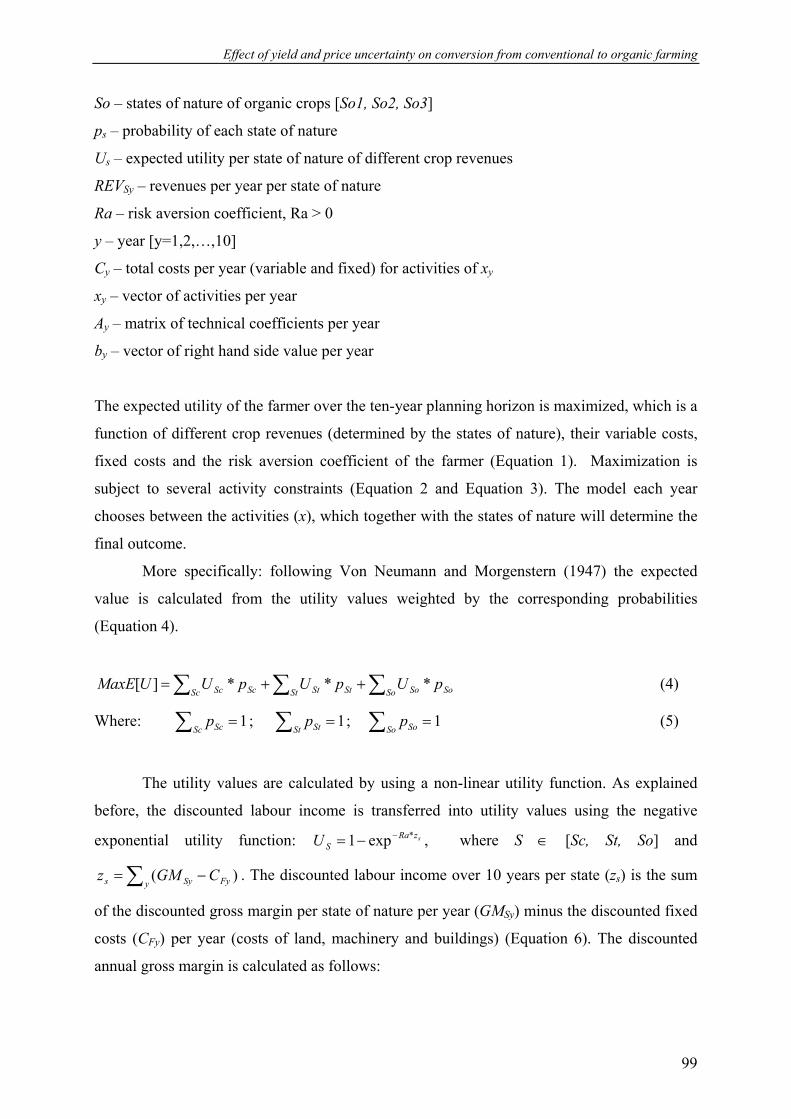
Effect of yield and price uncertainty on conversion from conventional to organic farming
So – states of nature of organic crops [So1, So2, So3]
ps – probability of each state of nature
Us – expected utility per state of nature of different crop revenues
REVSy – revenues per year per state of nature
Ra – risk aversion coefficient, Ra > 0
y – year [y=1,2,…,10]
Cy – total costs per year (variable and fixed) for activities of xy
xy – vector of activities per year
Ay – matrix of technical coefficients per year
by – vector of right hand side value per year
The expected utility of the farmer over the ten-year planning horizon is maximized, which is a
function of different crop revenues (determined by the states of nature), their variable costs,
fixed costs and the risk aversion coefficient of the farmer (Equation 1). Maximization is
subject to several activity constraints (Equation 2 and Equation 3). The model each year
chooses between the activities (x), which together with the states of nature will determine the
final outcome.
More specifically: following Von Neumann and Morgenstern (1947) the expected
value is calculated from the utility values weighted by the corresponding probabilities
(Equation 4).
SoSo SoStSt StScSc Sc pUpUpUUMaxE ***][ ∑∑∑ ++= (4)
Where: ∑ ; ; =Sc Scp 1 ∑ =
St Stp 1 ∑ =So Sop 1 (5)
The utility values are calculated by using a non-linear utility function. As explained
before, the discounted labour income is transferred into utility values using the negative
exponential utility function: , where S ∈ [Sc, St, So] and
. The discounted labour income over 10 years per state (z
szRaSU *exp1 −−=
∑ −=y FySys CGMz )( s) is the sum
of the discounted gross margin per state of nature per year (GMSy) minus the discounted fixed
costs (CFy) per year (costs of land, machinery and buildings) (Equation 6). The discounted
annual gross margin is calculated as follows:
99

Chapter 5
yL LyLySLy
Sy iLUSCREV
GM)1(
*)(+
−= ∑ ; S ∈ [Sc, St, So] (6)
Where: REVSLy – revenue per state of nature per crop per year; CLy – variable costs per crop
per year; LUSLy – land use system (cropping pattern) in hectare of each crop per year; L- crop
type; i – discount rate (4%). The choice of activities determinates the revenues and the costs
of farming. The revenues represent the discrete stochastic element in the model, which
depends on the chosen crops and the states of nature of each crop. Variable costs include crop
production costs (including costs of variable operations, pesticide use, energy use, contract
work, marketing costs and other remaining costs), costs of purchased nutrients (manure and
fertilisers), hired labour costs and nutrient taxes. The final production plan maximizes the
probability-weighted average of the utilities of the discounted labour income of the cropping
patterns over the ten years.
The matrix developed comprised 9845 activities and 11031 constraints. The model
was solved using GAMS programming language and SBB solver (Brooke et al. 1988).
5.2.3. Activities and constraints
The main groups of activities (x) in the model are:
• Crop activities:
Conventional: winter wheat, spring barley, ware potatoes, seed potatoes, sugar beet,
onion, and carrot;
Organic: winter wheat, spring barley, ware potatoes, seed potatoes, sugar beet, onion,
carrot, spring wheat, kidney bean, green pea, alfalfa celeriac, grass-clover;
Conversion: the same as organic crop activities with only difference that organic yields
and conventional prices are used.
• Hired labour. There is an opportunity to hire unlimited amount of skilled and unskilled
labour at any time of the year for 18 Euro/hour and 9 Euro/hour, respectively (CAO
2002).
• Manure and fertiliser purchase.
• Activities for calculating nutrient surplus, organic matter input and pesticides use.
100
Effect of yield and price uncertainty on conversion from conventional to organic farming
The main groups of constraints are:
• Land availability. A 48 ha farm size is assumed, which is an average farm size in the
central clay region in the Netherlands.
• Rotation restrictions. All the individual crops and groups of crops have their own rotation
constraints which are mainly based on agronomic reasons. For conventional production
1:3 crop rotation is used for the whole land area, which is characterising the region. For
conversion and organic production 1:6 crop rotation is used. This more diverse crop
rotation is a requirement for organic farming. More detailed information concerning crop
rotations can be found in Acs et al. (2006a).
• Conversion restrictions. Technical constrains concerning the dynamic aspect of the model.
The first year the model is restricted to produce only in conventional way. This restriction
was imposed in order to be able to compare the conventional production with the
conversion and organic production plan. From the second year the model can convert to
organic production. In case land goes into conversion, it will be in conversion for 2 years
to become organic land area. The model decides how much land goes from conventional
into conversion. In the model the conversion is restricted to one-way direction, so the
model excludes the possibility to convert back.
• Household labour constraint. The available amount of family labour is assumed to be 1,1
full-time labour (2255 hours per year), which is an average labour supply in this region for
48 ha land area (De Wolf & De Wolf, 2004). Family labour supply per period is assumed
to be constant over the year.
• Nutrient balance calculation for Dutch Mineral Accounting System (MINAS) regulation.
MINAS calculates a nutrient balance at farm level per hectare. Above the acceptable level
(100 kg N and 25 kg P2O5 per hectare in year 2002) the farmer has to pay a levy in Euro
kg-1 of unacceptable surplus, which is 2,3 Euro kg-1 in the case of nitrogen and 9 Euro kg-1
in the case of phosphate (MANMF, 2004).
• Maximum manure input restriction for Manure Transfer Agreement System (MTAS)
regulation. MTAS sets a limit to the amount of manure that can be used on the farm. This
limit is based on nitrogen (N) content which is 170 kg N from manure per ha.
• Several counting rows for pesticides use and organic matter input to the farm
101
Chapter 5
102
5.2.4. Data
Regarding crop revenues, based on available data, in our model ten states of nature were used
for conventional crops (see Table 5.1), two for conversion (see Table 5.2) and three for
organic crops (see Table 5.3). Each state has the same probability to occur: psc=0.1 for
conventional, pst=0.5 for conversion and pso=0.333 for organic states of nature.
The data were obtained from the Farm Accounting Data Network (FADN) dataset
from Agricultural Economics Research Institute (LEI) in the Netherlands. FADN data is a
unique panel dataset, which includes crop-level information per farm. Data consists of yields
and product prices over 300-400 farms per year for conventional crops, 80 farms for
conversion and 32 farms for organic crops. Because prices and yields tend to change over
time in a more or less consistent and predictable way, they were de-trended to account for
inflation and technical progress (Barry et al., 2000), with 2002 as the base year, just as in Acs
et al. (2006b). This makes it possible to compare the outcome of results of Acs et al. (2006b)
with the results of this paper. Prices were corrected for inflation by using the inflation index
of prices (CBS, 2005). To account for technical progress crop yields were corrected for trend.
The means and the standard deviations of these crop revenues observations were calculated
(see Tables 5.1, 5.2 and 5.3). The mean and the standard deviations of this historical data
were adjusted to the year 2002 while preserving the correlations and other stochastic
dependencies embodied in the original information.
Regarding variable costs of crops, data was obtained from Quantitative Information
Handbook (KWIN, 2002). Fix costs for conventional and organic farms were calculated from
the results of real farms (Wijnands & Dekking, 2002). The direct costs (variable costs without
nutrient and labour costs), labour and nutrient requirement per crop are summarized in Table
5.4. Detailed information about these input data and about fixed costs, crop rotation,
household labour use and organic matter input can be found in Acs et al. (2006a and 2006b).
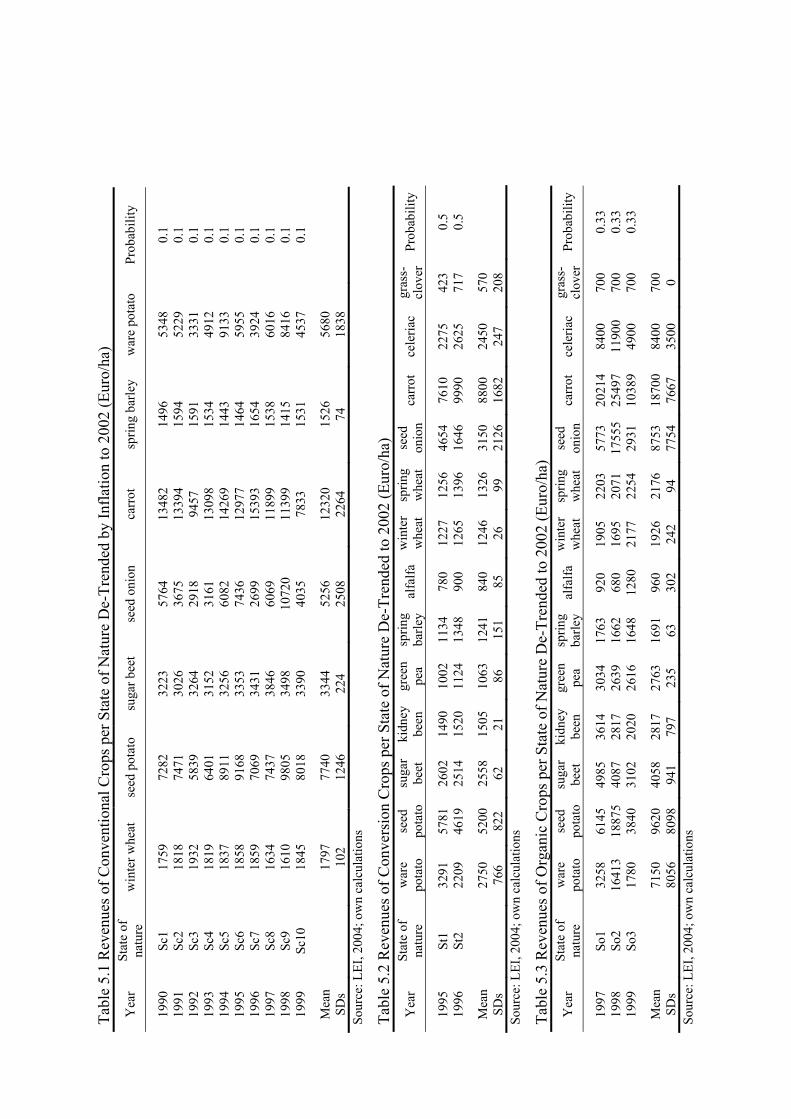
Tabl
e 5.
1 R
even
ues o
f Con
vent
iona
l Cro
ps p
er S
tate
of N
atur
e D
e-Tr
ende
d by
Infla
tion
to 2
002
(Eur
o/ha
) Y
ear
Stat
e of
na
ture
w
inte
r whe
at
seed
pot
ato
suga
r bee
t se
ed o
nion
ca
rrot
sp
ring
barle
y w
are
pota
to
Prob
abili
ty
1990
Sc1
1759
7282
3223
5764
1348
214
9653
480.
119
91Sc
218
1874
7130
2636
7513
394
1594
5229
0.1
1992
Sc3
1932
5839
3264
2918
9457
1591
3331
0.1
1993
Sc4
1819
6401
3152
3161
1309
815
3449
120.
119
94Sc
518
3789
1132
5660
8214
269
1443
9133
0.1
1995
Sc6
1858
9168
3353
7436
1297
714
6459
550.
119
96Sc
718
5970
6934
3126
9915
393
1654
3924
0.1
1997
Sc8
1634
7437
3846
6069
1189
915
3860
160.
119
98Sc
916
1098
0534
9810
720
1139
914
1584
160.
119
99Sc
1018
4580
1833
9040
3578
3315
3145
370.
1
Mea
n17
9777
4033
4452
5612
320
1526
5680
SDs
102
1246
224
2508
2264
7418
38So
urce
: LEI
, 200
4; o
wn
calc
ulat
ions
Ta
ble
5.2
Rev
enue
s of C
onve
rsio
n C
rops
per
Sta
te o
f Nat
ure
De-
Tren
ded
to 2
002
(Eur
o/ha
) Y
ear
Stat
e of
na
ture
w
are
pota
to
seed
po
tato
su
gar
beet
ki
dney
be
en
gree
n pe
a sp
ring
barle
y al
falfa
w
inte
r w
heat
sp
ring
whe
at
seed
on
ion
carr
ot
ce
leria
cgr
ass-
clov
er
Prob
abili
ty
1995
St1
3291
5781
2602
1490
1002
1134
780
1227
1256
4654
7610
2275
423
0.5
1996
St2
2209
4619
2514
1520
1124
1348
900
1265
1396
1646
9990
2625
717
0.5
Mea
n27
5052
0025
5815
0510
6312
4184
012
4613
2631
5088
0024
5057
0SD
s76
682
262
2186
151
8526
9921
2616
8224
720
8So
urce
: LEI
, 200
4; o
wn
calc
ulat
ions
Ta
ble
5.3
Rev
enue
s of O
rgan
ic C
rops
per
Sta
te o
f Nat
ure
De-
Tren
ded
to 2
002
(Eur
o/ha
) Y
ear
Stat
e of
na
ture
w
are
pota
to
seed
po
tato
su
gar
beet
ki
dney
be
en
gree
n pe
a sp
ring
barle
y al
falfa
w
inte
r w
heat
sp
ring
whe
at
seed
on
ion
carr
ot
ce
leria
cgr
ass-
clov
er
Prob
abili
ty
1997
So1
3258
6145
4985
3614
3034
1763
920
1905
2203
5773
2021
484
0070
00.
3319
98So
216
413
1887
540
8728
1726
3916
6268
016
9520
7117
555
2549
711
900
700
0.33
1999
So3
1780
3840
3102
2020
2616
1648
1280
2177
2254
2931
1038
949
0070
00.
33
Mea
n71
5096
2040
5828
1727
6316
9196
019
2621
7687
5318
700
8400
700
SDs
8056
8098
941
797
235
6330
224
294
7754
7667
3500
0So
urce
: LEI
, 200
4; o
wn
calc
ulat
ions
10
3
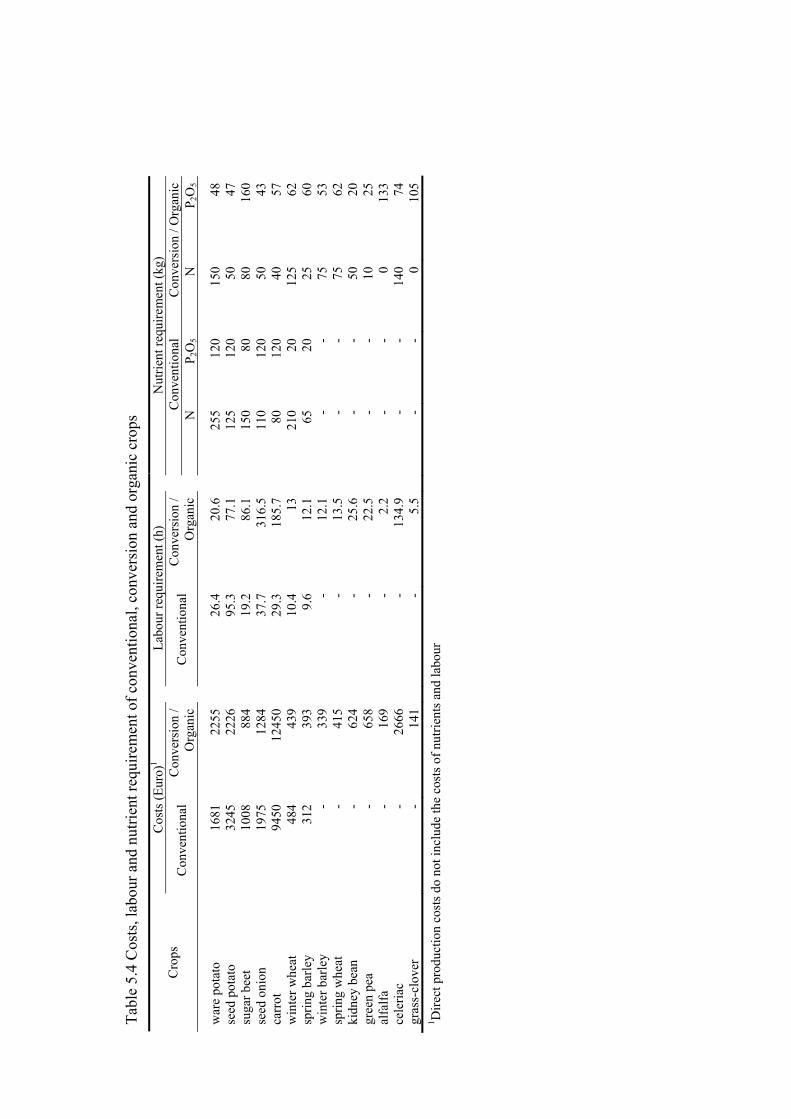
Tabl
e 5.
4 C
osts
, lab
our a
nd n
utrie
nt re
quire
men
t of c
onve
ntio
nal,
conv
ersi
on a
nd o
rgan
ic c
rops
C
osts
(Eur
o)1
La
bour
requ
irem
ent (
h)
N
utrie
nt re
quire
men
t (kg
)
C
onve
ntio
nal
Con
vers
ion
/Org
anic
Cro
ps
Con
vent
iona
l C
onve
rsio
n /
Org
anic
Con
vent
iona
l C
onve
rsio
n /
Org
anic
N
P 2O
5N
P 2
O5
war
e po
tato
1681
2255
26.4
20.6
255
120
150
48se
ed p
otat
o 32
4522
2695
.377
.112
512
050
47su
gar b
eet
1008
884
19.2
86.1
150
8080
160
seed
oni
on
1975
1284
37.7
316.
511
012
050
43ca
rrot
9450
1245
0 29
.318
5.7
8012
040
57w
inte
r whe
at48
4 43
9 10
.413
210
2012
562
sprin
g ba
rley
312
393
9.6
12.1
6520
2560
win
ter b
arle
y -
339
-12
.1-
-75
53sp
ring
whe
at -
415
-13
.5-
-75
62ki
dney
bea
n -
624
-25
.6-
-50
20gr
een
pea
-
658
-22
.5-
-10
25al
falfa
- 16
9 -
2.2
--
013
3ce
leria
c-
2666
-13
4.9
--
140
74gr
ass-
clov
er-
141
-5.
5-
-0
105
1 Dire
ct p
rodu
ctio
n co
sts d
o no
t inc
lude
the
cost
s of n
utrie
nts a
nd la
bour
10
4

Effect of yield and price uncertainty on conversion from conventional to organic farming
For the calculation of the absolute risk aversion coefficient (Ra), by means of formula:
, maximized labour income over 10 years planning horizon is used from
DLP model results (Acs et al., 2006b). In the basic DLP, model the maximized discounted
labour income was 206503 Euro for conventional farming and 251724 Euro for converted
organic farm (Acs et al., 2006b). As shown before the relative risk aversion coefficient (Rr)
can take the range between 0-4. In our analysis, the conventional optimized discounted labour
income is taken as a base for the calculation of absolute risk aversion for the range from 0 to 4
of relative risk aversion. This means that the corresponding absolute risk aversion coefficient
can take values between 0 and 0.000019.
wwRrzRa /)()( =
5.2.5. Setup of calculations
Due to differences between farmers concerning their attitude towards risk, in our analysis,
first, the whole range of risk aversion is investigated. The solutions are obtained by stepwise
variation in risk aversion coefficient (Ra). Next, In the sensitivity analysis, the effect on
conversion of policy incentives, market stabilisation and of learning are analysed. In this
sensitivity analysis the focus is on a somewhat risk averse person (with Rr=1), which
according to Anderson and Dillon (1992) is the risk attitude of a ‘normal’ person.
Policy incentives
The first policy incentive is a tax on pesticides. The amount of pesticides used for the
protection against weeds, pest and diseases is calculated in active ingredients (a.i.), which is
the weight of the toxic substance in the applied product in kilograms. Pesticides are used only
for conventional crops, since the use of synthetic chemical inputs in organic farming is not
allowed. This gives an option to imposing a tax on pesticide use in order to stimulate the
farmers to convert to organic production. The amount of pesticides used for each crop activity
is fixed in the model (i.e. it does not allow to use less pesticide which could have an affect on
the output results). The model does not adapt to the changes in pesticide use. In this analysis
the minimum amount of tax (in Euro/kg a.i.) necessary for conversion is determined.
Another option to stimulate conversion to organic farming is by using subsidies on
organic production. Subsidies can take different form: i) subsidy at once, at the beginning of
the conversion period; ii) conversion subsidies, given only during the conversion period
which would serve as a compensation for switching costs (i.e. costs of
investment/disinvestment, learning costs, lower revenues during this period); iii) subsidies for
105

Chapter 5
all organically produced crops starting from conversion years. All of these are hectare-based
subsidies for the area converted. The minimum amount of subsidy required to convert is
determined by the DUEP-model.
Market stabilization
In this analysis, we explore how the conversion would take place if the market for organic
products would be more stable. It means less fluctuation in prices. From modelling point of
view it means that the variation of organic crop revenues will decrease with a certain
percentage after the conversion years. In our sensitivity analysis, we explore how much this
decrease of the revenue variation should be before it is optimal for the farmer to convert to
organic production.
Learning effect
During the conversion years, the farmer has to learn organic production practices. After a few
years of experience the organic crops might give higher and more stable yield. In this
scenario, this effect is investigated by raising the mean and decreasing the variance of organic
crop revenues from the fourth year. The mean is assumed to rise by five percent and stay at
this higher level the following years, and the percentage reduction in variance that is
necessary for conversion is calculated.
5.3 Results
5.3.1 Basic results of DUEP model
The results show that the degree of risk aversion has strong effect on the optimal decision of a
farmer to convert. While it is for the risk neutral farmer optimal to convert the whole area to
organic production, it is for a hardly-risk-averse farmer (Rr = 0.5) more optimal to stay
farming conventionally. In the case the farmer is even more risk averse (0.5 ≤ Rr ≤ 4.0) also
no conversion is optimal.
Table 5.5 summarizes the maximal labour income, the amount of area converted to
organic farming and the optimal cropping plan with different degree of risk aversion
coefficients. Just for illustration purposes, three degrees of risk aversion are chosen to show
106
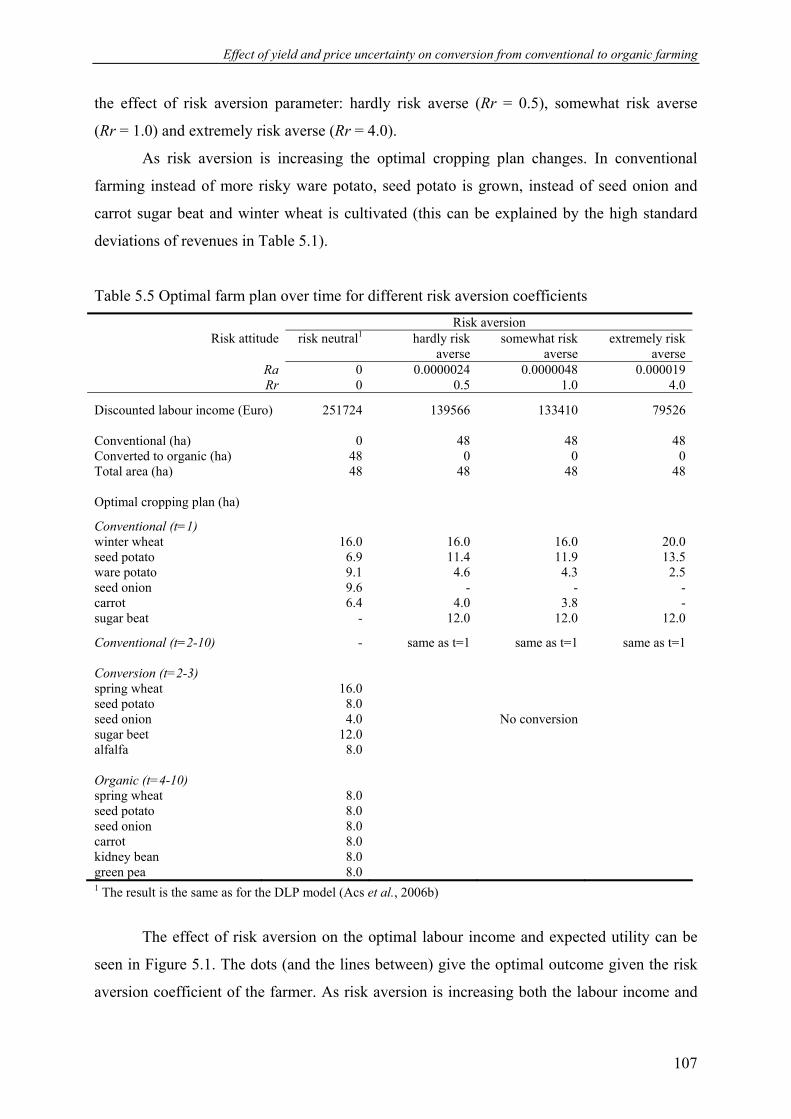
Effect of yield and price uncertainty on conversion from conventional to organic farming
the effect of risk aversion parameter: hardly risk averse (Rr = 0.5), somewhat risk averse
(Rr = 1.0) and extremely risk averse (Rr = 4.0).
As risk aversion is increasing the optimal cropping plan changes. In conventional
farming instead of more risky ware potato, seed potato is grown, instead of seed onion and
carrot sugar beat and winter wheat is cultivated (this can be explained by the high standard
deviations of revenues in Table 5.1).
Table 5.5 Optimal farm plan over time for different risk aversion coefficients Risk aversion
Risk attitude risk neutral1 hardly risk averse
somewhat risk averse
extremely risk averse
Ra 0 0.0000024 0.0000048 0.000019 Rr 0 0.5 1.0 4.0
Discounted labour income (Euro) 251724 139566 133410 79526 Conventional (ha) 0 48 48 48 Converted to organic (ha) 48 0 0 0 Total area (ha) 48 48 48 48 Optimal cropping plan (ha)
Conventional (t=1) winter wheat 16.0 16.0 16.0 20.0 seed potato 6.9 11.4 11.9 13.5 ware potato 9.1 4.6 4.3 2.5 seed onion 9.6 - - - carrot 6.4 4.0 3.8 - sugar beat - 12.0 12.0 12.0
Conventional (t=2-10) - same as t=1 same as t=1 same as t=1 Conversion (t=2-3) spring wheat 16.0 seed potato 8.0 seed onion 4.0 No conversion sugar beet 12.0 alfalfa 8.0 Organic (t=4-10) spring wheat 8.0 seed potato 8.0 seed onion 8.0 carrot 8.0 kidney bean 8.0 green pea 8.0
1 The result is the same as for the DLP model (Acs et al., 2006b)
The effect of risk aversion on the optimal labour income and expected utility can be
seen in Figure 5.1. The dots (and the lines between) give the optimal outcome given the risk
aversion coefficient of the farmer. As risk aversion is increasing both the labour income and
107

Chapter 5
the expected utility of the farmer is decreasing. It means that the more risk averse the farmer
is the more he is satisfied with lower but more certain income. If the farmer is more risk
averse the same labour income gives him lower expected utility as it can also be seen from the
figure.
300000 1.2
Dis
coun
ted
labo
ur in
com
e (E
uro)
250000 1
200000 0.8 E[U]
150000 0.6
100000 0.4 Discounted labourincome (Euro)50000 0.2 E[U]
0 0 0 0.5 1.0 2.0 3.0 4.0
Relative risk aversion (Rr)
Figure 5.1 Effect of risk aversion on the optimal discounted labour income and expected
utility
5.3.2 Sensitivity analysis
The basic outcome of the DUEP model shows that the no conversion takes place when risk is
included. In the sensitivity analysis, different policy incentives and the effect of market
stabilization and of learning are examined for a person with somewhat risk averse attitude
(Rr = 1).
108
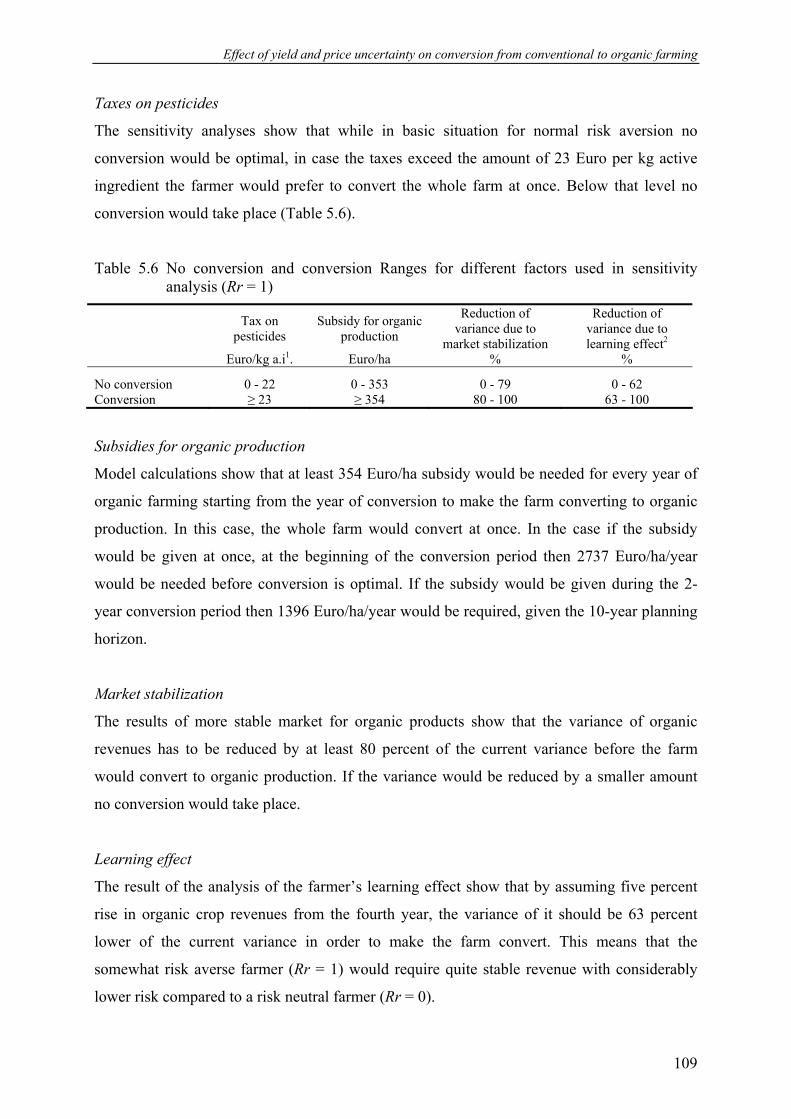
Effect of yield and price uncertainty on conversion from conventional to organic farming
Taxes on pesticides
The sensitivity analyses show that while in basic situation for normal risk aversion no
conversion would be optimal, in case the taxes exceed the amount of 23 Euro per kg active
ingredient the farmer would prefer to convert the whole farm at once. Below that level no
conversion would take place (Table 5.6).
Table 5.6 No conversion and conversion Ranges for different factors used in sensitivity analysis (Rr = 1)
Tax on pesticides
Subsidy for organic production
Reduction of variance due to
market stabilization
Reduction of variance due to learning effect2
Euro/kg a.i1. Euro/ha % %
No conversion 0 - 22 0 - 353 0 - 79 0 - 62 Conversion ≥ 23 ≥ 354 80 - 100 63 - 100
Subsidies for organic production
Model calculations show that at least 354 Euro/ha subsidy would be needed for every year of
organic farming starting from the year of conversion to make the farm converting to organic
production. In this case, the whole farm would convert at once. In the case if the subsidy
would be given at once, at the beginning of the conversion period then 2737 Euro/ha/year
would be needed before conversion is optimal. If the subsidy would be given during the 2-
year conversion period then 1396 Euro/ha/year would be required, given the 10-year planning
horizon.
Market stabilization
The results of more stable market for organic products show that the variance of organic
revenues has to be reduced by at least 80 percent of the current variance before the farm
would convert to organic production. If the variance would be reduced by a smaller amount
no conversion would take place.
Learning effect
The result of the analysis of the farmer’s learning effect show that by assuming five percent
rise in organic crop revenues from the fourth year, the variance of it should be 63 percent
lower of the current variance in order to make the farm convert. This means that the
somewhat risk averse farmer (Rr = 1) would require quite stable revenue with considerably
lower risk compared to a risk neutral farmer (Rr = 0).
109

Chapter 5
5.4 Discussion and conclusion
The developed method is suitable to model the conversion from conventional to organic
farming including yield and price uncertainty of future conventional and organic crops. The
dynamic aspect and the inclusion of stochastic elements into the model is one of the
advantages of this modelling approach. This makes farm level analysis of conversion closer to
the real situation compared with static and deterministic models. The model can also be used
as a tool for policy makers to analyse the effect of certain incentives at farm level conversion.
However, the model strongly depends on the data available for use.
In this research, survey data were used for assessing risk. For conversion and organic
crop yields and prices there were only two and three year data observations available,
respectively. There are two implications of this lack of data availability. This questions the
reliability of the model results. More attention should be paid on survey data collection in the
future. Data availability is improving by collection and publication of data from organic
farming (FADN data collected by LEI, data from BIOM projects collected by PPO),
especially for established organic systems. However, more observations are needed also from
in-conversion farms in order to get more realistic model results.
The survey data used in this thesis concerning yield risk and also other evidence (Van
Bueren et al., 2002) showed that in organic farming the variance of crop yields is higher
compared to conventional farming. However, the conclusion that organic yields fluctuate
more than in conventional systems is not certainly a ‘fact’, there is also evidence in the
opposite direction (Lamkin & Padel, 1994). In the case organic farming would have more
stable yield, compared to conventional farming, a risk averse farmer would convert ‘easier’ to
organic production.
Calculations with the DLP model developed by Acs et al. (2006b) showed that one-
step conversion of the whole farm area would maximize net present value in 10 years. This
result is valid in the case when there is no risk aversion. When including risk aversion in the
DUEP model no conversion takes place. Moreover, the optimal (conventional) production
plan of the farm is affected. Other studies on inclusion of risk aversion into mathematical
modelling showed that the cost of ignoring risk aversion may be small in short-run (tactical)
decision problems in farming (Pannell et al., 2000; Lien and Hardaker, 2001; Flaten and Lien,
2006). Our results suggest that in considering risk aversion in the decision problems with a
longer planning horizon (strategic decisions for several years) the effect of risk aversion can
be considerable.
110
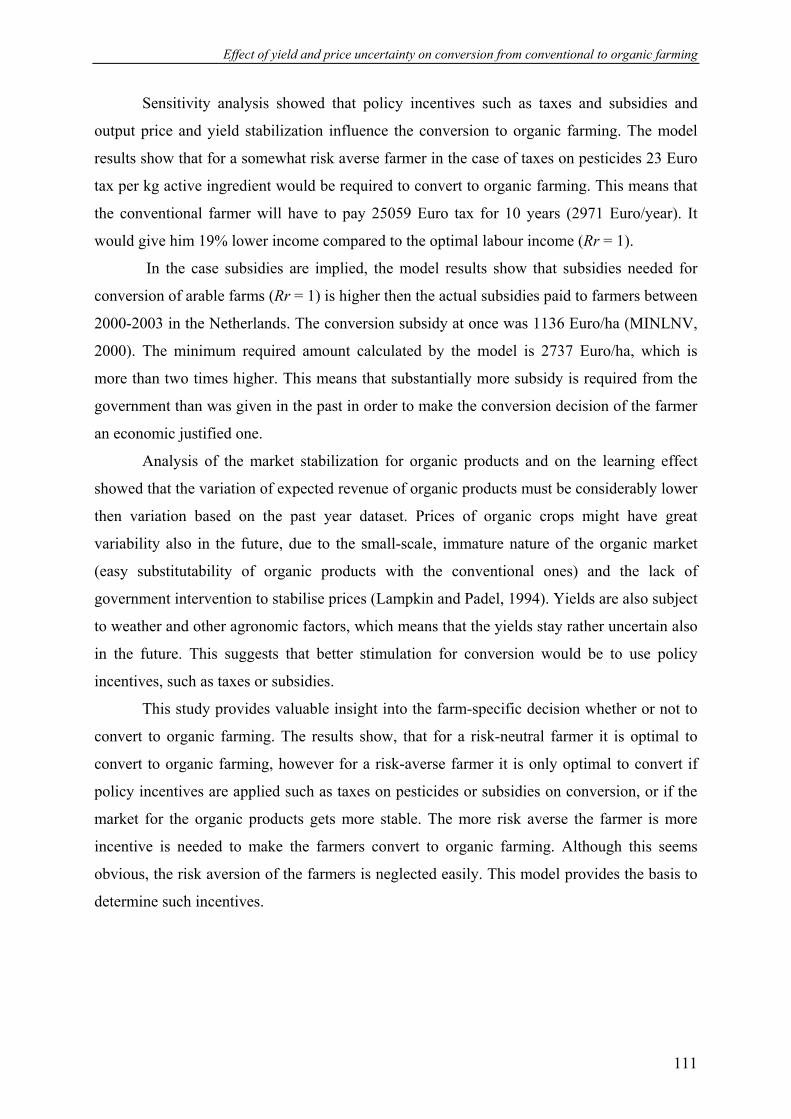
Effect of yield and price uncertainty on conversion from conventional to organic farming
Sensitivity analysis showed that policy incentives such as taxes and subsidies and
output price and yield stabilization influence the conversion to organic farming. The model
results show that for a somewhat risk averse farmer in the case of taxes on pesticides 23 Euro
tax per kg active ingredient would be required to convert to organic farming. This means that
the conventional farmer will have to pay 25059 Euro tax for 10 years (2971 Euro/year). It
would give him 19% lower income compared to the optimal labour income (Rr = 1).
In the case subsidies are implied, the model results show that subsidies needed for
conversion of arable farms (Rr = 1) is higher then the actual subsidies paid to farmers between
2000-2003 in the Netherlands. The conversion subsidy at once was 1136 Euro/ha (MINLNV,
2000). The minimum required amount calculated by the model is 2737 Euro/ha, which is
more than two times higher. This means that substantially more subsidy is required from the
government than was given in the past in order to make the conversion decision of the farmer
an economic justified one.
Analysis of the market stabilization for organic products and on the learning effect
showed that the variation of expected revenue of organic products must be considerably lower
then variation based on the past year dataset. Prices of organic crops might have great
variability also in the future, due to the small-scale, immature nature of the organic market
(easy substitutability of organic products with the conventional ones) and the lack of
government intervention to stabilise prices (Lampkin and Padel, 1994). Yields are also subject
to weather and other agronomic factors, which means that the yields stay rather uncertain also
in the future. This suggests that better stimulation for conversion would be to use policy
incentives, such as taxes or subsidies.
This study provides valuable insight into the farm-specific decision whether or not to
convert to organic farming. The results show, that for a risk-neutral farmer it is optimal to
convert to organic farming, however for a risk-averse farmer it is only optimal to convert if
policy incentives are applied such as taxes on pesticides or subsidies on conversion, or if the
market for the organic products gets more stable. The more risk averse the farmer is more
incentive is needed to make the farmers convert to organic farming. Although this seems
obvious, the risk aversion of the farmers is neglected easily. This model provides the basis to
determine such incentives.
111

Chapter 5
References
Acs, S., P.M.B. Berentsen and R.M.B. Huirne., 2006a. Comparison of Conventional and
Organic Arable Farming Systems in the Netherlands by means of Bio-Economic
Modelling. Accepted for publication in Biological Agriculture and Horticulture.
Acs, S., P.M.B. Berentsen and R.M.B. Huirne, 2006b. Modelling Conversion from
Conventional to Organic Arable Farming Systems in the Netherlands by means of
Dynamic Linear Programming. Submitted to Agricultural Systems.
Anderson, J.R. and J.L. Dillon, 1992. Risk Analysis in Dryland Farming Systems. Farm
Systems Management Series 2, FAO, Rome, p. 55.
Barry, P.J., P.N. Ellinger, C.B. Baker and J.A. Hopkin, 2000. Financial Management in
Agriculture Danville, Illinois: Interstate Publishers, Inc. Sixth Edition.
Brooke A., D. Kendrick and A. Meeraus, 1988. GAMS: A User’s Guide. The Scientific Press,
San Francisco, USA, 289 p.
CBS, 2005. Agricultural Economic Research Institute and Central Bureau of Statistics.
Agricultural Figures, several volumes (in Dutch). The Hague, 1993-2002.
Eurostat, 2006. European Commission, Eurostat. Accessed 8 February 2006.
<http://www.organic-europe.net/europe_eu/statistics.asp >
Flaten, O. and G. Lien. 2006. Stochastic Utility-Efficient Programming on Organic Dairy
Farms. European Journal of Operational Research (forthcoming).
Freund, R.L. 1956. The introduction of risk into a programming model. Econometrica 24, p.
253-263.
Hardaker, J. B., R.B.M. Huirne, J.R Anderson and G. Lien, 2004. Coping with risk in
agriculture, Second edition, Wallingford: CAB International, 332 p.
Harwood, J., R. Heifner, K. Coble, J. Perry and A. Somwaru, 1999. Managing risk in farming:
Concepts, research , and analysis. Economic Research Service, US Department of
Agriculture, Washington.
Lampkin, N.H. and S. Padel, 1994. The Economics of Organic Farming. An International
Perspective. CAB International, Wallinford, 454 p..
Lampkin, N., 2002. ‘Certified and Policy-Supported Organic and In-Conversion Land Area in
Europe, 1985-2002’. <http://www.organic.aber.ac.uk/statistics/euroarea03.htm>
Accessed 13 February 2006
112
Effect of yield and price uncertainty on conversion from conventional to organic farming
Langley, J.A, E.O. Heady and K. D. Olson, 1983. Macro implications of a complete
transformation of U.S. agricultural production to organic farming practices. Agriculture,
Ecosystems & Environment 10 (4), p. 323-333.
LEI, 2004. FADN-data for several years. Agricultural Economics Research Institute (LEI).
Lien, G. and J.B. Hardaker, 2001. Whole-farm planning under uncertainty: impacts of subsidy
scheme and utility function on portfolio choice in Norwegian agriculture, European
Review of Agricultural Economics 28 (1), p. 17-36.
KWIN, 2002. Quantitative Information Handbook (In Dutch) (Kwantitatieve Informatie
Akkerbouw en Vollegrondsgroenteteelt. Praktijkonderzoek Plant en Omgeving,
Lelystad.
Martin, S., 1996. Risk management strategies in New Zealand agriculture and horticulture.
Rev. Market. Agric. Econ. 64, p. 31-44.
Mas-Colell A., M.D. Whinston, and J.R.Green, 1995. Microeconomic Theory. New York:
Oxford University Press Inc., p 981.
Meuwissen, M.P.M., R.B.M. Huirne and J.B. Hardaker, 2001. Risk and risk management: An
empirical analysis of Dutch livestock farmers. Livestock Production Science 69, p. 43-
53.
MINLNV, 2005. Ministry of Agriculture, Nature and Food Quality (In Dutch) (Ministerie van
Landbouw, Natuur en Voedselkwaliteit. Persbericht ministerraad),
<www.minlnv.nl/persberichten>, Accessed 20.11.2005.
MINLNV, 2000. Change of regulation on stimulating organic production methods. (In Dutch)
(Wijziging Regeling stimulering biologische productiemethode) 17 september
2000/Nr.TRCJZ/2000/5181 Directie Juridische Zaken Staatscourant 20 september 2000,
nr. 182, p. 26.
Morris, C., Hopkins A. and Winter M., 2001. Comparison of the social, economic, and
environmental effects of organic, ICM and conventional framing. Final report to The
Countryside Agency, Institute of Grassland and Environmental Research. UK p 152.
Offermann F. and Nieberg, H., 2000. Economic performance of organic farms in Europe,
Organic farming in Europe: Economics and Policy, Volume 5, Stuttgart: Hohenheim.
Pannell, D.J., Malcolm, B. and Kingwell, R.S., 2000. Are we risking too much? Perspectives
on risk in farm modelling. Agricultural Economics 23, p. 69-78.
Patten, L.H., J.B. Hardaker and D.J. Pannell, 1988. Utility-efficient programming for whole-
farm planning. Australian Journal of Agricultural Economics 32, p. 122-136.
113
Chapter 5
Von Neumann, J. and O. Morgenstern, 1947. Theory of games and of economic behavior.
Princeton University Press, Princeton.
Wijnands, F.G. and A.J. Dekking, 2002. Integrated and Organic Farming. Central Clay
Region (In Dutch). Applied Plant Research (PPO-Bedrijfssystemen) – 2002, no 1. & no
4., PPO, Lelystad.
114
115
Chapter 6
General discussion

116
General Discussion
6.1 Introduction
The main objective of the research presented in this thesis was to gain insight into the
conversion decision of arable farms from conventional to organic production. The main
method used was (1) to develop a modelling approach that can be used for analyzing the
conversion from conventional to organic arable farming systems from an economic and
environmental point of view and (2) to determine the effects of influential factors and policies
on the choice of farmers to convert from conventional to organic farming systems. Three
questions were identified in this project:
1. Why do farmers not convert?
2. What are important influential factors with regard to conversion? What is the
magnitude of them?
3. What types of incentives can be useful?
The developed modelling approach was applied to the central clay region of the Netherlands.
This approach consisted of three phases. First, the conventional and organic farming systems
were compared from technical, economic and environmental point of view by using a static
linear programming (LP) model for each farming system. Second, in order to analyse the
conversion phase of the process a dynamic linear programming (DLP) model was developed
based on the two LP models. Third, to clarify the effect of production and price uncertainty of
crops and the effect of farmers risk attitude on the conversion process a dynamic utility-
efficient programming (DUEP) model was developed. Using these models the effect of
different influential factors and policy incentives on the conversion was determined.
This chapter discusses research issues and draws the main conclusions of the thesis. In
section 6.2 methodological issues with respect to farm level approach, the use of empirical
and normative modelling, with emphasis on static and dynamic linear programming and
dynamic utility-efficient programming models, and the problems concerning data availability
for modelling purposes are discussed. Section 6.3 discusses the model results. Section 6.4
focuses on policy implications. Finally, section 6.5 presents the main conclusions on
methodology and results achieved within this study.
117
Chapter 6
6.2 Methodological issues
6.2.1. Farm level approach
Analysing conversion from conventional to organic production system different levels of
analysis can be distinguished: field, farm and aggregated (sector, regional, national) level. In
this research farm level approach is preferred to field or aggregated level, since the purpose of
this research is on clarifying the influential factors on the decision making of farmers
concerning conversion. This requires investigation at farm level rather than an aggregated
level. Lampkin (1994) and Offerman and Nieberg (2000) argue that it is only a systems-level
comparison that is meaningful: in the context of comparing organic and conventional farming
systems the key issue is the difference in systems, not simply modifications in existing
practices. The philosophy behind organic farming considers a farming system as one coherent
whole rather then the sum of different components (soil, organic matter, plants, animals,
humane etc) (Lampkin & Padel, 1994). The diversity of farms with respect to their types (i.e.
arable, dairy) and specificity (i.e. soil type, size, intensity) and the difference in farmers’
attitude towards conversion also suggests analysis at farm level. This makes it possible to
show the effect of policies and other influential factors on the conversion, which are
important, especially, for farmers who are interested firstly in consequences of their own type
of farm. The main drawback for modelling at farm level is that market prices are exogenous in
the model. Compared to the aggregated level there is lack of mechanism that controls demand
and supply of inputs and outputs. Especially a large-scale conversion can have significant
effect on market prices of inputs and outputs. This would lead to drop of prices of organic
products, which would make the situation of already converted farmers worse of (see
Lampkin & Padel, 2004). This can effect the conversion decision of farmers and lead to
‘backward’ conversion due to lower relative prices compared to conventional ones.
6.2.2. Empirical vs. normative approach
When the relationship between agricultural production methods and economic and
environmental sustainability at the farm level is examined we can distinguish two main
categories of models: empirical and normative models. Empirical models are understood here
as econometric models, and normative models are mathematical optimization and simulation
118
General Discussion
models. The main difference lies in the purpose and the use of these models. Econometric
models are used for statistical testing of economic and/or technical relationships (Pindick &
Rubinfeld, 1998). Normative models are based on systems of equations and/or inequalities to
replicate farm-level activities related to production, marketing and finance and to explore the
effect of future changes (Hazell & Norton, 1986; Weersink et al., 2002). The advantage of
econometric models is its ability to aggregate from individual units to a large scale in a
statistically consistent manner; however, the disadvantage of these types of models is its
intensive data demand (Weersink et al., 2002). Moreover, these models are based on
historical data and cannot deal easily with new technologies or new types of policy. In
principle the conclusions based on such analyses are valid only for the period for which data
was collected (Falconer & Hodge, 2000). In contrast, normative models are able to capture
more detailed technical information and analyse the effects of new or even hypothetical
technologies and policies that makes them suitable for what-if analyses (Van Ittersum et al.,
1998). Beside this, in empirical models the behavioural relations are determined from the
data, while in normative models the behaviour is assumed by the modeller. Since the purpose
of this research is to investigate the conversion process from economic and environmental
point of view and analyse the possible policy incentives on conversion based on limited
availability of historical data a mathematical modelling approach was used. Several
constraints, variables and activities can be added to the model and the effect of these on the
conversion process can be analysed. In this study we focused on one specific farm type within
a certain region, but the model can be easily adapted also to other regions and farm specificity
(i.e. size, soil type).
6.2.3. The use of LP-, DLP- and DUEP -models
This research was focusing on the use of three mathematical modelling techniques: linear
programming (LP), dynamic linear programming (DLP) and discrete stochastic dynamic
utility-efficient programming (DUEP). All these models are mathematical optimization
models. Optimization is an important feature since the farmers usually want to maximize their
income, utility or minimize costs subject to several constraining factors (i.e. land, labour).
The LP modelling approach was chosen to compare established conventional and
organic farming systems in a steady state. These models capture detailed economic,
environmental and technical information about these two farming systems. In the developed
119
Chapter 6
two LP models the labour income of the farmer was maximized subject to farm specific
constraints and the results of these two models were compared from economic, environmental
and technical point of view. The steady state comparison, however, does not give a clear
picture on whether farmers would convert to organic production, since an important phase,
the transition period, is missing. The transition to organic farming is a long-term strategic
decision which usually implies a planning horizon of a decade or more (Dabbert et al., 2004).
This means that the time aspect plays an important role while analysing the conversion of
farms. The conversion period takes two years during which a farmer has to learn the new
production method and adopt his farm according to the new production requirements. There is
a possibility for partial or stepwise conversion, which give the farmers more time for adoption
and learning the new production method. This also allows farmers to produce conventional
products next to in-conversion products on part of their land to secure income to some extent
during the conversion years. By modelling over time it is possible to see in which year what
area of certain corps would be the best to produce from economic or/and environmental point
of view and how it would develop over the years. Another reason to include the time aspect is
that it gives the possibility to include different policy incentives, such as taxes and subsidies,
before, during and after the conversion period. In a dynamic model the effect of these
instruments on the conversion of farms can be analysed. For these reasons a DLP modelling
approach was used to investigate the process of conversion and the effect of several
constraining factors on the conversion of farms. The model maximized the discounted labour
income of the farmer over a ten-year planning horizon.
From several studies it appears that farmers also include risk considerations in the
decision whether or not to convert to organic production (Lampkin and Padel, 1994). To
include risk a DUEP approach was used. This model incorporates the risk attitude of farmers
towards the stochastic nature of yields and prices for conventional, transitional and organic
production. The DUEP model maximizes the expected utility of the farmer over the entire
planning horizon with respect to the farmers’ risk attitude. This last stage could be possibly
solved by using quadratic risk programming method. However, given the assumptions
underlying this method it generally considered as less flexible approach then DUEP model
(Hardaker et al., 2004).
120
General Discussion
6.2.4. Data issues on farm modelling
Besides the applied modelling techniques data used is also critical for the model output
results. In general data can be collected from case studies, experiments and survey data. The
first two can be criticized on the basis of representativeness and generalizability (Lampkin
and Padel, 1994). In this research survey data was used for modelling conversion. There are
insufficient reliable survey data available for modelling, especially concerning new
production methods. This can be a critique on the reliability of the model results. The survey
data availability is improving by collection and publication of data from organic farming
(FADN data collected by LEI, data from BIOM projects collected by PPO), especially for
established organic systems. However, more observations are needed from in-conversion and
organic farms in order to get more realistic model results.
The survey data used in this thesis concerning yield risk and also other evidence (Van
(Bueren et al., 2002) showed that in organic farming the variance of crop yields is higher
compared to conventional farming. However, the conclusion that organic yields fluctuate
more than in conventional systems is not certainly a ‘fact’, there is also evidence in the
opposite direction (Lamkin & Padel, 1994). This means that in the case organic farming
would have more stable yield compared to conventional farming risk averse farmer would
convert ‘easier’ to organic production.
Several studies show that during conversion years the yields tend to be lower than
after the conversion period, and that pre-cropping have significant effect on the yields of
subsequent crops (Lampkin & Padel, 1994). Since in the conversion period the main aim is to
build up soil fertility, in order to get higher yields in subsequent organic crops, it is important
to know the effects of pre-cropping for different crop sequences. However, the magnitude of
these effects is per possible crop sequence is unknown due to the fact that survey data does
not include this information separately. However, these effects are implicitly included in the
data. Since the knowledge of crop sequence effects on yields could decrease the risk
associated with organic farming, more efforts should be made to improve data availability in
the future. Experiments could be set up to determine these effects. However, this is more
costly and time consuming.
121
Chapter 6
6.3 Results
6.3.1 Economic results
Economic performance is widely seen as an important factor determining the acceptance of
organic systems within the farming community (Morris et al., 2001). In Chapter 3 model
results for arable farm showed better economic results for organic farming, due lower
production costs and access to premium prices. The significant better results resulted partly
from the fact that the costs of conversion were not included in the calculations. Overall
profitability through longer planning horizon including the conversion period was
investigated in Chapter 4. The results show that using a ten years planning horizon organic
farming is still more attractive from economic point of view. However, in the case when
additional constraints are included (such as extra depreciation costs, hired labour availability,
lower organic market price, minimum labour income requirement) the conversion to organic
farming is not always economically optimal.
Several literature studies showed that economic performance of organic farms is
similar to comparable conventional farms (Mahoney et al, 2004; Stockdale et al, 2001;
Offerman and Nieberg, 2000). However, significant differences in economic performance
occur between different studies, countries and between farm types. Organic arable farms show
remarkably high profits relative to comparable conventional farms (Morris et al., 2001),
mainly due to lower input costs that compensated for reduced outputs (Offerman and Nieberg,
2000). Relative profitability of conventional and organic farming system depends on the
economic performance of the conventional farms used for comparison and the differences in
access to premium prices for different products (Morris et al, 2001).
6.3.2 Price and yield risk
Swinton and Roberts (1996) (as cited in Morris et al., 2001) highlight that although
profitability is the main criterion used in economic comparisons, average profitability is an
inadequate criterion in itself, since it ignores risk. In Chapter 5 special attention was given to
the effect of future yield and price uncertainty on the conversion concerning conventional,
conversion and organic crops, including farmers’ risk attitude towards this uncertain outcome.
The results showed that taking risk into account for a risk-averse farmer it is optimal not to
122
General Discussion
convert, unless policy incentives are applied such as taxes or subsidies, or the market prices
for the organic products get more stable.
In Chapter 5 the data of organic farms showed more variance in yields and prices thus
higher risk than that of conventional farms. Considerable variation over time was also
observed in other studies, with the organic consistently outperforming the conventional
system (Morris et al., 2001). However, there is also evidence that risk is not unambiguously
higher in organic farming (Lampkin and Padel, 1994). This fluctuation follows the same
pattern in both systems, and demonstrates that external factors such as climate, prices and
policies are important determinants of revenues (Offerman and Nieberg, 2000).
There are two types of considerations about risk in organic farming: higher risk, due to
higher variability in organic yields and prices; and lower risk, due to more extensive farming
with more diverse crop rotation (Morris at al., 2001). Even if the variance is not higher than
in conventional farming many farmers perceive organic farming more risky. To adopt a new
farming system, such as organic farming, means that the farmer has to make a decision
surrounded by uncertainty, in which farmers’ perceptions and attitudes are influential (Buck,
2001). The perceived risk may be higher because the farmer has no firsthand experience with
the new method, and because the adoption of the new technology requires a substantial
investment, such as the compulsory conversion process (Hardaker et al., 2004). The
uncertainties concerning market prices for organic products are also perceived higher due to
organic market conditions such as the smaller scale and immature nature of organic market.
Farmers base their decisions on perceived rather then on real risk (Hardaker et al., 2004),
which suggests to pay attention on both risk perception and real risk. One possible method to
reduce the degree of risk perceived by the farmers can be by supplying relevant technical and
economic information about the new production method. This would help the farmer to
decide more easily which choices best suit his/her particular circumstances and risk-bearing
capacity (e.g. how to cope with real risk associated with organic farming). Agricultural policy
makers also need to account for risk and farmers’ responses to it. Models that include risk can
provide better predictions of farmers’ behaviour than those that do not (Hardaker et al 2004).
123
Chapter 6
6.3.3 Environmental results
In the last decade negative environmental impacts of agricultural production have gained
importance in European agricultural policy (Dabbert et al., 2004). In terms of some
environmental effects, there is unequivocal evidence that organic systems perform better than
conventional systems (Stolze et al., 2000). In Chapter 2 the model results showed better
environmental results for organic farming than for conventional concerning nutrient
surpluses, pesticide use and organic matter input to the farm. In our study nutrient surpluses
were calculated instead of losses, because it is easier to measure and because it was also
controlled by the Dutch policy regulation called MINAS (Dutch Mineral Accounting System).
Overall evidence from the literature indicates that organic farms have lower total nutrient
emissions to the environment (Morris et al., 2001; Anon. 1997; Cobb et al., 1999). This can
be explained by the fact that organic farmers, unlike conventional farmers, have an interest in
minimising loss of nutrients to the environment due to limited opportunities to replace them
(Morris et al., 2001). However, since the relative environmental performance of organic
farming differs substantially according to farming system, farm type and region (Dabbert et
al., 2004); and in many cases research evidence is lacking and/or produces variable results
(Morris et al., 2001) it is difficult to draw a general conclusion that organic farming in all
cases performs environmentally better than conventional farming.
6.3.4 Policy implications
The dual societal role of organic farming should be recognized while designing policy
concept for organic farming (COM, 2004). First, organic farming produces food products
which consumers are willing to buy for higher prices. From this perspective the development
of organic farming is governed by market rules. Second, organic farming delivers public
goods such as environmental benefits, social and rural development, public health and animal
welfare. From this perspective the development of organic farming can be stimulated with
public means based on policy choice, (mainly on environmental policy grounds.) Both roles
of organic farming contribute to the income of farmers. This means consumers give a ‘pulling
effect’ and policy incentives a ‘pushing effect’ on the conversion from conventional to
organic farming (Dabbert et al., 2004). In this discussion the focus is made on the effect of
policy incentives.
124
General Discussion
According to Lampkin and Padel (1994) financial payments during the conversion
period can have a significant impact on the rate of adoption of organic farming. Within agri-
environmental program (European Council Regulation 2078/92) as part of the 1992 Common
Agricultural Policy reform and rural development program (Rural Development Regulation
1257/1999) of EC, organic farming can be supported in accordance with its potential to
achieve a broad range of environmental and other objectives (Dabbert et al., 2004). Member
States decide themselves about the form of implementation of this support through direct
payments or provision of public services such as marketing activities, dissemination of
information, supporting market integration and research. Offerman and Nieberg (2000)
determined the significance of financial payments for the economic performance of organic
farms throughout the EU. The absolute level of payments appeared to vary significantly
between farm types and countries. Despite the importance of financial payments some
countries do not provide subsidy or the amount provided is not high enough to cover
conversion-induced costs (Dabbert et al. 2004). In the Netherlands the planned conversion
subsidy during 2001-2004 under Dutch Regulation to Stimulate Organic Production Methods
(Regeling Stimulering Biologische Productiemethode – RSBP) was abolished in 2003.
However, due to stagnation of growth in the number of organic farms in 2003 it was open
again in 2004. The reason behind the abolishment in 2003 was its lack of stimulation of
farmers to convert to organic production, as was expressed by farmers in interviews (Taen et
al., 2004). This can be explained by two main reasons: i) the subsidy was not high enough to
secure the income of the farmers; or ii) other than financial motives drive the farmers to
convert. In Chapter 5 the amount of financial support needed for the conversion was
calculated. This appeared to be considerably higher than that provided by financial payments
during the last years.
In order to reach the goal of ten percent for 2010 of organic land area of the total UAA
in the Netherlands a 30% yearly growth would be required instead of the average 6.5% which
was observed during the last few years (2001-2003), with a stagnation in 2004 (Taen et al.,
2004). Based on current situation the target does not seem realistic anymore. However, policy
makers still want to keep the target for stimulating reasons, e.g. ‘show’ that they care about
organic farming (Taen et al., 2004). Due to shortage of supply in the past the direct support to
farmers has been relatively overrated in organic farming policy in the EU, as also in the
Netherlands (Dabbert et al., 2004). Currently there is a new action plan for Dutch organic
farming for the period of 2005-2007 (MINLNV, 2005). This action plan aims to integrate
both the demand and supply side focusing on market expansion and providing direct
125
Chapter 6
payments for farmers. This integrated, more balanced action plan is prioritized at the moment
in the EU as a whole (Dabbert et al., 2004).
The decision to convert is a long-term strategic decision for the farmer. This means
that attractive support measures are necessary for a long time horizon. Differentiation of
payments between farm types and regions might be justified (Dabbert et al., 2004). However,
a more stable institutional environment is necessary in order to reduce the institutional risk
associated with changing short- and medium-term policy design. The current uncertain, in-
transparent subsidizing leads to a source of risk which might hinder the conversion of farms.
This means that without a proper long-term policy uncertainty is high for farmers. This has a
negative effect on the decision to convert.
Other instruments, such as taxes on conventional production (i.e on fertilizers,
pesticides) could be more effective than subsidies, since they are giving continuous
motivation for farmers to change his management to more environmentally friendly
production method (Folmer et al., 2000). It does not necessarily motivate them to convert to
other production, such as organic, rather than just to have more effective management practice
and switch the input use to more environmentally friendly one. This suggest that policy
measures stimulating conversion should take into account the already existing policies, which
drives conventional farming closer to organic farming. This can be even more efficient in
tackling certain environmental goals than organic farming.
6.4 Main conclusions
The following general conclusions can be drawn from the methodologies used in this thesis:
• Mathematical modelling, including LP, DLP and DUEP, is a suitable tool for analysing
the interactions between management measures and production intensity on one hand, and
farm income and environmental aspects on the other hand. Moreover, it is a useful tool for
determining the implications of different policy options at farm level on economic and
environmental aspects of farming.
• Linear programming is a good tool to compare different farming practices in a steady state
situation from an economic and environmental point of view.
• For modelling conversion of farms from conventional to organic farming the inclusion of
time is important for two main reasons: (i) conversion is a strategic decision including an
investment in the form of the compulsory two years conversion period, and (ii)
126
General Discussion
government intervention can play a role before, during and after the conversion. For these
reasons a dynamic linear programming appears to be a suitable tool for analysing the
conversion period of farms.
• Risk and uncertainty in yield and price of future conventional and organic crops play an
important role in the decision to convert to organic farming. The dynamic utility-efficient
programming model is a suitable tool to incorporate dynamic and stochastic risk aspects
in the model and to analyse the conversion and the effect of different policy incentives on
the conversion.
The following general conclusions can be drawn from the results of this thesis:
• In a steady situation organic farming appears to be more profitable than conventional
farming. Besides, organic farming shows less intensive land use and better environmental
results.
• The conversion period shows a considerable income drop due to lower yields and no
premium prices. This needs more attention from policy makers to help the farmers
through this period.
• Price and yield risk play an important role while deciding about conversion. These aspects
should be taken into account while analysing conversion.
• The more risk averse the farmer is the stronger the incentives need to be to make the
farmer convert to organic production.
• The policy environment concerning organic farming is not stable over the years. This
contributes to uncertainty and it makes the decision to convert more difficult for the
farmers.
127

Chapter 6
References
Anon, 1977. The Joint Research Council c Farming Stud Forum, RAC Cirencester, 26 March
1997.
Cobb, R., Feber, R., Hopkins, A., Stockdale, L., O’Riordan, T., Clements, B., Firbank, L.,
Goulding, K., Jarvis, S. and Macdonald, D., 1999. Integrating the environmental and
economic consequences of converting to organic agriculture: evidence from a case
study. Land Use Policy 16, p. 207-221.
COM, 2004. European Action Plan for Organic Food and Farming, Commission Staff
Working Document, Commission of the European Communities, SEC (2004) 739,
Brussels.
Dabbert S., Häring, A. M. and Zanoli, R., 2004. Organic Farming. Policies and Prospects. Zed
Books; London, UK.
Falconer, K. and Hodge, I., 2000. Using economic incentives for pesticide usage reductions:
responsiveness to input taxation and agricultural systems. Agricultural Systems 63, p.
175–194.
Folmer, H., and Gabel, H.L., 2000, Principles of Environmental and Resource Economics,
2nd edition, Edward Elgar, Cheltenham (paperback edition), 736 p.
Hardaker, J.B., R.B.M. Huirne, J.R. Anderson and G. Lien, 2004. Coping with risk in
Agriculture. Second edition. CABI Publishing, Oxfordshire, 332 p.
Hazell, P.B.R. and Norton, R.D., 1986. Mathematical Programming for Economic Analysis in
Agriculture. MacMillan, New York, 400 p.
Lampkin, N.H. and Padel, S., 1994. The Economics of Organic Farming. An International
Perspective. CAB International, Wallinford, p. 468.
Lampkin, N., 1994. Researching organic farming systems. Chapter 3 in Lampkin, N. and
Padel, S. (eds) 1994. The economics of organic farming. An International Perspective.
Wallingford: CAB International.
Taen, R.J.M., van Dalen, L.H., de Ruijter, P.P.M., 2004. Biologish meer gangbaar”
Evaluatie-onderzoek Nota Biologische Landbouw 2001-2004. Ministry of Agriculture,
Nature and Food Quality (MINLNV), MINLNV, 2005. Ministry of Agriculture, Nature
and Food Quality, <http://www.nlpekagr.com/>, Accessed 20 April 2006.
Mahoney P.R., Olson, K.D., Porter, P.M., Huggins, D.R., Perillo, C.A. and Kent Crookston,
R., 2004. Profitability of organic cropping systems in southwestern Minnesota,
Renewable Agriculture and Food Systems 19 (1), p. 35-46.
128
General Discussion
Morris, C., Hopkins, A. and Winter, M., 2001. Comparison of the social, economic, and
environmental effects of organic, ICM and conventional farming. Final report to The
Countriside Agency. Countryside & Community Research Unit & Institute of Grassland
and Environmental Research, Gloucestirshire, UK.
MINLNV, 2005. Ministry of Agriculture, Nature and Food Quality
<http://www.nlpekagr.com/> Accessed 20 April 2006.
Offermann, F. and Nieberg, H., 2000. Economic Performance of Organic Farms in Europe. In
Organic farming in Europe: Economics and Policy, Vol. 5, Suttgart-Hohenheim,
University of Hohenheim.
Olson, K.D., Langley, J. and Heady, E.O. 1982. Widespread adoption of organic farming
practices: estimated impacts on U.S. agriculture. Journal of Soil and Water Conservation
37, 41-45
Pindyck, R.S. and D.L. Rubinfeld, 1998. Econometric Models and Economic Forecasts (4th
edition). McGraw-Hill, New York, 625 pp.
Prins, U., de Wit, J. and Nauta, W., 2005. Combining on-farm, participatory research
methodologies with modelling in order to create a regionally based organic agriculture
in Holland. International Scientific Conference on Organic Agriculture, Adelaide, 21-23
September, Australia
Stockdale, E. A., Lampkin, N. H., Hovi, M., Keatinge, R., Lennartsson, E. K. M., Macdonald,
D. W., Padel, S., Tattersall, F. H., Wolfe, M. S. and Watson, C. A., 2001. Agronomic
and environmental implications of organic farming systems, Advances in Agronomy,
Academic Press, 70, p. 261-262.
Stolze, M., Piorr, A. Häring, A. and Dabbert, S., 2000. The Environmental Impact of Organic
Farming in Europe. In Organic Farming in Europe: Economics and Policy, Vol. 6,
Stuttgart-Hohenheim: University of Hohenheim.
Van Bueren, E.T.L., Struik, P.C. and Jacobsen, E., 2002. Ecological concepts in organic
farming and their consequences for an organic crop ideotype. Netherlands Journal of
Agricultural Science, 50, 1-26.
Van Ittersum, M.K., Rabbinge, R., Van Latesteijn, H.C., 1998. Exploratory land use studies
and their role in strategic policy making. Agricultural Systems 58, p. 309-330.
Weersink, A., Jeffrey, S. and Pannell, D., 2002. Farm-level modeling for bigger issues.
Review of Agricultural Economics 24, p. 123–140.
129

130

131
Summary

132
Summary
Background and problem definition
Society and governments in many countries show an increasing concern about food
production due to environmental problems, animal welfare and human health problems. These
problems have induced many governments in the world to promote more sustainable farming
systems, such as organic farming. Organic farming in European Union (EU) showed rapid
growth in the last few decades due to policy incentives and consumer demand. However, the
overall significance of organic farming in the EU context is still quite small in terms of land
area used. In some EU member states, such as in the Netherlands, the last few years the
conversion from conventional to organic farming was progressing more slowly than the
government expected. In order to stimulate the conversion, policy makers need more
information about the process of conversion. Factors that motivate and hamper the conversion
of farms have to be investigated in more detail.
This study aims to gain more insight in the economics of conversion. The research
attempts to answer the following three sub-questions:
1. Why do the farmers not convert?
2. What are the important influential factors of conversion? What is the magnitude of
them?
3. What types of incentives can be useful to stimulate conversion?
The main objective of this research was to answer the above questions by means of (1)
developing a modelling approach that can be used for analyzing the conversion from
conventional to organic arable farming systems from economic and environmental point of
view and (2) determining the effects of influential factors and policies (incentives) on the
choice of farmers to convert from conventional to organic farming systems. The models were
developed for a typical arable farm in the central clay region in the Netherlands.
Four phases were identified in the research project (see Figure 6.1 for phase 2 to 4):
1. A thorough review of scientific literature on economics of conversion in order to
identify the most suitable method to analyse the conversion process.
2. The development of a static bio-economic linear programming model at farm level
in order to compare conventional and organic arable farming systems from
economic and environmental point of view.
133
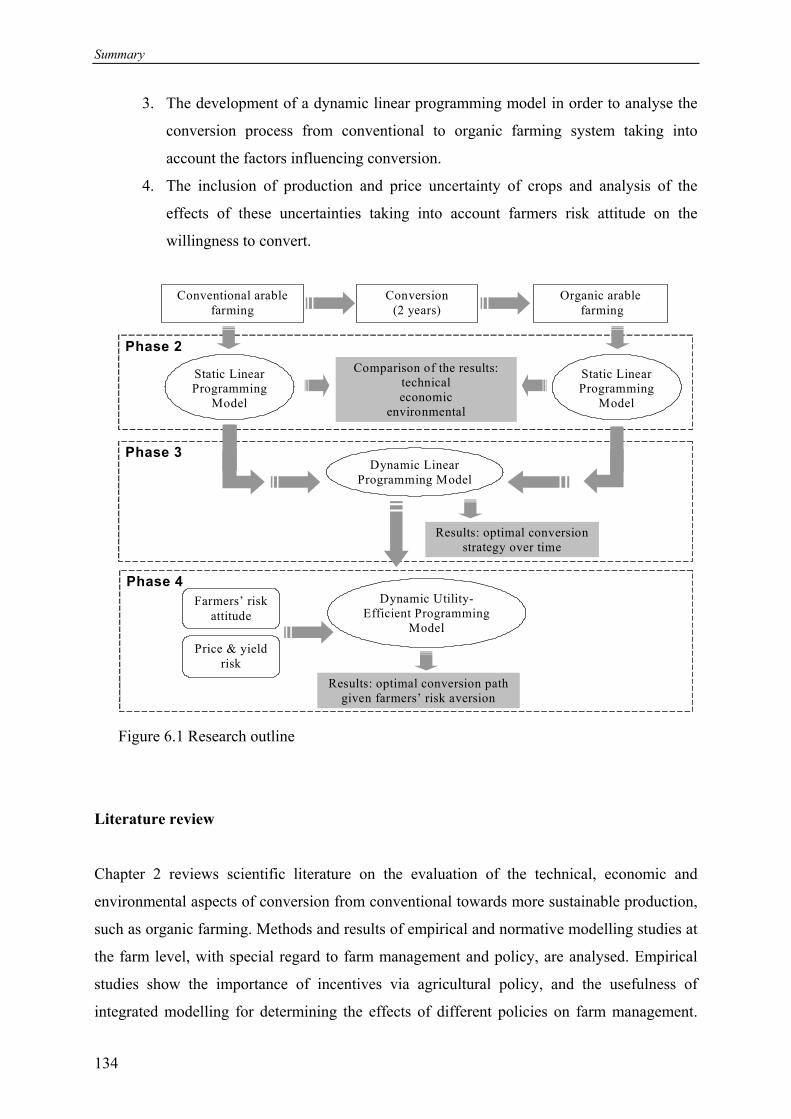
Summary
3. The development of a dynamic linear programming model in order to analyse the
conversion process from conventional to organic farming system taking into
account the factors influencing conversion.
4. The inclusion of production and price uncertainty of crops and analysis of the
effects of these uncertainties taking into account farmers risk attitude on the
willingness to convert.
Conventional arable farming
Organic arable farming
Conversion (2 years)
Dynamic Utility- Efficient Programming
Model Price & yield
risk
Farmers’ risk attitude
Phase 2
Phase 3
Phase 4
Results: optimal conversion path given farmers’ risk aversion
Comparison of the results: technical economic
environmental
Results: optimal conversion strategy over time
Dynamic Linear Programming Model
Static Linear Programming
Model
Static Linear Programming
Model
Figure 6.1 Research outline
Literature review
Chapter 2 reviews scientific literature on the evaluation of the technical, economic and
environmental aspects of conversion from conventional towards more sustainable production,
such as organic farming. Methods and results of empirical and normative modelling studies at
the farm level, with special regard to farm management and policy, are analysed. Empirical
studies show the importance of incentives via agricultural policy, and the usefulness of
integrated modelling for determining the effects of different policies on farm management.
134
Summary
Normative modelling shows the effects of new policy instruments and technology, and allows
the high level of detail needed for what-if analysis. Normative models of conversion to
organic farming confirm the importance of incentives and the agricultural policy context.
Since the purpose of this research is to investigate the conversion process from economic and
environmental point of view and to analyse possible policy incentives on conversion and
since there is limited availability of historical data a mathematical modelling approach suits
best for this research.
Comparison of conventional and organic farming
In Chapter 3 a comparison of the conventional and organic arable farming system is made by
using a normalised situation (same area, soil type, climate, etc.). In this phase a linear
programming model (LP) of a conventional arable farm and of an organic arable farm in the
central clay region of the Netherlands is developed. The models include environmental
externalities such as losses of nutrients and pesticide use, the levels of which can be
influenced by using different production structures (cropping plans). With the conventional
model two different crop rotations (3-year and 4-year), and with the organic model one
rotation (6-year) are analysed and the technical, economic and environmental results of these
three situations are compared. The results show that organic farming leads to less intensive
land use, better environmental results and better economic results. Expenditure on hired
labour is much higher in organic farming which also leads to higher variable costs. Prices for
organic products are higher than for similar conventional products, but lower yields and the
less intensive cropping plan mitigates the effects on total revenues.
Conversion process from conventional to organic farming
The results of Chapter 3 and several other studies show that organic farming is more
profitable than conventional farming. However, in reality not many farmers convert to organic
farming. The objective of Chapter 4 is to develop a dynamic linear programming (DLP)
model in which the conversion period between conventional and organic farming is included.
This model is based on the LP-models from Chapter 3. By the use of this model the effects of
different limiting factors on the conversion process of farms are analysed. The DLP describes
135
Summary
the conversion process of a farm over time by maximizing the net present value over a ten-
year planning horizon. There a three phases in the model, the conventional, the conversion
and the organic farming phase. The solution of the model provides a complete decision
strategy for the farmer for the whole panning horizon for each year. Next to the optimal
cropping plan it provides information on the labour allocation, nutrient and pesticide
purchase, nutrient losses, organic matter input to the farm and the costs and revenues of the
production. It shows whether partial or complete conversion, one-step or stepwise conversion
is more profitable.
The results of the analysis of the basic scenario show that conversion to organic farming is
more profitable than staying conventional. However, the income difference is much smaller
than that in Chapter 3. In order to get to the really profitable phase of organic farming the
farmer has to get through the two years conversion period, which is economically difficult
due to lower yields and no premium prices. Sensitivity analysis show that if extra depreciation
costs would occur due to superfluous machinery because of conversion, which would be
higher than 25% of conventional fixed cost conversion is less profitable then staying
conventional. Also the availability of hired labour, which can be constrained in peak periods,
has a strong effect on the cropping plan and on the area converted. Further analysis show that
slight drop (2%) of organic prices lower the labour income of the farmer and make the
conversion less profitable than conventional farming. For the farmers a minimum labour
income can be a requirement to ‘survive’. The analyses show that a constraint on minimum
labour income suggests stepwise conversion for the farmers to overcome the economic
difficulties during the conversion period.
Effect of yield and price risk and farmers’ risk attitude on the conversion of farms
Studies suggest that the main sources of risk for both conventional and organic farmers are
the output price and production risk. In arable farming in the Netherlands there is a large
variation between the years in crops’ gross margin of conventional, conversion and organic
crops. This is mainly caused by large revenue (yield and output price) variation across the
years. Differences in variation between conventional, conversion and organic crops are caused
mainly by different management practices (i.e. restrictions on pesticide use and fertilizer) and
by different market opportunities and prices for the products. This suggests that it is important
136
Summary
to take into account the variation of revenue while analysing the conversion to organic
farming. There is quite some literature on inclusion of risk in agricultural farm models,
however, very few studies have tackled the issue of risk and uncertainty in organic farming.
In Chapter 5 a discrete stochastic dynamic utility-efficient programming (DUEP) model is
developed which includes yield and price uncertainty before, during and after the conversion
years. The DUEP model is based on the developed DLP model of Chapter 4. The model
maximizes the expected utility of the farmer over a ten-year planning horizon depending on
the farmers’ risk attitude. Sensitivity analysis for different factors such as policy incentives,
market stabilization for organic products or learning effect of farmers were carried out. The
results show, that for a risk-neutral farmer it is optimal to convert to organic farming,
however for a risk-averse farmer it is only optimal to convert if policy incentives are applied
such as taxes on pesticides or subsidies on conversion, or if the market for the organic
products gets more stable. The more risk averse the farmer is, the more incentive is needed to
make the farmers convert to organic farming. Although this seems obvious, the risk aversion
of the farmers is neglected easily. This model provides the basis to determine such incentives.
Main conclusions
The following general conclusions can be drawn from the methodologies used in this thesis:
• Mathematical modelling, including LP, DLP and DUEP, is a suitable tool for analysing
the interactions between management measures and production intensity on one hand, and
farm income and environmental aspects on the other hand. Moreover, it is a useful tool for
determining the implications of different policy options at farm level on economic and
environmental aspects of farming.
• Linear programming is a good tool to compare different farming practices in a steady state
situation from an economic and environmental point of view.
• For modelling conversion of farms from conventional to organic farming the inclusion of
time is important for two main reasons: (i) conversion is a strategic decision including an
investment in the form of the compulsory two years conversion period, and (ii)
government intervention can play a role before, during and after the conversion. For these
reasons a dynamic linear programming appears to be a suitable tool for analysing the
conversion period of farms.
137
Summary
• Risk and uncertainty in yield and price of future conventional and organic crops play an
important role in the decision to convert to organic farming. The dynamic utility-efficient
programming model is a suitable tool to incorporate dynamic and stochastic risk aspects
in the model and to analyse the conversion and the effect of different policy incentives on
the conversion.
The following general conclusions can be drawn from the results of this thesis:
• In a steady situation organic farming appears to be more profitable than conventional
farming. Besides, organic farming shows less intensive land use and better environmental
results.
• The conversion period shows a considerable income drop due to lower yields and no
premium prices. This needs more attention from policy makers to help the farmers
through this period.
• Price and yield risk play an important role while deciding about conversion. These aspects
should be taken into account while analysing conversion.
• The more risk averse the farmer is the stronger the incentives need to be to make the
farmer convert to organic production.
• The policy environment concerning organic farming is not stable over the years. This
contributes to uncertainty and it makes the decision to convert more difficult for the
farmers.
138

139
Samenvatting

Samenvatting
140
Samenvatting
De voedselproductie ondervindt in veel westerse landen toenemende mate van kritiek vanwege problemen op het vlak van het milieu, dierwelzijn en volksgezondheid. De biologische landbouw wordt als een mogelijke oplossingsrichting gezien. Deze wordt sinds midden jaren negentig van de vorige eeuw door veel nationale overheden gestimuleerd. Dit heeft geleid tot een forse groei van het areaal biologische landbouw. In Nederland is deze groei de laatste jaren vertraagd. In het licht van mogelijke vormen van overheidsbeleid om biologische landbouw te stimuleren komen de volgende vragen op:
1. Waarom stappen boeren niet over naar biologische landbouw? 2. Wat zijn belangrijke factoren in de besluitvorming om wel of niet over te stappen en
wat is de de bandbreedte van deze factoren? 3. Welke soorten overheidsbeleid zijn bruikbaar voor het stimuleren van conversie naar
biologische landbouw? Het hoofddoel van dit onderzoek was het beantwoorden van bovenstaande vragen voor Nederlandse akkerbouw door middel van (1) het ontwikkelen van een model van een akkerbouwbedrijf dat gebruikt kan worden om de conversie naar biologische landbouw vanuit economisch en milieutechnisch perspectief te analyseren en (2) het vaststellen van mogelijke effecten van belangrijke factoren en beleidsmaatregelen op de beslissing al dan niet tot conversie over te gaan aan de hand van berekeningen met het ontwikkelde model. Het ontwikkelde model is een afspiegeling van het typische akkerbouwbedrijf in het centrale zeekleigebied in Nederland, dat wil zeggen een bedrijf van 48 ha met een gemiddeld bouwplan. De eerste stap in het onderzoek was een literatuuronderzoek naar technische, economische en milieutechnische analyses van conversie naar biologische landbouw, teneinde zicht te krijgen op bruikbare methoden om bovenstaande vragen te onderzoeken (H2). Het beschikbare modelonderzoek viel uiteen in empirisch, econometrisch onderzoek en normatief modelonderzoek. De conclusie van het literatuuronderzoek was dat, gezien de wens verschillende deels nieuwe vormen van overheidsstimulering te onderzoeken en gezien de relatief geringe beschikbaarheid van data, normatief modelonderzoek het meest geschikt is voor het onderhavige onderzoek. De volgende stap was een statische vergelijking van een conventionele en een biologische geoptimaliseerde bedrijfssituatie onder de veronderstelling van dezelfde bedrijfsgrootte, grondsoort en weersomstandigheden (H3). Voor beide bedrijfssituaties is een lineair programmeringsmodel (LP) opgesteld met als doelstelling maximalisering van de arbeidsopbrengst van het gezin (1,1 VAK). Naast de verschillende mogelijke gewassen die verbouwd kunnen worden bevatten de modellen telrijen voor het bepalen van de nutrientenverliezen en het pesticidegebruik. Met het conventionele bedrijfsmodel is een 3- en een 4-jarige rotatie geoptimaliseerd en met het biologische model een 6-jarige rotatie.
141
Samenvatting
Vergelijking van de resultaten liet zien dat de biologische bedrijfsvoering leidt tot een minder intensief grondgebruik en tot substantieel betere economische en milieutechnische resultaten. De statische vergelijking in H3 gaat voorbij aan het feit dat een beslissing om te converteren betekent dat het bedrijf een periode van twee jaar door moet waarin al wel volgens biologische voorschriften geproduceerd dient te worden terwijl de gerealiseerde lagere productie nog niet als biologisch aangemerkt mag worden. Dit betekent hogere kosten en lagere opbrengsten en dus een lagere abeidsopbrengst. Om dit aspect mee te nemen in de analyse is in H4 een dynamisch lineair programmeringsmodel (DLP) ontwikkeld, gebaseerd op de twee LP-modellen van H3. Het DLP-model maximaliseert de gedisconteerde arbeidsopbrengst van het gezin over een periode van 10 jaar. Het model bevat drie mogelijke fasen. Er wordt altijd gestart met een conventionele productie als eerste fase. Na het eerste jaar kan het bedrijf conventioneel blijven of in conversie gaan. Conversie kan ineens voor het bedrijf als geheel plaatsvinden, maar ook stapsgewijs. Op de conversiefase van twee jaar volgt de biologische fase voor de rest van de 10 jaar. De resultaten geven aan dat conversie naar biologische bedrijfsvoering economisch aantrekkelijker is dan conventioneel blijven. Het verschil in arbeidsopbrengst is echter aanzienlijk lager dan het verschil dat volgde uit de statische vergelijking (H3). Dit komt met name door de twee conversiejaren met een negatieve arbeidsopbrengst. Gevoeligheidsanalyse laat zien dat 2% lagere prijzen voor biologische producten het voordeel doet omslaan naar conventionele landbouw, dat een minimumeis voor de arbeidsopbrengst in de conversiejaren leidt tot stapsgewijze conversie en dat beperking van beschikbare losse arbeid leidt tot een omschakeling voor slechts een deel van de bedrijfsoppervlakte. In de berekeningen in H3 en H4 is steeds uitgegaan van de arbeidsopbrengst als criterium. Deze is ondermeer gebaseerd op de gemiddelde productie en de gemiddelde opbrengstprijs per ha gewas. Een eventueel risicoverschil wat het gevolg kan zijn van een verschil in variatie in producties en prijzen blijft hiermee buiten beschouwing. Omdat uit beschikbare LEI-data blijkt dat de variatie in opbrengsten groter is in de biologische landbouw en omdat uit onderzoek bekend is dat boeren in het algemeen risicomijdend zijn is in H5 het DLP-model uitgebreid met de opname van risico tot een DUEP (Dynamic Utility Efficiënt Programming) model. Arbeidsopbrengst wordt daarbij in nut (utility) omgezet volgens een relatie die afhankelijk is van de risicohouding. Voor een risico-averse houding is deze relatie kromlijnig wat betekent dit het marginaal nut van extra arbeidsopbrengst afneemt bij een stijgende arbeidsopbrengst. Door voor een plan meerdere berekeningen van het resulterende nut te maken, gebaseerd op verschillende opbrengsten met elk een waarschijnlijkheid, kan het gewogen gemiddelde nut van een plan bepaald worden. Dit gewogen gemiddelde nut is in het DUEP-model het criterium op basis waarvan het optimale plan bepaald wordt. De resultaten op basis van de LEI-data voor wat betreft de variatie in
142
Samenvatting
opbrengsten laten zien een geringe mate van risico-aversie al leidt tot de beslissing om conventioneel te blijven. Subsidies op conversie (minimaal € 2737 per ha ineens) of een heffing op pesticidegebruik (€ 23 per kg actieve stof) zijn vormen van overheidsbeleid om het voordeel weer te laten omslaan naar conversie. Hetzelfde wordt bereikt door een stabielere markt voor biologische producten en door een hogere gemiddelde productie voor biologische productie.
Uit deze studie zijn een aantal conclusies te trekken voor wat betreft de gebruikte methode en de verkregen resultaten. De belangrijkste conclusies zijn: • Optimaliseringsmodellen (LP, DLP en DUEP) zijn bruikbare modellen om de interactie
tussen management en productie-intensiteit enerzijds en arbeidsopbrengst en milieuresultaat anderzijds te analyseren. Bovendien zijn het bruikbare instrumenten om de implicaties van overheidsbeleid voor bedrijven te kwantificeren;
• De sterke daling van de arbeidsopbrengst in de conversiejaren en het grotere opbrengstrisico (bestaande uit productie- en prijsrisico) in de biologische productie zijn belangrijke factoren die conversie naar biologische akkerbouw negatief beïnvloeden.
143

144

145
Publications

146

Publications
List of Publications
Peer-reviewed scientific papers
Acs, S., P.B.M. Berentsen, M. de Wolf, R.B.M. Huirne 2006. Comparison of conventional
and organic arable farming systems in the Netherlands by means of bio-economic
modelling. Accepted for publication in Biological Agriculture and Horticulture
Acs, S., P.B.M. Berentsen, R.B.M. Huirne 2006. Conversion to organic arable farming in the
Netherlands: a dynamic linear programming analysis. Submitted to Agricultural
Systems
Acs, S., P.B.M. Berentsen, R.B.M. Huirne 2006. Effect of yield and price uncertainty on
conversion from conventional to organic farming. Submitted to American Journal of
Agricultural Economics
Acs, S., P.B.M. Berentsen, R.B.M. Huirne 2005. Modelling conventional and organic
farming, a literature review. Wageningen Journal of Life Sciences, NJAS 53-1
Conference papers
Acs, S., P. Berentsen, R. Huirne 2005. Bio-economic modelling of conversion from
conventional to organic arable farming system in the Netherlands. 15th IFOAM
Organic World Congress, 21-23 September 2005, Adelaide, Australia
Acs, S., P. Berentsen, M. de Wolf, R. Huirne 2004. Bio-economic modelling of arable
farming system, comparison of conventional and organic farming systems in the
Netherlands. The Agricultural Economics Society 78th Annual Conference, 2-4 April
2004, Imperial College London, UK
Acs, S., P. Berentsen, K. Takács-György, R. Huirne 2002. Economic modelling of Hungarian
farms incorporating nature conservation. 13th International IFMA Congress of Farm
Management, Wageningen, The Netherlands
147
Publications
Acs, S., P. Berentsen, R. Huirne 2002. Bio-economic modelling of conversion from
conventional to organic farming systems in the Netherlands. 2nd International
Conference for Young Researchers, SZIE, Gödöllõ, Hungary
Acs, S., L. Barkaszi, 2001. Economic impact of environmental measures on Hungarian farms.
1st International Conference for Young Researchers, SZIE, Gödöllõ, Hungary
Acs, S., 2000. Prfit Optimization of mixed farm systems with integrated nitrogen
management. Scientific Conference VISION 2000, SZIE, Gödöllõ, Hungary
Acs, S., 1999. Nitrogen circulation and its economical effects at the Jozsefmajor model farm,
Scientific Conference of Students, SZIE, Gödöllõ, Hungary
Balazs, K., L. Podmaniczky, S. Acs, 2002. Drawing up farm management plans for Agri-
environmental Shemes. 13th International IFMA Congress of Farm Management,
Wageningen, The Netherlands
Barkaszi, L., K. Ritter, S. Acs, 2001. Organic farming – an alternative for rural development.
1st International Conference for Young Researchers, SZIE, Gödöllõ, Hungary
Kovacs, A., Acs S., 2000. Economic analysis of nitrogen circulation by LP model. VII.
International Agricultural Economic Conference, Gyöngyös, Hungary
148

149

150
About the Author
Szvetlána Ács was born on 26 February, 1977 in Budapest, Hungary. In 1995 she finished her
secondary education in Körösi Csoma Sándor Bilingual (Russian-Hungarian) Grammar
School in Budapest. In the same year she began her study at Szent István University at the
Faculty of Economical and Social Sciences, Gödöllő, Hungary. In 2000 she graduated and got
her MSc diploma in Agricultural Economics and Management. After her graduation she was
working at the Department of Farm Management and Economics on the research project
entitled “Planning of agricultural enterprises with special emphasis on nutrient economy”.
During this period she visited and carried out research at Business Economics Group,
Wageningen Unversity, first, as an Erasmus student for a period of 3 month, and later as a
researcher for a year financed by Dutch Ministry of Agriculture and Fisheries (IAC grant) and
Mansholt Graduate School. From January 2002 till February 2006 she has been employed as
PhD researcher in the Business Economics Group. The focus of her PhD project was on “Bio-
economic Modelling of Conversion from Conventional to Organic Arable Farming.” During
this period she followed her PhD education program in the Mansholt Graduate School of
Wageningen University and in the Netherlands Network of Economics (NAKE - Graduate
program in Economics and Econometrics). She completed the full NAKE program and
received her NAKE diploma in 2006.
Since July 2006 Szvetlána Ács works as a Postdoc at the Department of Economics at
the University of Stirling, Scotland, UK, in the research program entitled “A Landscape-scale
Analysis of the Sustainability of the Hill-farming Economy and Impact of Farm Production
Decisions on Upland Landscapes and Biodiversity”. This is a joint program with University
of Sheffield and University of Nottingham.
151

Publisher
Grafisch Bedrijf Ponsen & Looijen BV, Wageningen
Cover design
Szvetlána Ács
Photo: Whitehavenbeach, Australia
152