Embed Size (px)
Citation preview
Biochemical and Biophysical studies
of human SUR1 NBD1, rat SUR2A
NBD2 and the role of the C-terminal
extension in rat SUR2A NBD1
by
Claudia Paola Alvarez
A thesis submitted in conformity with the requirements for
the degree of Master of Science
Department of Chemistry
University of Toronto
© Copyright by Claudia Paola Alvarez, 2013
ii
Biochemical and Biophysical studies of human SUR1 NBD1, rat SUR2A NBD2
and the role of the C-terminal extension in rat SUR2A NBD1
Claudia Paola Alvarez
Master of Science, 2013
Department of Chemistry
University of Toronto
Abstract
SUR2A-mediated regulation of KATP channels is affected by residues belonging to the C
terminus of the first nucleotide binding domain (NBD1). We studied the C-terminal region of
NBD1 by comparing experiments using NBD1 S615-D914 and NBD1 S615-K972 constructs to
studies of NBD1 S615-L933 also performed in our laboratory. Our NMR data suggests that the
C-terminal region of NBD1 from residues Q915 to L933 is disordered and transiently contacts
the NBD1 core, which may affect NBD1 phosphorylation. Tryptophan quenching fluorescence
experiments corroborate that the Q915-L933 C-terminal tail contacts the NBD1 core.
Fluorescence thermal denaturation experiments suggest that NBD1 S615-D914 has a higher
affinity for MgATP compared with NBD1 S615-L933, implying that the C-terminal tail varies
MgATP binding.
Additional experiments were performed to identify soluble constructs of hSUR1 NBD1
and rSUR2A NBD2 that would allow detailed biophysical studies of these domains. Some of the
constructs studied showed improved solubility and stability.
iii
Acknowledgements
First of all, I would like to express my gratitude to Dr. Voula Kanelis who guided and
supported me during my Master's research. Her valuable and constructive suggestions during this
research work are very much appreciated.
I am also grateful to Dr. Scott Prosser, who inspired me to work in his lab during my last
year of undergraduate studies. Additionally, I want to thank him for his continuous support
during my graduate education.
I would like to thank Marijana Stagljar for helping me during my training, and for her
friendship. My thanks are also extended to Batool Z Hyder for sharing her new methods for
saving time in lab and for her constant support, to Dr. Jorge Lopez-Alonso for his help in
running NMR experiments and data analysis and to Elvin de Araujo who also helped me during
my training and data analysis.
I would also like to extend my gratitude to the Prosser lab, Shin lab, Espie lab and Barzda
lab for sharing their laboratory equipment and also for their friendly disposition.
I want to thank my family and friends for their support and encouragement during my
undergraduate and graduate career. Finally, I wish to thank Daaf Sandkuijl for proofreading my
thesis.
iv
Table of contents Abstract ............................................................................................................................... ii
Acknowledgements ............................................................................................................. iii
List of Figures .................................................................................................................... vii
List of Tables ....................................................................................................................... ix
List of Abbreviations ........................................................................................................... x
1 Introduction ........................................................................................................................ 1
1.1 Overview of the KATP channels ................................................................................... 1
1.1.1 Molecular basis of the KATP channel .................................................................... 2
1.2 Inwardly rectifying potassium subunits....................................................................... 4
1.2.1 ATP inhibition and PIP2 activation of the Kir6 subunit ....................................... 6
1.3 Background on ABC Transporters .............................................................................. 7
1.3.1 Structure of the ABC transporters ........................................................................ 9
1.3.2 Closer inspection on the nucleotide binding domains (NBDs) .......................... 11
1.3.3 Transport mechanism of the ABC family .......................................................... 15
1.4 The sulfonylurea receptor (SUR) .............................................................................. 18
1.4.1 Isoforms and splice variants of the SUR protein ................................................ 20
1.5 Physical link and regulation of Kir6 by SUR and vice versa .................................... 22
1.5.1 Nucleotide regulation of channel activity via the SUR protein .......................... 23
1.5.2 Allosteric regulation on the SUR protein affects channel activity ..................... 25
1.5.3 Regulation of the KATP channel by phosphorylation .......................................... 26
v
1.6 The KATP channels in the pancreas and heart tissues................................................. 27
1.7 Biophysical studies .................................................................................................... 31
1.7.1 Nuclear magnetic resonance ............................................................................... 31
1.7.2 Fluorescence spectroscopy ................................................................................. 34
1.7.3 Circular dichroism (CD) ..................................................................................... 38
1.8 Goals .......................................................................................................................... 40
1.8.1 Investigation of the function of the C-terminal region of NBD1 ....................... 40
1.8.2 Determination of soluble constructs of hSUR1 NBD1 and rSUR2A NBD2 ..... 40
2 Materials and Methods ..................................................................................................... 42
2.1 Protein expression and Purification ........................................................................... 42
2.1.1 Selection of the N- and C-terminal boundaries .................................................. 42
2.1.2 PCR amplification of selected NBD1 boundaries .............................................. 42
2.1.3 Expression of rSUR2A NBD1, rSUR2A NBD2 and hSUR1 NBD1 constructs 43
2.1.4 Purification of rSUR2A NBD1 and hSUR1 NBD1 .......................................... 44
2.1.5 Purification of rSUR2A NBD2 constructs ......................................................... 46
2.2 NMR Spectroscopy ................................................................................................... 46
2.2.1 Phosphorylation of rSUR2A NBD1 S615-D914 ................................................ 47
2.3 Fluorescence Spectroscopy ....................................................................................... 47
2.3.1 Thermal denaturation experiments ..................................................................... 47
2.3.2 Fluorescence Quenching .................................................................................... 48
vi
2.3.3 Fluorescence nucleotide binding experiments .................................................... 49
2.4 Circular dichroism spectroscopy ............................................................................... 50
3 Results .............................................................................................................................. 51
3.1 Determination of the C-terminal region function in NBD1 ...................................... 51
3.1.1 Experiments performed with rSUR2A NBD1 .................................................... 51
3.1.2 NMR spectroscopy experiments......................................................................... 58
3.1.3 Fluorescence spectroscopy experiments ............................................................. 69
3.2 Determination of soluble constructs for rSUR2A NBD2 and hSUR1 NBD1 ........... 74
3.2.1 rSUR2A NBD2 ................................................................................................... 74
3.2.2 hSUR1 NBD1 ..................................................................................................... 76
4 Discussion......................................................................................................................... 78
4.1 Investigation of the C-terminal region of NBD1 ....................................................... 78
4.1.1 Comparison of the S615-D914 and S615-L933 construct of NBD1 .................. 79
4.1.2 rSUR2A NBD1 S615 K972 and rSUR2A NBD1 S615-N962 ........................... 83
4.2 Determination of soluble hSUR1 NBD1 and rSUR2A NBD2 constructs ................ 84
5 Conclusions and Future directions ................................................................................... 86
6 Bibliography ..................................................................................................................... 88
vii
List of Figures
Figure 1.1 Schematic representation of the KATP channel. ............................................................. 2
Figure 1.2 Human SUR and Kir6 gene chromosomal configuration............................................. 3
Figure 1.3 Inwardly rectifying potassium channel (Kir). ............................................................... 4
Figure 1.4 Open and close states of the Kir6 subunit ..................................................................... 6
Figure 1.5 Mutually exclusive binding sties for ATP and PIP2. ..................................................... 7
Figure 1.6 Structure of an ABC transporter .................................................................................. 10
Figure 1.7. NBD dimer in the close conformation and conserved motifs .................................... 12
Figure 1.8 Structure-based sequence alignment of ABC NBDs ................................................... 14
Figure 1.9 Switch model. .............................................................................................................. 16
Figure 1.10 Constant model at the NBDs ..................................................................................... 17
Figure 1.11 Sulfonylurea receptor (SUR) ..................................................................................... 19
Figure 1.12 Nucleotide activation of the ATP channel ................................................................. 24
Figure 1.13 Role of the ED domain .............................................................................................. 26
Figure 1.14 Phosphorylation sites of Kir6.2 and SUR2A ............................................................. 27
Figure 1.15 Insulin secretion in normal and abnormal KATP channels .......................................... 28
Figure 1.16 KATP channels activity in the heart and related disease mutations. ........................... 30
Figure 1.17 Energy diagram showing the different excited states of a fluorophore. .................... 35
Figure 1.18 Energy diagram representing the concept of collisional quenching. ......................... 37
Figure 1.19 Characteristic far UV CD spectra for secondary protein structures .......................... 39
Figure 3.1 Expression of rSUR2A NBD1contructs ...................................................................... 51
Figure 3.2 Lysis of the cells expressing the rSUR2A NBD1 constructs ...................................... 52
Figure 3.3 Purification of rSUR2A NBD1 (S615-D914) ............................................................. 55
viii
Figure 3.4 Purification of rSUR2A NBD1 (S615-K972) ............................................................. 56
Figure 3.5 Purification of rSUR2A NBD1 (S615-N962) ............................................................. 57
Figure 3.6 2D 15
N-1H TROSY-HSQC of rSUR2A NBD1 S615-D914 at different temperatures 59
Figure 3.7 2D 15
N-1H TROSY-HSQC of rSUR2A NBD1 S615-D914 at 30
oC .......................... 62
Figure 3.8 Overlay spectra of rSUR2A NBD1 S615-D914 and S615-L933 ................................ 63
Figure 3.9 Time resolved phosphorylation of NBD1 S615-D914 by PKA .................................. 64
Figure 3.10 Comparison of phosphorylated and non-phosphorylated of NBD1 S615-D914 ....... 66
Figure 3.11 Overlay spectra of phosphorylated and non-phosphorylated NBD1 S615-D914 ..... 67
Figure 3.12 Temperature series with rSUR2A NBD1 S615-K972............................................... 68
Figure 3.13 NBD1 S615 D914 thermal stability .......................................................................... 70
Figure 3.14 Acrylamide and KI quenching................................................................................... 71
Figure 3.15 CD spectra of rSUR2A NBD1 S615-D914 ............................................................... 72
Figure 3.16 TNP-ATP binding experiments with rSUR2A NBD1 S615 K972 ........................... 73
Figure 3.17 Induction of the rSUR2A NBD2 constructs .............................................................. 75
Figure 3.18 Purification of the construct rSUR2A NBD2 Q1307-M1545 ................................... 75
Figure 3.19 Expression of the hSUR1 constructs in BL21 competent cells. ................................ 76
Figure 3.20 Purification of the hSUR1 NBD1 S616-L955 construct ........................................... 77
ix
List of Tables
Table 1.1 List of human ABC genes, function and related diseases[45] ........................................ 8
Table 1.2 Tissue distributions of the SUR isoforms[15] .............................................................. 21
Table 1.3 The characterized splice variant of SUR2 and SUR1[15] ............................................ 21
Table 1.4 Biological relevant nuclei for NMR[126] ..................................................................... 32
Table 1.5 Aromatic residues in proteins[130]............................................................................... 37
Table 2.1 Selected constructs predicted from structure-based sequence alignment[75] .............. 42
Table 2.2 Constructs used in PCR reaction .................................................................................. 43
Table 3.1Summary of the thermal stability of rSUR2A NBD1 S615 D914 ................................. 70
Table 3.2 Stern-Volmer constants obtained for rSUR2A NBD1 S615-D914 .............................. 72
x
List of Abbreviations
ABC ATP-binding cassette
ADP Adenosine diphosphate
AMD Age-related macular degeneration
ATP Adenosine triphosphate
Bo External magnetic field
CD Circular dichroism
CDR Cone-rod dystrophy
CFTR Cystic fibrosis transmembrane conductance regulator
Co2+
Cobalt ion
DNA Deoxyribonucleic acid
DSS 4,4-dimethyl-4-silapentane-1-sulfonic acid
DTT Dithiothreitol
ED domain Glutamate and aspartate containing domain
Fo Fluorescence intensity in the absence of a quencher
F Fluorescence intensity in the presence of a quencher
FFM Fundus Flavimaculatis
FHDLD Familial hypoapoproteinemia
FPHHI Familial persistent hyperinsulinemic hypoglycemia of infancy
h Planck’s constant, 6.626068 × 10⁻³⁴ m2 kg/s
HSQC Heteronuclear single quantum coherence
ICD Intracellular domain
IPTG Isopropyl-β-D-thio-galactoside
Ksv Quenching constant
K+ Potassium ion
KATP channel ATP-sensitive potassium channel
KCO KATP channel openers
Kd Dissociation constant
KDa Kilodalton
Ki Enzyme-inhibitor dissociation constant (KI)
LB Luria Bertani
Mg2+
Magnesium ion
MRP Multidrug resistant proteins
MSD Membrane spanning
NaCl Sodium chloride
NBD Nucleotide Binding Domain
Ni2+
Nickel ion
NMR Nuclear magnetic resonance
NusA N-utilizing (where N stands for the phage lambda N protein) substances A
OD Optical density
PCR Polymerase chain reaction
PDB Protein Data Bank
PHHI Persistent hyperinsulinemic hypoglycemia of infancy
PKA Protein kinase A
Q Quencher
xi
RP Retinitis pigmentosum
SDS-PAGE sodium dodecyl sulfate polyacrylamide gel electrophoresis
SUMO Small Ubiquitin-like Modifier
SUR Sulfonylurea receptors
T1 Spin-lattice relaxation
T2 Spin-spin relaxation
TEV Tobacco Etch Virus protease
TNP-ATP 2',3'-O-(2,4,6-Trinitrophenyl)adenosine-5'-triphosphate
tetra(triethylammonium) salt
TRIS 2-Amino-2-hydroxymethyl-propane-1,3-diol
TROSY Transverse relaxation optimized spectroscopy
Ulp1 (ubiquitin-like protein)-specific protease 1
ΔE Energy separation
1
1 Introduction
The ATP-sensitive potassium (KATP) channel couples the influx of potassium (K+) ions to
different processes in metabolically active cells. Therefore, perturbations in KATP channel gating
is detrimental to human health.[1, 2] Of major importance to the proper functioning is the
regulatory subunit of the channel, named the sulfonylurea receptor (SUR). Essentially, the SUR
proteins are responsible for controlling channel gating by sensing the ATP concentration inside
the cell through two nucleotide binding domains (NBDs). Mutations in these SUR NBDs are
responsible for diseases such as diabetes mellitus, familial hyperinsulinism and several
cardiovascular disorders.[3, 4] Therefore, it is important to study the SUR NBDs for
understanding regulation of KATP channel activity as well as to gain insights into the molecular
basis by which mutations cause human diseases.
1.1 Overview of the KATP channels
KATP channels are located at the plasma membrane and allow the influx of K+ ions in a
controlled manner. The transport of K+ ions allows the hyperpolarization or depolarization of the
cell membrane, depending on the cell's resting potential, and serves as a signalling switch for
other cellular processes. Because gating of KATP channel essentially involves hydrolysis of
MgATP, KATP channels link electrical activity to intracellular Mg2+
-ADP and ATP
concentrations inside the cell.[5] Thus, in general KATP channels are open during low metabolic
activity and closed when high intracellular concentrations of ATP are reached.[6]
Since the discovery of KATP channels in cardiac myocytes in the early 80's, numerous
studies showed that they are also localized in various cell types and tissues, including pancreatic
β-cells, heart, brain, kidney as well as skeletal and smooth muscle.[7-11] The proper function of
2
the KATP channels in these tissues allows for insulin secretion in the pancreatic β-cells, coping
with cardiac stress and ischemic preconditioning in the heart tissue, skeletal muscle glucose
uptake, vascular smooth muscle tone; and neuronal excitability.[12]
1.1.1 Molecular basis of the KATP channel
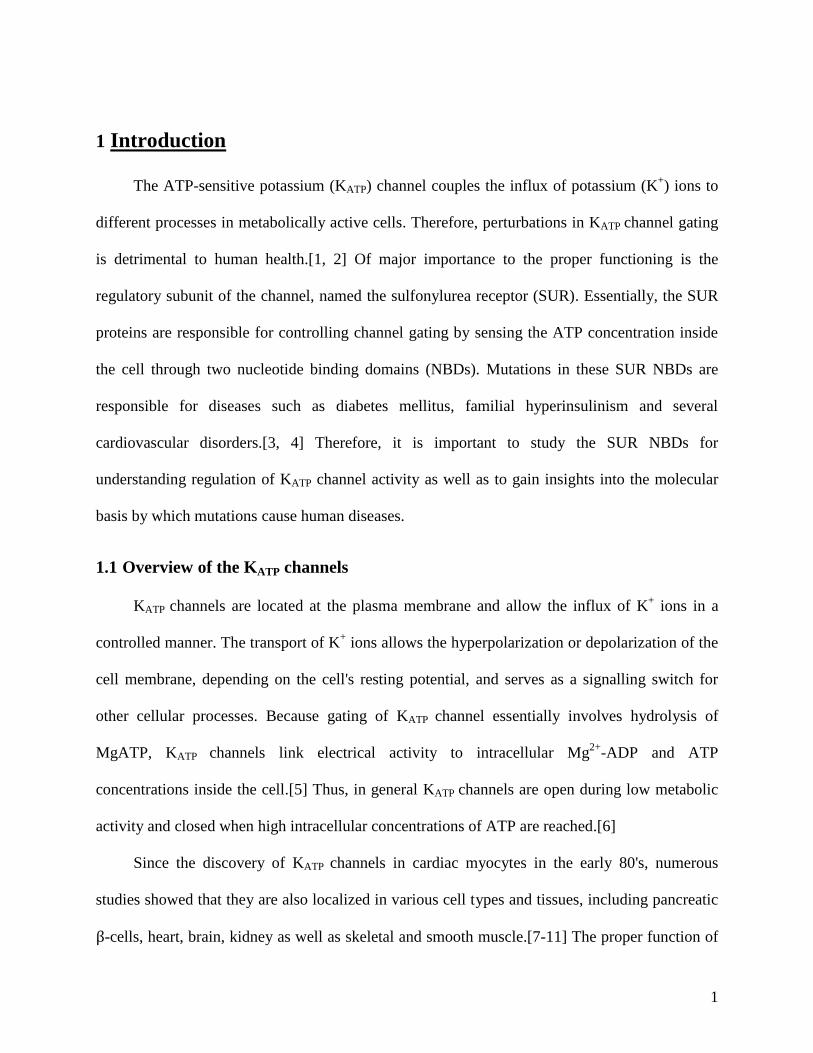
The KATP channel is a hetero-octameric complex of about 950 kDa with dimensions of
about ~18 nm across and ~13 nm in height.[13, 14] It is composed of two subunits, the pore
forming potassium inwardly rectifier (Kir6.x) subunit and the regulatory sulfonylurea receptor
(SUR) subunit. The Kir6.x and SUR proteins are co-assembled in a 4:4 stoichiometry as
demonstrated by various biochemical and biophysical studies (Figure 1.1).[13, 15]
Figure 1.1 Schematic representation of the KATP channel.
A. The KATP channel is a hetero-octameric complex formed by four Kir6 and four SUR subunits.
The pore is formed by four inward rectifier K+ (Kir6) proteins (green) and each subunit is
associated with one SUR protein (pink). Lipids in the bilayer are shown in purple. B. Top view
of the KATP (figure obtained from Teramoto. J. of Physiol., 2006.[16]
The Kir6.x subunit belongs to the inwardly rectifying potassium channel family of
proteins. There are two genes that encode for the Kir6.x subunit, KCNJ8 and KCNJ11, that
encode for the Kir6.1 and Kir6.2 isoforms of the pore forming protein, respectively. Remarkably,
these isoforms share about 65 % sequence identity at the amino acid level. It is recognized
however, that the Kir6.2 subunit is present more often than the Kir6.1 subunit in most
tissues.[17, 18]
A.
A)
Su
pe
rio
r
vi
e
w
th
e
K
AT
P
ch
an
ne
l
w
he
re
is
ob
se
rv
ed
th
e
he
ter
oc
ta
m
B.
A)
Su
pe
rio
r
vi
e
w
th
e
K
AT
P
ch
an
ne
l
w
he
re
is
ob
se
rv
ed
th
e
he
ter
oc
ta
m
3
The regulatory subunit or SUR protein is part of the ATP-binding cassette (ABC) family of
transporters. Similar to the Kir6.x subunit, the SUR protein also has two genes, ABCC8 and
ABCC9, that encode for the isoforms of the SUR protein, SUR1 and SUR2, respectively.[18, 19]
The SUR protein additionally has different splice variants (e.g. SUR2A and SUR2B) that
increase the range of physiological and pharmacological properties of the channel at specific
tissues.[15] Different combinations of the genes encoding for the Kir6.x and SUR proteins
produce KATP channels in different tissues.
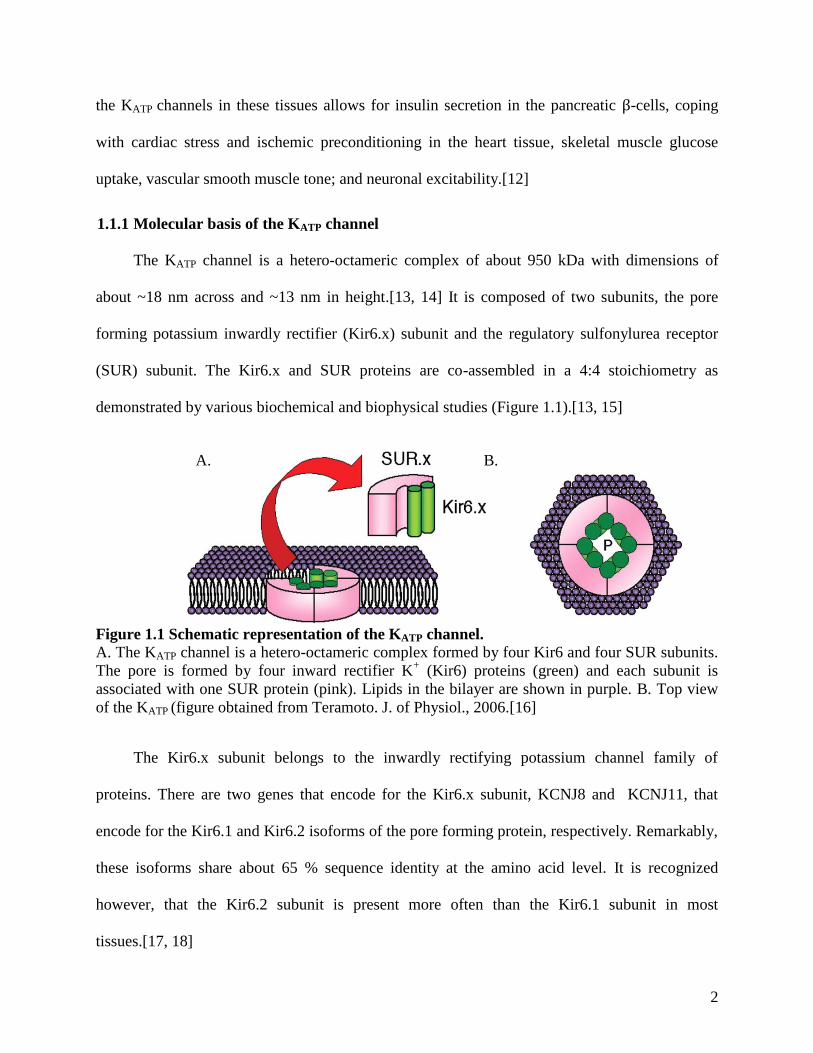
Notably, the Kir6.2 and SUR1 genes are adjacent on the human chromosome 11p15.1
which implies similar transcriptional regulatory mechanism for both genes (Figure 1.2).[17]
Likewise, the genes encoding for the Kir6.1 and SUR2 proteins are located next to each other in
the 12p12.1 chromosome, which implies that their expression is also controlled during
transcription and also provides evidence for a gene duplication event (Figure 1.2).[20] Other
studies that corroborate the intrinsic relationship of both subunits show that heterelogous
expression of a functional channel is only possible when SUR and Kir6 subunits are co-
expressed. [13, 17, 21]
Figure 1.2 Human SUR and Kir6 gene chromosomal configuration.
Chromosome 11p15 1 and 11p12.1 are depicted and show the adjacent genes that code for the
KATP channel.
4
1.2 Inwardly rectifying potassium subunits
The Kir6.x subunits are K+ selective channels that conduct K
+ ions inside the cell, therefore
their name "inward rectifiers". The inwardly rectifying channels form a superfamily made up of
seven families (Kir1-7) containing at least 15 members in mammals.[22] However, only two
isoforms of the Kir6.x subfamily have been cloned so far, Kir6.1 and Kir6.2, from different
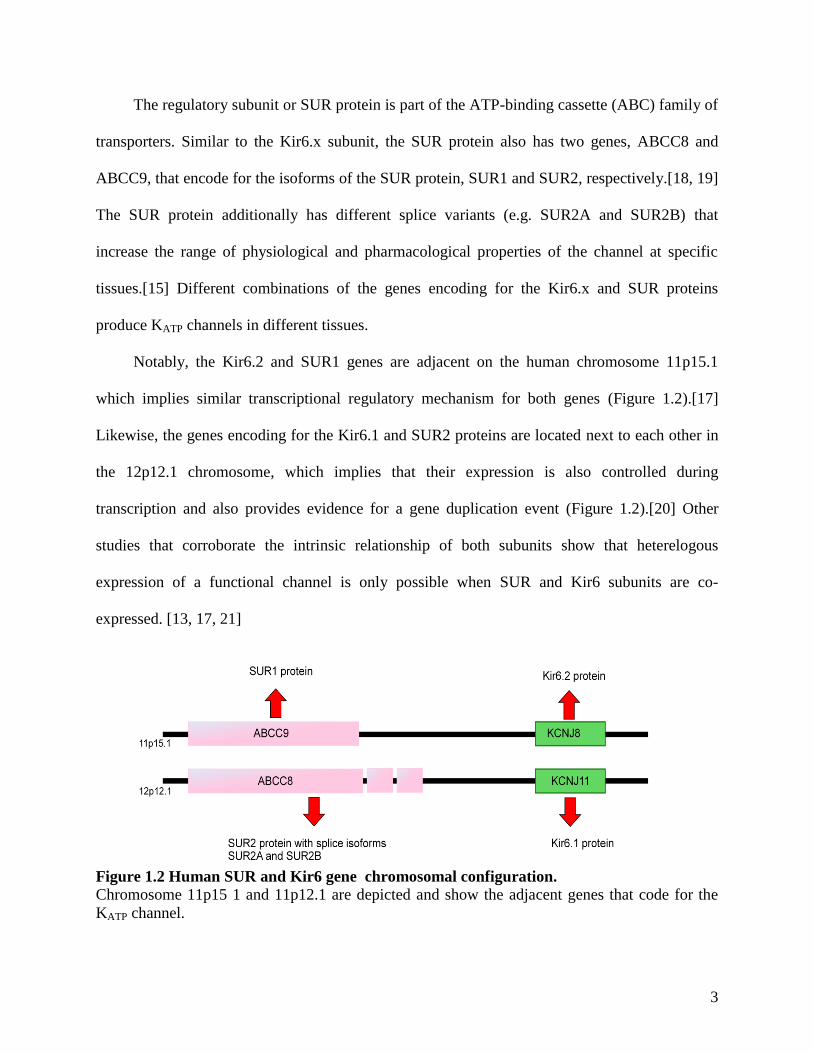
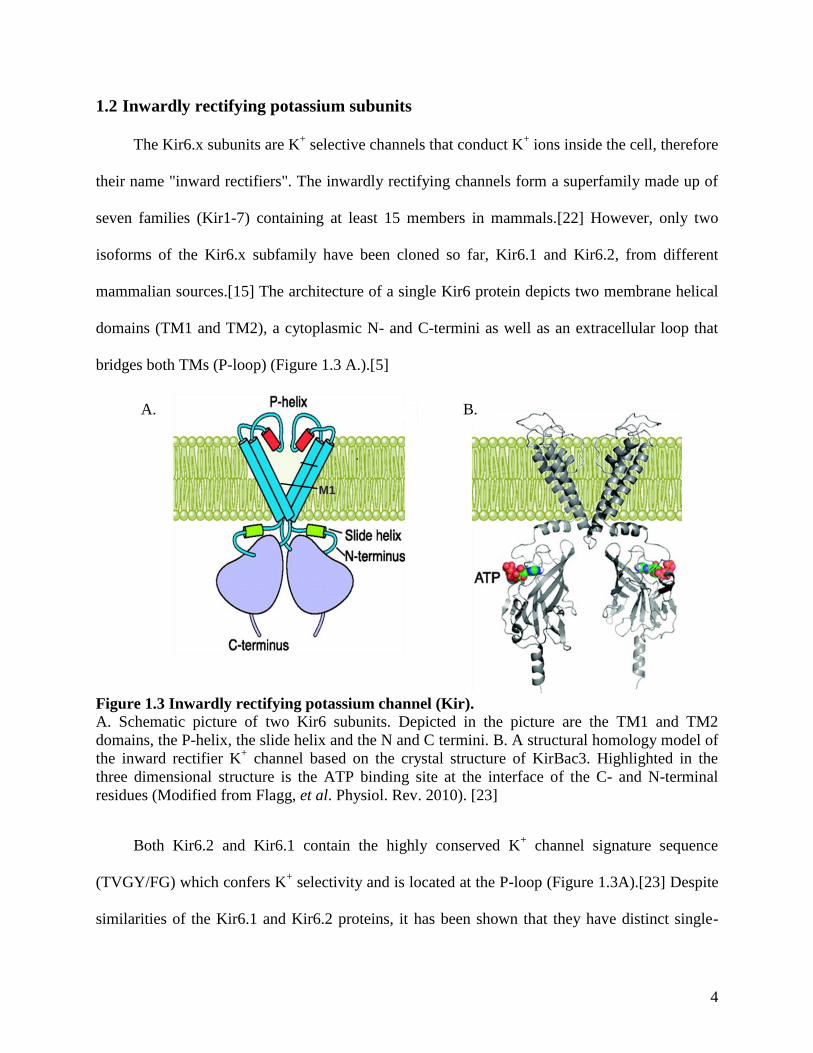
mammalian sources.[15] The architecture of a single Kir6 protein depicts two membrane helical
domains (TM1 and TM2), a cytoplasmic N- and C-termini as well as an extracellular loop that
bridges both TMs (P-loop) (Figure 1.3 A.).[5]
Figure 1.3 Inwardly rectifying potassium channel (Kir).
A. Schematic picture of two Kir6 subunits. Depicted in the picture are the TM1 and TM2
domains, the P-helix, the slide helix and the N and C termini. B. A structural homology model of
the inward rectifier K+ channel based on the crystal structure of KirBac3. Highlighted in the
three dimensional structure is the ATP binding site at the interface of the C- and N-terminal
residues (Modified from Flagg, et al. Physiol. Rev. 2010). [23]
Both Kir6.2 and Kir6.1 contain the highly conserved K+ channel signature sequence
(TVGY/FG) which confers K+ selectivity and is located at the P-loop (Figure 1.3A).[23] Despite
similarities of the Kir6.1 and Kir6.2 proteins, it has been shown that they have distinct single-
A.
A)
Su
pe
rio
r
vi
e
w
th
e
K
AT
P
ch
an
ne
l
w
he
re
is
ob
se
rv
ed
th
e
he
ter
oc
ta
m
eri
c
co
B.
A)
Su
pe
rio
r
vi
e
w
th
e
K
AT
P
ch
an
ne
l
w
he
re
is
ob
se
rv
ed
th
e
he
ter
oc
ta
m
eri
c
co
TT
MM11
TT
MM22
5
channel conductance of ~35 and ~80 pS, respectively in 150 mM K+
solution.[17, 18, 24] The
difference in conductance is attributed to presence of specific amino acids in the TM1 and TM2
regions.[25]
Crystal structures of the tetrameric domains of eukaryotic Kir3.1[26] and full length
bacterial homolog KirBac1.1[27] allowed the modelling of the tetrameric Kir6 pore. The
homology and structural modelling experiments revealed unique features of the N- and C-
terminal cytoplasmic regions that provided insights into the mechanism of gating. There are four
ATP binding domains, one in the cytoplasmic domain of each Kir6 protein in the channel.[28-
30] Each of these sites is located on the cytoplasmic face where the three dimensional fold brings
together several the N- and C-termini residues (Figure 1.3 B.).[28-30] The existence the ATP
binding sites is also corroborated by several mutational experiments that show the residues
involved in ATP binding.[30-33] Furthermore, the three dimensional model also illustrates the
presence of the 'slide helix' which is predicted to be an amphiphilic interfacial helix that lies
parallel to the membrane (Figure 1.3 B.).[29] This slide helix is thought to produce the physical
link between the ATP binding site and the TMs.[27, 34]
Models of Kir6.2 based on the structure of KirBac3.1 channel helped envision the physical
mechanism by which the Kir6 subunit opens.[34] The model proposes that the TM2 helix is
involved in a hinge motion that helps close the channel inner cavity at the narrow collar and acts
in conjunction with the slide helix movement. Supporting evidence of the important role of these
two regions is highlighted by several disease causing mutations the cluster along the TM2 and
slide helix that affect channel opening.[27, 34] The gating pathway through the Kir6.2 pore
structure is shown in Figure 1.4.
6
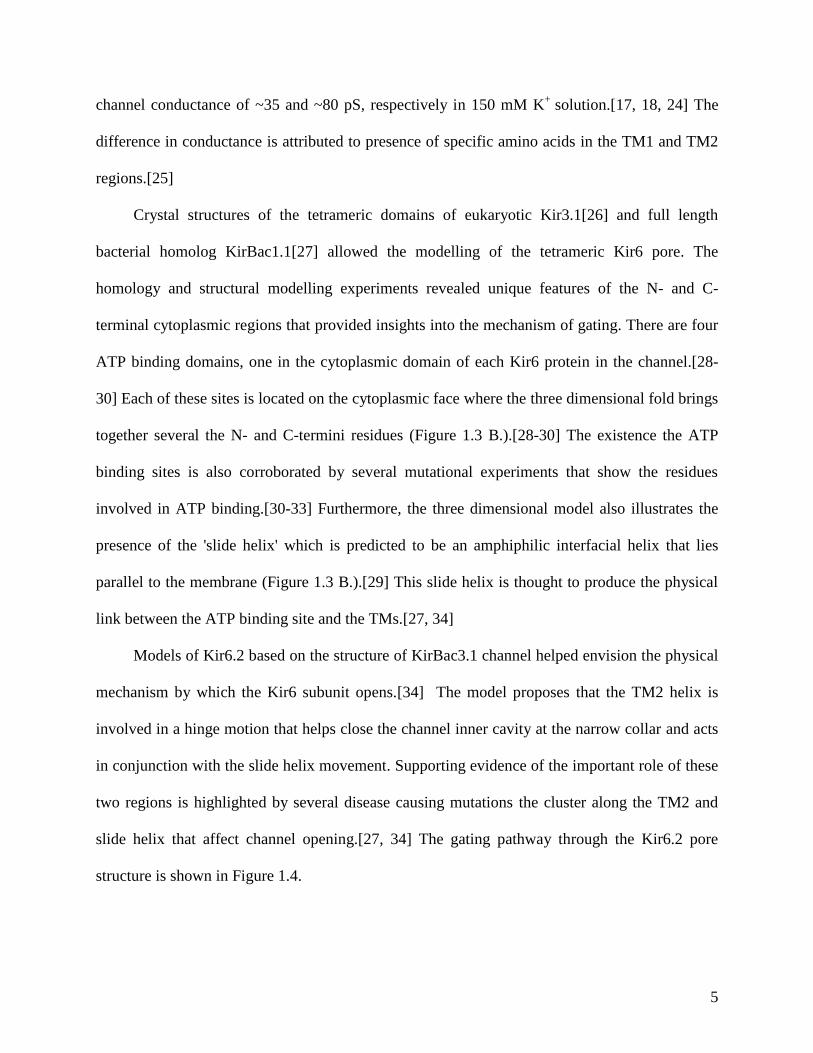
Figure 1.4 Open and close states of the Kir6
subunit
Gating states of the Kir channel based on the
crystal structure of KirBac3.1[34] Two
different states are shown, open and closed.
Additionally, the components and regions of
the channel are labelled for clarity. The TM1
and TM2 transmembrane helixes are shown in
green and purple (respectively). The slide helix
is shown in red. The blue coloured regions
depict the region of the channel that is
occupied by water. The green area shows
where one or two water molecules fit while
that in red shows the place at which no water
molecule can pass. (modified figure from
Nichols, Nature, 2006).[5]
1.2.1 ATP inhibition and PIP2 activation of the Kir6 subunit
The cytoplasmic domain of Kir6.1 and Kir6.2 not only provides the binding site for ATP
but also for phosphatidylinositol-4,5-bisphosphate (PIP2) (Figure 1.5).[29] These two molecules
play very different roles in the gating mechanism of the channel. Biochemical studies show that
PIP2 strongly stabilizes the open state of all eukaryotic Kir channels while ATP has the opposite
effect.[5] Additionally, kinetic analysis showed that the sites of action of each of these molecules
on the cytoplasmic domain are mutually exclusive and that the channel is fairly unstable in the
absence of PIP2 and ATP.[29] As a result, the Kir subunits will be bound to either ATP or PIP2 at
any one time. In the absence of ATP, ~90% of the Kir6 subunits are found in the open
configuration or PIP2 bound state.[35] However, the reality inside cells is quite different as ATP
is readily available. In turn, this makes the open probability of the Kir6 pore less than 0.1 as
binding of ATP at any of the four binding sites of the Kir6 subunit closes the channel. Therefore,
without any other stimulatory effect, there would be a small probability of opening the channel.
7
The site and behaviour for both ATP and PIP2 binding are corroborated by competition binding
studies and numerous mutagenesis studies.[36, 37]
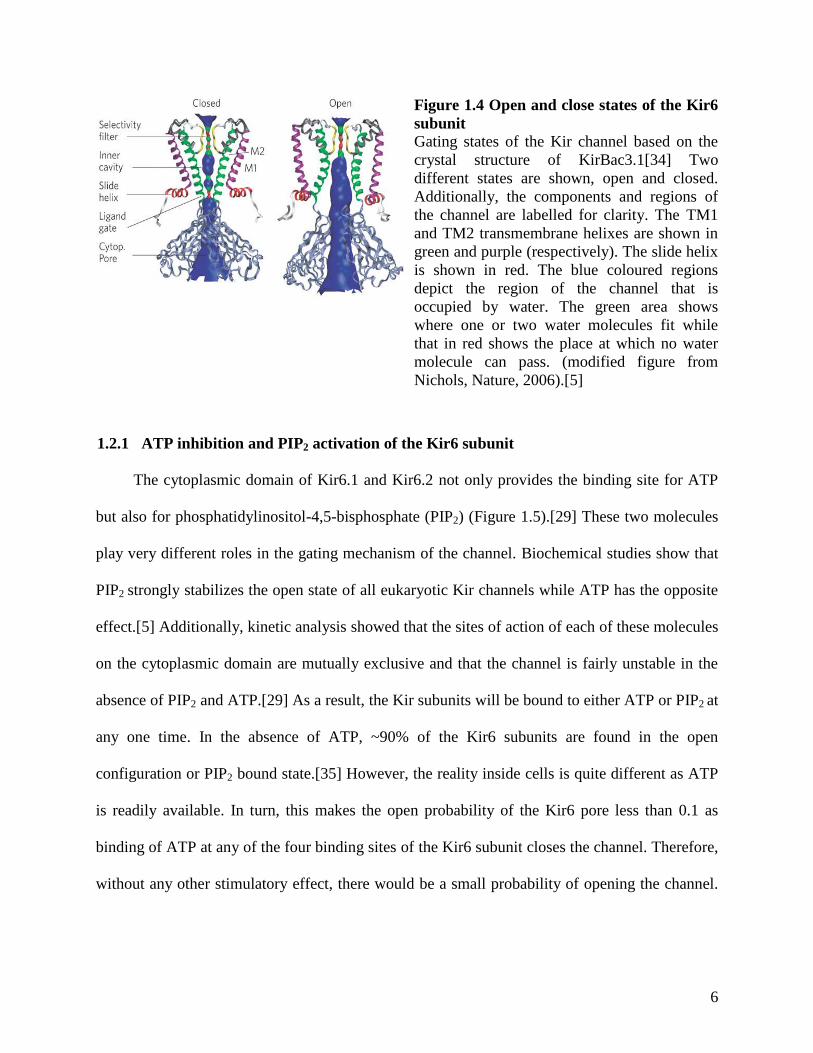
Figure 1.5 Mutually exclusive binding sties
for ATP and PIP2.
For clarity, in the figure only two Kir6.x
subunits are shown. The blue and red lines
show the transmembrane domains of the Kir
subunits as well as the P-loops. In green and
yellow lines are shown the cytoplasmic
domains. The red balls are the residues
involved in the binding of ATP while those
interacting with PIP2 are shown in blue
(modified figure from Nichols, Nature,
2006).[5]
1.3 Background on ABC Transporters
The SUR proteins are the regulatory subunits in KATP and are members of the ATP binding
cassette (ABC) family of transporters. ABC transporters are a group of large proteins that
actively move molecules across cellular membranes. They are present in both prokaryotes and
eukaryotes.[38, 39] Highlighting their importance in biology is the fact that they are highly
expressed in all species such as Saccharomyces, Drosophila, Arabadopsis as well as in
Escherichia coli where five percent of the genes encode ABC transporters.[38, 40] The role of
ABC transporters is vital for cellular nutrient intake, production of energy, removal of waste
products and/or shuffling of signalling molecules.[39, 41, 42] ABC proteins are mainly localized
in the plasma membrane as well as inside the cell in the endoplasmic reticulum (ER), peroxisome
and mitochondria.[39, 43] There are in total 49 known genes of ABC transporters expressed in
humans.[44] Mutations in many of these genes are responsible for many genetic disorders that
center on the inability to transport a specific ligand across the lipid bilayer. Table 1.1 displays a
list of all subfamilies of the transporters and the number of genes from each subfamily that are
8
known to be expressed in humans. Additionally, Table 1.1 displays some genes of these
subfamilies that are associated with human diseases.
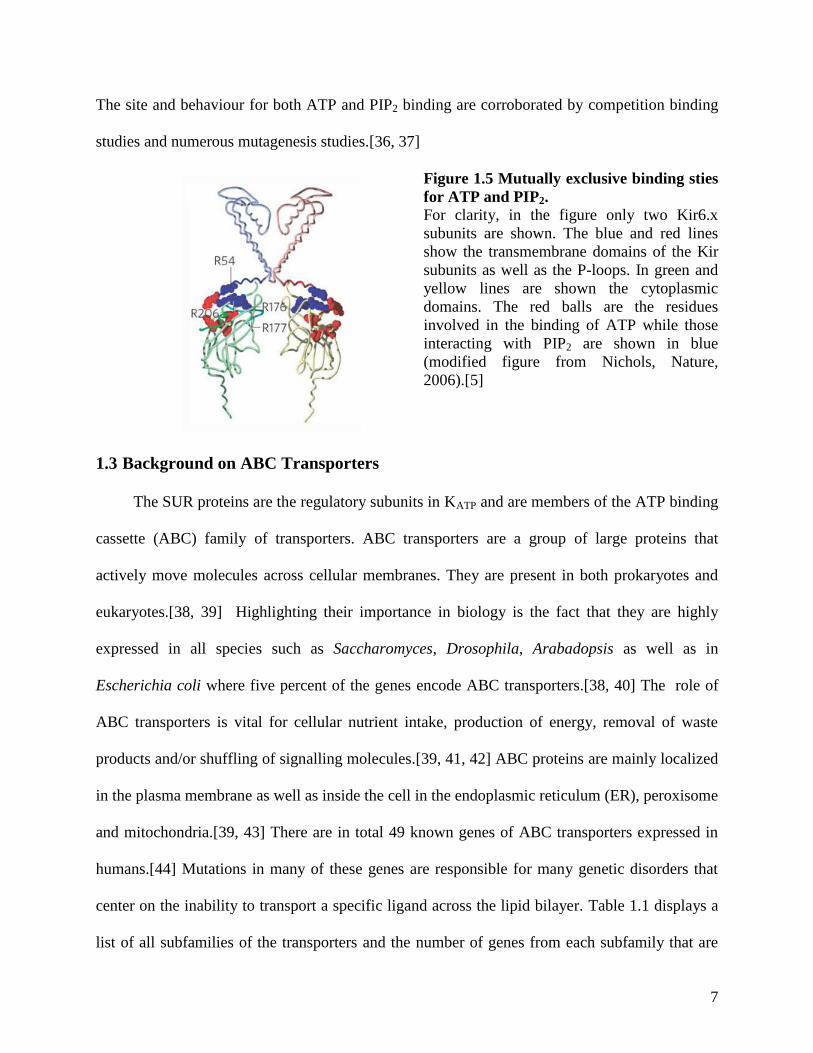
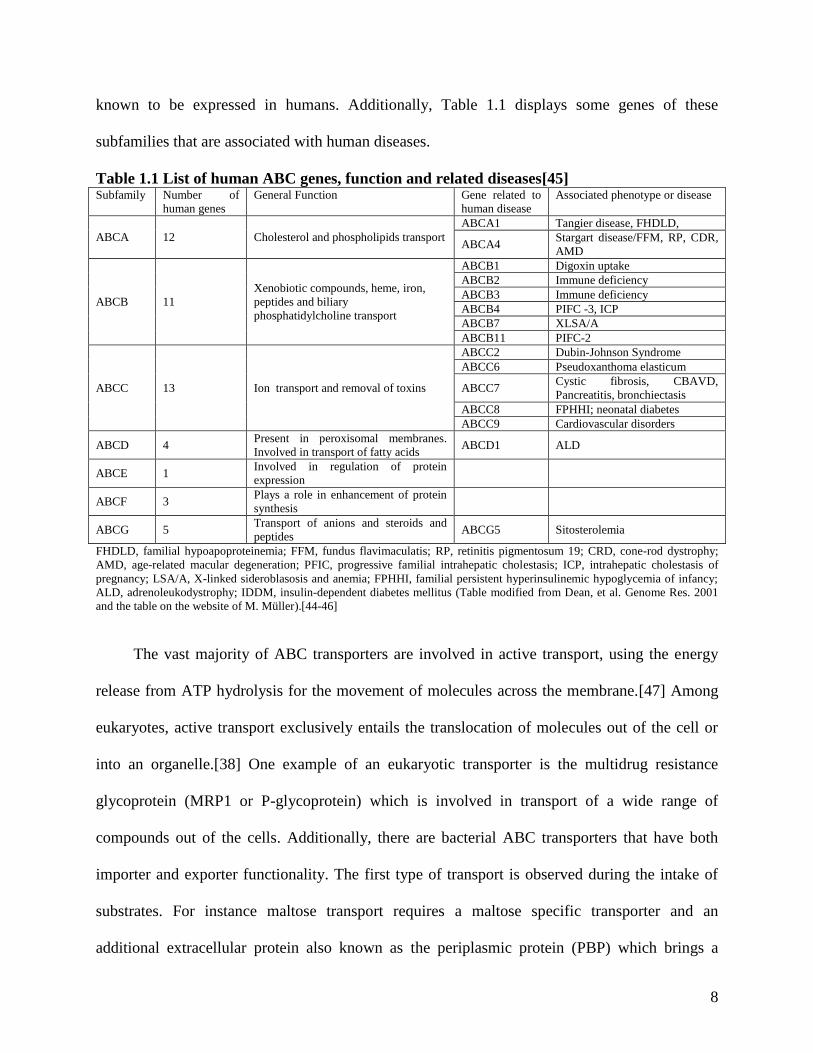
Table 1.1 List of human ABC genes, function and related diseases[45] Subfamily Number of
human genes
General Function Gene related to
human disease
Associated phenotype or disease
ABCA 12 Cholesterol and phospholipids transport
ABCA1 Tangier disease, FHDLD,
ABCA4 Stargart disease/FFM, RP, CDR,
AMD
ABCB 11
Xenobiotic compounds, heme, iron,
peptides and biliary
phosphatidylcholine transport
ABCB1 Digoxin uptake
ABCB2 Immune deficiency
ABCB3 Immune deficiency
ABCB4 PIFC -3, ICP
ABCB7 XLSA/A
ABCB11 PIFC-2
ABCC 13 Ion transport and removal of toxins
ABCC2 Dubin-Johnson Syndrome
ABCC6 Pseudoxanthoma elasticum
ABCC7 Cystic fibrosis, CBAVD,
Pancreatitis, bronchiectasis
ABCC8 FPHHI; neonatal diabetes
ABCC9 Cardiovascular disorders
ABCD 4 Present in peroxisomal membranes.
Involved in transport of fatty acids ABCD1 ALD
ABCE 1 Involved in regulation of protein
expression
ABCF 3 Plays a role in enhancement of protein
synthesis
ABCG 5 Transport of anions and steroids and
peptides ABCG5 Sitosterolemia
FHDLD, familial hypoapoproteinemia; FFM, fundus flavimaculatis; RP, retinitis pigmentosum 19; CRD, cone-rod dystrophy;
AMD, age-related macular degeneration; PFIC, progressive familial intrahepatic cholestasis; ICP, intrahepatic cholestasis of
pregnancy; LSA/A, X-linked sideroblasosis and anemia; FPHHI, familial persistent hyperinsulinemic hypoglycemia of infancy;
ALD, adrenoleukodystrophy; IDDM, insulin-dependent diabetes mellitus (Table modified from Dean, et al. Genome Res. 2001
and the table on the website of M. Müller).[44-46]
The vast majority of ABC transporters are involved in active transport, using the energy
release from ATP hydrolysis for the movement of molecules across the membrane.[47] Among
eukaryotes, active transport exclusively entails the translocation of molecules out of the cell or
into an organelle.[38] One example of an eukaryotic transporter is the multidrug resistance
glycoprotein (MRP1 or P-glycoprotein) which is involved in transport of a wide range of
compounds out of the cells. Additionally, there are bacterial ABC transporters that have both
importer and exporter functionality. The first type of transport is observed during the intake of
substrates. For instance maltose transport requires a maltose specific transporter and an
additional extracellular protein also known as the periplasmic protein (PBP) which brings a
9
maltose molecule to the transporter.[39] The second type of transport in bacterial cells is mostly
observed in the translocation of peptides, proteins and non-protein substrates such as lipids. An
example of an ABC exporter protein in bacteria cells is the lipid flippase Sav1866.[48] There are
yet some other ABC transporters that, instead of being involved in transport, have evolved to
couple conformational changes due to ATP hydrolysis to other cellular activities such as K+
channel regulation (ABCC8, SUR proteins), DNA repair (MutS and Rad50), mRNA nuclear
export (ElF1p) and chromosomal organization (SMC proteins).[38, 43]
Some of the ABC transporters that arguably have received the most interest in ABC
transporter research are the B and C subfamilies which collectively include the multidrug
resistance proteins, cystic fibrosis transmembrane conductance regulator (CFTR) and the
sulfonylurea receptors (ABCC8/SUR1 and ABBC9/SUR2).[38, 49] The human P-glycoprotein
(P-gp; MDR1; ABCB1) is a transporter that is involved in drug resistance in about 50% of
human cancers. [50] Notably, P-gP displays broad specificity and can export hundreds of
chemically and structurally different drugs but yet is quite similar to the other 48 members of the
ABC subfamilies. [49] Cystic fibrosis (CF) is caused by 1,500 mutations mostly localized
throughout CFTR, including in the nucleotide binding domains (NBDs).[51, 52] CF afflicts the
Caucasian population 1/900 to 1/2500 births.[45] The SUR proteins, which are the focus of our
research, regulate gating of the KATP channel. Defective SUR proteins are responsible for a wide
range of diseases including persistent hyperinsulinemic hypoglycaemia of infancy, type two
diabetes epilepsy and cardiovascular disorders.
1.3.1 Structure of the ABC transporters
The canonical structure of ABC transporters is composed of two transmembrane domains
(TMDs) and two cytosolic nucleotide binding domains (NBDs) (Figure 1.6).[42] In general, the
10
two TMDs and NBDs are very similar if not identical for a given ABC transporter and thus form
an internal symmetry within the transporter. [38] To date there are eleven structures of full length
ABC proteins, of which nine are prokaryotic ABC proteins and two are eukaryotic proteins. [48,
53-63]
The TMDs are composed of multiple transmembrane spanning α-helices that form the
physical pathway by which the substrates cross the membrane. Thus, the TMDs contain poorly
defined substrate binding sites, although for most ABC proteins, the specific residues involved
are yet to be elucidated.[49] Structures of full length ABC proteins revealed that the
transmembrane α-helices extend beyond the lipid bilayer into the cytosol. These long helical
extensions are connected by short loops that adopt an α-helical conformation and are known
as the coupling helices (Figure 1.6).[48] The coupling helices fit within grooves on the NBDs
and thus form the interface between the NBDs and the TMDs.[48] The coupling helices link the
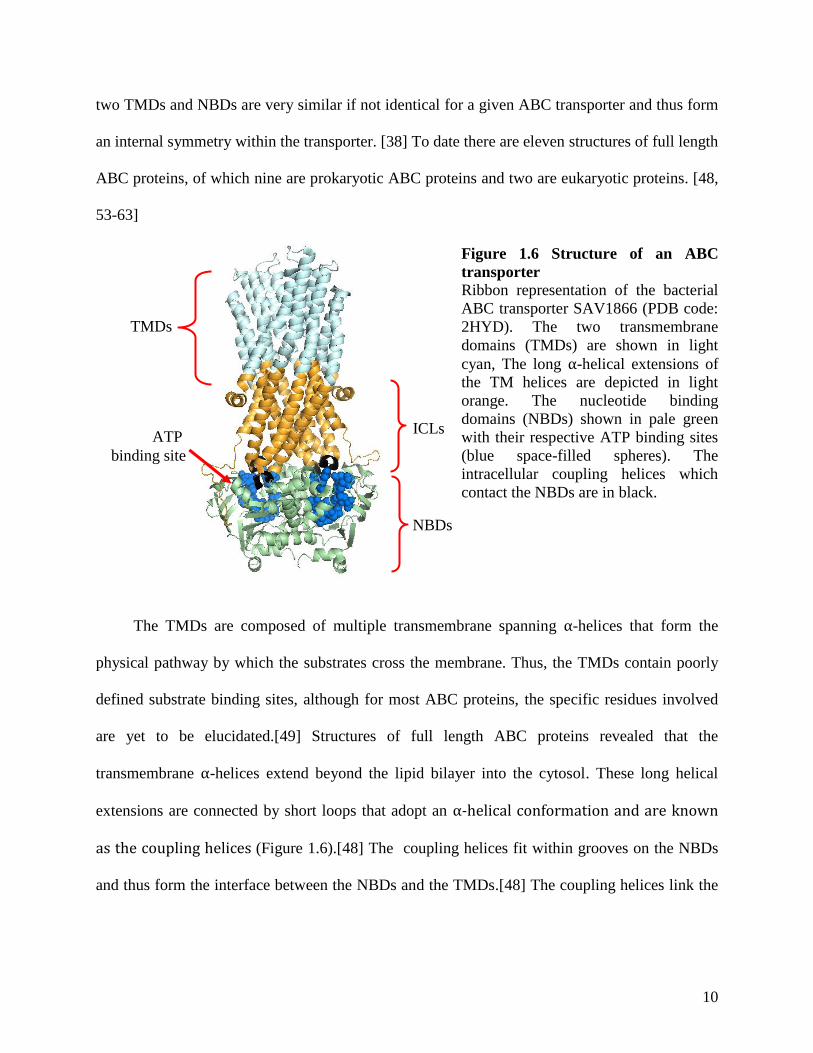
Figure 1.6 Structure of an ABC
transporter
Ribbon representation of the bacterial
ABC transporter SAV1866 (PDB code:
2HYD). The two transmembrane
domains (TMDs) are shown in light
cyan, The long α-helical extensions of
the TM helices are depicted in light
orange. The nucleotide binding
domains (NBDs) shown in pale green
with their respective ATP binding sites
(blue space-filled spheres). The
intracellular coupling helices which
contact the NBDs are in black.
TMDs
NBDs
ATP
binding site
ICLs
11
intramolecular movements due to ATP binding and hydrolysis at the NBDs to substrate transport
in the TMDS subunit (Figure 1.6).
ABC genes are organized either as full transporters where the four domains (two TMDs
and two NBDs) are encoded as a single polypeptide or separate polypeptides where each domain
is generated from one specific gene. [49] The first type of gene arrangement is usually observed
in eukaryotes, where a multidomain gene encodes for a full transporter or half a transporter.[43]
In the ABCG family, the expression of half a transporter is commonly observed, implying that
one TMD and one NBD are encoded in every gene.[64] In prokaryotes, the second arrangement
is more common; this therefore means that every domain is expressed separately and the
association of the four domains needs to occur before forming a functional transporter. This
model of expression indicates that the TMDs and NBDs function as independently interaction
units and that individual domains of the ABC transporter, such as the NBDs, can be studied in
order to obtain information about regulation of the full transporter.
1.3.2 Closer inspection on the nucleotide binding domains (NBDs)
Each NBD is divided in two main subdomains, the core subdomain and the helical
subdomain.[65] Due to the similarities that the core subdomain shares with the structure of the
RecA and part of the bovine F1-ATPase, it is referred to as the "RecA-like" or "F1-like" domain
in the literature.[66, 67] The core subdomain is formed in part by the catalytic or α/β-domain
that contains conserved residues such as the Walker A and the Walker B motif, an aromatic
residue that provides stacking interaction with adenine base of the bound ATP, and the D-,Q-,
and H-loops (Figure 1.7 A.). Each of the regions of the core subdomain have specific functions
to contribute to the nucleotide binding and hydrolysis as well as intramolecular communication.
The Walker A motif is a glycine rich consensus sequence (G-X-X-G-X-G-K-S/T) that interacts
12
with the β and γ phosphate of the ATP molecule.[68] Conversely, the Walker B motif with its ϕ-
ϕ-ϕ-ϕ-D sequence, where ϕ is any hydrophobic residue, forms part of the β sheet motif of the
NBD core and helps coordinate the magnesium ion through the aspartate residue.[67] The
stacking aromatic allows for π-π interaction with the adenine base.[42] The D-loop, with
consensus sequence SALD, is uniquely located to communicate via hydrogen bonding the active
sites from opposite monomers at the dimer interface.[69] Additionally, the conserved glutamate
that is located N-terminus of the D-loop is proposed to act as a catalytic base in concert with a
nucleophilic water molecule to hydrolyse ATP.[70, 71] The H-loop has a conserved histidine
residue that is thought to act in concert with the catalytic glutamate in ATP hydrolysis by
polarizing the water molecule.[71, 72] The Q-loop helps coordinate the Mg2+
ion, γ-phosphate,
the catalytic base and the water molecule.[71] Furthermore, the Q-loop is thought to convey
changes due to binding and hydrolysis of ATP to changes in the transporter activity.[42]
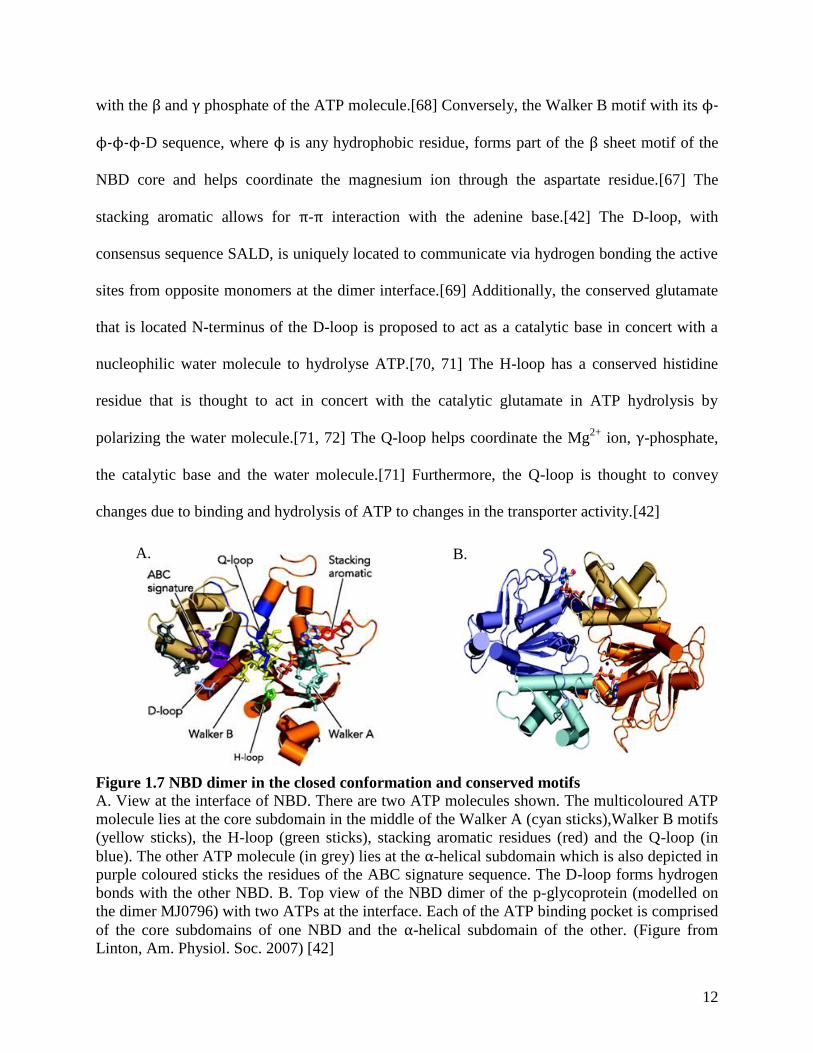
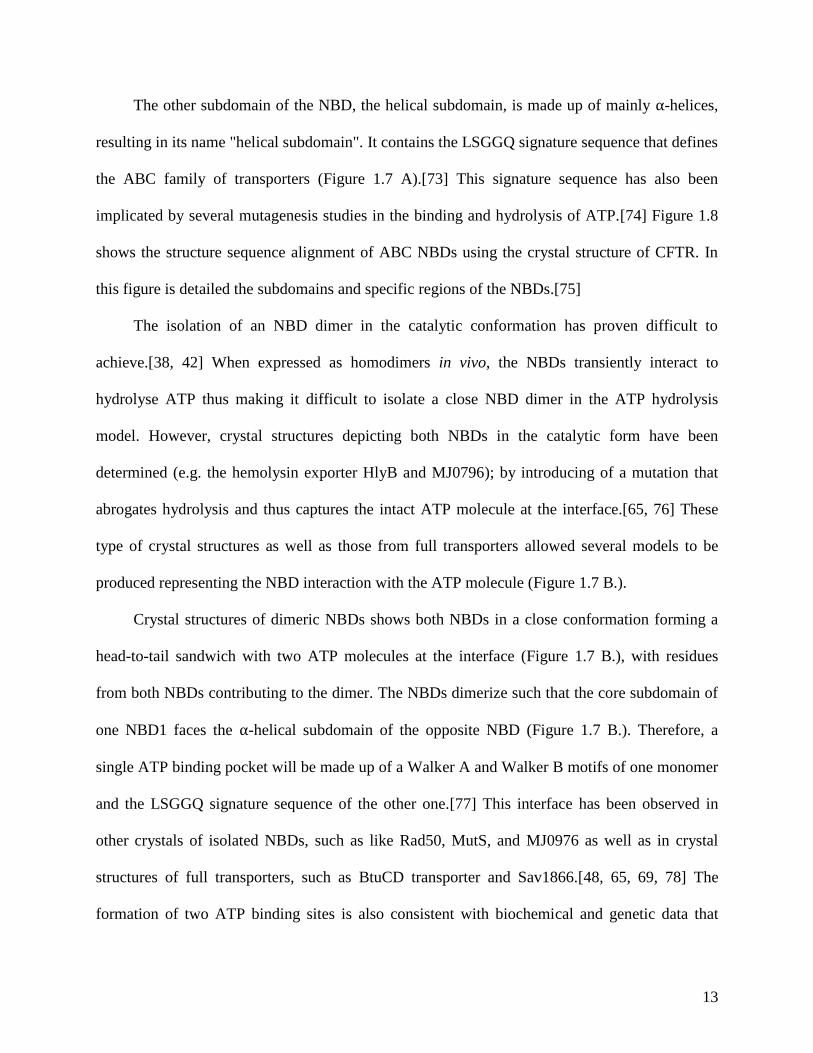
Figure 1.7 NBD dimer in the closed conformation and conserved motifs
A. View at the interface of NBD. There are two ATP molecules shown. The multicoloured ATP
molecule lies at the core subdomain in the middle of the Walker A (cyan sticks),Walker B motifs
(yellow sticks), the H-loop (green sticks), stacking aromatic residues (red) and the Q-loop (in
blue). The other ATP molecule (in grey) lies at the α-helical subdomain which is also depicted in
purple coloured sticks the residues of the ABC signature sequence. The D-loop forms hydrogen
bonds with the other NBD. B. Top view of the NBD dimer of the p-glycoprotein (modelled on
the dimer MJ0796) with two ATPs at the interface. Each of the ATP binding pocket is comprised
of the core subdomains of one NBD and the α-helical subdomain of the other. (Figure from
Linton, Am. Physiol. Soc. 2007) [42]
A. B.
13
The other subdomain of the NBD, the helical subdomain, is made up of mainly α-helices,
resulting in its name "helical subdomain". It contains the LSGGQ signature sequence that defines
the ABC family of transporters (Figure 1.7 A).[73] This signature sequence has also been
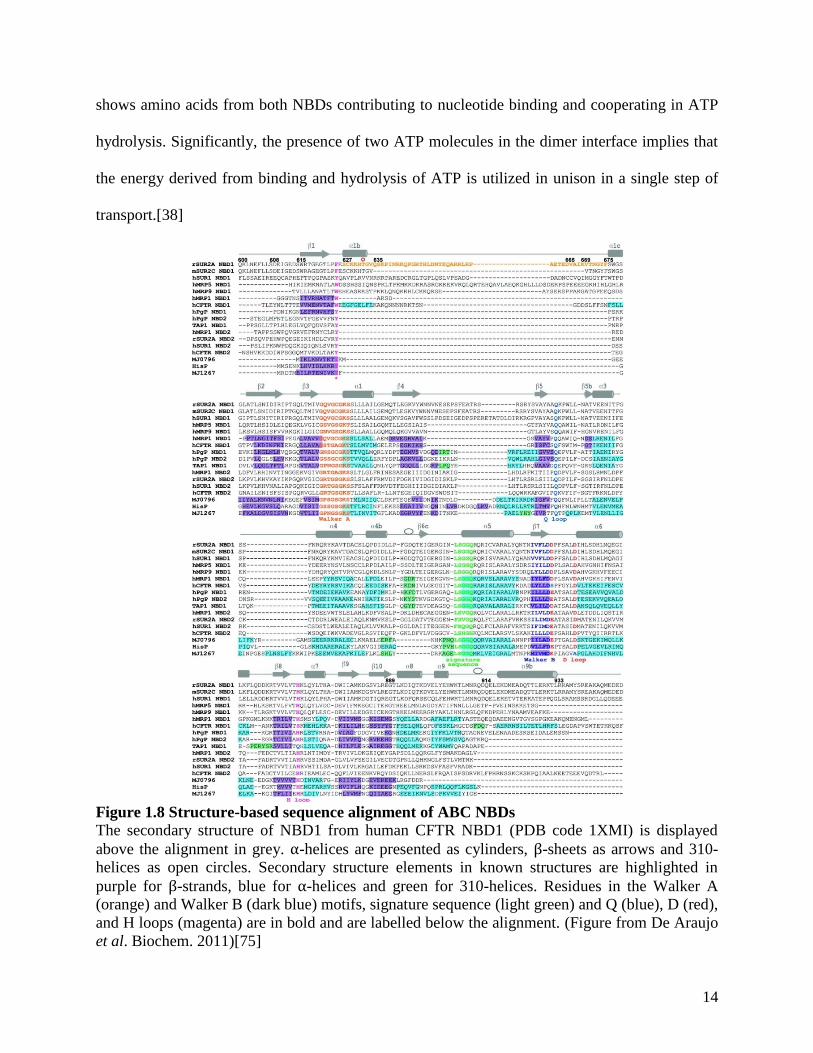
implicated by several mutagenesis studies in the binding and hydrolysis of ATP.[74] Figure 1.8
shows the structure sequence alignment of ABC NBDs using the crystal structure of CFTR. In
this figure is detailed the subdomains and specific regions of the NBDs.[75]
The isolation of an NBD dimer in the catalytic conformation has proven difficult to
achieve.[38, 42] When expressed as homodimers in vivo, the NBDs transiently interact to
hydrolyse ATP thus making it difficult to isolate a close NBD dimer in the ATP hydrolysis
model. However, crystal structures depicting both NBDs in the catalytic form have been
determined (e.g. the hemolysin exporter HlyB and MJ0796); by introducing of a mutation that
abrogates hydrolysis and thus captures the intact ATP molecule at the interface.[65, 76] These
type of crystal structures as well as those from full transporters allowed several models to be
produced representing the NBD interaction with the ATP molecule (Figure 1.7 B.).
Crystal structures of dimeric NBDs shows both NBDs in a close conformation forming a
head-to-tail sandwich with two ATP molecules at the interface (Figure 1.7 B.), with residues
from both NBDs contributing to the dimer. The NBDs dimerize such that the core subdomain of
one NBD1 faces the α-helical subdomain of the opposite NBD (Figure 1.7 B.). Therefore, a
single ATP binding pocket will be made up of a Walker A and Walker B motifs of one monomer
and the LSGGQ signature sequence of the other one.[77] This interface has been observed in
other crystals of isolated NBDs, such as like Rad50, MutS, and MJ0976 as well as in crystal
structures of full transporters, such as BtuCD transporter and Sav1866.[48, 65, 69, 78] The
formation of two ATP binding sites is also consistent with biochemical and genetic data that
14
shows amino acids from both NBDs contributing to nucleotide binding and cooperating in ATP
hydrolysis. Significantly, the presence of two ATP molecules in the dimer interface implies that
the energy derived from binding and hydrolysis of ATP is utilized in unison in a single step of
transport.[38]
Figure 1.8 Structure-based sequence alignment of ABC NBDs
The secondary structure of NBD1 from human CFTR NBD1 (PDB code 1XMI) is displayed
above the alignment in grey. α-helices are presented as cylinders, β-sheets as arrows and 310-
helices as open circles. Secondary structure elements in known structures are highlighted in
purple for β-strands, blue for α-helices and green for 310-helices. Residues in the Walker A
(orange) and Walker B (dark blue) motifs, signature sequence (light green) and Q (blue), D (red),
and H loops (magenta) are in bold and are labelled below the alignment. (Figure from De Araujo
et al. Biochem. 2011)[75]
15
1.3.2.1 ATP hydrolysis at the NBDs
Although the mechanism of ATP hydrolysis at the NBDs is still not clear, there are several
aspects of the process that have been elucidated by analysis of crystal structures, biochemical
studies using mutagenesis and molecular dynamics simulation experiments.[41, 49] ATP binding
initiates the formation of the NBD dimer. [5, 23] A prehydrolytic stage is proposed where the
nucleophilic water forms H-bonds with the catalytic glutamate residue of one NBD and the
carbonyl oxygen of the alanine residue of the D-loop of the other NBD.[65] The purpose of these
two H-bonds is to position the oxygen in the water molecule towards the γ-phosphate of
ATP.[71] The LSSGQ sequence interacts at all times with the γ-phosphate and it is vital for
positioning of the ATP molecule in the pre-hydrolytic and hydrolytic stage. ATP hydrolysis
occurs cooperatively between the two ATP-binding sites but asymmetrically.[79-81] Thus, one
ATP binding site is binding tightly to one ATP molecule while the other site is empty or bound
loosely to the nucleotide.[82, 83] The D-loop and its immediate downstream helix are
responsible for the formation of the active ATP hydrolysis site.[71] Thus, these regions of the
NBD are responsible for allowing the cooperative allostery of the two ATP sites.[49]
1.3.3 Transport mechanism of the ABC family
The mechanism by which ABC transporters translocate molecules across the lipid bilayer
has not been completely elucidated yet.[38, 49] There are two main models that attempt to
explain the mechanism of transport of the ABC family of transporters. The first one, called the
switch model, was proposed by Higgins and Linton (Figure 1.9).[38] According to this model,
transport is initiated by substrate binding to the TMDs. Support of this model comes from
mutagenesis studies with bacterial histidine and maltose permeases that demonstrated ATP
hydrolysis occurs in a futile cycle when cross-membrane signalling was abrogated.[84, 85]
16
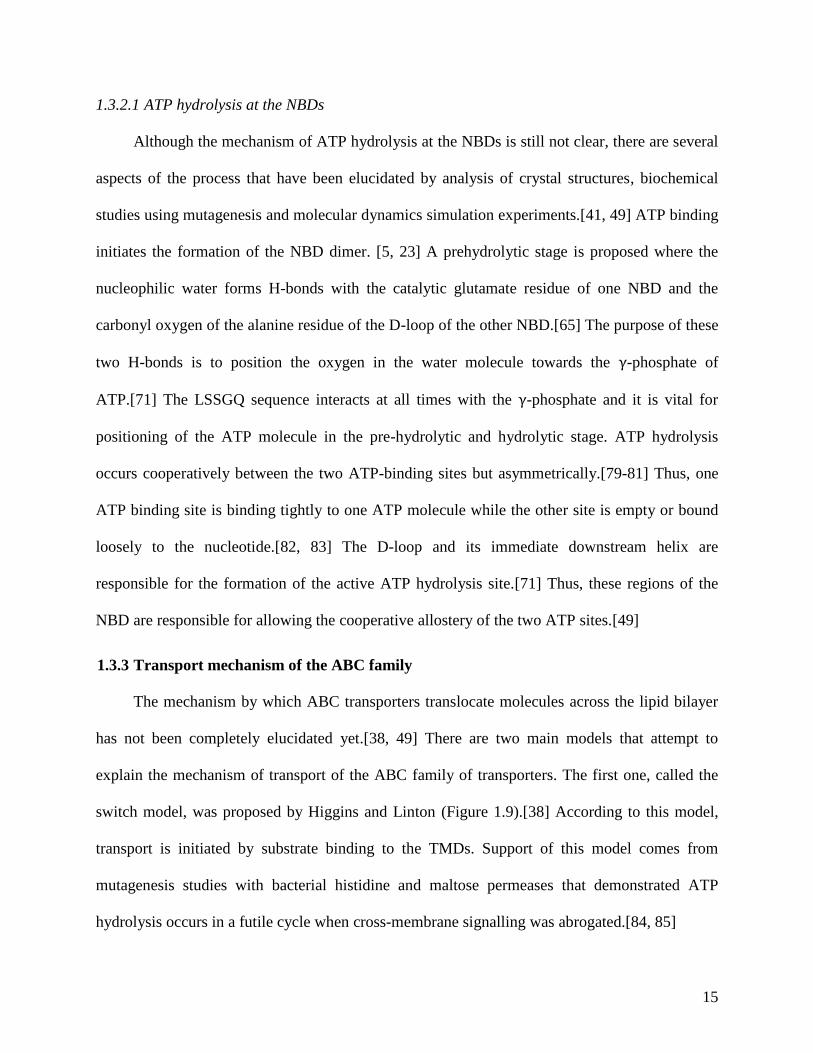
Figure 1.9 Switch model.
Ligand binding to the TMDs induces changes in the TMDs. These changes are transmitted to the
NBDs, resulting in an ATP high-affinity state. Binding of ATP is the power stroke for transport.
Hydrolysis of ATP at both ATP binding sites initiates resetting of the system. Release of ADP/Pi
makes the system return to the basal open dimer state. (Figure from Linton, Am. Physiol. Soc.
2006)[42]
The molecular events by which the signal to initiate transport is transmitted to the NBDs is
still unclear.[38] However, it seems likely that the signal is forwarded by means of the TMDs
and the Q-loops.[59, 65] The second step in transport is ATP binding which induces a closed
conformation at the NBDs.[38] The closed dimer formation has also been linked with providing
enough free energy to cause sufficient conformational changes in the TMDs to allow
transport.[65, 86] Therefore, in this model it is proposed that the ATP binding step is responsible
for providing the power stroke for transport.[38] ATP hydrolysis occurs at the NBDs and this
initiates resetting of the cycle.[42] Studies on P-gp with ATP analogues, such as vanadate, that
stabilized the post-hydrolytic state indicate that the transporter remains in the closed
configuration after ATP hydrolysis.[87] Hence, ATP hydrolysis causes conformational changes
that destabilize of the NBD dimer but seems not to affect the restoration of the transporter initial
configuration.[42, 88] The final step in the cycle is the Pi and ADP release which restores the
system to the basal stage (Figure 1.9). The NBD dimer is disrupted by electrostatic repulsion
between ADP bound to the Walker A domain and the Pi in the signature motif of the other
17
NBD.[65] Evidence from the open dimer conformation comes from crystallographic studies of
several ABC transporters that show gap of 20-30 Å between the NBDs. [53]
The constant model was recently proposed by George and Jones.[49] This model differs
fundamentally in the way the NBDs interact with each other to allow transport. While the switch
model proposes an open configuration for the NBDs at the initial state and final state of
transport, the constant models suggest that the NBDs never lose contact with one another (Figure
1.10).[89] MD simulations studies with MJ096, a bacterial NBD, provide strong evidence for
this hypothesis.[89] From this simulation, a "rocking see-saw" effect is observed that allows the
NBDs to remain in contact even after ADP/Pi release at one of the sites. Therefore, the system
alternates in between several bound/free ATP and ADP/Pi configurations in each of the ATP
binding sites (Figure 1.10). Furthermore, the constant model implies that binding of two ATP
molecules at the interface does not induce transport, but rather that the conformational changes
undergone by the NBDs during ATP hydrolysis and release of the nucleotide that occurs at any
of the ATP binding sites results in transport.[49]
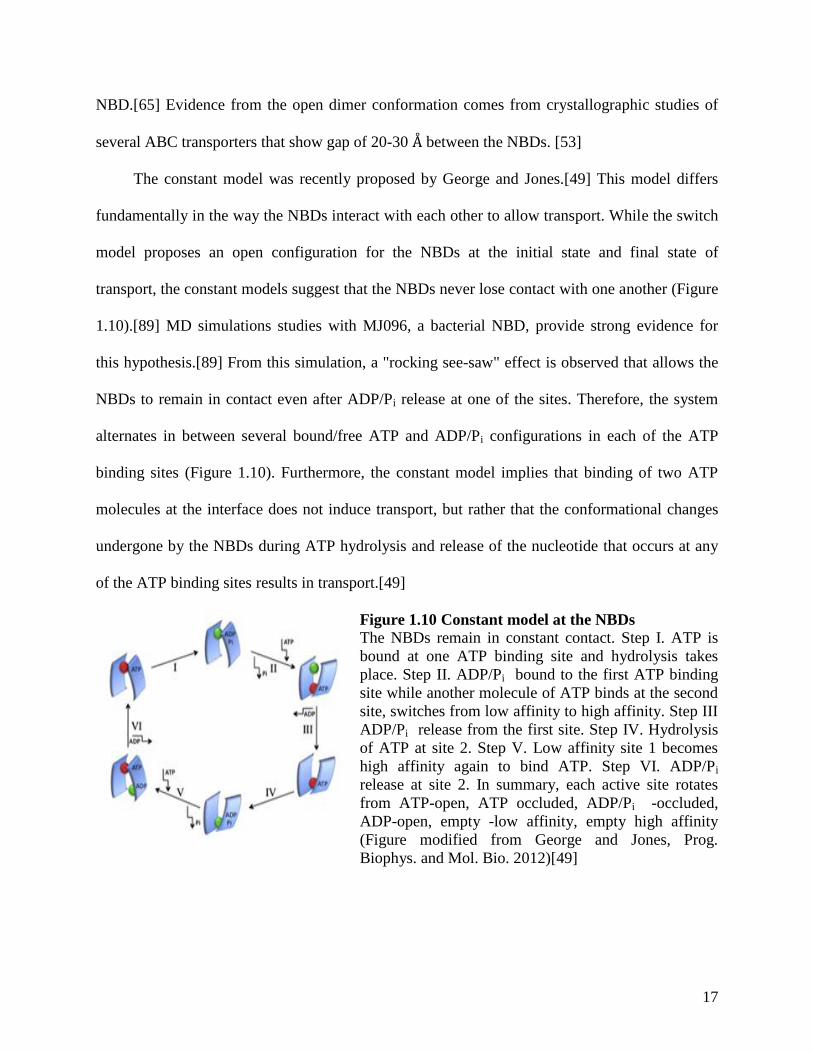
Figure 1.10 Constant model at the NBDs
The NBDs remain in constant contact. Step I. ATP is
bound at one ATP binding site and hydrolysis takes
place. Step II. ADP/Pi bound to the first ATP binding
site while another molecule of ATP binds at the second
site, switches from low affinity to high affinity. Step III
ADP/Pi release from the first site. Step IV. Hydrolysis
of ATP at site 2. Step V. Low affinity site 1 becomes
high affinity again to bind ATP. Step VI. ADP/Pi
release at site 2. In summary, each active site rotates
from ATP-open, ATP occluded, ADP/Pi -occluded,
ADP-open, empty -low affinity, empty high affinity
(Figure modified from George and Jones, Prog.
Biophys. and Mol. Bio. 2012)[49]
18
1.4 The sulfonylurea receptor (SUR)
The sulfonylurea receptors (SURs) ABCC8/SUR1 and ABCC9/SUR2 are members of the
ABC family of transporters but do not possess an intrinsic transport function.[90] Instead, they
function as the regulatory subunits of the KATP channels (Figure 1.1). Similar to other ABC
transporters, the SUR proteins possess a core made up of two bundles of six transmembrane
helices and two NBDs.[90] However, the SUR proteins and some other ABC proteins (i.e. some
of the MRPs) have a an additional five N-terminal α-helix transmembrane domain denominated
(TMD0) that is connected to the minimum ABC protein structure via an intracellular linker
termed "L0" linker (Figure 1.11).[77] The role of the TMD0 is different in MRP and SUR
proteins. Studies of the TMD0 domain in the SUR1 protein indicate that the TMD0 and L0 are
involved in controlling gating of the channel.[91] In the cadmium yeast transporter Ycf1p (which
is similar to human MRP1), the L0 linker is involved in transport as it might be involved in metal
ion recognition.[92]
Similar to the NBDs of other ABC proteins, the NBDs have several conserved motifs.
These include Walker A, Walker B, Q-loop, H-loop, D-loop and aromatic residues.[77]
Interestingly, the SUR NBDs are non-degenerate, non symmetric and posses non-canonical
Walker B and signature sequence.[93] Whereas NBD2 exhibits an Asp-Glu pair in the Walker B
motif, NBD1 features two aspartic acid residues, Asp-Asp. This difference between NBD1 and
NBD2 Walker B motifs is significant as the glutamate residue in NBD2 changes the catalytic
activity.[42] Furthermore, the ABC signature in NBD2 is different; while NBD1 has the highly
conserved LSGGQ sequence, NBD2 possesses the FSQGQ sequence.[94] Thus, one of the ATP
binding and hydrolysis sites in the SUR NBDs is better conserved than the other and implies that
only the NBD2 composite site (define) is active (Figure 1.11).
19
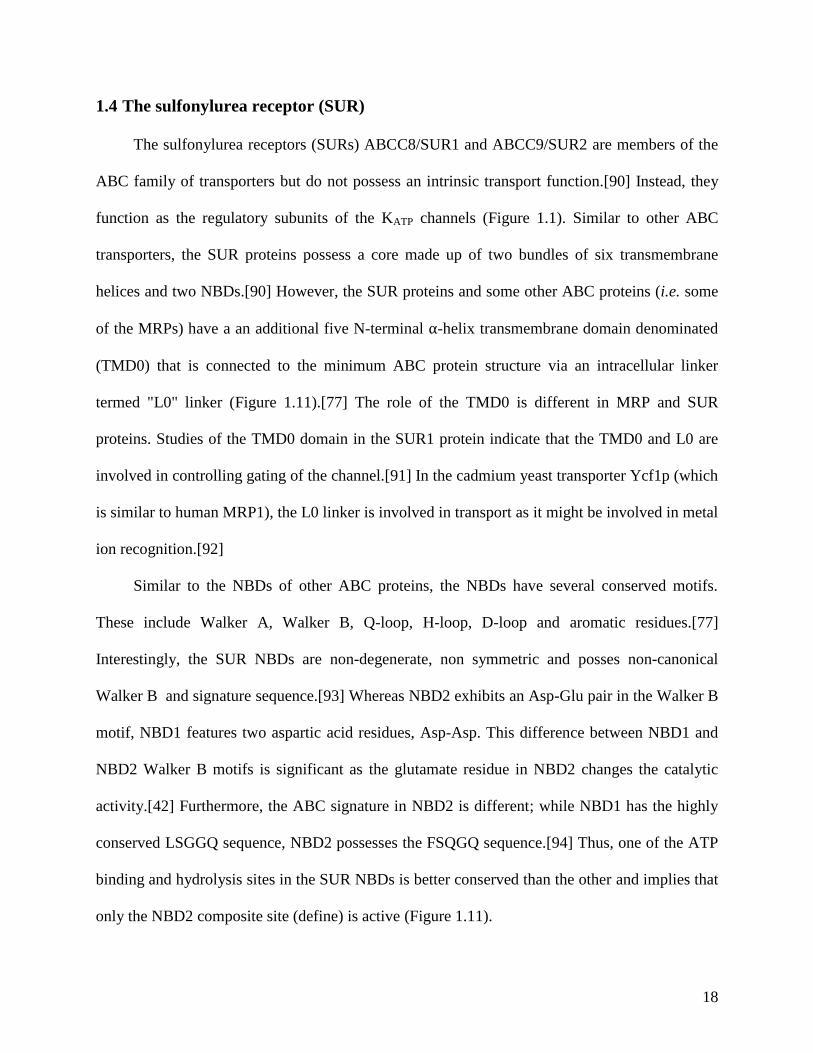
Figure 1.11 Sulfonylurea receptor (SUR)
A) Lateral view of a single SUR subunit. The SUR subunit depicts three transmembrane domains
(TMD0, TMD1 and TMD2), the L0 linker, and the nucleotide binding domains (NBD1 and
NBD2). Within the nucleotide binding domains two different ATP binding sites (ABS1 and
ABS2) can be noted B) Model structure of the SUR protein from prokaryotic and eukaryotic
proteins. (Modified from Flagg, et al. Physiol. Rev. 2010)[23]
Another particular trait of SUR1 and SUR2 proteins is that they have an insertion of 13 and
4 residues, respectively, between the NBD1 Walker A motif and the Q-loop.[94] This
characteristic is different in the ABCC subfamily of proteins where instead, there is a 13 residue
deletion at this position.[95] The insertion found in the SUR proteins is thought to be the contact
point of the coupling helixes of the opposing TMD and NBD1.[48]
The structural asymmetries observed between both NBDs directly correlates with
functional differences between the two ATP binding sites. Similar to other NBDs of the ABCC
subfamily, the ATPase activity of each of the ATP binding sties is different. Thus, site 2 that
resembles that of most ABC transporters (LSGGQ sequence of NBD1, and Walker B of NBD2
with residues DE) has greater ATPase activity than site 1.[96] Structural models of NBD1
corroborate this hypothesis by showing that the glutamate residue of the Walker B of NBD2 is
closer and better positioned to the γ-phosphate of ATP than the aspartate of NBD1, which is
A. B.
20
~1.5 Å farther away from the γ-phosphate.[77] Furthermore, mutational studies showed that the
binding of Mg2+
-ADP to site 2 (mutation E to D) and ATP to site (mutation D to E) lead changes
in KATP channel activity.[77, 97]
1.4.1 Isoforms and splice variants of the SUR protein
There are two genes, SUR1 and SUR2, that encode for SUR protein as well as various
splice variants of each. The SUR1 and SUR2 proteins mainly differ in their affinity to bind
sulfonylureas; thus SUR1 has high-affinity for sulfonylureas while SUR2 has a lower
affinity.[18, 19] Additionally, the SUR2 gene exists within the body as two splice variants that
differ in the usage of C-terminal exon, exon 38 in mice, which encodes the C-terminal 42
residues in the SUR protein known as the C42 region.[18, 98] These variants are commonly
denominated SUR2A and SUR2B and have also been cloned in mice, rats, rabbits and
humans.[24, 99] Interestingly, these two splice variants respond differently to the KATP channel
opener diazoxide. SUR2B makes the KATP channel diazoxide sensitive while SUR2A has the
opposite effect.[24] The SUR1 and SUR2 proteins are widely distributed within the body;
however, in some tissues there is a preferential expression for either of the two proteins or
isoforms of SUR2 (Table 1.2). The transcripts of SUR1 are mostly abundant in the brain and
pancreatic β-cells.[19] Conversely, the SUR2A and SUR2B expression is mostly detected in the
heart, skeletal and smooth muscle as well as widely distributed in many other tissues.[18]
Several other splice variants of SUR2A and SUR2B were later characterized. The splice
variant lacking exon 17 in mice (15 amino acids) was identified for SUR2A and SUR2B.[100]
Additionally, one other variant originally called SUR2C lacking exon 14 comprising of 35 amino
acids was found in SUR2A.[101] Similarly, for SUR1, it has been determine the existence of a
total of six splice variants. Gros et al. reported the variant of SUR1 missing exon 31 that
21
essentially leads to the loss of TM helixes 16 and 17.[102] Later identified was the variant
lacking exon 33 in mice.[103] This variant of SUR1 contains a frame shift mutation and a
deletion at NBD2. The reconstituted channel with this variant has four-fold higher ATP
sensitivity than that of the channel containing the SUR1 variant.[103] Table 1.3 summarizes the
different splice patterns for each of the splice variants.
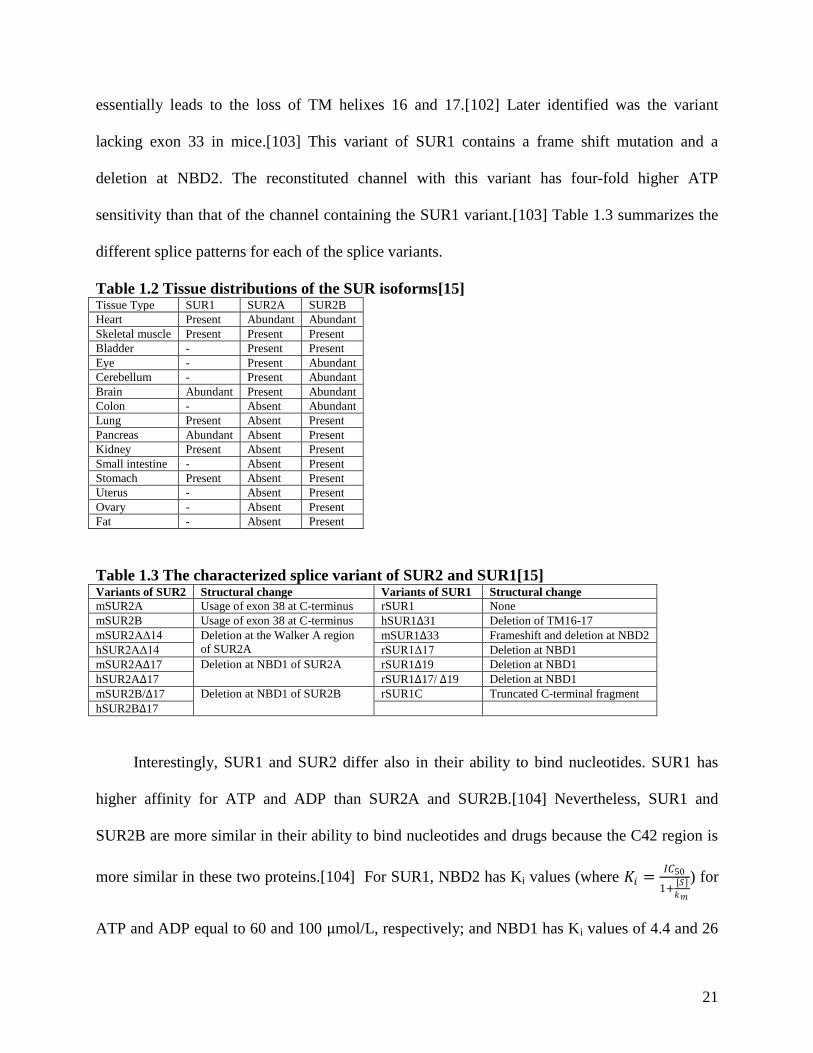
Table 1.2 Tissue distributions of the SUR isoforms[15] Tissue Type SUR1 SUR2A SUR2B
Heart Present Abundant Abundant
Skeletal muscle Present Present Present
Bladder - Present Present
Eye - Present Abundant
Cerebellum - Present Abundant
Brain Abundant Present Abundant
Colon - Absent Abundant
Lung Present Absent Present
Pancreas Abundant Absent Present
Kidney Present Absent Present
Small intestine - Absent Present
Stomach Present Absent Present
Uterus - Absent Present
Ovary - Absent Present
Fat - Absent Present
Table 1.3 The characterized splice variant of SUR2 and SUR1[15] Variants of SUR2 Structural change Variants of SUR1 Structural change
mSUR2A Usage of exon 38 at C-terminus rSUR1 None
mSUR2B Usage of exon 38 at C-terminus hSUR1Δ31 Deletion of TM16-17
mSUR2AΔ14 Deletion at the Walker A region
of SUR2A mSUR1Δ33 Frameshift and deletion at NBD2
hSUR2AΔ14 rSUR1Δ17 Deletion at NBD1
mSUR2AΔ17 Deletion at NBD1 of SUR2A rSUR1Δ19 Deletion at NBD1
hSUR2AΔ17 rSUR1Δ17/ Δ19 Deletion at NBD1
mSUR2B/Δ17 Deletion at NBD1 of SUR2B rSUR1C Truncated C-terminal fragment
hSUR2BΔ17
Interestingly, SUR1 and SUR2 differ also in their ability to bind nucleotides. SUR1 has
higher affinity for ATP and ADP than SUR2A and SUR2B.[104] Nevertheless, SUR1 and
SUR2B are more similar in their ability to bind nucleotides and drugs because the C42 region is
more similar in these two proteins.[104] For SUR1, NBD2 has Ki values (where 𝐾𝑖 =𝐼𝐶50
1+[𝑆]
𝑘𝑚
) for
ATP and ADP equal to 60 and 100 μmol/L, respectively; and NBD1 has Ki values of 4.4 and 26
22
μmol/L.[105] SUR2A NBD1 and NBD2 have higher Ki values than the SUR1 NBDs thus lower
affinity to nucleotides. The Ki values for ATP and ADP are 110 and 86 μmol/L, respectively for
rSUR2A NBD1 and Ki values of 120 and 170 μmol/L for rSUR2A NBD2.[105] The Ki values
for ATP and ADP of SUR2B NBD1 are 51 and 66 μmol/L and at NBD2 of 38 and 67 μmol/L,
respectively.[105] This difference between the two isoforms is directly correlated with tissue
specific responses of the KATP channels.[104]
1.5 Physical link and regulation of Kir6 by SUR and vice versa
The SUR protein has not only a physical interaction with the Kir6.2 as already shown by
previously obtained cryoEM structures[14] but also exerts regulatory effects on the Kir subunit
of the KATP sensitive channel. The first level of control is at the expression level where in the
absence of the SUR protein the Kir6 subunit is unable to reach the surface membrane.[1] This is
in turn owing to an endoplasmic reticulum retention sequence (consensus sequence RXR and
RKR in Kir6) in the C-terminus of the protein that is masked by the presence of the SUR protein
to allow of trafficking of the KATP channel to the plasma membrane.[106] Mutation or deletion of
the RKR motif (Kir6.2ΔC) allows the expression of the Kir6.2 in the lipid membrane thus
enabling the study of its intrinsic properties.[106, 107] First, the channel activity of the Kir6.2
unit alone exhibits lower open probability, going from 0.4 to 0.1.[5] In addition, the ATP
sensitivity is decrease 10 fold and thus the IC50 changes from 100 μM to 10 μM when SUR1 is
absent.[107] Lastly, in the absence of SUR1, the pore subunit has very little sensitivity to
therapeutic drugs which regularly act by binding directly to the SUR1 subunit (glibenclamide,
tolbutamide, diazoxide).[108]
The function of SUR1 is also affected by the absence of Kir6.2. In the absence of the
Kir6.2 subunit, the SUR protein has lower Km for ATP hydrolysis (0.1 M for SUR1 and 0.3 M
23
for KATP channels) which indicates that there is lower affinity of KATP channel complex for
MgATP.[14, 96] Additionally, these studies also showed that the turnover rate of the full channel
complex to be higher than that for purified SUR1.[14, 96]
Several regions of the SUR and Kir6.2 subunits enter in direct contact which allows the
SUR protein to control the channel activity. For example, the interaction between the TMs of
SUR1 and the first TM of Kir6.2 are required for membrane trafficking as well as regulation of
channel gating.[109] Evidence of this interaction comes from studies that show the expression of
the TMD0 and L0 linker are sufficient to vary gating of the Kir6.2ΔC pore. Co-expression of
TMD0-L0 of SUR1 and Kir6.2ΔC resulted in an open probability of 0.6 compared to 0.1 for
Kir6.2ΔC alone.[74] Furthermore, other studies showed that the mutation F132L in SUR1 L0
linker disrupts the ability of the channel to close which increases the open probability.[110] This
indicated that this mutation disrupted the inhibitory interaction of the SUR1 protein and Kir
subunits while still permitting the stimulatory interaction.[110]
1.5.1 Nucleotide regulation of channel activity via the SUR protein
In the presence of ATP, the Kir subunit is inhibited and thus the physiological activation of
the KATP channel arises from the interaction of nucleotides with the NBDs of the SUR protein.[5]
Several models of nucleotide binding to the SUR NBDs and their implication in channel activity
have been proposed to date. Figure 1.12 depicts the model proposed by Nichols.[5] This model
proposes that hydrolysis at the NBDs drives channel opening.[5]
24
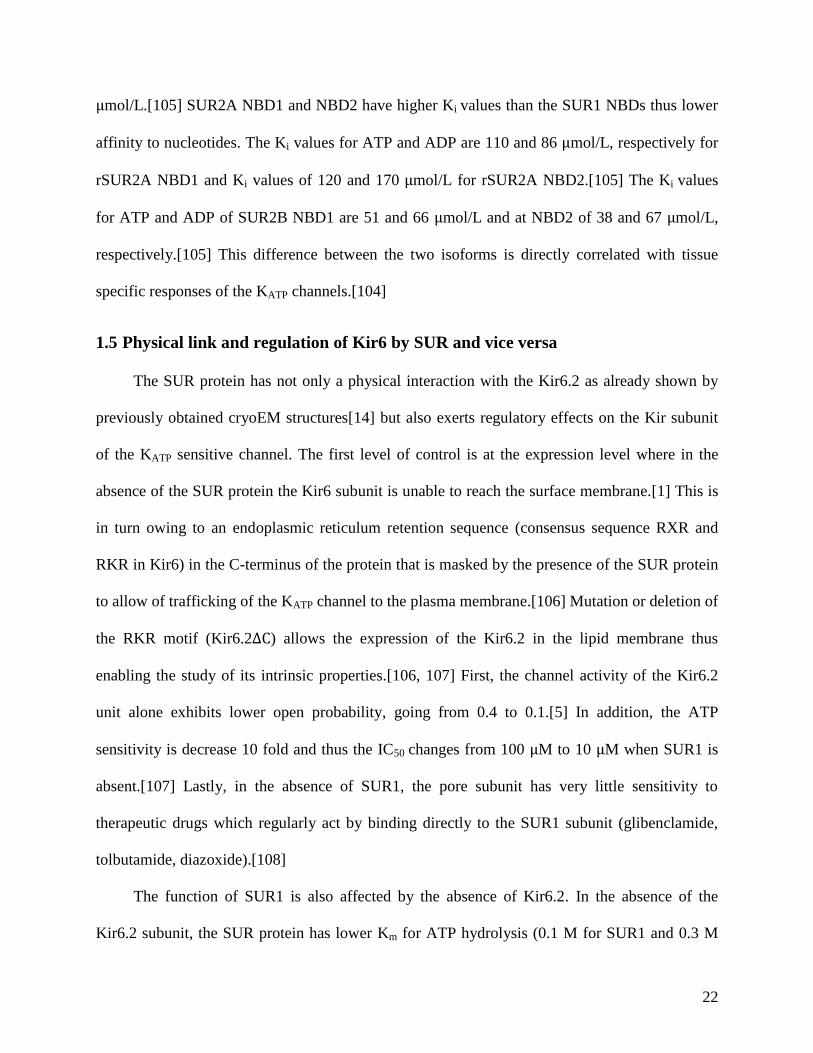
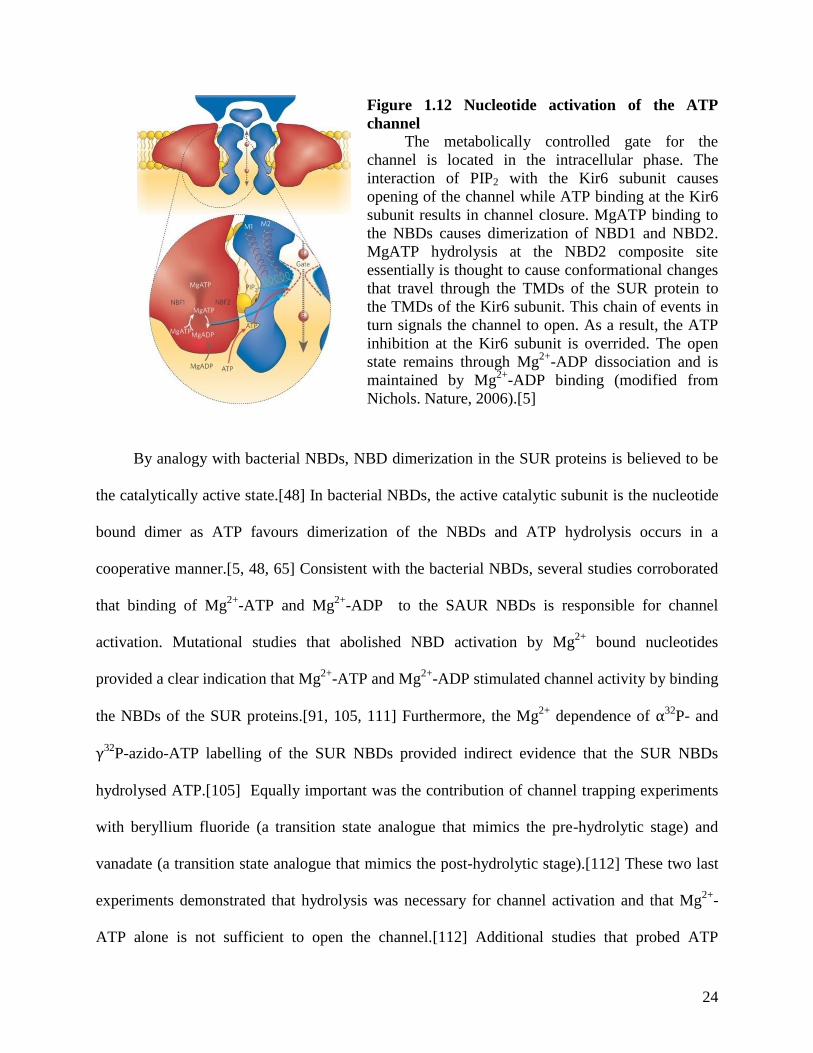
Figure 1.12 Nucleotide activation of the ATP
channel
The metabolically controlled gate for the
channel is located in the intracellular phase. The
interaction of PIP2 with the Kir6 subunit causes
opening of the channel while ATP binding at the Kir6
subunit results in channel closure. MgATP binding to
the NBDs causes dimerization of NBD1 and NBD2.
MgATP hydrolysis at the NBD2 composite site
essentially is thought to cause conformational changes
that travel through the TMDs of the SUR protein to
the TMDs of the Kir6 subunit. This chain of events in
turn signals the channel to open. As a result, the ATP
inhibition at the Kir6 subunit is overrided. The open
state remains through Mg2+
-ADP dissociation and is
maintained by Mg2+
-ADP binding (modified from
Nichols. Nature, 2006).[5]
By analogy with bacterial NBDs, NBD dimerization in the SUR proteins is believed to be
the catalytically active state.[48] In bacterial NBDs, the active catalytic subunit is the nucleotide
bound dimer as ATP favours dimerization of the NBDs and ATP hydrolysis occurs in a
cooperative manner.[5, 48, 65] Consistent with the bacterial NBDs, several studies corroborated
that binding of Mg2+
-ATP and Mg2+
-ADP to the SAUR NBDs is responsible for channel
activation. Mutational studies that abolished NBD activation by Mg2+
bound nucleotides
provided a clear indication that Mg2+
-ATP and Mg2+
-ADP stimulated channel activity by binding
the NBDs of the SUR proteins.[91, 105, 111] Furthermore, the Mg2+
dependence of α32P- and
γ32P-azido-ATP labelling of the SUR NBDs provided indirect evidence that the SUR NBDs
hydrolysed ATP.[105] Equally important was the contribution of channel trapping experiments
with beryllium fluoride (a transition state analogue that mimics the pre-hydrolytic stage) and
vanadate (a transition state analogue that mimics the post-hydrolytic stage).[112] These two last
experiments demonstrated that hydrolysis was necessary for channel activation and that Mg2+
-
ATP alone is not sufficient to open the channel.[112] Additional studies that probed ATP
25
binding properties of SUR1 with 8-azido-ATP followed by trypsinization suggested that NBD2
binding to Mg2+
-ADP was the most important requirement for channel activation.[113]
1.5.2 Allosteric regulation on the SUR protein affects channel activity
Understanding the role of specific regions of the KATP channel is imperative for elucidating
other ways in which the activity of the channel is regulated. Recently, the role of the region
located between the linker of NBD1 and the second transmembrane domain made up of 15
negatively charged residues (948-EDEDEEEEEEEEDEED-962) was determined in the activity
of the full KATP channel complex.[114] Comparison of the protein sequence of several ABCC
members indicated that the ED is not conserved but still matches the location of the R domain of
CFTR.[99, 114] This domain has been implicated in controlling gating of Cl- ions when
phosphorylated.[99] This unique location of the ED domain leaded to the hypothesis that the ED
can act as allosteric regulator of the KATP channel.[114] Mutational studies where the entire
domain was replaced with neutrally charged analogues or deleted completely demonstrated that
ED domain was important for nucleotide binding.[114] Additionally, the ED domain is critically
for the proper activation of the channel by Mg2+
-ADP and potassium channel opener (KCO),
pinacidil.[114] The disruption was attributed to the destabilization of the NBD dimer when the
ED domain was mutated. The loss of the ED domain therefore locks the NBDs in a suboptimal
state that renders the channel less sensitive to KCOs and nucleotides. Furthermore, the
modification of the ED domain (mutations: E to Q and D to N) endowed with increase sensitivity
to the antagonism role of ATP in the Kir6.2 subunit.[114] The channels with defective or absent
ED domain also exhibited decrease sensitivity to glyburide, a sulfonylurea that closes the
channel.[114] The ED domain is suggested to be an important structural component that helps
26
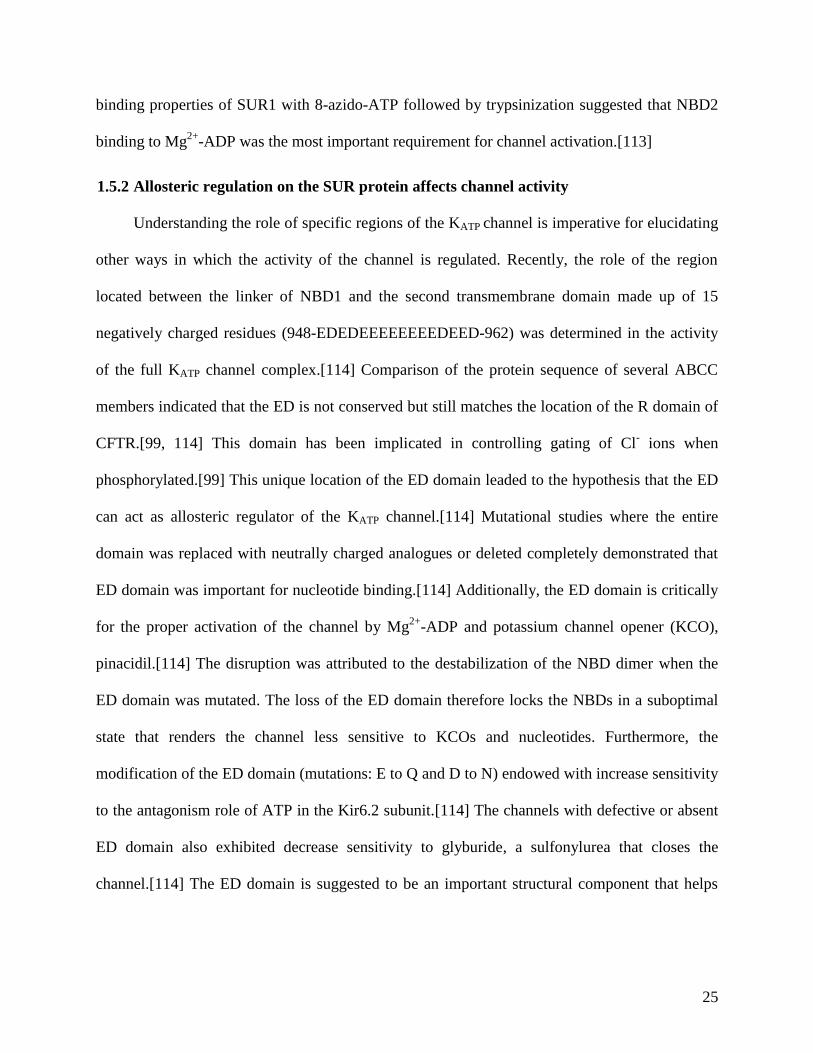
communicate diverse nucleotide- dependent states in the NBDs with the pore gating. The results
of this study are summarized in the model depicted in Figure 1.13.
Figure 1.13 Role of the ED domain
Role of the ED domain in the KATP channel. A. The ED domain is vital for the NBDs cooperative
dimerization. Channel activation occurs by binding of Mg2+
-ADP and potassium channel openers
(KCO). ATP-dependent Kir6.2 inhibition is allowed by the ED domain B. Glyburide binding
disrupts the cooperative NBD binding in presence of non-modified ED domain. The NBDs/ED
interaction is vital for the transduction of glyburide binding to the channel activity. C. Modified
ED domain destabilizes the NBD dimer thus inhibiting proper communication between different
channel subunits. Hence, the channels with disrupted ED domain have decrease sensitivity to
potassium channel openers, MgADP and glyburide. Additionally, inhibition of ATP to the Kir6.2
subunit is also decreased (Figure obtained from Karger et al. J Gen Phys. 2008). [114]
1.5.3 Regulation of the KATP channel by phosphorylation
The phosphorylation of ATP-sensitive potassium channels by protein kinases is an
important mechanism by which cellular excitability is regulated by signalling pathways.[115]
The most common mechanisms of phosphorylation of ion channels are mediated by protein
kinase A (PKA) and protein kinase C (PKC).[116] These enzymes add phosphate groups on
threonine and serine residues to alter the properties of the protein.[116] Phosphorylation can
affect the kinetics of the protein and thus can vary the number of active channels at the cell
membrane.[117] Despite extensive studies performed on the phosphorylation effects on ion
channels, very little is still known about the molecular basis of phosphorylation on the KATP
channels subunits.[117] To date, several phosphorylation sites have been identified (Figure
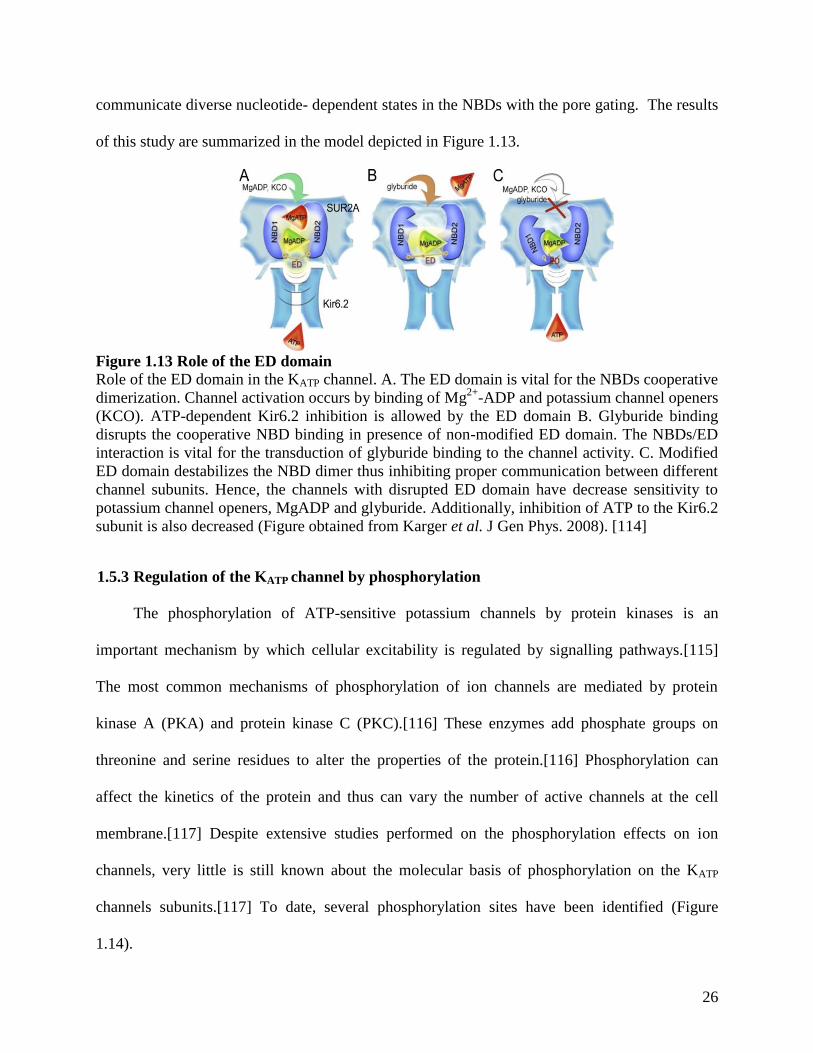
1.14).
27
Figure 1.14 Phosphorylation sites
of Kir6.2 and SUR2A
Schematic representation of one
Kir6.2 and SUR1 subunits. The
black dots represent the
phosphorylation sites. (modified
from Beguin et al. EMBO.
1999)[117]
Analysis of the amino acid sequence revealed that in the Kir6.2 subunit, the
phosphorylation sites are T224 and S372.[117] In SUR1, the phosphorylation sites are T949 in
NBD1 and in NBD2 S1446, S1500 and S1571.[117] The phosphorylation sites in SUR2 are
conserved among all splice variants.[118] NBD1 SUR2 has one phosphorylation site at T633
(NBD1) while NBD2 has two phosphorylation sites, one at S1387 and a second site at
S1465.[118, 119] Conformational changes in SUR1 and in the SUR2 isoforms due to
phosphorylation have different consequences on channel activity. The phosphorylation of SUR1
NBD2 (S1446 or S1571) leads to decrease conductance of K+ ions across the membrane by
affecting the open probability of the channel.[117] Furthermore, functional channel expression of
SUR1 S1571A is reduced and this in turn seems to indicate that PKA phosphorylation might be
involved in trafficking of the channel. In contrast, phosphorylation of the SUR2 isoform has
stimulatory effects on KATP channel activity by increasing the stability of the open state. [118]
1.6 The KATP channels in the pancreas and heart tissues
When regulation of gating of the Kir subunit by the SUR protein is compromised, several
types of diseases become prevalent.[5, 23] In the pancreas, aberrant function of the KATP channel
results in disorders related to glucose and insulin regulation.[1, 94]
28
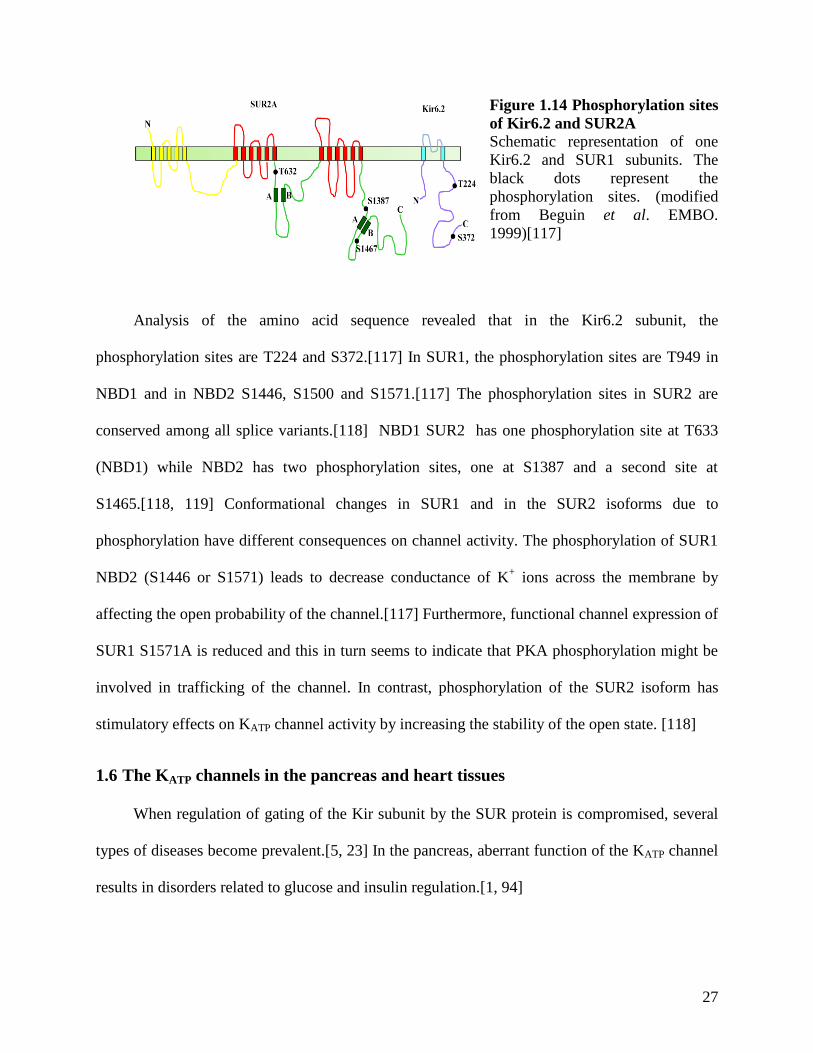
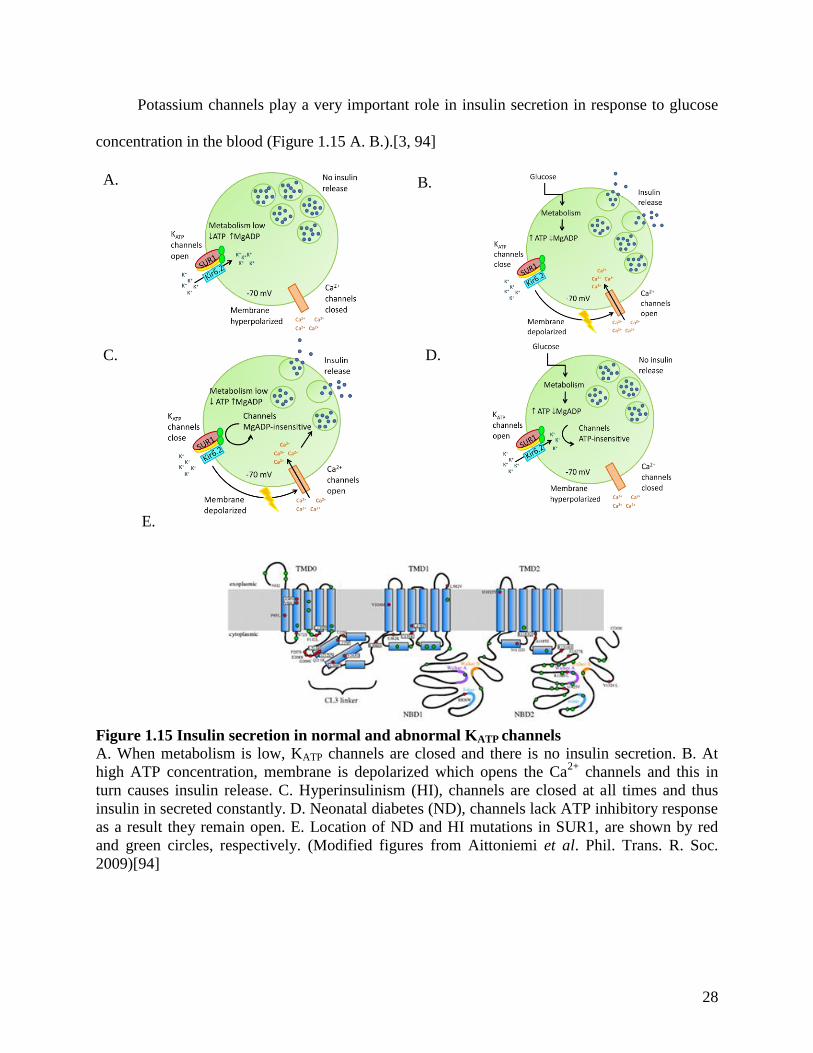
Potassium channels play a very important role in insulin secretion in response to glucose
concentration in the blood (Figure 1.15 A. B.).[3, 94]
Figure 1.15 Insulin secretion in normal and abnormal KATP channels
A. When metabolism is low, KATP channels are closed and there is no insulin secretion. B. At
high ATP concentration, membrane is depolarized which opens the Ca2+
channels and this in
turn causes insulin release. C. Hyperinsulinism (HI), channels are closed at all times and thus
insulin in secreted constantly. D. Neonatal diabetes (ND), channels lack ATP inhibitory response
as a result they remain open. E. Location of ND and HI mutations in SUR1, are shown by red
and green circles, respectively. (Modified figures from Aittoniemi et al. Phil. Trans. R. Soc.
2009)[94]
B.
C. D.
A.
E.
29
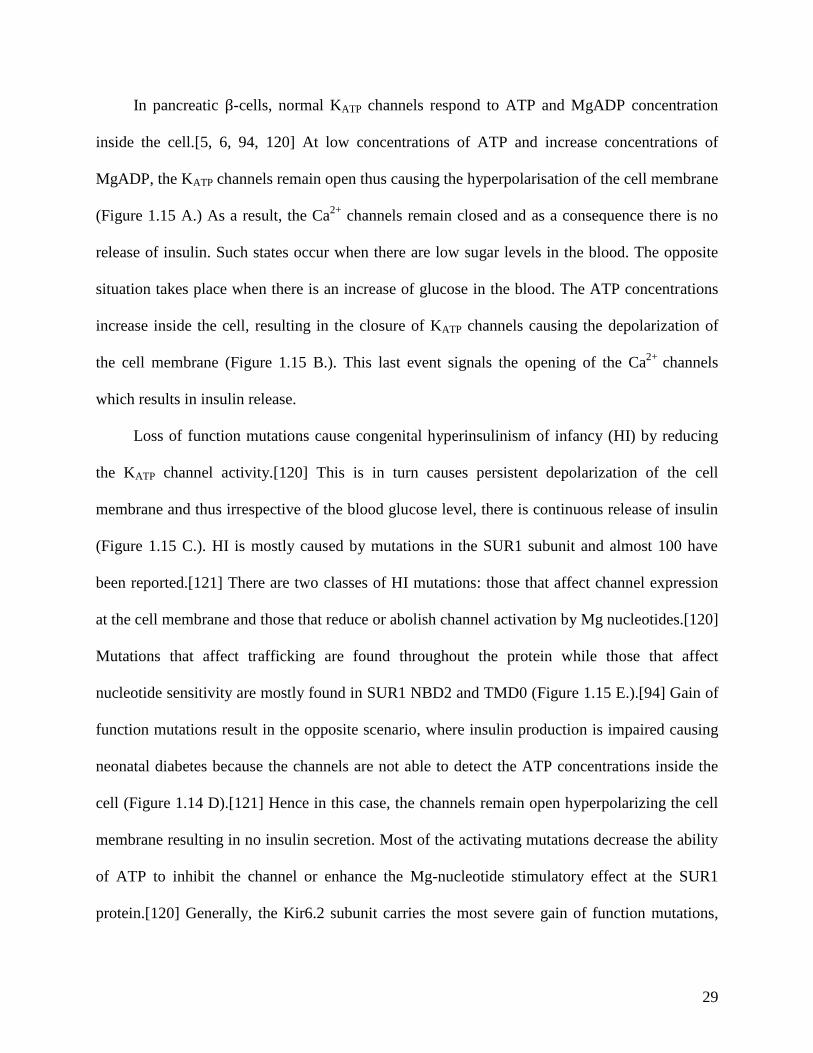
In pancreatic β-cells, normal KATP channels respond to ATP and MgADP concentration
inside the cell.[5, 6, 94, 120] At low concentrations of ATP and increase concentrations of
MgADP, the KATP channels remain open thus causing the hyperpolarisation of the cell membrane
(Figure 1.15 A.) As a result, the Ca2+
channels remain closed and as a consequence there is no
release of insulin. Such states occur when there are low sugar levels in the blood. The opposite
situation takes place when there is an increase of glucose in the blood. The ATP concentrations
increase inside the cell, resulting in the closure of KATP channels causing the depolarization of
the cell membrane (Figure 1.15 B.). This last event signals the opening of the Ca2+
channels
which results in insulin release.
Loss of function mutations cause congenital hyperinsulinism of infancy (HI) by reducing
the KATP channel activity.[120] This is in turn causes persistent depolarization of the cell
membrane and thus irrespective of the blood glucose level, there is continuous release of insulin
(Figure 1.15 C.). HI is mostly caused by mutations in the SUR1 subunit and almost 100 have
been reported.[121] There are two classes of HI mutations: those that affect channel expression
at the cell membrane and those that reduce or abolish channel activation by Mg nucleotides.[120]
Mutations that affect trafficking are found throughout the protein while those that affect
nucleotide sensitivity are mostly found in SUR1 NBD2 and TMD0 (Figure 1.15 E.).[94] Gain of
function mutations result in the opposite scenario, where insulin production is impaired causing
neonatal diabetes because the channels are not able to detect the ATP concentrations inside the
cell (Figure 1.14 D).[121] Hence in this case, the channels remain open hyperpolarizing the cell
membrane resulting in no insulin secretion. Most of the activating mutations decrease the ability
of ATP to inhibit the channel or enhance the Mg-nucleotide stimulatory effect at the SUR1
protein.[120] Generally, the Kir6.2 subunit carries the most severe gain of function mutations,
30
which also cause syndromes such as developmental delay and epilepsy muscle weakness, in
addition to neonatal diabetes (DEND) and permanent neonatal diabetes (PNDM).[94] Defects
related with the SUR1 have less incident of severe phenotypes but a higher incidence in
relapsing transient diabetes (TNDM).[94]
In the heart, KATP channels are important for the proper functioning of the heart as they act
as cardio-protectors. Defects in cardiac potassium channels cause several types of
cardiomyopathies and affect the cardiac response to ischemic conditions.[6, 122] KATP channels
are expressed mostly in cardiomyocytes but do not interfere with the normal myocardial
contractility.[23] Notably, the KATP channels in cardiac tissue respond differently than in the
pancreas. Under basal conditions, channels in the heart are in a close state; in part because
typically ATP is in high concentration in this tissue (Figure 1.16 A.). This in turn allows Ca2+
influx which permits in that way the normal contraction of the sarcolemmal cells.
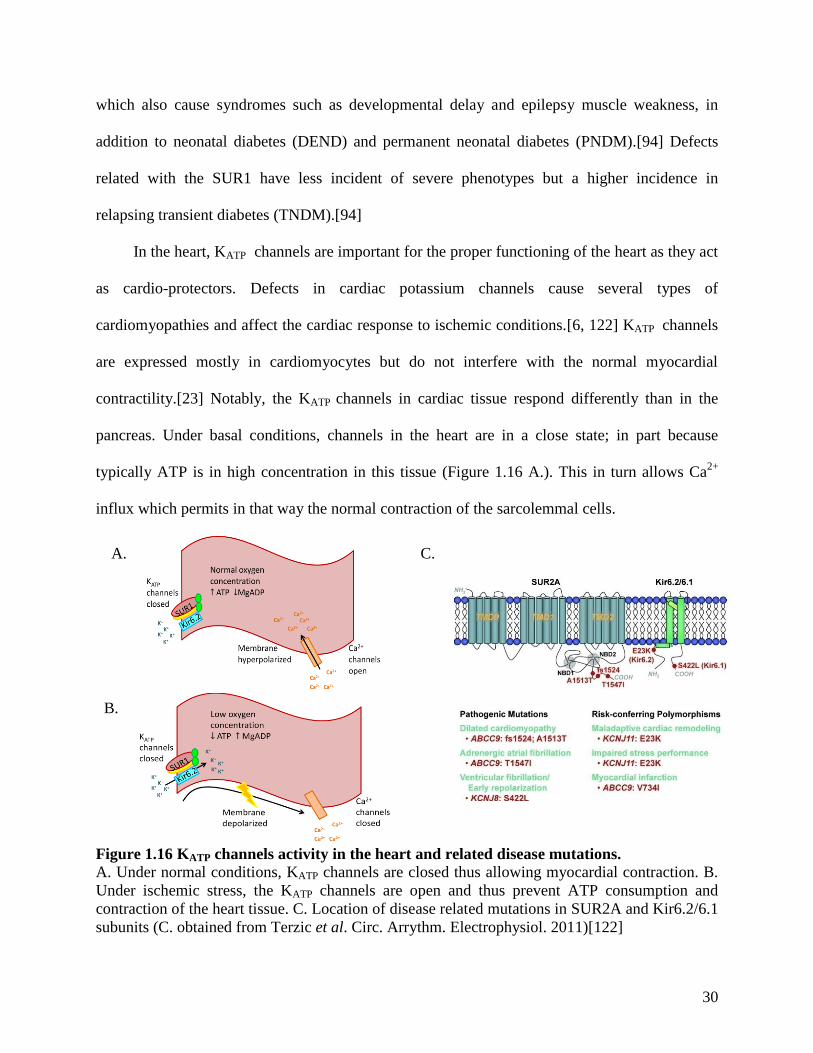
Figure 1.16 KATP channels activity in the heart and related disease mutations.
A. Under normal conditions, KATP channels are closed thus allowing myocardial contraction. B.
Under ischemic stress, the KATP channels are open and thus prevent ATP consumption and
contraction of the heart tissue. C. Location of disease related mutations in SUR2A and Kir6.2/6.1
subunits (C. obtained from Terzic et al. Circ. Arrythm. Electrophysiol. 2011)[122]
A.
B.
C.
31
KATP become activated under metabolic stress such as ischemia.[6] Under low oxygen
conditions, the ATP concentration decreases and the ADP concentration rises. As ADP rises, the
NBD2 of SUR2A becomes fixed in the post-hydrolytic state resulting in channel opening.[104]
The lower nucleotide affinity of SUR2A NBD2 has for ATP as oppose to that of SUR1 NBD2,
decreases the possibility of displacement of MgADP allowing it to remain bound longer.[104]
This consequently facilitates the KATP channels open state. The overall effect of channel opening
is hyperpolarization of the cell membrane which in turn closes the Ca+ channels (Figure 1.16
B.).[6] Under these conditions, the heart decreases contractions and therefore reduces
consumption of cellular ATP. Hence, the activity of the KATP channels confers protection to the
myocardium by preventing excessive contraction and allowing rapid recovery after ischemic
events.[123]
KATP channels malfunctioning in the heart is associated with atrial fibrillation dilated
cardiomyopathy with tachycardia and susceptibility to heart failure.[23] Atrial fibrillation can be
cause by gain or loss of function mutations which accelerate or slow repolarisation of the cardiac
cells. Cardiomyopathy-arrhythmia is linked with defects that change ATP hydrolysis, subunit
trafficking or pore conductance. [122] Figure 1.16 C., shows the location of some of the disease
causing mutations predominantly found in the heart tissue.
1.7 Biophysical studies
1.7.1 Nuclear magnetic resonance
Nuclear magnetic resonance (NMR) is a spectroscopic technique that can be used to
studying protein structure and dynamics. One advantage of NMR spectroscopy over other
spectroscopic techniques is that information can be obtained at the level of specific
residues.[124] Because protein NMR studies of soluble proteins are performed in solution, NMR
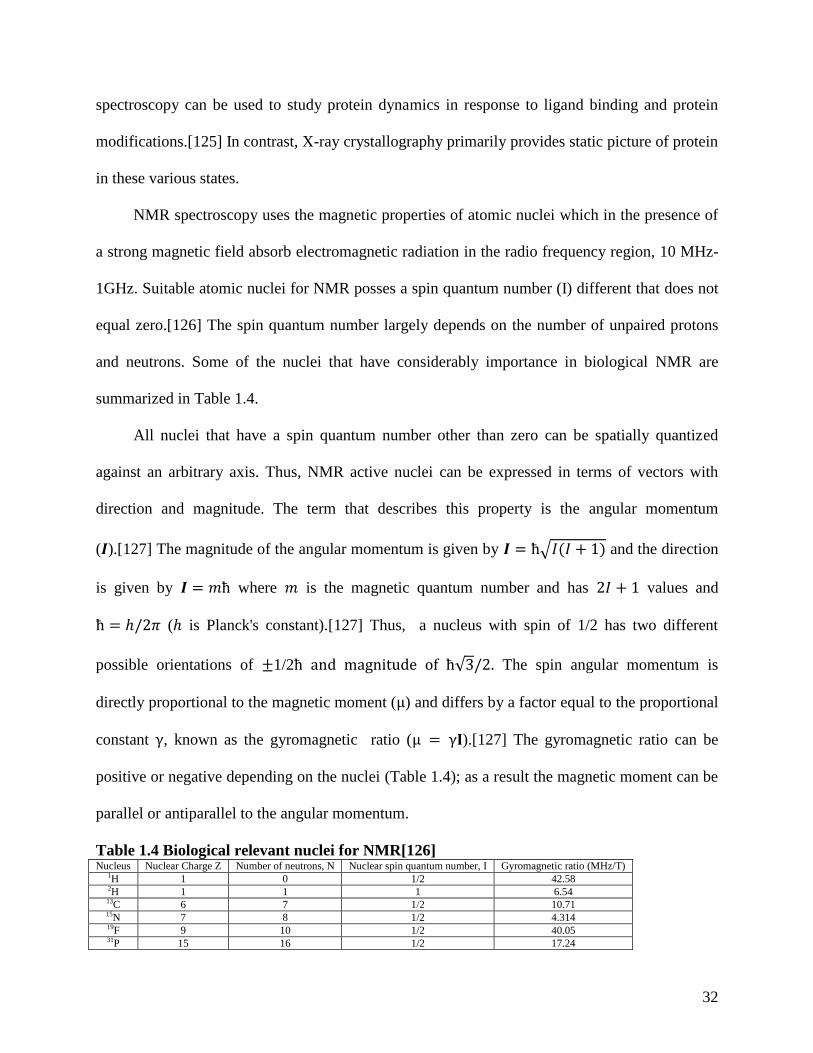
32
spectroscopy can be used to study protein dynamics in response to ligand binding and protein
modifications.[125] In contrast, X-ray crystallography primarily provides static picture of protein
in these various states.
NMR spectroscopy uses the magnetic properties of atomic nuclei which in the presence of
a strong magnetic field absorb electromagnetic radiation in the radio frequency region, 10 MHz-
1GHz. Suitable atomic nuclei for NMR posses a spin quantum number (I) different that does not
equal zero.[126] The spin quantum number largely depends on the number of unpaired protons
and neutrons. Some of the nuclei that have considerably importance in biological NMR are
summarized in Table 1.4.
All nuclei that have a spin quantum number other than zero can be spatially quantized
against an arbitrary axis. Thus, NMR active nuclei can be expressed in terms of vectors with
direction and magnitude. The term that describes this property is the angular momentum
(𝑰).[127] The magnitude of the angular momentum is given by 𝑰 = ħ 𝐼(𝐼 + 1) and the direction
is given by 𝑰 = 𝑚ħ where 𝑚 is the magnetic quantum number and has 2𝐼 + 1 values and
ħ = ℎ/2𝜋 (ℎ is Planck's constant).[127] Thus, a nucleus with spin of 1/2 has two different
possible orientations of ±1/2ħ and magnitude of ħ 3/2. The spin angular momentum is
directly proportional to the magnetic moment (μ) and differs by a factor equal to the proportional
constant γ, known as the gyromagnetic ratio (μ = γ𝐈).[127] The gyromagnetic ratio can be
positive or negative depending on the nuclei (Table 1.4); as a result the magnetic moment can be
parallel or antiparallel to the angular momentum.
Table 1.4 Biological relevant nuclei for NMR[126] Nucleus Nuclear Charge Z Number of neutrons, N Nuclear spin quantum number, I Gyromagnetic ratio (MHz/T)
1H 1 0 1/2 42.58 2H 1 1 1 6.54 13C 6 7 1/2 10.71 15N 7 8 1/2 4.314 19F 9 10 1/2 40.05 31P 15 16 1/2 17.24
33
In the absence of magnetic field, the orientations of the spin angular momentum orientation
have the same energy.[127] However, when a strong magnetic field (Bo) is applied, the spin
angular momentum tends to align with the magnetic field. As a result, the energy degeneracy
disappears and each of the angular momentum orientations will have specific energy state.[128]
In the case of nuclei with 1/2 spin, the spin angular momentum can be aligned with Bo, and thus
have a low energy state, or be opposed to the magnetic field to be in a high energy state. The
energy spacing between the different energy states that a spin can achieve is given by ∆𝐸 =
ħ𝛾𝐵𝑜 .[128] This relationship indicates that the energy difference is directly dependent on the
gyromagnetic ratio of the nuclei and the external magnetic field Bo. Additionally, thermal energy
also plays a important role as the energy separation between the states is small and thus energy
from thermal collision is sufficient for reaching higher energy states.[126]
A collection of magnetic nuclei is essentially distributed amongst the available energy
levels. When subjected to a strong magnetic field, this distribution obeys the Boltzmann
distribution 𝑁𝑢𝑝𝑝𝑒𝑟
𝑁𝑙𝑜𝑤𝑒𝑟= 𝑒−∆𝐸/𝑘𝑇 , where 𝑘 is the Boltzman constant and T is temperature.[127] The
overall population of magnetic spins will result in the bulk magnetization.
Signal acquisition in NMR is obtained by irradiating a nucleus that is under a strong
magnetic field with electromagnetic radiation of the correct energy, a nucleus with low energy
can be induced to transition to an orientation of higher energy.[127] For a 1/2 spin nuclei such as
H1, the bulk magnetization in the classical sense would go from being parallel to the Bo to the
transverse plane or antiparallel to the Bo.
Atomic level resolution in NMR spectroscopy is achieved because nuclear magnetic
moments are incredibly sensitive to their surroundings and thus NMR can identify specific nuclei
34
depending on their electronic environment. Differences in electronic environments cause the
nuclei to experience slightly different applied magnetic fields owing to shielding/deshielding of
the induced electronic magnetic fields.[127]
The sensitivity in NMR is directly correlated with the γ ratio, the number of nuclei aligned
with the magnetic field (Boltzmann distribution) and the strength of the magnetic field.[126].
Additionally, obtaining good signal in NMR largely depends on the T1 and T2 relaxation as well
as the overall magnetization. T1 relaxation occurs because the overall magnetization is lost
overtime as a consequence of thermal energy, dipole-dipole interactions, anisotropy and
coupling.[126] The result of T1 relaxation is to return the bulk magnetization back to equilibrium
conditions (i.e. before the application of a radiofrequency pulse to excite the nuclei). T2
relaxation occurs due to spin-spin relaxation in the transverse plane.[126] Spin-spin relaxation
occurs when identical nuclei in a sample are in slighting different environments and lose phase
coherence with one another. T2 is generally related to the linewidth (width at half height
= 1/𝜋𝑇2)
Particularly useful for protein studies is the hetero nuclear quantum coherence experiment
(15
N-1H HSQC). The
15N-
1H HSQC is a 2D NMR spectra where the chemical shift for every
amide proton and amide nitrogen in the protein backbone as well as side chains is correlated.
The study of large proteins is facilitated by using deuterated samples and by avoiding coupling
through the transverse relaxation optimized spectroscopy (TROSY).[129]
1.7.2 Fluorescence spectroscopy
Fluorescence is a type of luminescence that occurs as result of an electron relaxing from an
excited state to the ground state. Most molecules lack fluorescence because when an electron in
these molecules is excited the energy is dissipated via non-radiative transitions and thus is lost as
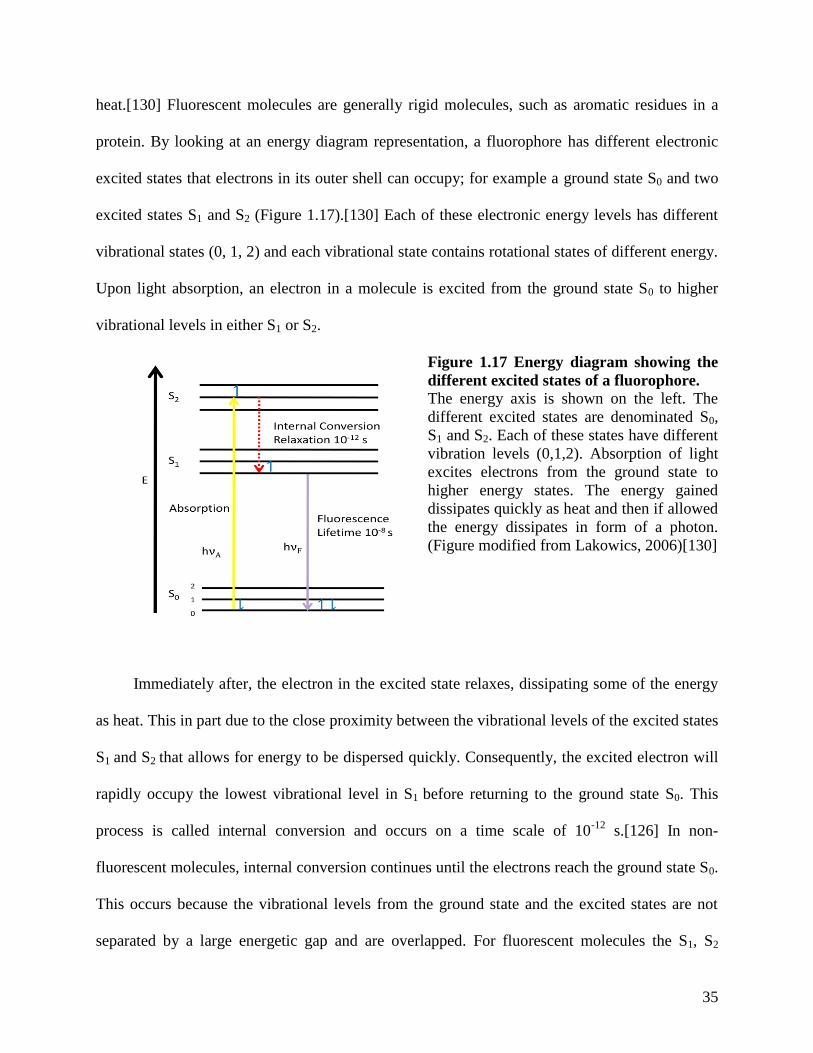
35
heat.[130] Fluorescent molecules are generally rigid molecules, such as aromatic residues in a
protein. By looking at an energy diagram representation, a fluorophore has different electronic
excited states that electrons in its outer shell can occupy; for example a ground state S0 and two
excited states S1 and S2 (Figure 1.17).[130] Each of these electronic energy levels has different
vibrational states (0, 1, 2) and each vibrational state contains rotational states of different energy.
Upon light absorption, an electron in a molecule is excited from the ground state S0 to higher
vibrational levels in either S1 or S2.
Figure 1.17 Energy diagram showing the
different excited states of a fluorophore.
The energy axis is shown on the left. The
different excited states are denominated S0,
S1 and S2. Each of these states have different
vibration levels (0,1,2). Absorption of light
excites electrons from the ground state to
higher energy states. The energy gained
dissipates quickly as heat and then if allowed
the energy dissipates in form of a photon.
(Figure modified from Lakowics, 2006)[130]
Immediately after, the electron in the excited state relaxes, dissipating some of the energy
as heat. This in part due to the close proximity between the vibrational levels of the excited states
S1 and S2 that allows for energy to be dispersed quickly. Consequently, the excited electron will
rapidly occupy the lowest vibrational level in S1 before returning to the ground state S0. This
process is called internal conversion and occurs on a time scale of 10-12
s.[126] In non-
fluorescent molecules, internal conversion continues until the electrons reach the ground state S0.
This occurs because the vibrational levels from the ground state and the excited states are not
separated by a large energetic gap and are overlapped. For fluorescent molecules the S1, S2
36
excited states are separated by a large energetic gap from the ground state S0. Fluorescence takes
place when the electron returns from the lowest vibrational level in S1 to the ground state and in
the process releases a photon. An important characteristic of the florescence event is that
fluorescence is a spin allowed transition as the electron that was excited pairs with the electron of
the opposite spin in the ground state (Figure 1.17).[130] Additionally, due to the energy lost to
vibrational relaxation, the emitted photon has a longer wavelength, and hence lower energy as
𝐸 = ℎ/𝜆 than the excitation photon.[130]
Two of the most important characteristics of a fluorophore are its quantum yield and
lifetime. Quantum yield (Q) is the ratio of the number of emitted photons to the number of
absorbed photons, and thus is always less than unity. The lifetime of a fluorophore (τ) is the
average time it takes for the excited fluorophore to return to the ground state. The intensity,
quantum yield and wavelength maximum of a fluorophore emission are very solvent dependent
and this in turn contributes to the sensitivity of the fluorescence technique. These parameters are
important when determining the conditions of an experimental setting.[130]
Aromatic residues in proteins such as tryptophan, phenylalanine and tyrosine contribute to
the intrinsic fluorescence of proteins (Table 1.5).[126] Aromatic residues in proteins differ
greatly in their quantum yield and lifetimes. Tryptophan is usually the preferred residue to target
when monitoring the intrinsic fluorescence of proteins because it has the stronger fluorescent
intensity and quantum yield that the other two aromatic amino acids. The fluorescence signal of a
tryptophan residue shifts to longer wavelengths when the tryptophan becomes more solvent
exposed.[130] Furthermore, the intensity of Trp also varies as the solvent surrounding this
residue is more abundant. Tryptophan residues buried in the hydrophobic core of proteins have a
higher fluorescent intensity than those exposed at the surface of a protein that are exposed to the
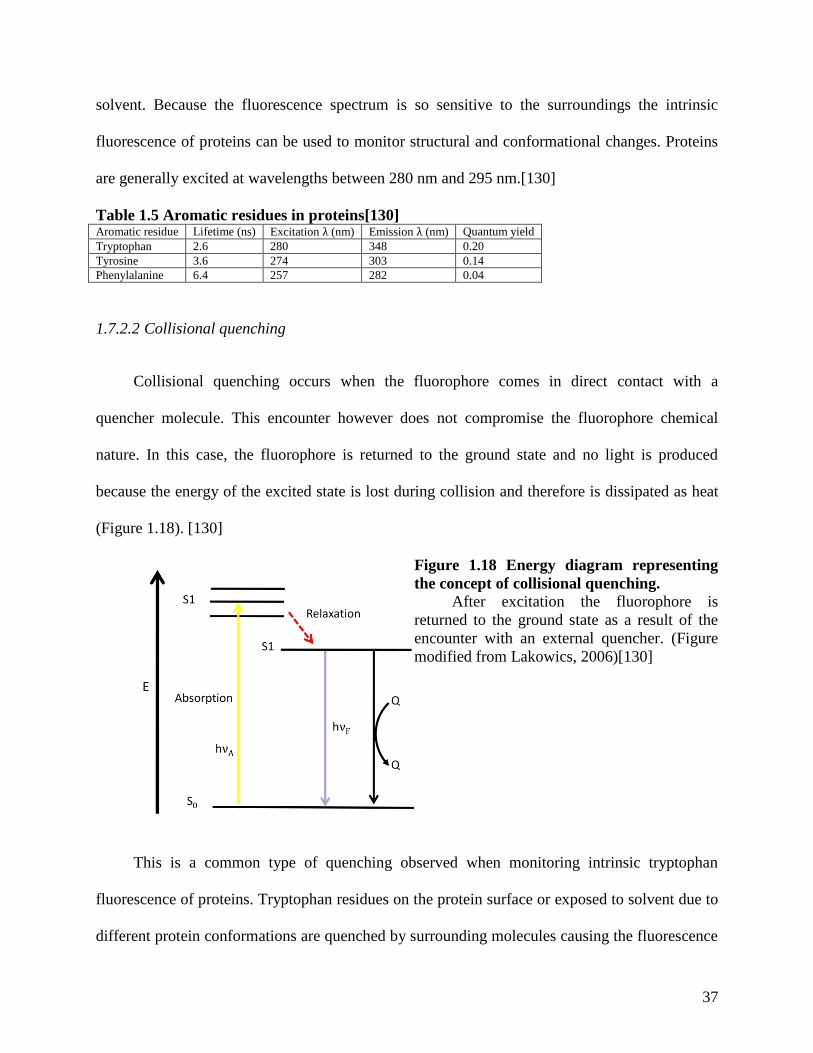
37
solvent. Because the fluorescence spectrum is so sensitive to the surroundings the intrinsic
fluorescence of proteins can be used to monitor structural and conformational changes. Proteins
are generally excited at wavelengths between 280 nm and 295 nm.[130]
Table 1.5 Aromatic residues in proteins[130] Aromatic residue Lifetime (ns) Excitation λ (nm) Emission λ (nm) Quantum yield
Tryptophan 2.6 280 348 0.20
Tyrosine 3.6 274 303 0.14
Phenylalanine 6.4 257 282 0.04
1.7.2.2 Collisional quenching
Collisional quenching occurs when the fluorophore comes in direct contact with a
quencher molecule. This encounter however does not compromise the fluorophore chemical
nature. In this case, the fluorophore is returned to the ground state and no light is produced
because the energy of the excited state is lost during collision and therefore is dissipated as heat
(Figure 1.18). [130]
Figure 1.18 Energy diagram representing
the concept of collisional quenching.
After excitation the fluorophore is
returned to the ground state as a result of the
encounter with an external quencher. (Figure
modified from Lakowics, 2006)[130]
This is a common type of quenching observed when monitoring intrinsic tryptophan
fluorescence of proteins. Tryptophan residues on the protein surface or exposed to solvent due to
different protein conformations are quenched by surrounding molecules causing the fluorescence
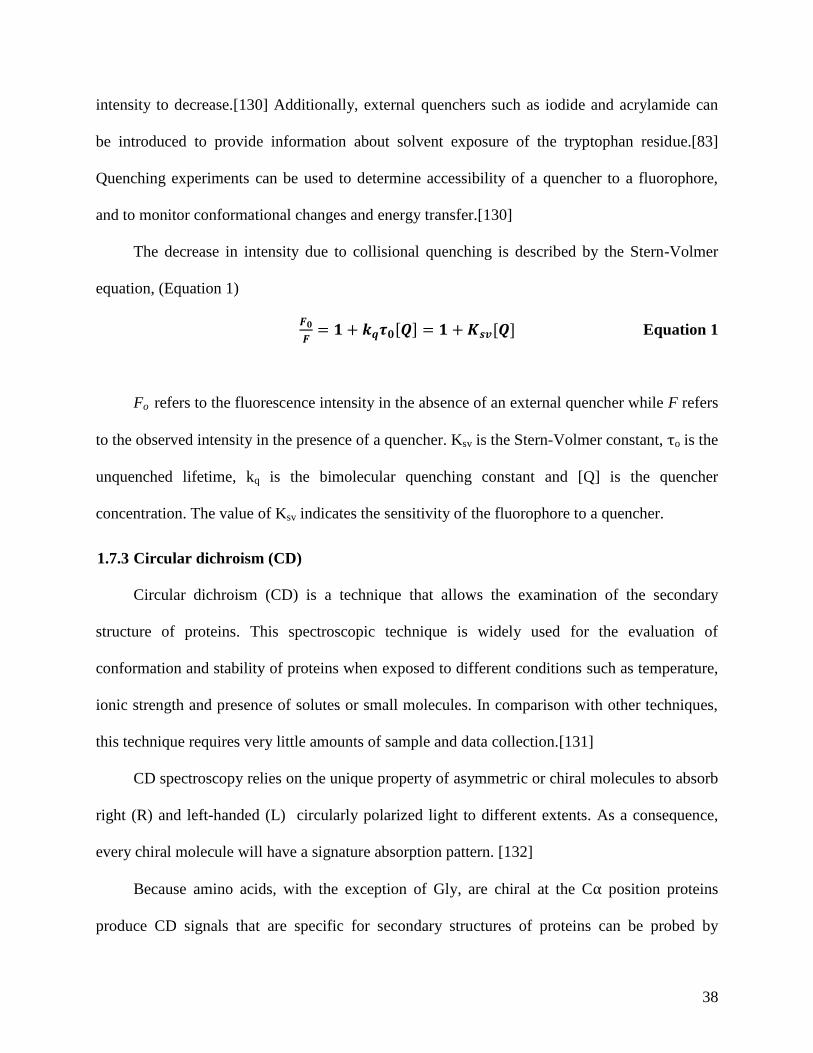
38
intensity to decrease.[130] Additionally, external quenchers such as iodide and acrylamide can
be introduced to provide information about solvent exposure of the tryptophan residue.[83]
Quenching experiments can be used to determine accessibility of a quencher to a fluorophore,
and to monitor conformational changes and energy transfer.[130]
The decrease in intensity due to collisional quenching is described by the Stern-Volmer
equation, (Equation 1)
𝑭𝟎
𝑭= 𝟏 + 𝒌𝒒𝝉𝟎 𝑸 = 𝟏 + 𝑲𝒔𝒗[𝑸] Equation 1
Fo refers to the fluorescence intensity in the absence of an external quencher while F refers
to the observed intensity in the presence of a quencher. Ksv is the Stern-Volmer constant, τo is the
unquenched lifetime, kq is the bimolecular quenching constant and [Q] is the quencher
concentration. The value of Ksv indicates the sensitivity of the fluorophore to a quencher.
1.7.3 Circular dichroism (CD)
Circular dichroism (CD) is a technique that allows the examination of the secondary
structure of proteins. This spectroscopic technique is widely used for the evaluation of
conformation and stability of proteins when exposed to different conditions such as temperature,
ionic strength and presence of solutes or small molecules. In comparison with other techniques,
this technique requires very little amounts of sample and data collection.[131]
CD spectroscopy relies on the unique property of asymmetric or chiral molecules to absorb
right (R) and left-handed (L) circularly polarized light to different extents. As a consequence,
every chiral molecule will have a signature absorption pattern. [132]
Because amino acids, with the exception of Gly, are chiral at the Cα position proteins
produce CD signals that are specific for secondary structures of proteins can be probed by
39
CD.[131] The amide backbone of the protein is observed in a CD spectra below 250 nm. Amides
have two main electronic transitions that dominate the CD phenomenon at far-UV; n − π∗ and
πo − π∗ that give rise to CD signals at 215-230 and 185-200 nm, respectively.[132] The first
transition n − π∗ is magnetically permitted but electrically forbidden. This transitions is
responsible for the negative CD signal observed in the spectrum of an α-helical protein at 222
nm and for the β-sheet protein at 216-218 nm.[132] The πo − π∗ transition is correlated with the
positive band in spectra of both α-helical and β-sheet proteins at about 190 nm.[131] In addition,
for the α-helical proteins, this transition also produces a negative band at 208 nm. Figure 1.1
shows the different characteristic far-UV CD profiles of protein containing only α-helixes, β-
sheets and disorder conformation.
Figure 1.19 Characteristic far UV CD
spectra for secondary protein structures
The spectrum for a protein made of α-
helices has two negative bands of similar
magnitude, one at 220 nm and 208 nm and a
positive band at around 190 nm. A protein
containing only β-sheets has in general a
negative band between 210-220 and a positive
band between 195-200. The spectrum for a
disordered protein has a negative band at
around 200 nm and positive band at ~215 nm.
(modified figure from Correa and Ramos,
African J. Biochem. Res., 2009)
40
1.8 Goals
1.8.1 Investigation of the function of the C-terminal region of NBD1
There is currently limited information about the regulatory mechanisms of ATP hydrolysis
at the SUR NBDs and the mechanism of signal transduction to the Kir6.x pore subunit in KATP
channels. There are regions in NBD1 that possess regulatory purposes, such as the ED region
which is hypothesized in serving as an allosteric regulator of ATP hydrolysis in full ATP
channels.[114] Previous studies also demonstrate that the SUR2A boundaries that allow
heterelogous expression of soluble SUR2A NBD1 included residues outside the canonical NBD
structural core.[75] From this study, in which multiple boundaries were screened, it was
determined that the highest amounts of soluble expressed protein with best solution conditions
(i.e. optimal NMR spectra, monomeric behaviour) was for SUR2A NBD1 construct from Ser615
to Leu933.[75] Because our alignment indicates that the canonical C-terminus of rSUR2A NBD1
is at Asp914, we are studying proteins that are missing residues Asn915 to Leu933 in the
Ser615-Asp914 construct. Further we wish to probe the role of the ED region and also
investigating constructs of NBD1 from Ser615-Lys972 and from Ser615-Asn962. Comparison of
the biophysical properties of these constructs with the NBD1 construct S615-L933 will provide
insights of the function of the C-terminal region of NBD1.
1.8.2 Determination of soluble constructs of hSUR1 NBD1 and rSUR2A NBD2
The study of the SUR NBDs is for the most part limited to electro-physiological studies in
the intact KATP channel. Functional and mutational studies of NBDs are usually performed in full
channels because of the difficulty of heterelogous expression of soluble NBD constructs.
However, focus on the individual NBDs can elucidate different molecular events otherwise
disregarded. Study individual NBDs with and without mutations will help elucidate basic
41
molecular defects in mutants; such as ATP binding fold differences that affect trafficking of the
channel or overall unfavourable conformations. Identification of correct domain boundaries is
imperative for the expression of soluble NBD constructs in E.coli. For hSUR1 NBD1and
rSUR2A NBDs, the determination of soluble constructs will open also the possibility of studying
different disease causing mutations in terms of their structural, dynamic and functional
implications. Additionally, determination of soluble rSUR2A NBD2 constructs will allow the
determination of its intrinsic structural properties as well as elucidate mechanisms of its
interaction with rSUR2A NBD1.
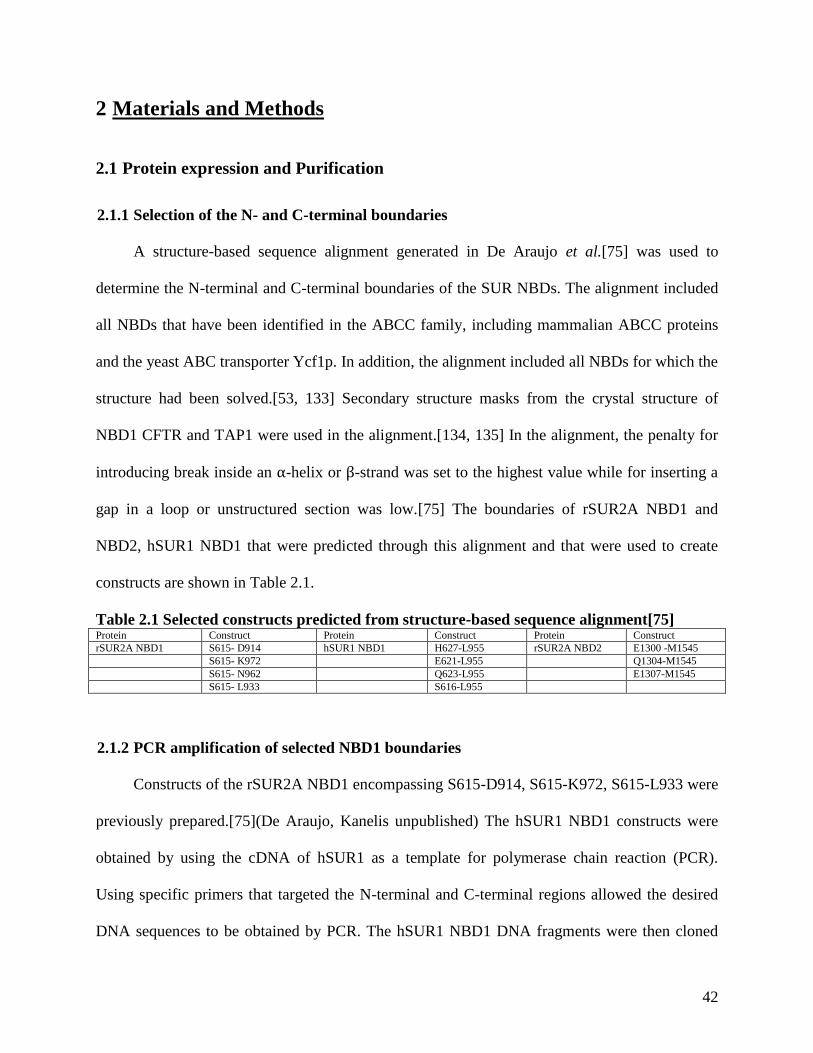
42
2 Materials and Methods
2.1 Protein expression and Purification
2.1.1 Selection of the N- and C-terminal boundaries
A structure-based sequence alignment generated in De Araujo et al.[75] was used to
determine the N-terminal and C-terminal boundaries of the SUR NBDs. The alignment included
all NBDs that have been identified in the ABCC family, including mammalian ABCC proteins
and the yeast ABC transporter Ycf1p. In addition, the alignment included all NBDs for which the
structure had been solved.[53, 133] Secondary structure masks from the crystal structure of
NBD1 CFTR and TAP1 were used in the alignment.[134, 135] In the alignment, the penalty for
introducing break inside an α-helix or β-strand was set to the highest value while for inserting a
gap in a loop or unstructured section was low.[75] The boundaries of rSUR2A NBD1 and
NBD2, hSUR1 NBD1 that were predicted through this alignment and that were used to create
constructs are shown in Table 2.1.
Table 2.1 Selected constructs predicted from structure-based sequence alignment[75] Protein Construct Protein Construct Protein Construct
rSUR2A NBD1 S615- D914 hSUR1 NBD1 H627-L955 rSUR2A NBD2 E1300 -M1545
S615- K972 E621-L955 Q1304-M1545
S615- N962 Q623-L955 E1307-M1545
S615- L933 S616-L955
2.1.2 PCR amplification of selected NBD1 boundaries
Constructs of the rSUR2A NBD1 encompassing S615-D914, S615-K972, S615-L933 were
previously prepared.[75](De Araujo, Kanelis unpublished) The hSUR1 NBD1 constructs were
obtained by using the cDNA of hSUR1 as a template for polymerase chain reaction (PCR).
Using specific primers that targeted the N-terminal and C-terminal regions allowed the desired
DNA sequences to be obtained by PCR. The hSUR1 NBD1 DNA fragments were then cloned
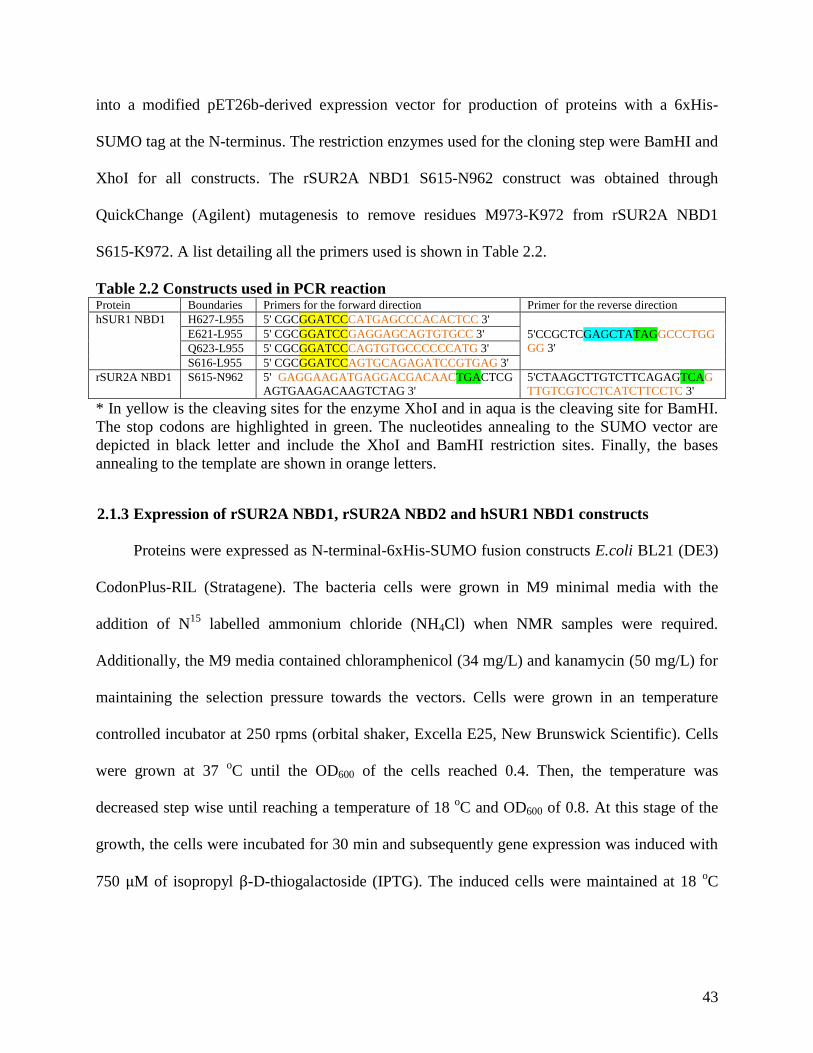
43
into a modified pET26b-derived expression vector for production of proteins with a 6xHis-
SUMO tag at the N-terminus. The restriction enzymes used for the cloning step were BamHI and
XhoI for all constructs. The rSUR2A NBD1 S615-N962 construct was obtained through
QuickChange (Agilent) mutagenesis to remove residues M973-K972 from rSUR2A NBD1
S615-K972. A list detailing all the primers used is shown in Table 2.2.
Table 2.2 Constructs used in PCR reaction Protein Boundaries Primers for the forward direction Primer for the reverse direction
hSUR1 NBD1
H627-L955 5' CGCGGATCCCATGAGCCCACACTCC 3'
5'CCGCTCGAGCTATAGGCCCTGG
GG 3'
E621-L955 5' CGCGGATCCGAGGAGCAGTGTGCC 3'
Q623-L955 5' CGCGGATCCCAGTGTGCCCCCCATG 3'
S616-L955 5' CGCGGATCCAGTGCAGAGATCCGTGAG 3'
rSUR2A NBD1 S615-N962 5' GAGGAAGATGAGGACGACAACTGACTCG
AGTGAAGACAAGTCTAG 3'
5'CTAAGCTTGTCTTCAGAGTCAG
TTGTCGTCCTCATCTTCCTC 3'
* In yellow is the cleaving sites for the enzyme XhoI and in aqua is the cleaving site for BamHI.
The stop codons are highlighted in green. The nucleotides annealing to the SUMO vector are
depicted in black letter and include the XhoI and BamHI restriction sites. Finally, the bases
annealing to the template are shown in orange letters.
2.1.3 Expression of rSUR2A NBD1, rSUR2A NBD2 and hSUR1 NBD1 constructs
Proteins were expressed as N-terminal-6xHis-SUMO fusion constructs E.coli BL21 (DE3)
CodonPlus-RIL (Stratagene). The bacteria cells were grown in M9 minimal media with the
addition of N15
labelled ammonium chloride (NH4Cl) when NMR samples were required.
Additionally, the M9 media contained chloramphenicol (34 mg/L) and kanamycin (50 mg/L) for
maintaining the selection pressure towards the vectors. Cells were grown in an temperature
controlled incubator at 250 rpms (orbital shaker, Excella E25, New Brunswick Scientific). Cells
were grown at 37 oC until the OD600 of the cells reached 0.4. Then, the temperature was
decreased step wise until reaching a temperature of 18 oC and OD600 of 0.8. At this stage of the
growth, the cells were incubated for 30 min and subsequently gene expression was induced with
750 μM of isopropyl β-D-thiogalactoside (IPTG). The induced cells were maintained at 18 oC
44
with continuous shaking overnight (~18 hrs). Cell cultures were harvested by centrifugation at 4
oC (6000 rpm for 20 min). The cell pellets were stored at -20
oC until purification of the protein.
2.1.4 Purification of rSUR2A NBD1 and hSUR1 NBD1
The purification protocol utilized follows that described for rSUR2A NBD1 S615-L933
with minor modifications.[75, 136] All purification steps were done at 4 oC to decrease the
possibility of protein aggregation and proteolysis. Cells are re-suspended and lysed with a buffer
containing 20 mM Tris pH 7.6, 150 mM NaCl, 10 % glycerol, 100 mM L-arginine, 0.2% (v/v)
Triton X-100, 5 mM imidazole, 2 mM β-mercaptoethanol, 5 mM MgCl2, 2 mM ATP, 2 mg/mL
deoxycholic acid, 1 mg/mL lyzozyme, 5 mM benzamidine, 5 mM ε-aminocaproic acid,1 mM
phenylmethylsulfonyl fluoride (PMSF) and a minimal amount of DNase (~5 mg). The amount of
lysis buffer used corresponded to 10 mL per litre of culture with OD600 of 1.0. The lysis stage
was carried for 15 minutes, after which the cells were sonicated using a Heat System Inc.
sonicator with a microprobe set at a power of about 18 to 19 watts. Sonication was performed by
pulsing, 20 sec with the sonicator on and a min off to prevent heating of the sample, for 7 cycles.
Sonicated cells were centrifuged at 11500 rpm in a fixed angle rotor for 45 min. The cellular
pellet was re-suspended in lysis buffer and treated as above. The supernatant from both lysis
steps was filtered using a 0.45 μm filter and loaded onto a high performance Ni2+
-NTA affinity
column (GE Healthcare) in equilibration buffer containing 20 mM tris pH 7.6, 150 mM NaCl, 5
% glycerol and 5 mM imidazole. The column was washed with 10 column volumes of
equilibration buffer containing 5 mM ATP and 5 mM of MgCl2. The protein was eluted with
elution buffer (20 mM Tris pH 7.6, 150 mM NaCl, 5 % glycerol, 400 mM imidazole, 10 mM
ATP, 10 mM MgCl2, 4 mM of β-mercaptoethanol, 2 mM of benzamidine and ε-aminocaproic
acid). In order to dilute protein immediately after elution, the eluted protein was collected into
45
tubes containing 20 mM Tris buffer pH 7.6 with 150 mM NaCl, 5 % glycerol, 10 mM ATP, 10
mM MgCl2, 2 mM of benzamidine and ε-aminocaproic acid. Eluents containing the protein were
pooled and concentrated to ≤ 300 μM using a centrifugal filter (Millipore, 10 kDa MWCO) in a
swinging bucket rotor at 2,700 rpm. During the concentration step, the 6xHis-SUMO tag was
cleaved using 6xHis-tagged ubiquitin like protease 1, Ulp1 (1 μL of Ulp per mL). The
concentrated cleaved protein was loaded in 250 μL aliquots onto a 24 mL Superdex 75 gel
filtration column (GE Healthcare) pre-equilibrated with 20 mM Tris Cl- pH 7.6, 150 mM NaCl, 5
% glycerol, 2 mM ATP, 5 mM MgCl2, 2 mM of benzamidine and ε-aminocaproic acid.
Typically not less than ~15 runs were required for purification of the full amount of concentrated
and cleaved sample. The fractions containing NBD1 were applied to a Co2+
affinity column
(Thermos, Talon resin) to remove contaminants and any amount of 6x-His-SUMO still
remaining. The Co2+
was pre-equilibrated and washed with buffer that contained 20 mM Tris Cl-
pH 7.6, 150 mM NaCl, 5 % glycerol, 20 mM imidazole, 2 mM ATP, 5 mM MgCl2, 2 mM of
benzamidine and ε-aminocaproic acid. The protein collected in the flow through and wash of the
Co2+
column was then dialysed into buffer containing 20 mM Na phosphate pH 7.25, 150 mM
NaCl, 5 mM MgCl2, 2 mM ATP, 2 mM DTT and 2% (v/v) glycerol and stored at 4 oC. To
generate samples lacking MgATP, the SUR2A NBD1 samples were applied to a 24 mL
Superdex 75 gel filtration column equilibrated in 20 mM Na phosphate, pH 7.25, 150 mM NaCl,
2% (v/v) glycerol, 2 mM DTT and 5 mM EDTA.
For the construct rSUR2A NBD1 S615 K972, there was an extra step in the purification
after the Ni2+
-NTA column. The elutions containing the protein were polled together and
dialysed overnight into 20 mM Tris Cl- pH 7.6, 50 mM NaCl, 5 % glycerol, 2 mM ATP, 5 mM
MgCl2, 2 mM of benzamidine and ε-aminocaproic acid. In addition to the Ni2+
affinity-purified
46
6xHis-SUMO-NBD1, Ulp1 protease (1/1000 v/v) was added to the dialysis bag. After dialysis
the protein was further purified in a 5 mL (HiTrap Q HP) anion exchange column (GE
Healthcare) using a gradient of 20 mM NaCl per mL elution buffer, to a maximum NaCl
concentration of 1 M. The fractions that contained the protein were then concentrated in a
centrifugal filter (Millipore, 10 kDa MWCO) in a swinging bucket rotor at ≤ 2,700 rpm and
then loaded onto the Superdex 24 column. The steps that followed are the same as above.
2.1.5 Purification of rSUR2A NBD2 constructs
The constructs tested for NBD2 E1300-M1545, Q1304-M1545 and E1307-M1545 were
cloned previously (Elvin De Araujo and Marijana Stagljar). Two strategies were opted for
cloning the constructs 1304-M1545 and 1307-M154 to improve their solubility. One of the was
the addition of the 6xHisSUMO tag N-terminus to the constructs just as previously done for
NBD1.[75] A second strategy was to clone these constructs into a vector pETM-60 that encoded
for the NusA6xHis tag at the N-terminus of the construct. The 1300-M1545 construct was tested
as a 6xHis-SUMO fusion only. The purification protocol performed for the constructs containing
the SUMO tag followed the protocol outlined for S615-L933 construct.[75] Those with the
NusA6xHis tag had a minor variation at the cleavage stage where instead of using Ulp protease,
Tobacco Etch Virus (TEV) protease was used.
2.2 NMR Spectroscopy
TROSY-HSQC spectra were recorded on a 600 MHz Varian spectrometer (Varian Inc.
Palo Alto, CA) equipped with actively-shielded z-gradients and a H(F)CN triple resonance
cryoprobe. The NBD1 sample volume was 550 μL and the concentration varied from 50 μM to
500 μM. A series of spectra of various constructs were recorded in which the temperature ranged
between 15 and 35 oC. 4,4-dimethyl-4-silapentane-1-sulfonic acid (DSS) was used as a reference
47
for all NMR experiments. Data was processed using NMRPipe/NMRDraw[137] and analyzed
using NMRView.[138]
2.2.1 Phosphorylation of rSUR2A NBD1 S615-D914
Phosphorylation of rSUR2A NBD1 S615-D914 was conducted at 30 oC degrees and was
monitored with 15
N-1H TROSY-HSQC spectra from 0 to 10 hrs. The phosphorylation reaction
contained a protein concentration of 150 μM in 20 mM Na phosphate pH 7.25, 150 mM NaCl,
50 mM MgCl2, 50 mM ATP, 2 mM DTT and 2% (v/v) glycerol, and PKA (1/1000). Samples
were then incubated at 4 oC for a period of two weeks to ensure completion of the
phosphorylation reaction. After two, the sample was dialysed into 20 mM Na phosphate pH 7.25,
150 mM NaCl, 5 mM MgCl2, 2 mM ATP, 2 mM DTT and 2% (v/v) glycerol. Final 15
N-1H
TROSY-HSQC spectra at 20, 25 and 30 oC were obtained.
2.3 Fluorescence Spectroscopy
Fluorescence experiments were carried on a Fluoromax 4 Model (Horiba-Jovin, Inc)
equipped with a Peltier, allows for accurate temperature regulation and an automatic titrator.
Changes in fluorescence were monitored by selectively exciting tryptophan residues at 295 nm,
using an emission slit width of 2 nm, while the emission spectra was collected between 350 nm
and 450 nm with a slit width of 5 nm.
2.3.1 Thermal denaturation experiments
The melting point of rSUR2A NBD1 S615-D914 and rSUR2A NBD1 S615-K972 was
measured using intrinsic Trp fluorescence. These experiments were carried out with 2 μM
protein in a 0.5 mL cuvette. The constructs were heated from 10 to 60 oC in 1
oC
increments
with a 1 min equilibration time at each temperature and excitation wavelength of 295 nm. The
emission spectra was collected from 350 nm to 450 nm at each temperature. The change in the
48
emission spectra at 350 nm was monitored at different temperatures. The melting temperature
was determined by plotting the first derivative of the melt plot.[139]
2.3.2 Fluorescence Quenching
Fluorescence quenching experiments were performed with rSUR2A NBD1 S615-D914, in
the presence and absence of MgATP, using iodide (I-) and acrylamide. All experiments were
performed in a 3 mL cuvette containing 2 mL of 2 μM protein. The changes in fluorescence at
350 nm with increasing amount of quenching solutions (50 μL increments) were monitored. For
the iodide quenching experiments, a quenching stock containing 0.3 M KI and 0.1 M sodium
thiosulfate (Na2S2O3) was used and 50 μL aliquots were added using the automatic titrator. The
addition of Na2S2O3 prevents the formation of I2 and I3- species in the KI solution.[140] All
quenching solutions were made fresh in the same buffer as the protein. To account for the
dilution of NBD1 and changes in ionic strength, control experiments were done with 0.3 M KCl.
The overall change in fluorescence at every addition of KI stock solution was determined by the
equation 𝐹𝑜
𝐹=
𝐹𝑜
𝐹 𝐾𝐼
𝐹𝑜
𝐹 𝐾𝐶𝑙
, where 𝐹𝑜
𝐹 𝐾𝐼
and 𝐹𝑜
𝐹 𝐾𝐶𝑙
are the fluorescence ratios in the presence of KI
or KCl, respectively, and Fo and F are the fluorescence intensities in the absence and at each
point of the titration with the quencher.[80] The acrylamide quenching experiments were
performed with 1 M acrylamide solutions. The addition of 50 μL of 1 M acrylamide was
performed manually to avoid spreading acrylamide throughout the tubing of the titrator. The
dilution effect was accounted by performing parallel titrations experiments with buffer alone.
The data obtained from the acrylamide experiment was also corrected for the inner filter
effect.[80] The absorbance at 295 nm and 350 nm at each titration point and the fluorescence
was corrected using the following the equation 𝐹𝑐𝑜𝑟𝑟𝑒𝑐𝑡𝑒𝑑 = 𝐹𝑜𝑏𝑠𝑒𝑟𝑣𝑒𝑑 10𝐴295 +𝐴350
2 , the corrected
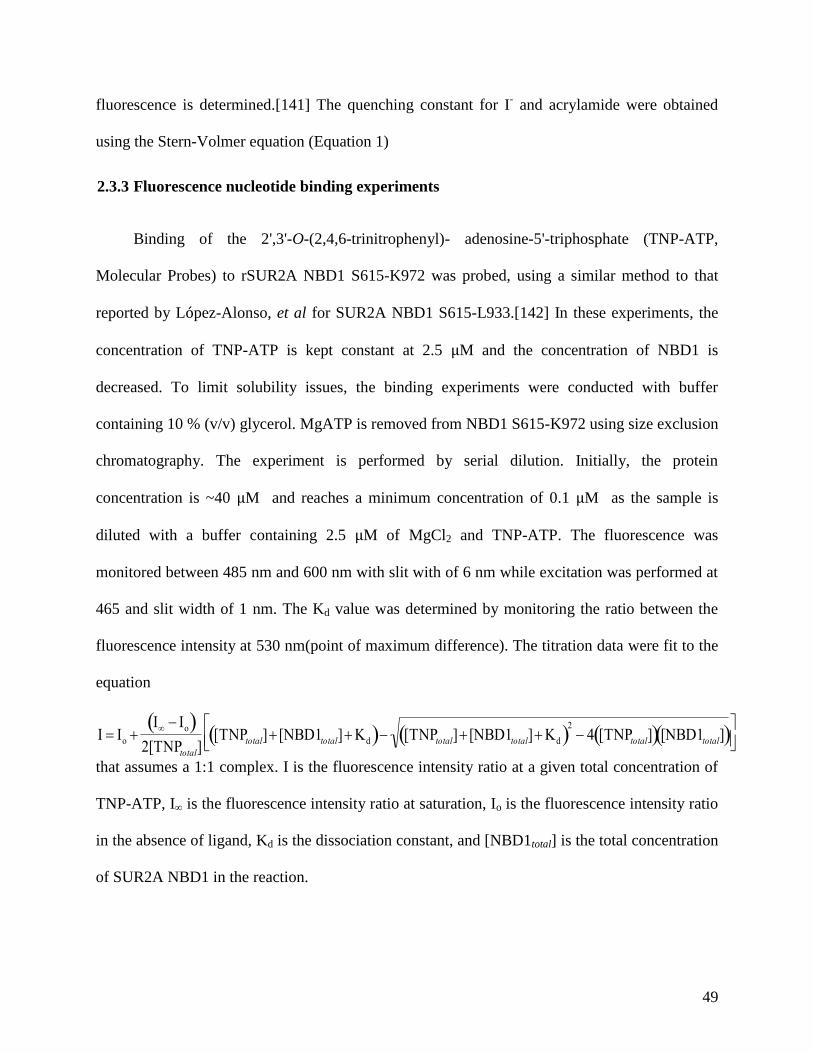
49
fluorescence is determined.[141] The quenching constant for I- and acrylamide were obtained
using the Stern-Volmer equation (Equation 1)
2.3.3 Fluorescence nucleotide binding experiments
Binding of the 2',3'-O-(2,4,6-trinitrophenyl)- adenosine-5'-triphosphate (TNP-ATP,
Molecular Probes) to rSUR2A NBD1 S615-K972 was probed, using a similar method to that
reported by López-Alonso, et al for SUR2A NBD1 S615-L933.[142] In these experiments, the
concentration of TNP-ATP is kept constant at 2.5 μM and the concentration of NBD1 is
decreased. To limit solubility issues, the binding experiments were conducted with buffer
containing 10 % (v/v) glycerol. MgATP is removed from NBD1 S615-K972 using size exclusion
chromatography. The experiment is performed by serial dilution. Initially, the protein
concentration is ~40 μM and reaches a minimum concentration of 0.1 μM as the sample is
diluted with a buffer containing 2.5 μM of MgCl2 and TNP-ATP. The fluorescence was
monitored between 485 nm and 600 nm with slit with of 6 nm while excitation was performed at
465 and slit width of 1 nm. The Kd value was determined by monitoring the ratio between the
fluorescence intensity at 530 nm(point of maximum difference). The titration data were fit to the
equation
I Io I Io
2[TNPtotal][TNPtotal][NBD1total]Kd [TNPtotal][NBD1total]Kd
2
4 [TNPtotal] [NBD1total]
that assumes a 1:1 complex. I is the fluorescence intensity ratio at a given total concentration of
TNP-ATP, I∞ is the fluorescence intensity ratio at saturation, Io is the fluorescence intensity ratio
in the absence of ligand, Kd is the dissociation constant, and [NBD1total] is the total concentration
of SUR2A NBD1 in the reaction.
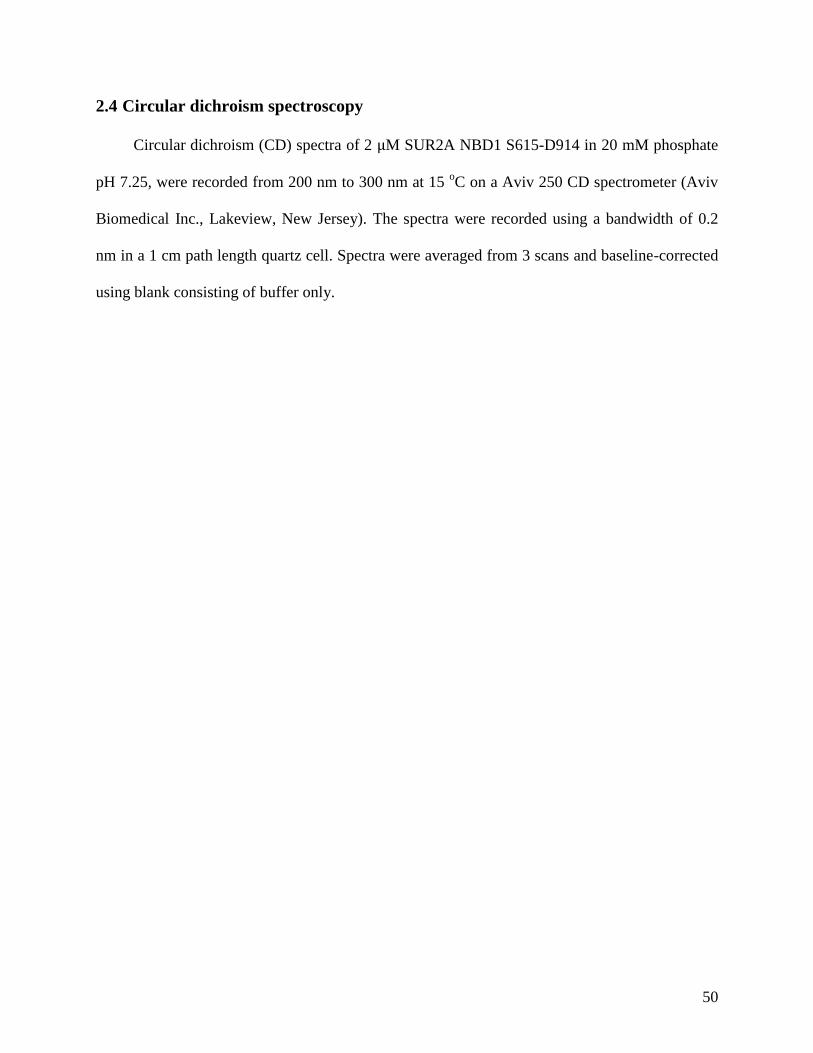
50
2.4 Circular dichroism spectroscopy
Circular dichroism (CD) spectra of 2 μM SUR2A NBD1 S615-D914 in 20 mM phosphate
pH 7.25, were recorded from 200 nm to 300 nm at 15 oC on a Aviv 250 CD spectrometer (Aviv
Biomedical Inc., Lakeview, New Jersey). The spectra were recorded using a bandwidth of 0.2
nm in a 1 cm path length quartz cell. Spectra were averaged from 3 scans and baseline-corrected
using blank consisting of buffer only.
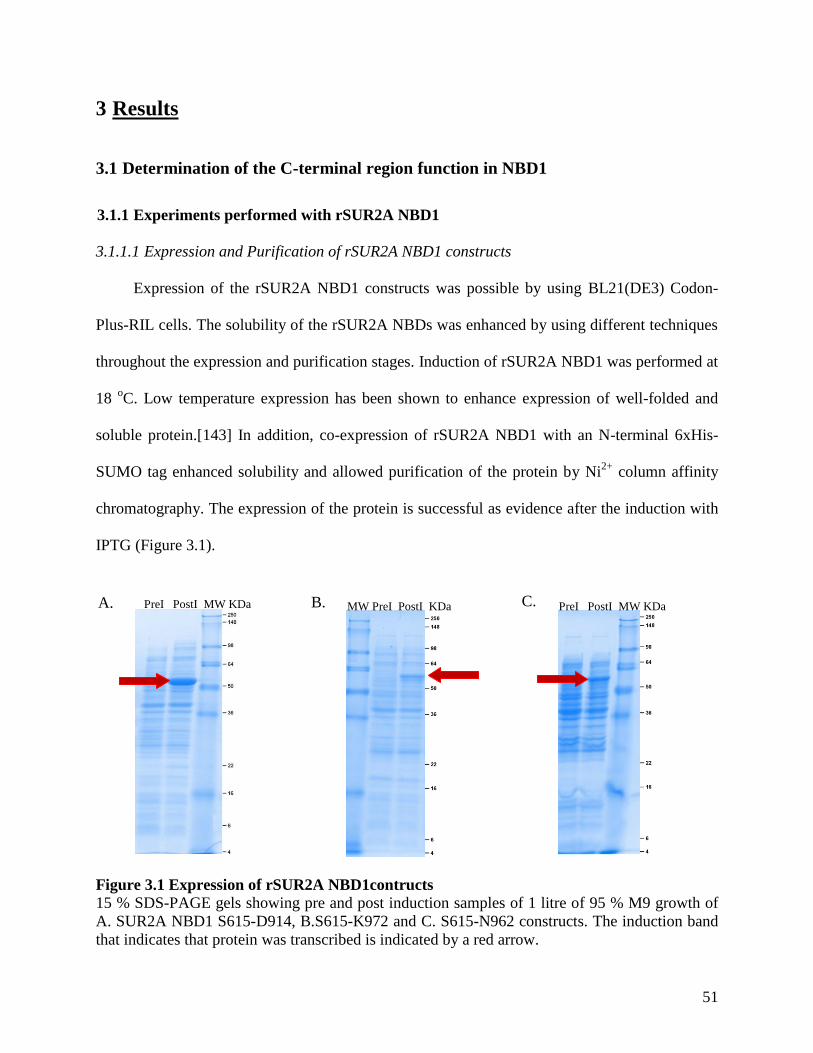
51
3 Results
3.1 Determination of the C-terminal region function in NBD1
3.1.1 Experiments performed with rSUR2A NBD1
3.1.1.1 Expression and Purification of rSUR2A NBD1 constructs
Expression of the rSUR2A NBD1 constructs was possible by using BL21(DE3) Codon-
Plus-RIL cells. The solubility of the rSUR2A NBDs was enhanced by using different techniques
throughout the expression and purification stages. Induction of rSUR2A NBD1 was performed at
18 oC. Low temperature expression has been shown to enhance expression of well-folded and
soluble protein.[143] In addition, co-expression of rSUR2A NBD1 with an N-terminal 6xHis-
SUMO tag enhanced solubility and allowed purification of the protein by Ni2+
column affinity
chromatography. The expression of the protein is successful as evidence after the induction with
IPTG (Figure 3.1).
Figure 3.1 Expression of rSUR2A NBD1contructs
15 % SDS-PAGE gels showing pre and post induction samples of 1 litre of 95 % M9 growth of
A. SUR2A NBD1 S615-D914, B.S615-K972 and C. S615-N962 constructs. The induction band
that indicates that protein was transcribed is indicated by a red arrow.
PreI PostI MW KDa MW PreI PostI KDa A. PreI PostI MW KDa B. C.
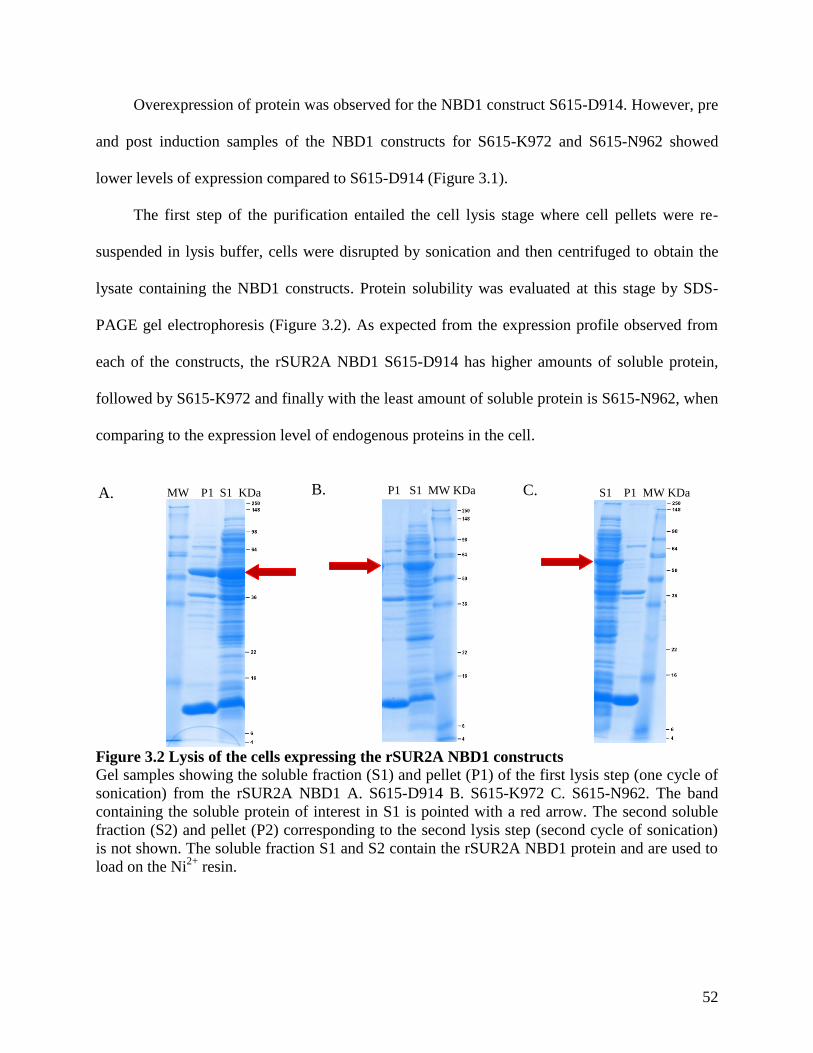
52
Overexpression of protein was observed for the NBD1 construct S615-D914. However, pre
and post induction samples of the NBD1 constructs for S615-K972 and S615-N962 showed
lower levels of expression compared to S615-D914 (Figure 3.1).
The first step of the purification entailed the cell lysis stage where cell pellets were re-
suspended in lysis buffer, cells were disrupted by sonication and then centrifuged to obtain the
lysate containing the NBD1 constructs. Protein solubility was evaluated at this stage by SDS-
PAGE gel electrophoresis (Figure 3.2). As expected from the expression profile observed from
each of the constructs, the rSUR2A NBD1 S615-D914 has higher amounts of soluble protein,
followed by S615-K972 and finally with the least amount of soluble protein is S615-N962, when
comparing to the expression level of endogenous proteins in the cell.
Figure 3.2 Lysis of the cells expressing the rSUR2A NBD1 constructs
Gel samples showing the soluble fraction (S1) and pellet (P1) of the first lysis step (one cycle of
sonication) from the rSUR2A NBD1 A. S615-D914 B. S615-K972 C. S615-N962. The band
containing the soluble protein of interest in S1 is pointed with a red arrow. The second soluble
fraction (S2) and pellet (P2) corresponding to the second lysis step (second cycle of sonication)
is not shown. The soluble fraction S1 and S2 contain the rSUR2A NBD1 protein and are used to
load on the Ni2+
resin.
MW P1 S1 KDa P1 S1 MW KDa S1 P1 MW KDa A. B. C.
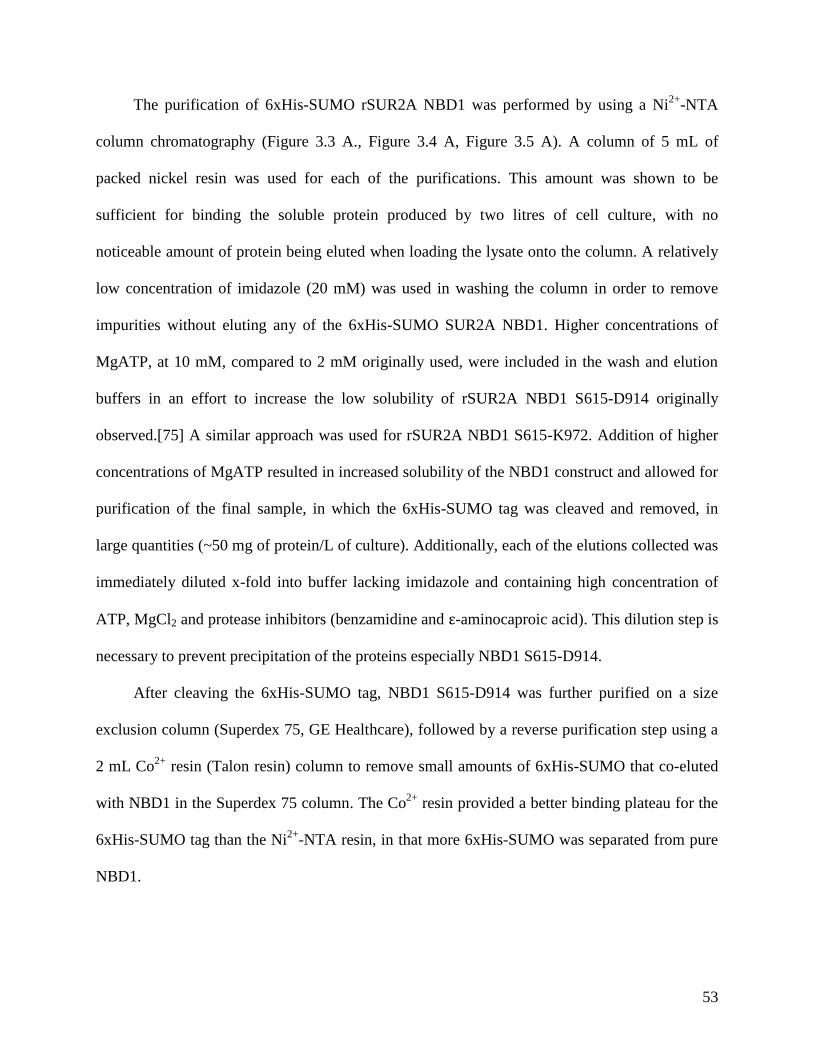
53
The purification of 6xHis-SUMO rSUR2A NBD1 was performed by using a Ni2+
-NTA
column chromatography (Figure 3.3 A., Figure 3.4 A, Figure 3.5 A). A column of 5 mL of
packed nickel resin was used for each of the purifications. This amount was shown to be
sufficient for binding the soluble protein produced by two litres of cell culture, with no
noticeable amount of protein being eluted when loading the lysate onto the column. A relatively
low concentration of imidazole (20 mM) was used in washing the column in order to remove
impurities without eluting any of the 6xHis-SUMO SUR2A NBD1. Higher concentrations of
MgATP, at 10 mM, compared to 2 mM originally used, were included in the wash and elution
buffers in an effort to increase the low solubility of rSUR2A NBD1 S615-D914 originally
observed.[75] A similar approach was used for rSUR2A NBD1 S615-K972. Addition of higher
concentrations of MgATP resulted in increased solubility of the NBD1 construct and allowed for
purification of the final sample, in which the 6xHis-SUMO tag was cleaved and removed, in
large quantities (~50 mg of protein/L of culture). Additionally, each of the elutions collected was
immediately diluted x-fold into buffer lacking imidazole and containing high concentration of
ATP, MgCl2 and protease inhibitors (benzamidine and ε-aminocaproic acid). This dilution step is
necessary to prevent precipitation of the proteins especially NBD1 S615-D914.
After cleaving the 6xHis-SUMO tag, NBD1 S615-D914 was further purified on a size
exclusion column (Superdex 75, GE Healthcare), followed by a reverse purification step using a
2 mL Co2+
resin (Talon resin) column to remove small amounts of 6xHis-SUMO that co-eluted
with NBD1 in the Superdex 75 column. The Co2+
resin provided a better binding plateau for the
6xHis-SUMO tag than the Ni2+
-NTA resin, in that more 6xHis-SUMO was separated from pure
NBD1.
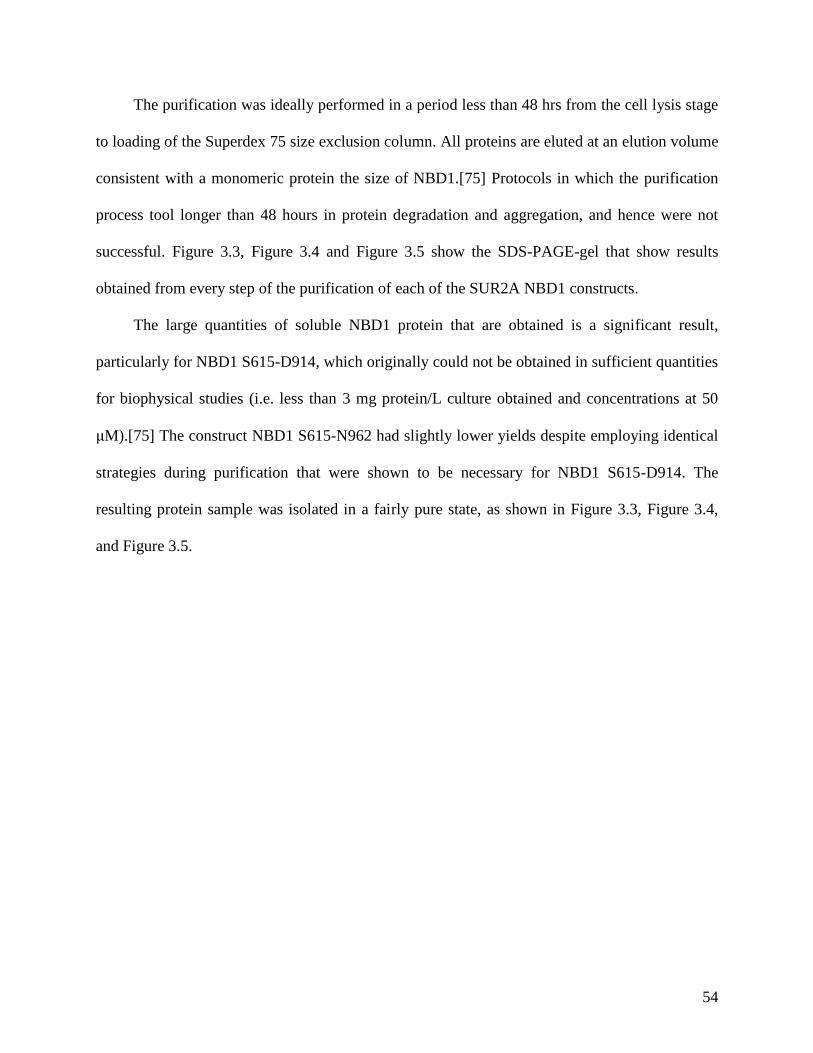
54
The purification was ideally performed in a period less than 48 hrs from the cell lysis stage
to loading of the Superdex 75 size exclusion column. All proteins are eluted at an elution volume
consistent with a monomeric protein the size of NBD1.[75] Protocols in which the purification
process tool longer than 48 hours in protein degradation and aggregation, and hence were not
successful. Figure 3.3, Figure 3.4 and Figure 3.5 show the SDS-PAGE-gel that show results
obtained from every step of the purification of each of the SUR2A NBD1 constructs.
The large quantities of soluble NBD1 protein that are obtained is a significant result,
particularly for NBD1 S615-D914, which originally could not be obtained in sufficient quantities
for biophysical studies (i.e. less than 3 mg protein/L culture obtained and concentrations at 50
μM).[75] The construct NBD1 S615-N962 had slightly lower yields despite employing identical
strategies during purification that were shown to be necessary for NBD1 S615-D914. The
resulting protein sample was isolated in a fairly pure state, as shown in Figure 3.3, Figure 3.4,
and Figure 3.5.
55
10 20
0
300
600
900
Inte
nsity a
t A
28
0 (
mA
U)
Elution Volume (mL)
Figure 3.3 Purification of rSUR2A NBD1 (S615-D914)
A. 15 % SDS-PAGE gel of Ni2+
affinity purification of 6xHis-SUMO rSUR2A NBD1 (S615-
D914) (expected MW of 47954 Da), depicting the load or lysate (L), flow through (F/T), wash
(W) and elutions 1-5 (E1-E5). Each of the elution fractions had a total volume of 10 mL. The
volume of every sample loaded in this gel was 5 μL. B. 15 % SDS-PAGE gel of pre and post Ulp
cleavage. MW of NBD1 is 33967 Da (5 μL load on the gel). C. A280 trace from size exclusion
purification using a Superdex 75 (GE Healthcare) column. D. Co2+
affinity reverse purification:
L1 (load 1) fractions prior FPLC purification, L2 (load 2) pooled fractions collected after FPLC,
B1 beads prior loading, flow through (F/T) ~25 mL, W1 (wash 1) ~12 mL, W2 (wash 2) ~3 mL
(W2) and B2 beads post washing. The volume of all samples loaded on the gel was 20 μL. The
SUR NBD1 protein n al gels is highlighted with a red box.
KDa MW Lys F/T W E1 E2 E3 E4 E5 KDa MW Pre Post
KDa MW L1 L2 B1 F/T W1 W2 B2
A. B.
C. D.
56
10 20
0
200
400
Inte
nsity a
t A
28
0 (
mA
U)
Elution volume (mL)
Figure 3.4 Purification of rSUR2A NBD1 (S615-K972)
A. 15 % SDS-PAGE gel of Ni2+
affinity chromatography of 6xHis-SUMO rSUR2A NBD1
(S615-K972) MW 54983 Da, depicting the load or lysate (L), flow through (F/T), wash (W) and
elutions 1-5 (E1-E5). The volume of every sample loaded in this gel is 5 μL. B. 15 % SDS-
PAGE anion exchange column purification of SUR2A NBD1 S615-K972 after removal of the
6xHis-SUMO tag with Ulp protease. The molecular mass of NBD1 S615-K972 is 40993 Da.
Selected fractions are shown. The gradient was increased at a rate of 20 mM/mL. The protein
was eluted at ~350 mM NaCl. Each fraction was 2 mL and 10 μL was loaded on the gel C. A280
trace from Superdex 75 (GE Healthcare) size exclusion purification of pooled anion exchange
fractions. D. 15 % SDS PAGE gel of reverse Ni2+
purification showing: load from the pooled
fractions of collected after the size exclusion column (L), flow through (F/T), wash (W) and Ni 2+
beads after washing. The NBD1 S615-K972 protein in all gels is highlighted with a red box.
Lys F/T W MW E1 E2 E3 E4 E5 KDa
KDa MW F/T W
B
A. B.
C. D.
KDa MW F/T W 3 8 9 13 15 17 18 19 20 21 22
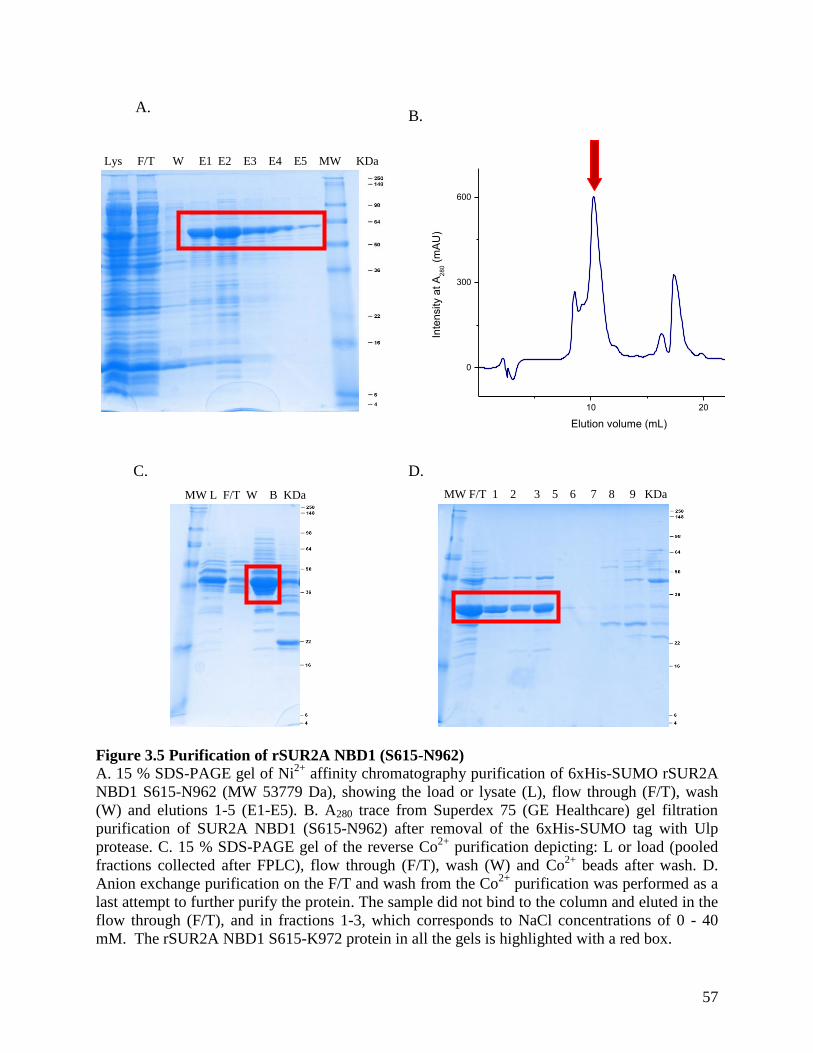
57
10 20
0
300
600
Inte
nsity a
t A
28
0 (
mA
U)
Elution volume (mL)
Figure 3.5 Purification of rSUR2A NBD1 (S615-N962)
A. 15 % SDS-PAGE gel of Ni2+
affinity chromatography purification of 6xHis-SUMO rSUR2A
NBD1 S615-N962 (MW 53779 Da), showing the load or lysate (L), flow through (F/T), wash
(W) and elutions 1-5 (E1-E5). B. A280 trace from Superdex 75 (GE Healthcare) gel filtration
purification of SUR2A NBD1 (S615-N962) after removal of the 6xHis-SUMO tag with Ulp
protease. C. 15 % SDS-PAGE gel of the reverse Co2+
purification depicting: L or load (pooled
fractions collected after FPLC), flow through (F/T), wash (W) and Co2+
beads after wash. D.
Anion exchange purification on the F/T and wash from the Co2+
purification was performed as a
last attempt to further purify the protein. The sample did not bind to the column and eluted in the
flow through (F/T), and in fractions 1-3, which corresponds to NaCl concentrations of 0 - 40
mM. The rSUR2A NBD1 S615-K972 protein in all the gels is highlighted with a red box.
Lys F/T W E1 E2 E3 E4 E5 MW KDa
MW L F/T W B KDa
A. B.
C. D.
MW F/T 1 2 3 5 6 7 8 9 KDa
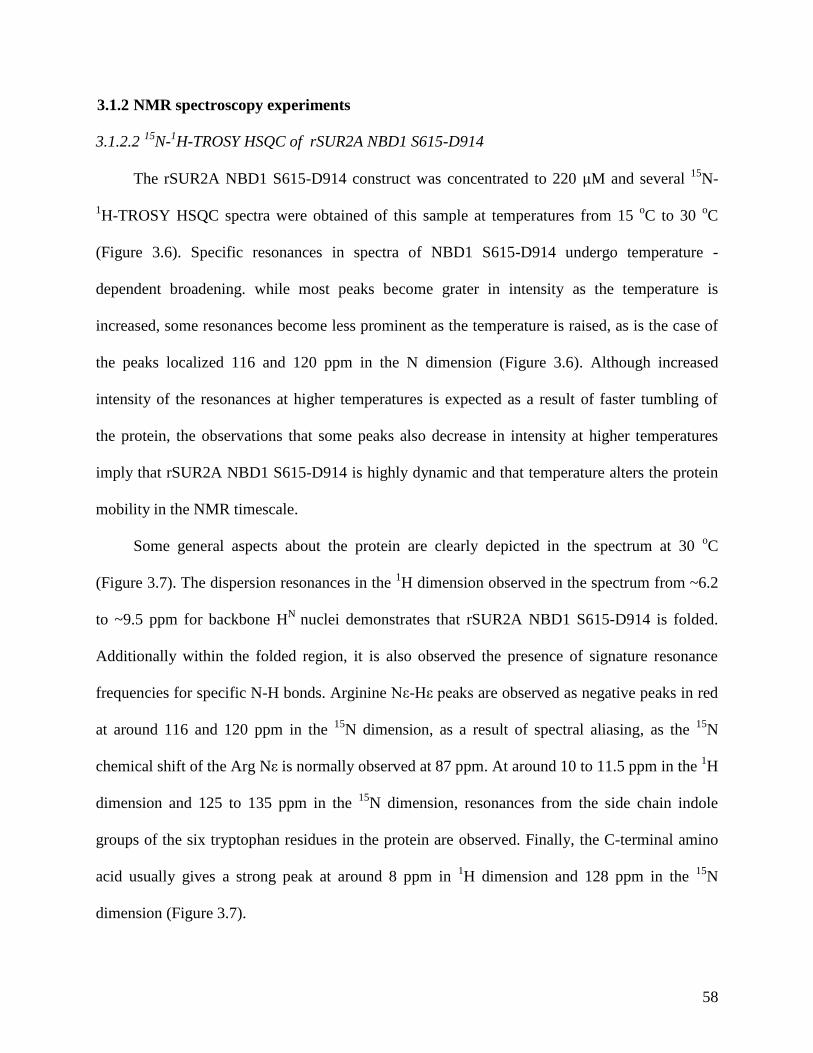
58
3.1.2 NMR spectroscopy experiments
3.1.2.2 15N-
1H-TROSY HSQC of rSUR2A NBD1 S615-D914
The rSUR2A NBD1 S615-D914 construct was concentrated to 220 μM and several 15
N-
1H-TROSY HSQC spectra were obtained of this sample at temperatures from 15
oC to 30
oC
(Figure 3.6). Specific resonances in spectra of NBD1 S615-D914 undergo temperature -
dependent broadening. while most peaks become grater in intensity as the temperature is
increased, some resonances become less prominent as the temperature is raised, as is the case of
the peaks localized 116 and 120 ppm in the N dimension (Figure 3.6). Although increased
intensity of the resonances at higher temperatures is expected as a result of faster tumbling of
the protein, the observations that some peaks also decrease in intensity at higher temperatures
imply that rSUR2A NBD1 S615-D914 is highly dynamic and that temperature alters the protein
mobility in the NMR timescale.
Some general aspects about the protein are clearly depicted in the spectrum at 30 oC
(Figure 3.7). The dispersion resonances in the 1H dimension observed in the spectrum from ~6.2
to ~9.5 ppm for backbone HN
nuclei demonstrates that rSUR2A NBD1 S615-D914 is folded.
Additionally within the folded region, it is also observed the presence of signature resonance
frequencies for specific N-H bonds. Arginine Nε-Hε peaks are observed as negative peaks in red
at around 116 and 120 ppm in the 15
N dimension, as a result of spectral aliasing, as the 15
N
chemical shift of the Arg Nε is normally observed at 87 ppm. At around 10 to 11.5 ppm in the 1H
dimension and 125 to 135 ppm in the 15
N dimension, resonances from the side chain indole
groups of the six tryptophan residues in the protein are observed. Finally, the C-terminal amino
acid usually gives a strong peak at around 8 ppm in 1H dimension and 128 ppm in the
15N
dimension (Figure 3.7).
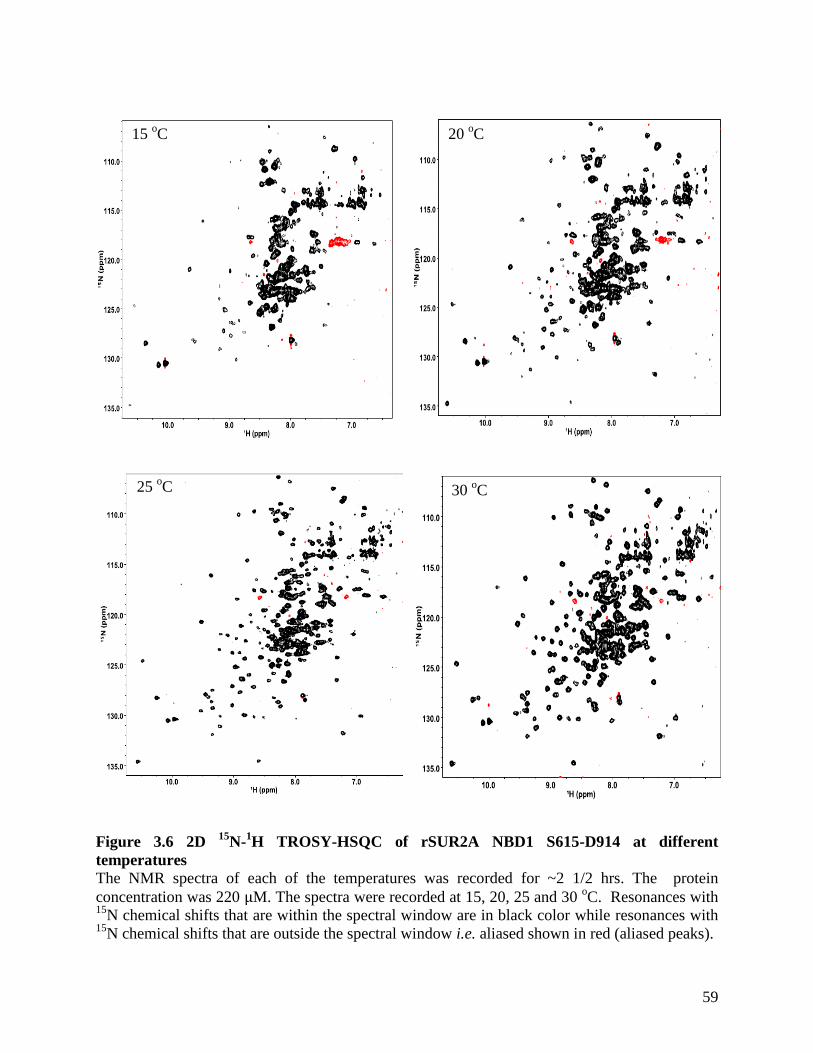
59
Figure 3.6 2D 15
N-1H TROSY-HSQC of rSUR2A NBD1 S615-D914 at different
temperatures
The NMR spectra of each of the temperatures was recorded for ~2 1/2 hrs. The protein
concentration was 220 μM. The spectra were recorded at 15, 20, 25 and 30 oC. Resonances with
15N chemical shifts that are within the spectral window are in black color while resonances with
15N chemical shifts that are outside the spectral window i.e. aliased shown in red (aliased peaks).
15 oC
20 oC
25 oC
30 oC
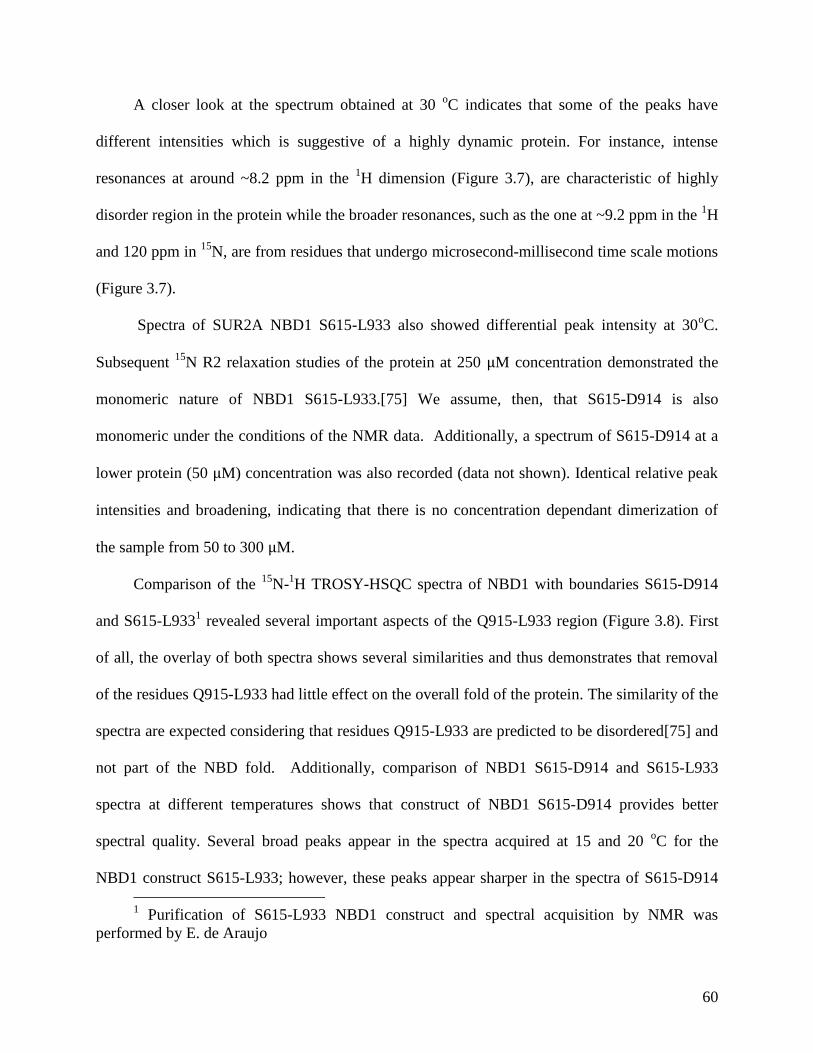
60
A closer look at the spectrum obtained at 30 oC indicates that some of the peaks have
different intensities which is suggestive of a highly dynamic protein. For instance, intense
resonances at around ~8.2 ppm in the 1H dimension (Figure 3.7), are characteristic of highly
disorder region in the protein while the broader resonances, such as the one at ~9.2 ppm in the 1H
and 120 ppm in 15
N, are from residues that undergo microsecond-millisecond time scale motions
(Figure 3.7).
Spectra of SUR2A NBD1 S615-L933 also showed differential peak intensity at 30oC.
Subsequent 15
N R2 relaxation studies of the protein at 250 μM concentration demonstrated the
monomeric nature of NBD1 S615-L933.[75] We assume, then, that S615-D914 is also
monomeric under the conditions of the NMR data. Additionally, a spectrum of S615-D914 at a
lower protein (50 μM) concentration was also recorded (data not shown). Identical relative peak
intensities and broadening, indicating that there is no concentration dependant dimerization of
the sample from 50 to 300 μM.
Comparison of the 15
N-1H TROSY-HSQC spectra of NBD1 with boundaries S615-D914
and S615-L9331 revealed several important aspects of the Q915-L933 region (Figure 3.8). First
of all, the overlay of both spectra shows several similarities and thus demonstrates that removal
of the residues Q915-L933 had little effect on the overall fold of the protein. The similarity of the
spectra are expected considering that residues Q915-L933 are predicted to be disordered[75] and
not part of the NBD fold. Additionally, comparison of NBD1 S615-D914 and S615-L933
spectra at different temperatures shows that construct of NBD1 S615-D914 provides better
spectral quality. Several broad peaks appear in the spectra acquired at 15 and 20 oC for the
NBD1 construct S615-L933; however, these peaks appear sharper in the spectra of S615-D914
1 Purification of S615-L933 NBD1 construct and spectral acquisition by NMR was
performed by E. de Araujo
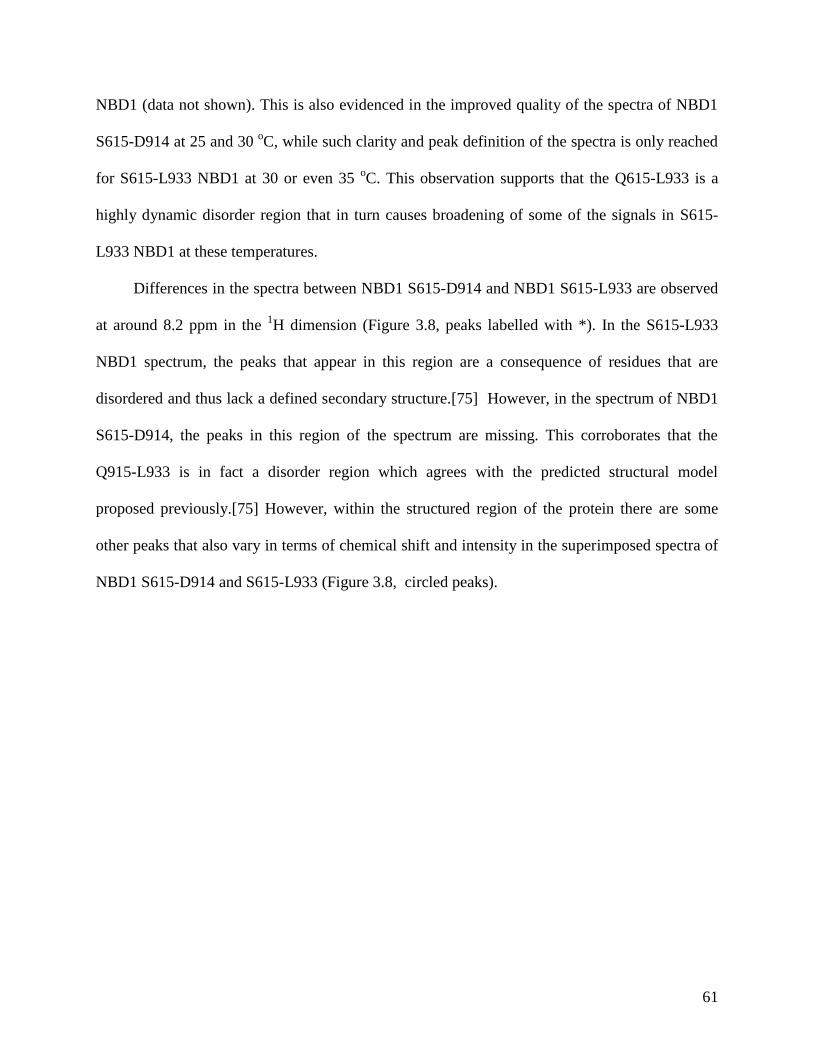
61
NBD1 (data not shown). This is also evidenced in the improved quality of the spectra of NBD1
S615-D914 at 25 and 30 oC, while such clarity and peak definition of the spectra is only reached
for S615-L933 NBD1 at 30 or even 35 oC. This observation supports that the Q615-L933 is a
highly dynamic disorder region that in turn causes broadening of some of the signals in S615-
L933 NBD1 at these temperatures.
Differences in the spectra between NBD1 S615-D914 and NBD1 S615-L933 are observed
at around 8.2 ppm in the 1H dimension (Figure 3.8, peaks labelled with *). In the S615-L933
NBD1 spectrum, the peaks that appear in this region are a consequence of residues that are
disordered and thus lack a defined secondary structure.[75] However, in the spectrum of NBD1
S615-D914, the peaks in this region of the spectrum are missing. This corroborates that the
Q915-L933 is in fact a disorder region which agrees with the predicted structural model
proposed previously.[75] However, within the structured region of the protein there are some
other peaks that also vary in terms of chemical shift and intensity in the superimposed spectra of
NBD1 S615-D914 and S615-L933 (Figure 3.8, circled peaks).
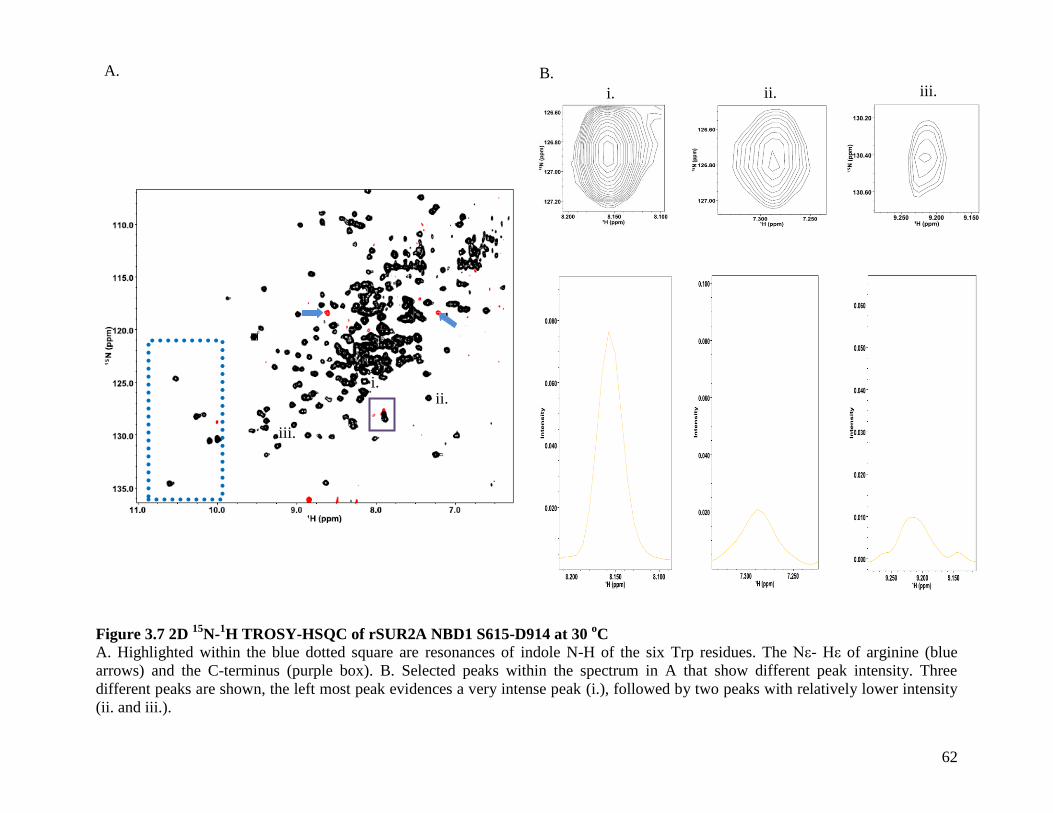
62
Figure 3.7 2D 15
N-1H TROSY-HSQC of rSUR2A NBD1 S615-D914 at 30
oC
A. Highlighted within the blue dotted square are resonances of indole N-H of the six Trp residues. The Nε- Hε of arginine (blue
arrows) and the C-terminus (purple box). B. Selected peaks within the spectrum in A that show different peak intensity. Three
different peaks are shown, the left most peak evidences a very intense peak (i.), followed by two peaks with relatively lower intensity
(ii. and iii.).
A. B.
i. ii. iii.
i. ii.
iii.
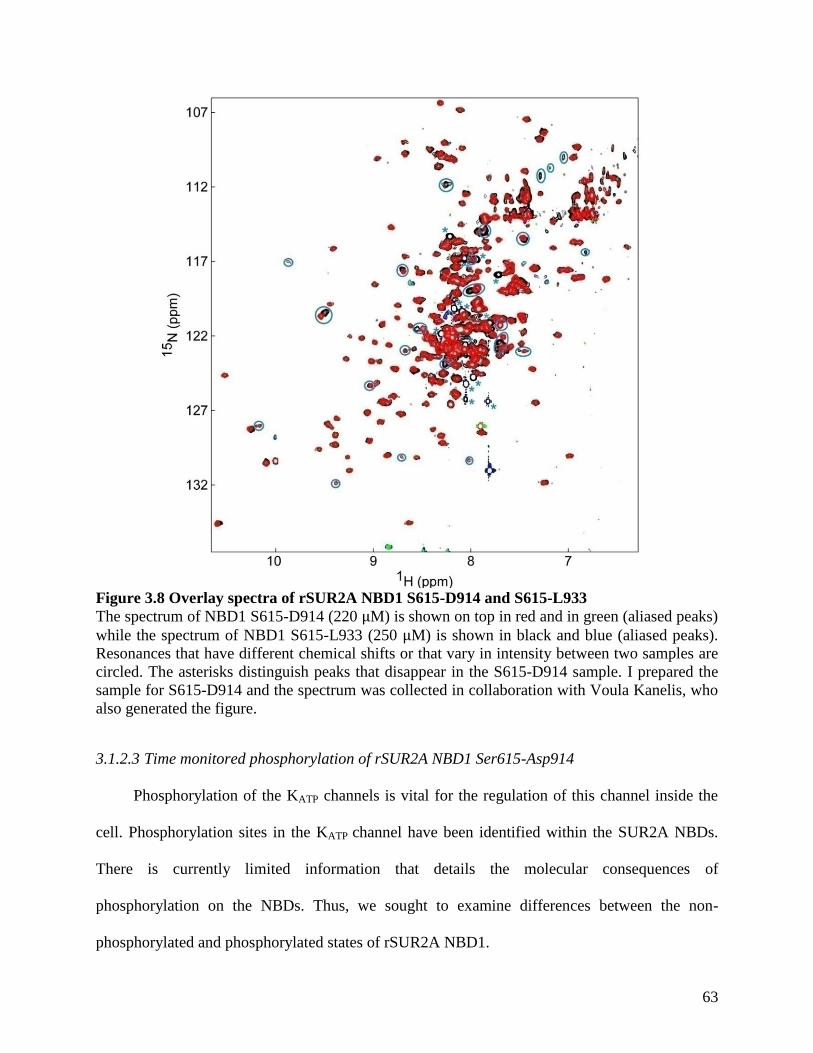
63
Figure 3.8 Overlay spectra of rSUR2A NBD1 S615-D914 and S615-L933
The spectrum of NBD1 S615-D914 (220 μM) is shown on top in red and in green (aliased peaks)
while the spectrum of NBD1 S615-L933 (250 μM) is shown in black and blue (aliased peaks).
Resonances that have different chemical shifts or that vary in intensity between two samples are
circled. The asterisks distinguish peaks that disappear in the S615-D914 sample. I prepared the
sample for S615-D914 and the spectrum was collected in collaboration with Voula Kanelis, who
also generated the figure.
3.1.2.3 Time monitored phosphorylation of rSUR2A NBD1 Ser615-Asp914
Phosphorylation of the KATP channels is vital for the regulation of this channel inside the
cell. Phosphorylation sites in the KATP channel have been identified within the SUR2A NBDs.
There is currently limited information that details the molecular consequences of
phosphorylation on the NBDs. Thus, we sought to examine differences between the non-
phosphorylated and phosphorylated states of rSUR2A NBD1.
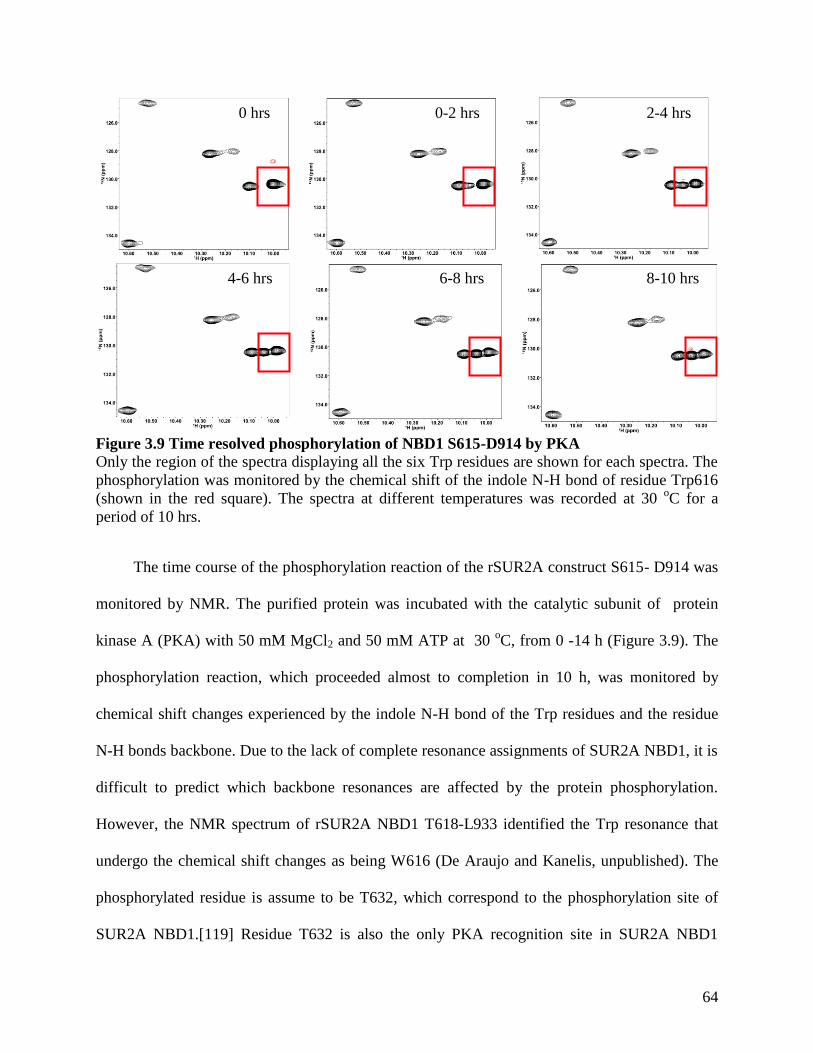
64
Figure 3.9 Time resolved phosphorylation of NBD1 S615-D914 by PKA
Only the region of the spectra displaying all the six Trp residues are shown for each spectra. The
phosphorylation was monitored by the chemical shift of the indole N-H bond of residue Trp616
(shown in the red square). The spectra at different temperatures was recorded at 30 oC for a
period of 10 hrs.
The time course of the phosphorylation reaction of the rSUR2A construct S615- D914 was
monitored by NMR. The purified protein was incubated with the catalytic subunit of protein
kinase A (PKA) with 50 mM MgCl2 and 50 mM ATP at 30 oC, from 0 -14 h (Figure 3.9). The
phosphorylation reaction, which proceeded almost to completion in 10 h, was monitored by
chemical shift changes experienced by the indole N-H bond of the Trp residues and the residue
N-H bonds backbone. Due to the lack of complete resonance assignments of SUR2A NBD1, it is
difficult to predict which backbone resonances are affected by the protein phosphorylation.
However, the NMR spectrum of rSUR2A NBD1 T618-L933 identified the Trp resonance that
undergo the chemical shift changes as being W616 (De Araujo and Kanelis, unpublished). The
phosphorylated residue is assume to be T632, which correspond to the phosphorylation site of
SUR2A NBD1.[119] Residue T632 is also the only PKA recognition site in SUR2A NBD1
0 hrs 0-2 hrs 2-4 hrs
4-6 hrs 6-8 hrs 8-10 hrs
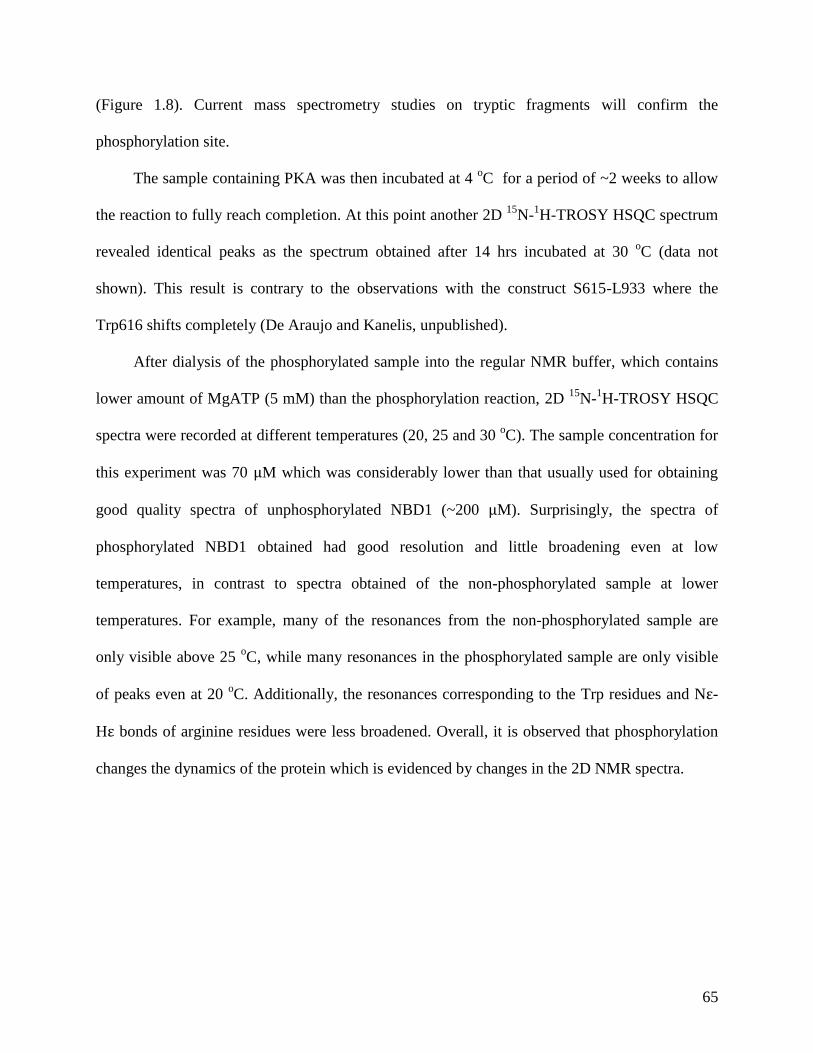
65
(Figure 1.8). Current mass spectrometry studies on tryptic fragments will confirm the
phosphorylation site.
The sample containing PKA was then incubated at 4 oC for a period of ~2 weeks to allow
the reaction to fully reach completion. At this point another 2D 15
N-1H-TROSY HSQC spectrum
revealed identical peaks as the spectrum obtained after 14 hrs incubated at 30 oC (data not
shown). This result is contrary to the observations with the construct S615-L933 where the
Trp616 shifts completely (De Araujo and Kanelis, unpublished).
After dialysis of the phosphorylated sample into the regular NMR buffer, which contains
lower amount of MgATP (5 mM) than the phosphorylation reaction, 2D 15
N-1H-TROSY HSQC
spectra were recorded at different temperatures (20, 25 and 30 oC). The sample concentration for
this experiment was 70 μM which was considerably lower than that usually used for obtaining
good quality spectra of unphosphorylated NBD1 (~200 μM). Surprisingly, the spectra of
phosphorylated NBD1 obtained had good resolution and little broadening even at low
temperatures, in contrast to spectra obtained of the non-phosphorylated sample at lower
temperatures. For example, many of the resonances from the non-phosphorylated sample are
only visible above 25 oC, while many resonances in the phosphorylated sample are only visible
of peaks even at 20 oC. Additionally, the resonances corresponding to the Trp residues and Nε-
Hε bonds of arginine residues were less broadened. Overall, it is observed that phosphorylation
changes the dynamics of the protein which is evidenced by changes in the 2D NMR spectra.
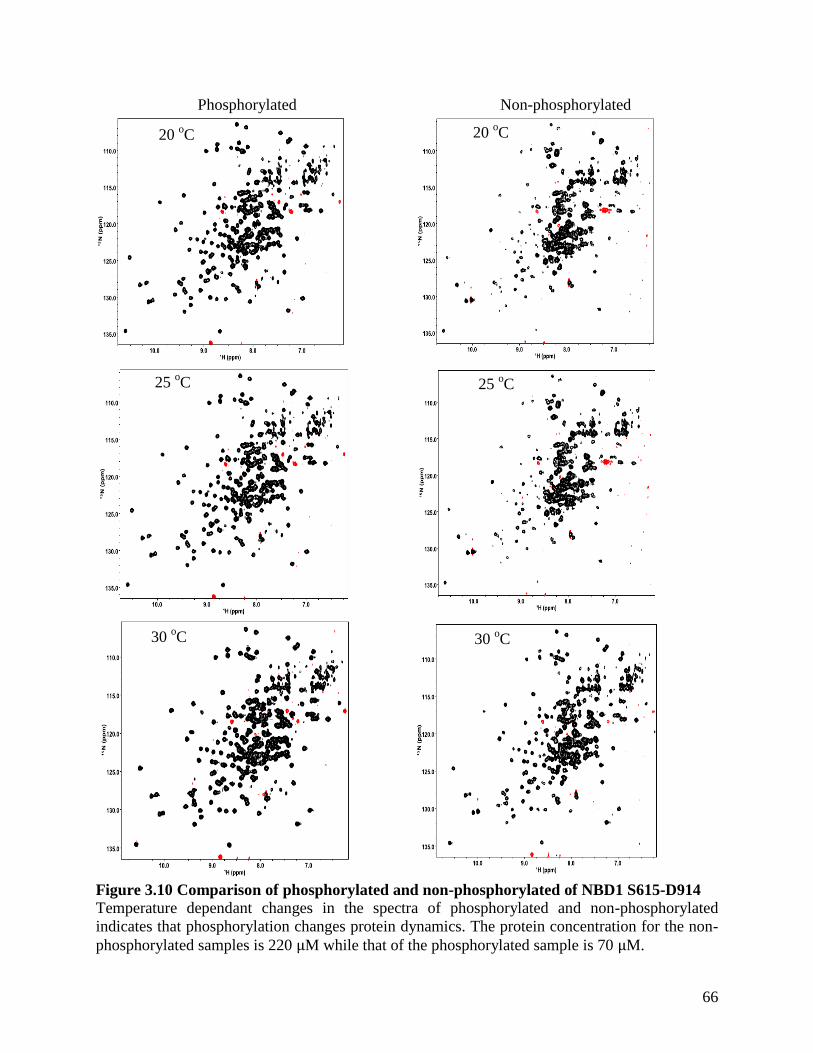
66
Phosphorylated Non-phosphorylated
Figure 3.10 Comparison of phosphorylated and non-phosphorylated of NBD1 S615-D914
Temperature dependant changes in the spectra of phosphorylated and non-phosphorylated
indicates that phosphorylation changes protein dynamics. The protein concentration for the non-
phosphorylated samples is 220 μM while that of the phosphorylated sample is 70 μM.
20 oC 20
oC
25 oC 25
oC
30 oC 30
oC
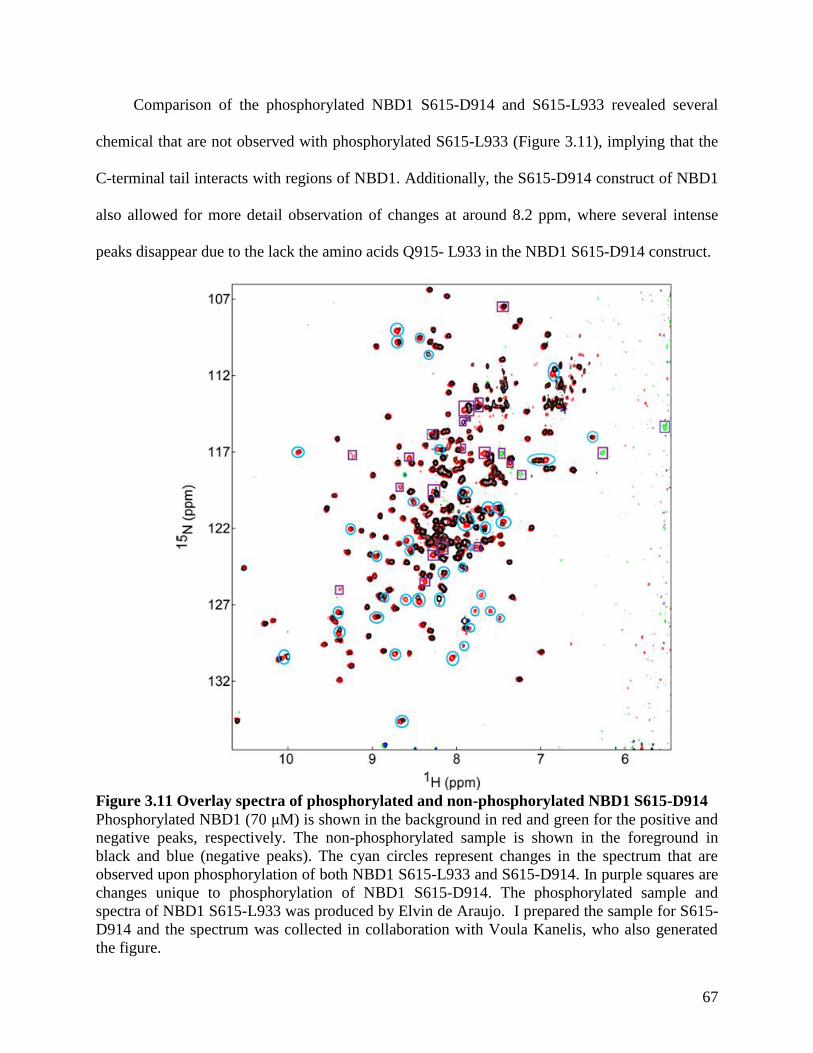
67
Comparison of the phosphorylated NBD1 S615-D914 and S615-L933 revealed several
chemical that are not observed with phosphorylated S615-L933 (Figure 3.11), implying that the
C-terminal tail interacts with regions of NBD1. Additionally, the S615-D914 construct of NBD1
also allowed for more detail observation of changes at around 8.2 ppm, where several intense
peaks disappear due to the lack the amino acids Q915- L933 in the NBD1 S615-D914 construct.
Figure 3.11 Overlay spectra of phosphorylated and non-phosphorylated NBD1 S615-D914
Phosphorylated NBD1 (70 μM) is shown in the background in red and green for the positive and
negative peaks, respectively. The non-phosphorylated sample is shown in the foreground in
black and blue (negative peaks). The cyan circles represent changes in the spectrum that are
observed upon phosphorylation of both NBD1 S615-L933 and S615-D914. In purple squares are
changes unique to phosphorylation of NBD1 S615-D914. The phosphorylated sample and
spectra of NBD1 S615-L933 was produced by Elvin de Araujo. I prepared the sample for S615-
D914 and the spectrum was collected in collaboration with Voula Kanelis, who also generated
the figure.
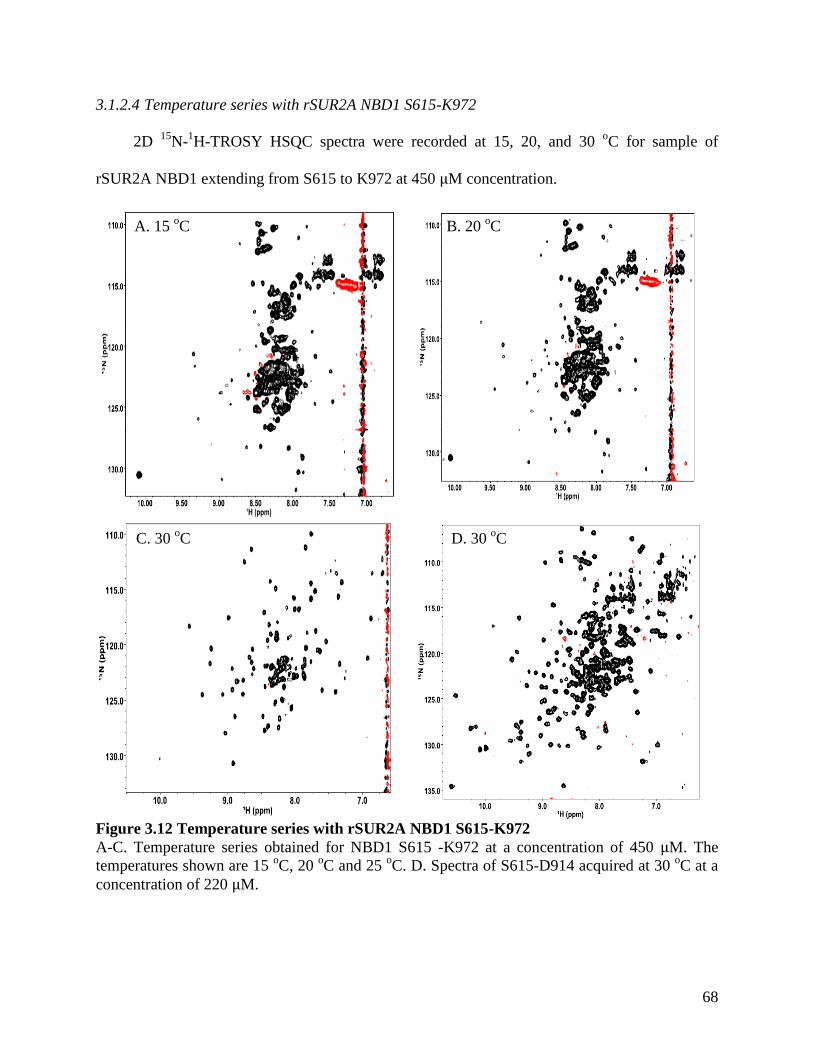
68
3.1.2.4 Temperature series with rSUR2A NBD1 S615-K972
2D 15
N-1H-TROSY HSQC spectra were recorded at 15, 20, and 30
oC for sample of
rSUR2A NBD1 extending from S615 to K972 at 450 μM concentration.
Figure 3.12 Temperature series with rSUR2A NBD1 S615-K972
A-C. Temperature series obtained for NBD1 S615 -K972 at a concentration of 450 μM. The
temperatures shown are 15 oC, 20
oC and 25
oC. D. Spectra of S615-D914 acquired at 30
oC at a
concentration of 220 μM.
A. 15 oC B. 20
oC
C. 30 oC D. 30
oC
69
Although the C-terminal extension increased the stability of the protein during the
purification stages, the protein was less stable at higher temperatures as the protein precipitated
at temperatures higher than 25 oC (Figure 3.12). The spectra obtained from this construct display
less resonances than those recorded for the S614-D914 construct. To determined whether
aggregation was a consequence of salt concentration and high concentration of rSUR2A NBD1
S615-K972 a 2D 15
N-1H-TROSY HSQC spectrum was recorded with 50 mM salt and 50 μM,
instead of the 150 mM NaCl concentration most often used (data not shown). The quality of the
spectrum at 30 oC for this sample was also low which once again demonstrated the instability of
this construct.
3.1.3 Fluorescence spectroscopy experiments
3.1.3.5 Thermal stability of rSUR2A NBD1 S615-D914 and rSUR2A NBD1 S615-K972
In order to assess the stability of the various SUR2A NBD1 constructs, changes in
tryptophan fluorescence were monitored as a function of temperature. The SUR2A NBD1
constructs each possess six Trp residues. Trp fluorescence intensity during unfolding was
monitored at an emission of 350 nm, which displayed the maximum intensity difference between
the folded and unfolded states. The melting process for these proteins exhibited an irreversible
two-state unfolding which rendered the determination of the thermodynamic parameter ΔG
impossible. For the construct rSUR2A NBD1 S615 D914 is observed that addition of ATP
stabilized the construct and thus melting of this construct in the presence of ATP had a higher
melting temperature (Figure 3.13 A.). Phosphorylation had no effect on the stability of the
sample in the presence of ATP (Figure 3.13 B.). Because the overall fluorescence change
corresponds to all six tryptophan residues in the protein, the changes in fluorescence are likely a
representation of multiple conformational changes in the protein with increasing temperature.
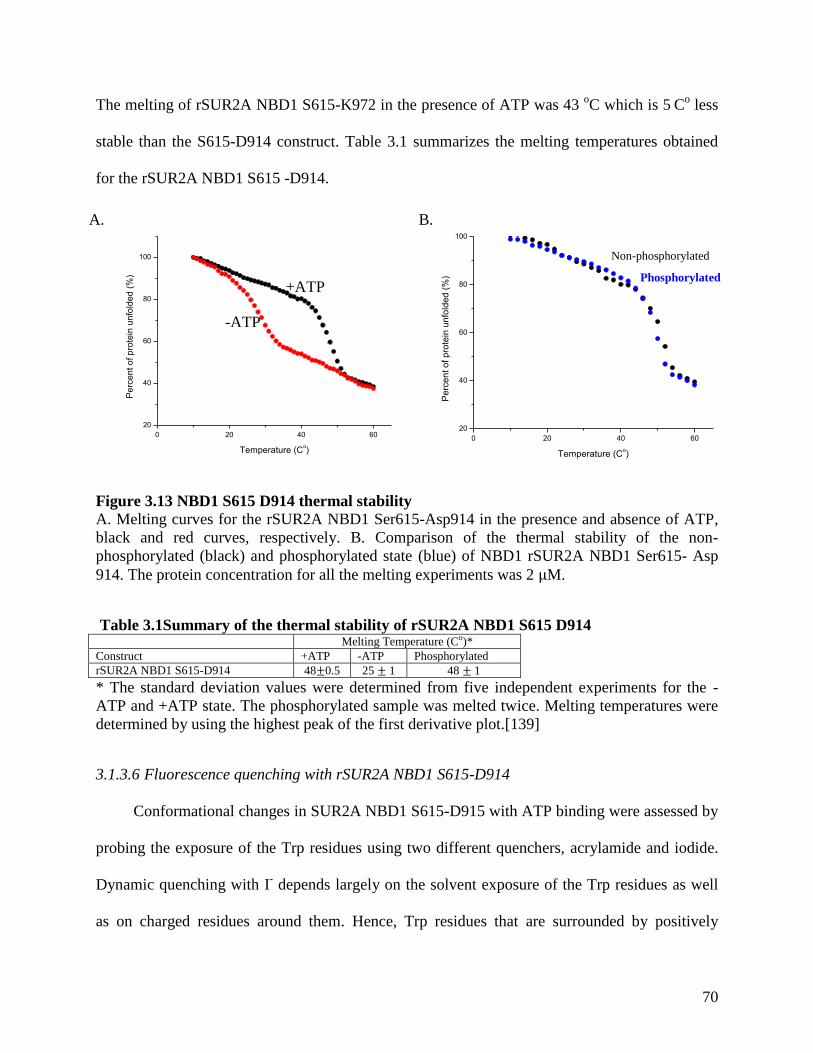
70
The melting of rSUR2A NBD1 S615-K972 in the presence of ATP was 43 oC which is 5
C
o less
stable than the S615-D914 construct. Table 3.1 summarizes the melting temperatures obtained
for the rSUR2A NBD1 S615 -D914.
0 20 40 60
20
40
60
80
100
Pe
rce
nt o
f p
rote
in u
nfo
lde
d (
%)
Temperature (Co)
0 20 40 60
20
40
60
80
100
Pe
rce
nt o
f p
rote
in u
nfo
lde
d (
%)
Temperature (Co)
Figure 3.13 NBD1 S615 D914 thermal stability
A. Melting curves for the rSUR2A NBD1 Ser615-Asp914 in the presence and absence of ATP,
black and red curves, respectively. B. Comparison of the thermal stability of the non-
phosphorylated (black) and phosphorylated state (blue) of NBD1 rSUR2A NBD1 Ser615- Asp
914. The protein concentration for all the melting experiments was 2 μM.
Table 3.1Summary of the thermal stability of rSUR2A NBD1 S615 D914 Melting Temperature (Co)*
Construct +ATP -ATP Phosphorylated
rSUR2A NBD1 S615-D914 48±0.5 25 ± 1 48 ± 1
* The standard deviation values were determined from five independent experiments for the -
ATP and +ATP state. The phosphorylated sample was melted twice. Melting temperatures were
determined by using the highest peak of the first derivative plot.[139]
3.1.3.6 Fluorescence quenching with rSUR2A NBD1 S615-D914
Conformational changes in SUR2A NBD1 S615-D915 with ATP binding were assessed by
probing the exposure of the Trp residues using two different quenchers, acrylamide and iodide.
Dynamic quenching with I- depends largely on the solvent exposure of the Trp residues as well
as on charged residues around them. Hence, Trp residues that are surrounded by positively
A. B.
+ATP
-ATP
Non-phosphorylated
Phosphorylated
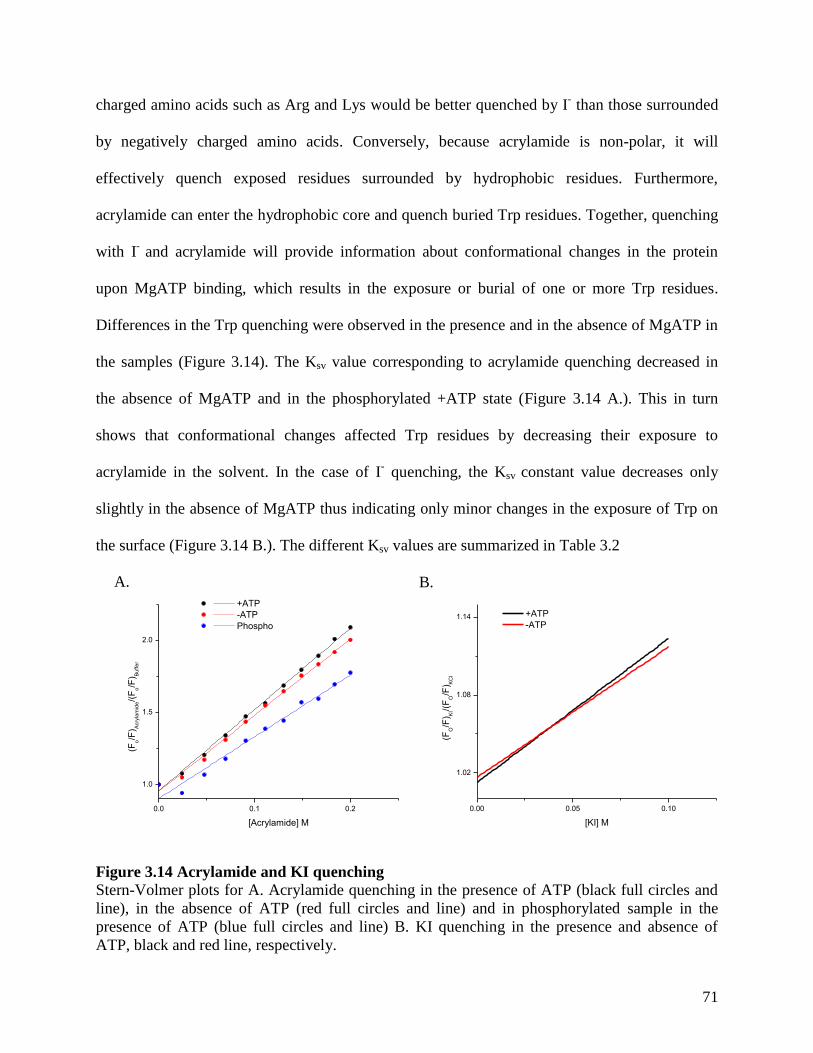
71
charged amino acids such as Arg and Lys would be better quenched by I- than those surrounded
by negatively charged amino acids. Conversely, because acrylamide is non-polar, it will
effectively quench exposed residues surrounded by hydrophobic residues. Furthermore,
acrylamide can enter the hydrophobic core and quench buried Trp residues. Together, quenching
with I-
and acrylamide will provide information about conformational changes in the protein
upon MgATP binding, which results in the exposure or burial of one or more Trp residues.
Differences in the Trp quenching were observed in the presence and in the absence of MgATP in
the samples (Figure 3.14). The Ksv value corresponding to acrylamide quenching decreased in
the absence of MgATP and in the phosphorylated +ATP state (Figure 3.14 A.). This in turn
shows that conformational changes affected Trp residues by decreasing their exposure to
acrylamide in the solvent. In the case of I- quenching, the Ksv constant value decreases only
slightly in the absence of MgATP thus indicating only minor changes in the exposure of Trp on
the surface (Figure 3.14 B.). The different Ksv values are summarized in Table 3.2
0.0 0.1 0.2
1.0
1.5
2.0
(F
o/F
) Acry
lam
ide/(
Fo/F
) Bu
ffe
r
[Acrylamide] M
+ATP
-ATP
Phospho
0.00 0.05 0.10
1.02
1.08
1.14 +ATP
-ATP
(FO/F
) KI/(
FO/F
) KC
l
[KI] M
Figure 3.14 Acrylamide and KI quenching
Stern-Volmer plots for A. Acrylamide quenching in the presence of ATP (black full circles and
line), in the absence of ATP (red full circles and line) and in phosphorylated sample in the
presence of ATP (blue full circles and line) B. KI quenching in the presence and absence of
ATP, black and red line, respectively.
A. B.
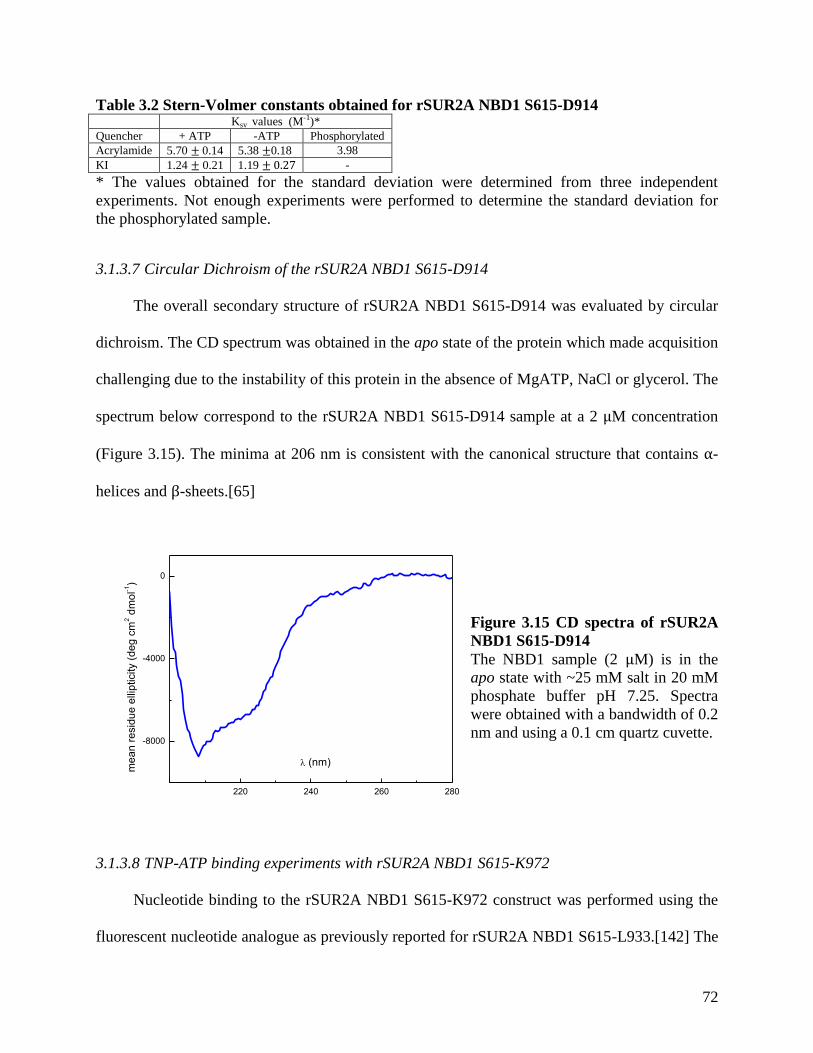
72
Table 3.2 Stern-Volmer constants obtained for rSUR2A NBD1 S615-D914 Ksv values (M-1)*
Quencher + ATP -ATP Phosphorylated
Acrylamide 5.70 ± 0.14 5.38 ±0.18 3.98
KI 1.24 ± 0.21 1.19 ± 0.27 -
* The values obtained for the standard deviation were determined from three independent
experiments. Not enough experiments were performed to determine the standard deviation for
the phosphorylated sample.
3.1.3.7 Circular Dichroism of the rSUR2A NBD1 S615-D914
The overall secondary structure of rSUR2A NBD1 S615-D914 was evaluated by circular
dichroism. The CD spectrum was obtained in the apo state of the protein which made acquisition
challenging due to the instability of this protein in the absence of MgATP, NaCl or glycerol. The
spectrum below correspond to the rSUR2A NBD1 S615-D914 sample at a 2 μM concentration
(Figure 3.15). The minima at 206 nm is consistent with the canonical structure that contains α-
helices and β-sheets.[65]
220 240 260 280
-8000
-4000
0
me
an
re
sid
ue
elli
pticity (
de
g c
m2 d
mo
l-1)
(nm)
Figure 3.15 CD spectra of rSUR2A
NBD1 S615-D914
The NBD1 sample (2 μM) is in the
apo state with ~25 mM salt in 20 mM
phosphate buffer pH 7.25. Spectra
were obtained with a bandwidth of 0.2
nm and using a 0.1 cm quartz cuvette.
3.1.3.8 TNP-ATP binding experiments with rSUR2A NBD1 S615-K972
Nucleotide binding to the rSUR2A NBD1 S615-K972 construct was performed using the
fluorescent nucleotide analogue as previously reported for rSUR2A NBD1 S615-L933.[142] The
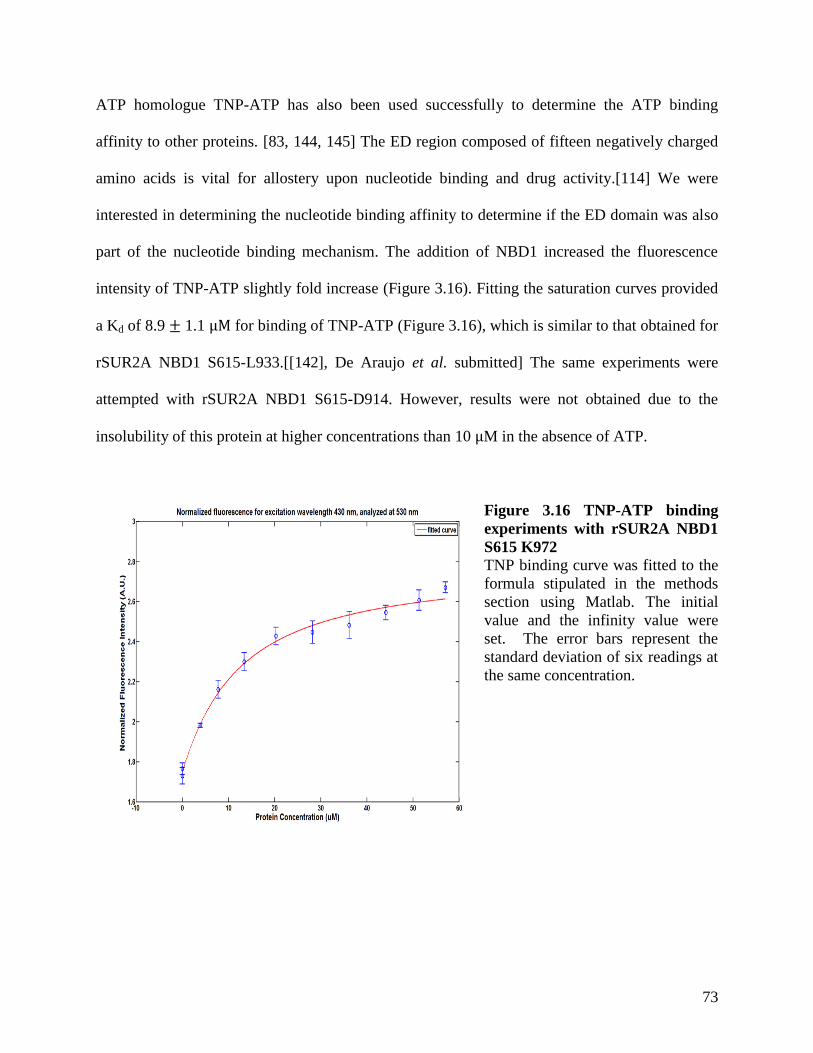
73
ATP homologue TNP-ATP has also been used successfully to determine the ATP binding
affinity to other proteins. [83, 144, 145] The ED region composed of fifteen negatively charged
amino acids is vital for allostery upon nucleotide binding and drug activity.[114] We were
interested in determining the nucleotide binding affinity to determine if the ED domain was also
part of the nucleotide binding mechanism. The addition of NBD1 increased the fluorescence
intensity of TNP-ATP slightly fold increase (Figure 3.16). Fitting the saturation curves provided
a Kd of 8.9 ± 1.1 μM for binding of TNP-ATP (Figure 3.16), which is similar to that obtained for
rSUR2A NBD1 S615-L933.[[142], De Araujo et al. submitted] The same experiments were
attempted with rSUR2A NBD1 S615-D914. However, results were not obtained due to the
insolubility of this protein at higher concentrations than 10 μM in the absence of ATP.
Figure 3.16 TNP-ATP binding
experiments with rSUR2A NBD1
S615 K972
TNP binding curve was fitted to the
formula stipulated in the methods
section using Matlab. The initial
value and the infinity value were
set. The error bars represent the
standard deviation of six readings at
the same concentration.
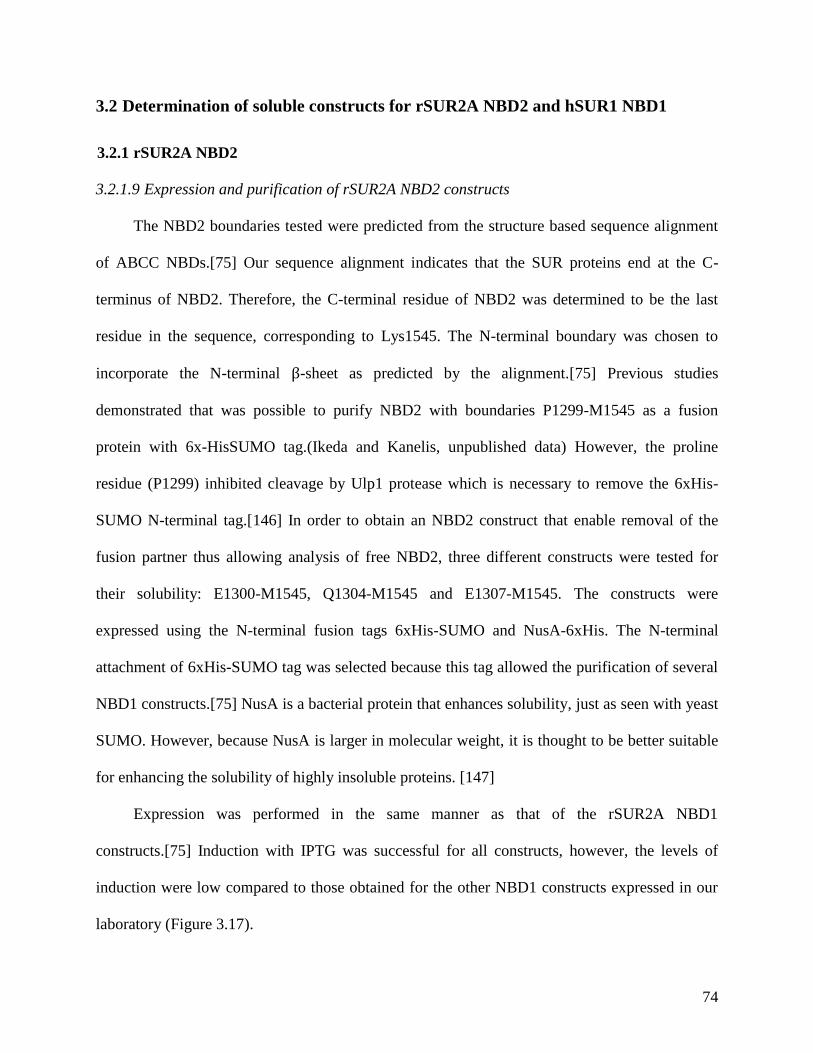
74
3.2 Determination of soluble constructs for rSUR2A NBD2 and hSUR1 NBD1
3.2.1 rSUR2A NBD2
3.2.1.9 Expression and purification of rSUR2A NBD2 constructs
The NBD2 boundaries tested were predicted from the structure based sequence alignment
of ABCC NBDs.[75] Our sequence alignment indicates that the SUR proteins end at the C-
terminus of NBD2. Therefore, the C-terminal residue of NBD2 was determined to be the last
residue in the sequence, corresponding to Lys1545. The N-terminal boundary was chosen to
incorporate the N-terminal β-sheet as predicted by the alignment.[75] Previous studies
demonstrated that was possible to purify NBD2 with boundaries P1299-M1545 as a fusion
protein with 6x-HisSUMO tag.(Ikeda and Kanelis, unpublished data) However, the proline
residue (P1299) inhibited cleavage by Ulp1 protease which is necessary to remove the 6xHis-
SUMO N-terminal tag.[146] In order to obtain an NBD2 construct that enable removal of the
fusion partner thus allowing analysis of free NBD2, three different constructs were tested for
their solubility: E1300-M1545, Q1304-M1545 and E1307-M1545. The constructs were
expressed using the N-terminal fusion tags 6xHis-SUMO and NusA-6xHis. The N-terminal
attachment of 6xHis-SUMO tag was selected because this tag allowed the purification of several
NBD1 constructs.[75] NusA is a bacterial protein that enhances solubility, just as seen with yeast
SUMO. However, because NusA is larger in molecular weight, it is thought to be better suitable
for enhancing the solubility of highly insoluble proteins. [147]
Expression was performed in the same manner as that of the rSUR2A NBD1
constructs.[75] Induction with IPTG was successful for all constructs, however, the levels of
induction were low compared to those obtained for the other NBD1 constructs expressed in our
laboratory (Figure 3.17).
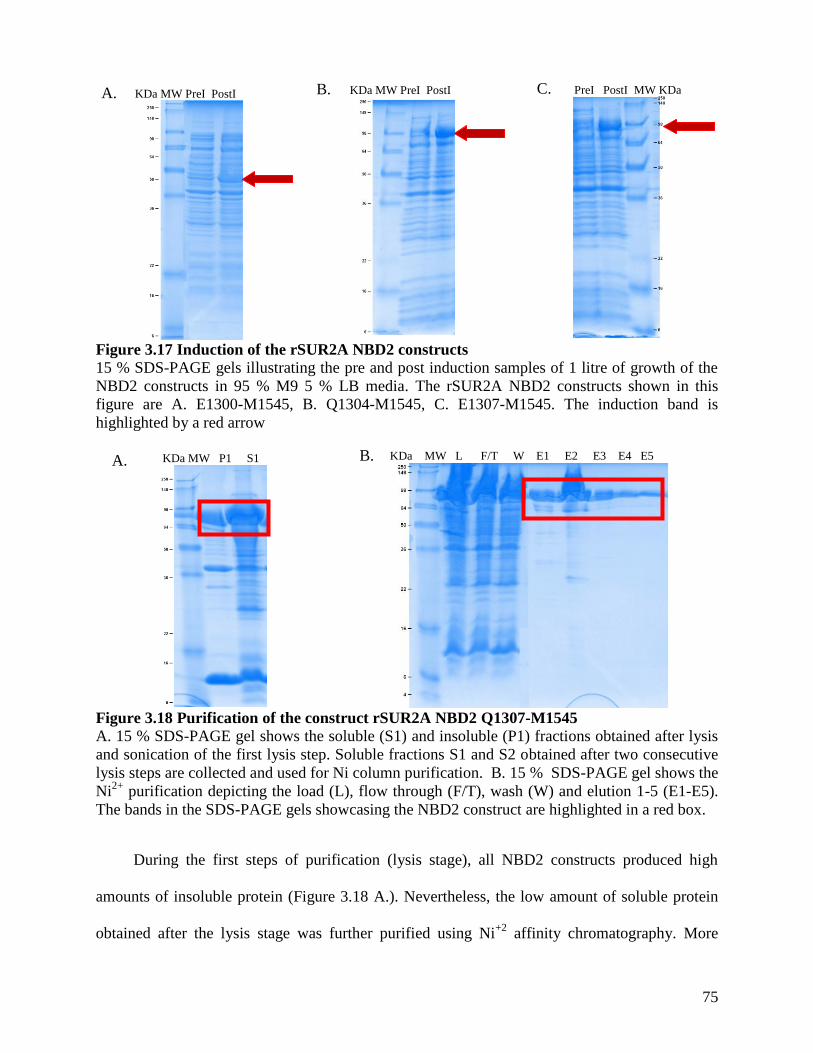
75
Figure 3.17 Induction of the rSUR2A NBD2 constructs
15 % SDS-PAGE gels illustrating the pre and post induction samples of 1 litre of growth of the
NBD2 constructs in 95 % M9 5 % LB media. The rSUR2A NBD2 constructs shown in this
figure are A. E1300-M1545, B. Q1304-M1545, C. E1307-M1545. The induction band is
highlighted by a red arrow
Figure 3.18 Purification of the construct rSUR2A NBD2 Q1307-M1545
A. 15 % SDS-PAGE gel shows the soluble (S1) and insoluble (P1) fractions obtained after lysis
and sonication of the first lysis step. Soluble fractions S1 and S2 obtained after two consecutive
lysis steps are collected and used for Ni column purification. B. 15 % SDS-PAGE gel shows the
Ni2+
purification depicting the load (L), flow through (F/T), wash (W) and elution 1-5 (E1-E5).
The bands in the SDS-PAGE gels showcasing the NBD2 construct are highlighted in a red box.
During the first steps of purification (lysis stage), all NBD2 constructs produced high
amounts of insoluble protein (Figure 3.18 A.). Nevertheless, the low amount of soluble protein
obtained after the lysis stage was further purified using Ni+2
affinity chromatography. More
PreI PostI MW KDa KDa MW PreI PostI KDa MW PreI PostI A. B. C.
KDa MW L F/T W E1 E2 E3 E4 E5 KDa MW P1 S1
A
.
B
.
A. B.
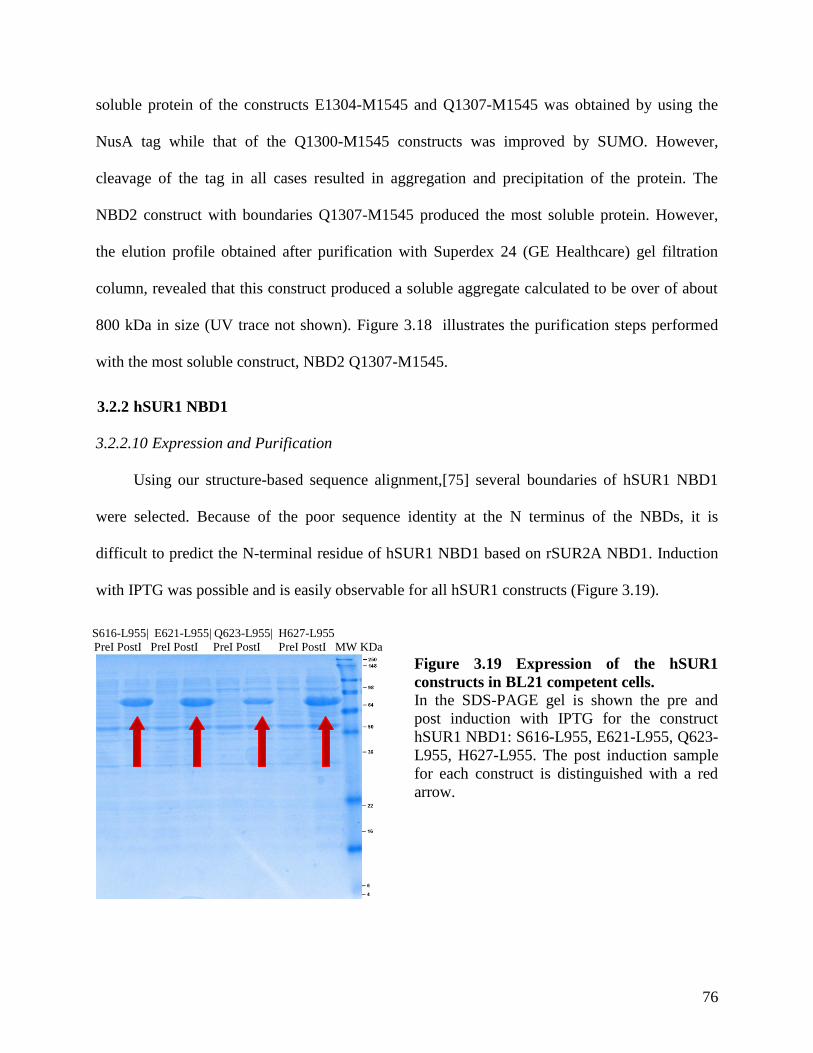
76
soluble protein of the constructs E1304-M1545 and Q1307-M1545 was obtained by using the
NusA tag while that of the Q1300-M1545 constructs was improved by SUMO. However,
cleavage of the tag in all cases resulted in aggregation and precipitation of the protein. The
NBD2 construct with boundaries Q1307-M1545 produced the most soluble protein. However,
the elution profile obtained after purification with Superdex 24 (GE Healthcare) gel filtration
column, revealed that this construct produced a soluble aggregate calculated to be over of about
800 kDa in size (UV trace not shown). Figure 3.18 illustrates the purification steps performed
with the most soluble construct, NBD2 Q1307-M1545.
3.2.2 hSUR1 NBD1
3.2.2.10 Expression and Purification
Using our structure-based sequence alignment,[75] several boundaries of hSUR1 NBD1
were selected. Because of the poor sequence identity at the N terminus of the NBDs, it is
difficult to predict the N-terminal residue of hSUR1 NBD1 based on rSUR2A NBD1. Induction
with IPTG was possible and is easily observable for all hSUR1 constructs (Figure 3.19).
Figure 3.19 Expression of the hSUR1
constructs in BL21 competent cells.
In the SDS-PAGE gel is shown the pre and
post induction with IPTG for the construct
hSUR1 NBD1: S616-L955, E621-L955, Q623-
L955, H627-L955. The post induction sample
for each construct is distinguished with a red
arrow.
S616-L955| E621-L955| Q623-L955| H627-L955
PreI PostI PreI PostI PreI PostI PreI PostI MW KDa
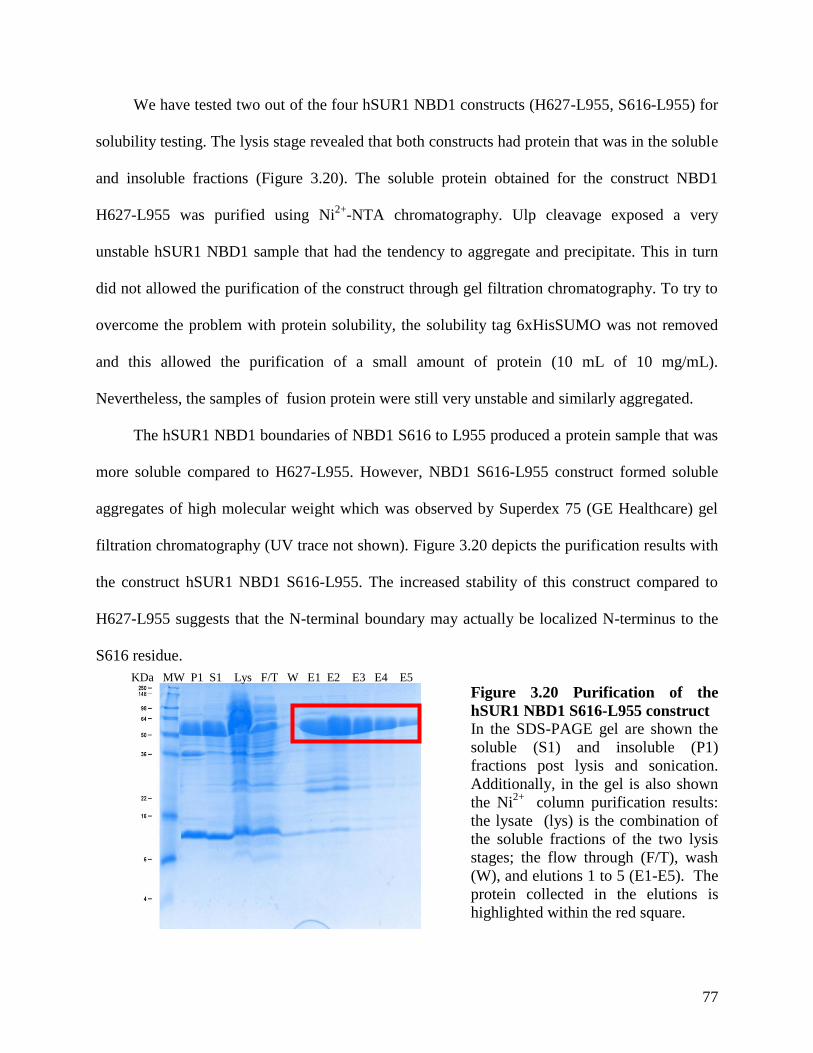
77
We have tested two out of the four hSUR1 NBD1 constructs (H627-L955, S616-L955) for
solubility testing. The lysis stage revealed that both constructs had protein that was in the soluble
and insoluble fractions (Figure 3.20). The soluble protein obtained for the construct NBD1
H627-L955 was purified using Ni2+
-NTA chromatography. Ulp cleavage exposed a very
unstable hSUR1 NBD1 sample that had the tendency to aggregate and precipitate. This in turn
did not allowed the purification of the construct through gel filtration chromatography. To try to
overcome the problem with protein solubility, the solubility tag 6xHisSUMO was not removed
and this allowed the purification of a small amount of protein (10 mL of 10 mg/mL).
Nevertheless, the samples of fusion protein were still very unstable and similarly aggregated.
The hSUR1 NBD1 boundaries of NBD1 S616 to L955 produced a protein sample that was
more soluble compared to H627-L955. However, NBD1 S616-L955 construct formed soluble
aggregates of high molecular weight which was observed by Superdex 75 (GE Healthcare) gel
filtration chromatography (UV trace not shown). Figure 3.20 depicts the purification results with
the construct hSUR1 NBD1 S616-L955. The increased stability of this construct compared to
H627-L955 suggests that the N-terminal boundary may actually be localized N-terminus to the
S616 residue.
Figure 3.20 Purification of the
hSUR1 NBD1 S616-L955 construct
In the SDS-PAGE gel are shown the
soluble (S1) and insoluble (P1)
fractions post lysis and sonication.
Additionally, in the gel is also shown
the Ni2+
column purification results:
the lysate (lys) is the combination of
the soluble fractions of the two lysis
stages; the flow through (F/T), wash
(W), and elutions 1 to 5 (E1-E5). The
protein collected in the elutions is
highlighted within the red square.
KDa MW P1 S1 Lys F/T W E1 E2 E3 E4 E5
78
4 Discussion
4.1 Investigation of the C-terminal region of NBD1
The sequence alignment containing all the ABCC NBD1[75] identified the canonical
rSUR2A NBD1 boundaries to be Ser615 to Asp914. Previous solubility and stability studies with
this canonical construct indicated that the boundaries S615-D914 produced a construct that was
highly unstable due to its likelihood for precipitation and thus, low yields of soluble protein.
Extension of the C-terminal boundary to L933 (i.e. boundaries of S615-L933) produced high
yields of soluble NBD1 (75 mg/mL) indicating that this construct was more stable during the
purification and considerably less prone to precipitation. Thus, residues Q915-L933 were
necessary to stabilize NBD1, despite the fact that these residues are predicted to be
disordered.[75] Furthermore, studies presented by Karger et al, demonstrated that the ED region
which is located C-terminal to L933 and is formed by a consecutive sequence of fifteen aspartate
and glutamate residues (948-EDEDEEEEEEEEDEED-962), is involved in allosteric regulation
of the KATP channels. The findings from this study show that the ED domain is important for
dimerization of the NBDs and allows NBD1 to acquire a favourable post-hydrolytic
conformation which is vital for channel activation. Additionally, KATP channels with defective
ED domains resulted in decreased sensitivity to KATP channel opener drug, pinacidil and also the
KATP channel inhibitory drug glyburide. These findings highlight the essential role of residues C-
terminal to the canonical end of NBD1, which is at D914, for NBD1 stability and functioning of
the KATP channel.
In the present study, we explored the functional and structural consequences of the C-
terminal region of NBD1. For that purpose, we worked on three different proteins that either
contained the D914 residue as the C terminus or extended past the ED region (NBD1 S615-K972
79
and S615-N962). The data obtained from these constructs was compared to S615-L933.([75],
unpublished data, De Araujo, Kanelis) Since previous studies performed in our laboratory
showed that the boundaries S615-D914 were very likely to precipitate and also produced very
low yields[75], we needed to improve the purification protocol for our studies, which was done
by introducing higher amounts of MgATP during the purification. Moreover, the stability of the
protein was also enhanced by controlling several other aspects of the purification, such as
temperature, salt and glycerol concentration. The improvements of the purification protocol
allowed the purification of NBD1 S615-D914 in considerably higher yields (i.e. ~ 50 mg/L of
culture) than what was previously possible.[75] Furthermore, the protein could be concentrated
to 350 μM. The production of high yields of soluble of NBD1 S615-D914 at high concentration
is an essential first step, as it made this construct suitable for NMR, fluorescence and circular
dichroism spectroscopic studies.
4.1.1 Comparison of the S615-D914 and S615-L933 construct of NBD1
To elucidate the effect of adding the C-terminal extension Q915-L933, changes in the
spectra between NBD1 S615-D914 and S615-L9332 were studied. Comparison of the spectra of
S615-D914 NBD1 and S615-K972 NBD1 highlighted several important facts. To begin with, the
spectra illustrated that the C-terminal tail (Q915-L933) is disordered and that removal of this C-
terminal tail did not disrupt the overall fold of the protein. Furthermore, the spectral overlay of
NBD1 S615-D914 and S615-L933 revealed that the C-terminal tail changes some other
resonances in structured regions of the spectrum (i.e. 9 ppm 1H dimension), in terms of chemical
shift and intensity. Because resonances at around this chemical shift correspond to structured
2 Purification of the S615-L933 NBD1 construct and spectral acquisition by NMR was
performed by E. de Araujo
80
regions of the protein, these differences in the spectra suggest that the Q615-L933 tail could be
transiently contacting well-folded regions of NBD1. The function for this putative interaction is
not known yet and further studies are required. However, there is a possibility that this ongoing
contact of the C-terminal region is necessary for regulation of the activity of NBD1, and thus the
entire KATP channel.
4.1.1.1 Similarities and differences upon phosphorylation
Phosphorylation by protein kinases inside the cell has been shown to regulate the KATP
channel activity.[119] There are five phosphorylation sites in the KATP channel, three of which
are located in the SUR protein.[117] One of the phosphorylation sites in the SUR protein is
located within NBD1 at T632.[119] We aimed to determine if the C-terminal Q915-L933
extension influences the action of NBD1, then these residues may also have an effect on
phosphorylation of NBD1. Thus we decided to compare the phosphorylation of the S615-D914
construct to that of the S615-L933 construct.
The time-course phosphorylation reaction of the protein NBD1 S615-D914 was unable to
reach the same final stage of phosphorylation observed with NBD1 S615-L93. One hypothesis
for this observation is that is that the NBD1 protein S615-D914 is not fully phosphorylated
because the Q915-L933 region is necessary as it could be involved in facilitating PKA anchorage
on NBD1.
Comparison of the NMR spectra of phosphorylated and non-phosphorylated NBD1 S615-
D914 at 20 and 25 oC revealed several large scale differences. Higher number of resonances
were observed at lower temperatures with phosphorylated NBD1 S615-D914 than with non-
phosphorylated NBD1 S615-D914. Additionally, there was less broadening and the resonances
overall were more pronounced in the phosphorylated NBD1 S615-D914 compared to the non-
81
phosphorylated NBD1 S615-D914. Because broadening in NMR is a consequence of μs - ms
timescale dynamics, these temperature-dependent changes in the NMR spectra of the
phosphorylated versus the non-phosphorylated samples suggest that phosphorylation changes the
protein dynamics of the NBD1 construct. Similar observations were noticed with NBD1 S615-
L933 (De Araujo and Kanelis, unpublished data).
The dynamics of the NBD1 protein are important for the KATP channel because the
dynamic conformational changes enable NBD1 to change upon ATP binding and hydrolysis as
well as allow for different interactions of NBD1 with other regions of the channel.[75] It was
hypothesized by Araujo et al, that μs - ms timescale dynamics in the non-phosphorylated sample
are partly due to interactions of the β-sheet subdomain insert with the core of the protein, just as
it occurs with the RI region and NBD1 in CFTR.[75, 136] Because the T632 phosphorylation
site is in the β-sheet subdomain, it is possible that phosphorylation of T632 disrupts these
interactions and thus decreases dynamics, which is evidenced by less spectral broadening.
Several similarities and differences are observed when the spectrum of phosphorylated
NBD1 construct S615-L933 is compared with the phosphorylated NBD1 S615-D914. Some
changes observed upon phosphorylation of the S615-L933 construct3 are observed also in the
NBD1 construct S615-D914. However, some resonance changes are unique to phosphorylated
NBD1 S615-D914. These resonances are observed throughout the spectra and might also be
present in the S615-L933 construct; however, we hypothesize they are masked by the presence
of the Q915-L933 C-terminal tail which transiently interacts with the core of NBD1.
3 E. de Araujo, submitted
82
4.1.1.2 Effect of the Q915-L933 C-terminal tail on the thermal stability of NBD1
Thermal stability of the construct S615-D914 in comparison with that of NBD1 S615-L933
reveals that the NBD1 S615-D914 is more stable than that of the S615-L933 construct, with
melting points of 48 and 42 oC, respectively.
4 This demonstrates that the disordered region made
up of residues Q915 to L933 is responsible for the decreased melting point observed. Notably,
the thermal stability correlates with the NMR results which demonstrate that this C-terminal
region is disordered. Nevertheless, even though the Q915-L933 extra C-terminal tail does not
contribute to thermal stability of the canonical NBD1 construct, it does stabilizes of the NBD1
construct by other means, such as enhancing solubility and preventing aggregation of NBD1.[75]
This stability provided by the C-terminal tail is greatly pronounced when in the apo state. The
sample tended to precipitate in the absence of ATP to such an extent that the protein would
aggregate within a few minutes after of obtaining the sample out of the FPLC at concentrations
higher than ~10 μM.
4.1.1.3 Quenching experiments with S615-D914 and S615-L933 constructs
The fluorescence quenching experiments with increasing concentrations of acrylamide and
I- in the presence and absence of MgATP revealed that the NBD1 S615-D914 undergoes
conformational changes upon MgATP binding throughout the protein resulting in the exposure
of Trp residues to the quencher. Notably, the observed Ksv values are higher when NBD1 S615-
D914 was quenched in the presence of MgATP than in the absence of it. According to the
structural model provided elsewhere,[75] two of the Trp are buried in a non-polar environment,
while the other four are partially uncovered near the surface but surrounded by differently
charged amino acids. The low Ksv values observed for I- could be a result of the location of some
of these Trp residues in the core or the surrounding negatively charged amino acids that repel the
4 The melting point for the S615-L933 was obtained by E. de Araujo
83
I- and prevent its quenching ability. Instead, acrylamide can access the hydrophobic surfaces in
the protein with greater ease. In addition, acrylamide can access the core of the protein more
easily than I- due to its hydrophobicity, and therefore it is likely that the conformational changes
that expose more Trp residues occur inside the core of the protein rather than near the surface.
Comparing these findings to the results on the NBD1 S615-L933 demonstrate that the
NBD1 construct S615-D914 had greater exposure of the Trp residues to quenchers in both the
MgATP and apo state. This difference is more pronounced with the quencher acrylamide. This
could be a consequence of shielding effect that the C-terminal tail provides to some of Trp
residues. Similarly to our result from NMR, this also imply a transient contact between the C-
terminal tail and the core of the protein.
4.1.2 rSUR2A NBD1 S615 K972 and rSUR2A NBD1 S615-N962
The construct S615-K972 contributed partially to determining the function of the ED
domain (948-EDEDEEEEEEEEDEED-962). This protein possesses less sample stability than the
NBD1 constructs from S615-D914 and S615-L933. Therefore, this limited our investigation with
NMR as this construct precipitates and aggregates independently of concentration at
temperatures higher that 25 oC. Nevertheless, the NMR temperature series obtained with this
construct illustrated that resonances in the spectra were very broad. The broadening observed is
possibly due to the extension of the C-terminal extension Q915-K972 which make the construct
more active and more prompt to ms-μs dynamics. Notably, this was observed at all temperatures.
The S615-K972 construct has similar melting point to that of NBD1 S615-L933, ~42 oC. Thus, it
is possible that the C-terminal extensions Q915-L933 and Q915-K972 cause the NBD1 construct
to denature faster at lower temperature. From our spectra, we know that this C-terminal tail is
disordered, however, we also recognized that this tail might be interacting with the NBD1
84
structure regions. We think that the addition of the C-terminal extension Q915-L933 and Q915-
K972 might vary the stability given by binding of MgATP. Our TNP-ATP binding experiments
showed that the construct S615-K972 binds as tightly to the TNP-ATP analogue as the NBD1
construct S615-L933, which would explain their similar denaturation pattern in the presence of
MgATP.[142] We tried performing the TNP-ATP binding experiments with NBD1 S615-D914.
However, because the instability of this construct in the absence of MgATP, we were unable to
obtain a binding affinity value for comparing with the other constructs.
We initiated studies with the construct rSUR2A NBD1 S615-N962. This construct was
selected as an alternative for analyzing the effects of the ED domain in NBD1 as the construct
S615-K972 lacked sample stability. According to recent structure sequence alignments5, the
residues M963 to K972 may be part of the amphipathic α-helix that interacts with the membrane,
thus increasing the insolubility and instability of the sample of NBD1 S615-K972. The
purification of the NBD1 construct S615-N962 indicated that this construct was less prone to
precipitation. However, the purification protocol still needs to be improved in order to obtain
higher yields and pure protein.
4.2 Determination of soluble hSUR1 NBD1 and rSUR2A NBD2 constructs
Up to date, no soluble constructs of hSUR1 NBD1 and rSUR2A NBD2 have been
obtained. The amino acid boundaries selected for these constructs did not yield a protein that
could be produce in soluble form at high concentrations.
In the case of rSUR2A NBD2, full boundary screening at the N-terminus should be
performed in order to identify stable constructs. In the case of hSUR1 NBD1, boundaries that
5 Recent structure sequence alignment performed by Voula Kanelis.
85
explore residues N-terminus to S616 should be used as our results indicate that the S616-L955
construct was less prompt to aggregation than the construct H627-L955.
86
5 Conclusions and future directions
In this work, we have investigated the C-terminal region of NBD1 through the use of three
different constructs that vary in their C-terminal boundary. We compared the (canonical) NBD1
that possesses the boundaries S615-D914, to the NBD1 S615-L933, and a NBD1 that contains
the ED domain and has the boundaries S615-K972. Our NMR data suggests that this extra C-
terminal region (Q915-L933) contacts the NBD1 core of the protein on what we believe is a
transient contact involved in regulation of NBD1. Similar NMR experiments with
phosphorylated S615-D914 NBD1 indicated that the C-terminal region (Q915-L933) might be
necessary for the binding of PKA. This in turn also implies a regulatory function of the terminal
tail. Quenching fluorescence experiments demonstrated that the S615-D914 is more easily
quenched by acrylamide and iodide than the construct S615-L933, thus implying that the Q915-
L933 extension allows NBD1 to achieve different conformations, further confirming that
residues Q915-L933 may interact with NBD1 core. Thermal stability experiments performed
with the construct S615-K972 showed that extension of the Q915-L933 domain to residue K972
made the construct thermally equally stable as S615-L933 but less stable than the canonical
S615-D914 construct. This implies that the C-terminal extension is disordered and that it
decreases the melting temperature of the NBD1 construct. NMR experiments performed with the
construct S615-K972 indicated that the C-terminal tail was very dynamic, which made it difficult
to acquire good spectra for comparison with the other constructs.
We initiated studies with the construct S615-N962 to better determine the function of the
ED region by NMR spectroscopy. We believe this construct would be more suitable for NMR
experiments than the construct S615-K972. This in turn would allow us to obtain good spectra
for comparison with the canonical S615-D914 and the construct S615-L933. So far, the results
87
are promising but additional work is needed on the purification procedure so that yields are
improved.
Soluble constructs of hSUR1 NBD1 and rSUR2A NBD2 are important for studying
different diseases causing mutations at the molecular level. SUR1 forms the regulatory SUR
protein in pancreatic KATP channels and mutations of NBD1 in hSUR1 cause diabetes and
hyperinsulinism.[120] To date, no soluble construct of hSUR1 NBD1 or rSUR2A NBD2 have
been determined. Our results with the most soluble boundaries of hSUR1 NBD1 and rSUR2A
NBD2 indicate that these constructs have a high propensity to aggregate. Therefore, future work
would involve the determination of other boundaries that prevent such aggregation, as well as
additional purification techniques that enhance the solubility of the construct.
88
6 Bibliography
1. Ashcroft, F.M. and F.M. Gribble, ATP-sensitive K+ channels and insulin secretion: their
role in health and disease. Diabetologia, 1999. 42(8): p. 903-919.
2. Seino, S., Physiology and pathophysiology of K-ATP channels in the pancreas and
cardiovascular system - A review. Journal of Diabetes and Its Complications, 2003. 17(2):
p. 2-5.
3. Flanagan, S.E., et al., Update of mutations in the genes encoding the pancreatic beta-cell
KATP channel subunits Kir6.2 (KCNJ11) and sulfonylurea receptor 1 (ABCC8) in diabetes
mellitus and hyperinsulinism. Human Mutation, 2009. 30(2): p. 170-180.
4. Bienengraeber, M., et al., ABCC9 mutations identified in human dilated cardiomyopathy
disrupt catalytic KATP channel gating. Nat Genet, 2004. 36(4): p. 382-387.
5. Nichols, C.G., K-ATP channels as molecular sensors of cellular metabolism. Nature, 2006.
440(7083): p. 470-476.
6. Alejandro, A., et al., Molecular biology of KATP channels and implications for health and
disease. IUBMB Life, 2009. 61(10): p. 971-978.
7. Noma, A., ATP-REGULATED K+ CHANNELS IN CARDIAC-MUSCLE. Nature, 1983.
305(5930): p. 147-148.
8. Ashford, M.L.J., et al., Adenosine-5′-triphosphate-sensitive ion channels in neonatal rat
cultured central neurones. Pflügers Archiv, 1988. 412(3): p. 297-304.
9. Spruce, A.E., N.B. Standen, and P.R. Stanfield, Voltage-dependent ATP-sensitive
potassium channels of skeletal muscle membrane. Nature, 1985. 316(6030): p. 736-738.
10. Standen, N., et al., Hyperpolarizing vasodilators activate ATP-sensitive K+ channels in
arterial smooth muscle. Science, 1989. 245(4914): p. 177-180.
89
11. Hunter, M. and G. Giebisch, Calcium-activated K-channels ofAmphiuma early distal
tubule: inhibition by ATP. Pflügers Archiv, 1988. 412(3): p. 331-333.
12. Seino, S. and T. Miki, Physiological and pathophysiological roles of ATP-sensitive K+
channels. Progress in Biophysics & Molecular Biology, 2003. 81(2): p. 133-176.
13. Clement, J.P., et al., Association and stoichiometry of K-ATP channel subunits. Neuron,
1997. 18(5): p. 827-838.
14. Mikhailov, M.V., et al., 3-D structural and functional characterization of the purified
KATP channel complex Kir6.2-SUR1. EMBO J, 2005. 24(23): p. 4166-4175.
15. Shi, N.-Q., B. Ye, and J.C. Makielski, Function and distribution of the SUR isoforms and
splice variants. Journal of Molecular and Cellular Cardiology, 2005. 39(1): p. 51-60.
16. Teramoto, N., Physiological roles of ATP-sensitive K+ channels in smooth muscle. Journal
of Physiology-London, 2006. 572(3): p. 617-624.
17. Inagaki, N., et al., Reconstitution of IKATP: An Inward Rectifier Subunit Plus the
Sulfonylurea Receptor. Science, 1995. 270(5239): p. 1166-1170.
18. Inagaki, N., et al., A Family of Sulfonylurea Receptors Determines the Pharmacological
Properties of ATP-Sensitive K+ Channels. Neuron, 1996. 16(5): p. 1011-1017.
19. Aguilar-Bryan, L., et al., Cloning of the beta cell high-affinity sulfonylurea receptor: a
regulator of insulin secretion. Science, 1995. 268(5209): p. 423-426.
20. Inagaki, N., J. Inazawa, and S. Seino, cDNA Sequence, Gene Structure, and Chromosomal
Localization of the Human ATP-Sensitive Potassium Channel, uKATP-1, Gene (KCNJ8).
Genomics, 1995. 30(1): p. 102-104.
21. Inagaki, N., T. Gonoi, and S. Seino, Subunit stoichiometry of the pancreatic β-cell ATP-
sensitive K+ channel. FEBS Letters, 1997. 409(2): p. 232-236.
90
22. Du, X., et al., Characteristic Interactions with Phosphatidylinositol 4,5-Bisphosphate
Determine Regulation of Kir Channels by Diverse Modulators. Journal of Biological
Chemistry, 2004. 279(36): p. 37271-37281.
23. Flagg, T.P., et al., Muscle K-ATP Channels: Recent Insights to Energy Sensing and
Myoprotection. Physiological Reviews, 2010. 90(3): p. 799-829.
24. Isomoto, S., et al., A Novel Sulfonylurea Receptor Forms with BIR (Kir6.2) a Smooth
Muscle Type ATP-sensitive K+ Channel. Journal of Biological Chemistry, 1996. 271(40):
p. 24321-24324.
25. Repunte, V.P., et al., Extracellular links in Kir subunits control the unitary conductance of
SUR/Kir6.0 ion channels. EMBO J, 1999. 18(12): p. 3317-3324.
26. Nishida, M. and R. MacKinnon, Structural Basis of Inward Rectification: Cytoplasmic
Pore of the G Protein-Gated Inward Rectifier GIRK1 at 1.8 Å Resolution. Cell, 2002.
111(7): p. 957-965.
27. Kuo, A., et al., Crystal Structure of the Potassium Channel KirBac1.1 in the Closed State.
Science, 2003. 300(5627): p. 1922-1926.
28. Antcliff, J.F., et al., Functional analysis of a structural model of the ATP-binding site of
the KATP channel Kir6.2 subunit. EMBO J, 2005. 24(2): p. 229-239.
29. Enkvetchakul, D. and C.G. Nichols, Gating Mechanism of KATP Channels: Function Fits
Form. The Journal of General Physiology, 2003. 122(5): p. 471-480.
30. Haider, S., et al., Conformational Dynamics of the Ligand-Binding Domain of Inward
Rectifier K Channels as Revealed by Molecular Dynamics Simulations: Toward an
Understanding of Kir Channel Gating. Biophysical Journal, 2005. 88(5): p. 3310-3320.
91
31. Proks, P., et al., Involvement of the N-terminus of Kir6.2 in the inhibition of the KATP
channel by ATP. The Journal of Physiology, 1999. 514(1): p. 19-25.
32. Li, L., J. Wang, and P. Drain, The I182 Region of Kir6.2 Is Closely Associated with Ligand
Binding in KATP Channel Inhibition by ATP. Biophysical Journal, 2000. 79(2): p. 841-
852.
33. Shyng, S.-L., et al., Structural Determinants of Pip2 Regulation of Inward Rectifier KATP
Channels. The Journal of General Physiology, 2000. 116(5): p. 599-608.
34. Kuo, A., et al., Two Different Conformational States of the KirBac3.1 Potassium Channel
Revealed by Electron Crystallography. Structure, 2005. 13(10): p. 1463-1472.
35. Flagg, T.P. and C.G. Nichols, Sarcolemmal KATP channels: what do we really know?
Journal of Molecular and Cellular Cardiology, 2005. 39(1): p. 61-70.
36. Baukrowitz, T., et al., PIP2 and PIP as Determinants for ATP Inhibition of KATP
Channels. Science, 1998. 282(5391): p. 1141-1144.
37. MacGregor, G.G., et al., Nucleotides and phospholipids compete for binding to the C
terminus of KATP channels. Proceedings of the National Academy of Sciences, 2002.
99(5): p. 2726-2731.
38. Higgins, C.F. and K.J. Linton, The ATP switch model for ABC transporters. Nat Struct Mol
Biol, 2004. 11(10): p. 918-926.
39. Higgins, C.F., ABC Transporters: From Microorganisms to Man. Annual Review of Cell
Biology, 1992. 8(1): p. 67-113.
40. Linton, K.J. and C.F. Higgins, The Escherichia coli ATP-binding cassette (ABC) proteins.
Molecular Microbiology, 1998. 28(1): p. 5-13.
92
41. Davidson, A.L., et al., Structure, Function, and Evolution of Bacterial ATP-Binding
Cassette Systems. Microbiology and Molecular Biology Reviews, 2008. 72(2): p. 317-364.
42. Linton, K.J., Structure and Function of ABC Transporters. Physiology, 2007. 22(2): p.
122-130.
43. Dean, M. and R. Allikmets, EVOLUTION OF ATP-BINDING CASSETTE TRANSPORTER
GENES. Current Opinion in Genetics & Development, 1995. 5(6): p. 779-785.
44. Vasiliou, V., K. Vasiliou, and D.W. Nebert,, Human ATP-binding cassette (ABC)
transporter family. Human Genomics, 2009. 3(3): p. 281-290.
45. Dean, M., A. Rzhetsky, and R. Allikmets, The Human ATP-Binding Cassette (ABC)
Transporter Superfamily. Genome Research, 2001. 11(7): p. 1156-1166.
46. Muller, M. 48 Human ATP-binding cassette transporters. 2001; Available from:
http://www.nutrigene.4t.com/humanabc.htm.
47. Borst, P. and R.O. Elferink, MAMMALIAN ABC TRANSPORTERS IN HEALTH AND
DISEASE. Annual Review of Biochemistry, 2002. 71(1): p. 537-592.
48. Dawson, R.J.P. and K.P. Locher, Structure of a bacterial multidrug ABC transporter.
Nature, 2006. 443(7108): p. 180-185.
49. George, A.M. and P.M. Jones, Perspectives on the structure–function of ABC transporters:
The Switch and Constant Contact Models. Progress in Biophysics and Molecular Biology,
2012. 109(3): p. 95-107.
50. Gottesman, M.M. and V. Ling, The molecular basis of multidrug resistance in cancer: The
early years of P-glycoprotein research. FEBS Letters, 2006. 580(4): p. 998-1009.
93
51. Riordan, J.R., et al., IDENTIFICATION OF THE CYSTIC-FIBROSIS GENE - CLONING
AND CHARACTERIZATION OF COMPLEMENTARY-DNA. Science, 1989. 245(4922): p.
1066-1072.
52. Collins, F.S., CYSTIC-FIBROSIS - MOLECULAR-BIOLOGY AND THERAPEUTIC
IMPLICATIONS. Science, 1992. 256(5058): p. 774-779.
53. Aller, S.G., et al., Structure of P-Glycoprotein Reveals a Molecular Basis for Poly-Specific
Drug Binding. Science, 2009. 323(5922): p. 1718-1722.
54. Gerber, S., et al., Structural Basis of Trans-Inhibition in a Molybdate/Tungstate ABC
Transporter. Science, 2008. 321(5886): p. 246-250.
55. Hollenstein, K., D.C. Frei, and K.P. Locher, Structure of an ABC transporter in complex
with its binding protein. Nature, 2007. 446(7132): p. 213-216.
56. Hvorup, R.N., et al., Asymmetry in the Structure of the ABC Transporter-Binding Protein
Complex BtuCD-BtuF. Science, 2007. 317(5843): p. 1387-1390.
57. Kadaba, N.S., et al., The High-Affinity E. coli Methionine ABC Transporter: Structure and
Allosteric Regulation. Science, 2008. 321(5886): p. 250-253.
58. Khare, D., et al., Alternating Access in Maltose Transporter Mediated by Rigid-Body
Rotations. Molecular Cell, 2009. 33(4): p. 528-536.
59. Locher, K.P., A.T. Lee, and D.C. Rees, The E. coli BtuCD Structure: A Framework for
ABC Transporter Architecture and Mechanism. Science, 2002. 296(5570): p. 1091-1098.
60. Oldham, M.L. and J. Chen, Crystal Structure of the Maltose Transporter in a
Pretranslocation Intermediate State. Science, 2011. 332(6034): p. 1202-1205.
61. Oldham, M.L., et al., Crystal structure of a catalytic intermediate of the maltose
transporter. Nature, 2007. 450(7169): p. 515-521.
94
62. Pinkett, H.W., et al., An Inward-Facing Conformation of a Putative Metal-Chelate-Type
ABC Transporter. Science, 2007. 315(5810): p. 373-377.
63. Ward, A., et al., Flexibility in the ABC transporter MsbA: Alternating access with a twist.
Proceedings of the National Academy of Sciences, 2007. 104(48): p. 19005-19010.
64. Sarkadi, B., et al., Human Multidrug Resistance ABCB and ABCG Transporters:
Participation in a Chemoimmunity Defense System. Physiological Reviews, 2006. 86(4): p.
1179-1236.
65. Smith, P.C., et al., ATP Binding to the Motor Domain from an ABC Transporter Drives
Formation of a Nucleotide Sandwich Dimer. Molecular Cell, 2002. 10(1): p. 139-149.
66. Story, R.M. and T.A. Steitz, Structure of the recA protein-ADP complex. Nature, 1992.
355(6358): p. 374-376.
67. Abrahams, J.P., et al., Structure at 2.8 A resolution of F1-ATPase from bovine heart
mitochondria. Nature, 1994. 370(6491): p. 621-628.
68. Walker, J.H., et al., Presynaptic plasma membranes and synaptic vesicles of cholinergic
nerve endings demonstrated by means of specific antisera. Cell and Tissue Research, 1982.
223(1): p. 101-116.
69. Hopfner, K.-P., et al., Structural Biochemistry and Interaction Architecture of the DNA
Double-Strand Break Repair Mre11 Nuclease and Rad50-ATPase. Cell, 2001. 105(4): p.
473-485.
70. Hung, L.W., et al., Crystal structure of the ATP-binding subunit of an ABC transporter.
Nature, 1998. 396(6712): p. 703-707.
95
71. Jones, P.M. and A.M. George, Role of the D-Loops in Allosteric Control of ATP Hydrolysis
in an ABC Transporter. The Journal of Physical Chemistry A, 2012. 116(11): p. 3004-
3013.
72. Zaitseva, J., et al., H662 is the linchpin of ATP hydrolysis in the nucleotide-binding domain
of the ABC transporter HlyB. EMBO J, 2005. 24(11): p. 1901-1910.
73. Ames, G.F., et al., Traffic ATPases: a superfamily of transport proteins operating from
Escherichia coli to humans. Advances in enzymology and related areas of molecular
biology, 1992. 65: p. 1-47.
74. Babenko, A.P. and J. Bryan, SUR Domains That Associate with and Gate KATP Pores
Define a Novel Gatekeeper. Journal of Biological Chemistry, 2003. 278(43): p. 41577-
41580.
75. de Araujo, E.D., et al., The First Nucleotide Binding Domain of the Sulfonylurea Receptor
2A Contains Regulatory Elements and Is Folded and Functions as an Independent Module.
Biochemistry, 2011. 50(31): p. 6655-6666.
76. Zaitseva, J., et al., A structural analysis of asymmetry required for catalytic activity of an
ABC-ATPase domain dimer. EMBO J, 2006. 25(14): p. 3432-3443.
77. Campbell, J.D., M.S.P. Sansom, and F.M. Ashcroft, Potassium channel regulation -
Structural insights into the function of the nucleotide-binding domains of the human
sulphonylurea receptor. Embo Reports, 2003. 4(11): p. 1038-1042.
78. Obmolova, G., et al., Crystal structures of mismatch repair protein MutS and its complex
with a substrate DNA. Nature, 2000. 407(6805): p. 703-710.
96
79. Davidson, A.L., S.S. Laghaeian, and D.E. Mannering, The Maltose Transport System of
Escherichia coli Displays Positive Cooperativity in ATP Hydrolysis. Journal of Biological
Chemistry, 1996. 271(9): p. 4858-4863.
80. Liu, R. and F.J. Sharom, Fluorescence Studies on the Nucleotide Binding Domains of the
P-Glycoprotein Multidrug Transporter†. Biochemistry, 1997. 36(10): p. 2836-2843.
81. Senior, A.E. and S. Bhagat, P-Glycoprotein Shows Strong Catalytic Cooperativity between
the Two Nucleotide Sites†. Biochemistry, 1998. 37(3): p. 831-836.
82. Sauna, Z.E., et al., Catalytic Cycle of ATP Hydrolysis by P-Glycoprotein: Evidence for
Formation of the E·S Reaction Intermediate with ATP-γ-S, a Nonhydrolyzable Analogue of
ATP†. Biochemistry, 2007. 46(48): p. 13787-13799.
83. Russell, P.L. and F.J. Sharom, Conformational and functional characterization of trapped
complexes of the P-glycoprotein multidrug transporter. Biochem J, 2006. 399(2): p. 315-
323.
84. Petronilli, V. and G.F. Ames, Binding protein-independent histidine permease mutants.
Uncoupling of ATP hydrolysis from transmembrane signaling. Journal of Biological
Chemistry, 1991. 266(25): p. 16293-16296.
85. Davidson, A.L., H.A. Shuman, and H. Nikaido, Mechanism of maltose transport in
Escherichia coli: transmembrane signaling by periplasmic binding proteins. Proceedings
of the National Academy of Sciences, 1992. 89(6): p. 2360-2364.
86. Kreimer, D.I., K.P. Chai, and G. Ferro-Luzzi Ames, Nonequivalence of the Nucleotide-
Binding Subunits of an ABC Transporter, the Histidine Permease, and Conformational
Changes in the Membrane Complex†. Biochemistry, 2000. 39(46): p. 14183-14195.
97
87. Urbatsch, I.L., et al., P-glycoprotein Is Stably Inhibited by Vanadate-induced Trapping of
Nucleotide at a Single Catalytic Site. Journal of Biological Chemistry, 1995. 270(33): p.
19383-19390.
88. Rosenberg, M.F., et al., Repacking of the transmembrane domains of P-glycoprotein
during the transport ATPase cycle. EMBO J, 2001. 20(20): p. 5615-5625.
89. Jones, P.M. and A.M. George, Opening of the ADP-bound active site in the ABC
transporter ATPase dimer: Evidence for a constant contact, alternating sites model for the
catalytic cycle. Proteins-Structure Function and Bioinformatics, 2009. 75(2): p. 387-396.
90. Higgins, C.F., ABC transporters: physiology, structure and mechanism – an overview.
Research in Microbiology, 2001. 152(3–4): p. 205-210.
91. Babenko, A.P., G. Gonzalez, and J. Bryan, Two Regions of Sulfonylurea Receptor Specify
the Spontaneous Bursting and ATP Inhibition of KATP Channel Isoforms. Journal of
Biological Chemistry, 1999. 274(17): p. 11587-11592.
92. Mason, D.L. and S. Michaelis, Requirement of the N-Terminal Extension for Vacuolar
Trafficking and Transport Activity of Yeast Ycf1p, an ATP-binding Cassette Transporter.
Molecular Biology of the Cell, 2002. 13(12): p. 4443-4455.
93. Bryan, J., et al., ABCC8 and ABCC9: ABC transporters that regulate
K<sup>+</sup> channels. Pflügers Archiv European Journal of Physiology,
2007. 453(5): p. 703-718.
94. Aittoniemi, J., et al., SUR1: a unique ATP-binding cassette protein that functions as an ion
channel regulator. Philosophical Transactions of the Royal Society B: Biological Sciences,
2009. 364(1514): p. 257-267.
98
95. Ramaen, O., et al., Structure of the Human Multidrug Resistance Protein 1 Nucleotide
Binding Domain 1 bound to Mg2+/ATP Reveals a Non-productive Catalytic Site. Journal
of Molecular Biology, 2006. 359(4): p. 940-949.
96. de Wet, H., et al., Studies of the ATPase activity of the ABC protein SUR1. Febs Journal,
2007. 274(14): p. 3532-3544.
97. Reimann, F., F.M. Gribble, and F.M. Ashcroft, Differential Response of KATP Channels
Containing SUR2A or SUR2B Subunits to Nucleotides and Pinacidil. Molecular
Pharmacology, 2000. 58(6): p. 1318-1325.
98. Matsushita, K., et al., Intramolecular interaction of SUR2 subtypes for intracellular ADP-
induced differential control of K-ATP channels. Circulation Research, 2002. 90(5): p. 554-
561.
99. Aguilar-Bryan, L., et al., Toward understanding the assembly and structure of K(ATP)
channels. Physiological Reviews, 1998. 78(1): p. 227-245.
100. Chutkow, W.A., et al., Alternative splicing of sur2 exon 17 regulates nucleotide sensitivity
of the ATP-sensitive potassium channel. Journal of Biological Chemistry, 1999. 274(19): p.
13656-13665.
101. Chutkow, W.A., et al., Cloning, tissue expression, and chromosomal localization of SUR2,
the putative drug-binding subunit of cardiac, skeletal muscle, and vascular K(ATP)
channels. Diabetes, 1996. 45(10): p. 1439-1445.
102. Gros, L., et al., Characterization of two novel forms of the rat sulphonylurea receptor
SUR1A2 and SUR1BΔ31. British Journal of Pharmacology, 2002. 137(1): p. 98-106.
103. Sakura, H., et al., Altered functional properties of KATP channel conferred by a novel
splice variant of SUR1. The Journal of Physiology, 1999. 521(2): p. 337-350.
99
104. Burke, M.A., R.K. Mutharasan, and H. Ardehali, The Sulfonylurea Receptor, an Atypical
ATP-Binding Cassette Protein, and Its Regulation of the KATP Channel. Circulation
Research, 2008. 102(2): p. 164-176.
105. Matsuo, M., et al., Different Binding Properties and Affinities for ATP and ADP among
Sulfonylurea Receptor Subtypes, SUR1, SUR2A, and SUR2B. Journal of Biological
Chemistry, 2000. 275(37): p. 28757-28763.
106. Zerangue, N., et al., A New ER Trafficking Signal Regulates the Subunit Stoichiometry of
Plasma Membrane KATP Channels. Neuron, 1999. 22(3): p. 537-548.
107. Tucker, S.J., et al., Truncation of Kir6.2 produces ATP-sensitive K+ channels in the
absence of the sulphonylurea receptor. Nature, 1997. 387(6629): p. 179-183.
108. Proks, P. and F.M. Ashcroft, Phentolamine block of KATP channels is mediated by Kir6.2.
Proceedings of the National Academy of Sciences, 1997. 94(21): p. 11716-11720.
109. Schwappach, B., et al., Molecular Basis for KATP Assembly: Transmembrane Interactions
Mediate Association of a K+ Channel with an ABC Transporter. Neuron, 2000. 26(1): p.
155-167.
110. Proks, P., et al., Mechanism of action of a sulphonylurea receptor SUR1 mutation (F132L)
that causes DEND syndrome. Human Molecular Genetics, 2007. 16(16): p. 2011-2019.
111. Gribble, F.M., S.J. Tucker, and F.M. Ashcroft, The essential role of the Walker A motifs of
SUR1 in K-ATP channel activation by Mg-ADP and diazoxide. EMBO J, 1997. 16(6): p.
1145-1152.
112. Zingman, L.V., et al., Signaling in Channel/Enzyme Multimers: ATPase Transitions in
SUR Module Gate ATP-Sensitive K+ Conductance. Neuron, 2001. 31(2): p. 233-245.
100
113. Matsuo, M., et al., Mutations in the linker domain of NBD2 of SUR inhibit transduction but
not nucleotide binding. EMBO J, 2002. 21(16): p. 4250-4258.
114. Karger, A.B., et al., Role for SUR2A ED domain in allosteric coupling within the K-ATP
channel complex. Journal of General Physiology, 2008. 131(3): p. 185-196.
115. Levitan, I.B., Modulation of ion channels by protein phosphorylation - How the brain
works. Ion Channel Regulation, 1999. 33: p. 3-22.
116. Jonas, E.A. and L.K. Kaczmarek, Regulation of potassium channels by protein kinases.
Current Opinion in Neurobiology, 1996. 6(3): p. 318-323.
117. Beguin, P., et al., PKA-mediated phosphorylation of the human K-ATP channel: separate
roles of Kir6.2 and SUR1 subunit phosphorylation. Embo Journal, 1999. 18(17): p. 4722-
4732.
118. Shi, Y., et al., cAMP-dependent protein kinase phosphorylation produces interdomain
movement in SUR2B leading to activation of the vascular K-ATP channel. Journal of
Biological Chemistry, 2008. 283(12): p. 7523-7530.
119. Quinn, K.V., J.P. Giblin, and A. Tinker, Multisite phosphorylation mechanism for protein
kinase A activation of the smooth muscle ATP-sensitive K(+) channel. Circulation
Research, 2004. 94(10): p. 1359-1366.
120. Ashcroft, F.M., ATP-sensitive potassium channelopathies: focus on insulin secretion.
Journal of Clinical Investigation, 2005. 115(8): p. 2047-2058.
121. Gloyn, A.L., J. Siddiqui, and S. Ellard, Mutations in the genes encoding the pancreatic
beta-cell K-ATP channel subunits Kir6.2 (KCNJ11) and SUR1 (ABCC8) in diabetes
mellitus and hyperinsullinlism. Human Mutation, 2006. 27(3): p. 220-231.
101
122. Terzic, A., et al., Advances in Cardiac ATP-Sensitive K+ Channelopathies From
Molecules to Populations. Circulation: Arrhythmia and Electrophysiology, 2011. 4(4): p.
577-585.
123. Suzuki, M., et al., Functional roles of cardiac and vascular ATP-sensitive potassium
channels clarified by Kir6.2-knockout mice. Circulation Research, 2001. 88(6): p. 570-577.
124. Ishima, R. and D.A. Torchia, Protein dynamics from NMR. Nat Struct Mol Biol, 2000.
7(9): p. 740-743.
125. Gardner, K.H. and L.E. Kay, The use of H-2, C-13, N-15 multidimensional NMR to study
the structure and dynamics of proteins. Annual Review of Biophysics and Biomolecular
Structure, 1998. 27: p. 357-406.
126. Serdyuk, I.N., N.R. Zaccai, and G. Zaccai, Methods in molecular biophysics : structure,
dynamics, function. 2007, Cambridge ; New York: Cambridge University Press. xvi, 1120
p.
127. Teng, Q., Basic Principles of NMR, in Structural Biology. 2013, Springer US. p. 1-63.
128. Keeler, J., Understanding NMR spectroscopy. 2nd ed. 2010, Chichester, U.K.: John Wiley
and Sons. xiii, 511 p.
129. Kay, L.E., NMR studies of protein structure and dynamics. Journal of Magnetic
Resonance, 2005. 173(2): p. 193-207.
130. Lakowicz, J.R., Principles of fluorescence spectroscopy. 3rd ed. 2006, New York:
Springer. xxvi, 954 p.
131. Correa, D. and C. Ramos, The use of circular dichroism spectroscopy to study protein
folding, form and function. African Journal of Biochemistry Research, 2009. 3(5): p. 164-
173.
102
132. Kelly, S.M., T.J. Jess, and N.C. Price, How to study proteins by circular dichroism.
Biochimica et Biophysica Acta (BBA) - Proteins and Proteomics, 2005. 1751(2): p. 119-
139.
133. Jones, P.M. and A.M. George, The ABC transporter structure and mechanism:
perspectives on recent research. Cellular and Molecular Life Sciences, 2004. 61(6): p. 682-
699.
134. Lewis, H.A., et al., Structure of nucleotide-binding domain 1 of the cystic fibrosis
transmembrane conductance regulator. Embo Journal, 2004. 23(2): p. 282-293.
135. Gaudet, R. and D.C. Wiley, Structure of the ABC ATPase domain of human TAP1, the
transporter associated with antigen processing. Embo Journal, 2001. 20(17): p. 4964-
4972.
136. Kanelis, V., et al., NMR evidence for differential phosphorylation-dependent interactions
in WT and Delta F508 CFTR. Embo Journal, 2010. 29(1): p. 263-277.
137. Delaglio, F., et al., NMRPipe: A multidimensional spectral processing system based on
UNIX pipes. Journal of Biomolecular NMR, 1995. 6(3): p. 277-293.
138. Johnson, B. and R. Blevins, NMR View: A computer program for the visualization and
analysis of NMR data. Journal of Biomolecular NMR, 1994. 4(5): p. 603-614.
139. Mergny, J.L. and L. Lacroix, Analysis of thermal melting curves. Oligonucleotides, 2003.
13(6): p. 515-537.
140. Lehrer, S.S., Solute Perturbation of Protein Fluorescence - Quenching of Tryptophyl
Fluorescence of Model Compounds and of Lysozyme by Iodide Ion. Biochemistry, 1971.
10(17): p. 3254-&.
103
141. Schlamadinger, D.E., D.I. Kats, and J.E. Kim, Quenching of Tryptophan Fluorescence in
Unfolded Cytochrome c: A Biophysics, Experiment for Physical Chemistry Students.
Journal of Chemical Education, 2010. 87(9): p. 961-964.
142. López-Alonso, J.P., E.D. de Araujo, and V. Kanelis, NMR and Fluorescence Studies of
Drug Binding to the First Nucleotide Binding Domain of SUR2A. Biochemistry, 2012.
51(45): p. 9211-9222.
143. Sorensen, H., et al., Soluble expression of aggregating proteins by covalent coupling to the
ribosome. Biochem Biophys Res Commun, 2004. 319: p. 715 - 719.
144. Guarnieri, M.T., B.S. Blagg, and R. Zhao, A high-throughput TNP-ATP displacement
assay for screening inhibitors of ATP-binding in bacterial histidine kinases. Assay Drug
Dev Technol, 2011. 9(2): p. 174-83.
145. Rabeh, W.M., et al., Correction of both NBD1 energetics and domain interface is required
to restore DeltaF508 CFTR folding and function. Cell, 2012. 148(1-2): p. 150-63.
146. Malakhov, M.P., et al., SUMO fusions and SUMO-specific protease for efficient expression
and purification of proteins. J Struct Funct Genomics, 2004. 5(1-2): p. 75-86.
147. Kim, S. and S.B. Lee, Soluble expression of archaeal proteins in Escherichia coli by using
fusion-partners. Protein Expression and Purification, 2008. 62(1): p. 116-119.