Embed Size (px)
Citation preview
© The Author 2013. Published by Oxford University Press. All rights reserved. For Permissions, please email: [email protected]
Tree Physiology 33, 793–806doi:10.1093/treephys/tpt047
Biochemical photosynthetic responses to temperature: how do interspecific differences compare with seasonal shifts?
Yan-Shih Lin1,2,3, Belinda E. Medlyn2, Martin G. De Kauwe2 and David S. Ellsworth1
1Hawkesbury Institute for the Environment, University of Western Sydney-Hawkesbury Campus, Locked Bag 1797, Penrith, NSW 2751, Australia; 2Department of Biological Sciences, Macquarie University, North Ryde, NSW 2109, Australia; 3Corresponding author ([email protected])
Received February 6, 2013; accepted June 5, 2013; published online July 9, 2013; handling Editor Danielle Way
Plants show flexible acclimation of leaf photosynthesis to temperature that depends both on their prevailing growth environ-ment and the climate where they originated. This acclimation has been shown to involve changes in the temperature responses of the apparent maximum rate of Rubisco carboxylation (Vcmax) and apparent maximum rate of electron transport (Jmax), as well as changes in the ratio of these parameters. We asked whether such changes in photosynthetic biochemistry attributable to climate of origin are similar in nature and magnitude to those attributable to growth environment. To address this ques-tion, we measured temperature responses of photosynthesis and chlorophyll fluorescence on six Eucalyptus species from diverse geographical and climatic regions growing in a common garden. Measurements were made in three seasons, allow-ing us to compare interspecific differences with seasonal changes. We found significant interspecific differences in apparent Vcmax and Jmax standardized to 25 °C, but there were no significant differences in the temperature responses of these param-eters among species. Comparing data across seasons, we found significant seasonal changes in apparent Vcmax25, but not in Jmax25, causing a change in their ratio (J/V ratio). However, there were no seasonal changes in the temperature response of either parameter. We concluded that the growth environment had a much larger effect on temperature response than climate of origin among this set of species. Mean daytime temperature increased by 15 °C from winter to summer, whereas we esti-mated that the seasonal change in J/V ratio would cause a change in the optimum temperature (Topt) for gross photosynthesis of 3.6 °C. Use of a general relationship to describe photosynthetic temperature acclimation resulted in a strong underestima-tion of the Topt for photosynthesis for these species. Our results indicated that variation in photosynthetic temperature responses cannot be captured in one simple relationship with growth temperature. Further comparative research on species groups will be needed to develop a basis for modelling these interspecific differences in plant temperature acclimation.
Keywords: electron transport rate, leaf net photosynthesis, seasonal acclimation, temperature acclimation, temperature response of photosynthesis.
Introduction
Leaf photosynthetic processes depend strongly on tempera-ture (Berry and Björkman 1980). This temperature depen-dence is widely incorporated into vegetation–climate models, where the effect of temperature on leaf carbon budget is a major constraint on plant productivity in future, warmer cli-mates (Melillo et al. 1993, Cao and Woodward 1998, Sitch
et al. 2003, Medlyn et al. 2011). In most models, the parame-ters for these photosynthesis–temperature relationships do not vary as a function of growth environment. However, plants commonly exhibit variation in leaf photosynthetic responses to temperature, as a function of growth temperature. Generally speaking, plants growing in, or originating from, warm environ-ments show higher thermal optima for leaf net photosynthesis
Research paper
at National D
ong Hw
a University L
ibrary on April 3, 2014
http://treephys.oxfordjournals.org/D
ownloaded from
Tree Physiology Volume 33, 2013
(An) and lower dark respiration rates at a standard temperature than do plants growing in, or originating from, cold environ-ments (De Pury and Farquhar 1997, Slatyer 1977a, 1977b, Slatyer and Ferrar 1977, Slatyer and Morrow 1977, Llorens et al. 2003, Ow et al. 2008). Such differences in temperature responses between plants acclimated to, or adapted to, warm vs. cold environments are thought to indicate that plants regu-late their photosynthetic thermal optimum to the prevailing thermal regime (Berry and Björkman 1980, Ehleringer and Cerling 1995, Battaglia et al. 1996, Hikosaka et al. 2007). Using static photosynthetic–temperature responses may there-fore lead to incorrect estimates of plant carbon gain, particu-larly in future global warming scenarios (Way and Oren 2010). Ideally, models of vegetation productivity would incorporate the potential for leaf photosynthetic acclimation or adaptation to growth temperature (Tgrowth). Unfortunately, there is still little quantitative information on which to base such models. It remains unclear which processes are involved in photosyn-thetic acclimation to temperature. Potential mechanisms under-lying these thermal response adjustments include changes in the component biochemical processes (Sage and Kubien 2007), adjustments in stomatal conductance (Lin et al. 2012) and acclimation of respiration (Atkin et al. 2000, Tjoelker et al. 2001, Crous et al. 2011). Most research has focused on changes in the biochemical processes (Hikosaka et al. 2006, Kattge and Knorr 2007, Dillaway and Kruger 2010, Yamori et al. 2010).
There are two major sets of biochemical processes that commonly limit photosynthesis, namely carboxylation of RuBP (determined by maximal Rubisco activity, Vcmax) and electron transport photochemistry for the regeneration of RuBP in the Calvin cycle (determined by the maximum electron transport rate, Jmax). There is also a third biochemical process that can limit photosynthesis, namely the rate of triose phosphate utili-zation (Harley and Sharkey 1991, Long and Bernacchi 2003, Sharkey et al. 2007), but this limitation is generally not consid-ered in temperature studies because it is rarely observed in the field. The temperature dependence of both Jmax and Vcmax can be described by peaked Arrhenius-type functions
f T kE T
RTS H R
( ) exp( ) exp ( ) /
ka k
k
d= −
+ −( )+25
298298
1 298 2981
∆eexp ( ) /T S H T Rk d k∆ −( )
(1)
where k25 (µmol m−2 s−1) is either Jmax25 or Vcmax25 and repre-sents the rate at a standard temperature of 25 °C, Tk is the leaf temperature in K, Ea (kJ mol−1) is the activation energy describ-ing the rate of increase in the process at low temperature, R is the universal gas constant (0.8314 kJ mol−1 K−1), Hd (kJ mol−1) is the deactivation energy and ΔS (kJ mol−1 K−1) is an entropy factor. The latter two parameters combine to determine the optimum temperature (Topt) for the process. Note that some
authors also include a limitation due to internal (mesophyll) conductance (gi) (e.g., Warren 2008), but we use here the standard formulation of the Farquhar et al. (1980) model com-monly used in vegetation models; the Vcmax is therefore an apparent Vcmax that is obtained from gas exchange measure-ments and includes any changes in gi and/or the active state of Rubisco and/or Rubisco activase. The temperature responses of Rubisco activity and RuBP regeneration differ (Bunce 2000, Hikosaka et al. 2006). In general, the thylakoid membrane complex involved in RuBP regeneration is more sensitive to high temperatures (e.g., >35 °C) than is carboxylation because membrane-bound proteins in whole-chain electron transport are sensitive to alterations in thylakoid membrane composition (Sage and Kubien 2007). Temperature acclimation of the bio-chemical processes may thus involve changes in the Ea or the ΔS of one or both sets of processes. Additionally, since tem-perature dependencies of Jmax and Vcmax are different, changes in the ratio of these parameters (ratio of Jmax to Vcmax, J/V ratio hereafter) will affect which biochemical process is most limit-ing at a given temperature and thus can change the thermal optimum for net photosynthesis (Hikosaka et al. 1999, Onoda et al. 2005a). Generally speaking, although Jmax has lower Topt than Vcmax (Medlyn et al. 2002a, Kattge and Knorr 2007), the RuBP regeneration-limited photosynthesis (Aj) has higher Topt than the Rubisco-limited photosynthesis (Ac). This means that when J/V ratio declines, Aj is more frequently limiting and thus leads to an increase in Topt of An (Onoda et al. 2005a, Hikosaka et al. 2006, Lin et al. 2012).
Studies of temperature acclimation of photosynthetic bio-chemistry to date disagree on which temperature response parameters (Ea, ΔS or J/V ratio) are altered. In a review of 23 species, including evergreen and deciduous trees and crops, Hikosaka et al. (2006) found that the observed relationship between Topt of An and the growth temperature (Tgrowth) of the plants is driven by changes in J/V ratio as well as changes in Ea for Vcmax and Jmax. They found that Ea for both Jmax and Vcmax increased with Tgrowth, and the J/V ratio decreased with Tgrowth. There was a general relationship for Ea of Vcmax, which increased by 10 kJ mol−1 for every 10 °C increase in Tgrowth, but the rela-tionships for Ea of Jmax and the J/V ratio varied among species. Kattge and Knorr (2007) collated the temperature depen-dences of Vcmax and Jmax measured on a similarly wide range of species to estimate how these temperature dependences vary with Tgrowth. In agreement with Hikosaka et al. (2006), they found that the J/V ratio declined with Tgrowth. However, they found that neither Ea for Vcmax and Jmax changed with Tgrowth, but ΔS for both processes decreased with Tgrowth. In agreement with Hikosaka et al. (2006), they found that the J/V ratio declined with Tgrowth. The discrepancy between these two stud-ies may be partially explained by the equation chosen to fit to data: although both studies applied a peaked equation (Eq. (1)) to estimate the temperature dependence of Jmax, Hikosaka
794 Lin et al.
at National D
ong Hw
a University L
ibrary on April 3, 2014
http://treephys.oxfordjournals.org/D
ownloaded from
Tree Physiology Online at http://www.treephys.oxfordjournals.org
et al. (2006) used an Arrhenus equation and Kattge and Knorr (2007) used the peaked equation to estimate temperature dependences of Vcmax.
In addition to the uncertainty over which processes are involved in the temperature acclimation of biochemical photo-synthetic responses, it is not clear whether the processes involved in short-term acclimation to growth environment are similar to the processes involved in long-term differentiation among species native to different environments. The biochemi-cal photosynthetic response to temperature is known to differ among species when grown in the same environment (Berry and Björkman 1980, Ferrar et al. 1989, Knight and Ackerly 2002). For a given species, the biochemical photosynthetic response to temperature also varies dynamically as a function of Tgrowth (Leuning 1990, Dreyer et al. 2001, Froux et al. 2004, Hikosaka et al. 2007, Amthor et al. 2010). However, all review studies to date (Medlyn et al. 2002a, Hikosaka et al. 2006, Kattge and Knorr 2007) include both different species and dif-ferent growth environments, making it impossible to distin-guish the effects of short-term phenotypic acclimation from long-term species differences.
In this study, we aimed to separate the short-term photo-synthetic acclimatory response to the environment from the intrinsic interspecific differences in photosynthetic tempera-ture responses. We conducted a common garden experiment comprised of closely related Eucalyptus species originating from climates with differing mean annual temperatures. We parameterized the temperature responsiveness of key photo-synthetic parameters (i.e., Vcmax, Jmax, J/V ratio and electron transport rate, ETR) from field measurements on these spe-cies, allowing us to quantify species differences in photosyn-thetic temperature acclimation. We hypothesized that species originating from warm climates would have higher photosyn-thetic temperature optima than the species originating from cooler climates. The measurements were conducted in three different seasons (winter, spring and summer), as we hypoth-esized that there would be strong seasonal shifts in the photo-synthetic temperature response, with the Topt increasing from winter through summer. Following the work by Kattge and Knorr (2007), we hypothesized that both seasonal and spe-cies differences in temperature responses of biochemistry would be driven by changes in the J/V ratio and the entropy factor of their temperature responses, rather than the activa-tion energy.
Our chosen species also had different native range sizes. The potential for acclimation to growth thermal regime may vary among species in relation to range size (Ferrar et al. 1989, Dillaway and Kruger 2010, Ghannoum and Way 2011). Narrowly distributed species may exhibit less plasticity in their temperature responses than widely distributed species. We hypothesized that we would see the largest seasonal tempera-ture acclimation in species with the largest native ranges.
Finally, we compared our parameter values to a previous meta-analysis (Kattge and Knorr 2007). We used the parame-ters obtained from the field measurements to simulate the photosynthesis–temperature response for our species, and compared this response with that obtained using parameter values in Kattge and Knorr’s meta-analysis. The aim of this comparison was to test the generality of the relationships obtained in that meta-analysis.
Materials and methods
Experimental site
This study was conducted at the Hawkesbury Forest Experiment (HFE) common garden, located in western Sydney (Richmond, NSW, Australia; 33°36′S, 150°44′E), and is in a sub-humid temperate climate (Barton et al. 2010; see site description therein). The mean daily maximum temperature of the hottest month is 29 °C, with an average of 1.5 days exceeding 40 °C per annum, and the mean daily minimum tem-perature of the coldest month is 3 °C, with an average of 12 frost days per annum. The long-term annual rainfall in this loca-tion is 801 mm.
This common garden experiment was established to assess how different Eucalyptus species regulate plant functional responses to climate and seasonal climatic variation. The HFE common garden consists of six Eucalyptus species planted in monocultures in blocks at a constant spacing, each with two replicate plots. Seedlings of six Eucalyptus species that came from seed stocks in southeastern Australia (Table 1) were planted in September 2007. Each species was randomly assigned to two replicate plots of 35 trees planted at 3.4 × 2.65 m spacing, approximating 1000 trees per hectare. The six Eucalyptus species were chosen based on their native range sizes (Table 1). These were (i) widely distributed, cos-mopolitan eastern Australian species Eucalyptus crebra F. Muell. and Eucalyptus tereticornis Sm., whose native ranges cover nearly 20° latitude on the Australian continent; (ii) medium-distributed species Eucalyptus saligna Sm. and Eucalyptus melliodora A. Cunn. ex Schauer.; and (iii) narrowly distributed species and Eucalyptus cladocalyx F. Muell. and Eucalyptus dunnii Maiden., which have native ranges covering <4° latitude as well as small longitudinal ranges. Of the species with smaller range sizes, E. saligna and E. dunnii originate in cooler climates than E. melliodora and E. cladocalyx.
While temperature-controlled measurements of tree seed-lings are logistically easiest to achieve in controlled environ-ments, artificial environments typically lack realistic temperature variations on a diurnal and day-to-day basis, and their responses to simplified day–night temperature regimes may not represent the acclimation potential of larger plants in the field. We therefore chose to carry out field measurements on saplings for this study.
Temperature acclimation of Eucalyptus photosynthesis 795
at National D
ong Hw
a University L
ibrary on April 3, 2014
http://treephys.oxfordjournals.org/D
ownloaded from
Tree Physiology Volume 33, 2013
Field data
CO2 response of leaf net photosynthesis (An − Ci) measurementsField measurements of the response of net photosynthesis (An) to step changes in external CO2 concentration, Ca, were measured using the LI-6400 portable photosynthesis system (LI-COR, Inc., Lincoln, NE, USA). The Li-Cor LED light source was set to 1800 µmol m−2 s−1 to allow determination of An as a function of different Ca levels at light saturation. Measurements were first taken at ambient Ca and then progressed through a series of step-wise changes in Ca from sub-ambient to super-ambient saturating Ca. In the common garden, the An responses to Ca were measured in each species, conducted in three sea-sons (i.e., spring, summer and winter), to evaluate the seasonal response. Trees were measured in their second year after planting. The average heights of the different species ranged between 2 and 3.5 m at the start of the first campaign (i.e., August 2008). The slow-growing species, E. crebra, was the shortest, and the fast growing species, E. saligna, was the tall-est. Three trees from each species were randomly chosen for the measurements. Measurements were done on the fully expended, current-year leaves from the top one-third tree crown. These leaves were measured using a 2-cm2 cuvette attached to the leaf blade and maintained at three temperature levels (15, 25 and 32 °C) in late August 2008 (i.e., austral winter), and two of the same temperatures and a higher tem-perature (25, 32 and 36 °C) in mid-November 2008 (i.e., aus-tral spring) and early February 2009 (i.e., austral summer). In all cases, leaves were enclosed in the leaf cuvette at the target temperature and ambient Ca level for at least 20 min before An– Ci curve measurements were conducted, then allowed to equilibrate for a further 20 min at the new temperature prior to the next set of An − Ci curve measurements. Temperatures were increased progressively from low to high.
Temperature response of ETRAn independent set of temperature responses of light-satu-rated net photosynthetic rate coupled with chlorophyll a
fluorescence (Genty et al. 1989) was used to evaluate the temperature response of ETR among six Eucalyptus species in the HFE common garden. It is suggested that ETR is propor-tional to photochemical efficiency of Photosystem II (PS II), which increases with temperature, but deactivates at higher temperature due to non-photochemical quenching associated with energization of the thylakoids (Genty et al. 1989). These measurements were made at six to seven temperature levels (15, 20, 25, 30, 35, 40 and 45 °C) using the 2-cm2 leaf cuvette (LI-COR, Inc.), saturating light (1800 µmol m−2 s−1 with the Li-Cor LED light source and fluorometer) at ambient atmo-spheric CO2 concentration in August 2009 (austral winter) and January 2010 (austral summer). In all cases, leaves were enclosed in the leaf chamber at the target temperature and ambient Ca level for at least 20 min before the light-saturated net photosynthetic rates were measured, then allowed to equil-ibrate for another 20 min at the next temperature measure-ment. At the end of each temperature equilibration period, an estimate of maximal fluorescence ( ′Fm) was obtained by apply-ing a saturating light flash (>7000 µmol m−2 s−1; 800 ms pulse) using the leaf chamber fluorometer (LI-6400-40, LI-COR, Inc.). Electron transport rate is then calculated as
ETR m S
mleaf=
′ −′
F FF
fIα
(2)
where Fs is the steady-state fluorescence, I is incident photon flux density (µmol m−2 s−1), αleaf is leaf absorbance and f is the fraction of absorbed quanta used by photosynthesis II system (Genty et al. 1989). We used 0.84 for αleaf and 0.5 for f from the standard assumption for C3 plants (Krall and Edwards 1992, LI-Cor 2008). As with the previous section, tempera-tures were increased progressively from low to high.
Meteorological dataTo evaluate the relationship between leaf physiological responses to temperature and climate of origin, climate data from meteorological stations were obtained from the Australia
796 Lin et al.
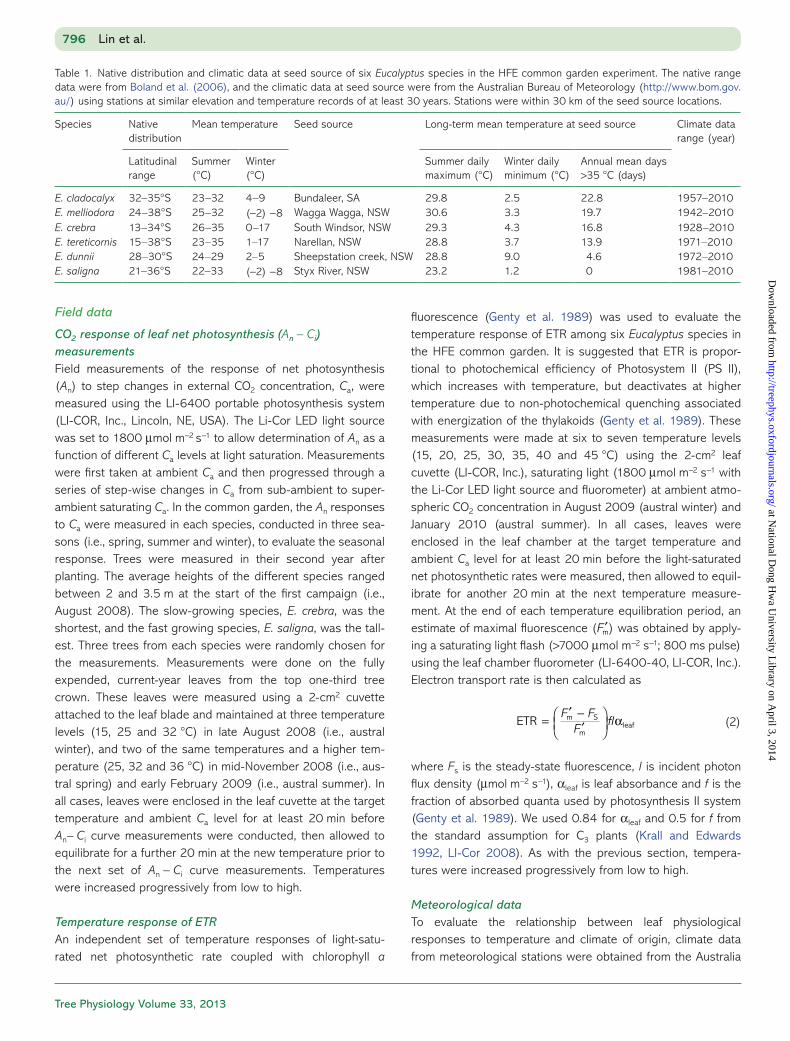
Table 1. Native distribution and climatic data at seed source of six Eucalyptus species in the HFE common garden experiment. The native range data were from Boland et al. (2006), and the climatic data at seed source were from the Australian Bureau of Meteorology (http://www.bom.gov.au/) using stations at similar elevation and temperature records of at least 30 years. Stations were within 30 km of the seed source locations.
Species Native distribution
Mean temperature Seed source Long-term mean temperature at seed source Climate data range (year)
Latitudinal range
Summer (°C)
Winter (°C)
Summer daily maximum (°C)
Winter daily minimum (°C)
Annual mean days >35 °C (days)
E. cladocalyx 32–35°S 23–32 4–9 Bundaleer, SA 29.8 2.5 22.8 1957–2010E. melliodora 24–38°S 25–32 (−2) −8 Wagga Wagga, NSW 30.6 3.3 19.7 1942–2010E. crebra 13–34°S 26–35 0–17 South Windsor, NSW 29.3 4.3 16.8 1928–2010E. tereticornis 15–38°S 23–35 1–17 Narellan, NSW 28.8 3.7 13.9 1971–2010E. dunnii 28–30°S 24–29 2–5 Sheepstation creek, NSW 28.8 9.0 4.6 1972–2010E. saligna 21–36°S 22–33 (−2) −8 Styx River, NSW 23.2 1.2 0 1981–2010
at National D
ong Hw
a University L
ibrary on April 3, 2014
http://treephys.oxfordjournals.org/D
ownloaded from
Tree Physiology Online at http://www.treephys.oxfordjournals.org
Bureau of Meteorology (http://www.bom.gov.au/). For each species, the station closest to the seed source with at least a resent 30-year temperature record was chosen. Long-term mean daily maximum temperature, mean daily minimum tem-perature, mean annual temperature range and mean annual days >35 °C for each seed source are given in Table 1. In this study, we chose the annual mean days above 35 °C as the main climatic index, because it was the most distinguishable climatic parameter among the climates of origin of the six spe-cies (Table 1). To evaluate the relationship between photosyn-thetic responses to temperature and growth temperature, we used climatic data measured at the HFE common garden dur-ing each campaign. Mean growth temperature (calculated as average of mean daily maxima and minima) was used as the index for growth temperature (Table 2).
Data analysisKey photosynthetic parameters (i.e., apparent Vcmax, Jmax and ETR) were first fitted to field measurements. The temperature responses of these photosynthetic parameters were then com-pared among species and across seasons, and correlated with the long-term mean temperature at seed source. Simulations based on C3 photosynthesis model (Farquhar et al. 1980) were used to reconstruct and compare the gross Ac and Aj responses to temperature among different parameterizations from this study and previous studies.
Apparent Vcmax and Jmax
Three photosynthetic parameters were fitted to measured An – Ci curves based on the C3 photosynthesis model of Farquhar et al. (1980): the apparent Vcmax, the apparent Jmax and the day respiration rate (Rd). As this study focused on photo synthesis biochemistry rather than respiration, estima-tions of Rd were not used further. Parameters for the tempera-ture dependence of the Michaelis–Menten coefficient of Rubisco and the temperature dependence of the CO2 compen-sation point in the absence of photorespiration were taken from Bernacchi et al. (2001). As these values were obtained from in vivo measurements, they are more likely to reflect the actual activity of the leaf. The model was fitted assuming
infinite mesophyll conductance, so the obtained values of Vcmax and Jmax should be regarded as apparent values. In contrast to Ethier and Livingstone (2004), when we examined residuals of the model fits we found no evidence for a lack of fit of the model to data that might indicate a need to incorporate a finite mesophyll conductance.
The Levenberg–Marquardt least squares approach was used for all parameter fitting.
Comparisons of photosynthetic parameters among species and across seasonsRates of apparent Vcmax and Jmax are correlated with leaf nitro-gen content and may vary considerably among leaves (Wilson et al. 2000, Hikosaka 2004, Grassi et al. 2005). To account for such variations, we first compared biochemical parameters at a reference temperature of 25 °C (i.e., apparent Vcmax25 and Jmax25) among species and across seasons. Statistical differ-ences in these parameters among species were tested for using a general linear model in R (version 2.15) with Tukey’s post hoc comparison. We tested separately for seasonal changes in each of the parameters, and relationships with (i) long-term mean days above 35 °C at seed source, and (ii) spe-cies’ native range size. We then normalized the parameters Vcmax and Jmax estimated at each measurement temperature for each leaf by their value at 25 °C. We tested for differences in the normalized values of Jmax and Vcmax among species and seasons. We then linearized the normalized data using the standard Arrhenius equation, and used a general linear model to test whether slopes and intercepts differed among species and seasons.
Finally, we characterized the temperature responses of nor-malised apparent Vcmax and Jmax by fitting the Ea and ΔS to Eq. (1) using the Levenberg–Marquardt least squares approach. We also checked whether Eq. (1) (peaked function) fitted the data better than the standard Arrhenius equation.
Electron transport rateElectron transport rate data obtained from field measurements of chlorophyll fluorescence were first normalized at 25 °C in order to reduce the variation caused by the differential leaf
Temperature acclimation of Eucalyptus photosynthesis 797
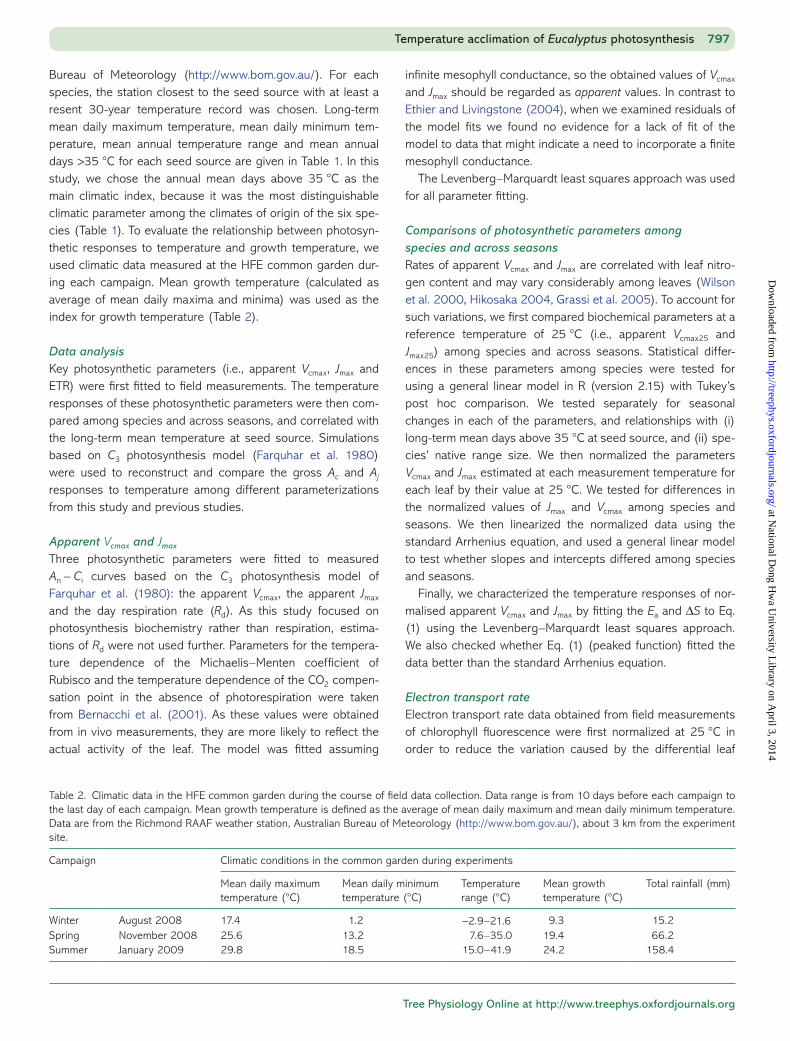
Table 2. Climatic data in the HFE common garden during the course of field data collection. Data range is from 10 days before each campaign to the last day of each campaign. Mean growth temperature is defined as the average of mean daily maximum and mean daily minimum temperature. Data are from the Richmond RAAF weather station, Australian Bureau of Meteorology (http://www.bom.gov.au/), about 3 km from the experiment site.
Campaign Climatic conditions in the common garden during experiments
Mean daily maximum temperature (°C)
Mean daily minimum temperature (°C)
Temperature range (°C)
Mean growth temperature (°C)
Total rainfall (mm)
Winter August 2008 17.4 1.2 −2.9–21.6 9.3 15.2Spring November 2008 25.6 13.2 7.6–35.0 19.4 66.2Summer January 2009 29.8 18.5 15.0–41.9 24.2 158.4
at National D
ong Hw
a University L
ibrary on April 3, 2014
http://treephys.oxfordjournals.org/D
ownloaded from
Tree Physiology Volume 33, 2013
nitrogen contents (which affect the leaf absorptance) or mea-suring instruments. It is assumed that while the magnitude of ETR varies among different leaves, the Topt and the shape of temperature response of ETR should not be affected (Evans and Poorter 2001). The temperature response of ETR was fit-ted using the equation proposed by June et al. (2004):
J JT T
T Tleaf opt
leaf opte= − −( )( )/Ω2
(3)
where JTleaf and JTleaf are the ETR at given leaf temperature and optimum temperature, respectively. Ω describes the width of the response curve.
Simulation of photosynthesis responses to temperatureThe temperature responses of photosynthesis were simulated based on the C3 photosynthesis model (Farquhar et al. 1980) using normalized parameterizations at 25 °C from six Eucalyptus species as describe above. We simulated Ac and Aj for leaf temperature from 10 to 45 °C, assuming a fixed Ci : Ca ratio = 0.7, ambient Ca of 380 ppm, and saturated light as a standard condition for light-saturated photosynthesis. We stan-dardized curves to 25 °C by setting Vcmax at 25 °C to 1 (µmol m−2 s−1). The dependence of J/V ratio at 25 °C as a func-tion of Tgrowth was estimated by fitting apparent Vcmax and Jmax from field measured An − Ci curves as described above. We did not employ a dynamic or coupled model for stomatal conduc-tance as biochemical acclimation is the main focus of this study and differing stomatal sensitivities to water availability among species is a study of its own (Héroult et al. 2013). By assuming a constant Ci : Ca ratio and examining gross photosynthesis rather than net photosynthesis, we were able to quantify the effects of differences in biochemistry alone on the temperature response of photosynthesis. Finally, we compared our model
simulation results with parameterizations for Vcmax and Jmax as a function of Tgrowth proposed by Kattge and Knorr (2007) based on a meta-analysis of 36 different species, in order to evaluate whether a general model of temperature acclimation predicts the temperature responses that we observed.
Results
Temperature response of photosynthesis among six Eucalyptus species
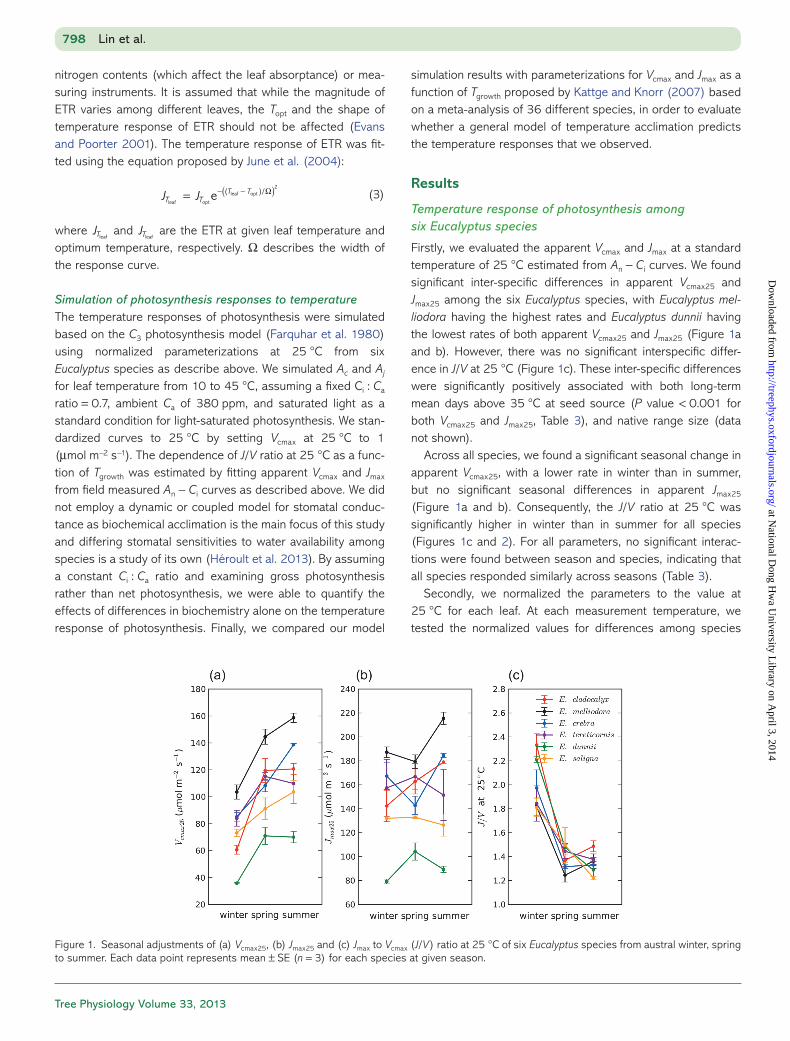
Firstly, we evaluated the apparent Vcmax and Jmax at a standard temperature of 25 °C estimated from An − Ci curves. We found significant inter-specific differences in apparent Vcmax25 and Jmax25 among the six Eucalyptus species, with Eucalyptus mel-liodora having the highest rates and Eucalyptus dunnii having the lowest rates of both apparent Vcmax25 and Jmax25 (Figure 1a and b). However, there was no significant interspecific differ-ence in J/V at 25 °C (Figure 1c). These inter-specific differences were significantly positively associated with both long-term mean days above 35 °C at seed source (P value < 0.001 for both Vcmax25 and Jmax25, Table 3), and native range size (data not shown).
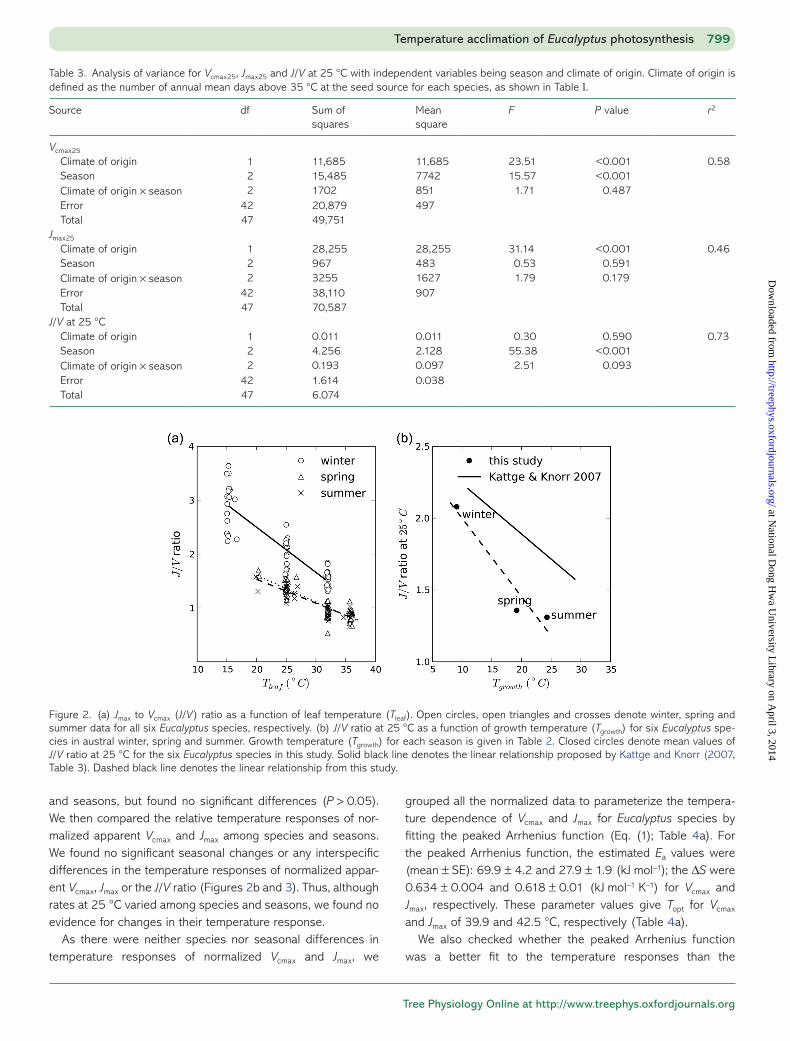
Across all species, we found a significant seasonal change in apparent Vcmax25, with a lower rate in winter than in summer, but no significant seasonal differences in apparent Jmax25 (Figure 1a and b). Consequently, the J/V ratio at 25 °C was significantly higher in winter than in summer for all species (Figures 1c and 2). For all parameters, no significant interac-tions were found between season and species, indicating that all species responded similarly across seasons (Table 3).
Secondly, we normalized the parameters to the value at 25 °C for each leaf. At each measurement temperature, we tested the normalized values for differences among species
798 Lin et al.
Figure 1. Seasonal adjustments of (a) Vcmax25, (b) Jmax25 and (c) Jmax to Vcmax (J/V) ratio at 25 °C of six Eucalyptus species from austral winter, spring to summer. Each data point represents mean ± SE (n = 3) for each species at given season.
at National D
ong Hw
a University L
ibrary on April 3, 2014
http://treephys.oxfordjournals.org/D
ownloaded from
Tree Physiology Online at http://www.treephys.oxfordjournals.org
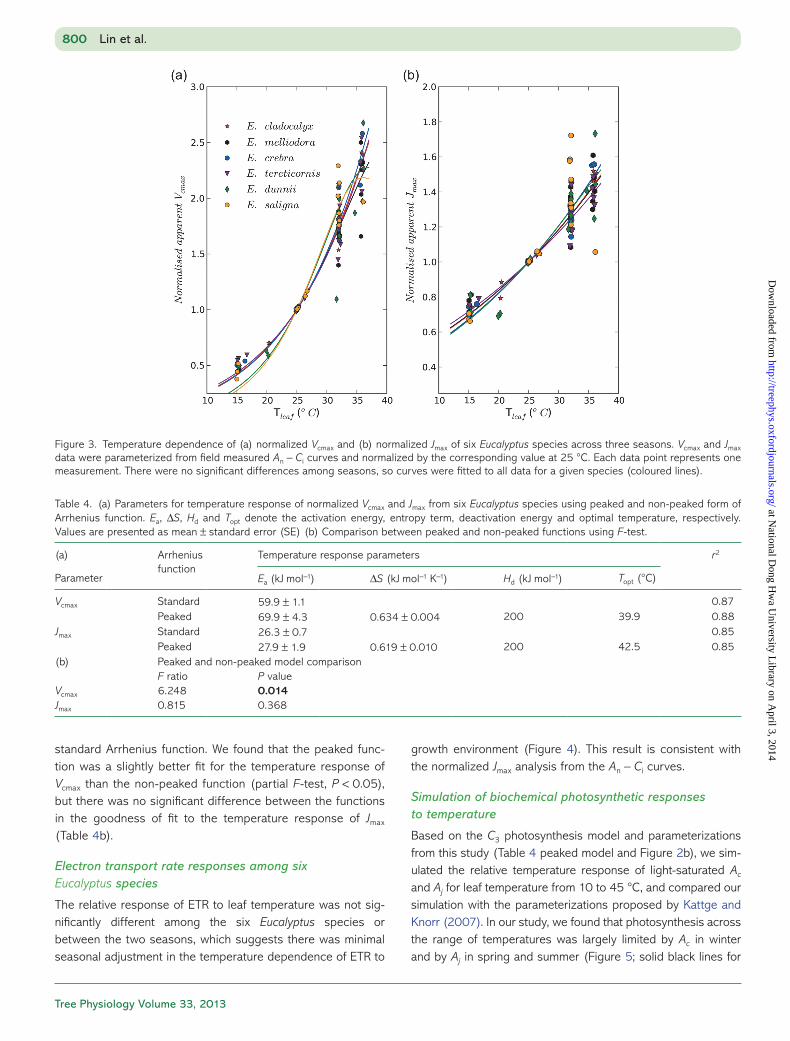
and seasons, but found no significant differences (P > 0.05). We then compared the relative temperature responses of nor-malized apparent Vcmax and Jmax among species and seasons. We found no significant seasonal changes or any interspecific differences in the temperature responses of normalized appar-ent Vcmax, Jmax or the J/V ratio (Figures 2b and 3). Thus, although rates at 25 °C varied among species and seasons, we found no evidence for changes in their temperature response.
As there were neither species nor seasonal differences in temperature responses of normalized Vcmax and Jmax, we
grouped all the normalized data to parameterize the tempera-ture dependence of Vcmax and Jmax for Eucalyptus species by fitting the peaked Arrhenius function (Eq. (1); Table 4a). For the peaked Arrhenius function, the estimated Ea values were (mean ± SE): 69.9 ± 4.2 and 27.9 ± 1.9 (kJ mol−1); the ΔS were 0.634 ± 0.004 and 0.618 ± 0.01 (kJ mol−1 K−1) for Vcmax and Jmax, respectively. These parameter values give Topt for Vcmax and Jmax of 39.9 and 42.5 °C, respectively (Table 4a).
We also checked whether the peaked Arrhenius function was a better fit to the temperature responses than the
Temperature acclimation of Eucalyptus photosynthesis 799
Figure 2. (a) Jmax to Vcmax (J/V) ratio as a function of leaf temperature (Tleaf). Open circles, open triangles and crosses denote winter, spring and summer data for all six Eucalyptus species, respectively. (b) J/V ratio at 25 °C as a function of growth temperature (Tgrowth) for six Eucalyptus spe-cies in austral winter, spring and summer. Growth temperature (Tgrowth) for each season is given in Table 2. Closed circles denote mean values of J/V ratio at 25 °C for the six Eucalyptus species in this study. Solid black line denotes the linear relationship proposed by Kattge and Knorr (2007, Table 3). Dashed black line denotes the linear relationship from this study.
Table 3. Analysis of variance for Vcmax25, Jmax25 and J/V at 25 °C with independent variables being season and climate of origin. Climate of origin is defined as the number of annual mean days above 35 °C at the seed source for each species, as shown in Table l.
Source df Sum of squares
Mean square
F P value r2
Vcmax25
Climate of origin 1 11,685 11,685 23.51 <0.001 0.58 Season 2 15,485 7742 15.57 <0.001 Climate of origin × season 2 1702 851 1.71 0.487 Error 42 20,879 497 Total 47 49,751Jmax25
Climate of origin 1 28,255 28,255 31.14 <0.001 0.46 Season 2 967 483 0.53 0.591 Climate of origin × season 2 3255 1627 1.79 0.179 Error 42 38,110 907 Total 47 70,587J/V at 25 °C Climate of origin 1 0.011 0.011 0.30 0.590 0.73 Season 2 4.256 2.128 55.38 <0.001 Climate of origin × season 2 0.193 0.097 2.51 0.093 Error 42 1.614 0.038 Total 47 6.074
at National D
ong Hw
a University L
ibrary on April 3, 2014
http://treephys.oxfordjournals.org/D
ownloaded from
Tree Physiology Volume 33, 2013
standard Arrhenius function. We found that the peaked func-tion was a slightly better fit for the temperature response of Vcmax than the non-peaked function (partial F-test, P < 0.05), but there was no significant difference between the functions in the goodness of fit to the temperature response of Jmax (Table 4b).
Electron transport rate responses among six Eucalyptus species
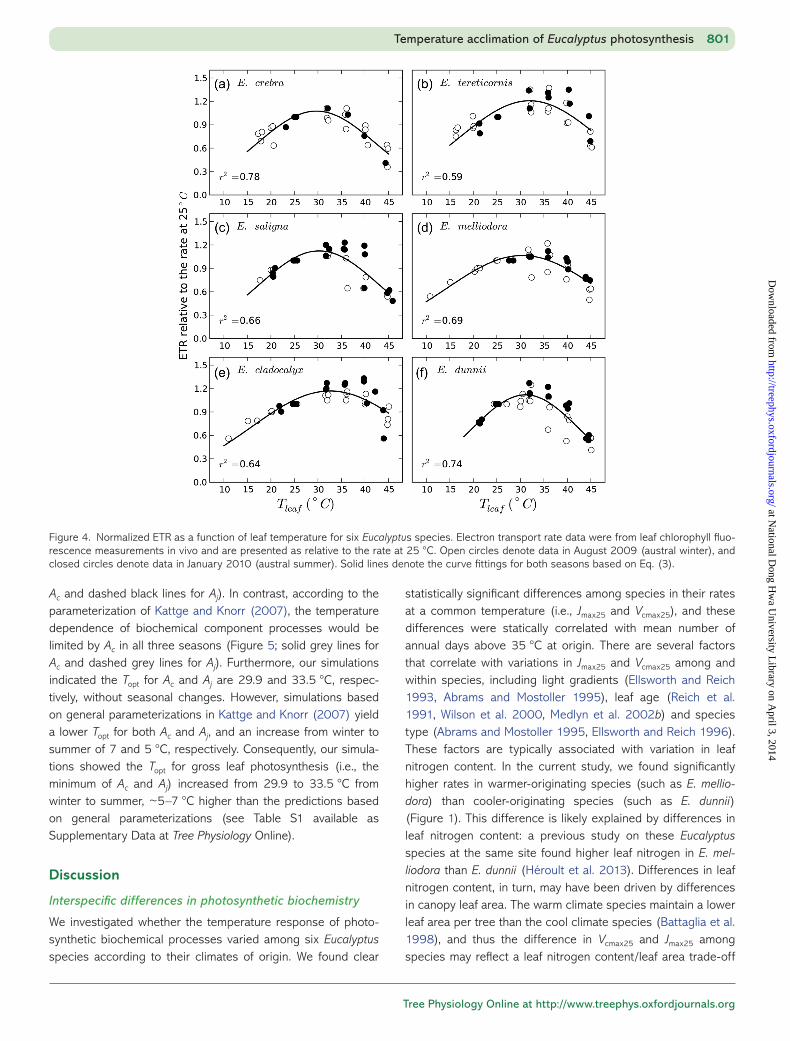
The relative response of ETR to leaf temperature was not sig-nificantly different among the six Eucalyptus species or between the two seasons, which suggests there was minimal seasonal adjustment in the temperature dependence of ETR to
growth environment (Figure 4). This result is consistent with the normalized Jmax analysis from the An − Ci curves.
Simulation of biochemical photosynthetic responses to temperature
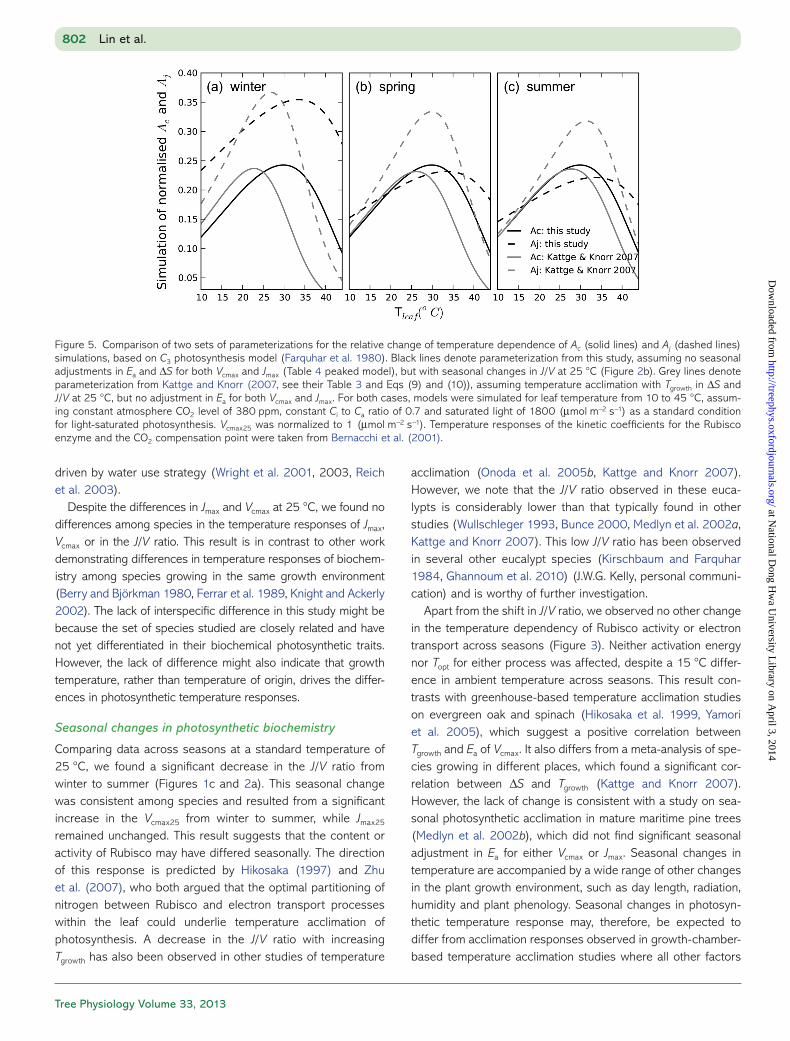
Based on the C3 photosynthesis model and parameterizations from this study (Table 4 peaked model and Figure 2b), we sim-ulated the relative temperature response of light-saturated Ac and Aj for leaf temperature from 10 to 45 °C, and compared our simulation with the parameterizations proposed by Kattge and Knorr (2007). In our study, we found that photosynthesis across the range of temperatures was largely limited by Ac in winter and by Aj in spring and summer (Figure 5; solid black lines for
800 Lin et al.
Figure 3. Temperature dependence of (a) normalized Vcmax and (b) normalized Jmax of six Eucalyptus species across three seasons. Vcmax and Jmax data were parameterized from field measured An − Ci curves and normalized by the corresponding value at 25 °C. Each data point represents one measurement. There were no significant differences among seasons, so curves were fitted to all data for a given species (coloured lines).
Table 4. (a) Parameters for temperature response of normalized Vcmax and Jmax from six Eucalyptus species using peaked and non-peaked form of Arrhenius function. Ea, ΔS, Hd and Topt denote the activation energy, entropy term, deactivation energy and optimal temperature, respectively. Values are presented as mean ± standard error (SE) (b) Comparison between peaked and non-peaked functions using F-test.
(a) Arrhenius function
Temperature response parameters r2
Parameter Ea (kJ mol−1) ΔS (kJ mol−1 K−1) Hd (kJ mol−1) Topt (°C)
Vcmax Standard 59.9 ± 1.1 0.87Peaked 69.9 ± 4.3 0.634 ± 0.004 200 39.9 0.88
Jmax Standard 26.3 ± 0.7 0.85Peaked 27.9 ± 1.9 0.619 ± 0.010 200 42.5 0.85
(b) Peaked and non-peaked model comparisonF ratio P value
Vcmax 6.248 0.014Jmax 0.815 0.368
at National D
ong Hw
a University L
ibrary on April 3, 2014
http://treephys.oxfordjournals.org/D
ownloaded from
Tree Physiology Online at http://www.treephys.oxfordjournals.org
Ac and dashed black lines for Aj). In contrast, according to the parameterization of Kattge and Knorr (2007), the temperature dependence of biochemical component processes would be limited by Ac in all three seasons (Figure 5; solid grey lines for Ac and dashed grey lines for Aj). Furthermore, our simulations indicated the Topt for Ac and Aj are 29.9 and 33.5 °C, respec-tively, without seasonal changes. However, simulations based on general parameterizations in Kattge and Knorr (2007) yield a lower Topt for both Ac and Aj, and an increase from winter to summer of 7 and 5 °C, respectively. Consequently, our simula-tions showed the Topt for gross leaf photosynthesis (i.e., the minimum of Ac and Aj) increased from 29.9 to 33.5 °C from winter to summer, ~5–7 °C higher than the predictions based on general parameterizations (see Table S1 available as Supplementary Data at Tree Physiology Online).
Discussion
Interspecific differences in photosynthetic biochemistry
We investigated whether the temperature response of photo-synthetic biochemical processes varied among six Eucalyptus species according to their climates of origin. We found clear
statistically significant differences among species in their rates at a common temperature (i.e., Jmax25 and Vcmax25), and these differences were statically correlated with mean number of annual days above 35 °C at origin. There are several factors that correlate with variations in Jmax25 and Vcmax25 among and within species, including light gradients (Ellsworth and Reich 1993, Abrams and Mostoller 1995), leaf age (Reich et al. 1991, Wilson et al. 2000, Medlyn et al. 2002b) and species type (Abrams and Mostoller 1995, Ellsworth and Reich 1996). These factors are typically associated with variation in leaf nitrogen content. In the current study, we found significantly higher rates in warmer-originating species (such as E. mellio-dora) than cooler-originating species (such as E. dunnii) (Figure 1). This difference is likely explained by differences in leaf nitrogen content: a previous study on these Eucalyptus species at the same site found higher leaf nitrogen in E. mel-liodora than E. dunnii (Héroult et al. 2013). Differences in leaf nitrogen content, in turn, may have been driven by differences in canopy leaf area. The warm climate species maintain a lower leaf area per tree than the cool climate species (Battaglia et al. 1998), and thus the difference in Vcmax25 and Jmax25 among species may reflect a leaf nitrogen content/leaf area trade-off
Temperature acclimation of Eucalyptus photosynthesis 801
Figure 4. Normalized ETR as a function of leaf temperature for six Eucalyptus species. Electron transport rate data were from leaf chlorophyll fluo-rescence measurements in vivo and are presented as relative to the rate at 25 °C. Open circles denote data in August 2009 (austral winter), and closed circles denote data in January 2010 (austral summer). Solid lines denote the curve fittings for both seasons based on Eq. (3).
at National D
ong Hw
a University L
ibrary on April 3, 2014
http://treephys.oxfordjournals.org/D
ownloaded from
Tree Physiology Volume 33, 2013
driven by water use strategy (Wright et al. 2001, 2003, Reich et al. 2003).
Despite the differences in Jmax and Vcmax at 25 °C, we found no differences among species in the temperature responses of Jmax, Vcmax or in the J/V ratio. This result is in contrast to other work demonstrating differences in temperature responses of biochem-istry among species growing in the same growth environment (Berry and Björkman 1980, Ferrar et al. 1989, Knight and Ackerly 2002). The lack of interspecific difference in this study might be because the set of species studied are closely related and have not yet differentiated in their biochemical photo synthetic traits. However, the lack of difference might also indicate that growth temperature, rather than temperature of origin, drives the differ-ences in photosynthetic temperature responses.
Seasonal changes in photosynthetic biochemistry
Comparing data across seasons at a standard temperature of 25 °C, we found a significant decrease in the J/V ratio from winter to summer (Figures 1c and 2a). This seasonal change was consistent among species and resulted from a significant increase in the Vcmax25 from winter to summer, while Jmax25 remained unchanged. This result suggests that the content or activity of Rubisco may have differed seasonally. The direction of this response is predicted by Hikosaka (1997) and Zhu et al. (2007), who both argued that the optimal partitioning of nitrogen between Rubisco and electron transport processes within the leaf could underlie temperature acclimation of photosynthesis. A decrease in the J/V ratio with increasing Tgrowth has also been observed in other studies of temperature
acclimation (Onoda et al. 2005b, Kattge and Knorr 2007). However, we note that the J/V ratio observed in these euca-lypts is considerably lower than that typically found in other studies (Wullschleger 1993, Bunce 2000, Medlyn et al. 2002a, Kattge and Knorr 2007). This low J/V ratio has been observed in several other eucalypt species (Kirschbaum and Farquhar 1984, Ghannoum et al. 2010) (J.W.G. Kelly, personal communi-cation) and is worthy of further investigation.
Apart from the shift in J/V ratio, we observed no other change in the temperature dependency of Rubisco activity or electron transport across seasons (Figure 3). Neither activation energy nor Topt for either process was affected, despite a 15 °C differ-ence in ambient temperature across seasons. This result con-trasts with greenhouse-based temperature acclimation studies on evergreen oak and spinach (Hikosaka et al. 1999, Yamori et al. 2005), which suggest a positive correlation between Tgrowth and Ea of Vcmax. It also differs from a meta-analysis of spe-cies growing in different places, which found a significant cor-relation between ΔS and Tgrowth (Kattge and Knorr 2007). However, the lack of change is consistent with a study on sea-sonal photosynthetic acclimation in mature maritime pine trees (Medlyn et al. 2002b), which did not find significant seasonal adjustment in Ea for either Vcmax or Jmax. Seasonal changes in temperature are accompanied by a wide range of other changes in the plant growth environment, such as day length, radiation, humidity and plant phenology. Seasonal changes in photosyn-thetic temperature response may, therefore, be expected to differ from acclimation responses observed in growth- chamber-based temperature acclimation studies where all other factors
802 Lin et al.
Figure 5. Comparison of two sets of parameterizations for the relative change of temperature dependence of Ac (solid lines) and Aj (dashed lines) simulations, based on C3 photosynthesis model (Farquhar et al. 1980). Black lines denote parameterization from this study, assuming no seasonal adjustments in Ea and ΔS for both Vcmax and Jmax (Table 4 peaked model), but with seasonal changes in J/V at 25 °C (Figure 2b). Grey lines denote parameterization from Kattge and Knorr (2007, see their Table 3 and Eqs (9) and (10)), assuming temperature acclimation with Tgrowth in ΔS and J/V at 25 °C, but no adjustment in Ea for both Vcmax and Jmax. For both cases, models were simulated for leaf temperature from 10 to 45 °C, assum-ing constant atmosphere CO2 level of 380 ppm, constant Ci to Ca ratio of 0.7 and saturated light of 1800 (µmol m−2 s−1) as a standard condition for light-saturated photosynthesis. Vcmax25 was normalized to 1 (µmol m−2 s−1). Temperature responses of the kinetic coefficients for the Rubisco enzyme and the CO2 compensation point were taken from Bernacchi et al. (2001).
at National D
ong Hw
a University L
ibrary on April 3, 2014
http://treephys.oxfordjournals.org/D
ownloaded from
Tree Physiology Online at http://www.treephys.oxfordjournals.org
are held constant. The findings of this study and that of Medlyn et al. (2002b) suggest that seasonal changes in photosynthetic biochemistry are likely to be small, and limited to changes in the J/V ratio. Changes in other processes such as stomatal conduc-tance and respiration rates (Ow et al. 2008, 2010, Lin et al. 2012, Héroult et al. 2013) may be more important in determin-ing observed seasonal changes in the temperature optimum for photosynthesis as a whole.
Previous studies proposed that plants display interspecific variation in photosynthetic traits that relate to their climate of origin (Slatyer 1977a, Slatyer and Ferrar 1977, Slatyer 1978, Berry and Björkman 1980, Ferrar et al. 1989, Atkin et al. 2006a). However, there is substantial inconsistency in the extent of photosynthetic acclimation among species, with some species fully acclimating while others are incapable of even partial acclimation (Larigauderie and Körner 1995, De Pury and Farquhar 1997, Atkin et al. 2006b, Ghannoum and Way 2011). We hypothesized that narrowly distributed species would show less seasonal acclimation than widely distributed species. However, we could not reject the null hypothesis of no difference. We did not find any significant interaction between seasons and species’ native range size, or between seasons and species’ thermal regime at seed source, indicating that the capacity for seasonal acclimation of the biochemical photosyn-thetic responses was similar among the six Eucalyptus species studied. This lack of difference among species suggests that differences among species’ photosynthetic responses to tem-perature are not implicated in determining the geographical distribution of these six Eucalyptus species.
Comparison of modelled photosynthesis–temperature responses
Given that the biochemical C3 photosynthesis model (Farquhar et al. 1980) has been widely used as the basis to predict large-scale carbon budget under climate change, including elevated temperature (Melillo et al. 1993, Smith et al. 2001), it is important to understand the underlying mechanism of tem-perature acclimation capacity of two key biochemical parame-ters, Vcmax and Jmax, among species. Many previous studies suggest acclimation in Vcmax and Jmax to Tgrowth among several species (Hikosaka et al. 1999, Dreyer et al. 2001, Hikosaka et al. 2007), and Kattge and Knorr (2007) took this a step further, deriving general equations to describe how Vcmax and Jmax acclimate to Tgrowth. In their study, they found that both the J/V ratio at 25 °C and ΔS decrease with increasing Tgrowth (Figure 2b, black solid line), but there is no change in Ea for either parameter. Under this parameterization, the temperature response curves of Ac and Aj become less steep with increas-ing Tgrowth due to the decrease in ΔS, leading to an increase in Topt for Ac and Aj with higher Tgrowth (Table S1 available as Supplementary Data at Tree Physiology Online and Figure 5). The Tgrowth effect on J/V ratio at 25 °C alters the balance
between processes in such a way that Aj tends to limit photo-synthesis more often when Tgrowth is higher (Figure 5). We used these relationships to simulate photosynthesis as a function of temperature for the eucalypts in our study, and compared the resulting functions with those obtained using measured param-eters. We did not find that the generic relationships generalized well to the eucalypts in our study. We observed a similar Tgrowth response of the J/V ratio at 25 °C to that found by Kattge and Knorr (2007), but the values of the J/V ratio at any given tem-perature were significantly lower for the eucalypts. The value of Ea for Jmax was also strikingly lower than values collated by Kattge and Knorr (2007). As a result of these differences, the Topt of gross A in our species was ~6 °C higher than would be predicted by the general relationships obtained by Kattge and Knorr (2007). Further study is needed to understand the basis for this difference, but it does suggest that although Eucalyptus species have similar temperature responses to each other, they differ considerably from other tree species.
Our results agree with previous studies that a key process underlying temperature acclimation is a decrease in the ratio of electron transport capacity to Rubisco activity with increasing growth temperature. However, we did not find any significant changes in Ea or ΔS for either Jmax or Vcmax across seasons. As a result, the seasonal shift in Topt with Tgrowth is considerably less than would be predicted from the generic relationships with Tgrowth which were obtained by combining data from differ-ent species grown in different environments.
The implication of our study for modelling is that variation in photosynthetic temperature responses cannot be captured in one simple relationship with growth temperature. Seasonal shifts were smaller than predicted by a generic relationship based on data from different locations. We found that seasonal changes in photosynthetic temperature response at a given location could be described by changes in J/V ratio alone. Photosynthetic temperature response did not vary in relation to climate of origin among the Eucalyptus species studied, but there were differences between Eucalyptus and other tree spe-cies reported on in the literature. Further comparative research on species groups will be needed to develop a basis for model-ling these interspecific differences in plant temperature acclimation.
Supplementary Data
Supplementary data for this article are available at Tree Physiology Online.
Acknowledgments
We thank the constructive comments from the three anony-mous reviewers and the editor. We acknowledge the provision of funding by the Australian Government’s Department of
Temperature acclimation of Eucalyptus photosynthesis 803
at National D
ong Hw
a University L
ibrary on April 3, 2014
http://treephys.oxfordjournals.org/D
ownloaded from
Tree Physiology Volume 33, 2013
Climate Change and the Department of Agriculture, Fisheries and Forestry for the Hawkesbury Forest Experiment.
Funding
The senior author was partially supported by an UWS International Postgraduate Research Scholarship with UWS International Award (UWSIPRS/UWSIA) and a National Climate Change Adaptation Research Facility (NCCARF) scholarship from the NCCARF Primary Industries Adaptation Research Network.
References
Abrams MD, Mostoller SA (1995) Gas exchange, leaf structure and nitrogen in contrasting successional tree species growing in open and understory sites during a drought. Tree Physiol 15:361–370.
Amthor JS, Hanson PJ, Norby RJ, Wullschleger SD (2010) A comment on ‘Appropriate experimental ecosystem warming methods by eco-system, objective, and practicality’ by Aronson and McNulty. Agric For Meteorol 150:497–498.
Atkin OK, Holly C, Ball MC (2000) Acclimation of snow gum (Eucalyptus pauciflora) leaf respiration to seasonal and diurnal variations in tem-perature: the importance of changes in the capacity and tempera-ture sensitivity of respiration. Plant Cell Environ 23:15–26.
Atkin OK, Loveys BR, Atkinson LJ, Pons TL (2006a) Phenotypic plas-ticity and growth temperature: understanding interspecific variabil-ity. J Exp Bot 57:267–281.
Atkin OK, Scheurwater I, Pons T (2006b) High thermal acclimation potential of both photosynthesis and respiration in two lowland Plantago species in contrast to an alpine congeneric. Glob Chang Biol 12:500–515.
Barton CVM, Ellsworth DS, Medlyn BE et al. (2010) Whole-tree cham-bers for elevated atmospheric CO2 experimentation and tree scale flux measurements in south-eastern Australia: the Hawkesbury Forest Experiment. Agric For Meteorol 150:941–951.
Battaglia M, Beadle C, Loughhead S (1996) Photosynthetic tempera-ture responses of Eucalyptus globulus and Eucalyptus nitens. Tree Physiol 16:81–89.
Battaglia M, Cherry ML, Beadle CL, Sands PJ, Hingston A (1998) Prediction of leaf area index in eucalypt plantations: effects of water stress and temperature. Tree Physiol 18:521–528.
Bernacchi CJ, Singsaas EL, Pimentel C, Portis AR Jr, Long SP (2001) Improved temperature response functions for models of Rubisco-limited photosynthesis. Plant Cell Environ 24:253–259.
Berry J, Björkman O (1980) Photosynthetic response and adaption to temperature in higher plant. Annu Rev Plant Physiol 31:491–543.
Boland DJ, Brooker MIH, Chippendale GM, Hall N, Hyland BPM, Johnson RD (2006) Forest trees of Australia. CSIRO, Melbourne.
Bunce JA (2000) Acclimation of photosynthesis to temperature in eight cool and warm climate herbaceous C3 species: temperature dependence of parameters of a biochemical photosynthesis model. Photosynth Res 63:59–67.
Cao M, Woodward FI (1998) Net primary and ecosystem production and carbon stocks of terrestrial ecosystems and their responses to climate change. Glob Chang Biol 4:185–198.
Crous KY, Zaragoza-Castells J, Löw M, Ellsworth DS, Tissue DT, Tjoelker MG, Barton CVM, Gimeno TE, Atkin OK (2011) Seasonal acclimation of leaf respiration in Eucalyptus saligna trees: impacts of
elevated atmospheric CO2 and summer drought. Glob Chang Biol 17:1560–1576.
De Pury DGG, Farquhar GD (1997) Simple scaling of photosynthesis from leaves to canopies without the errors of big-leaf models. Plant Cell Environ 20:537–557.
Dillaway DN, Kruger EL (2010) Thermal acclimation of photosynthesis: a comparison of boreal and temperate tree species along a latitudi-nal transect. Plant Cell Environ 33:888–899.
Dreyer E, Le Roux X, Montpied P, Daudet FA, Masson F (2001) Temperature response of leaf photosynthetic capacity in seedlings from seven temperate tree species. Tree Physiol 21:223–232.
Ehleringer JR, Cerling TE (1995) Atmospheric CO2 and the ratio of intercellular to ambient CO2 concentrations in plants. Tree Physiol 15:105–111.
Ellsworth DS, Reich PB (1993) Canopy structure and vertical patterns of photosynthesis and related leaf traits in a deciduous forest. Oecologia 96:169–178.
Ellsworth DS, Reich PB (1996) Photosynthesis and leaf nitrogen in five Amazonian tree species during early secondary succession. Ecology 77:581–594.
Ethier GJ, Livingston NJ (2004) On the need to incorporate sensitivity to CO2 transfer conductance into the Farquhar–von Caemmerer–Berry leaf photosynthesis model. Plant Cell Environ 27:137–153.
Evans JR, Poorter H (2001) Photosynthetic acclimation of plants to growth irradiance: the relative importance of specific leaf area and nitrogen partitioning in maximizing carbon gain. Plant Cell Environ 24:755–767.
Farquhar GD, von Caemmerer S, Berry JA (1980) A biochemical model of photosynthetic CO2 assimilation in leaves of C3 species. Planta 149:78–90.
Ferrar PJ, Slatyer RO, Vranjic JA (1989) Photosynthetic temperature acclimation in Eucalyptus species from diverse habitats, and a com-parison with Nerium oleander. Aust J Plant Physiol 16:199–217.
Froux F, Ducrey M, Epron D, Dreyer E (2004) Seasonal variations and acclimation potential of the thermostability of photochemistry in four Mediterranean conifers. Ann For Sci 61:235–241.
Genty B, Briantais JM, Baker NR (1989) The relationship between the quantum yield of photosynthetic electron transport and quenching of chlorophyll fluorescence. Biochim Biophys Acta 990:87–92.
Ghannoum O, Way DA (2011) On the role of ecological adaptation and geographic distribution in the response of trees to climate change. Tree Physiol 31:1273–1276.
Ghannoum O, Phillips NG, Sears MA, Logan BA, Lewis JD, Conroy JP, Tissue DT (2010) Photosynthetic responses of two eucalypts to industrial-age changes in atmospheric [CO2] and temperature. Plant Cell Environ 33:1671–1681.
Grassi G, Vicinelli E, Ponti F, Cantoni L, Magnani F (2005) Seasonal and interannual variability of photosynthetic capacity in relation to leaf nitrogen in a deciduous forest plantation in northern Italy. Tree Physiol 25:349–360.
Harley P, Sharkey T (1991) An improved model of C3 photosynthesis at high CO2: Reversed O2 sensitivity explained by lack of glycerate reentry into the chloroplast. Photosynth Res 27:169–178.
Héroult A, Lin Y-S, Bourne A, Medlyn BE, Ellsworth DS (2013) Optimal stomatal conductance in relation to photosynthesis in climatically contrasting Eucalyptus species under drought. Plant Cell Environ 36:262–274.
Hikosaka K (1997) Modelling optimal temperature acclimation of the photosynthetic apparatus in C3 plants with respect to nitrogen use. Ann Bot 80:721–730.
Hikosaka K (2004) Interspecific difference in the photosynthesis-nitrogen relationship: patterns, physiological causes, and ecological importance. J Plant Res 117:481–494.
Hikosaka K, Murakami A, Hirose T (1999) Balancing carboxylation and regeneration of ribulose-1,5-bisphosphate in leaf photosynthesis:
804 Lin et al.
at National D
ong Hw
a University L
ibrary on April 3, 2014
http://treephys.oxfordjournals.org/D
ownloaded from
Tree Physiology Online at http://www.treephys.oxfordjournals.org
temperature acclimation of an evergreen tree, Quercus myrsinaefolia. Plant Cell Environ 22:841–849.
Hikosaka K, Ishikawa K, Borjigidai A, Muller O, Onoda Y (2006) Temperature acclimation of photosynthesis: mechanisms involved in the changes in temperature dependence of photosynthetic rate. J Exp Bot 57:291–302.
Hikosaka K, Nabeshima E, Hiura T (2007) Seasonal changes in the temperature response of photosynthesis in canopy leaves of Quercus crispula in a cool-temperate forest. Tree Physiol 27:1035–1041.
June T, Evans JR, Farquhar GD (2004) A simple new equation for the reversible temperature dependence of photosynthetic electron transport: a study on soybean leaf. Funct Plant Biol 31:275–283.
Kattge J, Knorr W (2007) Temperature acclimation in a biochemical model of photosynthesis: a reanalysis of data from 36 species. Plant Cell Environ 30:1176–1190.
Kirschbaum MUF, Farquhar GD (1984) Temperature dependence of whole-leaf photosynthesis in Eucalyptus pauciflora Sieb. ex Spreng. Aust J Plant Physiol 11:519–538.
Knight CA, Ackerly DD (2002) An ecological and evolutionary analysis of photosynthetic thermotolerance using the temperature-depen-dent increase in fluorescence. Oecologia 130:505–514.
Krall JP, Edwards GE (1992) Relationship between photosystem II activity and CO2 fixation in leaves. Physiol Plant 86:180–187.
Larigauderie A, Körner C (1995) Acclimation of leaf dark respiration to temperature in alpine and lowland plant species. Ann Bot 76:245–252.
Leuning R (1990) Modeling stomatal behavior and photosynthesis of Eucalyptus grandis. Aust J Plant Physiol 17:159–175.
LI-Cor I (2008) Using the LI-6400/LI-6400XT portable photosynthe-sis system, 6th edn. Li-Cor, Inc., Lincoln, NE.
Lin Y-S, Medlyn BE, Ellsworth DS (2012) Temperature responses of leaf net photosynthesis: the role of component processes. Tree Physiol 32:219–231.
Llorens L, Peñuelas J, Estiarte M (2003) Ecophysiological responses of two Mediterranean shrubs, Erica multiflora and Globularia alypum, to experimentally drier and warmer conditions. Physiol Plant 119:231–243.
Long SP, Bernacchi CJ (2003) Gas exchange measurements, what can they tell us about the underlying limitations to photosynthesis? Procedures and sources of error. J Exp Bot 54:2393–2401.
Medlyn BE, Dreyer E, Ellsworth D et al. (2002a) Temperature response of parameters of a biochemically based model of photosynthesis. II. A review of experimental data. Plant Cell Environ 25:1167–1179.
Medlyn BE, Loustau D, Delzon S (2002b) Temperature response of parameters of a biochemically based model of photosynthesis. I. Seasonal changes in mature maritime pine (Pinus pinaster Ait.). Plant Cell Environ 25:1155–1165.
Medlyn BE, Duursma RA, Zeppel MJB (2011) Forest productivity under climate change: a checklist for evaluating model studies. WIREs Clim Chang 2:332–355.
Melillo JM, McGuire AD, Kicklighter DW, Moore B III, Vorosmarty CJ, Schloss AL (1993) Global climate change and terrestrial net primary production. Nature 363:234–240.
Onoda Y, Hikosaka K, Hirose T (2005a) The balance between RuBP carboxylation and RuBP regeneration: a mechanism underlying the interspecific variation in acclimation of photosynthesis to seasonal change in temperature. Funct Plant Biol 32:903–910.
Onoda Y, Hikosaka K, Hirose T (2005b) Seasonal change in the bal-ance between capacities of RuBP carboxylation and RuBP regenera-tion affects CO2 response of photosynthesis in Polygonum cuspidatum. J Exp Bot 56:755–763.
Ow LF, Whitehead D, Walcroft AS, Turnbull MH (2008) Thermal accli-mation of respiration but not photosynthesis in Pinus radiata. Funct Plant Biol 35:448–461.
Ow LF, Whitehead D, Walcroft AS, Turnbull MH (2010) Seasonal varia-tion in foliar carbon exchange in Pinus radiata and Populus deltoides: respiration acclimates fully to changes in temperature but photosyn-thesis does not. Glob Chang Biol 16:288–302.
Reich PB, Walters MB, Ellsworth DS (1991) Leaf age and season influ-ence the relationships between leaf nitrogen, leaf mass per area and photosynthesis in maple and oak trees. Plant Cell Environ 14:251–259.
Reich PB, Wright IJ, Cavender-Bares J, Craine JM, Oleksyn J, Westoby M, Walters MB (2003) The evolution of plant functional variation: traits, spectra, and strategies. Int J Plant Sci 164:S143–S164.
Sage RF, Kubien DS (2007) The temperature response of C3 and C4 photosynthesis. Plant Cell Environ 30:1086–1106.
Sharkey TD, Bernacchi CJ, Farquhar GD, Singsaas EL (2007) Fitting photosynthetic carbon dioxide response curves for C3 leaves. Plant Cell Environ 30:1035–1040.
Sitch S, Smith B, Prentice IC et al. (2003) Evaluation of ecosystem dynamics, plant geography and terrestrial carbon cycling in the LPJ dynamic global vegetation model. Glob Chang Biol 9:161–185.
Slatyer RO (1977a) Altitudinal variation in the photosynthetic charac-teristics of snow gum, Eucalyptus pauciflora Sieb. ex Spreng. III. Temperature response of material grown in contrasting thermal environments. Aust J Plant Physiol 301–312.
Slatyer RO (1977b) Altitudinal variation in the photosynthetic charac-teristics of snow gum, Eucalyptus pauciflora Sieb. ex Spreng. IV. Temperature response of four populations grown at different tem-peratures. Aust J Plant Physiol 583–594.
Slatyer RO (1978) Altitudinal variation in the photosynthetic character-istics of snow gum, Eucalyptus pauciflora Sieb. ex Spreng. VII. Relationship between gradients of field temperature and photosyn-thetic temperature optima in the Snowy Mountain area. Aust J Bot 111–121.
Slatyer RO, Ferrar PJ (1977) Altitudinal variation in the photosynthetic characteristics of snow gum, Eucalyptus pauciflora Sieb. ex Spreng. II. Effects of growth temperature under controlled conditions. Aust J Plant Physiol 289–299.
Slatyer RO, Morrow PA (1977) Altitudinal variation in the photosyn-thetic characteristics of snow gum, Eucalyptus pauciflora Sieb. ex Spreng. I. Seasonal changes under field conditions in the Snowy Mountains area of south-eastern Australia. Aust J Bot 25:1–20.
Smith B, Prentice IC, Sykes MT (2001) Representation of vegetation dynamics in the modelling of terrestrial ecosystems: comparing two contrasting approaches within European climate space. Glob Ecol Biogeogr 10:621–637.
Tjoelker MG, Oleksyn J, Reich PB (2001) Modelling respiration of veg-etation: evidence for a general temperature-dependent Q10. Glob Chang Biol 7:223–230.
Warren CR (2008) Does growth temperature affect the temperature responses of photosynthesis and internal conductance to CO2? A test with Eucalyptus regnans. Tree Physiol 28:11–19.
Way DA, Oren R (2010) Differential responses to changes in growth temperature between trees from different functional groups and biomes: a review and synthesis of data. Tree Physiol 30:669–688.
Wilson KB, Baldocchi DD, Hanson PJ (2000) Spatial and seasonal vari-ability of photosynthetic parameters and their relationship to leaf nitrogen in a deciduous forest. Tree Physiol 20:565–578.
Wright IJ, Reich PB, Westoby M (2001) Strategy shifts in leaf physiology, structure and nutrient content between species of high- and low-rain-fall and high- and low-nutrient habitats. Funct Ecol 15:423–434.
Wright IJ, Reich PB, Westoby M (2003) Least-cost input mixtures of water and nitrogen for photosynthesis. Am Nat 161:98–111.
Wullschleger SD (1993) Biochemical limitations to carbon assimilation in C3 plants—a retrospective analysis of the A/Ci curves from 109 species. J Exp Bot 44:907–920.
Temperature acclimation of Eucalyptus photosynthesis 805
at National D
ong Hw
a University L
ibrary on April 3, 2014
http://treephys.oxfordjournals.org/D
ownloaded from

Tree Physiology Volume 33, 2013
Yamori W, Noguchi K, Terashima I (2005) Temperature acclimation of photosynthesis in spinach leaves: analyses of photosynthetic components and temperature dependencies of photosynthetic par-tial reactions. Plant Cell Environ 28:536–547.
Yamori W, Noguchi K, Hikosaka K, Terashima I (2010) Phenotypic plasticity in photosynthetic temperature acclimation among crop
species with different cold tolerances. Plant Physiol 152:388–399.
Zhu X-G, de Sturler E, Long SP (2007) Optimizing the distribution of resources between enzymes of carbon metabolism can dramatically increase photosynthetic rate: a numerical simulation using an evolu-tionary algorithm. Plant Physiol 145:513–526.
806 Lin et al.
at National D
ong Hw
a University L
ibrary on April 3, 2014
http://treephys.oxfordjournals.org/D
ownloaded from