Embed Size (px)
Citation preview
Biocompatibility and Microstructural
Characterization of PVD Coated and Nitrogen
Implanted Co-Cr Alloy
By
Uğur TÜRKAN
A Dissertation Submitted to the
Graduate School in Partial Fullfilment of the
Requirementd for the Degree of
MASTER OF SCIENCE
Department: Materials Science and Engineering
Major: Materials Science
İzmir Institute of Technology
İzmir, Turkey
September, 2004
We approve the thesis of Uğur TÜRKAN
Date of Signature
………………………………..
Assoc. Prof. Dr. Orhan ÖZTÜRK Supervisor Department of Physics
17.09.2004
……………………………......
Assoc. Prof. Dr. Ahmet E. EROĞLU Co-Supervisor Department of Chemistry
17.09.2004
………………………………..
Prof. Dr. Muhsin ÇİFTÇİOĞLU Department of Chemical Engineering
17.09.2004
………………………………..
Assoc. Prof. Dr. Funda TIHMINLIOĞLU Department of Chemical Engineering
17.09.2004
………………………………..
Assist. Prof. Dr. M. Dinçer BİLGİN Adnan Menderes University, Department of Biophysics
17.09.2004
………………………………..
Prof. Dr. Muhsin ÇİFTÇİOĞLU Head of Department
17.09.2004
ACKNOWLEDGMENTS
It has been a privilege to have been educated by my advisor, Assoc. Prof. Orhan
Öztürk. I would like to extend my utmost appreciation to him, for his valuable advice
and guidance, as well as his endless patience without which this thesis would not have
been possible.
I am very grateful to my co-advisor, Assoc. Prof. Ahmet E. Eroğlu, for
suggestions and valuable discussions related to experimental AAS and ICP-OES
analyses data.
I would also like to thank my other co-advisor, Prof. Şebnem Harsa, for her
encouragement and valuable discussions before and after this study.
Prof. Paul Wilbur, Colorado State University, Colorado, USA is acknowledged
for carrying out the nitrogen ion implantation into the CoCrMo samples.
Special thanks go to specialists Mr. Sinan Yılmaz for performing the AAS
analysis, Mrs. Oya Altıngöz for performing the ICP-OES analysis and Mrs. Rukiye
Çiftçioğlu for helping prepare of simulated body fluid and with pH measurements.
I am very thankful to Mr. Alptekin Aydın and Mr. Sinan Çetiner of HIPOKRAT
A.Ş. for providing the medical grade CoCrMo alloy materials and technical help.
I would like to thank Yüzey Teknolojileri Corporation for carrying out the TiN
deposition of the CoCrMo specimens.
I would also like to acknowledge my institution, İzmir Institute of Technology,
for providing me research facilities during my graduate study. The financial support for
this project is provided by İzmir Institute of Technology Research Fund
(2003IYTE/14).
Last but not least, I wish to express my gratitude to my family for their
encouragement support and patience during the course of my studies here at Iztech.
iv
ABSTRACT
In this study, the effectiveness of nitrogen ion implanted and TiN coated layers
on CoCrMo alloy (ISO 5832-12) in preventing metal ion release during in vitro
exposure of these layers to simulated body fluid (SBF) was investigated. The
experimental results clearly show higher levels of cobalt ion release from nitrogen
implanted CoCrMo material surfaces into simulated body fluid as compared to the as-
polished CoCrMo alloy.
The results clearly indicate that nitrogen ion implantation used for modification
of fcc CoCrMo alloy surfaces lead to the development of various near surface
microstructures. Nitrogen ion implantation was carried out at 60 and 30 keV ion
energies with the corresponding current densities of 0.1 and 0.2 mA/cm2, respectively,
for the substrate temperatures of 100, 200 and 400 °C and implantation time of 30
minutes. Near surface crystal structures and phases, nitrogen ion implanted and TiN
coated layer thicknesses were characterized by a combination of symmetric (-2) and
grazing incidence x-ray diffraction (XRD and GIXRD) and cross-sectional scanning
electron microscopy (SEM). Metal ion release into the simulated body fluid was
analyzed by atomic absorption spectrometry (AAS) and inductively coupled plasma
optical emission spectrometry (ICP-OES).
The experimental XRD results clearly show the formation of a metastable, fcc,
high-N phase (N) in mainly fcc CoCrMo alloy for the ion beam conditions at 400 °C.
The lower implantation temperatures, 100 and 200 °C, for both 60 and 30 keV ion
energies, result in a nitride phase, (Co, Cr, Mo)2+xN. The cross sectional SEM results for
the specimens implanted at the 60 and 30 keV ion energies at 400 °C reveal quite
clearly the uniform nature of the N layers. The N layer thicknesses, based on the SEM
data, were found to be 450 and 540 nm for the 60 and 30 keV implanted specimens,
while the (Co, Cr, Mo)2+xN nitride layer has a thickness range from 150 to 250 nm for
the 60 and 30 keV at 100 and 200 °C implantation conditions. The SEM results also
indicate that the (Co, Cr, Mo)2+xN nitride and N phase layers on the CoCrMo alloys
have high etch resistance suggesting enhanced corrosion resistance for the N implanted
specimens compared to the substrate material.
v
The XRD and SEM results for the TiN coated (via PVD) specimens show that
the fcc TiN coatings exhibit (111) preferred orientation and have a coating thickness of
3 µm with a columnar type of growth mode.
The experimental AAS results show that in vitro exposure of the N implanted
layers result in higher levels of cobalt ion release into the SBF than the as-polished
substrate CoCrMo alloy. This was attributed to the rougher surfaces of the N implanted
specimens compared to that of the substrate material (i.e, rougher surface implying a
larger area is available for metal ion release). It was also found that the specimens
implanted at the lower substrate temperatures of 100 and 200 °C have lower levels of
Co ion release compared to those specimens implanted at the substrate temperature of
400 °C. The limited dissolution of cobalt, in this case, was explained by the stronger
bonds of metal-N in the nitride phase than those of N phase. Furthermore, the AAS data
indicate higher cobalt ion release rate for the N implanted specimens compared to the
substrate alloy and suggest transport (diffusion) controlled dissolution reaction
mechanism.
The AAS results show no cobalt ions are released from the TiN coated
specimens (i.e, the release levels were below the analytical detection limit of the AAS
apparatus). This indicates that the TiN coated layer can be an effective barrier for
reducing the metal ion release from the substrate alloy.
The SEM/EDX study of the surface morphologies of the N implanted, TiN
coated and as-polished CoCrMo alloy test specimens after the static immersion test
clearly indicate calcium phosphate formation on the as-polished alloy, while there was
almost no phosphate precipitates on the surface of N implanted and TiN coated
specimens.
While the experimental results show higher levels of cobalt ion release for the N
implanted specimens compared to the substrate material, the overall release levels are
found to be below toxic levels for the human body.
vi
ÖZ
Bu çalışmada, azot implante edilmiş ve TiN kaplanmış CoCrMo (ISO 5832-12)
alaşımının tabakalarını simüle vücut sıvısına maruz bırakarak, bu tabakaların metal iyon
salınımını engellemede ki etkinliği araştırılmıştır. Deneysel sonuçlar, parlatılmış
CoCrMo alaşımına göre azot implante edilen örneklerden simüle vücut sıvısına daha
yüksek seviyede metal iyonu salındığını göstermiştir.
Deneysel sonuçlar, fcc yapıdaki CoCrMo alaşımının yüzeyini modifiye etmede
kullanılan azot iyon implantasyonu yüzeye yakın çeşitli mikroyapıların gelişimine yol
açmıştır. İmplantasyon, 60 ve 30 keV iyon enerjilerinde ve bu enerjilere karşılık gelen
0.1 ve 0.2 mA/cm2 akım yoğunluğunda, 100, 200 ve 400 °C sıcaklıklarda 30 dakika da
gerçekleştirilmiştir. Yüzey kristal yapıları ve fazları, azot iyonu implante edilmiş ve TiN
kaplanmış tabakaların kalınlıkları, simetrik (-2) ve anti simetrik x-ışınları kırınımı ve
elektron mikroskobu ile karakterize edilmiştir. Simüle vücut sıvısı içine salınan metal
iyonları atomik absorpsiyon ve optik emisyon spectrometrisi ile ölçülmüştür.
Deneysel XRD sonuçları, 400 °C implantasyon sıcaklığında fcc CoCrMo
alaşımında yarı kararlı azotça zengin fcc yapıda bir fazın meydana geldiğini
göstermiştir. 100 ve 200 °C implantasyon sıcaklıklarında, her iki iyon enerjisinde, (Co,
Cr, Mo)2+xN nitrür fazı meydana gelmiştir. SEM sonuçları, 60 ve 30 keV enerjilerde
400 °C de implantasyon yapılan örneklerde yüzeyin her yerinde aynı olan N
tabakalarını ortaya çıkarmıştır. 100 ve 200 °C implantasyon koşullarında meydana gelen
(Co, Cr, Mo)2+xN nitrür tabkalarının kalınlığı 150 ile 250 nm arsında olduğu ve 400 °C
de 60 ve 30 keV iyon enerjilerinde implantasyon yapılan örneklerde meydana gelen N
tabakalarının kalınlıkları ise 450 ve 540 nm olduğu SEM sonuçlarına dayanarak
bulunmuştur. Ayrıca, SEM sonuçları azot implante edilen örneklerde meydana gelen N
ve (Co, Cr, Mo)2+xN nitrür tabakalarının azot implante edilmemiş örneklere göre daha
yüksek korozyon ve dağlama dayanımına sahip olduğunu göstermiştir.
TiN kaplanmış örneklerde, XRD ve SEM sonuçları, TiN filminin fcc yapıda
(111) oriyantasyonunda ve yaklaşık olarak 3 µm kalınlığında, sütunsal büyüme
modunda olduğunu göstermiştir.
Deneysel AAS sonuçları, simüle vücut sıvısına maruz bırakılan azot implante
edilmiş tabakaların implantasyon yapılmayan örneklere göre daha yüksek seviyede
kobalt iyonu salınımına yol açtığını göstermiştir. Bu sonuç azot implante edilen
vii
örneklerin yüzeylerinin implantasyon yapılmayan örneklerin yüzeylerine göre daha
pürüzlü yüzeylere sahip olmasına dayandırılmıştır (pürüzlü yüzey metal iyon salınımı
için daha büyük yüzey alanına olanak sağlar). 100 ve 200 °C de azot implante edilen
örneklerin 400 °C de implantasyon yapılan örneklere göre daha düşük seviyede kobalt
iyonu salınımına sahip olduğu bulunmuştur. Bu durumda, kısıtlı kobalt iyon salınımı,
nitrür fazında ki metal-azot bağlarının N fazında ki metal-azot bağına göre daha güçlü
olması ile açıklanmıştır. Ayrıca, AAS sonuçları azot implante edilmiş örneklerin
implantasyon yapılmayan örneklere göre daha yüksek kobalt iyon salınım oranına sahip
olduklarını ve difüzyon kontrollü salınım mekanizması reaksiyonlarının olduğunu
göstermiştir.
AAS sonuçları TiN kaplanmış örneklerden kobalt iyon salınımı olmadığını
göstermiştir (salınım seviyesi AAS aletinin limit değerinin altındadır). Bu sonuç TiN
tabakalarının parlatılmış malzemeden metal iyon salınımını engellemede etkili bir engel
olduğunu göstermiştir.
Azot implante edilmiş, TiN kaplanmış ve parlatılmış CoCrMo örneklerinin statik
daldırma testinden sonra yapılan SEM/EDX ile yapılan yüzey morfoloji çalışmaları
sadece parlatılmış CoCrMo alaşımının yüzeyinde kalsiyum fosfatın meydana geldiğini
göstermiştir.
Deneysel sonuçlar, azot implante edilen örneklerin implante olmamış örneklere
göre daha yüksek seviyede kobalt iyon salınımına yol açtığını göstermesine rağmen,
tüm salınım seviyeleri vücut için toksik olarak bilinen seviyenin altında olduğu
bulunmuştur.
viii
TABLE OF CONTENTS
LIST OF FIGURES…………………………………………….…………......………...X
LIST OF TABLES……………………………………..…………………………......XIII
Chapter 1 INTRODUCTION……………………………………………………..........1
1.1 General Background ............................................................................................... 1
1.2 Metal Ion Release Issue .......................................................................................... 2
1.3 Nitrogen Ion Implantation ...................................................................................... 5
1.4 Physical Vapor Deposition Coating ........................................................................ 8
1.5 Purpose of This Work ............................................................................................. 9
Chapter 2 EXPERIMENTAL METHODS ..................................................................... 11
2.1. Nitrogen Ion Implantation ................................................................................... 11
2.2. PVD Coating ........................................................................................................ 12
2.3 Microstructural Characterization .......................................................................... 13
2.3.1 XRD Analysis ................................................................................................ 13
2.3.1.1 Bragg-Brentano Method (/2) .................................................................. 14
2.3.1.2 Grazing Incidence X-Ray Method ......................................................... 15
2.3.1.3 XRD Composition-Depth Analysis ............................................................ 15
2.3.2 Cross-Sectional SEM Analysis ...................................................................... 17
2.4 Static Immersion Test ........................................................................................... 18
2.5 Preparation of Simulated Body Fluid (SBF) ......................................................... 19
2.6 Ion Release Detection Method .............................................................................. 20
2.6.1 Electrothermal (Graphite Furnace) Atomic Absorption Spectroscopy .......... 20
2.6.2 Inductively Coupled Plasma Optical Emission Spectroscopy ....................... 24
Chapter 3 IMPLANTATION AND COATING INDUCED PHASES .......................... 25
3.1 Nitrogen Implantation Induced Phases ................................................................. 25
3.1.1 XRD Results .................................................................................................. 25
3.2 Coating Induced Phases ........................................................................................ 33
3.2.1 XRD Results .................................................................................................. 33
ix
Chapter 4 CROSS-SECTIONAL SEM ANALYSIS ...................................................... 36
4.1 Nitrogen Implanted Specimens ............................................................................. 36
4.2 TiN Coated Specimen ........................................................................................... 45
Chapter 5 METAL ION RELEASE DETECTION RESULTS ...................................... 49
5.1 AAS and ICP-OES Results ................................................................................... 49
5.1.1 Nitrogen Ion Implanted Specimens ............................................................... 49
5.1.2 Epoxy Coated Specimens ............................................................................ 55
5.1.3 TiN Coated Specimens .................................................................................. 55
5.1.4 pH Variation During The Immersion Test ..................................................... 56
5.2 Discussion ............................................................................................................. 57
5.2.1 Nitrogen Implanted Specimens ...................................................................... 57
5.2.2 TiN Coated Specimens .................................................................................. 61
5.2.3 Metal Ion Release Levels ............................................................................... 62
Chapter 6 SEM ANALYSIS AFTER THE IMMERSION TEST .................................. 64
Chapter 7 SUMMARY AND CONCLUSIONS ............................................................ 75
7.1 Summary and Discussion ...................................................................................... 75
7.2 Conclusions ........................................................................................................... 78
7.3 Future Work .......................................................................................................... 79
REFERENCES…………………………………………………………………………80 APPENDIX…………………………………………………………………………….84
x
LIST OF FIGURES
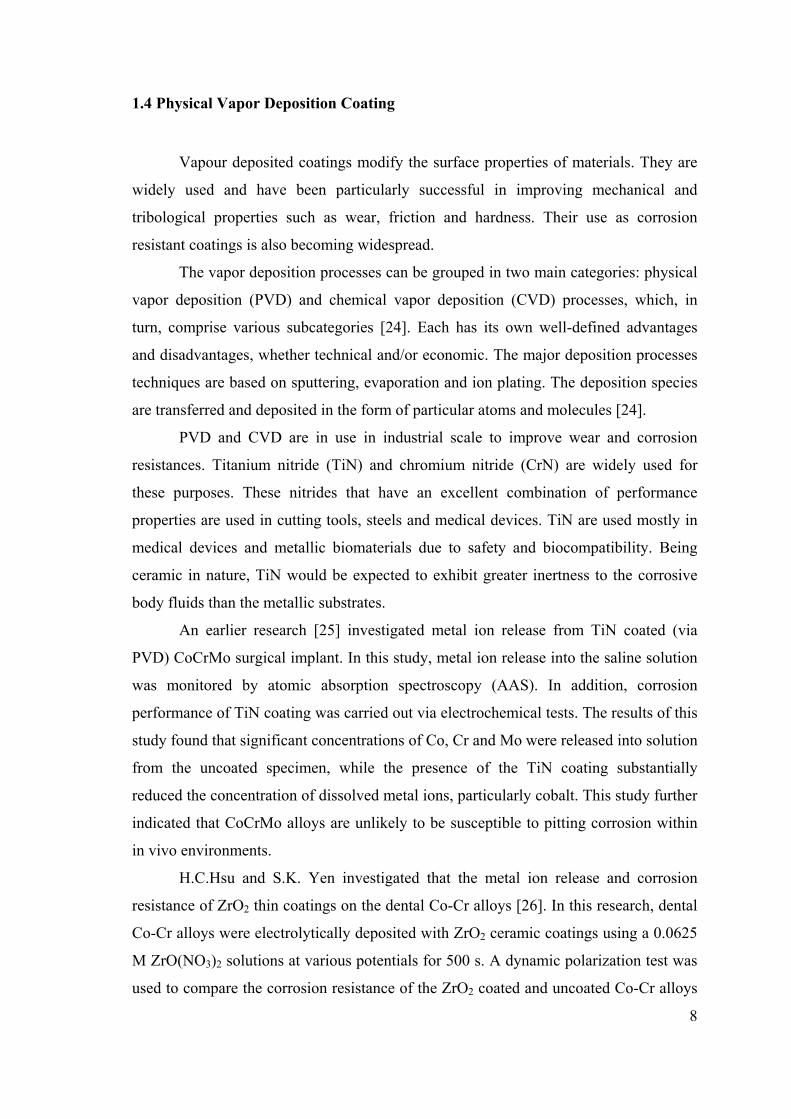
Figure 1.1. Various components of a total hip joint prosthesis. The picture on the left
represents an actual hip implant fabricated from CoCrMo alloy…………... 1
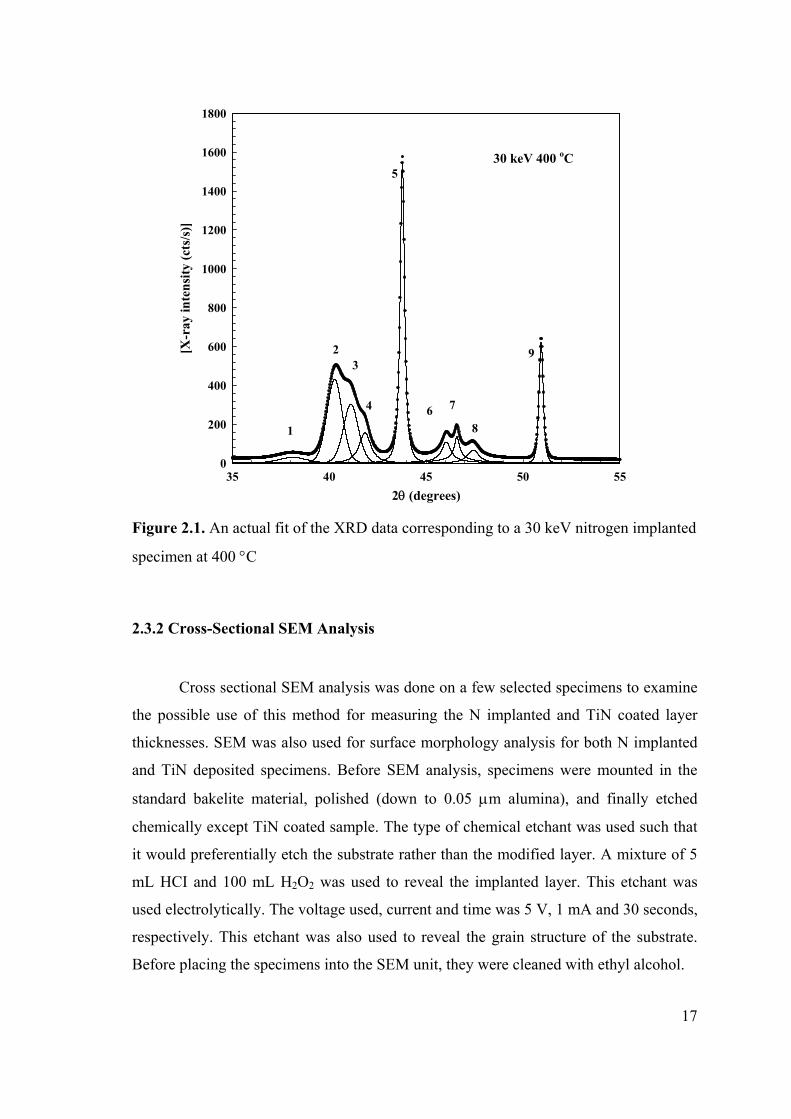
Figure 2.1. An actual fit of the XRD data corresponding to a 30 keV nitrogen
implanted specimen at 400 C……………………………………………... 17
Figure 2.2.Typical calibration graphs for aqueous and matrix-matched standards for
Co…………………………………………………………………………... 21
Figure 2.3. Standard calibrations graph for cobalt determination…………………….. 23
Figure 3.1. XRD patterns of as-polished (the substrate) and nitrogen implanted
specimens at 60 keV 0.1 mA/cm2 implantation conditions at substrate
temperature of 100, 200 and 400 C nitrogen implanted samples. refers
to (Co, Cr, Mo)2+xN phase……………………………………………….... 26
Figure 3.2. XRD patterns of as-polished (the substrate) and nitrogen implanted
specimens at 30 keV 0.2 mA/cm2 implantation conditions at substrate
temperature of 100, 200 and 400 C nitrogen implanted samples. refers
to (Co, Cr, Mo)2+xN phase………………………………………………… 27
Figure 3.3. GIXRD patterns of nitrogen implanted specimens at 60 keV 0.1 mA/cm2
implantation conditions at substrate temperature of 100, 200 and 400 C
nitrogen implanted samples. refers to (Co, Cr, Mo)2+xN phase. 30
Figure 3.4. GIXRD patterns of nitrogen implanted specimens at 30 keV 0.2 mA/cm2
implantation conditions at substrate temperature of 100, 200 and 400 C
nitrogen implanted samples. refers to (Co, Cr, Mo)2+xN phase…………. 31
Figure 3.5. XRD patterns of as-polished and TiN coated CoCrMo alloy……………... 34
Figure 4.1. Cross-sectional SEM data for the substrate grain structures. The lower
photomicrograph with a higher magnification of the same region………… 37
Figure 4.2. Cross-sectional SEM data for the specimen nitrogen implanted at 60 keV
at 100 C. The upper photomicrograph with higher magnification of the
same region……………………………………………………………….... 38
Figure 4.3. Cross-sectional SEM data for the specimen nitrogen implanted at 60 keV
at 200 C. The upper photomicrograph with higher magnification of the
same region……………………………………………………………….... 39
xi
Figure 4.4. Cross-sectional SEM data for the nitrogen implanted specimen 60 keV at
400 C. The upper photomicrograph with higher magnification of the
same region………………………………………………………………… 41
Figure 4.5. Cross-sectional SEM data for the specimen nitrogen implanted at 30 keV
at 100 °C. The upper photomicrograph with higher magnification of the
same region………………………………………………………………… 42
Figure 4.6. Cross-sectional SEM data for the specimen nitrogen implanted at30 keV
at 200 °C. The upper photomicrograph with higher magnification of the
same region………………………………………………………………… 43
Figure 4.7. Cross-sectional SEM data for the specimen nitrogen implanted at 30 keV
at 400 °C. The upper photomicrograph with higher magnification of the
same region……………………………………………………………….... 44
Figure 4.8. Cross sectional SEM data for the TiN coated specimen. The lower picture
with lower magnification and was using SEM in transmission light
detector SEM mode (TLD)………………………………………………… 46
Figure 4.9. Surface morphology of the TiN coated specimen. The lower picture
shows the porous structure of the TiN film………………………………... 47
Figure 5.1. Quantity of cobalt ion release into the SBF from the specimens implanted
at 60 keV (a) 100 (b) 200 (c) 400 °C………………………………………. 50
Figure 5.2. Quantity of cobalt ion release into the SBF from the specimens implanted
at 30 keV (a) 100 (b) 200 (c) 400 °C………………………………………. 51
Figure 6.1. SEM photomicrographs taken from the as-polished specimen after the
immersion test……………………………………………………………… 65
Figure 6.2. SEM photomicrographs (a) before and (b, c) after the immersion test
taken from 60 keV at 100 °C N ion implanted specimen………………….. 67
Figure 6.3. SEM photomicrographs (a) before and (b, c) after the immersion test
taken from 60 keV at 200 °C N ion implanted specimen………………….. 68
Figure 6.4. SEM photomicrographs (a) before and (b, c) after the immersion test
taken from 60 keV at 400 °C N ion implanted specimen………………….. 69
Figure 6.5. SEM photomicrographs (a) before and (b, c) after the immersion test
taken from 30 keV at 100 °C N ion implanted specimen………………….. 70
Figure 6.6. SEM photomicrographs (a) before and (b) after the immersion test taken
from 30 keV at 200 °C N ion implanted specimen………………………… 71

xii
Figure 6.7. SEM photomicrographs (a) before and (b) after the immersion test taken
from 30 keV at 400 °C N ion implanted specimen………………………… 72
Figure 6.8. SEM photomicrographs (a) before and (b, c) after the immersion test
taken from TiN coated specimen…………………………………………... 73
xiii
LIST OF TABLES Table 2.1. Range of operating conditions for the ion implanter used in this study ....... 11
Table 2.2. Nitrogen implantation conditions. A total of 16 samples were nitrogen
implanted. ..................................................................................................... 12
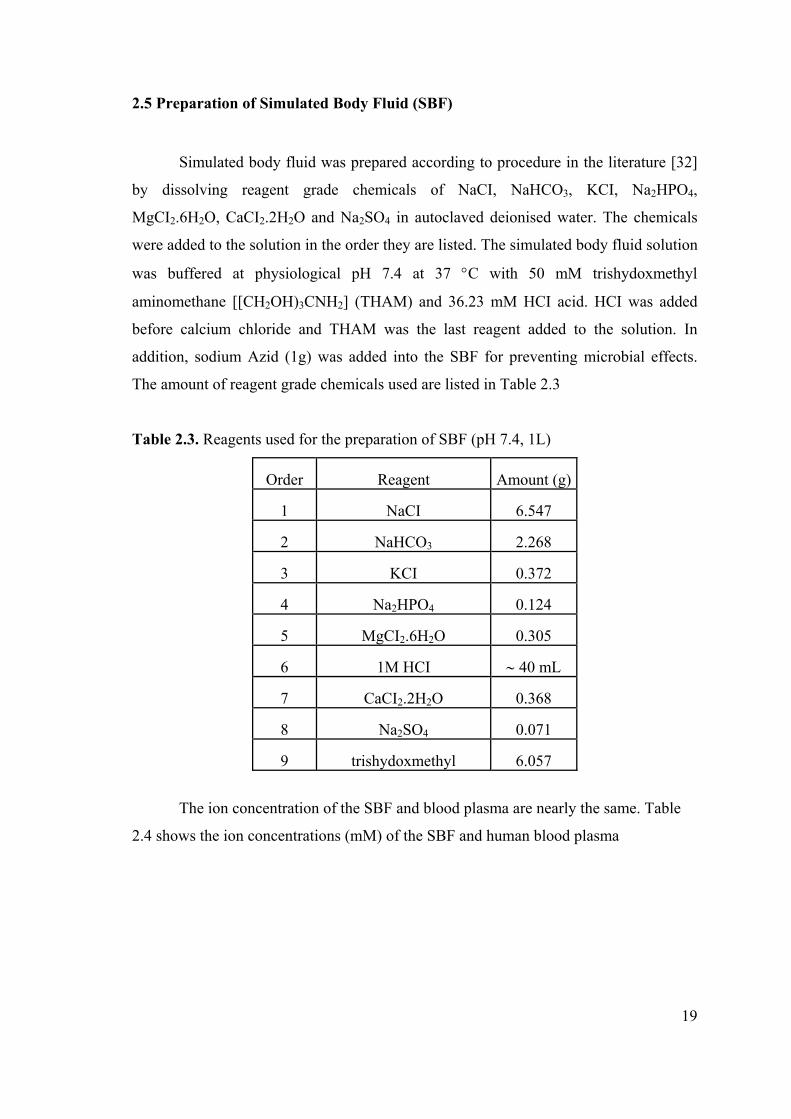
Table 2.3. Reagents used for the preparation of SBF (pH 7.4, 1L) ............................... 19
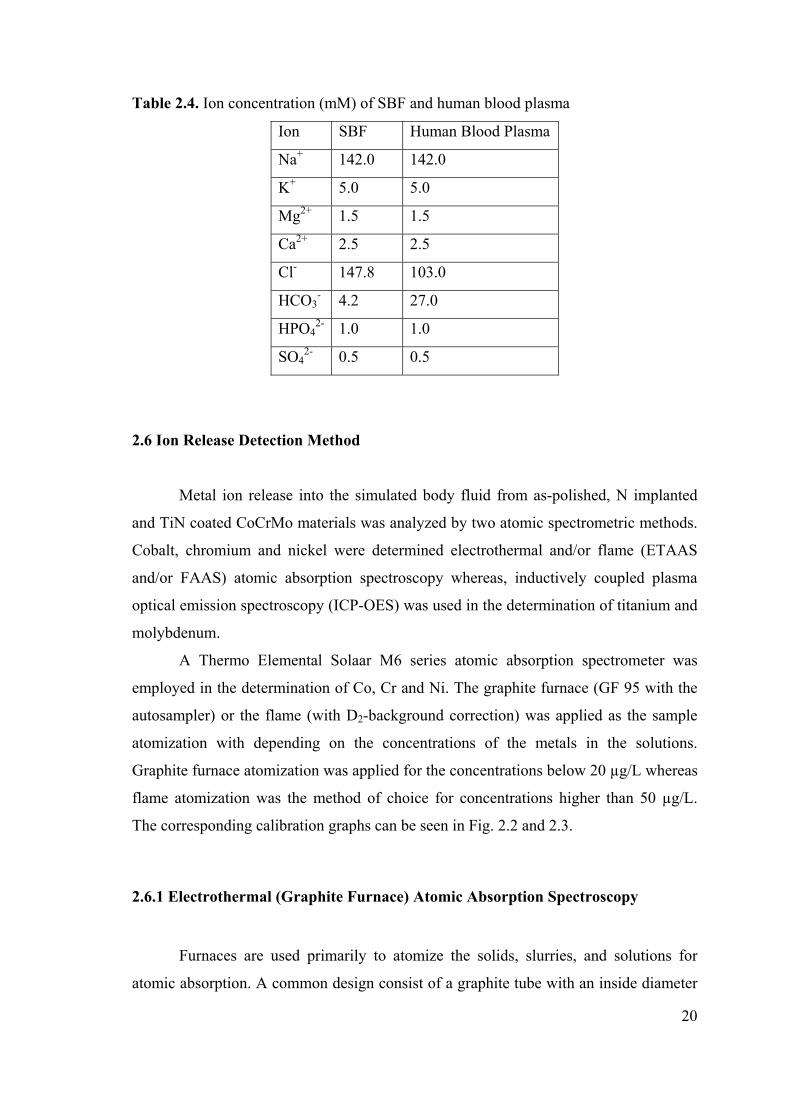
Table 2.4. Ion concentration (mM) of SBF and human blood plasma ........................... 20
Table 2.5. The temperature program for GFAAS for Cobalt ......................................... 22
Table 2.6. The temperature program for GFAAS for Chromium. ................................. 22
Table 2.7. The temperature program for GFAAS for Nickel. ........................................ 22
Table 3.1. XRD layer thicknesses based on (200) and (111) orientations. And also
TRIM calculations (Rp) ................................................................................. 28
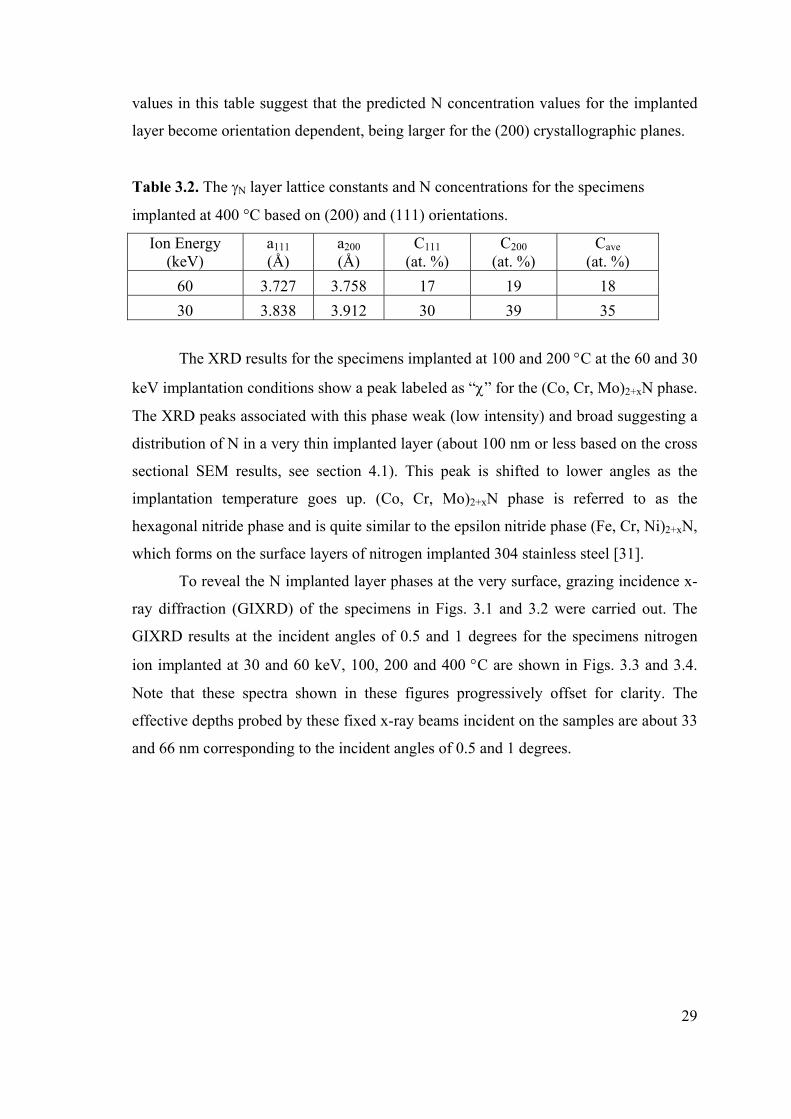
Table 3.2. The N layer lattice constants and N concentrations for the specimens
implanted at 400 °C based on (200) and (111) orientations. ........................ 29
Table 4.1. N implanted layer thicknesses based on XRD and SEM with implanted layer
phases. ........................................................................................................... 45
Table 4.2. EDX results from TİN coated specimen. ...................................................... 48
Table 5.1. The quantity of cobalt released from all the test specimens in units of µg/L.
The values in parentheses show the parallel of the same sample. * indicates
values under detection limit. ......................................................................... 54
Table 5.2. The pH values of all the test specimens during the immersion test. The
values in parentheses show the parallel of the same sample. ....................... 57
Table 6.1. EDX results after static immersion test taken from all the test specimens. .. 64
CHAPTER 1
INTRODUCTION
1.1 General Background
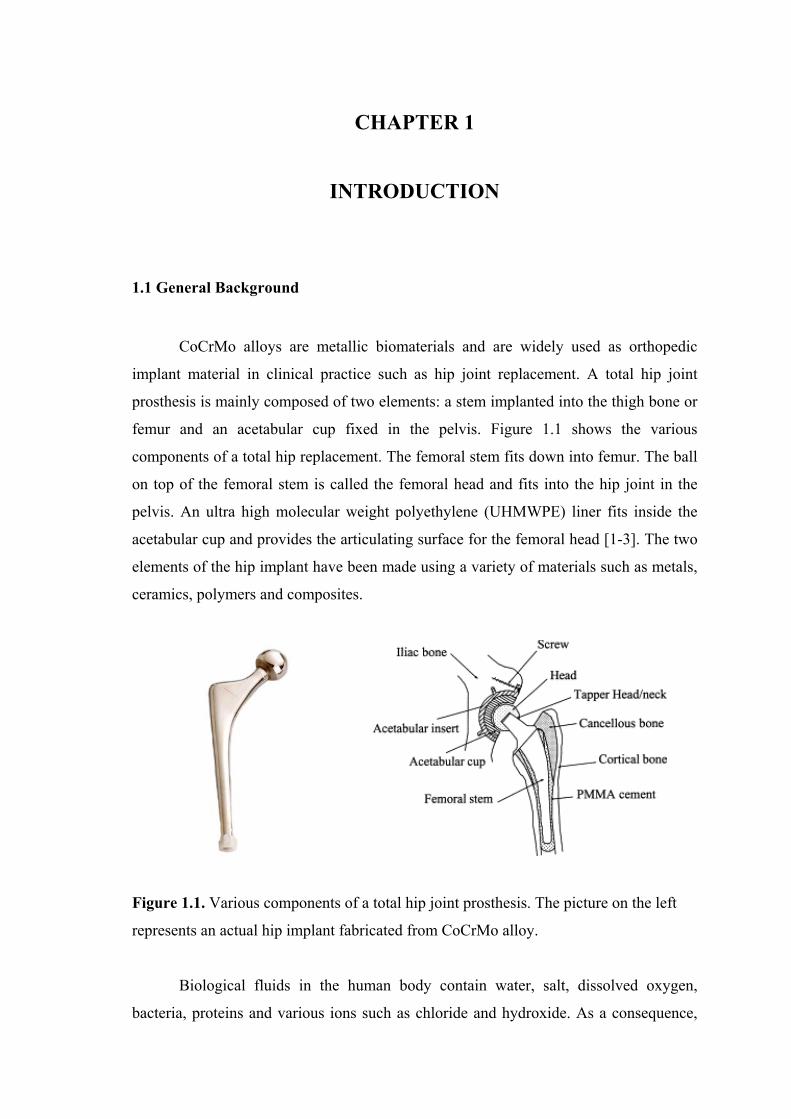
CoCrMo alloys are metallic biomaterials and are widely used as orthopedic
implant material in clinical practice such as hip joint replacement. A total hip joint
prosthesis is mainly composed of two elements: a stem implanted into the thigh bone or
femur and an acetabular cup fixed in the pelvis. Figure 1.1 shows the various
components of a total hip replacement. The femoral stem fits down into femur. The ball
on top of the femoral stem is called the femoral head and fits into the hip joint in the
pelvis. An ultra high molecular weight polyethylene (UHMWPE) liner fits inside the
acetabular cup and provides the articulating surface for the femoral head [1-3]. The two
elements of the hip implant have been made using a variety of materials such as metals,
ceramics, polymers and composites.
Figure 1.1. Various components of a total hip joint prosthesis. The picture on the left
represents an actual hip implant fabricated from CoCrMo alloy.
Biological fluids in the human body contain water, salt, dissolved oxygen,
bacteria, proteins and various ions such as chloride and hydroxide. As a consequence,
2
the human body is a very aggressive environment for metals or any other materials if we
want to use them as biomaterials. An ideal material or material combination, therefore,
should have the following characteristics: a biocompatible chemical composition to
avoid adverse tissue reaction, an excellent resistance to corrosion (degradation) in the
human body environment, acceptable strength to sustain the cyclic loading endured by
the joint, a low modulus to minimize bone resorption and a high wear resistance to
minimize the wear debris generation [2, 3].
CoCrMo alloys satisfy most of these characteristics and are considered as highly
biocompatible materials. A material affecting the equilibrium of the body as little as
possible is defined as a biocompatible material. In other words, the material causes no
toxic or allergic inflammatory response when the material is placed in vivo. Also, the
material must not stimulate changes in plasma proteins and enzymes or cause
immunological reaction, nor should it lead to carcinogenic or mutagenic effects.
The biocompatibility of CoCrMo alloy is closely related to this materials
excellent corrosion resistance due to the presence of an extremely thin passive oxide
film that spontaneously forms on the alloy surface. On exposure to air, an oxide layer is
formed spontaneously on the surface of CoCrMo alloy. XPS analysis reveals that its
composition is predominantly Cr2O3 oxide with some minor contribution from Co and
Mo oxide [4]. The calculated thickness is 1.8 nm. These films also form on the surfaces
of other metallic biomaterials (stainless steels, titanium and its alloys) and serve as a
barrier to corrosion processes in alloy systems that would otherwise experience very
high corrosion rates. In other words, in the absence of passive films, the driving force
for corrosion of metallic orthopedic implant alloys is very high, and corrosion rates
would also be high. The integrity of these films has been strongly correlated to the
chemical and mechanical stability of orthopedic implants.
1.2 Metal Ion Release Issue
In spite of CoCrMo alloy’s excellent corrosion resistance, there is still a concern
about metal ion release from orthopedic implants into the body fluids (serum, urine,
etc). Implant components fabricated from Co-Cr based alloys have been reported to
produce elevated Co, Cr, and Ni concentrations in body fluids [5, 6]. Significantly
3
elevated metal concentrations in body fluids of patients with Co-Cr alloy metal-on-
metal bearing implants are reported [5, 7].
Metals from orthopedic implant materials are released into surrounding tissue by
various processes, including corrosion, wear and mechanically accelerated
electrochemical processes such as stress corrosion, corrosion fatigue and fretting
corrosion [5]. Such metal ions and wear debris, concentrated at the implant- tissue
interface, may migrate through the tissue. Recent research [5] shows that the metal
release is associated with clinical implant failure, osteolysis, cutaneous allergic
reactions and remote site accumulation.
Reactions between the surface of metallic materials and living tissues occur
immediately after these materials are implanted into the human body. The surface oxide
film of the Co-Cr alloy consists of oxides of chromium and cobalt. The corrosion of
cobalt-chromium alloys in neutral or acidic solutions is found to proceed by selective
dissolution of cobalt [9]. It is found that the oxide film inhibits the dissolution of metal
ions but is not always stable in the human body. Studies show that the composition of
the surface oxide film changes even though the film is macroscopically stable.
Immersion in simulated body fluids of metallic materials and surface analysis of
materials are the simplest techniques to characterize the change in the composition and
structure of the surface oxide film in the human body. A surface chemistry study [8, 10]
(via XPS) of the surface oxide films formed on CoCrMo alloy during immersion in
various simulated biological environments, Hank’s solution, cell culture medium and
incubation with cultured cells found that the surface oxide film on CoCrMo alloy
polished mechanically in de-ionized water consisted of oxides of cobalt and chromium
with a small amount of molybdenum, and its thickness was about 2.5 nm. It was found
that the surface film contained a large amount of OH-, i.e. the oxide was highly hydrated
or oxyhydroxized. Furthermore, this study found that during immersion in Hank’s
solution and culture medium and cell culture, cobalt dissolved from the film, and
surface oxide film consists of chromium containing a small amount of molybdenum. In
other words, the surface oxide film is reconstructed in living tissue.
Also, on exposure of the alloy to a body environment, the properties of the
passive film may change with time. For example, ions present in the electrolyte solution
could adsorb onto the passive film, react with it, or could catalyze a selective
dissolution of a specific component species of the passive film. Studies performed on Ti
4
and its biocompatible alloys Ti-6Al-4V and Ti-6Al-7Nb show that on exposure to bio-
simulated electrolyte solutions, the passive oxide film selectively interacts with
phosphate and calcium ions and that the titanium oxide surface favors the nucleation of
calcium phosphates on its surface, which in turn makes it more protective towards
corrosion [10].
It is also found that corrosion resistance is reduced under the wear condition
compared with the static condition in vitro. Metal release from implanted prostheses is
accelerated by biomechanical breakdown of oxide films by fretting wear (resulting from
mechanical loading), fracture due to scratches, dents and micromotion between
implanted components and bone by loading or joint function, as well as effects of
complex environmental factors (i,e, varying pH’s). In an aqueous environment, oxide
fracture produces oxide particles and exposes the reactive base alloy to water.
Subsequent electrochemical events (oxidation) result in dissolution of the base alloy
(producing metal ions) and reformation of the oxide film (repassivation). During cyclic
loading fretting of the contacting surfaces and corrosion continue and this can lead to
the release of large quantities of metal ion and oxide particles [11].
The toxic effects of metals (Ni, Co, Cr, Ti, Al and V) released from orthopedic
implants are well documented [5]. Cr toxicity found to be closely related to its valence
state. Studies indicate that Cr (III) is the actual agent of toxicity and mutagenicity. It is
found that certain amount of Co is toxic in the body and that Co toxicity is strongly dose
related. The toxic effect of Al is significant considering recent reports of the
involvement of Al in Alzheimer’s dementia. V (in Ti-6Al-4V alloy) is considered to be
an essential element in the body, but may become toxic at excessive levels.
The increase in the incidence of allergy, and the necessity for prolonged use
require prosthetic materials having low or neglible ion release, essentially implying
implant with high corrosion resistance. Also, metal ion release may be of even greater
concern due to the growing awareness of the crucial role prolonged in many biological
systems by a variety of elements in trace amounts, and the impact that any disturbance
in this delicate balance could produce.
There are various methods to reduce the release of potentially harmful metal
ions from orthopedic implant materials. One way is to thicken the protective oxide by a
process is known as passivation. The Co-Cr alloys passivates spontaneously in air
resulting in the formation of a thin oxide film containing mainly Cr2O3, with a minor
5
contribution from Co and Mo- oxides. The protective oxide layer can be enhanced by
chemical treatment with hot, concentrated nitric acid, boiling in distilled water or
electrochemically (known as anodisation). In fact, the local company which provided
the CoCrMo alloy materials for this study applies nitric acid treatment to its materials
before they are used as hip joint replacement materials.
An alternative approach to prevent the release of metal ions from CoCrMo
orthopedic implant materials into body tissue is to treat the surfaces of these materials
by various surface modification techniques. Another alternative is to replace the toxic
elements in the alloy with biocompatible elements. This approach was resulted in the
development of new Ti alloys (titanium and its alloys), which are also highly
biocompatible materials and widely used as orthopedic implant materials. For example,
Ti-13Nb-13Zr may have answered the issue of biocompatibility with the exclusive
addition of biocompatible elements Zr and Nb in place for Al and V in Ti-6Al-4V (V is
known to show adverse tissue effects, while Al has been suggested to cause osteolysis
and neural disorders) [3].
The scope of this thesis study falls within the approach related to the surface
modification of CoCrMo alloys. Specifically, it involves surface treatment methods
such as coatings or protective layers, nitrogen ion implantation and plasma ion nitriding
to modify the near surface layers of CoCrMo alloy materials. Coatings or protective
layers act like a physical barrier between the aggressive milieu and the metal to be
protected. The surface treatment approach by nitrogen ion implantation is expected to
result in enhanced corrosion and wear resistances for these alloys and, this in turn, will
result in reduced metal ion release.
1.3 Nitrogen Ion Implantation
A central goal for surface modification is to improve the macroscopic surface
properties such as hardness, wear resistance, corrosion resistance and friction through
careful control of microstructure. Ion implantation is one way to accomplish this. In this
process, a selected atomic species is introduced into the surface layer of a material to a
depth that is in principle determined by the ion energy and the stopping power of target.
Ion implantation was first used in the semiconductor industry to introduce controlled
6
dopants into the semiconductor materials [12, 13]. Its application to metals and alloys
began in the mid seventies. Since then it has been used widely to modify surface
microstructures of these materials [14].
The main advantage associated with ion implantation is that it provides
flexibility in the selection of implantation species and processing parameters (e.g., dose
rate, temperature and ion energy). Its main advantage is the shallowness of the
implanted layer, which is less than 0.1 µm for most commonly, used ion energies (20 to
100 keV). Numerous ion species (both gaseous and metallic) have been implanted into
steels to improve the surface properties as well as to study more fundamental processes
of ion beam interaction with solids. Ion species implanted into various materials have
included N, C, B, Si, Fe, Cr, Ti, and inert ions (Ar, He). Among the gaseous species N
has been studied most extensively due to its abundance in nature and its after observed
ability to improve surface properties.
Nitrogen ion implantation has been successfully applied to metal and polymer
biomaterials [15, 16]. Most artificial joints consist of a metallic component articulating
against polymer. The metallic component is mainly made from either titanium and its
alloys (Ti, Ti-6Al-4V) or cobalt chromium (CoCr) alloys, while the polymer component
is mainly ultra high molecular weight polyethylene (UHMWPE). The main problem
existing in the artificial joints is the prosthetic wear debris which is believed to be the
major reason for aseptic loosening (leading to the implant failure) and failure of
artificial hip joint due to osteolysis [17]. Ti-6Al-4V has generally been found to have a
more detrimental impact on UHMWPE wear than CoCrMo alloys [18]. Wear of joint
prostheses materials unavoidably represents a long-term limitation to the lifetime of a
total joint replacement as accumulation of UHMWPE and to a lesser extent metal or
ceramic wear debris has been associated with prosthetic loosening [15].
Several researchers have utilized the ion beam applications in the medical area
such as for orthopedic prosthesis that require high wear properties, excellent corrosion
resistance and biocompatibility. In one study, the nitrogen ion implanted CoCr femoral
head resulted in significant reduction in polyethylene wear [19]. In another study [17],
the plasma based ion implantation (PBII) technique was used to improve wear
resistance of the metal femoral head. This technique is more suitable for complex
shaped implants such as femoral head and femoral prostheses due to the three
dimensional ion implantation effects. The results of this indicated that the wear
7
resistance of Co-Cr alloy with high nitrogen ion implantation dose was superior to the
untreated CoCr alloy. This research, furthermore, showed that high dose nitrogen ion
implantation process was effective in enhancing corrosion resistance of Co-Cr alloy.
In a recent study [20], orthopedic materials (Ti-6Al-4V and CoCrMo) were
nitrided at temperatures up to 850 °C using a newly developed technique known as high
intensity plasma ion nitriding (HIPIN) in order to enhance life time properties of these
materials. This study using cross-sectional SEM and x-ray diffraction techniques
concluded that increased wear properties, as a consequence of HIPIN processing, could
be related to both the formation of deep nitrided layers and the formation of specific
microstructures at the surface. In the case of the CoCrMo alloys, the specific
microstructure consisted of a metastable, high nitrogen phase between 300 and 600 °C,
while TiN and Ti2N formed in the case of Ti-6Al-4V alloy.
Nitrogen ion implantation into both the cobalt chromium and ultrahigh
molecular weight polyethylene was investigated by J.I. Oñate et al. [21] and it was
concluded that nitrogen ion implantation improved the wear behavior of UHMWPE, by
reducing the formation of polyethylene debris and lessening occurrence of any micro-
delamination.
Ti based alloys are also used as orthopedic implant materials. However, they
have poor wear resistance. Studies indicate that nitrogen ion implantation modify the
surface to produce wear resistant species like nitrides (TiN, Ti2N) other than TiO2 from
the surface. (The oxide film formed on Ti alloy mainly consists of TiO, Ti2O3 and
TiO2.) A study related to the surface modification of Ti-6Al-7Nb alloy with nitrogen ion
showed improvement in corrosion resistance at low ion doses (5x10¹⁶ ions/cm2), while
implantation at high doses (2.5x10¹⁷ ions/cm2) and energy (100 keV) was detrimental
with regard to corrosion point of view [22]. In this investigation (via GIXRD), nitrogen
ions were implanted onto Ti-6Al-7Nb alloy at an ion energy of 70 and 100 keV at ion
doses between 1x10¹⁶ and 3x10¹⁷ ions/ cm2. Then, the N implanted specimens were
subjected to electrochemical study in Ringer’s solution (almost similar to simulated
body fluid used in this study) in order to determine the optimum implanted dose that can
give good corrosion resistance in a simulated body fluid conditions.
8
1.4 Physical Vapor Deposition Coating
Vapour deposited coatings modify the surface properties of materials. They are
widely used and have been particularly successful in improving mechanical and
tribological properties such as wear, friction and hardness. Their use as corrosion
resistant coatings is also becoming widespread.
The vapor deposition processes can be grouped in two main categories: physical
vapor deposition (PVD) and chemical vapor deposition (CVD) processes, which, in
turn, comprise various subcategories [24]. Each has its own well-defined advantages
and disadvantages, whether technical and/or economic. The major deposition processes
techniques are based on sputtering, evaporation and ion plating. The deposition species
are transferred and deposited in the form of particular atoms and molecules [24].
PVD and CVD are in use in industrial scale to improve wear and corrosion
resistances. Titanium nitride (TiN) and chromium nitride (CrN) are widely used for
these purposes. These nitrides that have an excellent combination of performance
properties are used in cutting tools, steels and medical devices. TiN are used mostly in
medical devices and metallic biomaterials due to safety and biocompatibility. Being
ceramic in nature, TiN would be expected to exhibit greater inertness to the corrosive
body fluids than the metallic substrates.
An earlier research [25] investigated metal ion release from TiN coated (via
PVD) CoCrMo surgical implant. In this study, metal ion release into the saline solution
was monitored by atomic absorption spectroscopy (AAS). In addition, corrosion
performance of TiN coating was carried out via electrochemical tests. The results of this
study found that significant concentrations of Co, Cr and Mo were released into solution
from the uncoated specimen, while the presence of the TiN coating substantially
reduced the concentration of dissolved metal ions, particularly cobalt. This study further
indicated that CoCrMo alloys are unlikely to be susceptible to pitting corrosion within
in vivo environments.
H.C.Hsu and S.K. Yen investigated that the metal ion release and corrosion
resistance of ZrO2 thin coatings on the dental Co-Cr alloys [26]. In this research, dental
Co-Cr alloys were electrolytically deposited with ZrO2 ceramic coatings using a 0.0625
M ZrO(NO3)2 solutions at various potentials for 500 s. A dynamic polarization test was
used to compare the corrosion resistance of the ZrO2 coated and uncoated Co-Cr alloys
9
in artificial saliva and the test was applied 10, 30 and 60 minute, respectively. Metal ion
release was detected by graphite furnace atomic absorption spectroscopy (GFAAS). The
results of GFAAS showed that the Co and Cr ion release from the uncoated specimen
increased with increasing the exposure time and amount of cobalt released is greater
than that of chromium. On the other hand, the metal ion release from the ZrO2 coated
specimens is much less than that of the uncoated.
One other ZrO2 coated CoCrMo alloy study [27] reveals a good coating adhesion
on CoCrMo substrate, lower wear loss of UHMWPE and a higher corrosion potential
than the uncoated specimen in Hank’s solution.
Chia-Tze Kao et al. [28] investigated the anticorrosion ability of TiN plating on
an orthodontic metal bracket as well as its biocompatibility. An orthodontic metal
bracket is made from various stainless steel alloys (304, 304L, 316 and 316L). The
plated metal bracket was produced by TiN ion plating method and tested in acidic
artificial saliva (pH = 5.2). The quantity of metal ion release under the immersion
solution was analyzed by AAS. The anticorrosion ability of the plated bracket was
analyzed by means of inductively coupled plasma atomic emission spectroscopy (ICP-
AES). They found that both TiN and non TiN plated metal brackets may release
detectable ions into the test solution, including nickel, chromium, manganese, copper,
and iron. This study found that most of the TiN plated specimens revealed a greater
degree of metal ion release than was the case for the non-TiN-plated specimens
suggesting that the anticorrosion properties of the TiN-plated brackets were relatively
poor.
1.5 Purpose of This Work
The main objective of this study is to improve our understanding of surface
modification of CoCrMo alloy with nitrogen ion implantation and PVD coating
processes. In particular, microstructures and the effectiveness of TiN coated and
nitrogen ion implanted CoCrMo alloy, in preventing the dissolution of metal ions (Co,
Cr, Ni) into simulated body fluid will be investigated, respectively.
This will be accomplished by experimental characterization of the near surface
crystal structures and the N-implanted and the TiN coating layer thicknesses using a

10
combination of symmetric and grazing incidence x-ray diffraction (XRD and GIXRD),
cross sectional electron microscopy (SEM). Metal ion release into simulated body fluid
from TiN coated and nitrogen implanted CoCrMo alloy specimens will be investigated
by atomic absorption spectroscopy (AAS) and inductively coupled plasma optical
emission spectroscopy (ICP-OES).
The results of this research should lead to an understanding of the effectiveness
of N ion implanted and TiN coated layers in preventing the dissolution of metal ion
release into the simulated body fluid.
11
CHAPTER 2
EXPERIMENTAL METHODS
2.1. Nitrogen Ion Implantation
Cobalt-chromium-molybdenum (CoCrMo) alloy, specified in ISO 5832-12
which has nominal composition of 1 % Ni, 0.75 % Fe, 1.0 % Mn, 1.0 % Si, 0.35 % C,
0.25 % N, 5 % Mo, 26 % Cr and balance Co (all in wt %), was the base material into
which the N was implanted and onto which TiN was deposited. The specimen geometry
was designed as a disk, having 3 cm diameter and the thickness was 0.3 cm. The
average grain size for the specimens of this study, obtained by metallography, was 5
to 15 µm. Before the implantation and coating all the specimens were polished to mirror
like quality, with a mean surface roughness of about 0.05 µm based on surface
profilometry.
Nitrogen ion implantations were carried out with relatively simple, broad beam
(beam size up to 10 cm in diameter), ultrahigh current density ion implanter whose
design is based on ion thruster technology, and whose operation conditions are
capabilities are listed in Table 2.1. Detailed description of the essential elements of this
type of system can be found elsewhere [29]. The N ions generated by these two systems
were not mass analyzed, but primarily consist of N2+ ( 70 %) and N+ ( 30 %).
Table 2.1. Range of operating conditions for the ion implanter used in this study
Implanter Ion Energies (keV) Current Densities (A/cm2)
1 10-80 100-2000
The temperatures of the specimens were controlled by a thermocouple attached
to the back of the samples during the N implantation. The specimens were heated by the
ion beam. The specimens are mounted on a copper block that is cooled as necessary to
12
maintain the desired temperature under the beam heating conditions. During processing
the pressure inside the chamber was in the low 10-6 torr range.
The specimens prepared for this research are summarized in Table 2.2. The
substrate temperatures were chosen to be 100 C, 200 C and 400 C. As the table
indicates, to maintain the same substrate temperature, say 400 C, for a given set of
samples as one lowers the implantation energy one has to increase the current density so
that approximately similar power inputs to the specimens are applied. The total
implanted N ion dose (column 5) is found by the equation
eNtIQ .. (2.1)
where, I is the current density, t is the implantation time and e is the electron charge.
Table 2.2. Nitrogen implantation conditions. A total of 16 samples were nitrogen
implanted.
Sample No Ion Energy
(keV)
Dose Rate
(mA/cm2)
Temperature
(C)
Dose
(x1018 N/cm2)
Time
(min.)
29; 34; 35 60 0.1 100
1.9
30
28; 32; 33 60 0.1 200
30; 31 60 0.1 400
27; 40; 41 30 0.2 100
3.8
26; 38; 39 30 0.2 200
36; 37 30 0.2 400
2.2. PVD Coating
In addition to ion implantation, titanium nitride (TiN) coatings were deposited
on CoCrMo alloy substrate via physical vapour deposition (PVD). The PVD was carried
out by an industrial type (CC880/8 with CK288 cathode) coating machine. Before
deposition the substrate (as-polished specimens) were ultrasonically cleaned and, in
situ, sputter etched in a pure argon atmosphere. The coatings were deposited from a
titanium cathode material in an argon and nitrogen atmosphere. During the deposition
only 2 of the 4 cathodes were working and they were placed cross shaped. The coating
13
temperature, the bias voltage applied to the substrate and the deposition time were 550
C, 110 V and 6 hours, respectively. A total of 7 specimens were TiN coated (sample
no’s 1; 2; 3; 4; 7; 14; 15).
2.3 Microstructural Characterization
Near surface crystal structures, composition, the nitrogen implanted layer
thicknesses of the as implanted specimens and TiN coated samples were characterized
by x-ray diffraction (XRD) and scanning electron microscopy (SEM). SEM was used in
three different modes: (1) energy dispersive x-ray spectroscopy (EDX), (2) scanning
electron (SE) and (3) back scattering electron (BSE) modes, respectively.
The SE signal gives the highest resolution image. Large numbers of low energy
electrons are generated from a very small volume around the point of incidence of the
beam on the sample. The depth, from which the signal is obtained, is tens of
nanometers. The BSE signal is generated from a larger volume and greater depth within
the sample. The energy of these electrons is close to that of incoming electron beam
energy, of the order of hundreds of nanometers. The EDX signal is, for most elements,
generated from a greater volume of than either of the other electrons signals (SE and
BSE signal). The actual depth will depend on the energy both of the electron beam and
of the X-rays being emitted, but will be of the order of a micrometer.
2.3.1 XRD Analysis
X-ray diffraction analysis can be used for characterization of the surface layers
of ion implanted and TiN coated materials since low energy x-rays are strongly
absorbed in passing through solid materials. The fundamental physical and chemical
knowledge acquired by this analysis includes: crystal structure identification, layer
composition and thickness determination, and crystallite sizes and preferred orientation.
X-ray measurements were made with a /2 diffractometer with Cu K x-rays
( = 1.5404 for the 8.05 keV x-rays) from a high intensity x-ray tube (Philips Xpert).
The voltage and current used were 45.0 kV and 40 mA, respectively. The data
14
collection was made with a computer controlled system. The resultant spectrum is in the
form of the scattered x-ray intensity (counts/s) versus 2 (degrees). The presented
diffractograms in this study were plotted in square root of x-ray intensity [Sqrt (x-ray
intensity)] versus 2 (degrees) to reveal weaker patterns much more clearly. The 2
range for the specimens of this study was 30 to 100 degrees, which gives a scan time of
about 1 hour 56 minutes for the step widths and times used in this experiment (0.05
and 4 s, respectively). The experimental data were evaluated using available software
(Expert Manager). The first step in the process is to locate the peak positions and then
the search match method is performed to identify the peaks that are present.
The effective depth probed by Cu K x-ray (sin/2 [30] where is the
effective linear absorption coefficient, and approximately equals to 2540 cm-1 for
CoCrMo alloy used in this study) was such that it allowed the characterization of the
TiN coated and nitrogen implanted layer as well as the substrate phase. Two different
geometries: (1) Bragg Brentano (/2) and (2) grazing incidence x-ray diffraction
geometry are facilitated during the XRD measurements.
2.3.1.1 Bragg-Brentano Method (/2)
This method generally is known as powder method, and can be defined as a
symmetric method since the system always detects the scattered x-rays at a diffraction
angle which is equal to the angle of x-rays incident of the surface. Both the sample and
the detector move step by step during the measurement. While the samples rotate at an
angle () the detector moves two times this angle (2). This method, therefore, always
detects the diffracted x-rays from grains oriented parallel to the surfaces not the others.
One disadvantage of this geometry is that the effective depth probed by the incident
beam always changes during the scan due to the change in the angle of the incident
beam. For example, a typical scan range in 2 for most metals is from 30 to 100
degrees. Due to the change in the incident beam angle, the effective depth probed by the
beam at 2 = 100 degrees is approximately 3 times deeper than the effective depth
probed by the beam at 2 = 30 degrees (the effective depths probed by the beam at 2 =
30 and 100 degrees are equal to 0.49 µm and 1.4 m, respectively). This property of
the method might cause some misinterpretation if it is not taken notice on examining,
15
for example, a material having a layered structure. This introduces the concept of fixing
the angle of the incident beam and scanning the scattered beam, for that kind of analysis
the following method will be considered.
2.3.1.2 Grazing Incidence X-Ray Method
In this system, the incident x-ray beam is fixed to a predetermined value on the
sample and detector scans 2 degrees. Different from the powder method, this method
facilitates diffraction from the planes not parallel to surface, never the parallel ones.
Normally this method uses very small angles incident on the surface providing
information from quite thin layers and is ideally suitable for examination of typical
implantation modified layer thicknesses, which is on the order of 0.1 m. The main
power behind this method, therefore, involves providing the information layer by layer
just changing the angle of x-ray beam incident on the sample surface. Since the
effective depth probed by the fixed x-ray beam incident on the sample is mainly
dependent on this angle (sin/, where is the fixed angle and µis the mass absorption
coefficient [30]). Due to extremely low incident angles the scattered beam mainly lacks
of enough intensity and parallelism, which might lead to missing or wrong information.
Using Göbel mirror and parallel beam optics may solve this problem. Further
information can be found in the literature.
The incident angles () for investigating the nitrogen ion implanted layers were
0.5 and 1, while the corresponding effective depths probed by these incident x-ray
beams are 33 and 66 nm, respectively.
2.3.1.3 XRD Composition-Depth Analysis
XRD nitrogen composition analysis is done using the following formula
NCaa 0 (2.2)
This is a well established equation for the lattice constant of -Fe (fcc) as a function of
atomic percent interstitial nitrogen up to 10 at. % [31]. This equation can be applied to
materials and alloys with fcc structure. In this equation, as applied to the N layer, a0 is
16
the lattice constant of the substrate [-(CoCrMo)], CN is the atomic percent N
concentration for the N layer, is known as Vegard’s constant and equals to 0.0078
Å/at. % N for pure -Fe [31].
The Eq.2.2 is used to estimate an average nitrogen concentration for the N layer.
This is done by careful examination of the (111) and (200) reflections of the XRD data
of the N layer and the substrate -(Co, Cr, Mo). The lattice constants [a(N) and a0] used
in above equations to estimate CN are obtained from the center shifts determined by
careful fits of the XRD data for the (111) and (200) reflections. The a0 is obtained by a
least squares curve fitting of the XRD data related to the as polished specimen.
Experimental XRD data were fitted by a non-linear least-squares curve-fitting to
obtain accurate peak centers and integrated intensities (areas under the fitted curves) for
both the implanted layer and the substrate phases. These quantities were then used in
estimating N concentration and implanted layer thickness. The fitting function used was
Pearson VII (a four parameter function with two width parameters; according to the
variation of one of the parameters, this function becomes either Lorentzian or
Gaussian). Fig.2.1 shows an actual fit of the XRD data corresponding to 30 keV
nitrogen implanted specimen at 400 C.
The thickness of the implanted layer containing nitrogen in interstitial solid
solution phase (N) is found from the relative intensities of various (hkl) reflections.
This is given by [31]:
)sin
2exp(1
)()(
)(
L
II
I
N
N
(2.3)
where µ is the linear absorption coefficient and sin is the average value for both phases
( and N). The main assumption used in deriving this equation is that the N layer
extends uniformly from the surface to a depth L with an average concentration (CN)
obtained using Eq.2.2. In this equation, I(N) refers to the integrated intensity of the N
layer while I() refers to that of substrate phase (see Fig.2.1). In Eq.2.3, the mass
absorption coefficient was taken to be the same for both and N and its value was
estimated to be 2540 cm-1 based on the weight fractions of the elements for the substrate
material (CoCrMo alloy).
17
30 keV 400 oC
2 (degrees)
35 40 45 50 55
[X-r
ay in
ten
sity
(ct
s/s)
]
0
200
400
600
800
1000
1200
1400
1600
1800
1
23
4
5
6 7
8
9
Figure 2.1. An actual fit of the XRD data corresponding to a 30 keV nitrogen implanted
specimen at 400 C
2.3.2 Cross-Sectional SEM Analysis
Cross sectional SEM analysis was done on a few selected specimens to examine
the possible use of this method for measuring the N implanted and TiN coated layer
thicknesses. SEM was also used for surface morphology analysis for both N implanted
and TiN deposited specimens. Before SEM analysis, specimens were mounted in the
standard bakelite material, polished (down to 0.05 m alumina), and finally etched
chemically except TiN coated sample. The type of chemical etchant was used such that
it would preferentially etch the substrate rather than the modified layer. A mixture of 5
mL HCI and 100 mL H2O2 was used to reveal the implanted layer. This etchant was
used electrolytically. The voltage used, current and time was 5 V, 1 mA and 30 seconds,
respectively. This etchant was also used to reveal the grain structure of the substrate.
Before placing the specimens into the SEM unit, they were cleaned with ethyl alcohol.
18
SEM in EDX mode was also used to investigate the surface morphology of
specimens (N implanted and TiN coated) after the static immersion test. The EDX
analysis method is based on the detection of x-rays emitted during the interaction of
incident electron beam with material. The emitted x-rays are characteristic to the emitter
atoms or the elements. Therefore, elemental analysis determination is the main power
behind the EDX.
2.4 Static Immersion Test
Static immersion tests were performed with the as-polished (unimplanted and
uncoated), the N implanted, and TiN coated specimens. A total of 18 test specimens
involved in the immersion test (two of each set. For example, two test specimens at 30
keV 100 °C). Before the immersion of the specimens into the simulated body fluid
(SBF), the unimplanted and uncoated areas of the test specimens were coated with
epoxy resin so that metal ion release will be detected from the implanted and coated
areas only. The areas that were exposed to the body fluid were 1.65 and 16.0 cm2 for the
N implanted and as polished test specimens, respectively. To check the efficiency of the
epoxy, an unimplanted (as polished) sample was coated completely with it, and then
was immersed into the SBF. The glass bottles used for the immersion test were carefully
cleaned with 10 vol. % concentrated HNO3 solution and ultrapure water (18 Mcm-1) to
remove impurities, and thereafter sterilized in an autoclaved water. Then, a 130 mL
volume of SBF was poured into the bottles each containing a test specimen. All the
bottles were placed inside an incubator at 37 °C for 7 months. After the immersion,
samples (5 mL) were removed from the bottles to be analyzed for metal ion release
periodically. The time interval for solution removal (5 mL each time) was chosen to be
1, 3, 7, 15 and 30 days and then each month thereafter. This schedule was chosen to
know the initial metal ion release rate for the first four time intervals.
19
2.5 Preparation of Simulated Body Fluid (SBF)
Simulated body fluid was prepared according to procedure in the literature [32]
by dissolving reagent grade chemicals of NaCI, NaHCO3, KCI, Na2HPO4,
MgCI2.6H2O, CaCI2.2H2O and Na2SO4 in autoclaved deionised water. The chemicals
were added to the solution in the order they are listed. The simulated body fluid solution
was buffered at physiological pH 7.4 at 37 C with 50 mM trishydoxmethyl
aminomethane [[CH2OH)3CNH2] (THAM) and 36.23 mM HCI acid. HCI was added
before calcium chloride and THAM was the last reagent added to the solution. In
addition, sodium Azid (1g) was added into the SBF for preventing microbial effects.
The amount of reagent grade chemicals used are listed in Table 2.3
Table 2.3. Reagents used for the preparation of SBF (pH 7.4, 1L)
Order Reagent Amount (g)
1 NaCI 6.547
2 NaHCO3 2.268
3 KCI 0.372
4 Na2HPO4 0.124
5 MgCI2.6H2O 0.305
6 1M HCI 40 mL
7 CaCI2.2H2O 0.368
8 Na2SO4 0.071
9 trishydoxmethyl 6.057
The ion concentration of the SBF and blood plasma are nearly the same. Table
2.4 shows the ion concentrations (mM) of the SBF and human blood plasma
20
Table 2.4. Ion concentration (mM) of SBF and human blood plasma
Ion SBF Human Blood Plasma
Na+ 142.0 142.0
K+ 5.0 5.0
Mg2+ 1.5 1.5
Ca2+ 2.5 2.5
Cl- 147.8 103.0
HCO3- 4.2 27.0
HPO42- 1.0 1.0
SO42- 0.5 0.5
2.6 Ion Release Detection Method
Metal ion release into the simulated body fluid from as-polished, N implanted
and TiN coated CoCrMo materials was analyzed by two atomic spectrometric methods.
Cobalt, chromium and nickel were determined electrothermal and/or flame (ETAAS
and/or FAAS) atomic absorption spectroscopy whereas, inductively coupled plasma
optical emission spectroscopy (ICP-OES) was used in the determination of titanium and
molybdenum.
A Thermo Elemental Solaar M6 series atomic absorption spectrometer was
employed in the determination of Co, Cr and Ni. The graphite furnace (GF 95 with the
autosampler) or the flame (with D2-background correction) was applied as the sample
atomization with depending on the concentrations of the metals in the solutions.
Graphite furnace atomization was applied for the concentrations below 20 µg/L whereas
flame atomization was the method of choice for concentrations higher than 50 µg/L.
The corresponding calibration graphs can be seen in Fig. 2.2 and 2.3.
2.6.1 Electrothermal (Graphite Furnace) Atomic Absorption Spectroscopy
Furnaces are used primarily to atomize the solids, slurries, and solutions for
atomic absorption. A common design consist of a graphite tube with an inside diameter
21
of a few millimeters. Since the furnace tube is heated by passing electrical current
through the graphite, the method is also called electrothermal atomization. Today,
GFAAS is one of the most useful and powerful analytical technique for the
determination of trace and ultra-trace elements in the biological and clinical samples
because its high sensitivity and its ability to work with microliter amounts of samples.
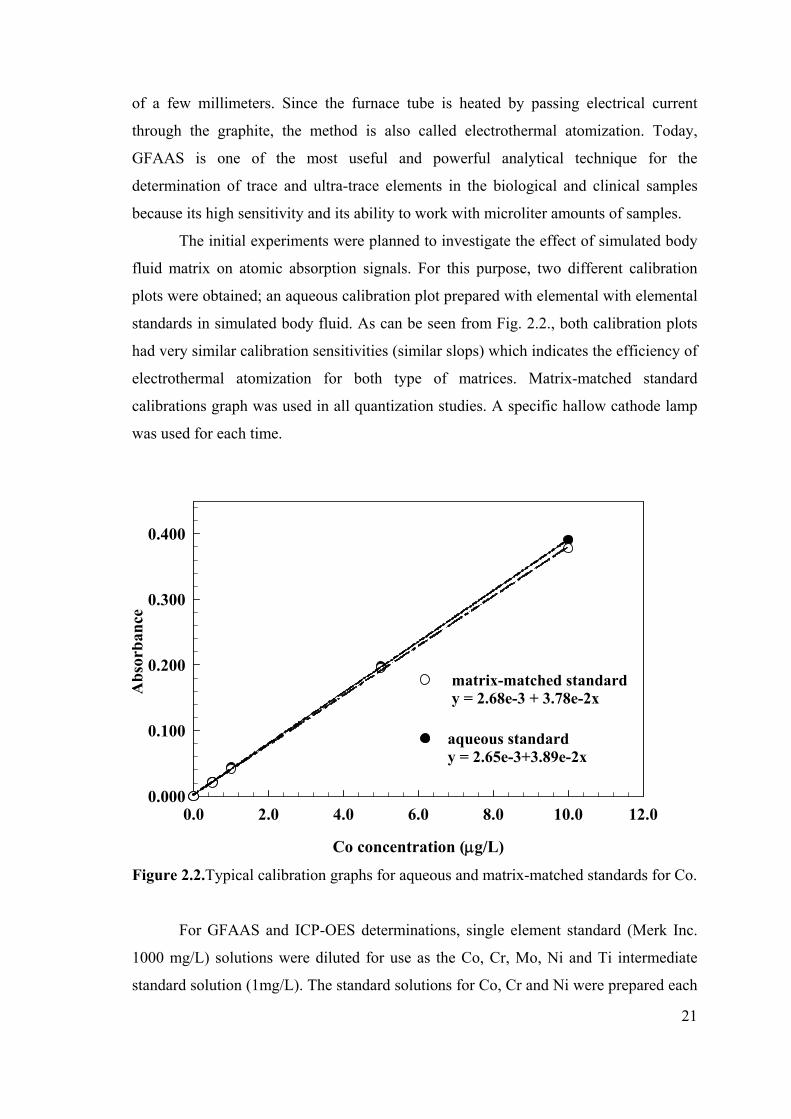
The initial experiments were planned to investigate the effect of simulated body
fluid matrix on atomic absorption signals. For this purpose, two different calibration
plots were obtained; an aqueous calibration plot prepared with elemental with elemental
standards in simulated body fluid. As can be seen from Fig. 2.2., both calibration plots
had very similar calibration sensitivities (similar slops) which indicates the efficiency of
electrothermal atomization for both type of matrices. Matrix-matched standard
calibrations graph was used in all quantization studies. A specific hallow cathode lamp
was used for each time.
Co concentration (g/L)
0.0 2.0 4.0 6.0 8.0 10.0 12.0
Ab
sorb
ance
0.000
0.100
0.200
0.300
0.400
matrix-matched standardy = 2.68e-3 + 3.78e-2x
aqueous standardy = 2.65e-3+3.89e-2x
Figure 2.2.Typical calibration graphs for aqueous and matrix-matched standards for Co.
For GFAAS and ICP-OES determinations, single element standard (Merk Inc.
1000 mg/L) solutions were diluted for use as the Co, Cr, Mo, Ni and Ti intermediate
standard solution (1mg/L). The standard solutions for Co, Cr and Ni were prepared each
22
time before measuring the metal ion concentrations into SBF on the predetermined time
interval between 5.0-50.0 g/l in matrix matched solution into the polypropylene tubes.
(Polypropylene tubes were cleaned by soaking them in nitric acid (10 v/v %) and were
rinsed with ultrapure water prior to use.) The working curves were established from at
least four plotted points. As stated before, in the determination of Co, Cr and Ni,
electrothermal atomization AAS was employed. The relevant furnace programs are
given in Tables 2.5, 2.6 and 2.7. In Co determination, especially after an immersion
period of one month, FAAS was used due to the increased release of Co into the
simulated body fluid.
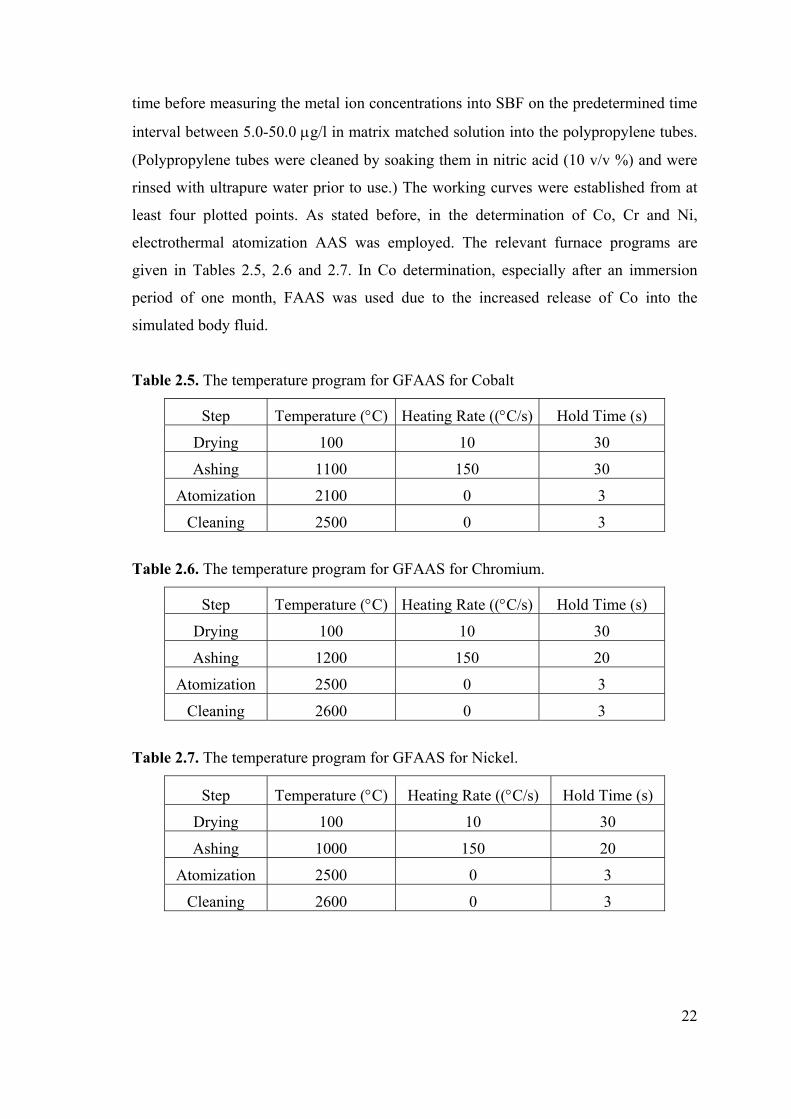
Table 2.5. The temperature program for GFAAS for Cobalt
Step Temperature (C) Heating Rate ((C/s) Hold Time (s)
Drying 100 10 30
Ashing 1100 150 30
Atomization 2100 0 3
Cleaning 2500 0 3
Table 2.6. The temperature program for GFAAS for Chromium.
Step Temperature (C) Heating Rate ((C/s) Hold Time (s)
Drying 100 10 30
Ashing 1200 150 20
Atomization 2500 0 3
Cleaning 2600 0 3
Table 2.7. The temperature program for GFAAS for Nickel.
Step Temperature (C) Heating Rate ((C/s) Hold Time (s)
Drying 100 10 30
Ashing 1000 150 20
Atomization 2500 0 3
Cleaning 2600 0 3
23
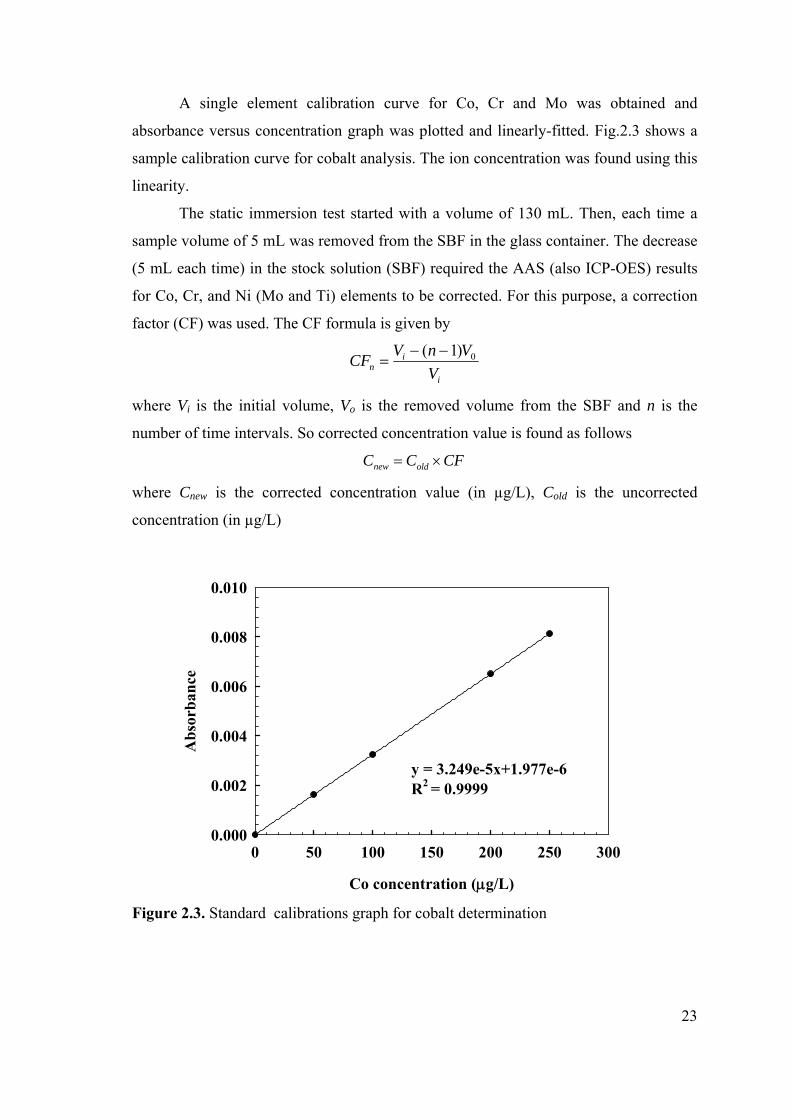
A single element calibration curve for Co, Cr and Mo was obtained and
absorbance versus concentration graph was plotted and linearly-fitted. Fig.2.3 shows a
sample calibration curve for cobalt analysis. The ion concentration was found using this
linearity.
The static immersion test started with a volume of 130 mL. Then, each time a
sample volume of 5 mL was removed from the SBF in the glass container. The decrease
(5 mL each time) in the stock solution (SBF) required the AAS (also ICP-OES) results
for Co, Cr, and Ni (Mo and Ti) elements to be corrected. For this purpose, a correction
factor (CF) was used. The CF formula is given by
i
in V
VnVCF 0)1(
where Vi is the initial volume, Vo is the removed volume from the SBF and n is the
number of time intervals. So corrected concentration value is found as follows
CFCC oldnew
where Cnew is the corrected concentration value (in µg/L), Cold is the uncorrected
concentration (in µg/L)
Co concentration (g/L)
0 50 100 150 200 250 300
Ab
sorb
ance
0.000
0.002
0.004
0.006
0.008
0.010
y = 3.249e-5x+1.977e-6R2 = 0.9999
Figure 2.3. Standard calibrations graph for cobalt determination
24
2.6.2 Inductively Coupled Plasma Optical Emission Spectroscopy
Plasma is ionized gas. High-temperature plasmas function as outstanding, high
temperature atomizers. The most commonly type used for optical emission is an
inductively coupled plasma (ICP) torch. The ICP is continuous (in time) plasma induced
in a flowing stream of argon. The energy to ionize the argon is added through a
radiofrequency electromagnetic field. The electrons are accelerated by the field and hit
the surrounding atoms, causing heating and further ionization, which sustains the
plasma state. The name inductively coupled plasma arises since the plasma is not
directly connected to the loop, but the energy is added inductively. If the gas flow and
radiofrequency power are regulated properly, a donut-shaped region with a high,
constant temperature is sustained at the base of the plume. This is the region into which
the sample is introduced.
Inductively coupled plasma optical emission spectroscopy was used in the
analysis of simulated body fluid for Ti and Mo determinations. ETAAS could not be
used for these two elements because of their high atomization temperatures (2100 °C,
and 2500 °C, for Ti and Mo, respectively) the temperature in ICP-OES reach up to 6000
°C which supplies a very efficient atomization in an inert Ar atmosphere. A similar
calibration strategy was followed in ICP-OES technique to handle solutions with heavy
matrix. In none of the samples, Ti and Mo concentrations were found greater than the
limit of detection (LOD3S). The limit of detection for Ti and Mo calculated according to
3S rule was 30 and 20 µg/L, respectively.
25
CHAPTER 3
IMPLANTATION AND COATING INDUCED PHASES
3.1 Nitrogen Implantation Induced Phases
3.1.1 XRD Results
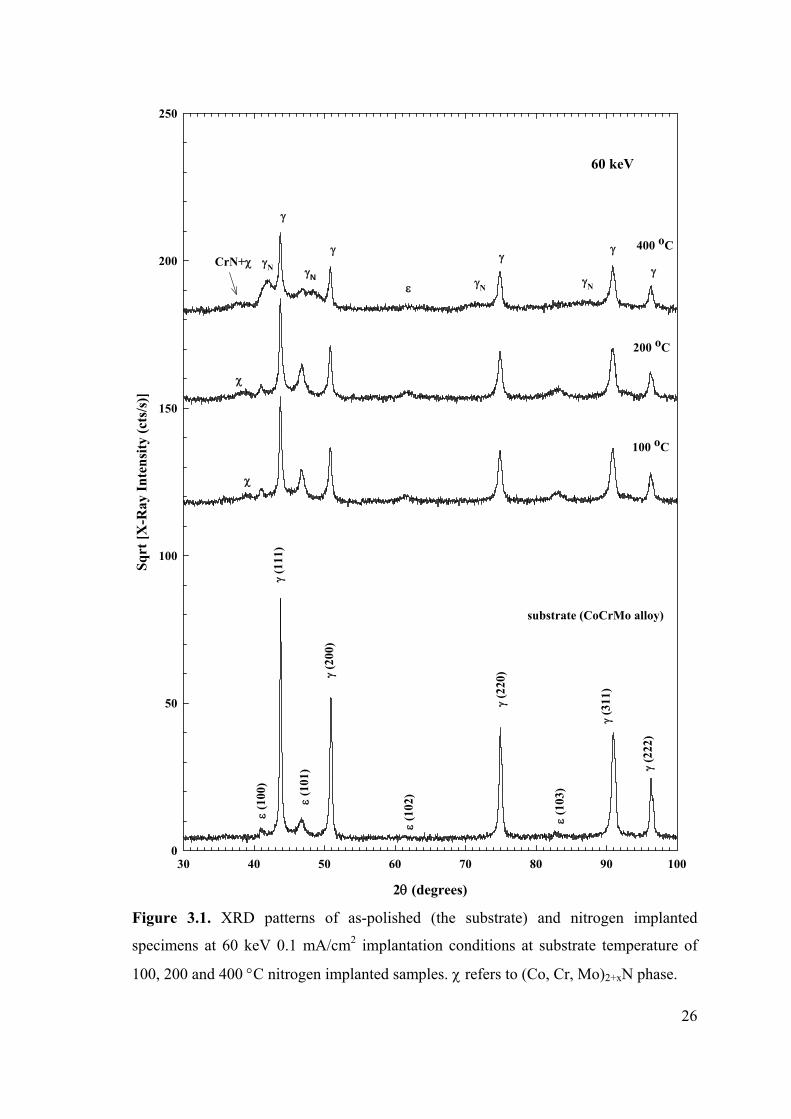
Experimental results from the specimens (specimens 34, 32, 30, 40, 39 and 36,
see Table 2.2) N implanted at the 60 keV-0.1 mA/cm2 and the 30 keV-0.2 mA/cm2 ion
beam conditions and at increasing substrate temperatures of 100, 200 and 400 °C are
shown Figs. 3.1, and 3.2. In Fig.3.1 the fcc and hcp substrate (CoCrMo alloy) peaks are
labeled as “(hkl)” for the fcc -(Co, Cr, Mo) phase and “(hkl)” for the hcp -(Co, Cr,
Mo) phase, respectively, and the implantation induced ones as N (hkl).
The as-polished material (the substrate) has face centered cubic (fcc) structure
and hexagonal close packed (hcp) structure. The lattice parameter for the substrate -
(CoCrMo) phase was calculated and found to be 3.579 Å. The lattice parameters, a and
c, for the substrate -(CoCrMo) phase was 1.32 Å and 2.70 Å, respectively. Based on
the intensity of the XRD peaks in Fig.3.1, the volume percent of the substrate phase is
estimated to be about 90 %, while the rest (10 %) is due to the substrate phase. The
SEM analysis results (to be discussed later) indicate that the microstructure for the
substrate material (CoCrMo alloy) consists of a fcc matrix with fine hcp platelets.
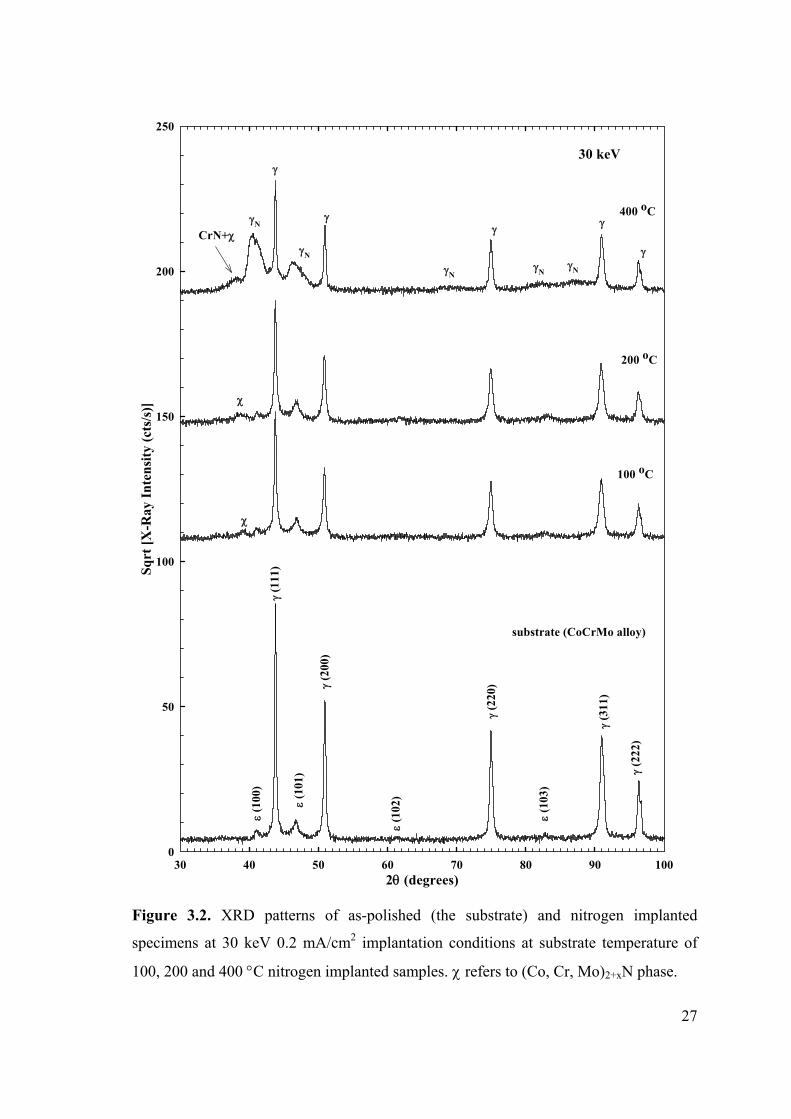
An important observation from Fig. 3.1 and Fig. 3.2 is the formation of an
interstitial phase (nitrogen occupying octahedral sites in fcc lattice) labeled as N. The
N phase was formed at the implantation temperature of 400 C under both the 30 keV
and the 60 keV N implantation conditions. The N phase formation is similar to that
observed for nitrogen implantation of 304 SS at 400 C where N forms from the - (Fe,
Cr, Ni) parent structure. Note that the parent structure of the substrate material in this
26
60 keV
2(degrees)
30 40 50 60 70 80 90 100
Sq
rt [
X-R
ay I
nte
nsi
ty (
cts/
s)]
0
50
100
150
200
250
(1
11)
(1
01)
(222
)
(3
11)
(2
20) (2
00)
(1
00)
N N
100 oC
400 oC
200 oC
substrate (CoCrMo alloy)
NN
(1
02)
(1
03)
CrN+
Figure 3.1. XRD patterns of as-polished (the substrate) and nitrogen implanted
specimens at 60 keV 0.1 mA/cm2 implantation conditions at substrate temperature of
100, 200 and 400 C nitrogen implanted samples. refers to (Co, Cr, Mo)2+xN phase.
27
30 keV
2(degrees)30 40 50 60 70 80 90 100
Sq
rt [
X-R
ay I
nte
nsi
ty (
cts/
s)]
0
50
100
150
200
250
(1
11)
(1
01)
(222
)
(3
11)
(2
20)
(200
)
(1
00)
N
N
100 oC
400 oC
200 oC
substrate (CoCrMo alloy)
NN
CrN+
(1
03)
(1
02)
N
Figure 3.2. XRD patterns of as-polished (the substrate) and nitrogen implanted
specimens at 30 keV 0.2 mA/cm2 implantation conditions at substrate temperature of
100, 200 and 400 C nitrogen implanted samples. refers to (Co, Cr, Mo)2+xN phase.
28
study is -(Co, Cr, Mo). Based on Ref. [31], the N was almost observed when the
substrate (304 SS) temperature was held near 400 C. The N phase is known to be
metastable. The metastability is associated with the fact that at lower and higher
substrate temperatures the N is not produced. Higher implantation temperatures ( 550
C) lead to the dissolution of the Cr resulting in a phase separated mixture of bcc-FeNi
and CrN, while lower implantation temperatures ( 200 to 350 °C) result in hexagonal
nitride phase, - (Fe, Cr, Ni)2+xN [31].
Careful qualitative and quantitative analyses of the XRD patterns in Figs. 3.1
and 3.2 reveal a number of key features. The relative intensity analyses of and N
reflections of (111) and (200) orientations associated with the 60 and 30 keV specimens
implanted at 400 °C indicate that the total N layer thickness for grains with (200)
orientation is greater than that of (111).
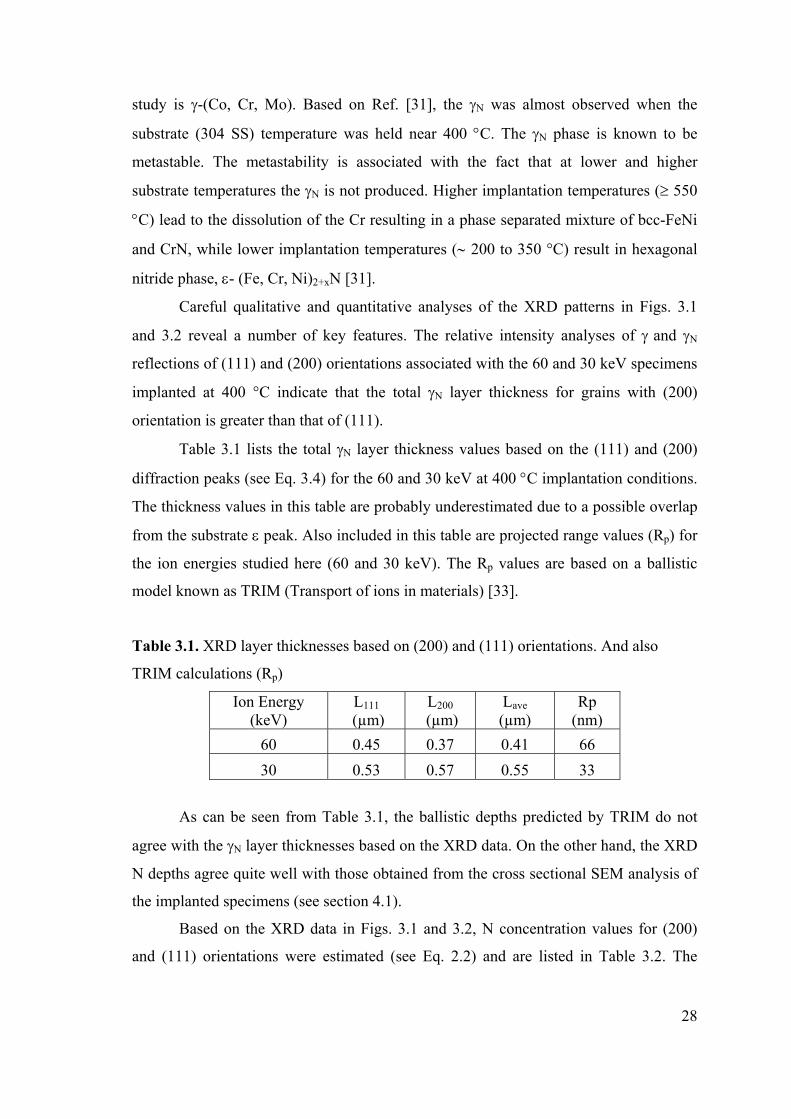
Table 3.1 lists the total N layer thickness values based on the (111) and (200)
diffraction peaks (see Eq. 3.4) for the 60 and 30 keV at 400 C implantation conditions.
The thickness values in this table are probably underestimated due to a possible overlap
from the substrate peak. Also included in this table are projected range values (Rp) for
the ion energies studied here (60 and 30 keV). The Rp values are based on a ballistic
model known as TRIM (Transport of ions in materials) [33].
Table 3.1. XRD layer thicknesses based on (200) and (111) orientations. And also
TRIM calculations (Rp)
Ion Energy (keV)
L111
(µm) L200
(µm) Lave (µm)
Rp (nm)
60 0.45 0.37 0.41 66
30 0.53 0.57 0.55 33
As can be seen from Table 3.1, the ballistic depths predicted by TRIM do not
agree with the N layer thicknesses based on the XRD data. On the other hand, the XRD
N depths agree quite well with those obtained from the cross sectional SEM analysis of
the implanted specimens (see section 4.1).
Based on the XRD data in Figs. 3.1 and 3.2, N concentration values for (200)
and (111) orientations were estimated (see Eq. 2.2) and are listed in Table 3.2. The
29
values in this table suggest that the predicted N concentration values for the implanted
layer become orientation dependent, being larger for the (200) crystallographic planes.
Table 3.2. The N layer lattice constants and N concentrations for the specimens
implanted at 400 °C based on (200) and (111) orientations.
Ion Energy (keV)
a111 (Å)
a200 (Å)
C111 (at. %)
C200 (at. %)
Cave (at. %)
60 3.727 3.758 17 19 18
30 3.838 3.912 30 39 35
The XRD results for the specimens implanted at 100 and 200 C at the 60 and 30
keV implantation conditions show a peak labeled as “” for the (Co, Cr, Mo)2+xN phase.
The XRD peaks associated with this phase weak (low intensity) and broad suggesting a
distribution of N in a very thin implanted layer (about 100 nm or less based on the cross
sectional SEM results, see section 4.1). This peak is shifted to lower angles as the
implantation temperature goes up. (Co, Cr, Mo)2+xN phase is referred to as the
hexagonal nitride phase and is quite similar to the epsilon nitride phase (Fe, Cr, Ni)2+xN,
which forms on the surface layers of nitrogen implanted 304 stainless steel [31].
To reveal the N implanted layer phases at the very surface, grazing incidence x-
ray diffraction (GIXRD) of the specimens in Figs. 3.1 and 3.2 were carried out. The
GIXRD results at the incident angles of 0.5 and 1 degrees for the specimens nitrogen
ion implanted at 30 and 60 keV, 100, 200 and 400 C are shown in Figs. 3.3 and 3.4.
Note that these spectra shown in these figures progressively offset for clarity. The
effective depths probed by these fixed x-ray beams incident on the samples are about 33
and 66 nm corresponding to the incident angles of 0.5 and 1 degrees.
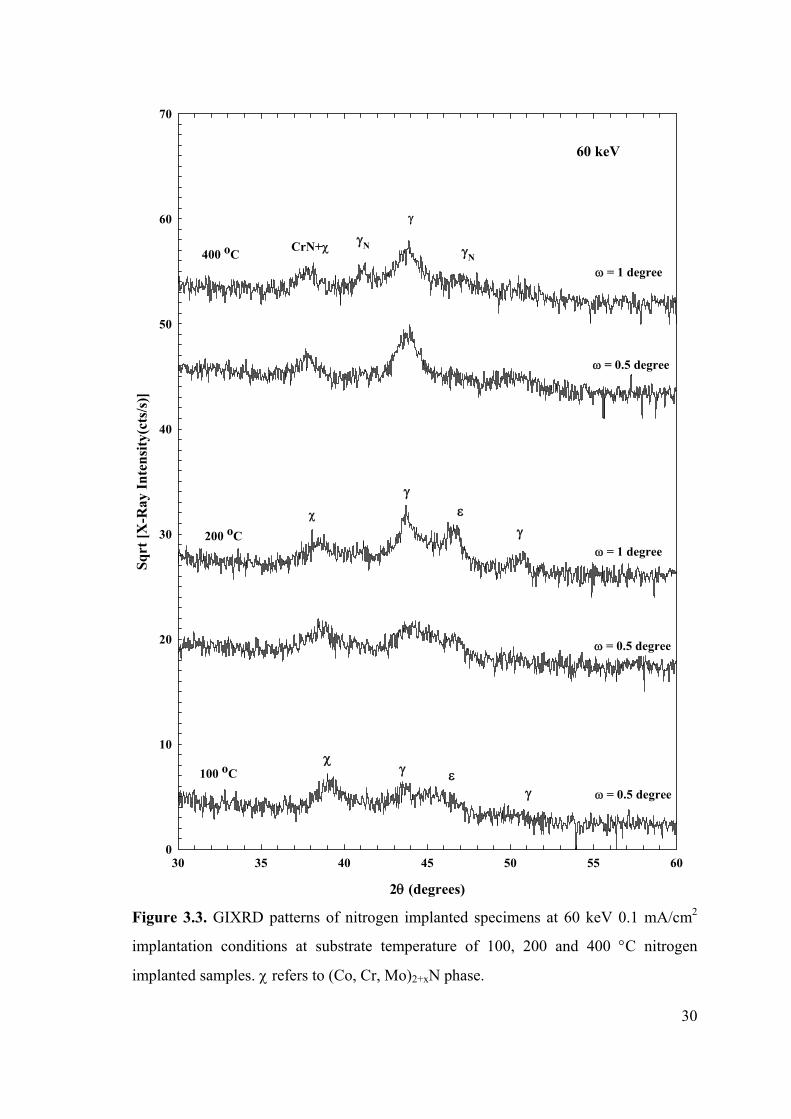
30
60 keV
2(degrees)
30 35 40 45 50 55 60
Sq
rt [
X-R
ay I
nte
nsi
ty(c
ts/s
)]
0
10
20
30
40
50
60
70
= 0.5 degree
400 oC
200 oC
100 oC
= 1 degree
= 0.5 degree
= 1 degree
= 0.5 degree
N
CrN+ N
Figure 3.3. GIXRD patterns of nitrogen implanted specimens at 60 keV 0.1 mA/cm2
implantation conditions at substrate temperature of 100, 200 and 400 C nitrogen
implanted samples. refers to (Co, Cr, Mo)2+xN phase.
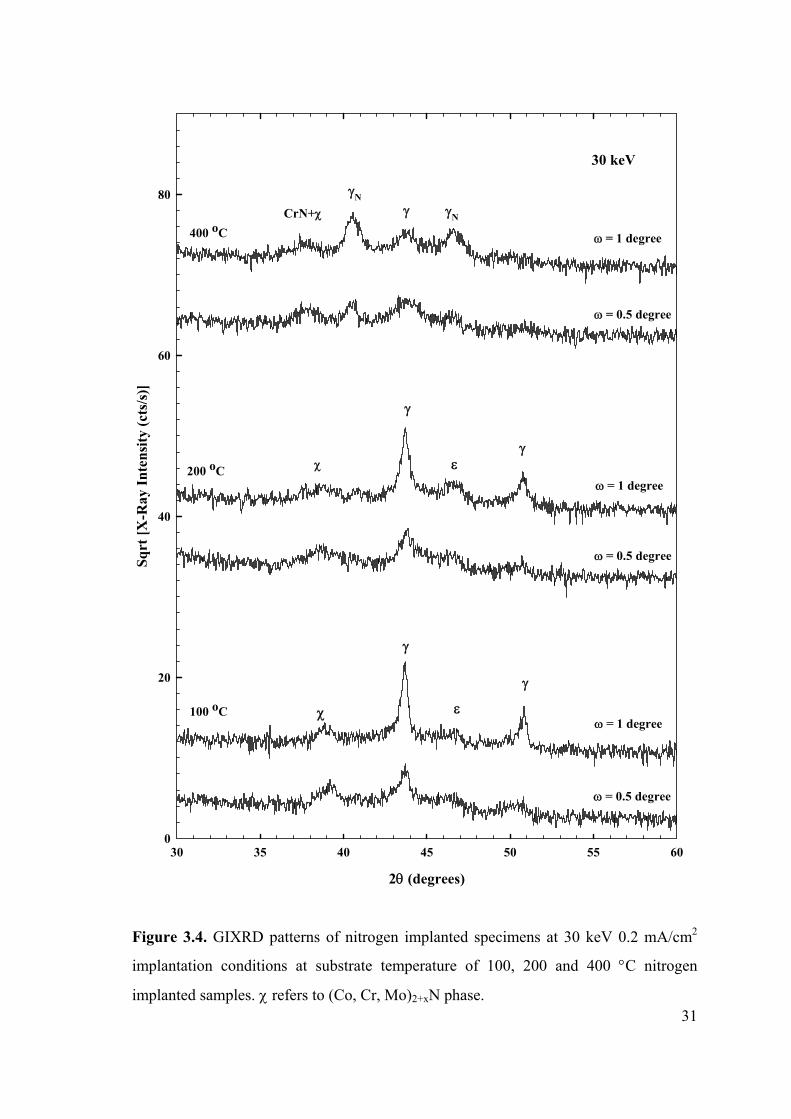
31
30 keV
2(degrees)
30 35 40 45 50 55 60
Sq
rt [
X-R
ay I
nten
sity
(ct
s/s)
]
0
20
40
60
80
400 oC
100 oC
200 oC
= 0.5 degree
= 1 degree
= 0.5 degree
= 1 degree
= 0.5 degree
= 1 degree
CrN+
N
N
Figure 3.4. GIXRD patterns of nitrogen implanted specimens at 30 keV 0.2 mA/cm2
implantation conditions at substrate temperature of 100, 200 and 400 C nitrogen
implanted samples. refers to (Co, Cr, Mo)2+xN phase.
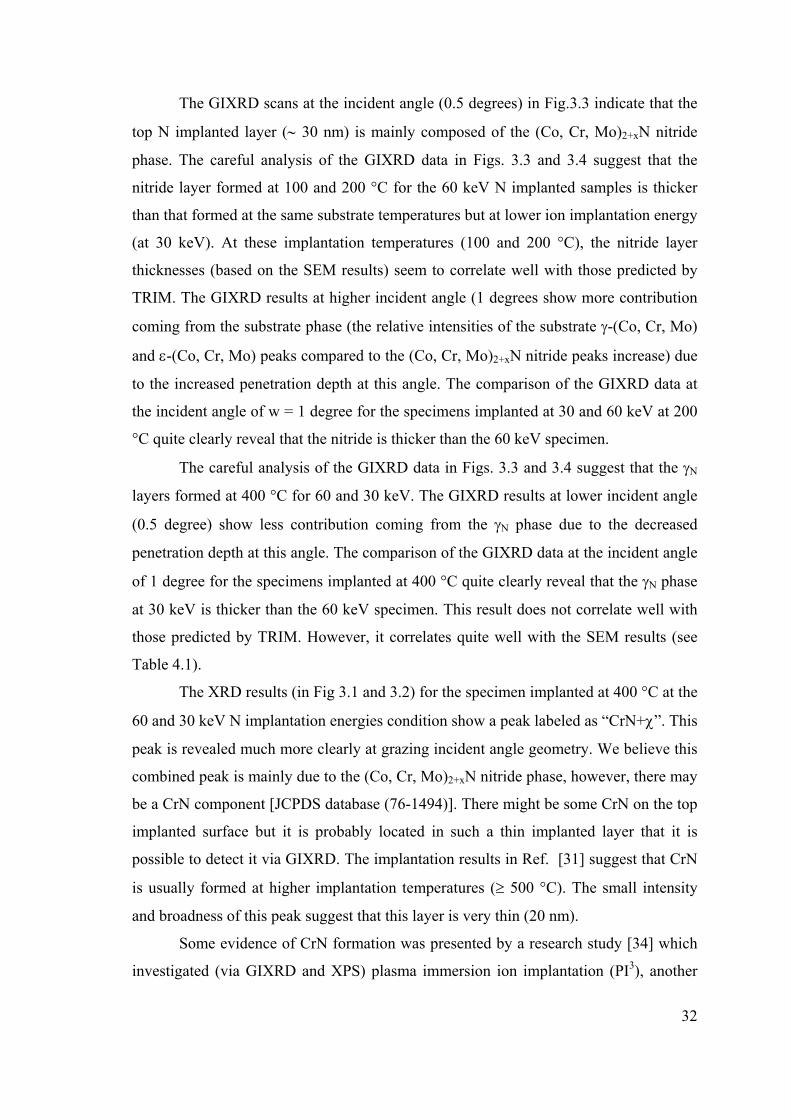
32
The GIXRD scans at the incident angle (0.5 degrees) in Fig.3.3 indicate that the
top N implanted layer ( 30 nm) is mainly composed of the (Co, Cr, Mo)2+xN nitride
phase. The careful analysis of the GIXRD data in Figs. 3.3 and 3.4 suggest that the
nitride layer formed at 100 and 200 °C for the 60 keV N implanted samples is thicker
than that formed at the same substrate temperatures but at lower ion implantation energy
(at 30 keV). At these implantation temperatures (100 and 200 °C), the nitride layer
thicknesses (based on the SEM results) seem to correlate well with those predicted by
TRIM. The GIXRD results at higher incident angle (1 degrees show more contribution
coming from the substrate phase (the relative intensities of the substrate -(Co, Cr, Mo)
and -(Co, Cr, Mo) peaks compared to the (Co, Cr, Mo)2+xN nitride peaks increase) due
to the increased penetration depth at this angle. The comparison of the GIXRD data at
the incident angle of w = 1 degree for the specimens implanted at 30 and 60 keV at 200
°C quite clearly reveal that the nitride is thicker than the 60 keV specimen.
The careful analysis of the GIXRD data in Figs. 3.3 and 3.4 suggest that the N
layers formed at 400 °C for 60 and 30 keV. The GIXRD results at lower incident angle
(0.5 degree) show less contribution coming from the N phase due to the decreased
penetration depth at this angle. The comparison of the GIXRD data at the incident angle
of 1 degree for the specimens implanted at 400 °C quite clearly reveal that the N phase
at 30 keV is thicker than the 60 keV specimen. This result does not correlate well with
those predicted by TRIM. However, it correlates quite well with the SEM results (see
Table 4.1).
The XRD results (in Fig 3.1 and 3.2) for the specimen implanted at 400 °C at the
60 and 30 keV N implantation energies condition show a peak labeled as “CrN+”. This
peak is revealed much more clearly at grazing incident angle geometry. We believe this
combined peak is mainly due to the (Co, Cr, Mo)2+xN nitride phase, however, there may
be a CrN component [JCPDS database (76-1494)]. There might be some CrN on the top
implanted surface but it is probably located in such a thin implanted layer that it is
possible to detect it via GIXRD. The implantation results in Ref. [31] suggest that CrN
is usually formed at higher implantation temperatures ( 500 °C). The small intensity
and broadness of this peak suggest that this layer is very thin (20 nm).
Some evidence of CrN formation was presented by a research study [34] which
investigated (via GIXRD and XPS) plasma immersion ion implantation (PI3), another
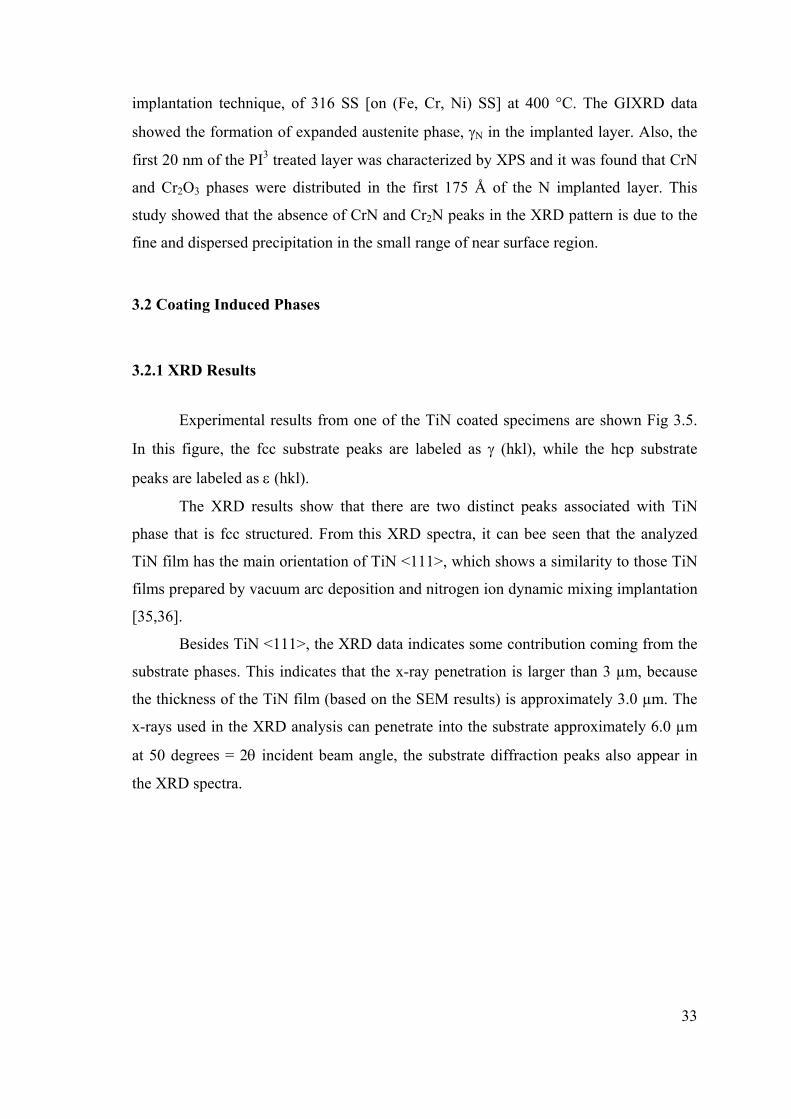
33
implantation technique, of 316 SS [on (Fe, Cr, Ni) SS] at 400 °C. The GIXRD data
showed the formation of expanded austenite phase, N in the implanted layer. Also, the
first 20 nm of the PI3 treated layer was characterized by XPS and it was found that CrN
and Cr2O3 phases were distributed in the first 175 Å of the N implanted layer. This
study showed that the absence of CrN and Cr2N peaks in the XRD pattern is due to the
fine and dispersed precipitation in the small range of near surface region.
3.2 Coating Induced Phases
3.2.1 XRD Results
Experimental results from one of the TiN coated specimens are shown Fig 3.5.
In this figure, the fcc substrate peaks are labeled as (hkl), while the hcp substrate
peaks are labeled as (hkl).
The XRD results show that there are two distinct peaks associated with TiN
phase that is fcc structured. From this XRD spectra, it can bee seen that the analyzed
TiN film has the main orientation of TiN <111>, which shows a similarity to those TiN
films prepared by vacuum arc deposition and nitrogen ion dynamic mixing implantation
[35,36].
Besides TiN <111>, the XRD data indicates some contribution coming from the
substrate phases. This indicates that the x-ray penetration is larger than 3 µm, because
the thickness of the TiN film (based on the SEM results) is approximately 3.0 µm. The
x-rays used in the XRD analysis can penetrate into the substrate approximately 6.0 µm
at 50 degrees = 2 incident beam angle, the substrate diffraction peaks also appear in
the XRD spectra.
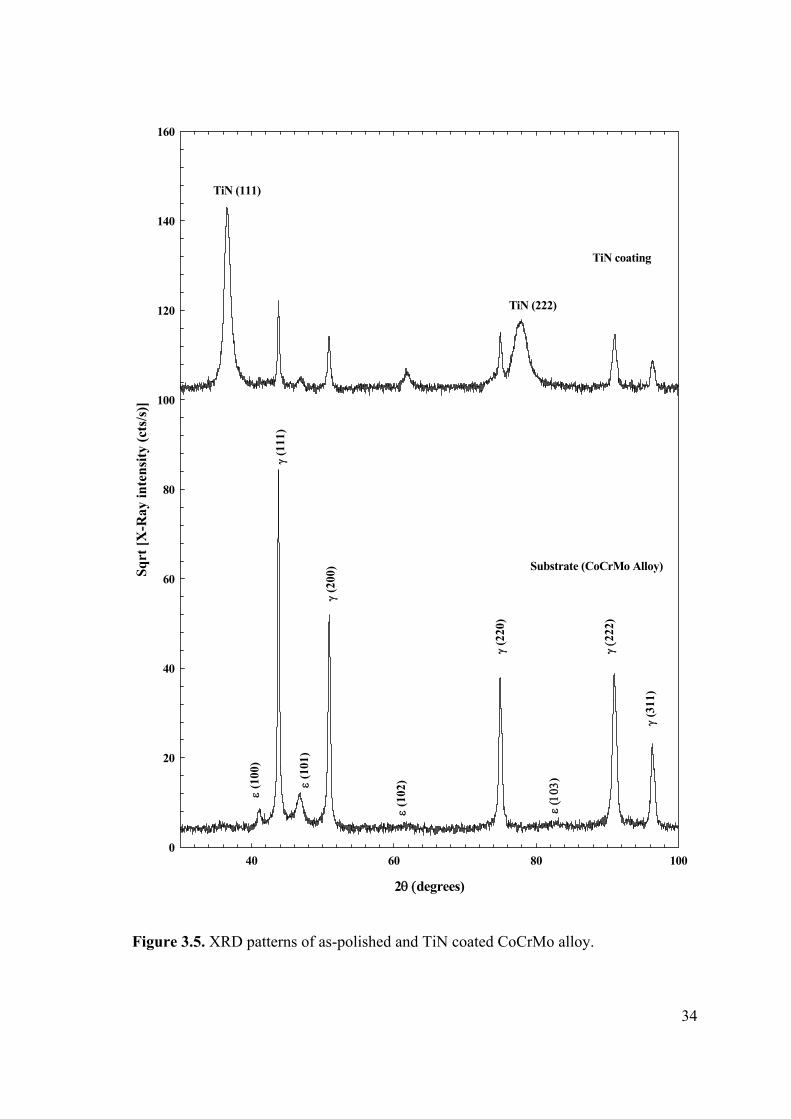
34
2degrees)
40 60 80 100
Sq
rt [
X-R
ay in
ten
sity
(ct
s/s)
]
0
20
40
60
80
100
120
140
160
TiN (111)
TiN (222)
(1
00)
(1
11)
(1
01)
(2
00)
(2
20)
2
22)
(3
11)
Substrate (CoCrMo Alloy)
TiN coating
(1
02)
)
Figure 3.5. XRD patterns of as-polished and TiN coated CoCrMo alloy.
35
The lattice constant for the TiN layer was calculated from the XRD data and was
found to be 4.240 A. This value is quite close to the literature values [37].
Another observation from the XRD data associated with TiN layer is that (111)
peak broadening is less than the (222) peak. This broadness might suggest poor
crystallinity. The (111) plane is the most closely packed and exhibits the lowest surface
energy. If no ionic additional bombardment occurs during the process, TiN crystallites
develop with random orientation, into columnar microstructure.
One research study [37] investigated TiN films prepared by PVD and IBAD. In
this study, TiN was deposited on high speed steel type S 6-5-2 at a substrate
temperature of 200 °C and the deposited layer was characterized by XRD and SEM.
Also, a scratch test was performed with acoustic emission monitoring system (AES).
The XRD and SEM results in this study are in good agreement with those of our
findings. Their XRD pattern show that the TiN has a (111) preferred orientation, while
the coating (via IBAD) has (200) orientation. In our case, the SEM results (to be
discussed next) indicate that the TiN coating thickness is approximately 3 µm thick. In
addition, the results show a columnar type of structure for the film regarding from the
substrate to the coating surface.
36
CHAPTER 4
CROSS-SECTIONAL SEM ANALYSIS
4.1 Nitrogen Implanted Specimens
Cross-sectional SEM analysis was done on the as-polished (substrate) material
and on the 60 and 30 keV N implanted specimens with substrate temperatures of 100,
200 and 400 C. Fig.4.1 shows the SEM results for the as-polished material. The
photomicrographs in Fig.4.1 clearly reveal the grain structure of the substrate phase (fcc
+ hcp phases). These pictures show that the substrate material has a fine and
homogenous grain structure. The average grain size for the specimens of this study,
based on the upper photomicrograph in Fig.4.1 obtained by metallography, is found to
be 6.8 µm.
The SEM results for the 60 keV N implanted specimens at 100, 200 and 400 C
substrate temperature are shown in Fig.4.2, 4.3 and 4.4, respectively. The SEM pictures
for the specimens implanted at 100 and 200 C at the 60 keV implantation conditions
clearly reveal N implanted layers with a relatively uniform layer thicknesses. The N
implanted layer thickness obtained from the upper photomicrographs in Figs.4.2 and 4.3
are about 150 and 200 nm for the specimens implanted at 100 and 200 C, respectively.
The photomicrographs for the 60 keV at 100 C specimen represent the two of several
pictures taken along the N implanted layer. These pictures were taken sequentially over
a span of several grains to look for N implanted layer thickness variations. So, based on
several photomicrographs, the average N layer thickness values for the 60 keV at 100
and 200 C specimens are found to be 160 nm and 185 nm, respectively. Note that
based on the XRD data the nitride phase (Co, Cr, Mo)2+xN is distributed in these very
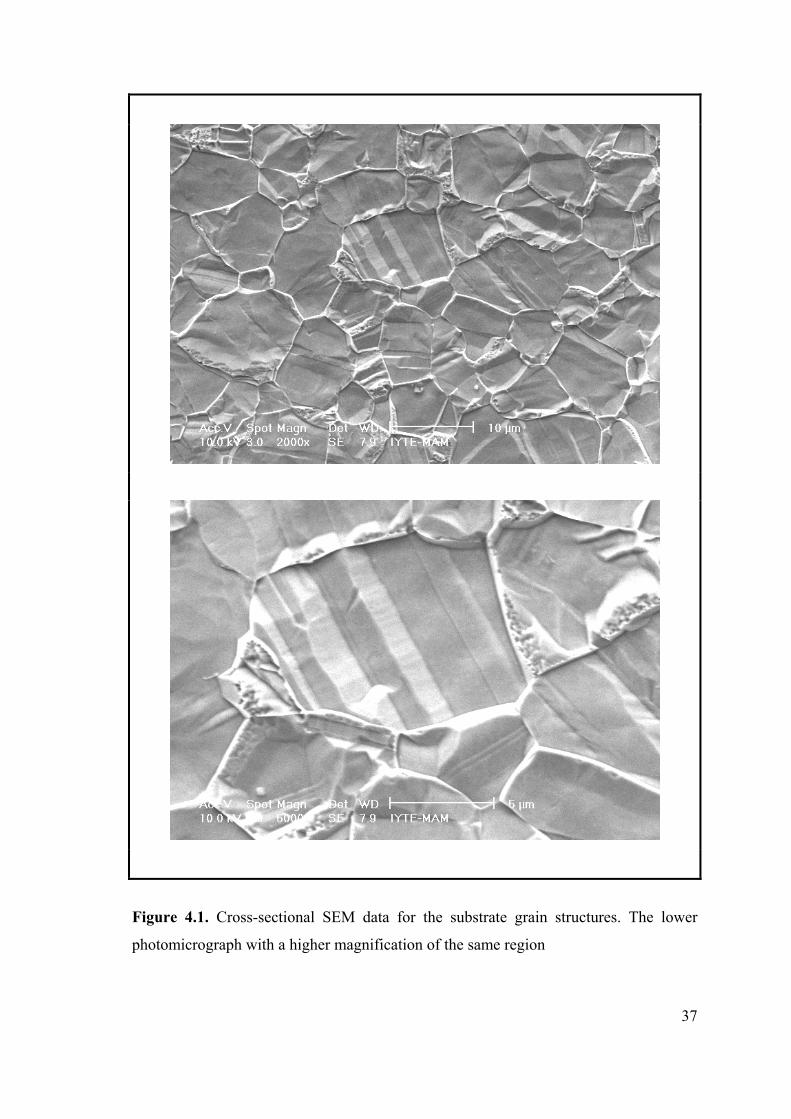
37
Figure 4.1. Cross-sectional SEM data for the substrate grain structures. The lower
photomicrograph with a higher magnification of the same region
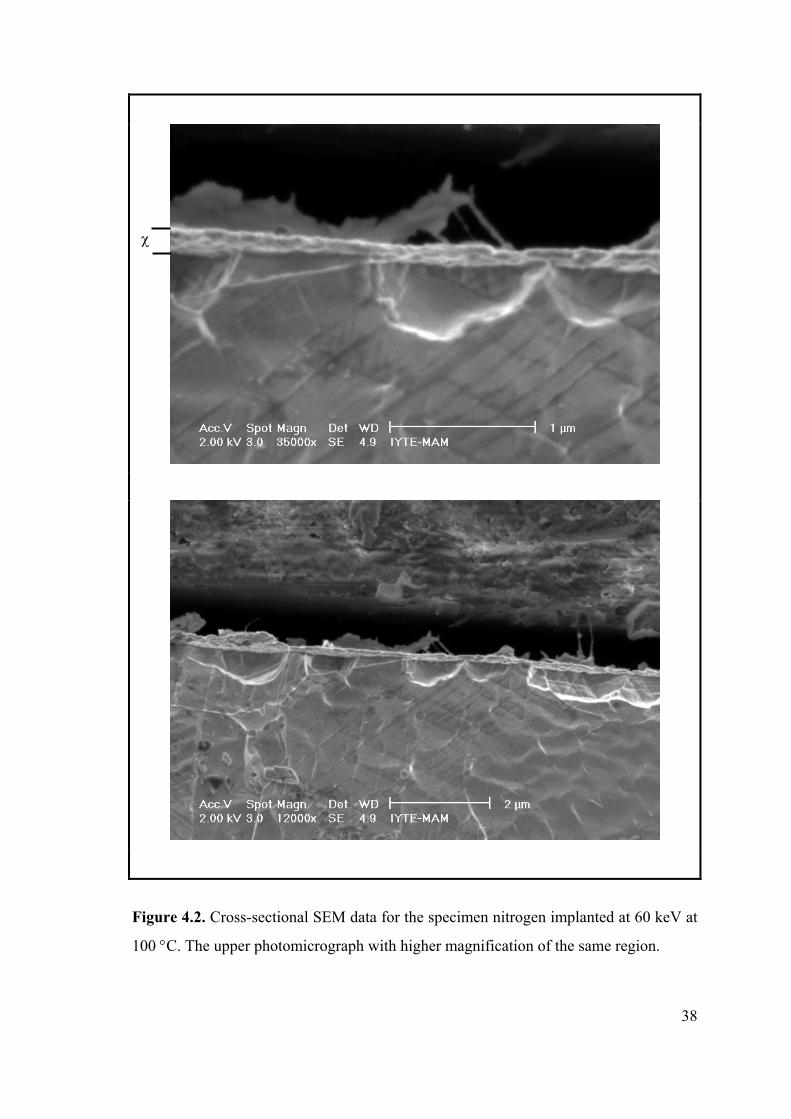
38
Figure 4.2. Cross-sectional SEM data for the specimen nitrogen implanted at 60 keV at
100 C. The upper photomicrograph with higher magnification of the same region.
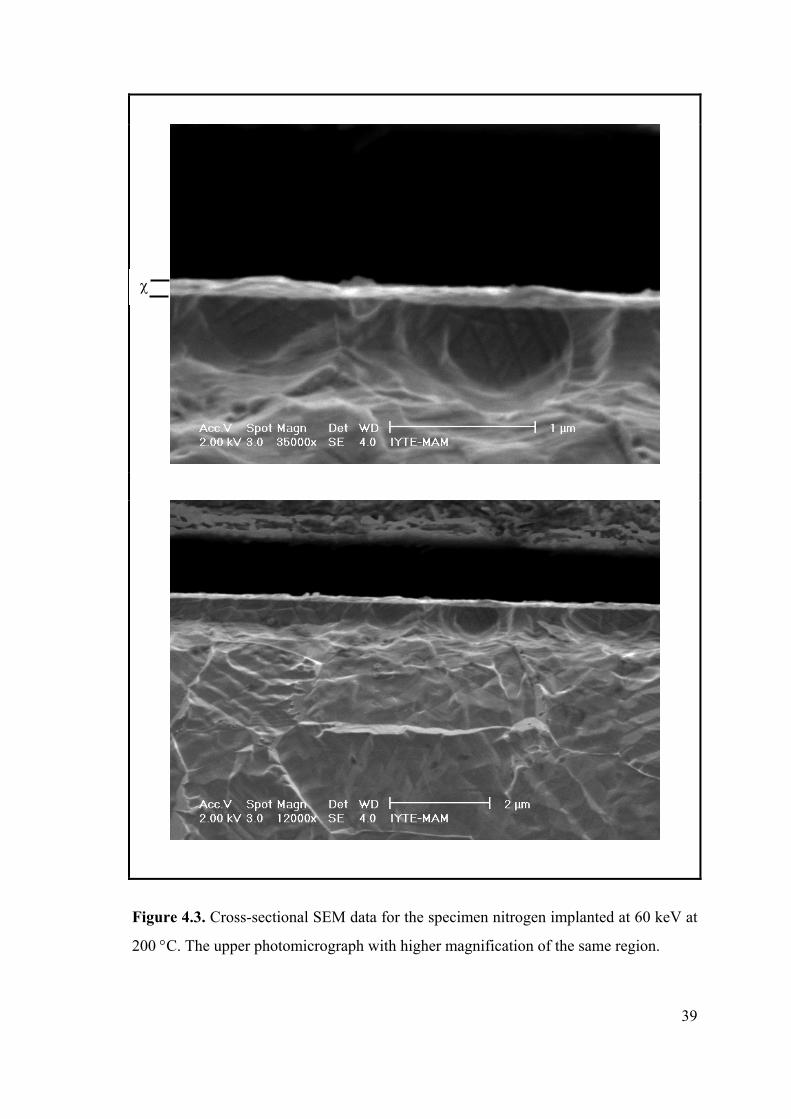
39
Figure 4.3. Cross-sectional SEM data for the specimen nitrogen implanted at 60 keV at
200 C. The upper photomicrograph with higher magnification of the same region.
40
thin N implanted layers for the specimens implanted at 100 and 200 C substrate
temperatures.
Figure 4.4 shows the SEM results for the 60 keV, 400 C nitrogen implanted
specimen. Both photomicrographs reveal the N implanted layer much more clearly than
those of the 60 keV, at 100 and 200 C samples. The SEM pictures clearly illustrate the
extremely uniform nature of the N implanted layer, which is mainly composed of the N
phase, and is found to be distributed in a 0.39 µm based on the XRD data (see
Fig.3.1). The N layer thickness obtained from the upper photomicrograph in Fig.4.4 is
about 400 nm for the 60 keV at 400 °C N implanted specimen. The average N
implanted layer thickness (N layer thickness) for the 60 keV, 400 C sample (based on
several photomicrographs) is found to be 450 nm. This depth correlates quite well with
that obtained from the XRD analysis (410 nm).
The SEM photomicrographs taken along the N implanted layer for the 30 keV at
100 C N implanted specimens are shown in Fig.4.5. These pictures also clearly show
the N implanted layer [(Co, Cr, Mo)2+xN nitride based on the XRD data] with a
relatively uniform layer thickness. The nitride layer thickness, based on the upper
photomicrograph in Fig.4.5 is 160 nm. The average N implanted layer thickness for the
30 keV at 100 C specimen (also based on several SEM pictures) is found to be 150 nm.
This result is quite similar to those found for the 60 keV at 100 C N implanted
specimen (see Fig.4.2).
The SEM pictures for the 30 keV at 200 C nitrogen implanted specimen
(Fig.4.6) indicate that the N implanted layer and composed of (Co, Cr, Mo) 2+xN nitride
(based on the XRD result) is slightly thicker than that for the 30 keV at 100 C sample.
The average nitride layer thickness, based on several pictures, for the 30 keV at 200 °C
sample was found to be about 250 nm. Note that the electrochemical etch used
(HCl+H2O2) strongly attacks the substrate () while the N implanted layer phase, (Co,
Cr, Mo) 2+xN, is not affected by the same etch. Also note that the N phase is not
attacked by the etchant used. In fact, as can be seen from Fig.4.4, the N phase is almost
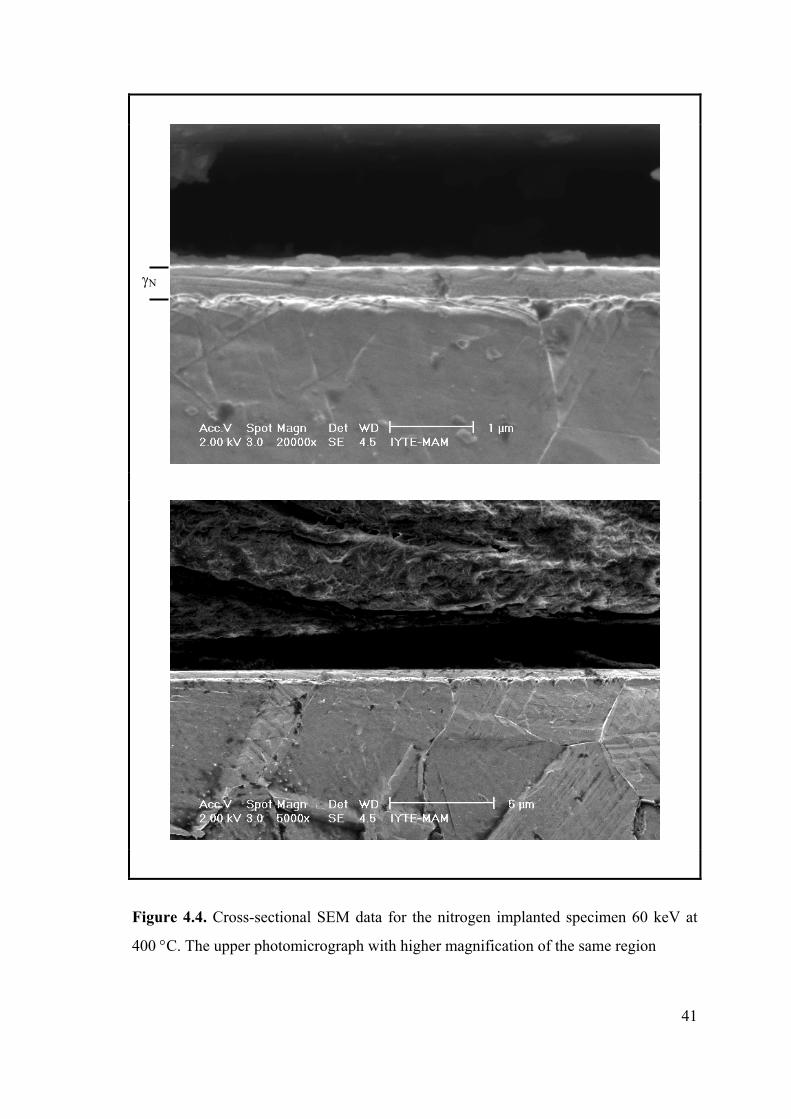
41
Figure 4.4. Cross-sectional SEM data for the nitrogen implanted specimen 60 keV at
400 C. The upper photomicrograph with higher magnification of the same region
N
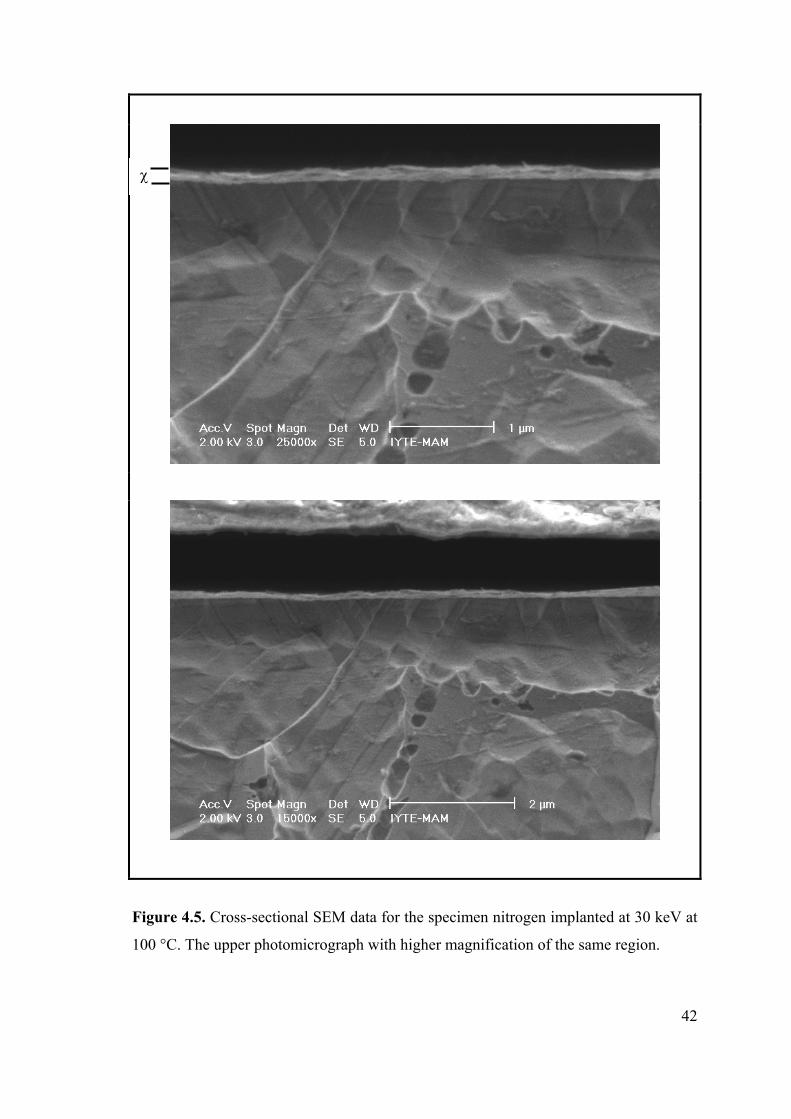
42
Figure 4.5. Cross-sectional SEM data for the specimen nitrogen implanted at 30 keV at
100 °C. The upper photomicrograph with higher magnification of the same region.
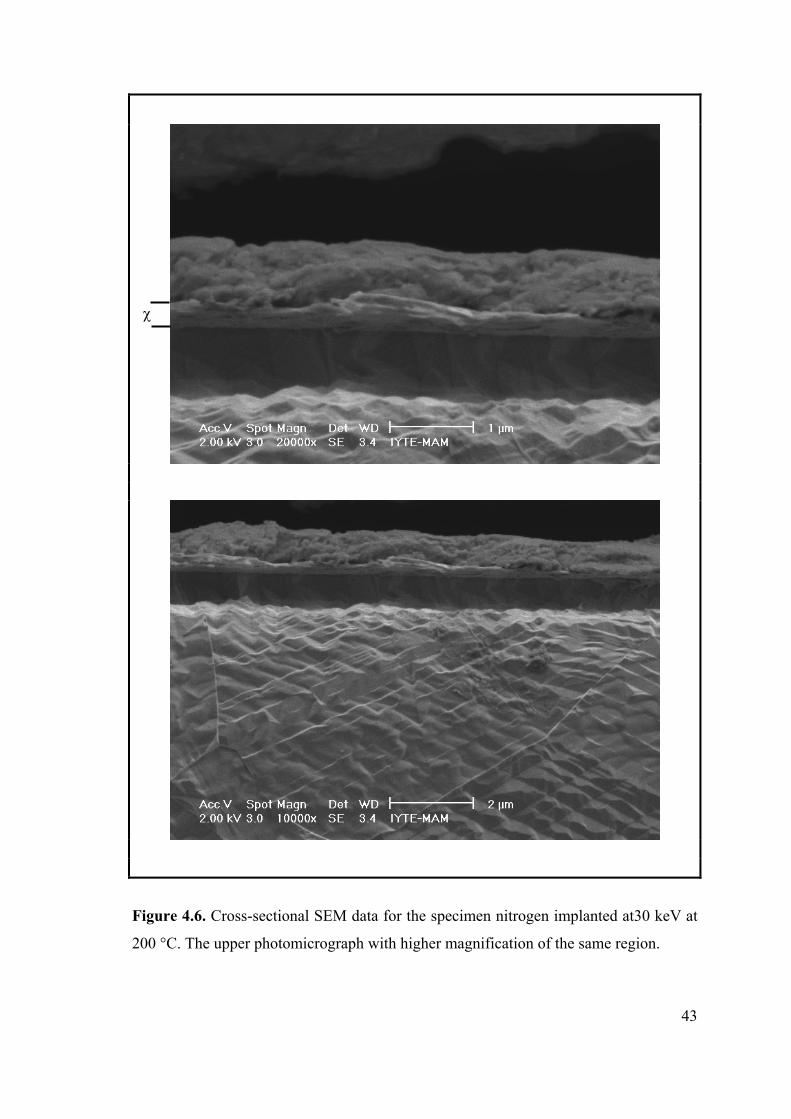
43
Figure 4.6. Cross-sectional SEM data for the specimen nitrogen implanted at30 keV at
200 °C. The upper photomicrograph with higher magnification of the same region.
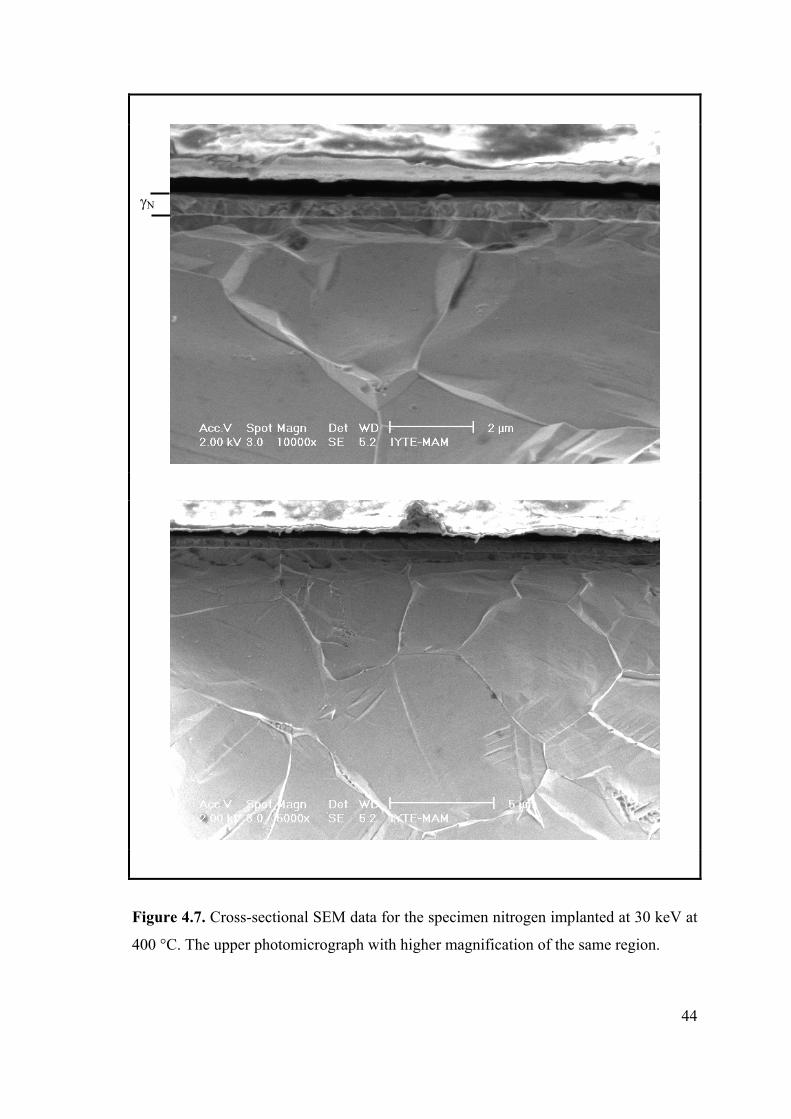
44
Figure 4.7. Cross-sectional SEM data for the specimen nitrogen implanted at 30 keV at
400 °C. The upper photomicrograph with higher magnification of the same region.
N
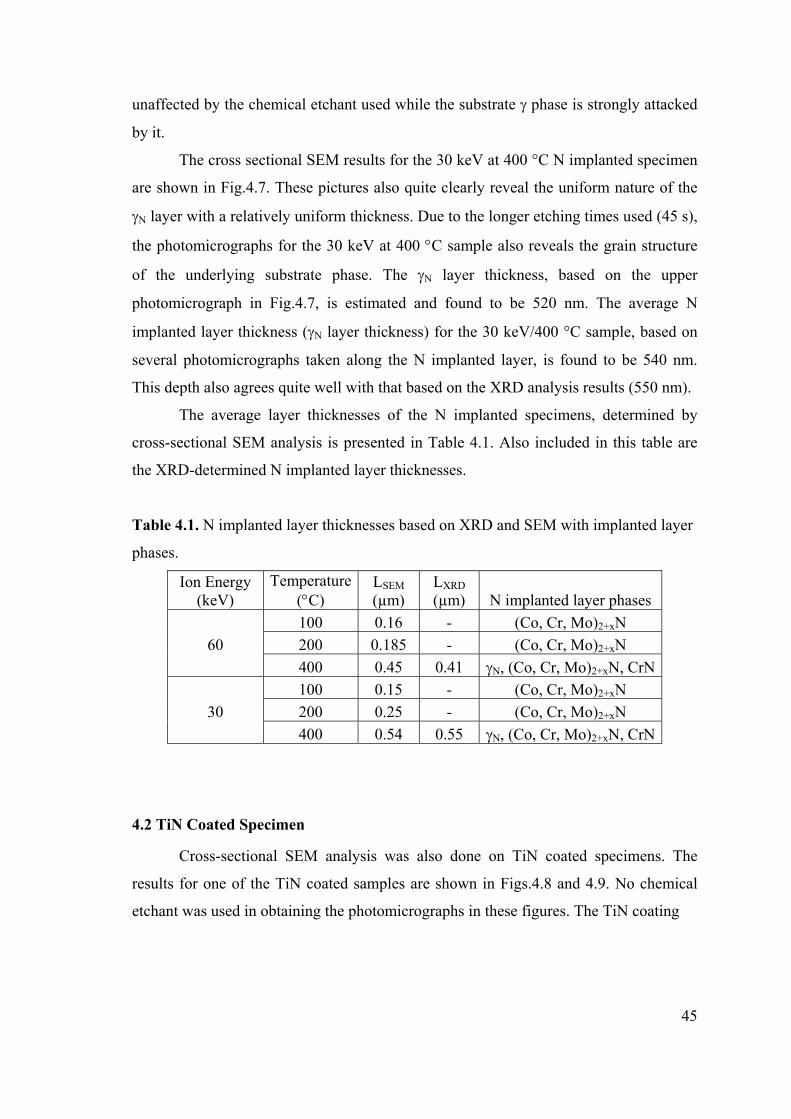
45
unaffected by the chemical etchant used while the substrate phase is strongly attacked
by it.
The cross sectional SEM results for the 30 keV at 400 °C N implanted specimen
are shown in Fig.4.7. These pictures also quite clearly reveal the uniform nature of the
N layer with a relatively uniform thickness. Due to the longer etching times used (45 s),
the photomicrographs for the 30 keV at 400 C sample also reveals the grain structure
of the underlying substrate phase. The N layer thickness, based on the upper
photomicrograph in Fig.4.7, is estimated and found to be 520 nm. The average N
implanted layer thickness (N layer thickness) for the 30 keV/400 °C sample, based on
several photomicrographs taken along the N implanted layer, is found to be 540 nm.
This depth also agrees quite well with that based on the XRD analysis results (550 nm).
The average layer thicknesses of the N implanted specimens, determined by
cross-sectional SEM analysis is presented in Table 4.1. Also included in this table are
the XRD-determined N implanted layer thicknesses.
Table 4.1. N implanted layer thicknesses based on XRD and SEM with implanted layer
phases.
Ion Energy (keV)
Temperature (C)
LSEM (µm)
LXRD (µm) N implanted layer phases
100 0.16 - (Co, Cr, Mo)2+xN
60 200 0.185 - (Co, Cr, Mo)2+xN
400 0.45 0.41 N, (Co, Cr, Mo)2+xN, CrN
100 0.15 - (Co, Cr, Mo)2+xN
30 200 0.25 - (Co, Cr, Mo)2+xN
400 0.54 0.55 N, (Co, Cr, Mo)2+xN, CrN
4.2 TiN Coated Specimen
Cross-sectional SEM analysis was also done on TiN coated specimens. The
results for one of the TiN coated samples are shown in Figs.4.8 and 4.9. No chemical
etchant was used in obtaining the photomicrographs in these figures. The TiN coating
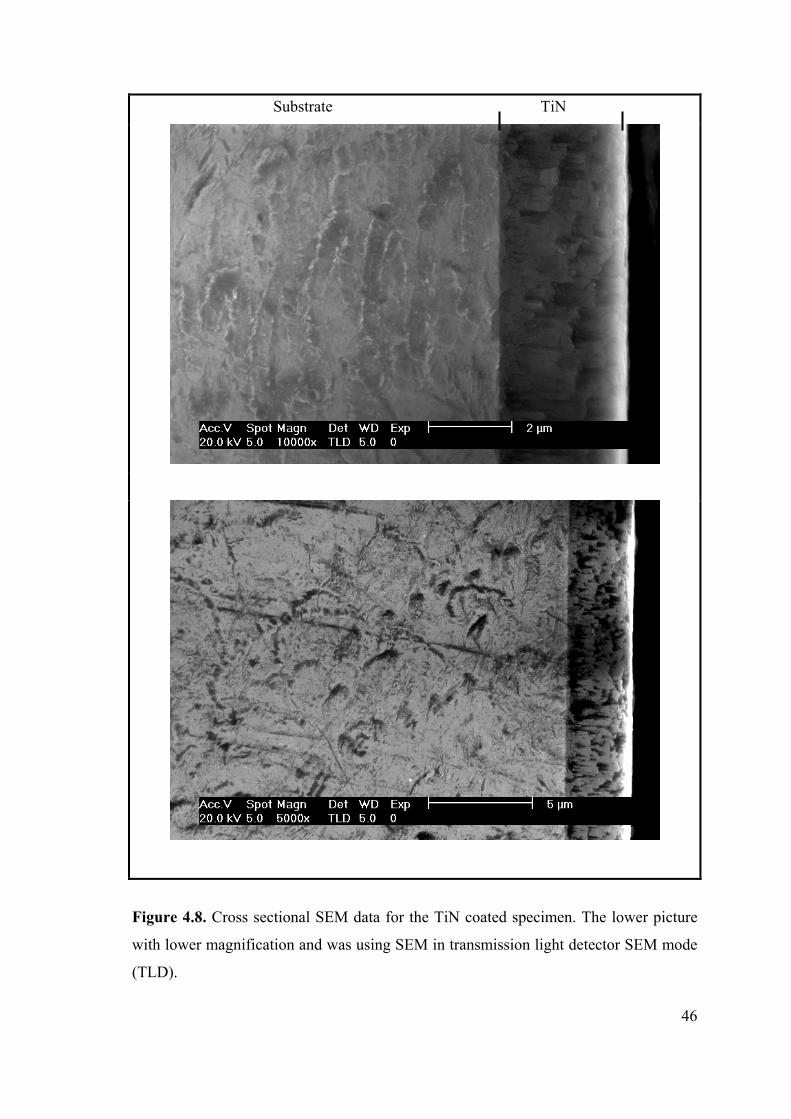
46
Substrate TiN
Figure 4.8. Cross sectional SEM data for the TiN coated specimen. The lower picture
with lower magnification and was using SEM in transmission light detector SEM mode
(TLD).
47
Figure 4.9. Surface morphology of the TiN coated specimen. The lower picture shows
the porous structure of the TiN film.
48
thickness, based on the upper picture in Fig.5.8 is about 3 µm. Both pictures in this
figure reveal the TiN deposited layer with a relatively uniform thickness. Careful
examination of quite a few photomicrographs indicates the growth mode for TiN
coating was of columnar type. This finding is also similar for literature study.
Fig.4.8 also suggests good adhesion of TiN coating on the CoCrMo alloy
substrate. The surface morphology of TiN coated specimen is shown in Fig. 4.9
SEM was also performed in EDX mode for the TiN coated specimen and the
EDX analysis results are shown in Table 4.2. As can be seen from this table, Ti/N
atomic percentage ratio is not close to 1 (It is about 0.54). This result suggests not a
good film stoichiometry.
Table 4.2. EDX results from TİN coated specimen.
TiN Coating Elements (at. %)
Ti 35
N 65
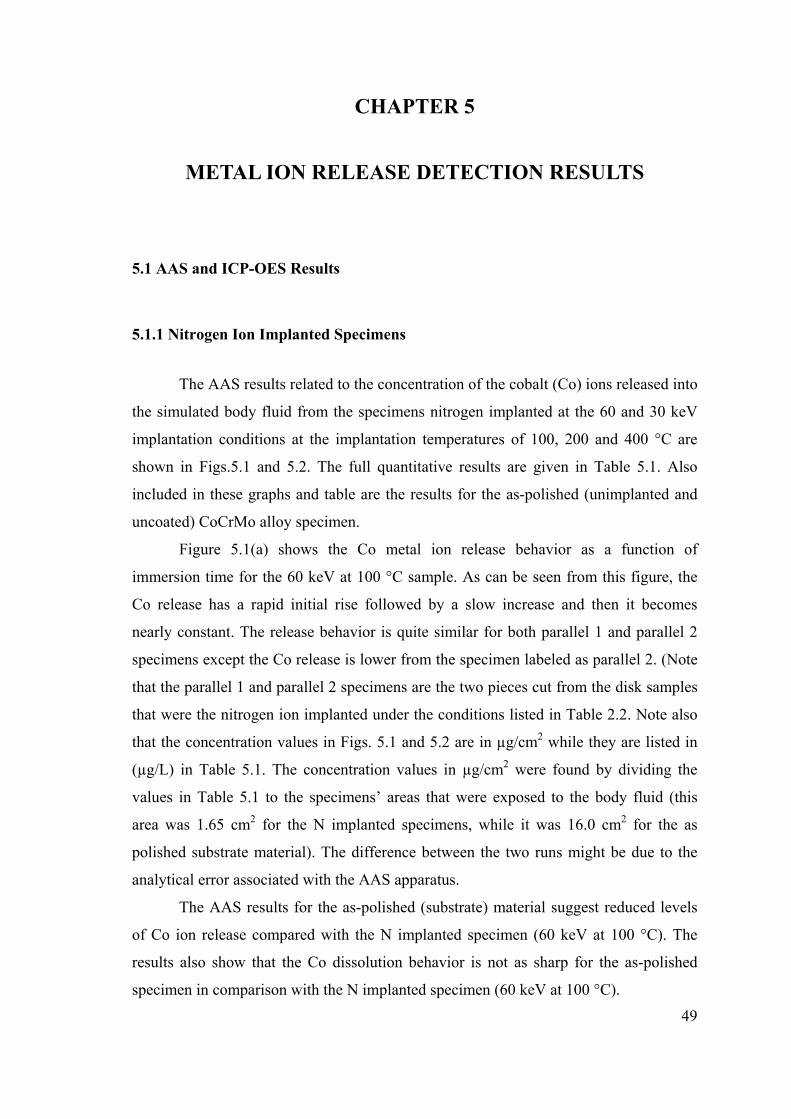
49
CHAPTER 5
METAL ION RELEASE DETECTION RESULTS
5.1 AAS and ICP-OES Results
5.1.1 Nitrogen Ion Implanted Specimens
The AAS results related to the concentration of the cobalt (Co) ions released into
the simulated body fluid from the specimens nitrogen implanted at the 60 and 30 keV
implantation conditions at the implantation temperatures of 100, 200 and 400 °C are
shown in Figs.5.1 and 5.2. The full quantitative results are given in Table 5.1. Also
included in these graphs and table are the results for the as-polished (unimplanted and
uncoated) CoCrMo alloy specimen.
Figure 5.1(a) shows the Co metal ion release behavior as a function of
immersion time for the 60 keV at 100 °C sample. As can be seen from this figure, the
Co release has a rapid initial rise followed by a slow increase and then it becomes
nearly constant. The release behavior is quite similar for both parallel 1 and parallel 2
specimens except the Co release is lower from the specimen labeled as parallel 2. (Note
that the parallel 1 and parallel 2 specimens are the two pieces cut from the disk samples
that were the nitrogen ion implanted under the conditions listed in Table 2.2. Note also
that the concentration values in Figs. 5.1 and 5.2 are in µg/cm2 while they are listed in
(µg/L) in Table 5.1. The concentration values in µg/cm2 were found by dividing the
values in Table 5.1 to the specimens’ areas that were exposed to the body fluid (this
area was 1.65 cm2 for the N implanted specimens, while it was 16.0 cm2 for the as
polished substrate material). The difference between the two runs might be due to the
analytical error associated with the AAS apparatus.
The AAS results for the as-polished (substrate) material suggest reduced levels
of Co ion release compared with the N implanted specimen (60 keV at 100 °C). The
results also show that the Co dissolution behavior is not as sharp for the as-polished
specimen in comparison with the N implanted specimen (60 keV at 100 °C).
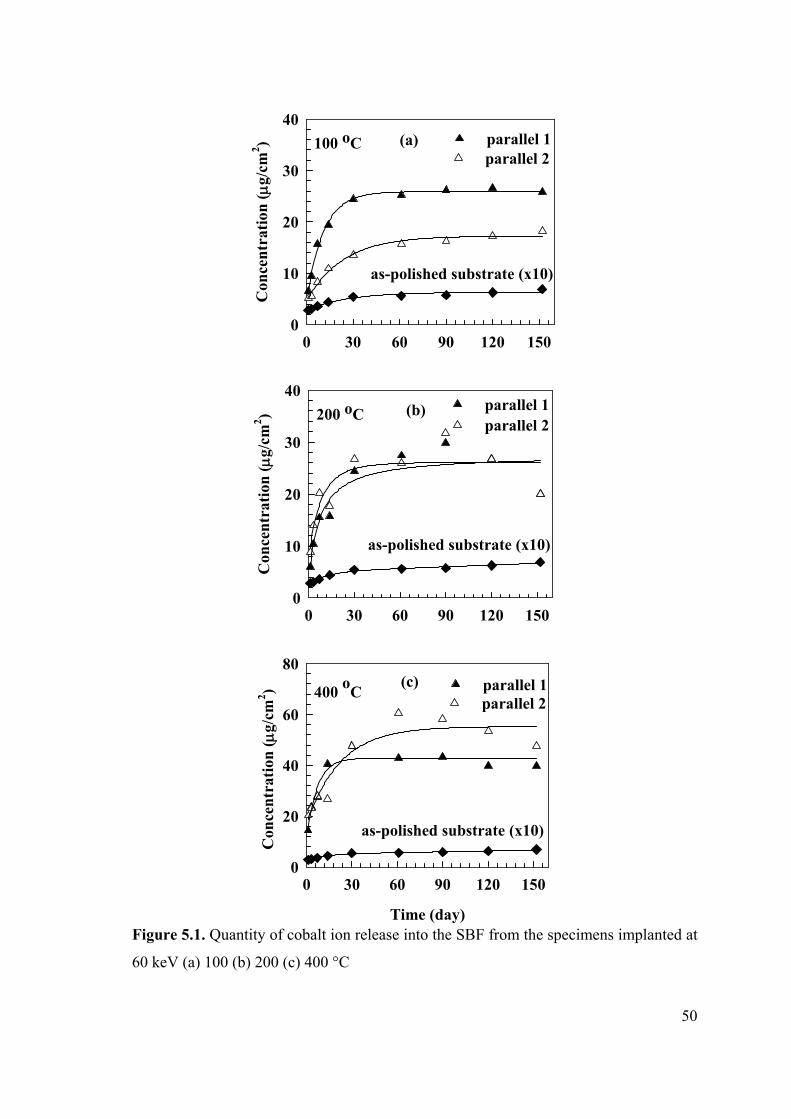
50
100 oC
0 30 60 90 120 150
Con
cen
trat
ion
(g
/cm
2 )
0
10
20
30
40parallel 1parallel 2
as-polished substrate (x10)
(a)
200 oC
0 30 60 90 120 150
Con
cen
trat
ion
(g
/cm
2 )
0
10
20
30
40parallel 1parallel 2
as-polished substrate (x10)
(b)
400 o
C
Time (day)
0 30 60 90 120 150
Con
cen
trat
ion
(g
/cm
2 )
0
20
40
60
80parallel 1parallel 2
as-polished substrate (x10)
(c)
Figure 5.1. Quantity of cobalt ion release into the SBF from the specimens implanted at
60 keV (a) 100 (b) 200 (c) 400 °C
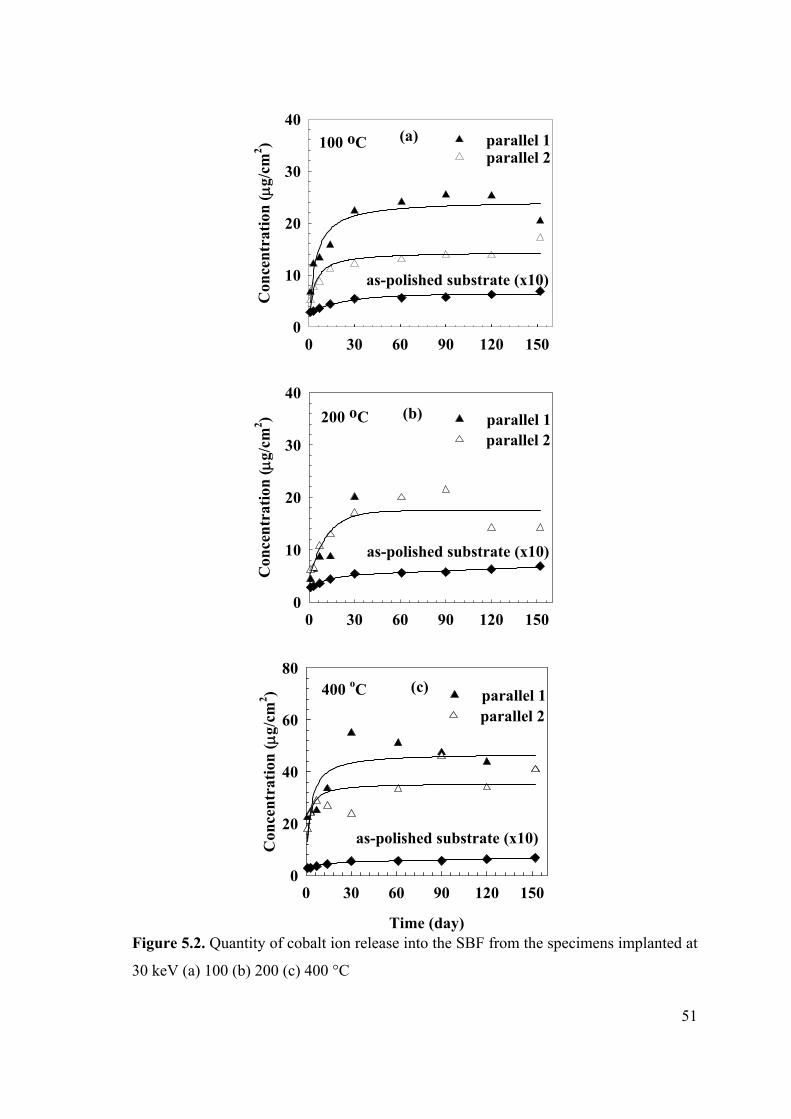
51
100 oC
0 30 60 90 120 150
Con
cen
trat
ion
(g
/cm
2 )
0
10
20
30
40parallel 1
as-polished substrate (x10)
parallel 2(a)
200 oC
0 30 60 90 120 150
Con
cen
trat
ion
(g
/cm
2 )
0
10
20
30
40
as-polished substrate (x10)
parallel 1(b)
parallel 2
400 oC
Time (day)
0 30 60 90 120 150
Con
cen
trat
ion
(g
/cm
2 )
0
20
40
60
80
parallel 2parallel 1
as-polished substrate (x10)
(c)
Figure 5.2. Quantity of cobalt ion release into the SBF from the specimens implanted at
30 keV (a) 100 (b) 200 (c) 400 °C
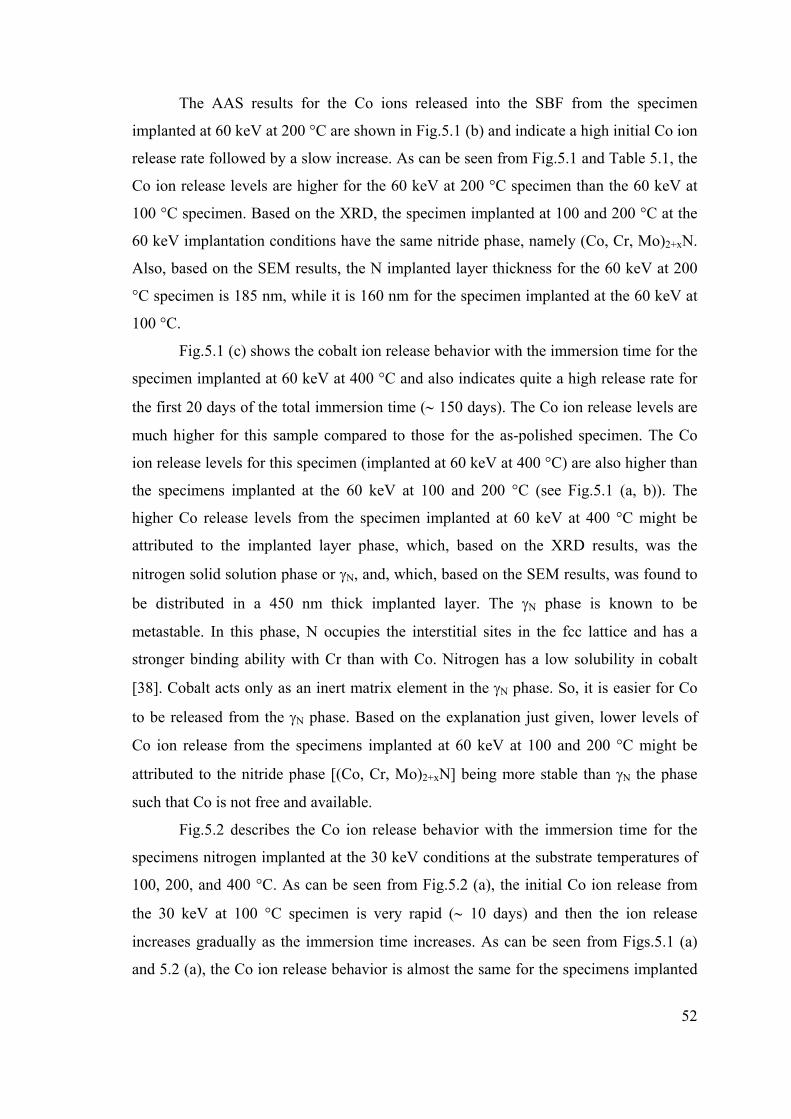
52
The AAS results for the Co ions released into the SBF from the specimen
implanted at 60 keV at 200 °C are shown in Fig.5.1 (b) and indicate a high initial Co ion
release rate followed by a slow increase. As can be seen from Fig.5.1 and Table 5.1, the
Co ion release levels are higher for the 60 keV at 200 °C specimen than the 60 keV at
100 °C specimen. Based on the XRD, the specimen implanted at 100 and 200 °C at the
60 keV implantation conditions have the same nitride phase, namely (Co, Cr, Mo)2+xN.
Also, based on the SEM results, the N implanted layer thickness for the 60 keV at 200
°C specimen is 185 nm, while it is 160 nm for the specimen implanted at the 60 keV at
100 °C.
Fig.5.1 (c) shows the cobalt ion release behavior with the immersion time for the
specimen implanted at 60 keV at 400 °C and also indicates quite a high release rate for
the first 20 days of the total immersion time ( 150 days). The Co ion release levels are
much higher for this sample compared to those for the as-polished specimen. The Co
ion release levels for this specimen (implanted at 60 keV at 400 °C) are also higher than
the specimens implanted at the 60 keV at 100 and 200 °C (see Fig.5.1 (a, b)). The
higher Co release levels from the specimen implanted at 60 keV at 400 °C might be
attributed to the implanted layer phase, which, based on the XRD results, was the
nitrogen solid solution phase or N, and, which, based on the SEM results, was found to
be distributed in a 450 nm thick implanted layer. The N phase is known to be
metastable. In this phase, N occupies the interstitial sites in the fcc lattice and has a
stronger binding ability with Cr than with Co. Nitrogen has a low solubility in cobalt
[38]. Cobalt acts only as an inert matrix element in the N phase. So, it is easier for Co
to be released from the N phase. Based on the explanation just given, lower levels of
Co ion release from the specimens implanted at 60 keV at 100 and 200 °C might be
attributed to the nitride phase [(Co, Cr, Mo)2+xN] being more stable than N the phase
such that Co is not free and available.
Fig.5.2 describes the Co ion release behavior with the immersion time for the
specimens nitrogen implanted at the 30 keV conditions at the substrate temperatures of
100, 200, and 400 °C. As can be seen from Fig.5.2 (a), the initial Co ion release from
the 30 keV at 100 °C specimen is very rapid ( 10 days) and then the ion release
increases gradually as the immersion time increases. As can be seen from Figs.5.1 (a)
and 5.2 (a), the Co ion release behavior is almost the same for the specimens implanted
53
at 100 °C but at different ion energies (60 and 30 keV) although the Co ion release
levels for the 30 keV at 100 °C is slightly lower.
As it can be seen from Fig.5.2(b), the initial Co ion release from the specimens
(parallel 1 and parallel 2) implanted at 30 keV at 200 °C is also very fast and the release
behavior is quite similar to those for the specimens implanted at 60 keV at 100 and 200
°C [see Fig.5.1 (a) and (b)]. The fact that the Co ion release behavior and levels are very
similar for the specimens implanted at 30 and 60 keV energies and at 100 and 200 °C
substrate temperatures may be explained by the observation (based on the XRD results)
that the N implanted layer phase, (Co, Cr, Mo)2+xN nitride, is the same for all the
specimens implanted at 30 and 60 keV and at 100 and 200 °C and is distributed in a
very thin implanted layer ( 100-200 nm).
The Co ion release results for the specimen implanted at 30 keV at 400 °C are
also shown in Fig.5.2 (c). The results indicate a high release rate for cobalt ions, in
particular for the first three time intervals (1, 3, 7 days). Also, the parallel 2 specimen
has similar release behavior but with slightly lower release levels. Compared to the 60
keV at 400 °C specimen, the specimen implanted at 30 keV at 400 °C has reduced
levels of cobalt ion release. Based on the XRD data, both specimens (60 keV at 400 °C
and 30 keV at 400 °C) have the same implanted crystal structure, namely the N phase.
However, the N implanted layer for the 30 keV at 400 °C specimen is thicker than that
for the 60 keV at 400 °C specimen (see Table 4.1)
A number of conclusions can be drawn from the AAS results presented above.
Firstly, the results suggest that the N implanted layers do not have any beneficial effect
for reducing the levels of Co ions into the SBF. The AAS results indicate a clear
reduction in ion release with the immersion time for the as-polished sample
(unimplanted and uncoated) compared to the N implanted specimens. The reduced
levels of Co ion release for the as-polished material has probably something to do with
the native oxide layer which serves as a barrier to the release of the Co ions from the
CoCrMo alloy substrate. One research study [4] via x-ray photoelectron spectroscopy
(XPS) finds that the native oxide layer has a thickness of about 3 to 4 nm and is
composed of Cr2O3, CoO and Mo oxides.
Secondly, the Co ion dissolution behavior is quite different for the N implanted
specimens compared with the as-polished specimen suggesting different dissolution
mechanism(s) for the N implanted and unimplanted (as-polished) specimens. The ion
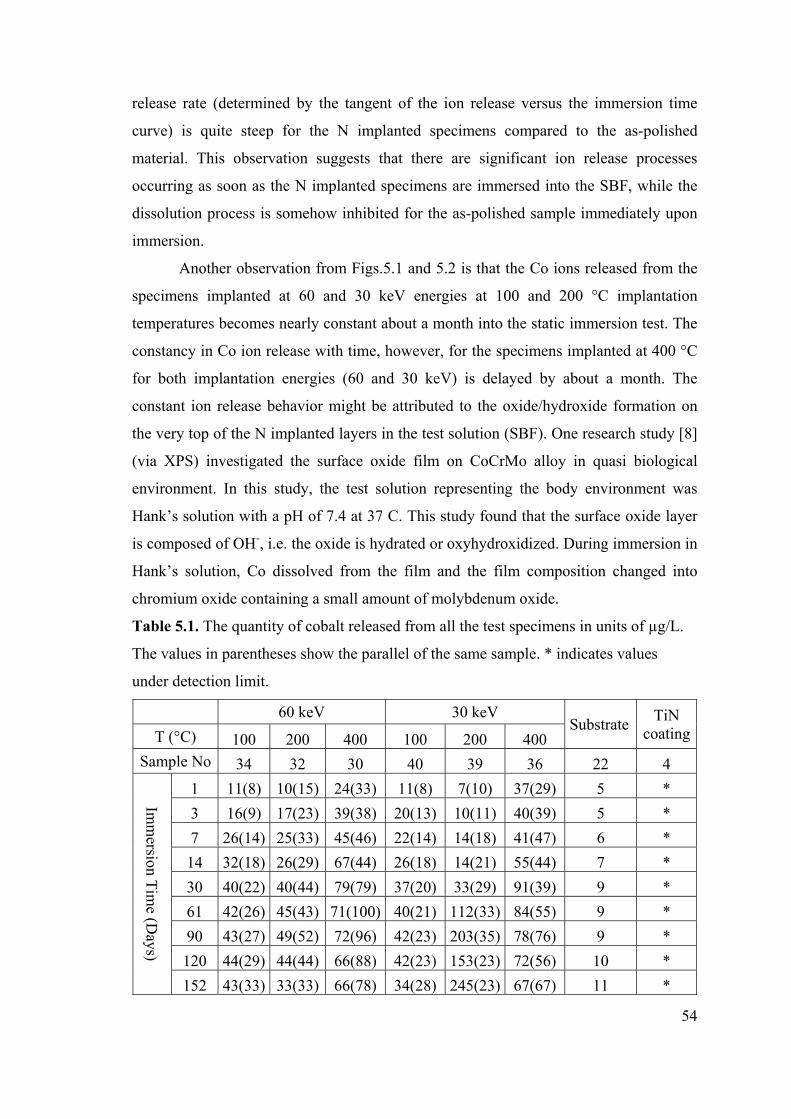
54
release rate (determined by the tangent of the ion release versus the immersion time
curve) is quite steep for the N implanted specimens compared to the as-polished
material. This observation suggests that there are significant ion release processes
occurring as soon as the N implanted specimens are immersed into the SBF, while the
dissolution process is somehow inhibited for the as-polished sample immediately upon
immersion.
Another observation from Figs.5.1 and 5.2 is that the Co ions released from the
specimens implanted at 60 and 30 keV energies at 100 and 200 °C implantation
temperatures becomes nearly constant about a month into the static immersion test. The
constancy in Co ion release with time, however, for the specimens implanted at 400 °C
for both implantation energies (60 and 30 keV) is delayed by about a month. The
constant ion release behavior might be attributed to the oxide/hydroxide formation on
the very top of the N implanted layers in the test solution (SBF). One research study [8]
(via XPS) investigated the surface oxide film on CoCrMo alloy in quasi biological
environment. In this study, the test solution representing the body environment was
Hank’s solution with a pH of 7.4 at 37 C. This study found that the surface oxide layer
is composed of OH-, i.e. the oxide is hydrated or oxyhydroxidized. During immersion in
Hank’s solution, Co dissolved from the film and the film composition changed into
chromium oxide containing a small amount of molybdenum oxide.
Table 5.1. The quantity of cobalt released from all the test specimens in units of µg/L.
The values in parentheses show the parallel of the same sample. * indicates values
under detection limit.
60 keV 30 keV Substrate
TiN coatingT (°C) 100 200 400 100 200 400
Sample No 34 32 30 40 39 36 22 4
Imm
ersion Tim
e (Days)
1 11(8) 10(15) 24(33) 11(8) 7(10) 37(29) 5 *
3 16(9) 17(23) 39(38) 20(13) 10(11) 40(39) 5 *
7 26(14) 25(33) 45(46) 22(14) 14(18) 41(47) 6 *
14 32(18) 26(29) 67(44) 26(18) 14(21) 55(44) 7 *
30 40(22) 40(44) 79(79) 37(20) 33(29) 91(39) 9 *
61 42(26) 45(43) 71(100) 40(21) 112(33) 84(55) 9 *
90 43(27) 49(52) 72(96) 42(23) 203(35) 78(76) 9 *
120 44(29) 44(44) 66(88) 42(23) 153(23) 72(56) 10 *
152 43(33) 33(33) 66(78) 34(28) 245(23) 67(67) 11 *
55
5.1.2 Epoxy Coated Specimens
Cobalt ion release into the SBF from the as-polished specimens coated with
epoxy resin was below the analytical detection limit. The detection limit for the AAS
cobalt analysis in the SBF was 0.5 µg/L (less than 1 ppb). The results for the epoxy
coated polished specimen suggest that the epoxy coating does provide some form of
physical barrier to Co dissolution. The results also indicate that the epoxy coating
prevented the Co dissolution from the unimplanted and uncoated (no TiN deposition)
sides of the N implanted and TiN coated disk specimens.
Chromium (Cr) and nickel (Ni) ions releases into the SBF from the as-polished,
N implanted and TiN coated specimens were also below the detection limits for both the
AAS Cr and Ni analyses in the SBF ( 0.5 µg/L).
Titanium (Ti) from TiN deposited CoCrMo alloy substrates and molybdenum
(Mo) from all the test specimens were analyzed by means of inductively coupled optical
emission spectrometry (ICP-OES). The ion releases for those two elements (Ti and Mo)
are also found to be below the detection limit. The analytical detection limits for Ti and
Mo were 30 and 20 µg/L, respectively.
5.1.3 TiN Coated Specimens
The AAS and ICP-OES results indicate that cobalt and titanium ion releases
from the specimen coated with TiN are below the analytical detection limits. Based on
the AAS results, the detection limit was 0.5 µg/L for Co, while it was 30 µg/L for Ti
(based on the ICP-OES results). The results clearly show that the TiN coating can
provide an effective barrier to the release of potentially harmful ions (Co) from the
CoCrMo alloy.
A much earlier investigation (via AAS) related to metallic dissolution products
released from an uncoated polished and TiN coated CoCrMo alloy after 550 h into the
saline solution (0.17 M NaCl + 2.7x10⁻³ M EDTA at 37 °C) also found that the presence
of the coating substantially reduced the concentration of dissolved ions, particularly
cobalt. Based on this study, however the reduced release of Co, Cr and Mo ions from
the coated specimen was accompanied by a release of Ti ions from the coating itself as
opposed to our findings in this study. The reason for this might have something to do
56
with the fact that the TiN coating thickness is 3 µm in our case while it was 2 µm for
the study mentioned in Ref [25].
In another study, the electrodeposition of a thin ZrO2 ceramic coating on the Co-
Cr alloy was found to be a good method for the prevention of ion release from Co-Cr
alloys used in dental implants. In this study [26], the accelerated corrosion test was
conducted on uncoated and ZrO2 coated Co-Cr alloy (with compositions very similar to
the one used in this study). The AAS results showed that the ion release for Co and Cr
was increased with increasing exposure time and amount of cobalt released was greater
than that of chromium for the uncoated specimen. The metal ion release of the ZrO2-
coated specimens was much less that that of the uncoated specimen.
5.1.4 pH Variation During The Immersion Test
During the immersion tests, the pH value of the SBF was also monitored as a
function of the immersion time. The results are shown in Table 5.2. As can be seen from
this table, there is a steady increase in the pH values of the SBF containing various test
specimens. For example, the pH value for the SBF containing the specimen implanted at
60 keV at 200 °C had a value of 7.40 at the beginning of the immersion test and a value
of 7.66 at the end of the test (after 120 days). The pH values followed the same trend
and range for most of the N implanted samples as well as the as-polished and epoxy
coated specimens. Changes in the pH of body fluid are small because the fluid is
buffered with THAM solutions to stabilize the pH. So, the pH usually remains at 7.4
and 7.6.
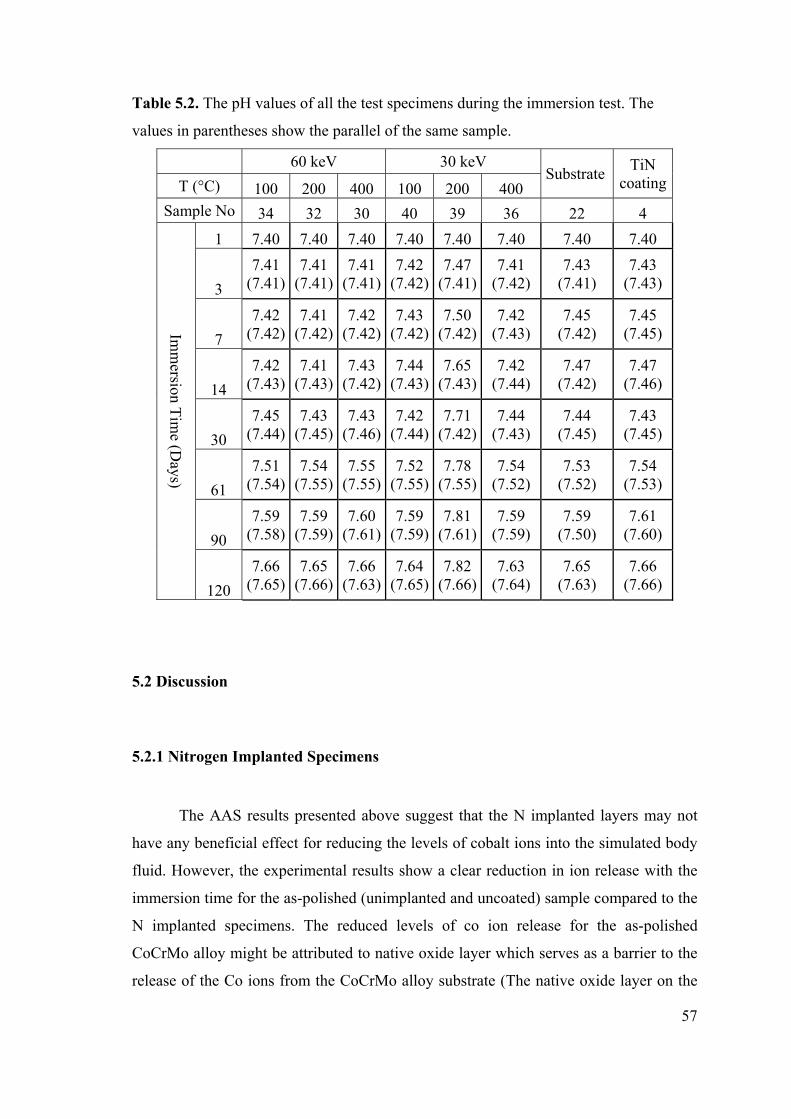
57
Table 5.2. The pH values of all the test specimens during the immersion test. The
values in parentheses show the parallel of the same sample.
60 keV 30 keV Substrate
TiN coatingT (°C) 100 200 400 100 200 400
Sample No 34 32 30 40 39 36 22 4
Imm
ersion Tim
e (Days)
1 7.40 7.40 7.40 7.40 7.40 7.40 7.40 7.40
3
7.41 (7.41)
7.41 (7.41)
7.41 (7.41)
7.42 (7.42)
7.47 (7.41)
7.41 (7.42)
7.43 (7.41)
7.43 (7.43)
7
7.42 (7.42)
7.41 (7.42)
7.42 (7.42)
7.43 (7.42)
7.50 (7.42)
7.42 (7.43)
7.45 (7.42)
7.45 (7.45)
14
7.42 (7.43)
7.41 (7.43)
7.43 (7.42)
7.44 (7.43)
7.65 (7.43)
7.42 (7.44)
7.47 (7.42)
7.47 (7.46)
30
7.45 (7.44)
7.43 (7.45)
7.43 (7.46)
7.42 (7.44)
7.71 (7.42)
7.44 (7.43)
7.44 (7.45)
7.43 (7.45)
61
7.51 (7.54)
7.54 (7.55)
7.55 (7.55)
7.52 (7.55)
7.78 (7.55)
7.54 (7.52)
7.53 (7.52)
7.54 (7.53)
90
7.59 (7.58)
7.59 (7.59)
7.60 (7.61)
7.59 (7.59)
7.81 (7.61)
7.59 (7.59)
7.59 (7.50)
7.61 (7.60)
120
7.66 (7.65)
7.65 (7.66)
7.66 (7.63)
7.64 (7.65)
7.82 (7.66)
7.63 (7.64)
7.65 (7.63)
7.66 (7.66)
5.2 Discussion
5.2.1 Nitrogen Implanted Specimens
The AAS results presented above suggest that the N implanted layers may not
have any beneficial effect for reducing the levels of cobalt ions into the simulated body
fluid. However, the experimental results show a clear reduction in ion release with the
immersion time for the as-polished (unimplanted and uncoated) sample compared to the
N implanted specimens. The reduced levels of co ion release for the as-polished
CoCrMo alloy might be attributed to native oxide layer which serves as a barrier to the
release of the Co ions from the CoCrMo alloy substrate (The native oxide layer on the
58
surface of CoCrMo alloy has a thickness of about 3 to 4 nm and is mainly composed of
Cr2O3, CoO and Mo-oxides [4]). On the other hand, the increased levels of Co ion
release from the N implanted samples might be explained by the fact that the top N
implanted layers ( few nm) do not inhibit the dissolution of cobalt ions in the
implanted layer.
The AAS experimental results also show that the specimens nitrogen implanted
at a substrate temperature of 400 °C and at both implantation energies (30 and 60 keV)
have higher Co ions release levels than the specimens implanted at the substrate
temperatures of 100 and 200 °C and at the same energies. This difference might be
attributed to the N implanted layer phases formed on the CoCrMo alloy under these N
implantation conditions. Based on the XRD results, the implanted layer phase for the
specimens implanted at 400 °C at 30 and 60 keV was the nitrogen solid solution phase,
N. The implanted layer phase, on the other hand, for the specimens implanted at 30 and
60 keV ion energies and at 100 and 200 °C substrate temperatures was found to be (Co,
Cr, Mo)2+XN nitride. In the N phase, N occupies the interstitial sites in the fcc lattice
and it has a stronger binding ability with Cr than with Co (cobalt acts only as inert
matrix element in the N phase). So, during in vitro exposure of the N phase layer, it is
easier for Co to be released from the N phase. Based on the explanation just given, the
limited dissolution of Co ions from the specimens implanted at 30 and 60 keV at 100
and 200 °C conditions might be attributed to the nitride phase [(Co, Cr, Mo)2+xN] being
more stable than the N phase such that Co is not free and available (i.e, due to the
stronger bonds of metal-N than those of the N phase).
As to why the Co ion release levels are higher for the N implanted specimens
compared to the as-polished CoCrMo alloy, a detailed analysis of the top surface layers
( few nm) is necessary. The dissolution behavior of an implant material is affected by a
number of surface controlled factors including the surface condition and nature of the
oxide layer. The surface condition involves the smoothness of the materials (CoCrMo
alloy) surface, i.e, roughness. The root mean square (RMS) roughness for the as-
polished specimens was 0.05 µm. While the RMS values for the N implanted
specimens were not measured, the SEM (see Figs. 6.2, 6.3, 6.4, 6.5, 6.6 and 6.7)
pictures clearly indicate much rougher surfaces for the N implanted surfaces in
59
comparison with the as-polished surface. The SEM results suggest that significant
sputtering took place during the N ion implantation of the original surface (as-polished).
It is clear that the N implanted specimens have much rougher surfaces compared
to the as-polished material (CoCrMo alloy). As a consequence, a greater surface area is
available for metal ion release from the N implanted surfaces via oxide dissolution or
micro-scale corrosion reactions, which are explained in detail in Appendix. A recent
study [39] investigating the effect of surface roughening on metal ion release found
higher levels of aluminum ion release from Ti-6Al-4V titanium alloy femoral stems that
were grit blasted compared to polished Ti-6Al-4V stems. The grit blasted specimens
had a surface roughness of 4.0 µm, while the polished stems had a roughness of about
1.0 µm. In this study, the immersion solution was sterile foetal calf serum, and prior to
immersion, the polished and grit blasted stems were treated to different surface oxide
conditions, one of which involved immersing the stems in 30 % nitric acid for 16 h and
the other involved aging the stems in boiling de-ionized water for 10 h. This
investigation further showed that for both surface conditions (polishing and grit
blasting), the ageing treatment was much more effective in reducing Al metal ion
release compared with the nitric acid passivation treatment (which is a typical
commercial treatment) due to the less stable oxide in the case of the passivated oxide.
In addition to the surface roughness argument that was used to explain higher Co
ion release levels from the N implanted surfaces, a detailed analysis of oxide layer(s)
formed on the N implanted surfaces both before and after the immersion tests seems to
be necessary. There is no conclusive evidence on the formation an oxide film based on
the experimental results in this study. An oxide layer might have formed during the
nitrogen implantation of the as-polished CoCrMo alloy materials. It is possible that a
thin oxide layer might form on the surfaces of the N implanted specimens in air after
implantation. In fact, a plasma immersion ion implantation (PI3) study of 316 stainless
steel (with similar crystal structure to the CoCrMo alloy) gives some evidence of an
oxide layer formation on the N implanted surface [34]. In this study, the PI3 was
performed for 4 h for various substrate bias voltages on 316 SS at a substrate
temperature of 400 °C (this is the implantation temperature where the N phase/layer
forms on the fcc (Fe, Cr, Ni) stainless steels and the CoCrMo alloy and the N implanted
surface was investigated by GIXRD and XPS. The GIXRD results indicated the
formation of expanded austenite phase (N). In addition, the XPS analysis showed the
60
formation of chromium nitride (CrN) and chromium oxide near the surface (in the first
175 Å of the substrate). Beyond the depth of 175 Å, only expanded austenite (N phase)
was present, while the oxide and CrN layer was absent. Based on the findings in Ref.
[34], our N implanted layers might have a thin oxide layer, which is probably formed on
the very top (in the first 50 to 100 Å) of the N implanted layer.
The lower levels of Co ion release from the as-polished CoCrMo alloy as
compared to the N implanted specimens has probably something to do with the native
oxide layer, which may serve as a barrier to the release of the Co ions from the CoCrMo
alloy substrate. The XPS studies indicate that the native oxide layer has a thickness of
about 3 to 4 nm and is mainly composed of Cr2O3 with some amount of CoO and Mo-
oxides [4].
The native oxide layer is found to inhibit the metal ion release from the
specimens but is not always stable and sufficient. T. Hanawa et al. [8] investigated the
surface oxide film on CoCrMo alloy. The surface oxide film on the alloy polished
mechanically in de-ionized water consisted of oxides of cobalt and chromium with a
small amount of molybdenum, and its thickness was about 2.5 nm. The surface film was
found to contain a large amount of OH-. During immersion in Hank’s solution and
culture medium and cell culture, cobalt dissolved from the film and its composition
changed into chromium oxide containing a small amount of molybdenum oxide. This
study (via XPS) explained that the dissolution is enhanced by the outward migration of
cobalt in the surface oxide film.
In order to reduce the metal contamination, during sampling of human tissue,
surgical instruments undergoes modification named as passivation. In industry, hot,
concentrated nitric acid treatment is usually performed to passivate the implants before
sampling the human. The passive film affects the corrosion resistance of the material.
The stronger the passive film, the higher the corrosion resistance of the implants. The
quantities of released metals changed depending on the nature and strength of the metal
oxide bond, structure, composition and thickness of oxide films. The oxide film formed
on the Co-Cr-Mo alloy mainly consists of Cr2O3 [4]. In our study, nitrogen ion
implanted and as-polished specimens were not passivated before the in vitro static
immersion test. If the specimens were to be passivated, the metal ion release might be
reduced. In the absence of passive films, the driving force for corrosion of metallic
orthopedic implant alloys is very high, and corrosion rates would also be high. The
61
integrity of these films has been strongly correlated to the chemical and mechanical
stability of orthopedic implants (see Appendix).
The experimental results in Figs. 5.1 and 5.2 clearly indicate different Co ion
dissolution behavior for the N implanted specimens in comparison with the as-polished
specimen suggesting different dissolution mechanism(s) for the N implanted and
unimplanted specimens. As can be seen from Figs. 5.1 and 5.2, the Co ion release is
quite steep for the N implanted specimens compared to the as-polished material. This
observation suggests there are significant ion release processes occurring as soon as the
N implanted specimens are immersed into the SBF, while the dissolution process is
somehow inhibited for the as-polished specimens immediately upon immersion.
It might be possible to extract some information regarding the kinetics of the
dissolution process from the data in Figs. 5.1 and 5.2. As can be seen from this graph,
the ion release rate (determined by the tangent of the ion release versus the immersion
time curve) is quite sharp for the N implanted specimens compared to the as-polished
material. The higher ion release rate for the N implanted specimens suggests a higher
rate constant. The data in Figs. 5.1 and 5.2 suggest a diffusion or transport controlled
dissolution process [39].
Besides the explanation given above about the metal ion release, the
electrochemical etch used in this study (HCl+H2O2) strongly attacks the substrate ()
while the N implanted layer phase, (Co, Cr, Mo)2+xN, is not affected by the same etch.
Also the N phase is not attacked by the same etchant (see section 4.1). This suggests
that the N and (Co, Cr, Mo)2+xN layers show a high acid etch resistance compared to
unimplanted CoCrMo substrate.
5.2.2 TiN Coated Specimens
The experimental AAS and ICP-OES analyses showed that cobalt and titanium
ion release from the specimens coated with TiN were below the analytical detection
limits. These results suggest that TiN is an effective barrier for reducing the metal ion
release from the CoCrMo alloy substrate. A. Wisbey et al. [25] investigated TiN coating
on CoCrMo alloy (also via PVD technique) and found that TiN coating is an effective
barrier to the release of cobalt and chromium ions from the CoCrMo substrate.
62
However, the reduced levels of Co, Cr and Mo ions from the coated specimen was
accompanied by a release of Ti ions from the coating itself as opposed to our findings in
this study. This study further indicated that the TiN coating was less efficient in
reducing molybdenum release than that of cobalt chromium. This was attributed to the
porosity of the coating on the surface of the substrate.
Due to its superior mechanical properties and corrosion resistance, titanium
nitride (TiN) is one of the most widely chosen coating materials. However, due to a
difference in thermal expansion coefficients between the coating and substrate
(CoCrMo alloy) material, some structural defects such as pores, pinholes and cracks
may occur on the surface of TiN coating. These kinds of defects act as a channel for
corrosive media. Once aggressive ions penetrate the coating through these defects,
galvanic cells form at the interface. Then, the exposed area will anodically dissolve
extending along the coating/substrate interface and finally leading to the removal of
entire coating by flaking [38].
In our case, it is rather surprising to find that no cobalt ions were released from
the TiN coated substrate material. Perhaps the coating thickness, which was 3 µm, was
an important factor in affecting the ion release. It is found that the corrosion property of
the TiN-coated metal substrate is mainly determined by the synergistic effect of packing
factor and coating thickness. The packing factor represents the denseness of the film,
while the coating thickness relates to the length of the diffusion path of the corrosive
media.
5.2.3 Metal Ion Release Levels
Although the AAS results indicate higher release levels for Co into the SBF for
the N implanted specimens, the ion levels probably remain below any toxic levels. The
total release values after 150 days for the 60 keV ion implanted specimens at 10, 200
and 400 °C are 38, 33 and 69 µg/L (µg/L 1 ppb), respectively. This value is 11 µg/L
for the as-polished material (see Table 5.1).
The toxic effects of metals (Co, Cr and Ni) released from implants are an
important point for the biomedical safety of implants. Cobalt and chromium are the
major constituents of the alloy used for metal on metal hip joints. These metals occur
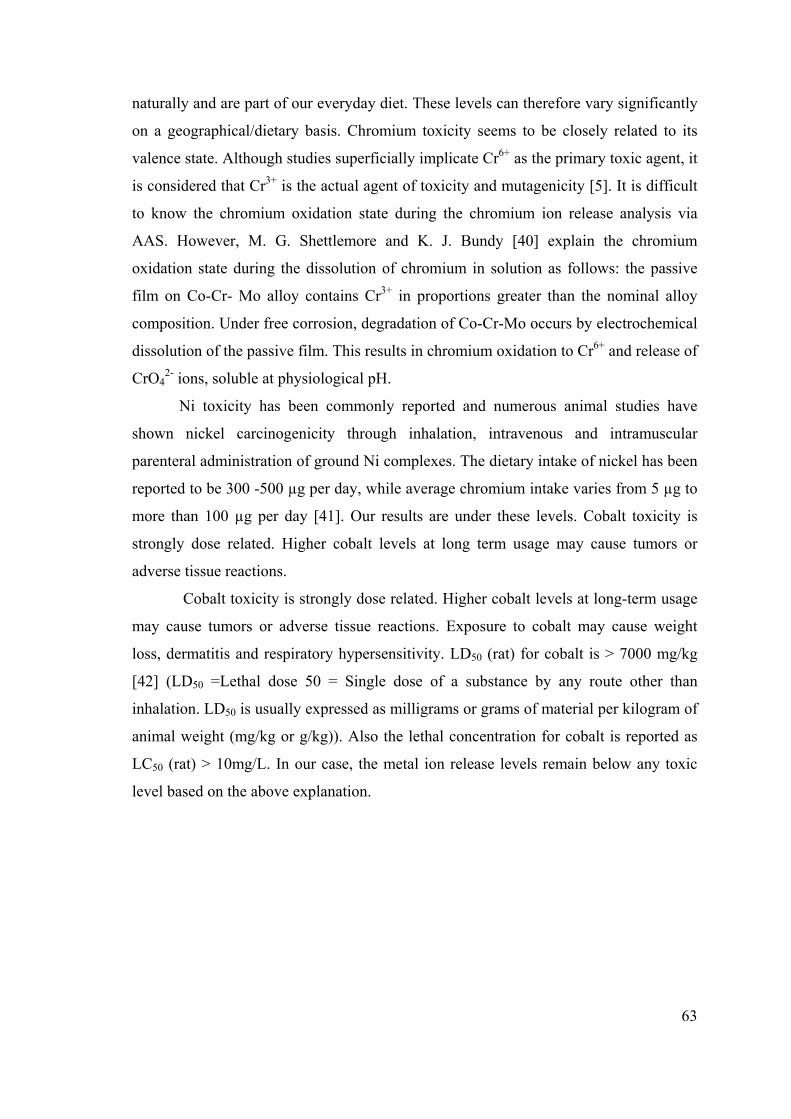
63
naturally and are part of our everyday diet. These levels can therefore vary significantly
on a geographical/dietary basis. Chromium toxicity seems to be closely related to its
valence state. Although studies superficially implicate Cr6+ as the primary toxic agent, it
is considered that Cr3+ is the actual agent of toxicity and mutagenicity [5]. It is difficult
to know the chromium oxidation state during the chromium ion release analysis via
AAS. However, M. G. Shettlemore and K. J. Bundy [40] explain the chromium
oxidation state during the dissolution of chromium in solution as follows: the passive
film on Co-Cr- Mo alloy contains Cr3+ in proportions greater than the nominal alloy
composition. Under free corrosion, degradation of Co-Cr-Mo occurs by electrochemical
dissolution of the passive film. This results in chromium oxidation to Cr6+ and release of
CrO42- ions, soluble at physiological pH.
Ni toxicity has been commonly reported and numerous animal studies have
shown nickel carcinogenicity through inhalation, intravenous and intramuscular
parenteral administration of ground Ni complexes. The dietary intake of nickel has been
reported to be 300 -500 µg per day, while average chromium intake varies from 5 µg to
more than 100 µg per day [41]. Our results are under these levels. Cobalt toxicity is
strongly dose related. Higher cobalt levels at long term usage may cause tumors or
adverse tissue reactions.
Cobalt toxicity is strongly dose related. Higher cobalt levels at long-term usage
may cause tumors or adverse tissue reactions. Exposure to cobalt may cause weight
loss, dermatitis and respiratory hypersensitivity. LD50 (rat) for cobalt is > 7000 mg/kg
[42] (LD50 =Lethal dose 50 = Single dose of a substance by any route other than
inhalation. LD50 is usually expressed as milligrams or grams of material per kilogram of
animal weight (mg/kg or g/kg)). Also the lethal concentration for cobalt is reported as
LC50 (rat) > 10mg/L. In our case, the metal ion release levels remain below any toxic
level based on the above explanation.
64
CHAPTER 6
SEM ANALYSIS AFTER THE IMMERSION TEST
After the immersion test, the surface morphologies of all the test specimens
(polished CoCrMo alloy, nitrogen implanted specimens, and TiN coated sample) were
investigated by scanning electron microscopy. Also, qualitative and quantitative
elemental analysis of the test specimen’s surfaces was carried out by energy dispersive
x-ray (EDX) analysis. Before the SEM/EDX analysis, all the test specimens were
washed with distilled water to remove chemical species that were physically adsorbed
but not chemically incorporated in the surface.
The SEM results after the immersion test for the polished substrate alloy
(CoCrMo) is shown in Fig. 6.1. The upper picture in this figure shows nearly full
coverage of the as-polished surface and suggests the precipitation has taken place. The
EDX analyses of these precipitates are listed in Table 6.1 and as can be seen from this
table, the precipitates are found to be strongly enriched in calcium (Ca) and phosphate
(P).
Table 6.1. EDX results after static immersion test taken from all the test specimens.
Specimens Elements (at. %)
Ca P Ca/P 100 °C 5.56 6.26 0.89
60 keV 200 °C 0.86 1.12 0.77 400 °C 0.68 0.17 4
100 °C 1.54 0.26 5.92 30 keV 200 °C 0.92 0.32 2.88
400 °C 0.83 1.72 0.48 TiN coating 15.73 10.87 1.45 As-polished 16.83 10.23 1.65
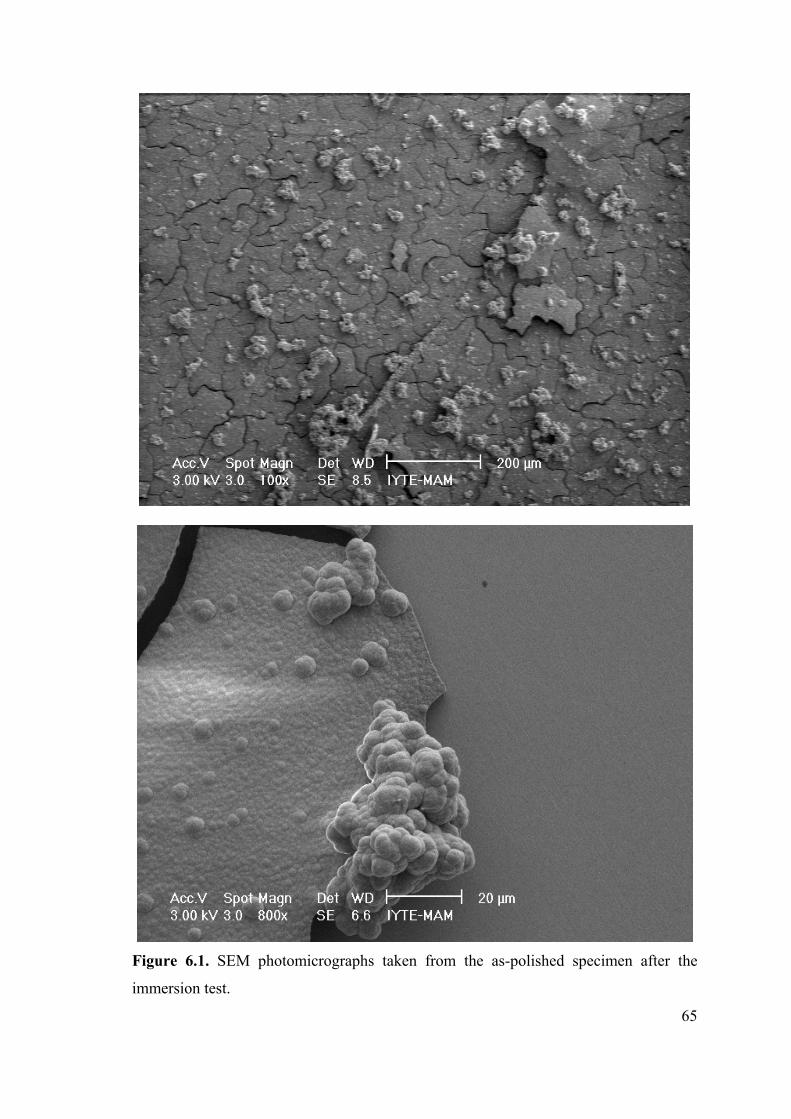
65
Figure 6.1. SEM photomicrographs taken from the as-polished specimen after the
immersion test.
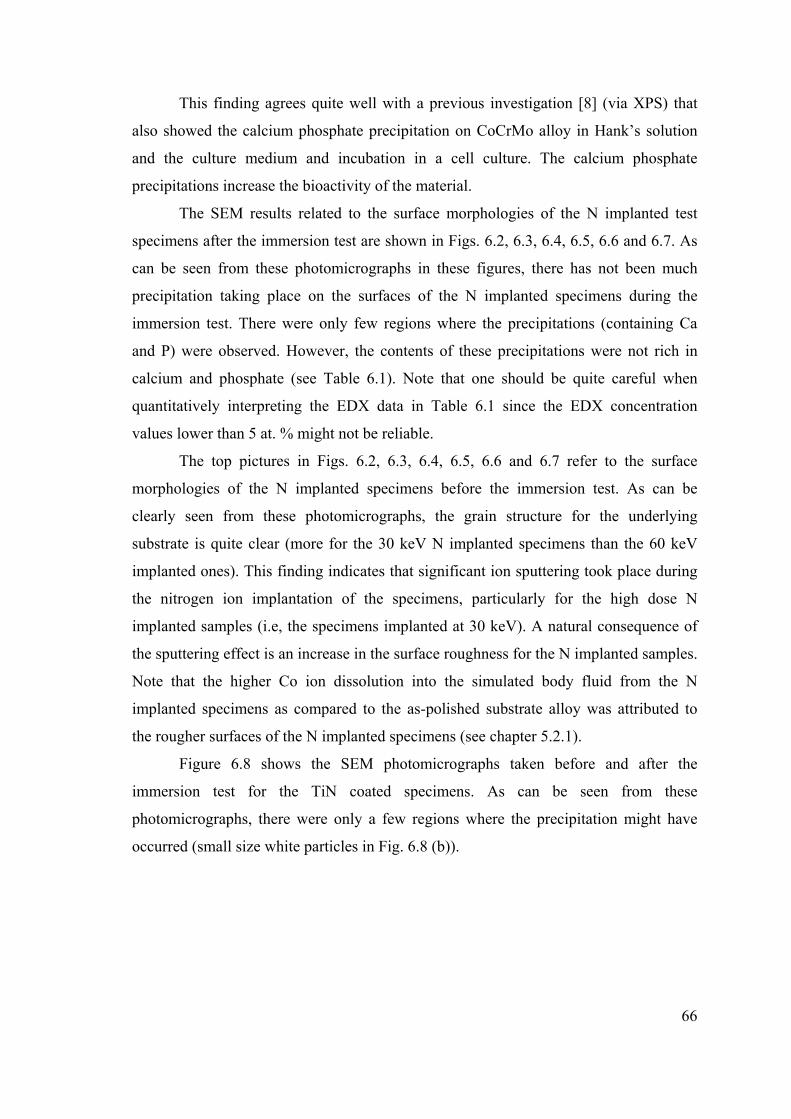
66
This finding agrees quite well with a previous investigation [8] (via XPS) that
also showed the calcium phosphate precipitation on CoCrMo alloy in Hank’s solution
and the culture medium and incubation in a cell culture. The calcium phosphate
precipitations increase the bioactivity of the material.
The SEM results related to the surface morphologies of the N implanted test
specimens after the immersion test are shown in Figs. 6.2, 6.3, 6.4, 6.5, 6.6 and 6.7. As
can be seen from these photomicrographs in these figures, there has not been much
precipitation taking place on the surfaces of the N implanted specimens during the
immersion test. There were only few regions where the precipitations (containing Ca
and P) were observed. However, the contents of these precipitations were not rich in
calcium and phosphate (see Table 6.1). Note that one should be quite careful when
quantitatively interpreting the EDX data in Table 6.1 since the EDX concentration
values lower than 5 at. % might not be reliable.
The top pictures in Figs. 6.2, 6.3, 6.4, 6.5, 6.6 and 6.7 refer to the surface
morphologies of the N implanted specimens before the immersion test. As can be
clearly seen from these photomicrographs, the grain structure for the underlying
substrate is quite clear (more for the 30 keV N implanted specimens than the 60 keV
implanted ones). This finding indicates that significant ion sputtering took place during
the nitrogen ion implantation of the specimens, particularly for the high dose N
implanted samples (i.e, the specimens implanted at 30 keV). A natural consequence of
the sputtering effect is an increase in the surface roughness for the N implanted samples.
Note that the higher Co ion dissolution into the simulated body fluid from the N
implanted specimens as compared to the as-polished substrate alloy was attributed to
the rougher surfaces of the N implanted specimens (see chapter 5.2.1).
Figure 6.8 shows the SEM photomicrographs taken before and after the
immersion test for the TiN coated specimens. As can be seen from these
photomicrographs, there were only a few regions where the precipitation might have
occurred (small size white particles in Fig. 6.8 (b)).
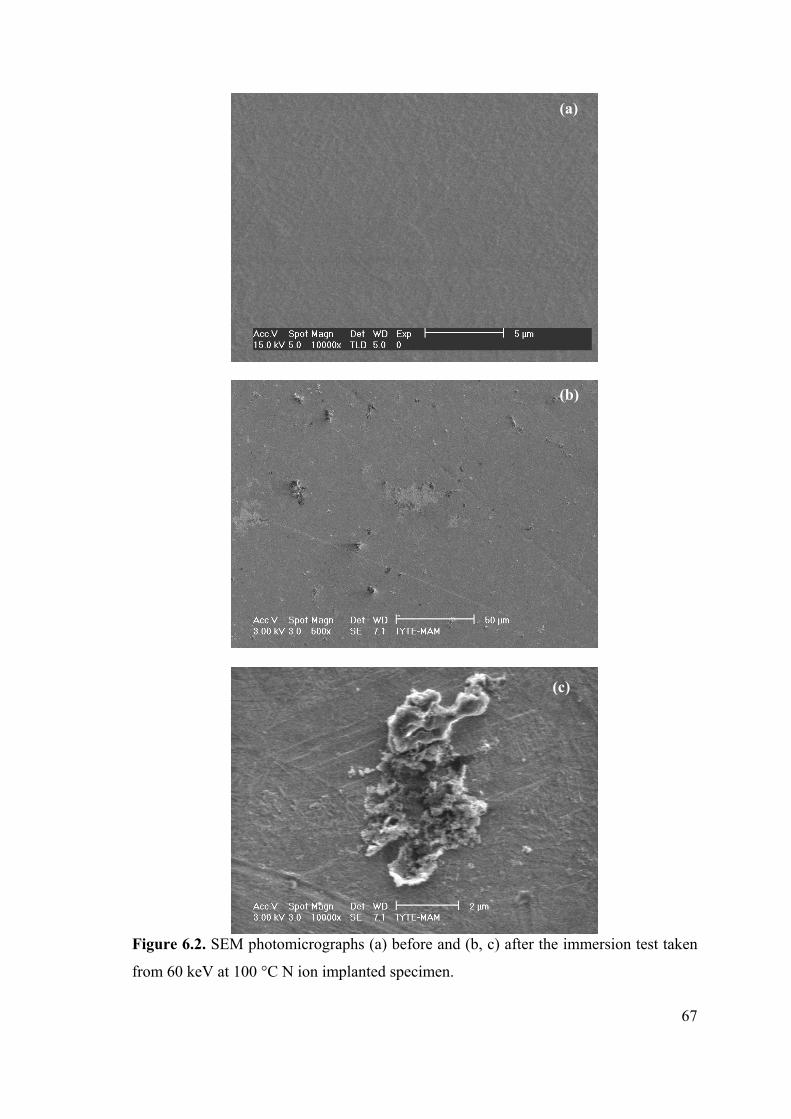
67
Figure 6.2. SEM photomicrographs (a) before and (b, c) after the immersion test taken
from 60 keV at 100 °C N ion implanted specimen.
(a)
(b)
(c)
68
Figure 6.3. SEM photomicrographs (a) before and (b, c) after the immersion test taken
from 60 keV at 200 °C N ion implanted specimen.
(a)
(b)
(c)
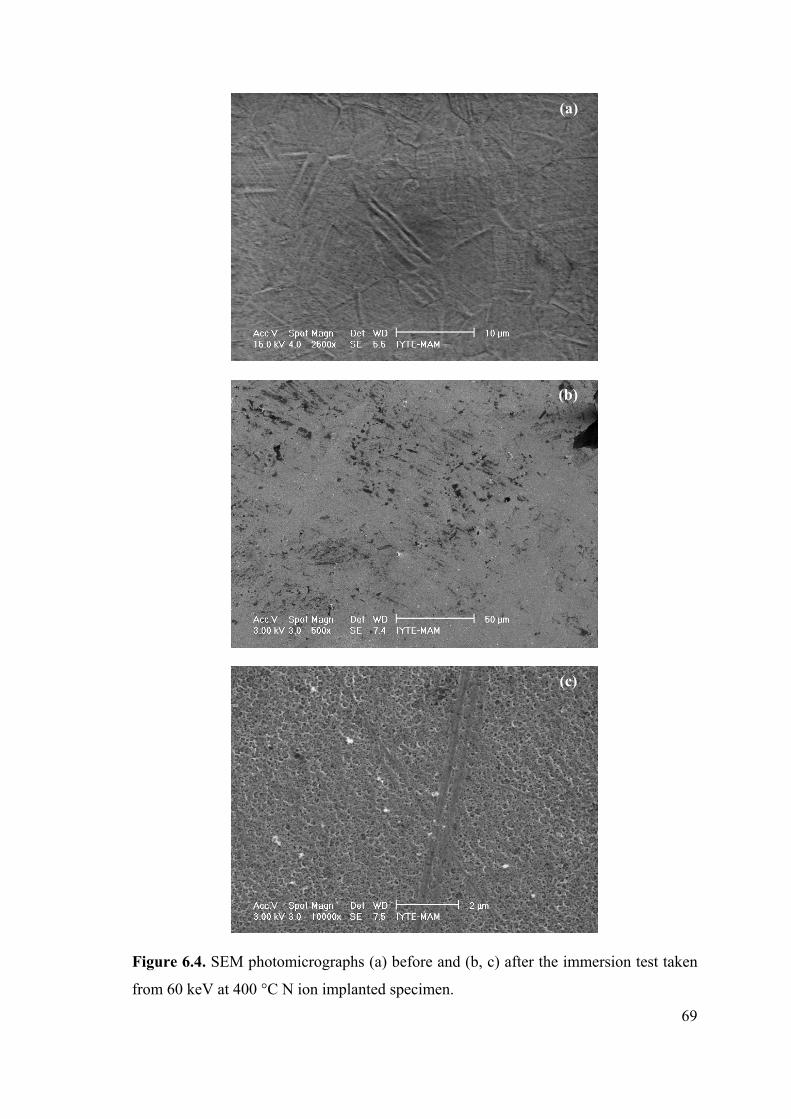
69
Figure 6.4. SEM photomicrographs (a) before and (b, c) after the immersion test taken
from 60 keV at 400 °C N ion implanted specimen.
(b)
(a)
(c)
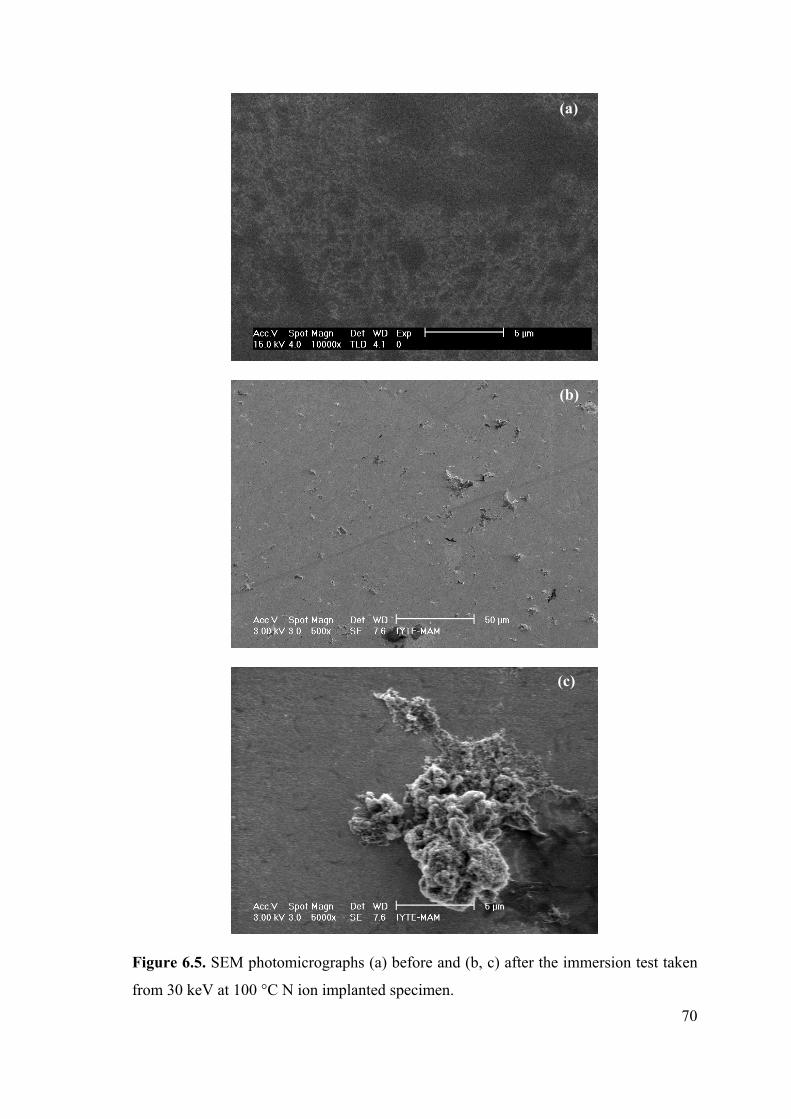
70
Figure 6.5. SEM photomicrographs (a) before and (b, c) after the immersion test taken
from 30 keV at 100 °C N ion implanted specimen.
(b)
(a)
(c)
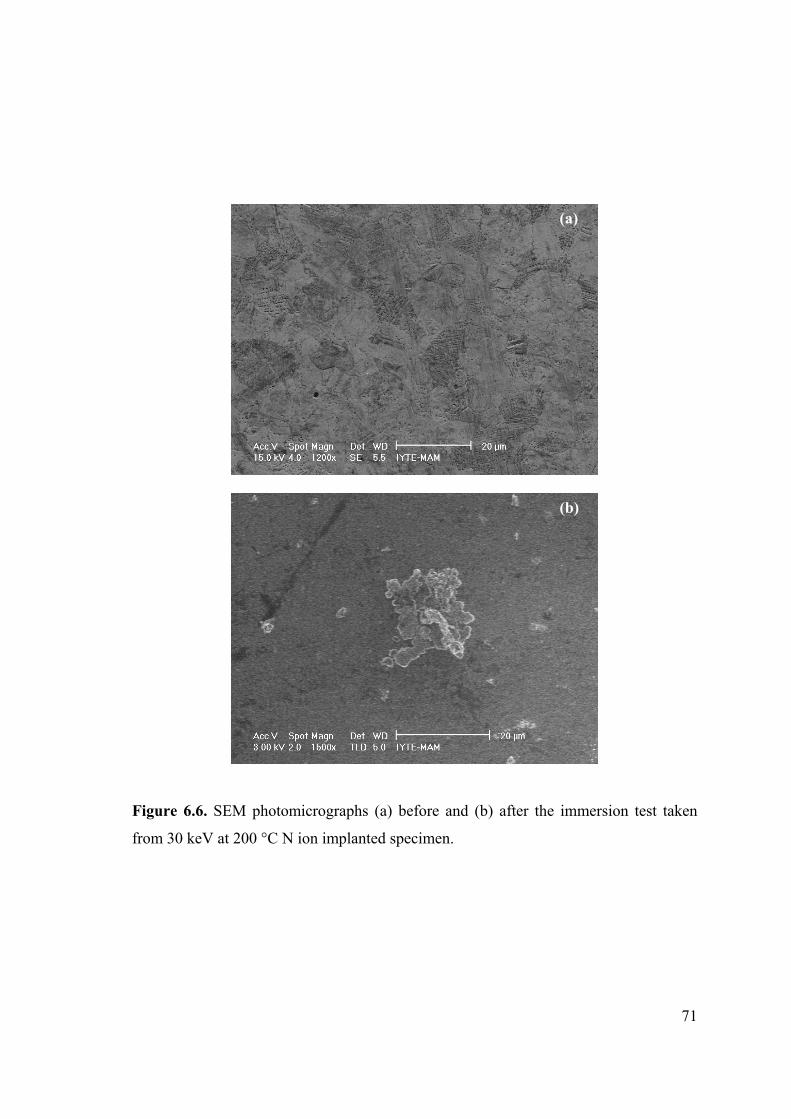
71
Figure 6.6. SEM photomicrographs (a) before and (b) after the immersion test taken
from 30 keV at 200 °C N ion implanted specimen.
(a)
(b)
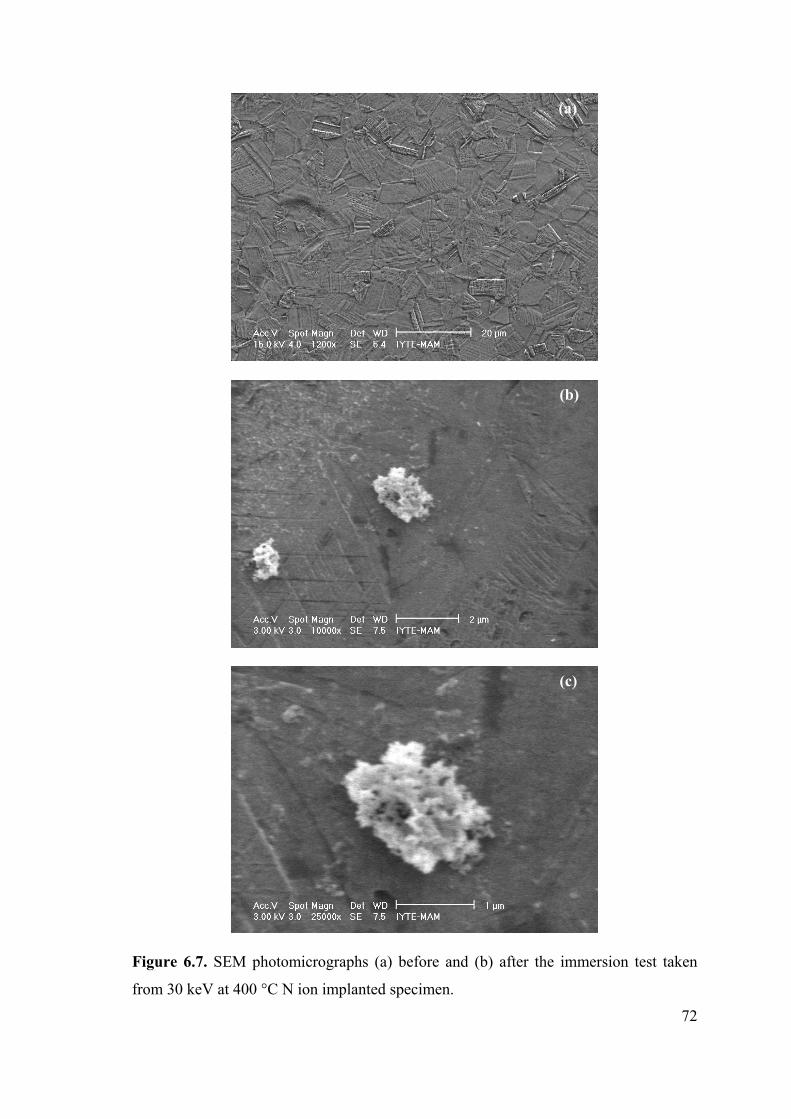
72
Figure 6.7. SEM photomicrographs (a) before and (b) after the immersion test taken
from 30 keV at 400 °C N ion implanted specimen.
(a)
(b)
(c)
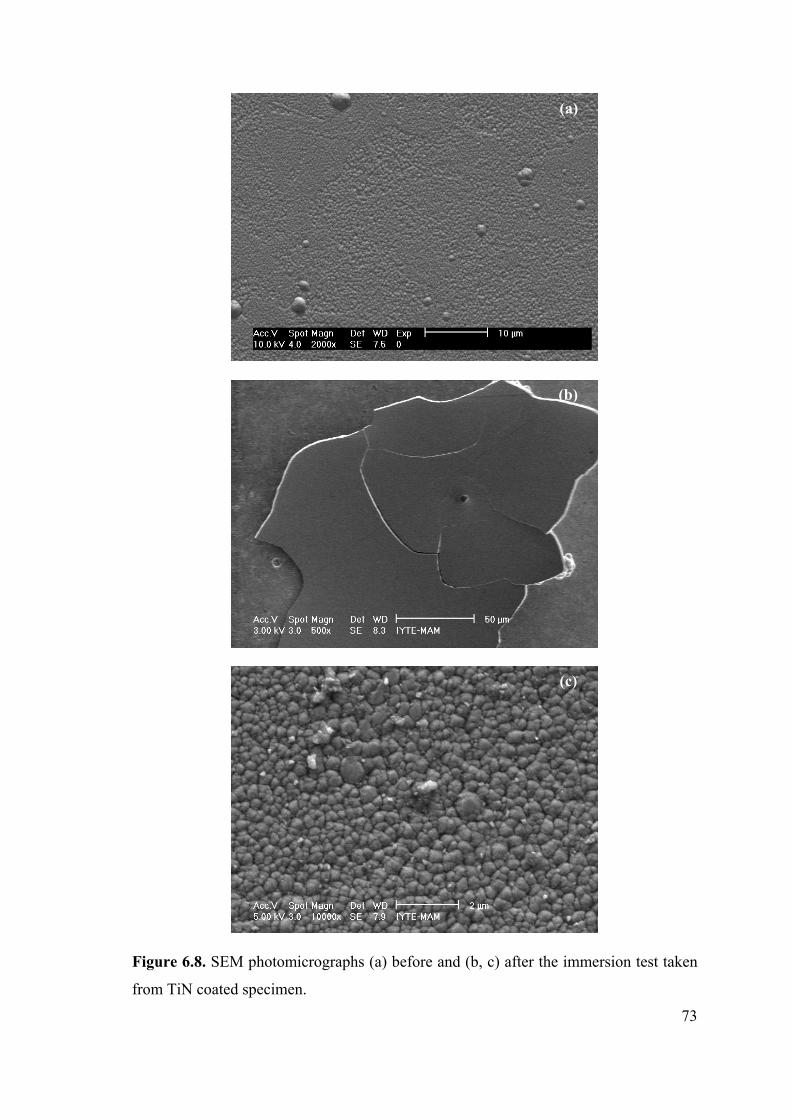
73
Figure 6.8. SEM photomicrographs (a) before and (b, c) after the immersion test taken
from TiN coated specimen.
(b)
(c)
(a)
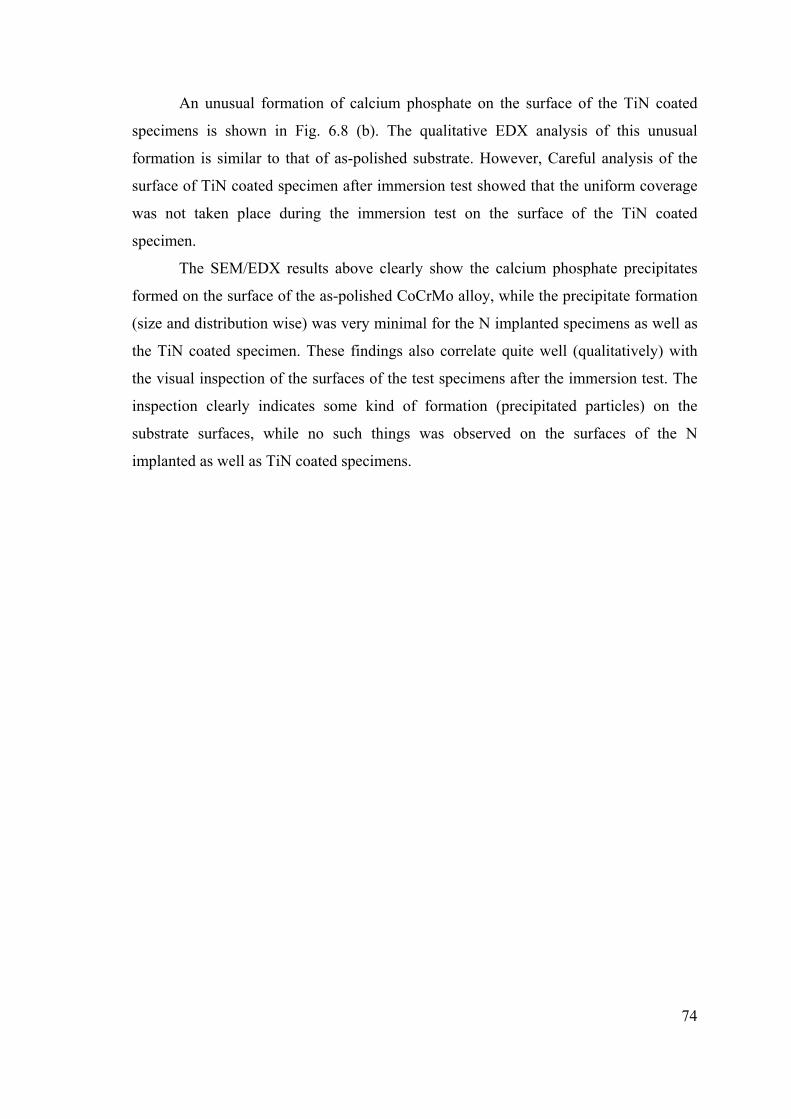
74
An unusual formation of calcium phosphate on the surface of the TiN coated
specimens is shown in Fig. 6.8 (b). The qualitative EDX analysis of this unusual
formation is similar to that of as-polished substrate. However, Careful analysis of the
surface of TiN coated specimen after immersion test showed that the uniform coverage
was not taken place during the immersion test on the surface of the TiN coated
specimen.
The SEM/EDX results above clearly show the calcium phosphate precipitates
formed on the surface of the as-polished CoCrMo alloy, while the precipitate formation
(size and distribution wise) was very minimal for the N implanted specimens as well as
the TiN coated specimen. These findings also correlate quite well (qualitatively) with
the visual inspection of the surfaces of the test specimens after the immersion test. The
inspection clearly indicates some kind of formation (precipitated particles) on the
substrate surfaces, while no such things was observed on the surfaces of the N
implanted as well as TiN coated specimens.
75
CHAPTER 7
SUMMARY AND CONCLUSIONS
7.1 Summary and Discussion
In this research, the effectiveness of nitrogen ion implanted and TiN coated
layers on CoCrMo alloy in preventing metal ion release into a simulated body fluid was
investigated. The experimental results in the preceding chapters clearly suggest the N
implanted layers are less efficient in preventing metal ion dissolution into the SBF
compared to the polished substrate alloy.
The experimental XRD results clearly show that the N ion beam conditions,
namely ion beam energies 60 and 30 keV, beam current densities 0.1 and 0.2 mA/cm2
for a substrate temperature of 400 °C, and implantation time of 30 minutes, lead to a
metastable fcc high N concentration phase (N) in mainly fcc CoCrMo alloy. In the N
phase, N occupies the interstitial sites in the fcc lattice and has a stronger binding ability
with Cr than with Co. The lower implantation temperatures, 100 and 200 °C, for both
60 and 30 keV implantation energies, result in a nitride phase, (Co, Cr, Mo)2+xN.
Based on the experimental XRD data, the average nitrogen contents and the
average layer thicknesses of the N implanted specimens implanted at the substrate
temperature of 400 °C were estimated and found to be (18 at. %, 0.41 µm) and (35 at.
%, 0.55 µm) for the 60 keV and 30 keV implantation energies, respectively. The XRD
results suggest thinner nitrogen implanted layers for the specimens implanted at the
lower substrate temperatures of 100 and 200 °C.
The N implanted layer thicknesses were also measured by SEM and the results
indicate that the N implanted layer thickness is maximized near the 30 keV, 400 °C
implantation conditions (see Table 4.1). The cross sectional SEM pictures taken from
the 60 and 30 keV at 400 °C implanted specimens reveal quite clearly the very uniform
nature of N layers with a reasonably well defined interface between the N layer and the
substrate, suggesting uniform N contents with uniform layer thicknesses. Based on the
SEM pictures, the N layer thicknesses for the 60 and 30 keV at 400 °C implanted
76
specimens were found to be 450 and 540 nm, respectively. These thicknesses were also
found to correlate well with values from the XRD data. Based on the SEM analysis
results, the (Co, Cr, Mo)2+xN nitride layer thickness is found to have a range from 150
to 250 nm for the 60 and 30 keV at 100 and 200 C implantation conditions.
The cross-sectional SEM results clearly show that the electrochemical etch used
(HCl+H2O2) strongly attacks the substrate phase (), while the N implanted layer phase,
(Co, Cr, Mo)2+xN, is not affected by the same etch. Also, the N phase is found to be
etch resistant. These results suggest the corrosion resistance of the substrate CoCrMo
alloy, which is quite high to start with, is significantly enhanced as a result of N ion
implantation into this alloy.
XRD and SEM were also used to investigate TiN coated CoCrMo alloys. The
XRD results indicate that the fcc TiN coatings exhibited (111) preferred orientation,
while the SEM results showed that the TiN film thickness was 3 µm, and that the
coatings had a columnar type of growth mode. However, the film quality was found to
be relatively poor (the films were quite poor) due to insufficient deposition conditions.
Metal ion release into SBF from the N implanted and TiN coated specimens
were analyzed by via AAS and ICP-OES. The AAS results show that in vitro exposure
of the N implanted layers result in higher levels of cobalt ion release into the SBF than
the polished substrate CoCrMo alloy. The AAS results indicate the specimens nitrogen
implanted at 60 and 30 keV ion energies and at the lower substrate temperatures of 100
and 200 °C releases lower levels of Co ions into the SBF as compared to the specimens
implanted at 400 °C. The higher Co dissolution from the specimens implanted at 400 °C
was attributed to the nature of the implanted layer phase, which, based on the XRD
results, was the nitrogen solid solution phase or N. It was explained that during in vitro
exposure of the N phase layer, it is easier for Co to be released from the N phase since
in the N phase, nitrogen (occupying the interstitial sites in the fcc lattice) has a strong
binding ability with Cr than with Co (cobalt acts only as an inert matrix element in the
N phase). Based on the explanation just given, the lower levels of Co ion release from
the specimens implanted at 100 and 200 °C was attributed to the nitride phase (Co, Cr,
Mo)2+xN being more stable compared to the N phase (i.e, due to the stronger bonds of
metal-N than those of the N phase).
77
In addition to the phase stability concept, the higher cobalt ion release levels
from the N implanted specimens explained by the rougher surfaces were associated with
the N implanted specimens compared to relatively smooth surface of the polished
substrate material. (The SEM pictures clearly indicate rougher surfaces for the N
implanted specimens in comparison with the as-polished surface.) As a result, a greater
surface area is available for metal ion release from the N implanted surfaces through
oxide dissolution or micro-scale dissolution reactions.
The lower levels of Co ion release from the as-polished CoCrMo alloy as
compared to the N implanted specimens was attributed to the native oxide layer and
rather smooth surface of the polished specimen. The native oxide layer is found to serve
as a barrier to the release of the Co ions from the CoCrMo alloy substrate but is not
always stable.
The AAS experimental results clearly indicate different Co dissolution behavior
for the N implanted specimens compared to the polished substrate alloy suggesting
different metal ion dissolution mechanism(s) for the implanted and unimplanted
(polished) specimens. The ion release rates are quite steep for the N implanted
specimens compared to the as-polished material. The Co ion release data for both the N
implanted specimens and the as-polished specimen suggest transport controlled
dissolution process.
Chromium and nickel ion release levels were found to be well below the
detection limit of the AAS apparatus. The detection limits for the AAS Co, Cr and Ni
analyses were found to be 0.5 µg/L (less than 1 ppb). Molybdenum (Mo) from all the
test specimens and titanium (Ti) from TiN coated CoCrMo alloys were analyzed by
ICP-OES. The ion release levels for these two elements (Mo and Ti) also found to be
under the detection limit of the ICP-OES instrument. The detection limits for the ICP-
OES Mo and Ti analyses were 20 and 30 µg/L, respectively.
The AAS results show that the Co ion release levels from the TiN coated
specimen are below the analytical detection limit or the instrument. The results suggest
that the TiN coated layer on the substrate CoCrMo alloy can be an effective barrier to
the release of potentially harmful ions (Co) from the CoCrMo alloy.
The SEM/EDX study of the surface morphologies of the N implanted, TiN
coated and as-polished CoCrMo alloy test specimens after the static immersion test
clearly indicate calcium phosphate formation on the as-polished CoCrMo alloy. There is
78
almost complete coverage of the as-polished surface by these precipitates. There was
almost no calcium phosphate precipitation on the surface of N implanted and TiN
coated test specimens.
7.2 Conclusions
(a) A metastable fcc, high N concentration phase N, is found to be produced in
CoCrMo alloy under 30 and 60 keV ion energies with the corresponding current
densities of 0.2 and 0.1 mA/cm2, respectively, for a substrate temperature of 400 °C.
(b) Under the same implantation conditions but for lower substrate temperatures
of 100 and 200 °C, a nitride phase, (Co, Cr, Mo) 2+xN, is found to be distributed in the
implanted layer.
(c) The nitride layer thicknesses are in the range from of 0.16 to 0.25 µm, while
the N layers have a thickness range between 450-540 nm.
(d) The N and (Co, Cr, Mo) 2+xN nitride phases show a high etch resistance
compared to the polished (unimplanted) CoCrMo substrate.
(e) Cobalt ion release levels are found to be higher for the N ion implanted
specimens as compared to the as-polished CoCrMo alloy.
(f) The specimens implanted at a substrate temperature of 400 C release higher
levels of cobalt ions into the simulated body fluid than the specimens implanted at
lower substrate temperatures of 100 and 200 °C.
(g) Higher Co ion release levels from the N implanted specimens as compared to
the polished substrate alloy is attributed to the rougher surfaces of the N implanted
specimens and the stability of the implantation induced phases.
(h) The Co ion release rate is much higher for the n implanted specimens than
for the polished CoCrMo alloy suggesting different dissolution mechanism(s) for the N
implanted and as-polished surfaces.
(i) Cobalt ion release data gives a hint related to the kinetics of the dissolution
process and suggest a transport controlled dissolution reaction for both the N implanted
and as-polished surfaces.
(j) TiN coated layer ( 3 µm thick) is an effective barrier to the cobalt ion
release from the substrate.
79
(k) Calcium phosphate precipitates are found on the surfaces of the as-polished
CoCrMo alloy specimens in simulated body fluid.
7.3 Future Work
In this study, metal ion release from the nitrogen ion implanted specimens was
attributed to the rougher surfaces of the specimens. However, top surfaces of the
materials are responsible for metal ion release. The top surface of the material should be
studied a powerful method such as x-ray photoelectron spectroscopy (XPS). This
technique gives more information form the first 20 nm of the surface of specimens.
Wear can mainly affect the performance of joint prostheses. Four types of
mechanisms may be implicated in the wear of metal components of joint prostheses.
They are: (i) abrasive, (ii) adhesive, (iii) fatigue and (iv) corrosive modes. The adhesive
wear is the most prominent on the metal-to-metal combinations. The metal to plastic
system will exhibit a lower coefficient of friction but a higher volumetric wear rate. The
volumetric wear of stainless steel–polyethylene combination is greater than cobalt–
chromium–polyethylene systems. Higher wear rates are generally observed for a few
metal-to-plastic combinations in an experimental system. The only combination used
extensively in the metal-to-metal system is cobalt–chromium to cobalt–chromium.
Nitrogen ion implantation improves the tribological properties (wear, hardness
and friction) of the specimens. In this study, tribological properties such as, wear,
hardness and friction could not be studied. These properties should be studied for a
better understanding of the performance of nitrogen implanted CoCrMo alloy.
The electrochemical measurements such as open circuit potential (OCP) and
cyclic polarization test should be done for better understanding corrosion of implants.
The critical parameters like corrosion potential (Ecorr), the breakdown potential (Eb) and
repassivation potential (Ep) are evaluated from the polarization curves.
80
REFERENCES
[1] Laure Duisabeau, Pierre Combrade, Bernard Forest, “Environmental effect on
fretting of metallic materials for orthopaedic implants”, Wear, 256, (2004), 805-
816.
[2] Kalpana S. Katti, “Biomaterials in total joint replacement”, Colloids and
Surfaces B: Biointerfaces, (2004).
[3] Marc Long, H. J. Rack, “Titanium alloys in total joint replacement—a materials
science perspective”, Biomaterials, 19, (1998), 1621-1639.
[4] I. Milošev, H.-H. Strehblow, “The composition of the surface passive film
formed on CoCrMo alloy in simulated physiological solution”, Electrochimica
Acta, 48, (2003), 2767-2774.
[5] Yoshimitsu Okazaki, Emiko Gotoh, “Comparison of metal release from various
metallic biomaterials in vitro”, Biomaterials, 26, (2005), 11-21.
[6] J.J. Jacobs, A.K. Skipor, L.M. Patterson, N.J. Hallab, W.G. Paprosky, J. Black,
J.O. Galante, “Metal release in patience who have had a primary total hip
arthroplasty”, Journal of Bone and Joint Ssurgery, 80-A, (1998), 1447-1458.
[7] W. Bordner, P. Bitzan, V. Meisinger, A. Kaider, F. Gottsauner-Wolf, R. Kotz,
“Elevetaed serum cobalt with metal-on-metal articulating surfaces”, Journal of
Bone and Joint Surgery, 79-B, (1997), 316-321.
[8] T. Hanawa, S. Hiromoto, K. Asami, “Characterization of the surface oxide film
of a Co-Cr-Mo alloy being located quasi-biological environment using XPS”,
Applied Surface Science, 183, (2001),68-75.
[9] A. W. E. Hodgson , S. Kurz , S. Virtanen , V. Fervel , C. -O. A. Olsson and S.
Mischler, “Passive and transpassive behaviour of CoCrMo in simulated
biological solutions”, Biomaterials, 25, (2004), 851-864.
[10] Takao Hanawa, “Evaluation techniques of metallic biomaterials in vitro”,
Surface and Technology of Advanced Materials, 3, (2002), 289-295.
[11] Jay R. Goldberg, Jeremy L. Gilbert, “The electrochemical and mechanical
behavior of passivated and TiN/AlN-coated CoCrMo and Ti6Al4V alloys”,
Biomaterials, 25, (2004), 851-864.
[12] B.L. Garside, “The economics of ion implantation”, Materials Sciences and
Engineering, A139, (1991), 207-213.
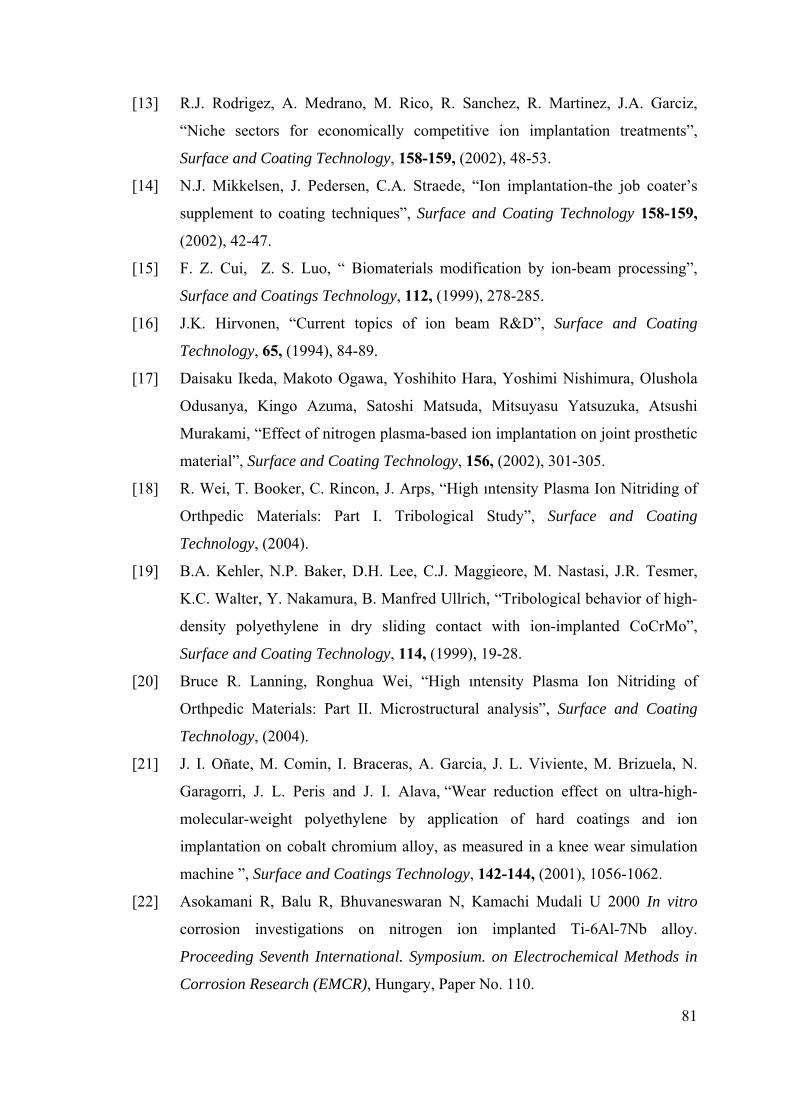
81
[13] R.J. Rodrigez, A. Medrano, M. Rico, R. Sanchez, R. Martinez, J.A. Garciz,
“Niche sectors for economically competitive ion implantation treatments”,
Surface and Coating Technology, 158-159, (2002), 48-53.
[14] N.J. Mikkelsen, J. Pedersen, C.A. Straede, “Ion implantation-the job coater’s
supplement to coating techniques”, Surface and Coating Technology 158-159,
(2002), 42-47.
[15] F. Z. Cui, Z. S. Luo, “ Biomaterials modification by ion-beam processing”,
Surface and Coatings Technology, 112, (1999), 278-285.
[16] J.K. Hirvonen, “Current topics of ion beam R&D”, Surface and Coating
Technology, 65, (1994), 84-89.
[17] Daisaku Ikeda, Makoto Ogawa, Yoshihito Hara, Yoshimi Nishimura, Olushola
Odusanya, Kingo Azuma, Satoshi Matsuda, Mitsuyasu Yatsuzuka, Atsushi
Murakami, “Effect of nitrogen plasma-based ion implantation on joint prosthetic
material”, Surface and Coating Technology, 156, (2002), 301-305.
[18] R. Wei, T. Booker, C. Rincon, J. Arps, “High ıntensity Plasma Ion Nitriding of
Orthpedic Materials: Part I. Tribological Study”, Surface and Coating
Technology, (2004).
[19] B.A. Kehler, N.P. Baker, D.H. Lee, C.J. Maggieore, M. Nastasi, J.R. Tesmer,
K.C. Walter, Y. Nakamura, B. Manfred Ullrich, “Tribological behavior of high-
density polyethylene in dry sliding contact with ion-implanted CoCrMo”,
Surface and Coating Technology, 114, (1999), 19-28.
[20] Bruce R. Lanning, Ronghua Wei, “High ıntensity Plasma Ion Nitriding of
Orthpedic Materials: Part II. Microstructural analysis”, Surface and Coating
Technology, (2004).
[21] J. I. Oñate, M. Comin, I. Braceras, A. Garcia, J. L. Viviente, M. Brizuela, N.
Garagorri, J. L. Peris and J. I. Alava, “Wear reduction effect on ultra-high-
molecular-weight polyethylene by application of hard coatings and ion
implantation on cobalt chromium alloy, as measured in a knee wear simulation
machine ”, Surface and Coatings Technology, 142-144, (2001), 1056-1062.
[22] Asokamani R, Balu R, Bhuvaneswaran N, Kamachi Mudali U 2000 In vitro
corrosion investigations on nitrogen ion implanted Ti-6Al-7Nb alloy.
Proceeding Seventh International. Symposium. on Electrochemical Methods in
Corrosion Research (EMCR), Hungary, Paper No. 110.
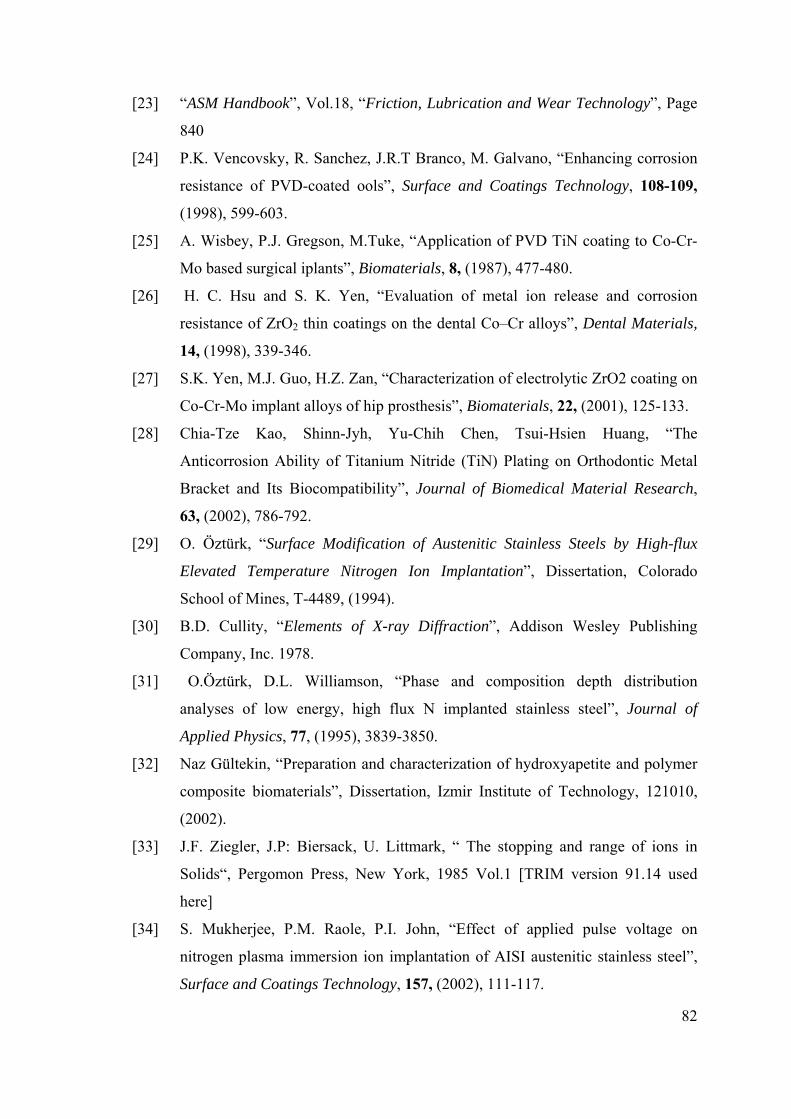
82
[23] “ASM Handbook”, Vol.18, “Friction, Lubrication and Wear Technology”, Page
840
[24] P.K. Vencovsky, R. Sanchez, J.R.T Branco, M. Galvano, “Enhancing corrosion
resistance of PVD-coated ools”, Surface and Coatings Technology, 108-109,
(1998), 599-603.
[25] A. Wisbey, P.J. Gregson, M.Tuke, “Application of PVD TiN coating to Co-Cr-
Mo based surgical iplants”, Biomaterials, 8, (1987), 477-480.
[26] H. C. Hsu and S. K. Yen, “Evaluation of metal ion release and corrosion
resistance of ZrO2 thin coatings on the dental Co–Cr alloys”, Dental Materials,
14, (1998), 339-346.
[27] S.K. Yen, M.J. Guo, H.Z. Zan, “Characterization of electrolytic ZrO2 coating on
Co-Cr-Mo implant alloys of hip prosthesis”, Biomaterials, 22, (2001), 125-133.
[28] Chia-Tze Kao, Shinn-Jyh, Yu-Chih Chen, Tsui-Hsien Huang, “The
Anticorrosion Ability of Titanium Nitride (TiN) Plating on Orthodontic Metal
Bracket and Its Biocompatibility”, Journal of Biomedical Material Research,
63, (2002), 786-792.
[29] O. Öztürk, “Surface Modification of Austenitic Stainless Steels by High-flux
Elevated Temperature Nitrogen Ion Implantation”, Dissertation, Colorado
School of Mines, T-4489, (1994).
[30] B.D. Cullity, “Elements of X-ray Diffraction”, Addison Wesley Publishing
Company, Inc. 1978.
[31] O.Öztürk, D.L. Williamson, “Phase and composition depth distribution
analyses of low energy, high flux N implanted stainless steel”, Journal of
Applied Physics, 77, (1995), 3839-3850.
[32] Naz Gültekin, “Preparation and characterization of hydroxyapetite and polymer
composite biomaterials”, Dissertation, Izmir Institute of Technology, 121010,
(2002).
[33] J.F. Ziegler, J.P: Biersack, U. Littmark, “ The stopping and range of ions in
Solids“, Pergomon Press, New York, 1985 Vol.1 [TRIM version 91.14 used
here]
[34] S. Mukherjee, P.M. Raole, P.I. John, “Effect of applied pulse voltage on
nitrogen plasma immersion ion implantation of AISI austenitic stainless steel”,
Surface and Coatings Technology, 157, (2002), 111-117.
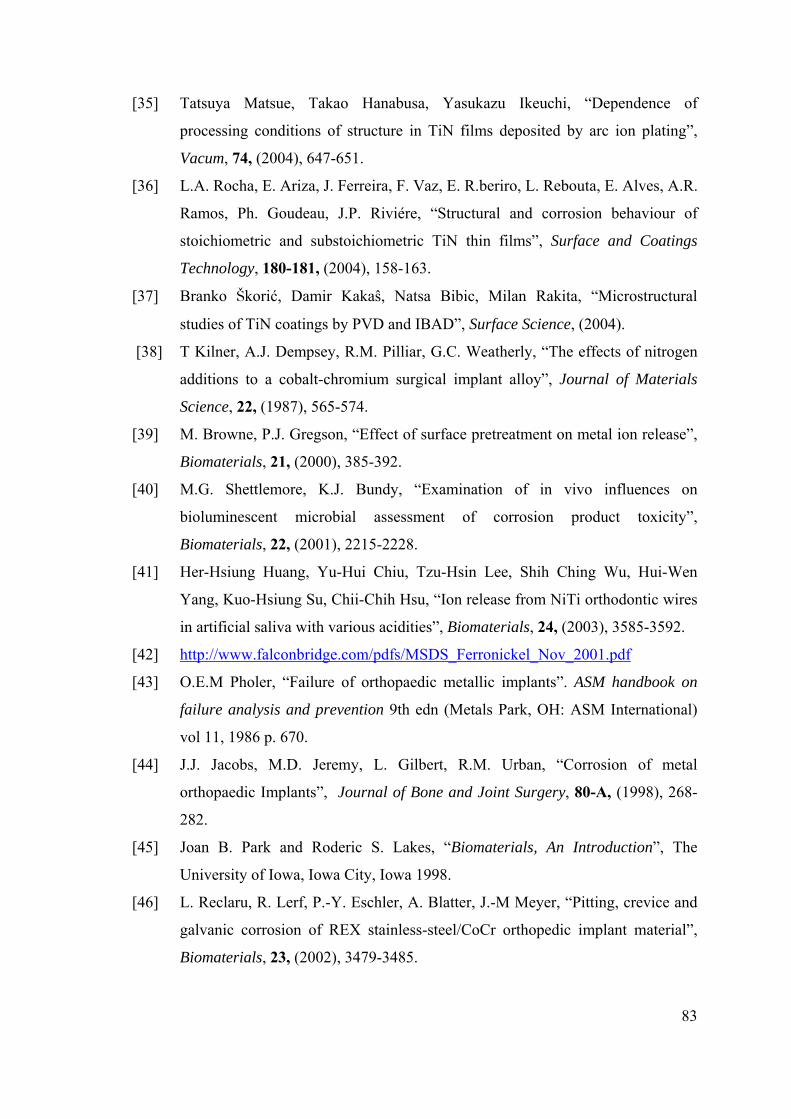
83
[35] Tatsuya Matsue, Takao Hanabusa, Yasukazu Ikeuchi, “Dependence of
processing conditions of structure in TiN films deposited by arc ion plating”,
Vacum, 74, (2004), 647-651.
[36] L.A. Rocha, E. Ariza, J. Ferreira, F. Vaz, E. R.beriro, L. Rebouta, E. Alves, A.R.
Ramos, Ph. Goudeau, J.P. Riviére, “Structural and corrosion behaviour of
stoichiometric and substoichiometric TiN thin films”, Surface and Coatings
Technology, 180-181, (2004), 158-163.
[37] Branko Škorić, Damir Kakaŝ, Natsa Bibic, Milan Rakita, “Microstructural
studies of TiN coatings by PVD and IBAD”, Surface Science, (2004).
[38] T Kilner, A.J. Dempsey, R.M. Pilliar, G.C. Weatherly, “The effects of nitrogen
additions to a cobalt-chromium surgical implant alloy”, Journal of Materials
Science, 22, (1987), 565-574.
[39] M. Browne, P.J. Gregson, “Effect of surface pretreatment on metal ion release”,
Biomaterials, 21, (2000), 385-392.
[40] M.G. Shettlemore, K.J. Bundy, “Examination of in vivo influences on
bioluminescent microbial assessment of corrosion product toxicity”,
Biomaterials, 22, (2001), 2215-2228.
[41] Her-Hsiung Huang, Yu-Hui Chiu, Tzu-Hsin Lee, Shih Ching Wu, Hui-Wen
Yang, Kuo-Hsiung Su, Chii-Chih Hsu, “Ion release from NiTi orthodontic wires
in artificial saliva with various acidities”, Biomaterials, 24, (2003), 3585-3592.
[42] http://www.falconbridge.com/pdfs/MSDS_Ferronickel_Nov_2001.pdf
[43] O.E.M Pholer, “Failure of orthopaedic metallic implants”. ASM handbook on
failure analysis and prevention 9th edn (Metals Park, OH: ASM International)
vol 11, 1986 p. 670.
[44] J.J. Jacobs, M.D. Jeremy, L. Gilbert, R.M. Urban, “Corrosion of metal
orthopaedic Implants”, Journal of Bone and Joint Surgery, 80-A, (1998), 268-
282.
[45] Joan B. Park and Roderic S. Lakes, “Biomaterials, An Introduction”, The
University of Iowa, Iowa City, Iowa 1998.
[46] L. Reclaru, R. Lerf, P.-Y. Eschler, A. Blatter, J.-M Meyer, “Pitting, crevice and
galvanic corrosion of REX stainless-steel/CoCr orthopedic implant material”,
Biomaterials, 23, (2002), 3479-3485.
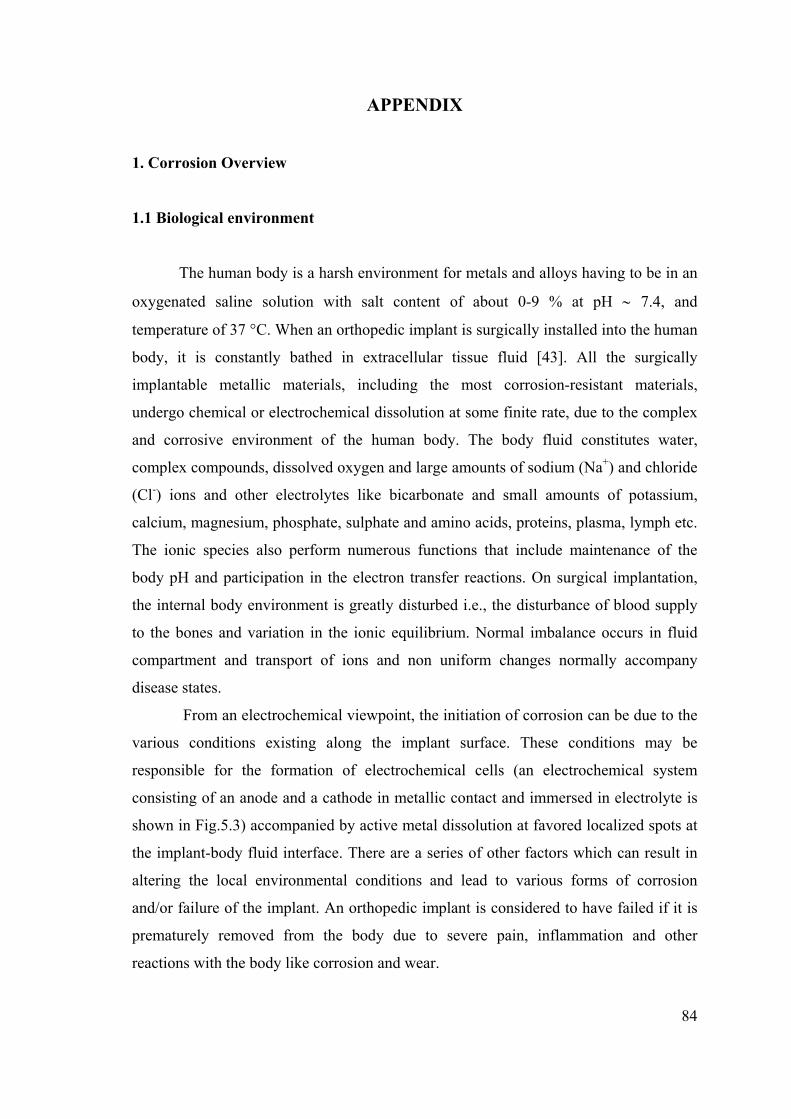
84
APPENDIX
1. Corrosion Overview
1.1 Biological environment
The human body is a harsh environment for metals and alloys having to be in an
oxygenated saline solution with salt content of about 0-9 % at pH 7.4, and
temperature of 37 °C. When an orthopedic implant is surgically installed into the human
body, it is constantly bathed in extracellular tissue fluid [43]. All the surgically
implantable metallic materials, including the most corrosion-resistant materials,
undergo chemical or electrochemical dissolution at some finite rate, due to the complex
and corrosive environment of the human body. The body fluid constitutes water,
complex compounds, dissolved oxygen and large amounts of sodium (Na+) and chloride
(Cl-) ions and other electrolytes like bicarbonate and small amounts of potassium,
calcium, magnesium, phosphate, sulphate and amino acids, proteins, plasma, lymph etc.
The ionic species also perform numerous functions that include maintenance of the
body pH and participation in the electron transfer reactions. On surgical implantation,
the internal body environment is greatly disturbed i.e., the disturbance of blood supply
to the bones and variation in the ionic equilibrium. Normal imbalance occurs in fluid
compartment and transport of ions and non uniform changes normally accompany
disease states.
From an electrochemical viewpoint, the initiation of corrosion can be due to the
various conditions existing along the implant surface. These conditions may be
responsible for the formation of electrochemical cells (an electrochemical system
consisting of an anode and a cathode in metallic contact and immersed in electrolyte is
shown in Fig.5.3) accompanied by active metal dissolution at favored localized spots at
the implant-body fluid interface. There are a series of other factors which can result in
altering the local environmental conditions and lead to various forms of corrosion
and/or failure of the implant. An orthopedic implant is considered to have failed if it is
prematurely removed from the body due to severe pain, inflammation and other
reactions with the body like corrosion and wear.
85
1.2 Implant Corrosion
Corrosion is one of the major processes that cause problems when metals and
alloys are used as implants in the body. To minimize these problems, better
understanding of some of the basic principles involved in the degradative process of
corrosion is required. Corrosion of implants in the aqueous medium of body fluids takes
place via electrochemical reactions [44,45] and it is necessary to appreciate and
understand the electrochemical principles that are most relevant to the corrosion
processes. The electrochemical reactions that occur on the surface of the surgically
implanted alloy are identical to those observed during exposure to seawater (namely,
aerated sodium chloride). The metallic components of the alloy are oxidized to their
ionic forms and the dissolved oxygen is reduced to hydroxyl ions. During corrosion
process, the total rates of oxidation and reduction reactions that are termed as electron
production and electron consumption, respectively, must be equal. The overall reaction
rate is controlled by the slowest step of these two processes. The metals and alloys used
as surgical implants achieve passivity by the presence of a protective surface passive
film. This film inhibits corrosion and keeps current flow and the release of corrosion
products at a very low level i.e. all the implantable materials undergo corrosion at some
finite rate due to complex corrosive environment of the body, while in use. The types of
corrosion that are pertinent to the currently used alloys are pitting, crevice, galvanic,
intergranular, stress-corrosion cracking, corrosion fatigue and fretting corrosion.
1.3 Electrochemical Aspects - Mechanism
Corrosion occurs when a metal atom becomes ionized and goes into solution, or
combine with oxygen or other species in solution to form a compound which flakes off
or dissolves. The body environment is very aggressive in terms of corrosion since it
contains chloride ions and proteins and many chemical reactions can occur. The
electrolyte, which contains ions in solution, serves to complete the electrical circuit.
Anions are negative ions that migrate toward the anode, and cations are positive ions
that migrate toward the cathode. Fig.5.3 shows an electrochemical cell.
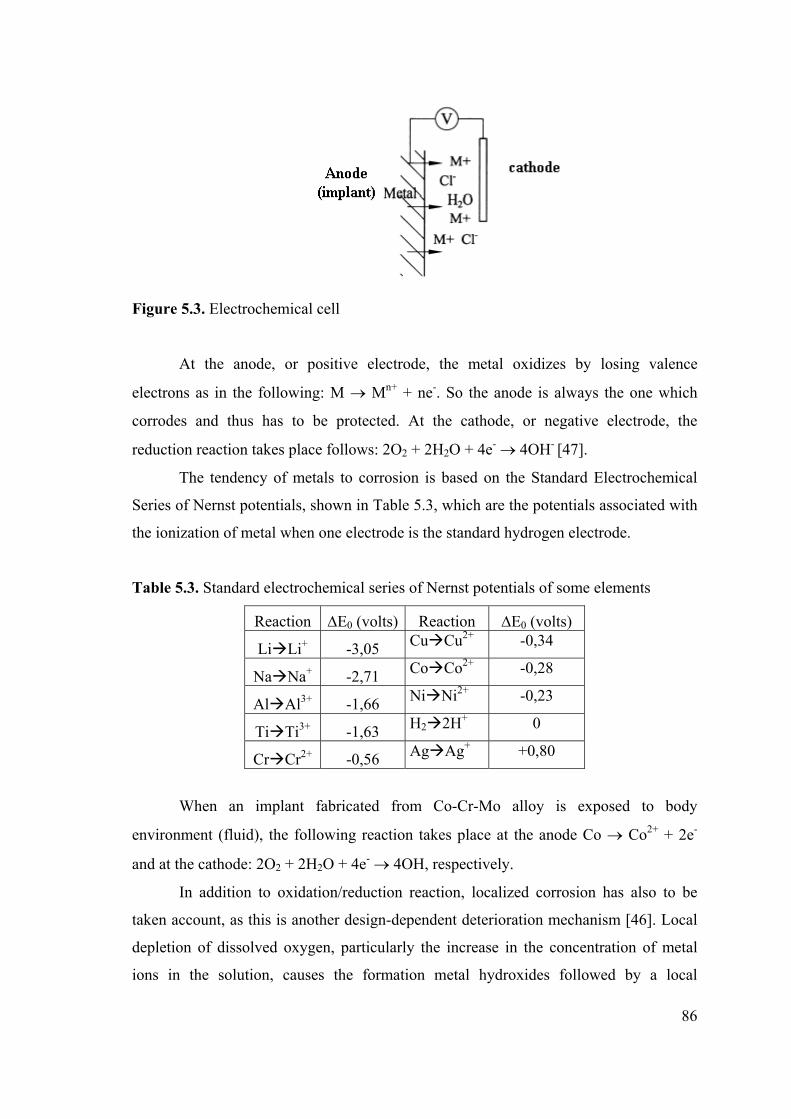
86
Figure 5.3. Electrochemical cell
At the anode, or positive electrode, the metal oxidizes by losing valence
electrons as in the following: M Mn+ + ne-. So the anode is always the one which
corrodes and thus has to be protected. At the cathode, or negative electrode, the
reduction reaction takes place follows: 2O2 + 2H2O + 4e- 4OH- [47].
The tendency of metals to corrosion is based on the Standard Electrochemical
Series of Nernst potentials, shown in Table 5.3, which are the potentials associated with
the ionization of metal when one electrode is the standard hydrogen electrode.
Table 5.3. Standard electrochemical series of Nernst potentials of some elements
Reaction E0 (volts) Reaction E0 (volts)
LiLi+ -3,05 CuCu2+ -0,34
NaNa+ -2,71 CoCo2+ -0,28
AlAl3+ -1,66 NiNi2+ -0,23
TiTi3+ -1,63 H22H+ 0
CrCr2+ -0,56 AgAg+ +0,80
When an implant fabricated from Co-Cr-Mo alloy is exposed to body
environment (fluid), the following reaction takes place at the anode Co Co2+ + 2e-
and at the cathode: 2O2 + 2H2O + 4e- 4OH, respectively.
In addition to oxidation/reduction reaction, localized corrosion has also to be
taken account, as this is another design-dependent deterioration mechanism [46]. Local
depletion of dissolved oxygen, particularly the increase in the concentration of metal
ions in the solution, causes the formation metal hydroxides followed by a local

87
reduction in the pH, Mn+ +nH2O M(OH)n + nH+, and the diffusion of Cl- ions into
this zone (produced due to the metal ion release from the surface of implant) resulted in
micro-scale corrosion, Mn+Cln- + nH2O M(OH)n + nHCl (micro-scale corrosion
reaction).