Embed Size (px)
Citation preview

BrandBiocon
At the Intersection of Patient + Therapy
ANNUAL REPORT 2011

DIABETOLOGY
Biocon has established itself as an emerging global biopharmaceutical innovator in just over a decade. Strategically leveraging a portfolio approach focused on chronic disease segments and integrating well validated target-to-clinic-to-counter capabilities, we have built considerable brand equity and are on the path to delivering affordable innovation.
Within a short span of time, we have brought to market an impressive portfolio of medically vital products. Our growing ability to offer affordable and differentiated medicines positions us at the challenging intersection of patient and therapy.
ONCOTHERAPEUTICS
NEPHROLOGY
CARDIOLOGY
COMPREHENSIVE CARE
IMMUNOTHERAPY
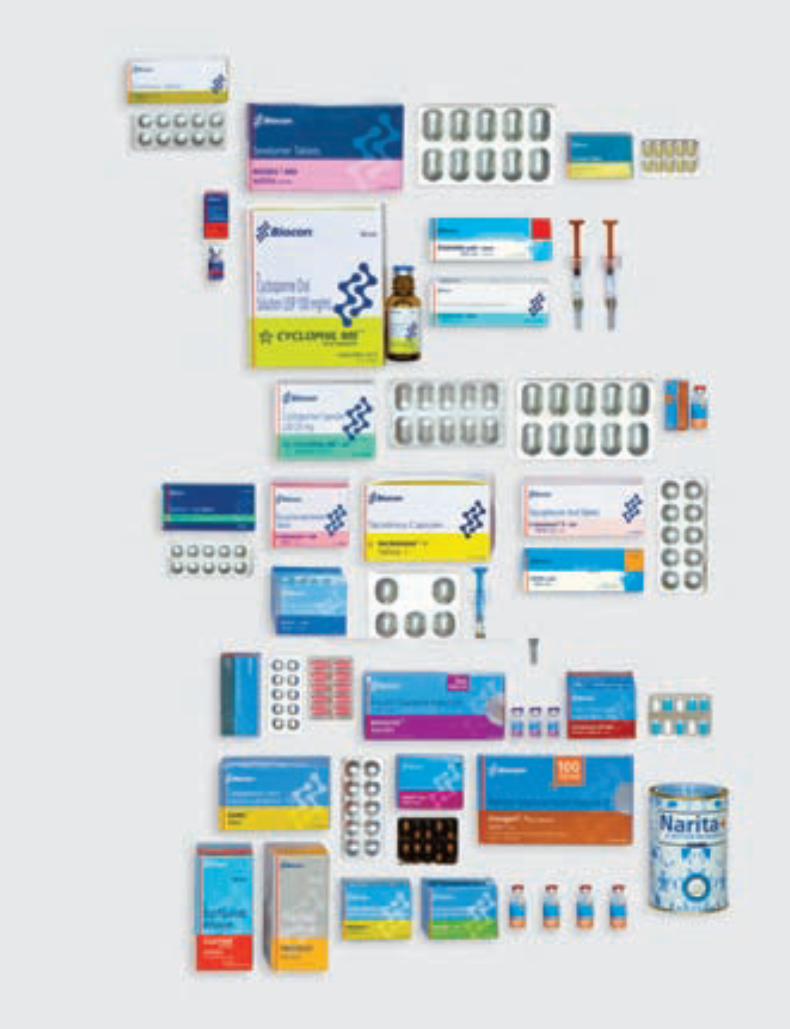
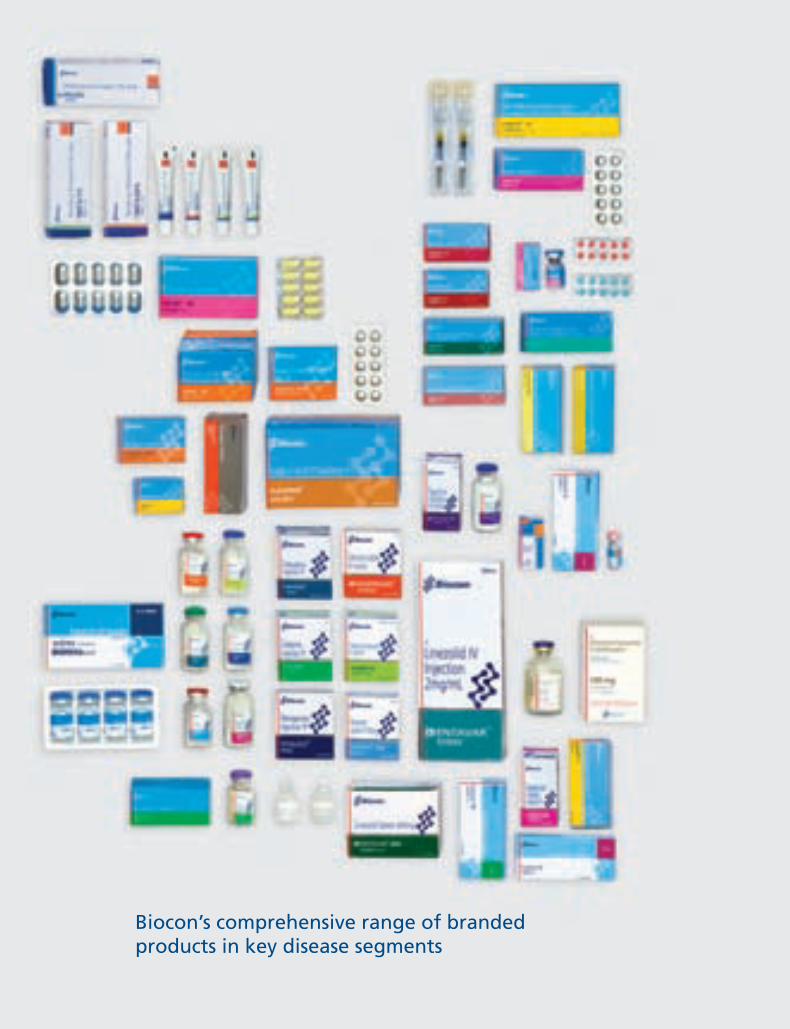
Biocon’s comprehensive range of branded products in key disease segments

At the Intersection of Patient + Therapy
BRAND BIOCON2011
The second largest in volume, 12th in value and by 2015, a USD 20 billion* market potential – India is forecast to be among the top 10 pharma destinations of the world. This robust growth has been fueled by increased purchasing power, access to better healthcare, wider adoption of international GCP/GMP norms, an improving IP and regulatory landscape, growing investment in health sector infrastructure, and rapidly developing R&D expertise and funding.
Strategically positioned in this expanding market is Biocon.With a tailwind of twelve years in biopharmaceuticals and a flexible yet well balanced biopharma strategy, we are committed to factoring ‘more for less’ into all our offerings. Biocon’s affordable innovation platform, dovetailed with world class capa-bilities along the drug value chain has enabled the Company’s successful foray into the branded formulations market.
Biocon’s Brandfolio targets chronic
diseases from diabetes, cancer, end-
stage renal illnesses to immune disorders
and other life-threatening conditions.
Marketed primarily in India, parts of
Asia, Latin America, Middle East and
Africa, we offer our products to
healthcare providers, including
physicians, clinics, hospitals and
pharmacies. Significantly, we market
proprietary molecules and conduct
critical clinical trials in therapeutic areas,
such as locally advanced head and neck
cancers, cervical cancers, brain tumors,
etc. that are a huge unmet need in the
Global patient population. Beyond
therapy, Biocon supports select
products with patient friendly initiatives
in disease awareness, prevention and
management. We also assist healthcare
professionals and patients with the
treatment of complex medical
conditions.
To successfully penetrate the Indian
branded formulations market, Biocon
recognizes the important synergies
derived from research and marketing
partnerships. We believe, collaborative
innovation will accelerate our pace of
development, while marketing alliances
will help extend our reach into local
geographies. We also aim to leverage
partnerships to capture emerging
opportunities in biosimilars. In the next
3 to 10 years, as a number of patents
expire, Biocon will harness its India
advantage to generate these techno-
logically feasible and economically
imperative alternatives to expensive
biologics.
Today, sales from branded formulations
(both injectables and oral dosages)
account for a sizeable portion of
Biocon’s revenues. Our products are
already among the top ten brands in
their respective verticals of oncology,
cardiology, nephrology and diabetology.
Going forward, we aim to step up our
presence in the domestic market by
aggressively launching more medicines
and thereby, increasing the contribution
of our brandfolio to more than 25% of
total revenues. In achieving this business
target, we aim to accomplish a far
more significant goal: making better
therapies available and accessible to
patients in India and eventually the
world.
With a tailwind of twelve years in biopharmaceuticals and a flexible yet well balanced biopharma strategy, Biocon is committed to factoring ‘more for less’ into all its offerings.
2011 Biocon Annual Report Brand Biocon
*Pharma Trends 2011
05
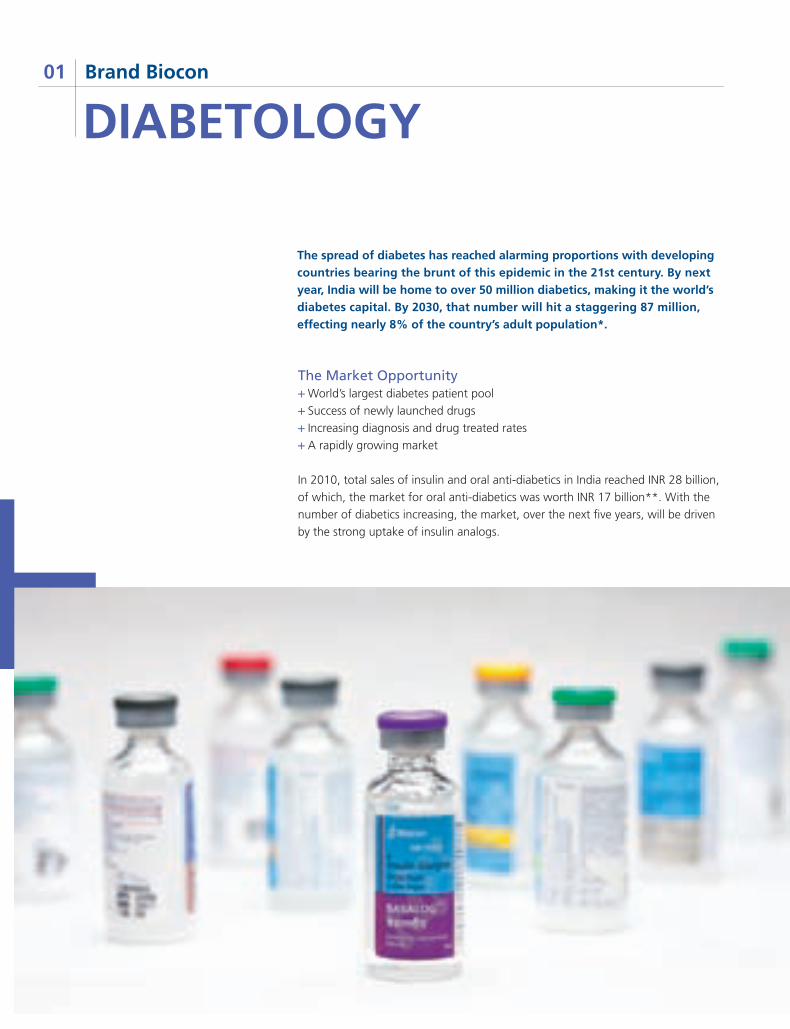
World’s largest diabetes patient pool
Success of newly launched drugs
Increasing diagnosis and drug treated rates
A rapidly growing market
In 2010, total sales of insulin and oral anti-diabetics in India reached INR 28 billion,
of which, the market for oral anti-diabetics was worth INR 17 billion**. With the
number of diabetics increasing, the market, over the next five years, will be driven
by the strong uptake of insulin analogs.
DIABETOLOGYBrand Biocon01
The spread of diabetes has reached alarming proportions with developingcountries bearing the brunt of this epidemic in the 21st century. By nextyear, India will be home to over 50 million diabetics, making it the world’s diabetes capital. By 2030, that number will hit a staggering 87 million, effecting nearly 8% of the country’s adult population*.
The Market Opportunity
Insugen® is the fastest growing drug in its class in India
201107
Biocon Annual Report Diabetology
Biocon Diabetology Insugen®
By far the most affordable brand in
India, Insugen® remains India’s most
clinically validated r-DNA insulin.
Launched 7 years ago, Insugen®
has brought about a paradigm shift
in the insulin market and is today,
a leading drug in its class.
BASALOG®
The launch of BASALOG® in the last
fiscal boosted divisional sales, garnering
considerable market share in the analog
market, hitherto dominated by brands
from foreign multinational companies.
Today, BASALOG® is a formidable player,
having successfully allayed apprehension
about the acceptance of analog insulin
in vials.
* International Diabetes Foundation, 2009** IMS MAT: Dec 2010
Flagship BrandsLaunched in 2004, this division has
successfully introduced into the Indian
market a range of oral anti-diabetic
drugs, human insulins and insulin
analogs. In its portfolio is one block-
buster brand and several other high
quality, affordable drugs that doctors
and patients continue to endorse.
In fact, Biocon is the only company,
among the 61 players in the anti-
diabetes space, to have demonstrated
success with both, insulins and oral
anti-diabetics.
Winning With DiabetesThis patient friendly initiative has greatly
enhanced the reputation of BASALOG®
by helping diabetics improve the quality
of their lives through effective medi-
cation and self monitoring. Till date,
over 12,500 patients have registered
with our helpline and 7,400 Breeze 2
glucometers have been delivered to
patients on a complimentary basis.
ABIDE This medical education forum aims to
create an enabling IT-based doctor-
patient interface for dissemination
of medical information and training
modules to diabetics and physicians
located in remote regions of India.
Biocon Diabetology is ranked 12th in its represented marketin India
Insugen® has more than 10% market share in India
Insugen® is now available in Latin America, Middle East, Asia and North Africa
Insugen® 100 IU was launched in December 2010
Marketed Products
Insugen® 30/70 100 IUInsugen® 50/50 100 IUInsugen® N 100 IUInsugen® R 100 IUINSUGEN® 30/70 40 IUINSUGEN® 50/50 40 IUINSUGEN® N 40 IUINSUGEN® R 40 IUBASALOG®
BLISTO®
BLISTO® MFMETADOZE IPR®
TriGPM® ZUKER® MFPIODART® PIODART® MFOLISAT® GABIL® GMAB® Plus
Milestones
Affordability Index(as compared to the leading brand
in that category)
Insugen® ~20% BASALOG® ~40%
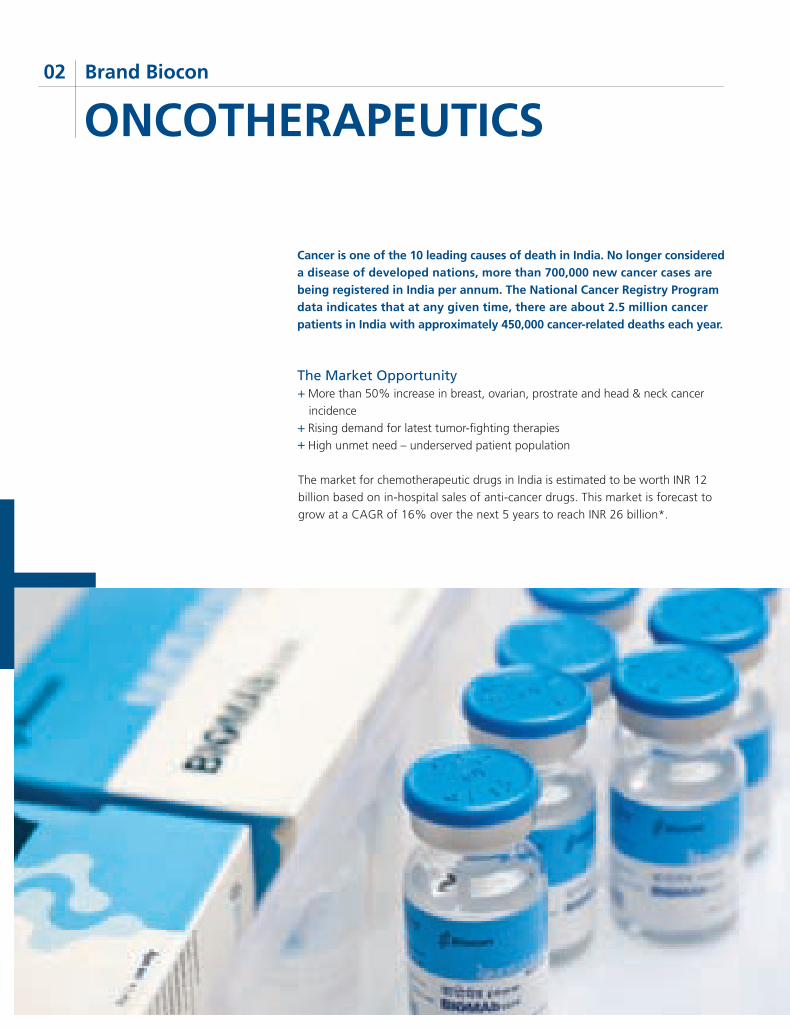
More than 50% increase in breast, ovarian, prostrate and head & neck cancer
incidence
Rising demand for latest tumor-fighting therapies
High unmet need – underserved patient population
The market for chemotherapeutic drugs in India is estimated to be worth INR 12
billion based on in-hospital sales of anti-cancer drugs. This market is forecast to
grow at a CAGR of 16% over the next 5 years to reach INR 26 billion*.
Cancer is one of the 10 leading causes of death in India. No longer considered a disease of developed nations, more than 700,000 new cancer cases are being registered in India per annum. The National Cancer Registry Program data indicates that at any given time, there are about 2.5 million cancer patients in India with approximately 450,000 cancer-related deaths each year.
The Market Opportunity
ONCOTHERAPEUTICSBrand Biocon02
Marketed Products
BIOMAb EGFR®
Abraxane®
NUFIL safe™NUFIL™EvertorTM
ERYPRO safe™
201109
Biocon Annual Report Oncotherapeutics
Biocon OncotherapeuticsLaunched in 2006, Biocon Oncothera-
peutics is committed to delivering
novel yet affordable cancer therapies.
Its comprehensive range of cancer-
chemotherapy and supportive drugs
are led by BIOMAb EGFR® (a humanized
monoclonal antibody for head and
neck cancer), Abraxane® (a US FDA
approved anti-cancer drug for breast
cancer), Evertor™ (the first generic
everolimus for the treatment of
advanced renal cell carcinoma) and
NUFIL safe™ (GCSF for chemotherapy
induced neutropenia). The division aims
to strengthen its position in the Indian
market by focusing on growth areas of
pain management and haematological
malignancies.
Abraxane® is ranked 3rd in the hypercompetitive taxanes market
NUFIL™ is ranked among the top four brands in its segment
Evertor™ is the first generic everolimus to be launched in India
Milestones
BIOMAb EGFR® In India, BIOMAb EGFR® is approved for
the treatment of locally advanced head
and neck cancers in combination with
radiotherapy and/or chemotherapy.
Since its launch in September 2006,
over 200 oncologists have endorsed
BIOMAb EGFR® by extending the
benefit of this molecule to over 2,500
Indian patients. In line with Biocon’s
focus on affordable innovation,
BIOMAb EGFR® is available to Indian
patients at a cost 40% lower than
other anti-cancer therapies in the same
class and indication.
Abraxane® A best-in-class taxane launched in India
in 2008, Abraxane®, used in the treat-
ment of metastatic breast cancer, is
making steady inroads into the highly
fragmented and hypercompetitive
Indian taxane market. With significant
sales growth over the last fiscal,
Abraxane®’s efficacy is increasingly
being acknowledged by oncologists.
* Datamonitor
Flagship Brands
Till date, over 2,500 Indian patients have been treated with BIOMAb EGFR®
Affordability Index(as compared to the leading brand
in that category)
BIOMAb EGFR® ~40%Abraxane® ~60%
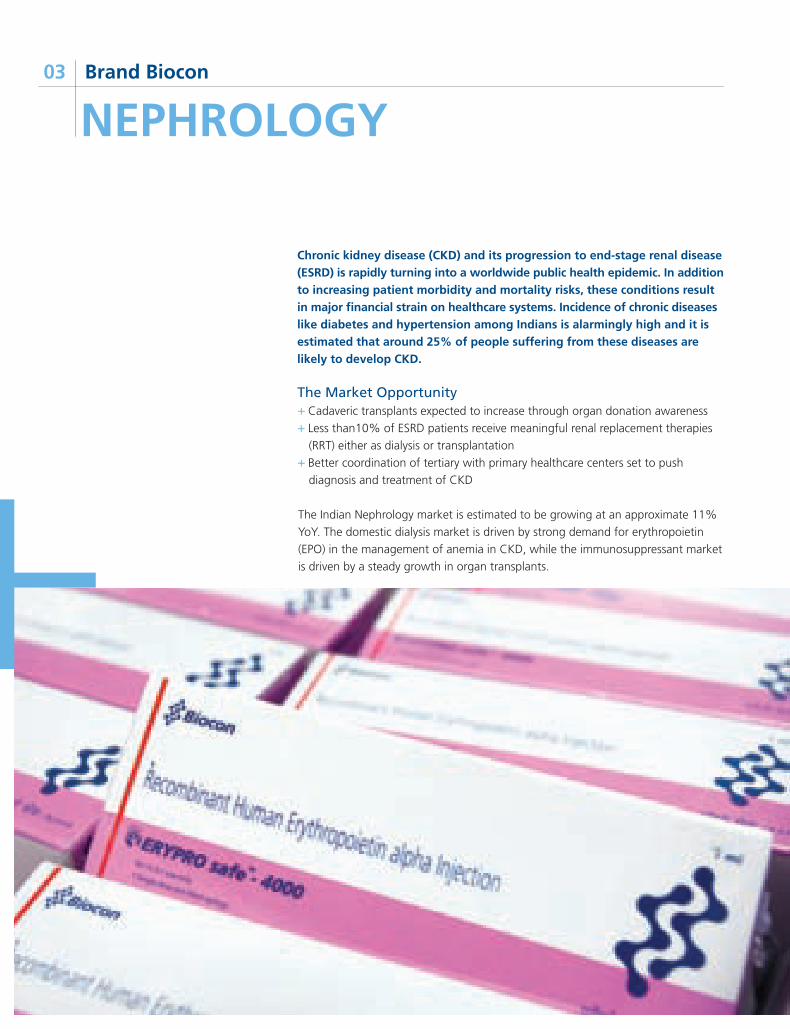
Chronic kidney disease (CKD) and its progression to end-stage renal disease (ESRD) is rapidly turning into a worldwide public health epidemic. In addition to increasing patient morbidity and mortality risks, these conditions result in major financial strain on healthcare systems. Incidence of chronic diseases like diabetes and hypertension among Indians is alarmingly high and it is estimated that around 25% of people suffering from these diseases are likely to develop CKD.
Cadaveric transplants expected to increase through organ donation awareness
Less than10% of ESRD patients receive meaningful renal replacement therapies
(RRT) either as dialysis or transplantation
Better coordination of tertiary with primary healthcare centers set to push
diagnosis and treatment of CKD
The Indian Nephrology market is estimated to be growing at an approximate 11%
YoY. The domestic dialysis market is driven by strong demand for erythropoietin
(EPO) in the management of anemia in CKD, while the immunosuppressant market
is driven by a steady growth in organ transplants.
The Market Opportunity
NEPHROLOGYBrand Biocon03
Marketed Products
ImmunosuppressantsTACROGRAF™RENODAPT®
RENODAPT®-SCYCLOPHIL ME®
RAPACAN™Advacan™
DialysisERYPRO safe™ERYPRO™ERYPRO™ PFSNarita™ + biOSEV™CeRACal™
TACROGRAF™ has attained No. 2 position, overtaking 25 brands in its category
201111
Biocon Annual Report Nephrology
Biocon NephrologyBiocon Nephrology aims to provide the
most comprehensive and cost-effective
therapies for ESRD patients. As one of
the largest manufacturers of immuno-
suppressants in the world, Biocon has
the widest range of products for the
treatment of organ transplantation,
coupled with innovative safety solutions
for renal anemia management. The
division is focused on taking its afford-
able yet world class brands to global
markets while achieving leadership in
the Indian nephrology segment.
Doctor InitiativesRen@links, a monthly e-newsletter
providing scientific updates in the field
of nephrology and organ transplantation
Post-Transplant Patient Monitoring Data Management Software for
management of patient data by
transplant centers
Stand-alone Conferences to demon-
strate strong commitment to good
science through international speaker
programs in nephrology and
transplantation
Biocon Nephrology has achieved a CAGR of over 20%
ERYPRO safe™ is ranked among the top 5 brands in its category
RENODAPT® ranks No. 3 in a segment consisting of 25 brands
TACROGRAF™ is in the No. 2 position, overtaking 25 competing brands
Milestones
TACROGRAF™ Occupying No. 2 position in the highly
congested tacrolimus market consisting
of more than 25 brands, TACROGRAF™
has the broadest dosage range. Its
safety and efficacy have been well
established in clinical practice in India.
In the coming years, TACROGRAF™ is
expected to play a central role in the
immunosuppressive protocols of major
transplant centers across India.
RENODAPT®® The mycophenolic acid (MPA) market,
the largest in the immunosuppressive
space, is also the most crowded and
price sensitive. RENODAPT® is the third
largest brand in the MPA space with
huge potential for growth. Since
launch in 2007, RENODAPT® has
well-established efficacy and safety
data in Indian transplant recipients.
Flagship BrandsAffordability Index(as compared to the leading brand
in that category)
TACROGRAF™ ~30% ERYPRO safe™ ~24%Advacan™ ~45%
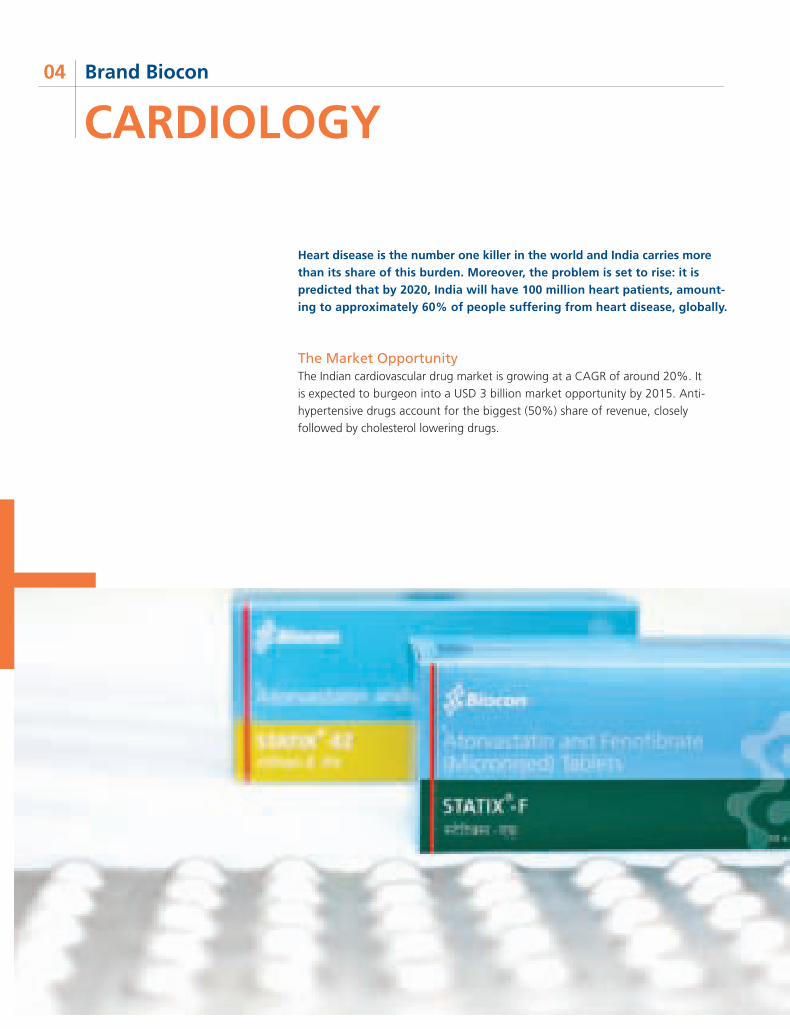
Heart disease is the number one killer in the world and India carries more than its share of this burden. Moreover, the problem is set to rise: it is predicted that by 2020, India will have 100 million heart patients, amount-ing to approximately 60% of people suffering from heart disease, globally.
The Market OpportunityThe Indian cardiovascular drug market is growing at a CAGR of around 20%. It
is expected to burgeon into a USD 3 billion market opportunity by 2015. Anti-
hypertensive drugs account for the biggest (50%) share of revenue, closely
followed by cholesterol lowering drugs.
CARDIOLOGYBrand Biocon04

Marketed Products
STATIX®
STATIX® FSTATIX®-EZTELMISAT®
TELMISAT®-HTELMISAT®-AMACTIBLOK™-IPRACTIBLOK AM™BESTOR®
BRADIA™ THINRIN™CLASPRIN®
ZARGO®
ZARGO® HZIGPRIL®
MYOKINASE® DYNALIX®
CLOTIDE®
PRASACT™ TIROZEST™
In a market of many brands, STATIX® stands out as the purest atorvastatin
201113
Biocon Annual Report Cardiology
Since its inception in 2008, Biocon
Cardiology has focused on providing
differentiated and affordable therapies
to patients suffering from cardiovascular
diseases. In a span of three successful
years, this division has launched an
optimum mix of brands all of which
performed exceedingly well in the
market.
Patient Friendly Lipid Camps Biocon Cardiology organizes Lipid
Camps across India to profile its
leading lipid-lowering brand STATIX®
and enable more patients to understand
their lipid numbers and take early
corrective action with the advice of
a physician. The Camps were well
attended, appreciated by patients and
doctors alike.
STATIX® has established formidable equity with cardiologists in a short span
CLOTIDE® is the leading eptifibatide brand in India
MYOKINASE® is the No. 2 brand of streptokinase in India within 12 months of launch
Milestones
STATIX® In a market of many brands, STATIX®
continues to stand out as the purest
atorvastatin. Its highly differentiated
features offer enhanced efficacy due to
faster rate of atorvastatin absorption,
and improved stability resulting from
smaller and uniform size distribution.
STATIX® has been endorsed by India’s
leading cardiologists and promoted
through well attended countrywide
lipid camps.
MYOKINASE® Used in Acute Myocardial Infarction,
the methionine-free technology of
MYOKINASE® has spurred a country-
wide revolution. In just 12 months,
MYOKINASE® has become the No. 2
brand in the country, having saved the
lives of 60,000 patients till date. Some
of the most reputed hospitals in the
country endorse MYOKINASE®.
Flagship BrandsAffordability Index(as compared to the leading brand
in that category)
BESTOR® ~30% MYOKINASE® ~10%STATIX® ~40%CLOTIDE® ~10%
Biocon Cardiology
COMPREHENSIVE CAREBrand Biocon05
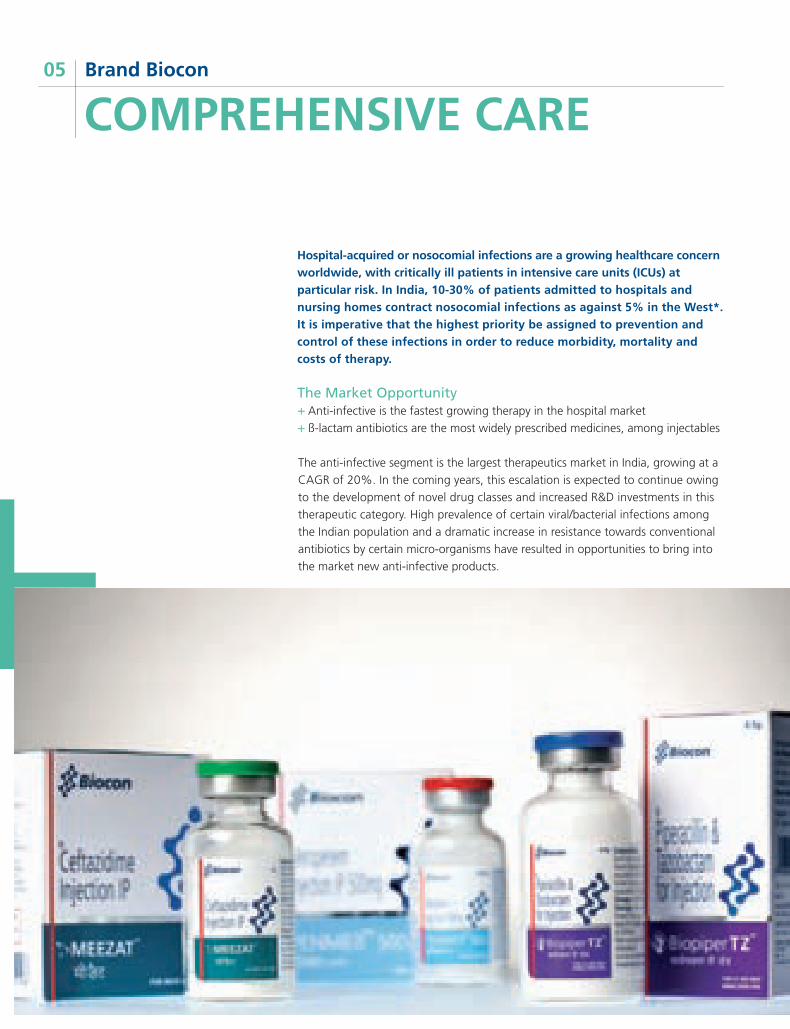
Hospital-acquired or nosocomial infections are a growing healthcare concern worldwide, with critically ill patients in intensive care units (ICUs) at particular risk. In India, 10-30% of patients admitted to hospitals and nursing homes contract nosocomial infections as against 5% in the West*. It is imperative that the highest priority be assigned to prevention and control of these infections in order to reduce morbidity, mortality and costs of therapy.
Anti-infective is the fastest growing therapy in the hospital market
ß-lactam antibiotics are the most widely prescribed medicines, among injectables
The anti-infective segment is the largest therapeutics market in India, growing at a
CAGR of 20%. In the coming years, this escalation is expected to continue owing
to the development of novel drug classes and increased R&D investments in this
therapeutic category. High prevalence of certain viral/bacterial infections among
the Indian population and a dramatic increase in resistance towards conventional
antibiotics by certain micro-organisms have resulted in opportunities to bring into
the market new anti-infective products.
The Market Opportunity
Marketed Products
CELRIM®
CELRIM TZ®
Biopiper TZ™IMICELUM™PENMER®
PENMER® – 500ENTAVAR™ENTAVAR™ – 600MEEZAT™GENPIROME®
201115
Biocon Annual Report Comprehensive Care
Biocon Comprehensive CareLaunched in 2010, Biocon Compre-
hensive Care positions itself in the
critical illness segment with an existing
anti-infective portfolio and the intro-
duction of novel therapies in surgical
trauma and medical emergencies.
Despite being a young entrant into the
Indian market, the division has estab-
lished a strong foothold in major
corporate hospitals across the country
and its products are widely accepted by
the intensive care community.
Biopiper TZ™Indicated for intra-abdominal infections,
skin and skin structure infections, and
pneumonia, Biopiper TZ™ was launched
into a highly competitive market. Owing
to its effectiveness and affordability, this
drug has witnessed steep growth and is
en route to becoming a big brand in
the market.
CELRIM®/CELRIM TZ®
Indicated for the treatment of urinary
tract infections, skin and skin structure
infections, pneumonia and bacteraemia,
CELRIM®/CELRIM TZ® has been extremely
well accepted since its market launch.
*Members of Hospital Infection Society (HIS), India
Flagship Brands
More than 82,000 units of CELRIM®/CELRIM TZ®
were sold within 6 months of launch

Immunological disorders like atopic dermatitis, vitiligo and psoriasis are amongst the top 10 indications observed by dermatologists in India. It is estimated that over 2% of Indians struggle with the social, psychological and physical complexities associated with immunological disorders.
The immuno-dermatology market in India is growing at a rapid pace. While steroids
and its combinations are the most common line of treatment for immunological
disorders, the chronic and recurrent nature of these diseases makes non-steroidal
or immunomodulators a preferred long term therapy option. The Indian market for
immunomodulators is highly promising. Within this segment, the market size for
tacrolimus and pimecrolimus is growing at approximately 15%.
The Market Opportunity
IMMUNOTHERAPYBrand Biocon06
Marketed Products
TBIS®
PICON®
PSORID™
201117
Biocon Annual Report Immunotherapy
Biocon ImmunotherapyLaunched in Oct 2010, Biocon Immuno-
therapy is focused on bringing to the
market a portfolio of safe, efficacious
and affordable immunomodulator
drugs for the treatment of immune
related disorders in dermatology. With
an objective to build a large portfolio of
brands and actively support the disease
area, the division aims to establish its
credentials and reinforce its commitment
to the patient and physician commun-
ities. To date, we have launched three
brands: TBIS®, PICON® and PSORID™.
In addition to 10gm, 30 gm lami tube SKUs were introduced for the first time in India
The launch of PSORID™ (cyclosporine capsules/oral solution) is a first among dermatological companies in India
Milestones
PICON® and TBIS®
PICON® is on its way to becoming the
No.1 brand of pimecrolimus and TBIS®
is fast catching up with the brand leader.
In just five months of launch, Biocon
Immunotherapy has gained formidable
market share in the immuno-derma
market. The launch of 30 gm SKU is
also expected to further strengthen
brand equity in the area of immune
related dermatological disorders.
Flagship Brands
PICON® is poised to become the No.1 brand of pimecrolimus in India
Affordability Index(as compared to the leading brand
in that category)
PICON® ~50%
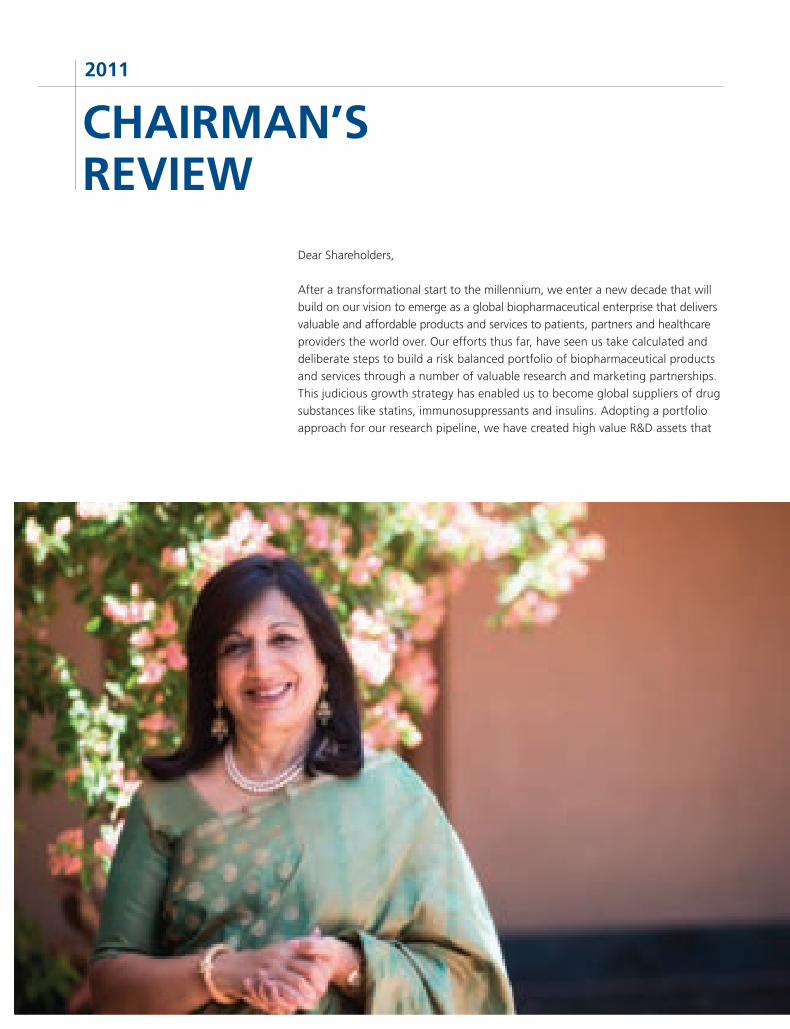
CHAIRMAN’S REVIEW
2011
Dear Shareholders,
After a transformational start to the millennium, we enter a new decade that will
build on our vision to emerge as a global biopharmaceutical enterprise that delivers
valuable and affordable products and services to patients, partners and healthcare
providers the world over. Our efforts thus far, have seen us take calculated and
deliberate steps to build a risk balanced portfolio of biopharmaceutical products
and services through a number of valuable research and marketing partnerships.
This judicious growth strategy has enabled us to become global suppliers of drug
substances like statins, immunosuppressants and insulins. Adopting a portfolio
approach for our research pipeline, we have created high value R&D assets that
201119
Biocon Annual Report Chairman’s Review
we are periodically unlocking through
licensing or via market access. The path
ahead is about building Brand Biocon
through products that can make a diff-
erence to chronic diseases like diabetes,
cancer, cardiovascular, autoimmune and
renal malfunction.
The journey ahead is therefore one of value added transition. From drug substance to drug product. From Drug Master Files (DMFs) to Product Dossiers. Over the last decade, Biocon has built significant brand equity across our customer base. The task before us now, is to extend that brand recognition to our products in the retail market.
In building Brand Biocon, we look
beyond the market and aim to deliver
medical education to healthcare pro-
fessionals and patients with a view to
create greater awareness of disease
management and thereby, better out-
come. Brand Biocon is committed to
making a difference to patients through
affordable drug innovation.
I am very happy to share with you the
progress we have made in creating this
brand recognition.
Brand Building through Differentiation and SpecializationWe have adopted a well researched
business strategy to develop products
that address chronic therapies in select
disease segments. We have identified
anchor products to spearhead the
launch of our brands into the Indian
market. The first such key product was
recombinant human insulin branded
Insugen® that launched our Diabetology
division in 2004. Entering at the lowest
rung, we have worked our way up the
anti-diabetic value chain to be ranked
12th in our represented market last
fiscal. Insugen® is a leading brand in the
country today, rapidly narrowing the
gap with its innovator counterparts.
The Biocon-Pfizer partnership is indeed a significant inflection point in our growth path. Our Companies bring together a winning combination of marketing, manufacturing and research excellence which will build a formidable global footprint in diabetes care
Our first insulin analog Glargine,
branded BASALOG® was introduced
into the market in 2010 and is already
the No. 2 brand. We have innovatively
supported this division by a successful
patient engagement program, Winning
with Diabetes, and are now creating a
medical education forum, ABIDE. This
forum enables doctor-patient interface
based on an IT platform and aims to
disseminate medical information and
training modules to diabetics and
physicians in remote reaches of the
country.
Spurred by the success of our insulins,
we entered into an exciting agreement
with Pfizer to address a large and lucra-
tive global biosimilar insulin opportunity.
Biocon has also developed a very
strong portfolio around Chronic Kidney
Disease. Our Nephrology division has
performed exceedingly well with
its flagship brands TACROGRAF™
(tacrolimus) now occupying the No. 2
position in the market and RENODAPT®
(mycophenolate mofetil) the third
largest brand in its category. Impressive
branding, high share of noise in the
market and a differentiated safety
device have propelled the success of
our ERYPRO™ group of erythropoietin
based therapies for the dialysis segment.
In Oncology, our brand portfolio has
garnered impressive market share.
Anchored by our proprietary, anti-
cancer MAb, BIOMAb EGFR® and
supported by our flagship albumin
fusion nanoparticle taxane, Abraxane®
and our biosimilar Granulocyte Stimu-
lating Factor (GCSF), NUFIL™, the
division is gaining good traction in
the market having recorded a robust
YoY growth this fiscal.
The fourth division, Cardiology,
launched in 2008 has been propelled
by our flagship brand STATIX® to a
ranking of 23 in a highly crowded
market. Q3 2011 saw the launch of
PRASACT™ (prasugrel) and TIROZEST™
(tirofiban) to consolidate our interven-
tional cardiology portfolio. Recent
introductions like BESTOR® (rosuvastatin)
and ACTIBLOK™ (metoprolol) continue
to follow a high growth trajectory.
In FY 2011, we added two more
divisions, Immunotherapy and Com-
prehensive Care. The Immunotherapy
focus in Phase I, is on introducing
molecules for the treatment of
immune-related dermatological
disorders, launched with two diff-
erentiated molecules in its armory
– TBIS® (tacrolimus) and PICON®
(pimecrolimus), for the treatment
of atopic dermatitis and vitiligo. Both
drugs have been well accepted and
are performing exceedingly well in
the market.
To cater to the critical care segment,
Biocon launched a Comprehensive
Care Division to provide affordable,
quality medicines for illness including
nosocomial infections, post-surgical
complications, trauma and medical
emergencies. I am proud to declare that
within just six months from launch, this
division has gained entry to the country’s
best corporate hospitals with its high
quality portfolio of specialty products.
Research & DevelopmentBiocon’s R&D has had a successful,
decade long track record of innovation.
Our research efforts have generated a
pipeline of generic small molecules,
biosimilars and novel biologics with
the potential of unleashing high value
growth in a sustained manner over the
foreseeable future.
01 Net income increased 17% to INR 28,137 million02 Profits grew 25% to an all time high of INR 3,675 million
Our portfolio of generic molecules
has enabled us to garner a dominant
position as a supplier of generic APIs
viz. statins and immunosuppressants
to US, European and Latin American
markets. This, I am pleased to say, has
yielded good financial returns and has
allowed us to forge very strong part-
nerships with global generics compa-
nies. One such partner, Mylan, has
extended this relationship in 2009,
to a portfolio of biosimilar monoclonal
antibodies. In October 2010, we
announced a global commercialization
partnership with Pfizer for our portfolio
of recombinant human insulin and
insulin analogs. Given the growing
incidence of diabetes the world over,
biosimlar insulins offer a large market
opportunity from 2014.
Our novel pipeline is also rapidly
advancing into the clinic. The most
advanced programs are IN-105 (oral
insulin) and T1h (itolizumab), an
anti-CD6 targeting MAb, both of which
have completed a Phase II/III proof of
efficacy clinical studies. Although oral
insulin did not meet its desired primary
end-point of HbA1c lowering, this was
attributable to an unexpectedly high
placebo effect due to frequent self
blood glucose monitoring. However,
all secondary end-points were met,
indicative of proof of action, another
program, BVX-20, a humanized anti-
CD20 monoclonal antibody being
co-developed with Vaccinex, is about
to enter the clinic. Two more in early
stages of development are: a hybrid
peptide with dual pharmacology for
type II diabetes being co-developed
with Amylin; and immunoconjugated
MAbs which will function as tumor
vaccines, being developed with IatriCa,
a start-up which originated from a
discovery made at the Johns Hopkins
University. We expect to initiate
discussions for partnering a few of
these programs in the coming fiscal.
Strategic PartnershipsPartnering has always been at the heart
of Biocon’s business philosophy and we
will continue to build value through
strategic partnering. We have sought
both research and marketing partner-
ships as a way to make global impact.
Pfizer The most visible and high profile part-
nership that we recently announced was
with the world’s leading pharmaceutical
company, Pfizer, to commercialize
our insulins portfolio. Pfizer will have
exclusive and a few co-exclusive rights
to commercialize these products
globally, while Biocon will be respon-
sible for the clinical development,
manufacture and supply of these
biosimilar insulin products. We firmly
believe this landmark partnership will
drive considerable growth in the
foreseeable future.
OptimerFY 2011 also saw Biocon and Optimer
Pharmaceuticals Inc. enter into a long
term supply agreement for the com-
mercial manufacturing of the API,
fidaxomicin, Optimer’s new drug for
the treatment of C. difficile. I believe,
our partnership with Optimer is an
emphatic recognition of Biocon’s cap-
abilities as an R&D partner as well as
an acknowledgement of our global
biomanufacturing strength. I am
delighted to inform you that Optimer
has just received US FDA approval for
this molecule which positions Biocon
as a sole supplier of this drug substance
for the market launch.
03 Research Services business crossed INR 3,175 million in revenue04 Licensing and Development fees grew 201% to INR 1,525 million
201121
Biocon Annual Report Chairman’s Review
Strategic Foreign Direct InvestmentWorld class infrastructure and attractive
tax incentives make Malaysia a compell-
ing destination for biotechnology.
Investing in Malaysia provides us with
an international location with strategic
geographical proximity to India. Biocon
is pleased to be an early mover in this
emerging opportunity and have
agreed to invest in establishing a
biomanufacturing facility at Bio-XCell,
a custom-built biotechnology park in
Iskandar Malaysia, Johor. This invest-
ment is the largest for the Malaysian
biotechnology sector thus far. In the
first phase, Biocon proposes to invest
around RM 500 million (approximately
USD 161 million) to create an insulin
manufacturing facility targeted to be
operational by 2014.
Research ServicesOur research services business supported
by Syngene and Clinigene, continues
to be a key growth driver, delivering a
CAGR of 13%. We are well positioned
to take advantage of the increasing
trend in big pharma to externalize R&D.
Additionally, there is a perceptible drift
from fee for service and component
services to integrated R&D and
partnered co-development on a risk
sharing platform. Between Syngene
and Clinigene, we are uniquely placed
to offer end-to-end integrated services
in both small and large molecules.
Our partnership with Bristol-Myers
Squibb is a fore runner of this integrated
service model. The customized R&D hub,
BBRC, that has been created at Syngene,
is enabling BMS to pursue pipeline
development through a team of over
450 scientists working seamlessly with
BMS labs in the U.S.
Beyond BordersNeoBiocon
After the successful launch of Abraxane®
in the UAE region, this year NeoBiocon
has introduced a range of branded
generic products in therapy areas of
cardiology, diabetology and infection
management. We are pleased with the
progress of this JV and look forward
to greater access to this high growth
region.
AxiCorpPursuant to our global insulins part-
nership with Pfizer, I would like to
announce that Biocon is divesting its
stake in its German subsidiary, AxiCorp
GmbH, to the existing group of pro-
moter shareholders. We believe that
this is in the best interests of the
shareholders of both companies.
Axicorp has done an admirable job in
sustaining profitability under difficult
external circumstances, triggered by
German healthcare reforms. Biocon
wishes AxiCorp´s management and
employees the very best in their
future endeavors.
Corporate Social ResponsibilityThe year gone by saw Biocon Foun-
dation being focused on integrating its
health initiatives to maximize their
impact and relevance to the comm-
unities it works with. By bringing
together the Foundation’s programs in
preventive healthcare, primary health-
care and health insurance for surgery
and other hospital care, we aim to
make our healthcare interventions more
effective, sustainable and scalable.
In FY 2011 we concentrated on
preventive health, particularly
addressing problems related to the
paucity of doctors. Keeping this in
mind, we train community health
workers to be peer educators and
05 Human Resources headcount rose to 5,500+ employees06 Net R&D spend, including clinical development, at INR 1,346 million
helpers who administer our programs,
ranging from a unique mobile phone
based cancer screening program, to
preventive health education.
Biocon and Biocon Foundation have
also assisted the Government of
Karnataka in building hundreds of
homes for displaced families in the
Bagalkot district of Karnataka that
was severely affected by floods.
Looking AheadI strongly believe that what we have
achieved so far is the beginning of a
new era of growth. The critical mass
we have built in the domestic formu-
lations space gives us the confidence
to pursue a larger and more responsive
brand position in the market. We are
now Asia’s largest biopharma company
and the only Asian company among
the top 25 in global biopharma. We are
committed to strengthening our growth
trajectory through branded formu-
lations, a strong R&D pipeline, an
integrated portfolio of research services
and strategic partnering that provides a
global footprint. I would like to see
Brand Biocon build on its core values
of quality, affordability, reliability and
innovation. That to me is the true and
201123
Biocon Annual Report Chairman’s Review
07 Domestic branded formulations grew at a robust 36%08 Interim dividend declared at 30%. Final dividend recommended at 60%
enduring test of a successful brand in
the global arena.
Once again, I commend Biocon’s people
for their entrepreneurial spirit, commit-
ment, teamwork and integrity. Inspired
by the tremendous possibilities of
science, Team Biocon has remained
admirably focused on advancing novel
therapies, driving our businesses and
supporting patient health, the world
over. I look forward to the year ahead
with a sense of confidence to deliver
even greater value to all our stakeholders.
Yours sincerely,
Kiran Mazumdar-Shaw
May 2011
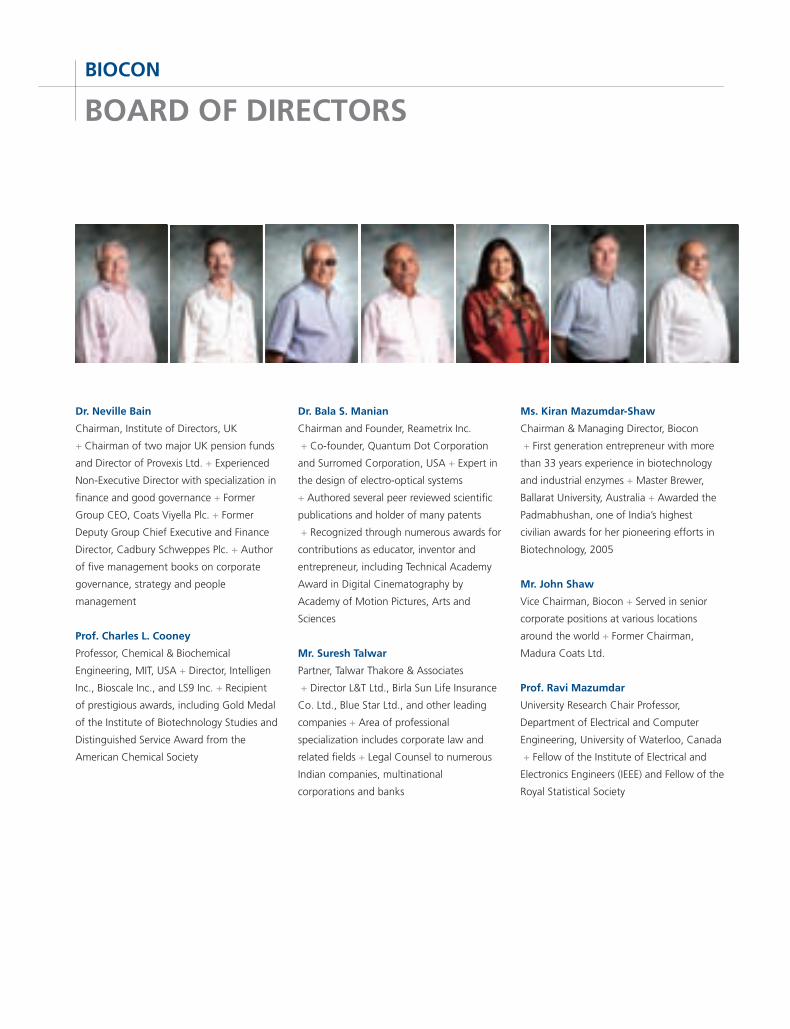
Dr. Neville Bain
Chairman, Institute of Directors, UK
+ Chairman of two major UK pension funds
and Director of Provexis Ltd. + Experienced
Non-Executive Director with specialization in
finance and good governance + Former
Group CEO, Coats Viyella Plc. + Former
Deputy Group Chief Executive and Finance
Director, Cadbury Schweppes Plc. + Author
of five management books on corporate
governance, strategy and people
management
Prof. Charles L. Cooney
Professor, Chemical & Biochemical
Engineering, MIT, USA + Director, Intelligen
Inc., Bioscale Inc., and LS9 Inc. + Recipient
of prestigious awards, including Gold Medal
of the Institute of Biotechnology Studies and
Distinguished Service Award from the
American Chemical Society
BOARD OF DIRECTORS
BIOCON
Dr. Bala S. Manian
Chairman and Founder, Reametrix Inc.
+ Co-founder, Quantum Dot Corporation
and Surromed Corporation, USA + Expert in
the design of electro-optical systems
+ Authored several peer reviewed scientific
publications and holder of many patents
+ Recognized through numerous awards for
contributions as educator, inventor and
entrepreneur, including Technical Academy
Award in Digital Cinematography by
Academy of Motion Pictures, Arts and
Sciences
Mr. Suresh Talwar
Partner, Talwar Thakore & Associates
+ Director L&T Ltd., Birla Sun Life Insurance
Co. Ltd., Blue Star Ltd., and other leading
companies + Area of professional
specialization includes corporate law and
related fields + Legal Counsel to numerous
Indian companies, multinational
corporations and banks
Ms. Kiran Mazumdar-Shaw
Chairman & Managing Director, Biocon
+ First generation entrepreneur with more
than 33 years experience in biotechnology
and industrial enzymes + Master Brewer,
Ballarat University, Australia + Awarded the
Padmabhushan, one of India’s highest
civilian awards for her pioneering efforts in
Biotechnology, 2005
Mr. John Shaw
Vice Chairman, Biocon + Served in senior
corporate positions at various locations
around the world + Former Chairman,
Madura Coats Ltd.
Prof. Ravi Mazumdar
University Research Chair Professor,
Department of Electrical and Computer
Engineering, University of Waterloo, Canada
+ Fellow of the Institute of Electrical and
Electronics Engineers (IEEE) and Fellow of the
Royal Statistical Society

CLINICAL ADVISORY BOARD
Prof. Catherine Rosenberg
Alternate Director to Prof. Ravi Mazumdar,
Biocon + Director, Syngene International
Limited + University Research Chair Professor
& Chairman + Department of Electrical &
Computer Engineering, University of
Waterloo, Canada
Mr. Peter Bains
Director, Syngene International Limited
+ Director, Peter Bains Consulting Limited
+ Director, Sosei, a Tokyo listed Japanese
biotechnology company + Extensive track
record of achievement as a senior pharma
and life science executive
Prof. Alan D. Cherrington
PhD, Professor & Chairman of Molecular
Physiology & Biophysics and Professor of
Medicine & Diabetes Research, Vanderbilt
University + Past President of the American
Diabetes Association
Dr. G. Alexander Fleming
MD, President and CEO of Kinexum LLC
+ Member of numerous Scientific Advisory
Boards and Expert Committees
Dr. Harold E. Lebovitz
MD, FACE, Professor of Medicine,
Endocrinology and Diabetes Division,
State University of New York,
Health Science Center, Brooklyn
Dr. Kapil Dhingra
Managing Member, KAPital Consulting
LLC + Former Head, Roche Oncology
Leadership Team
Prof. Andrew Morris
FMedSci, Professor of Medicine & Director,
Biomedical Research Institute, University of
Dundee
201125
Biocon Annual Report BOD + CAB

HIGHLIGHTS
Milestones
Healthcare Marketing
Research & Development
Discovery Research Services: Syngene
Clinical Research Services: Clinigene
Human Resources
Quality & Regulatory
Environment, Health & Safety
Corporate Social Responsibility
Product Glossary
Financial Highlights
28
30
35
39
41
42
44
44
46
52
60
MILESTONES2011
01 Biocon and Pfizer enter into a global agreement for the worldwide commercialization of Biocon’s Biosimilar Insulin and Insulin Analog products.
02 Biocon to establish state-of-the-art biopharma-ceutical manufacturing facility at BioXcell, a custom built biotechnology park and ecosystem in Malaysia.
03 Biocon divests stake in its German subsidiary, AxiCorp GmbH, to the existing group of promoter shareholders.
04 Biocon’s partner Optimer Pharmaceuticals receives FDA approval for Dificid (a first-in-class anti-infective for C. difficile treatment). Biocon is the sole supplier of the API to Optimer.
05 Biocon announces preliminary data on its novel Oral Insulin drug candidate. Topline analysis has shown encouraging results in patients with Type II Diabetes.
06 Biocon launches two new healthcare marketing divisions: Biocon Immunotherapy, targeting the treatment of immune related disorders in derma-tology and rheumatology; and Comprehensive Care, focused on therapies for critical care illness like nosocomial infections, post-surgical compli-cations, trauma and medical emergencies.
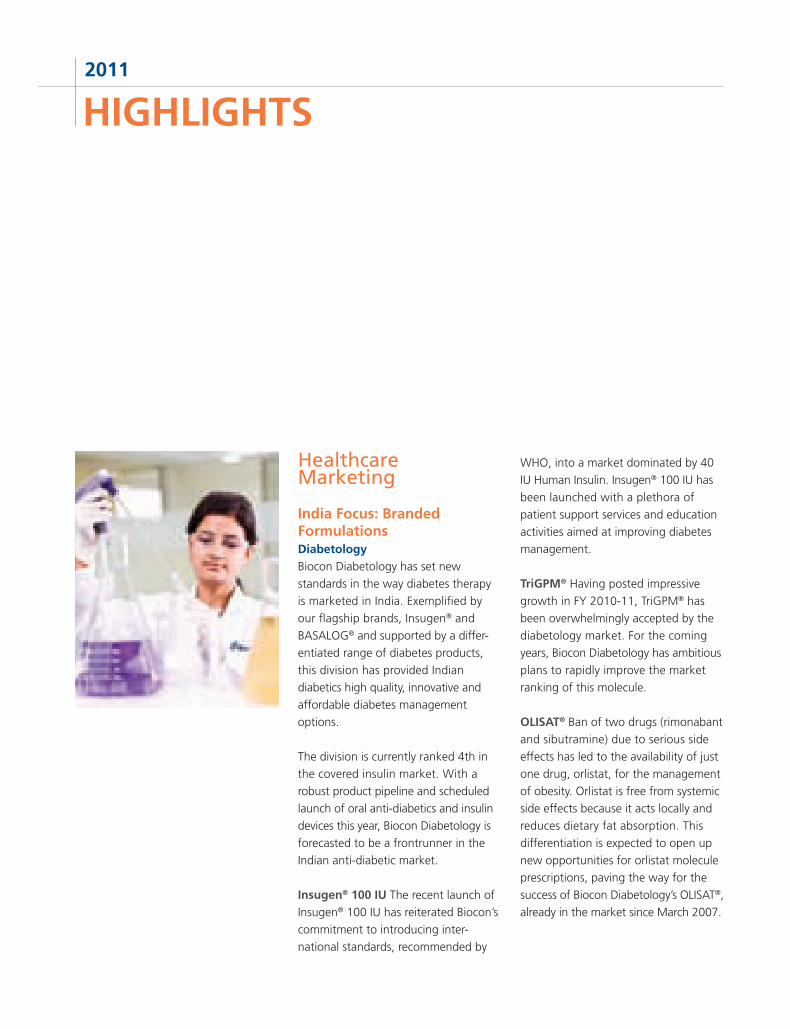
WHO, into a market dominated by 40
IU Human Insulin. Insugen® 100 IU has
been launched with a plethora of
patient support services and education
activities aimed at improving diabetes
management.
TriGPM® Having posted impressive
growth in FY 2010-11, TriGPM® has
been overwhelmingly accepted by the
diabetology market. For the coming
years, Biocon Diabetology has ambitious
plans to rapidly improve the market
ranking of this molecule.
OLISAT® Ban of two drugs (rimonabant
and sibutramine) due to serious side
effects has led to the availability of just
one drug, orlistat, for the management
of obesity. Orlistat is free from systemic
side effects because it acts locally and
reduces dietary fat absorption. This
differentiation is expected to open up
new opportunities for orlistat molecule
prescriptions, paving the way for the
success of Biocon Diabetology’s OLISAT®,
already in the market since March 2007.
HealthcareMarketing
India Focus: Branded FormulationsDiabetologyBiocon Diabetology has set new
standards in the way diabetes therapy
is marketed in India. Exemplified by
our flagship brands, Insugen® and
BASALOG® and supported by a differ-
entiated range of diabetes products,
this division has provided Indian
diabetics high quality, innovative and
affordable diabetes management
options.
The division is currently ranked 4th in
the covered insulin market. With a
robust product pipeline and scheduled
launch of oral anti-diabetics and insulin
devices this year, Biocon Diabetology is
forecasted to be a frontrunner in the
Indian anti-diabetic market.
Insugen® 100 IU The recent launch of
Insugen® 100 IU has reiterated Biocon’s
commitment to introducing inter-
national standards, recommended by
HIGHLIGHTS2011
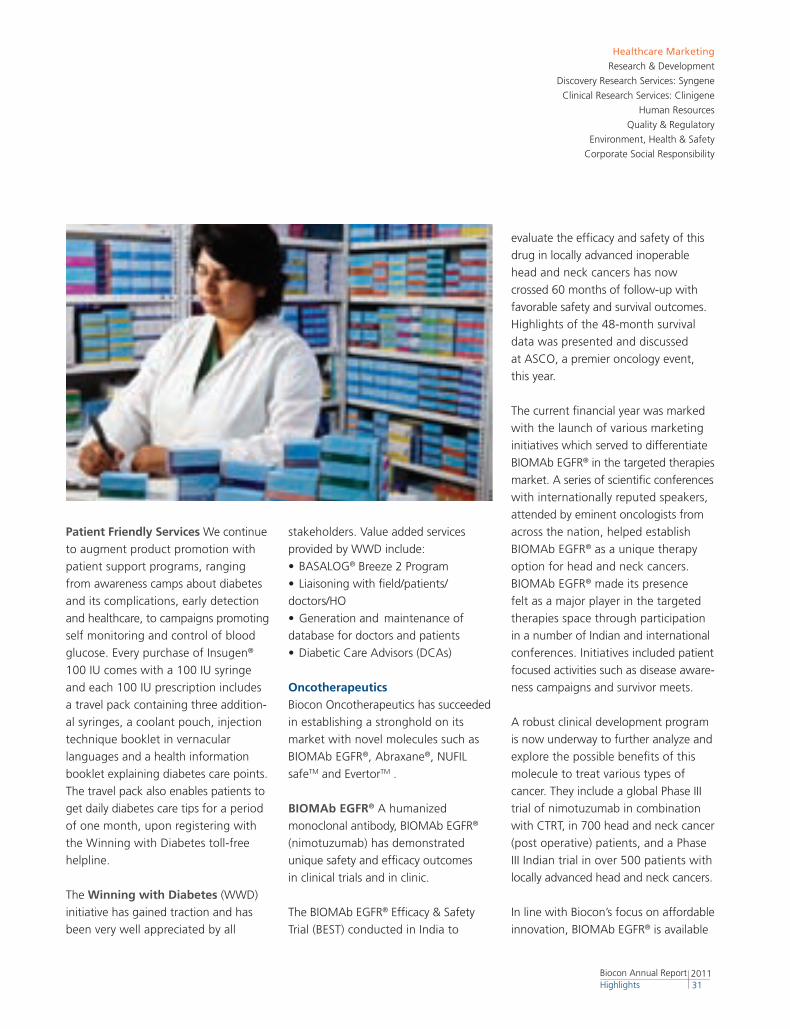
Patient Friendly Services We continue
to augment product promotion with
patient support programs, ranging
from awareness camps about diabetes
and its complications, early detection
and healthcare, to campaigns promoting
self monitoring and control of blood
glucose. Every purchase of Insugen®
100 IU comes with a 100 IU syringe
and each 100 IU prescription includes
a travel pack containing three addition-
al syringes, a coolant pouch, injection
technique booklet in vernacular
languages and a health information
booklet explaining diabetes care points.
The travel pack also enables patients to
get daily diabetes care tips for a period
of one month, upon registering with
the Winning with Diabetes toll-free
helpline.
The Winning with Diabetes (WWD)
initiative has gained traction and has
been very well appreciated by all
stakeholders. Value added services
provided by WWD include:
• BASALOG® Breeze 2 Program
• Liaisoning with field/patients/
doctors/HO
• Generation and maintenance of
database for doctors and patients
• Diabetic Care Advisors (DCAs)
OncotherapeuticsBiocon Oncotherapeutics has succeeded
in establishing a stronghold on its
market with novel molecules such as
BIOMAb EGFR®, Abraxane®, NUFIL
safeTM and EvertorTM .
BIOMAb EGFR® A humanized
monoclonal antibody, BIOMAb EGFR®
(nimotuzumab) has demonstrated
unique safety and efficacy outcomes
in clinical trials and in clinic.
The BIOMAb EGFR® Efficacy & Safety
Trial (BEST) conducted in India to
evaluate the efficacy and safety of this
drug in locally advanced inoperable
head and neck cancers has now
crossed 60 months of follow-up with
favorable safety and survival outcomes.
Highlights of the 48-month survival
data was presented and discussed
at ASCO, a premier oncology event,
this year.
The current financial year was marked
with the launch of various marketing
initiatives which served to differentiate
BIOMAb EGFR® in the targeted therapies
market. A series of scientific conferences
with internationally reputed speakers,
attended by eminent oncologists from
across the nation, helped establish
BIOMAb EGFR® as a unique therapy
option for head and neck cancers.
BIOMAb EGFR® made its presence
felt as a major player in the targeted
therapies space through participation
in a number of Indian and international
conferences. Initiatives included patient
focused activities such as disease aware-
ness campaigns and survivor meets.
A robust clinical development program
is now underway to further analyze and
explore the possible benefits of this
molecule to treat various types of
cancer. They include a global Phase III
trial of nimotuzumab in combination
with CTRT, in 700 head and neck cancer
(post operative) patients, and a Phase
III Indian trial in over 500 patients with
locally advanced head and neck cancers.
In line with Biocon’s focus on affordable
innovation, BIOMAb EGFR® is available
Healthcare Marketing
Research & Development
Discovery Research Services: Syngene
Clinical Research Services: Clinigene
Human Resources
Quality & Regulatory
Environment, Health & Safety
Corporate Social Responsibility
201131
Biocon Annual Report Highlights
to Indian patients at a cost 40% lower
than other anti-cancer therapies in the
same class and indication.
Abraxane® Launched just three years
ago, Abraxane® is making steady
inroads into the highly fragmented
and hypercompetitive Indian taxane
market, with significant sales growth
over the last fiscal. While major usage
share is held by metastatic breast
cancer, Abraxane®’s efficacy in multiple
difficult-to-treat cancers such as ovarian
cancer, non-small cell lung cancer,
pancreatic cancer, etc. is increasingly
being acknowledged by physicians.
The current financial year saw the
launch of marketing initiatives to boost
Abraxane®’s brand equity. Activities
ranged from disease awareness cam-
paigns to video conferences and live
national and international speaker
programs. Back-to-back speaker meets
involving key opinion leaders in onco-
logy have reinforced Abraxane® as a
formidable alternative to conventional
treatment options.
NUFIL safe™ Biocon Oncotherapeutics
trademark for filgrastim (r-metHuG-
CSF), NUFIL safe™ has been indigeno-
usly developed at Biocon’s world class
manufacturing facility. It is incorporated
with an Ultrasafe Passive® Delivery
System which enables protection from
needle stick injuries and provides
enhanced patient comfort. Since its
launch in 2008, NUFIL safe™ has
differentiated itself from the compe-
tition and garnered appreciable market
share. It is currently the 4th largest
brand in the market.
EvertorTM Launched in December
2010, EvertorTM is the first generic
of everolimus in India indicated for the
treatment of patients with advanced
renal cell carcinoma (RCC). In 2010,
everolimus received US FDA approval
for the treatment of subependymal
giant cell astrocytoma (SEGA) asso-
ciated with tuberous sclerosis (TS)
requiring therapeutic intervention
but no curative surgical resection.
EvertorTM works by inhibiting mTOR,
which is a key serine-threonine kinase,
the activity of which is known to be
upregulated in a number of human
cancers. Everolimus is currently being
studied in other indications such as
breast cancer, NHL, gastric cancer,
hepato cellular carcinoma (HCC),
neuroendocrine tumors (NET), NSCLC
and colorectal cancer.
NephrologySince its launch in 2007, Biocon
Nephrology has come a long way in
offering the most comprehensive and
well balanced portfolio of products for
dialysis and transplantation. Operating
in a highly competitive and increasingly
price sensitive market, with more than
20 active players and newer companies
joining every year, Biocon Nephrology
has achieved much success in a short
span of time.
Its flagship brand TACROGRAF™ now
occupies 2nd position in the highly
congested tacrolimus market while
RENODAPT® is the third largest brand
in its category with tremendous
potential for future growth. The
division’s other products ERYPRO™,
ERYPRO™ PFS and ERYPRO safe™ have also fared exceptionally well over
the last year. Impressive branding,
strategic marketing and an innovative
safety device have propelled Biocon’s
Erypro Group to 4th position in the
highly fragmented EPO market.
Patient Initiatives• Ayushamaan – A welcome kit for
newly transplanted patients containing
educational material on post transplant
renal care, mask, pen, etc.
• Breeze 2 – Patient support program,
launched in 2010, providing a compli-
mentary Breeze 2 glucometer to
patients enrolled on TACROGRAF™
and RENODAPT®
• TDM levels – Unrestricted support to
therapeutic drug monitoring of the
immunosuppressant portfolio
• SMBG Camps – Conducted to spread
awareness about post transplant
diabetes mellitus and the importance
of self monitoring of blood glucose
CardiologyBiocon Cardiology continues to provide
therapy to cardiovascular patients across
India through high quality products and
innovative patient/doctor initiatives. Led
by its flagship brands STATIX® and
MYOKINASE®, the division’s marketed
products have performed impressively,
garnering greater market share and
receiving much appreciation from
medical and patient communities.
STATIX® In a market of many brands,
Biocon’s STATIX® stands apart as the
purest atorvastatin. The distinguishing
features and well validated benefits of
this highly differentiated drug will, in
the long run, considerably contribute
to reducing the risks associated with
cardiovascular diseases.
Benefits of STATIX® to patients:
• Enhanced efficacy due to faster rate
of atorvastatin absorption
• Improved stability resulting from
smaller and uniform size distribution
• Increased shelf life with no increase
in total impurities
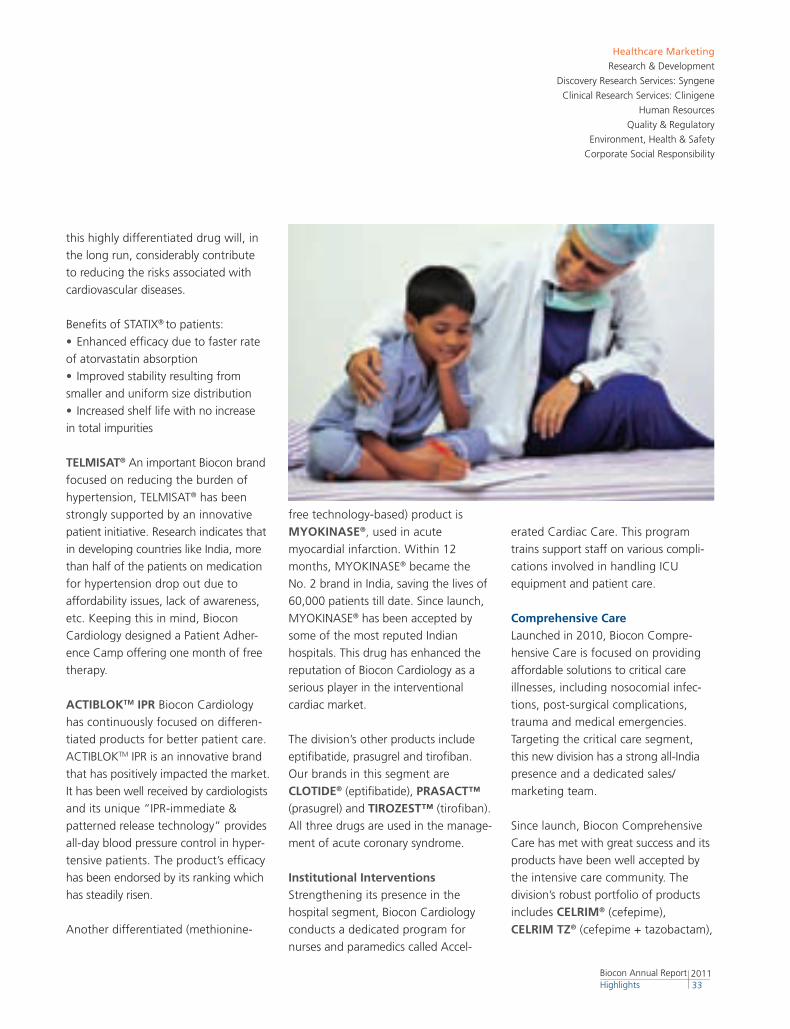
TELMISAT® An important Biocon brand
focused on reducing the burden of
hypertension, TELMISAT® has been
strongly supported by an innovative
patient initiative. Research indicates that
in developing countries like India, more
than half of the patients on medication
for hypertension drop out due to
affordability issues, lack of awareness,
etc. Keeping this in mind, Biocon
Cardiology designed a Patient Adher-
ence Camp offering one month of free
therapy.
ACTIBLOKTM IPR Biocon Cardiology
has continuously focused on differen-
tiated products for better patient care.
ACTIBLOKTM IPR is an innovative brand
that has positively impacted the market.
It has been well received by cardiologists
and its unique “IPR-immediate &
patterned release technology” provides
all-day blood pressure control in hyper-
tensive patients. The product’s efficacy
has been endorsed by its ranking which
has steadily risen.
Another differentiated (methionine-
free technology-based) product is
MYOKINASE®, used in acute
myocardial infarction. Within 12
months, MYOKINASE® became the
No. 2 brand in India, saving the lives of
60,000 patients till date. Since launch,
MYOKINASE® has been accepted by
some of the most reputed Indian
hospitals. This drug has enhanced the
reputation of Biocon Cardiology as a
serious player in the interventional
cardiac market.
The division’s other products include
eptifibatide, prasugrel and tirofiban.
Our brands in this segment are
CLOTIDE® (eptifibatide), PRASACT™
(prasugrel) and TIROZEST™ (tirofiban).
All three drugs are used in the manage-
ment of acute coronary syndrome.
Institutional Interventions Strengthening its presence in the
hospital segment, Biocon Cardiology
conducts a dedicated program for
nurses and paramedics called Accel-
erated Cardiac Care. This program
trains support staff on various compli-
cations involved in handling ICU
equipment and patient care.
Comprehensive Care Launched in 2010, Biocon Compre-
hensive Care is focused on providing
affordable solutions to critical care
illnesses, including nosocomial infec-
tions, post-surgical complications,
trauma and medical emergencies.
Targeting the critical care segment,
this new division has a strong all-India
presence and a dedicated sales/
marketing team.
Since launch, Biocon Comprehensive
Care has met with great success and its
products have been well accepted by
the intensive care community. The
division’s robust portfolio of products
includes CELRIM® (cefepime),
CELRIM TZ® (cefepime + tazobactam),
Healthcare Marketing
Research & Development
Discovery Research Services: Syngene
Clinical Research Services: Clinigene
Human Resources
Quality & Regulatory
Environment, Health & Safety
Corporate Social Responsibility
201133
Biocon Annual Report Highlights
Biopiper TZ™ (piperacillin + tazo-
bactam), IMICELUM™ (imipenem +
cilastatin), PENMER® (meropenem),
ENTAVAR™ (linezolid), MEEZAT™ (ceftazidime) and GENPIROME®
(cefpirome sulphate).
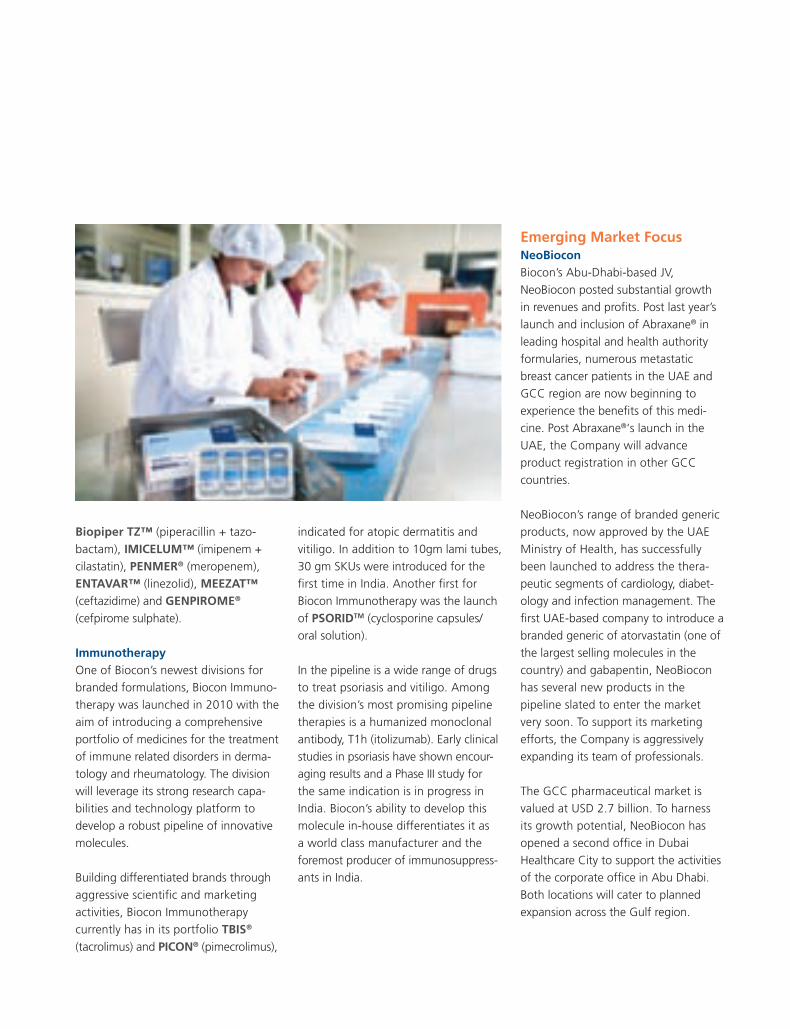
ImmunotherapyOne of Biocon’s newest divisions for
branded formulations, Biocon Immuno-
therapy was launched in 2010 with the
aim of introducing a comprehensive
portfolio of medicines for the treatment
of immune related disorders in derma-
tology and rheumatology. The division
will leverage its strong research capa-
bilities and technology platform to
develop a robust pipeline of innovative
molecules.
Building differentiated brands through
aggressive scientific and marketing
activities, Biocon Immunotherapy
currently has in its portfolio TBIS®
(tacrolimus) and PICON® (pimecrolimus),
indicated for atopic dermatitis and
vitiligo. In addition to 10gm lami tubes,
30 gm SKUs were introduced for the
first time in India. Another first for
Biocon Immunotherapy was the launch
of PSORIDTM (cyclosporine capsules/
oral solution).
In the pipeline is a wide range of drugs
to treat psoriasis and vitiligo. Among
the division’s most promising pipeline
therapies is a humanized monoclonal
antibody, T1h (itolizumab). Early clinical
studies in psoriasis have shown encour-
aging results and a Phase III study for
the same indication is in progress in
India. Biocon’s ability to develop this
molecule in-house differentiates it as
a world class manufacturer and the
foremost producer of immunosuppress-
ants in India.
Emerging Market FocusNeoBioconBiocon’s Abu-Dhabi-based JV,
NeoBiocon posted substantial growth
in revenues and profits. Post last year’s
launch and inclusion of Abraxane® in
leading hospital and health authority
formularies, numerous metastatic
breast cancer patients in the UAE and
GCC region are now beginning to
experience the benefits of this medi-
cine. Post Abraxane®‘s launch in the
UAE, the Company will advance
product registration in other GCC
countries.
NeoBiocon’s range of branded generic
products, now approved by the UAE
Ministry of Health, has successfully
been launched to address the thera-
peutic segments of cardiology, diabet-
ology and infection management. The
first UAE-based company to introduce a
branded generic of atorvastatin (one of
the largest selling molecules in the
country) and gabapentin, NeoBiocon
has several new products in the
pipeline slated to enter the market
very soon. To support its marketing
efforts, the Company is aggressively
expanding its team of professionals.
The GCC pharmaceutical market is
valued at USD 2.7 billion. To harness
its growth potential, NeoBiocon has
opened a second office in Dubai
Healthcare City to support the activities
of the corporate office in Abu Dhabi.
Both locations will cater to planned
expansion across the Gulf region.
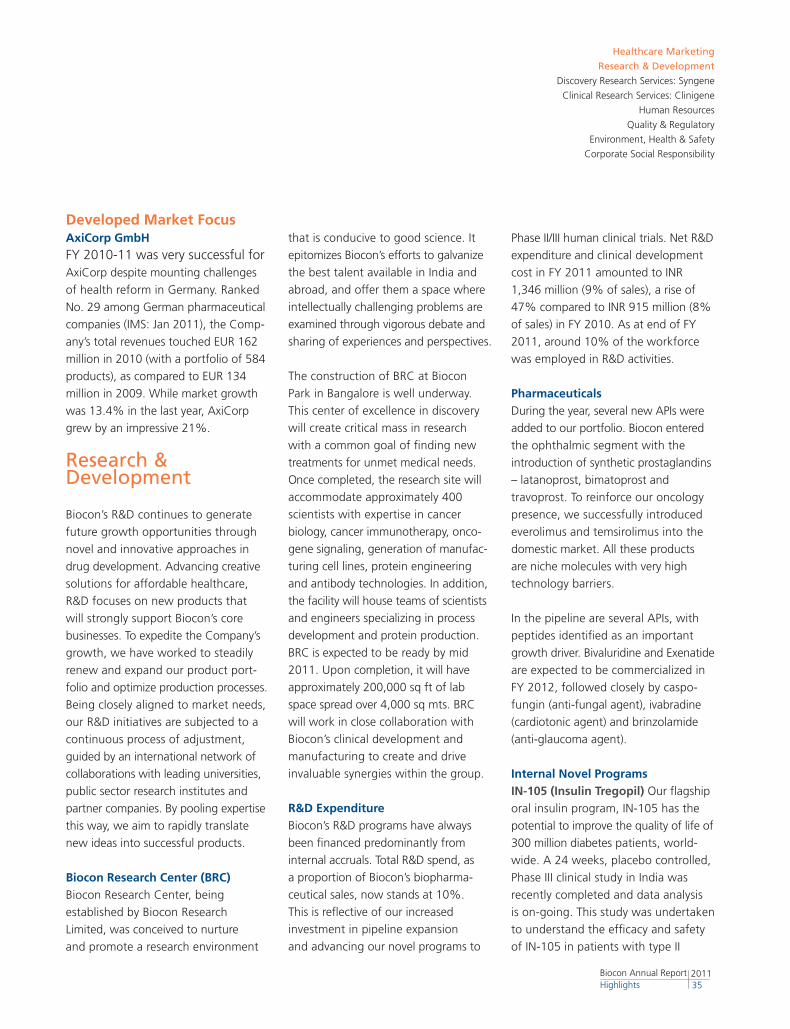
Developed Market FocusAxiCorp GmbHFY 2010-11 was very successful for AxiCorp despite mounting challenges
of health reform in Germany. Ranked
No. 29 among German pharmaceutical
companies (IMS: Jan 2011), the Comp-
any’s total revenues touched EUR 162
million in 2010 (with a portfolio of 584
products), as compared to EUR 134
million in 2009. While market growth
was 13.4% in the last year, AxiCorp
grew by an impressive 21%.
Research & Development
Biocon’s R&D continues to generate
future growth opportunities through
novel and innovative approaches in
drug development. Advancing creative
solutions for affordable healthcare,
R&D focuses on new products that
will strongly support Biocon’s core
businesses. To expedite the Company’s
growth, we have worked to steadily
renew and expand our product port-
folio and optimize production processes.
Being closely aligned to market needs,
our R&D initiatives are subjected to a
continuous process of adjustment,
guided by an international network of
collaborations with leading universities,
public sector research institutes and
partner companies. By pooling expertise
this way, we aim to rapidly translate
new ideas into successful products.
Biocon Research Center (BRC)Biocon Research Center, being
established by Biocon Research
Limited, was conceived to nurture
and promote a research environment
that is conducive to good science. It
epitomizes Biocon’s efforts to galvanize
the best talent available in India and
abroad, and offer them a space where
intellectually challenging problems are
examined through vigorous debate and
sharing of experiences and perspectives.
The construction of BRC at Biocon
Park in Bangalore is well underway.
This center of excellence in discovery
will create critical mass in research
with a common goal of finding new
treatments for unmet medical needs.
Once completed, the research site will
accommodate approximately 400
scientists with expertise in cancer
biology, cancer immunotherapy, onco-
gene signaling, generation of manufac-
turing cell lines, protein engineering
and antibody technologies. In addition,
the facility will house teams of scientists
and engineers specializing in process
development and protein production.
BRC is expected to be ready by mid
2011. Upon completion, it will have
approximately 200,000 sq ft of lab
space spread over 4,000 sq mts. BRC
will work in close collaboration with
Biocon’s clinical development and
manufacturing to create and drive
invaluable synergies within the group.
R&D ExpenditureBiocon’s R&D programs have always
been financed predominantly from
internal accruals. Total R&D spend, as
a proportion of Biocon’s biopharma-
ceutical sales, now stands at 10%.
This is reflective of our increased
investment in pipeline expansion
and advancing our novel programs to
Healthcare Marketing
Research & Development
Discovery Research Services: Syngene
Clinical Research Services: Clinigene
Human Resources
Quality & Regulatory
Environment, Health & Safety
Corporate Social Responsibility
Phase II/III human clinical trials. Net R&D
expenditure and clinical development
cost in FY 2011 amounted to INR
1,346 million (9% of sales), a rise of
47% compared to INR 915 million (8%
of sales) in FY 2010. As at end of FY
2011, around 10% of the workforce
was employed in R&D activities.
PharmaceuticalsDuring the year, several new APIs were
added to our portfolio. Biocon entered
the ophthalmic segment with the
introduction of synthetic prostaglandins
– latanoprost, bimatoprost and
travoprost. To reinforce our oncology
presence, we successfully introduced
everolimus and temsirolimus into the
domestic market. All these products
are niche molecules with very high
technology barriers.
In the pipeline are several APIs, with
peptides identified as an important
growth driver. Bivaluridine and Exenatide
are expected to be commercialized in
FY 2012, followed closely by caspo-
fungin (anti-fungal agent), ivabradine
(cardiotonic agent) and brinzolamide
(anti-glaucoma agent).
Internal Novel ProgramsIN-105 (Insulin Tregopil) Our flagship
oral insulin program, IN-105 has the
potential to improve the quality of life of
300 million diabetes patients, world-
wide. A 24 weeks, placebo controlled,
Phase III clinical study in India was
recently completed and data analysis
is on-going. This study was undertaken
to understand the efficacy and safety
of IN-105 in patients with type II
201135
Biocon Annual Report Highlights
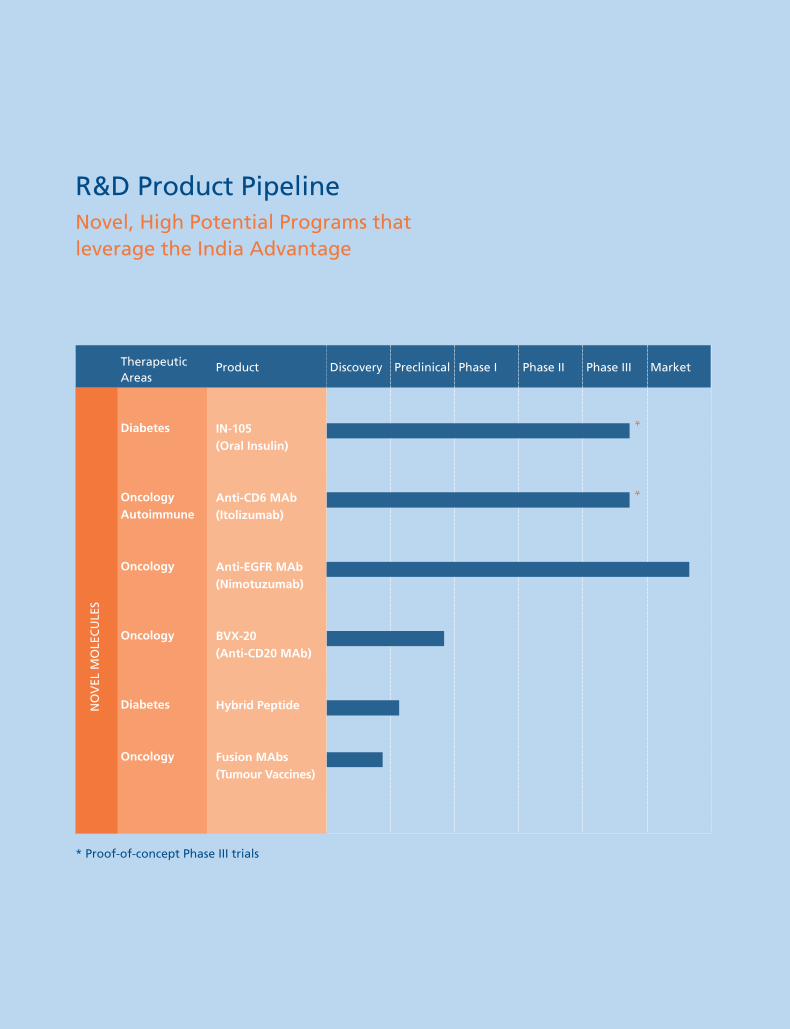
NO
VEL
MO
LEC
ULE
S
Diabetes
OncologyAutoimmune
Oncology
Oncology
Diabetes
Oncology
IN-105 (Oral Insulin)
Anti-CD6 MAb (Itolizumab)
Anti-EGFR MAb(Nimotuzumab)
BVX-20(Anti-CD20 MAb)
Hybrid Peptide
Fusion MAbs(Tumour Vaccines)
R&D Product PipelineNovel, High Potential Programs thatleverage the India Advantage
* Proof-of-concept Phase III trials
*
*
Therapeutic Areas
Product Discovery Preclinical Phase I Phase II Phase III Market
diabetes mellitus who have inadequate
glucose control with metformin. It
involved a titration phase to investigate
optimum dosage and a maintenance
phase to study the effect of oral insulin
on lowering of HbA1c. Doses tried out
were 10 mg, 15 mg, 20 mg and 30
mg, along with their matching placebo.
Preliminary data has shown encouraging
results. Although the drug did not meet
its primary end-point of showing
superiority over placebo in reducing
HbA1c, it was superior in effectively
reducing post-prandial glycemic
excursions in patients with type II
diabetes. Biocon is also conducting a
Phase I study in patients with type I
diabetes mellitus to test the pharmaco-
kinetics and pharmacodynamics of
IN-105 under US IND. In terms of
safety, no clinically relevant hypo-
glycemia was observed, there were
no serious adverse events, the drug
appears to be non-immunogenic and
weight neutral. We do plan to initiate
partnering discussions very soon and
propose to conduct further studies after
a partnership is established.
T1h (Itolizumab) T1h is our advanced
immune-modulating, anti-CD6 anti-
body that is moving through the pipe-
line successfully. Immune-modulating
antibodies are a promising, new
approach to autoimmune diseases
and we are presently evaluating this
particular drug for two indications:
psoriasis and rheumatoid arthritis.
Significantly, early pre-clinical studies
are increasingly revealing that anti-CD6
antibody has potential uses in several
other indications, including psoriatic
arthritis, multiple sclerosis, lupus and
type I diabetes. Given its growing
importance across key disease areas,
we consider T1h to be a pipeline within
a product. Initial investigations will
focus on rheumatoid arthritis and
psoriasis, followed closely by multiple
sclerosis. With these three indications
alone, we will be targeting a market
size of over USD 20 billion by 2015.
For psoriasis, we have seen some very
good responses to treatment as assessed
by a standardized measure known as
Psoriasis Area and Severity Index (PASI).
For patients treated with T1h, scores
with mean PASI improved by 50% in
four weeks and 75% by 12 weeks.
In addition, we have seen significant
changes in the quality of life parameters.
In the area of rheumatoid arthritis,
studies have revealed good ACR* 50
and ACR 70 scores, hitherto not seen in
the methotrexate control arm. T1h was
an add-on therapy to patients on
methotrexate and not doing too well.
Again, we have observed some very
important improvements in, both
quality of life and disability parameters,
as well as tender and swollen joint
counts which had substantially reduced
and sustained over a 24-week period.
A comparison of T1h with other
biologics targeting rheumatoid arthritis
highlighted two strong differentiators:
lower infection rates and reduced
dosage compared to other antibodies.
It is these differentiators that we will
focus on when we evaluate T1h in
future studies. The clinical plan, there-
fore, is to continue with psoriasis and
Healthcare Marketing
Research & Development
Discovery Research Services: Syngene
Clinical Research Services: Clinigene
Human Resources
Quality & Regulatory
Environment, Health & Safety
Corporate Social Responsibility
rheumatoid arthritis. Patient enrolment
in the psoriasis trial has been completed
and we plan to obtain primary end-
point data during the year. In the later
half of FY 2012, we hope to apply for
an Indian registration and have Pre-IND
advice from US FDA at the same time.
A longer term RA study using T1h is to
begin soon. We plan to complete it by
next year and apply for a US IND in FY
2013.
* The ACR score is a standardized measure of change in rheumatoid arthritis symptoms, typically used in a clinical study setting. It incorporates numerical values for various clinically relevant criteria such as the numbers of swollen and tender joints, pain, quality of life, physician and patient assessments. ACR 50 refers to a 50% improvement in the standardized measurement.
Global Alliances Biocon & Amylin This exclusive
agreement to jointly develop, manu-
facture and commercialize a novel
therapeutic agent for the treatment
of diabetes is well on track. This
compound has recently entered early
stage pre-clinical development to
support forthcoming Phase I studies.
We hope to complete Phase I
supporting pre-clinical toxicology
studies, being conducted in the US,
during the first half of this year.
During the later half of this fiscal,
Biocon and Amylin plan to jointly file
an IND application with the US FDA.
The IND will be necessary to start
testing of this molecule in humans
(Phase I) in order to primarily under-
stand the safety parameters of the
compound.
201137
Biocon Annual Report Highlights
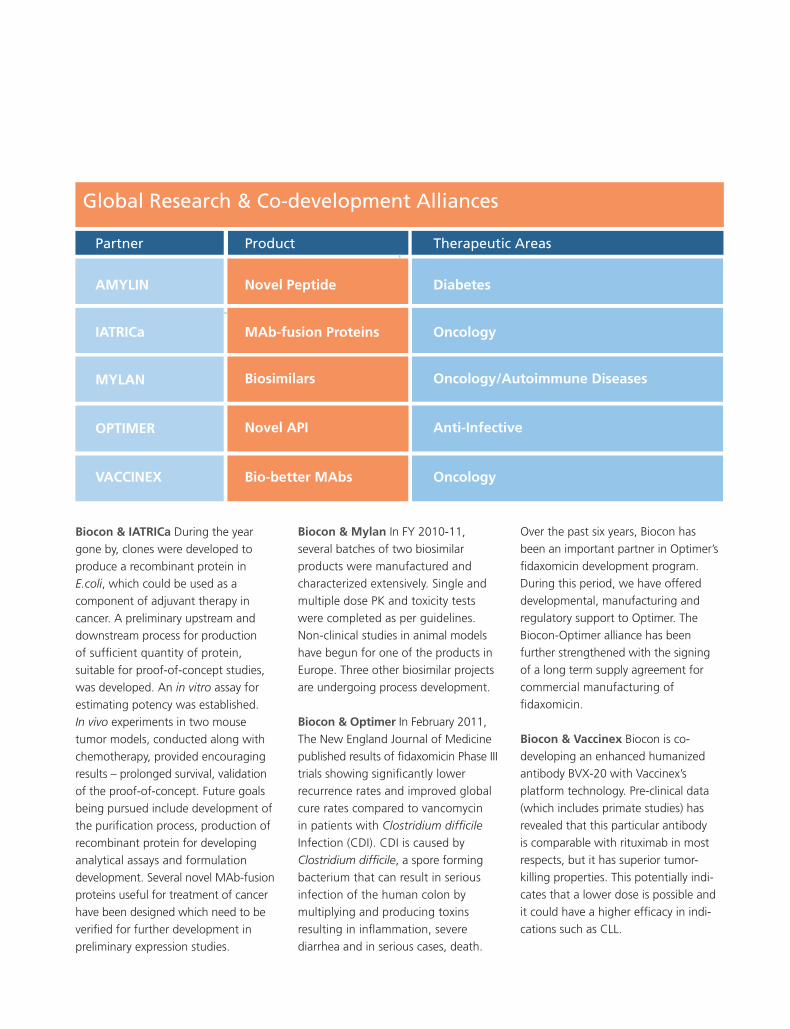
Biocon & IATRICa During the year
gone by, clones were developed to
produce a recombinant protein in
E.coli, which could be used as a
component of adjuvant therapy in
cancer. A preliminary upstream and
downstream process for production
of sufficient quantity of protein,
suitable for proof-of-concept studies,
was developed. An in vitro assay for
estimating potency was established.
In vivo experiments in two mouse
tumor models, conducted along with
chemotherapy, provided encouraging
results – prolonged survival, validation
of the proof-of-concept. Future goals
being pursued include development of
the purification process, production of
recombinant protein for developing
analytical assays and formulation
development. Several novel MAb-fusion
proteins useful for treatment of cancer
have been designed which need to be
verified for further development in
preliminary expression studies.
Biocon & Mylan In FY 2010-11,
several batches of two biosimilar
products were manufactured and
characterized extensively. Single and
multiple dose PK and toxicity tests
were completed as per guidelines.
Non-clinical studies in animal models
have begun for one of the products in
Europe. Three other biosimilar projects
are undergoing process development.
Biocon & Optimer In February 2011,
The New England Journal of Medicine
published results of fidaxomicin Phase III
trials showing significantly lower
recurrence rates and improved global
cure rates compared to vancomycin
in patients with Clostridium difficile
Infection (CDI). CDI is caused by
Clostridium difficile, a spore forming
bacterium that can result in serious
infection of the human colon by
multiplying and producing toxins
resulting in inflammation, severe
diarrhea and in serious cases, death.
Over the past six years, Biocon has
been an important partner in Optimer’s
fidaxomicin development program.
During this period, we have offered
developmental, manufacturing and
regulatory support to Optimer. The
Biocon-Optimer alliance has been
further strengthened with the signing
of a long term supply agreement for
commercial manufacturing of
fidaxomicin.
Biocon & Vaccinex Biocon is co-
developing an enhanced humanized
antibody BVX-20 with Vaccinex’s
platform technology. Pre-clinical data
(which includes primate studies) has
revealed that this particular antibody
is comparable with rituximab in most
respects, but it has superior tumor-
killing properties. This potentially indi-
cates that a lower dose is possible and
it could have a higher efficacy in indi-
cations such as CLL.
IATRICa
AMYLIN Diabetes
Oncology
MYLAN
OPTIMER
Oncology/Autoimmune Diseases
Anti-Infective
VACCINEX Bio-better MAbs Oncology
Novel Peptide
MAb-fusion Proteins
Biosimilars
Novel API
Partner Therapeutic AreasProduct
Global Research & Co-development Alliances
The current clinical plan is to conduct
a Phase I/II trial on refractory-NHL
patients or relapsed-NHL patients,
(approximately 50) with a primary end-
point being safety and a follow-up for
two years. We will evaluate PK on first
and last doses and we hope to file a
US IND in the later part of the ensuing
fiscal.
Biocon and Pfizer In October, 2010,
Biocon signed a definitive global
agreement with Pfizer Inc., the world’s
leading biopharmaceutical company,
for the worldwide commercialization
of Biocon’s biosimilar versions of insulin
and insulin analog products.
Pfizer will have exclusive rights to
commercialize these products globally,
with certain exceptions, including
co-exclusive rights for all of the pro-
ducts with Biocon in certain other
markets. Pfizer will also have co-
exclusive rights with existing Biocon
licensees, with respect to some of the
products, primarily in a number of
developing markets.
Biocon will remain responsible for the
clinical development, manufacture
and supply of these biosimilar insulin
products, as well as for regulatory
activities to secure their approval in
various geographies. Biocon’s recom-
binant human insulin formulations are
approved in 27 countries in developing
markets, and commercialized in 23,
while glargine has been launched in
its first market, India.
Under the terms of the agreement,
Pfizer will make upfront payments
totaling USD 200 million. Biocon is
also eligible to receive development
and regulatory milestone payments
of up to USD 150 million and will
receive additional payments linked to
Pfizer’s sales of its four insulin biosimilar
products across global markets.
The 2010 market for diabetes drugs
and devices is estimated at over USD
40 billion with insulins accounting for
35% of the diabetes segment. By
2015, a number of insulin analogs are
expected to lose patent protection,
resulting in a significant opportunity
for the biosimilars market. With this
alliance, Pfizer and Biocon expect to be
well positioned to be first movers in this
potentially large market opportunity.
Intellectual PropertyBiocon was granted 40 patents in FY
2010-11. Our total IP asset stands at
1,075 patent applications, of which
148 are PCT applications and 245 are
granted patents. Biocon’s BASALOG®
was registered in Russia, New Zealand
and Mexico, while Insugen® was
registered in Japan and New Zealand
during the last fiscal. A total of 32
trademarks from Biocon’s Healthcare
portfolio were registered in India during
last fiscal year. In recognition of our
impressive IP asset, Biocon received the
prestigious “Pharmexcil/Government
of India Patents Award 2009-10” in
September 2010.
Healthcare Marketing
Research & Development
Discovery Research Services: Syngene
Clinical Research Services: Clinigene
Human Resources
Quality & Regulatory
Environment, Health & Safety
Corporate Social Responsibility
Discovery Research Services: Syngene
Syngene remains amongst India’s
largest contract research organizations
with a portfolio that spans the entire
drug discovery and development
continuum. Discovery services offered
include scaffold and library synthesis,
medicinal chemistry, computer-aided
drug design (CADD), DMPK profiling,
crystallography, in vivo pharmacology
and toxicology. Syngene also provides
development services from API process
development, polymer chemistry, cGMP
manufacturing of APIs and advanced
intermediates, oral and injectable
formulation development to cGMP
manufacture of drug product for
first-in-human and Phase II clinical
studies.
Paradigm Shift in Discovery & Development ServicesOver the past few years, pharma-
ceutical companies have undergone
a paradigm shift not only in the way
research is conducted in-house, but
also in the way it is outsourced to
contract research organizations. Ever
since innovator companies have shifted
from the traditional approach of
conducting research in silos to a more
integrated, multidisciplinary approach,
the same is expected from contract
research companies. Keeping pace
with this development, Syngene has
developed internal expertise and
practices to offer integrated services,
in both discovery and development.
Together with the clinical development
partnership of Clinigene, Syngene is in
201139
Biocon Annual Report Highlights
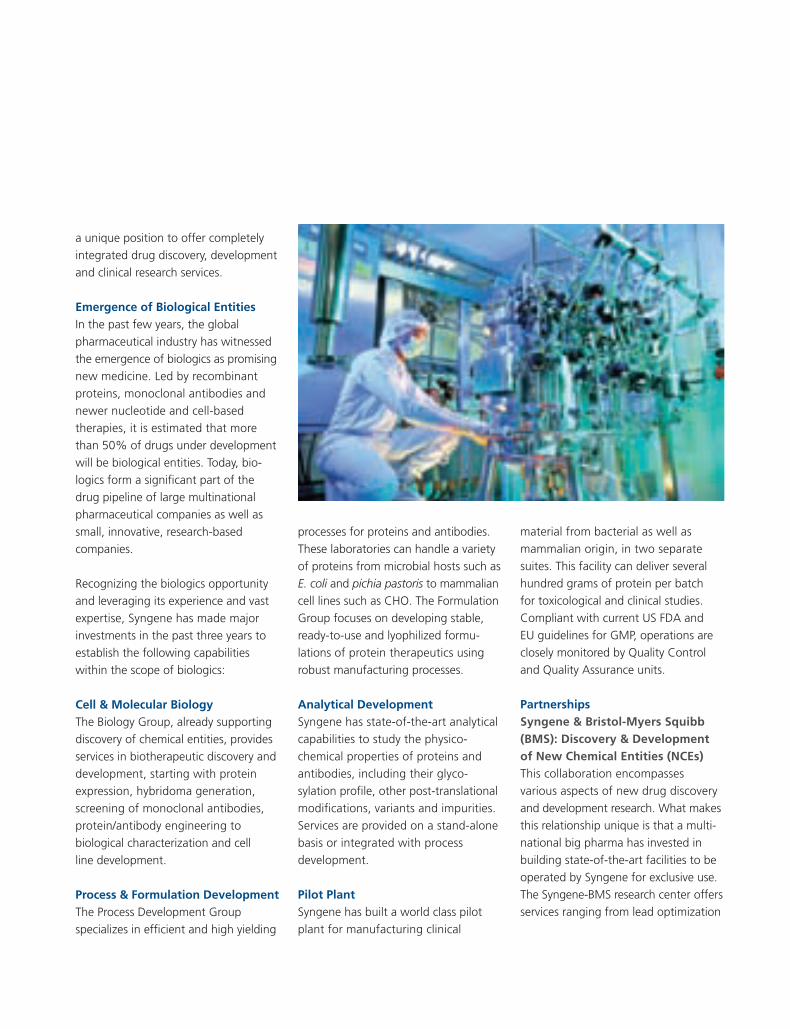
a unique position to offer completely
integrated drug discovery, development
and clinical research services.
Emergence of Biological EntitiesIn the past few years, the global
pharmaceutical industry has witnessed
the emergence of biologics as promising
new medicine. Led by recombinant
proteins, monoclonal antibodies and
newer nucleotide and cell-based
therapies, it is estimated that more
than 50% of drugs under development
will be biological entities. Today, bio-
logics form a significant part of the
drug pipeline of large multinational
pharmaceutical companies as well as
small, innovative, research-based
companies.
Recognizing the biologics opportunity
and leveraging its experience and vast
expertise, Syngene has made major
investments in the past three years to
establish the following capabilities
within the scope of biologics:
Cell & Molecular BiologyThe Biology Group, already supporting
discovery of chemical entities, provides
services in biotherapeutic discovery and
development, starting with protein
expression, hybridoma generation,
screening of monoclonal antibodies,
protein/antibody engineering to
biological characterization and cell
line development.
Process & Formulation DevelopmentThe Process Development Group
specializes in efficient and high yielding
processes for proteins and antibodies.
These laboratories can handle a variety
of proteins from microbial hosts such as
E. coli and pichia pastoris to mammalian
cell lines such as CHO. The Formulation
Group focuses on developing stable,
ready-to-use and lyophilized formu-
lations of protein therapeutics using
robust manufacturing processes.
Analytical DevelopmentSyngene has state-of-the-art analytical
capabilities to study the physico-
chemical properties of proteins and
antibodies, including their glyco-
sylation profile, other post-translational
modifications, variants and impurities.
Services are provided on a stand-alone
basis or integrated with process
development.
Pilot PlantSyngene has built a world class pilot
plant for manufacturing clinical
material from bacterial as well as
mammalian origin, in two separate
suites. This facility can deliver several
hundred grams of protein per batch
for toxicological and clinical studies.
Compliant with current US FDA and
EU guidelines for GMP, operations are
closely monitored by Quality Control
and Quality Assurance units.
PartnershipsSyngene & Bristol-Myers Squibb (BMS): Discovery & Development of New Chemical Entities (NCEs) This collaboration encompasses
various aspects of new drug discovery
and development research. What makes
this relationship unique is that a multi-
national big pharma has invested in
building state-of-the-art facilities to be
operated by Syngene for exclusive use.
The Syngene-BMS research center offers
services ranging from lead optimization
and toxicology services to API scale-up
and early clinical formulations.
Syngene & Endo Pharmaceuticals:Development of Novel Therapeutic Molecules against Cancer In early
2010, Syngene initiated a collaborative
research program with Endo Pharma-
ceuticals, USA to develop novel biologic
molecules for targeted cancer therapy.
This unique association, now entering
its second year, has successfully deli-
vered on several crucial milestones. The
innovation and challenges involved
have provided Syngene invaluable
experience and expertise in integrated
biotherapeutic discovery and develop-
ment for pharma companies. This
learning will now be leveraged to
secure further collaborations of a
similar nature.
Syngene & DuPont Crop Protection: Discovery & Development Services for Agrochemical Companies Building
on its long term relationship as a pre-
ferred service provider, Syngene’s
alliance with DuPont’s Crop Protection
supports the company’s discovery
pipeline through integrated R&D
services. The Syngene-DuPont
collaboration, which has reached its
10th year milestone, includes
discovery and development services
in the area of crop protection, such as
design of novel molecules, custom
synthesis of promising candidates and
advance intermediates, and synthesis
and characterization of reference and
impurity standards.
Healthcare Marketing
Research & Development
Discovery Research Services: Syngene
Clinical Research Services: Clinigene
Human Resources
Quality & Regulatory
Environment, Health & Safety
Corporate Social Responsibility
Clinical Research Services: Clinigene
Clinigene has successfully completed a
decade of excellence in offering quality
clinical research solutions to pharma-
ceutical and biotechnology companies
in India and several regulated markets,
including EU, US and UK. Till date,
Clinigene has conducted more than
80 BA/BE and early phase studies
and over 60 Phase I-IV clinical trials
involving more than 5,500 patients.
Clinigene’s ability to offer innovative
services was further augmented in
2010, when it acquired the well
established, experience-rich bioanaly-
tical research facility for large molecules
(previously part of Biocon R&D). Built
to meet international standards and
specifications, this GLP-compliant
laboratory has state-of-the-art infra-
structure and specializes in method
development and testing services (for
pharmacokinetic, toxicokinetic and
immunogenicity analysis of new
biologics, biosimilars, some small
molecules, antibodies, recombinant
proteins, cytokines and growth
hormones), to support early and late
phase trials for global registrations.
Possibly the first-of-its-kind available
with an Indian CRO, this facility will
greatly enhance Clinigene’s capabilities
and reaffirm its leadership position in
the clinical evaluation of biologics.
Regulatory Approvals• A major achievement for Clinigene
this year has been the successful
completion of US FDA inspection of
the Human Pharmacology Unit (HPU)
and Bioanalytical Research Laboratory.
This was the first time Clinigene was
being audited by US FDA. No critical
observations were identified. This is an
authentication of quality deliverables
offered to clients in support of their
clinical development programs.
• A Clinigene managed study site
located in India and participating in
a global, Phase III diabetes trial was
successfully audited by US FDA with
no critical findings.
• HPU and Bioanalytical Research
Laboratory for small molecules also
underwent an audit by an EMA
regulatory body.
• HPU and Bioanalytical Research
Laboratory were inspected and
approved by UAE Ministry of Health.
• Clinigene’s Central Laboratory
successfully completed the NABL ISO
15189 accreditation audit. The Lab
recently procured an IVD certified Flow
Cytometer, enabling Clinigene to extend
its services in the area of biomarker
analysis for new biologics and
biosimilars.
Clinical Development Oral Insulin Program (IN-105)
Clinigene completed Phase III clinical
trials in 264 type II diabetes patients,
across 15 sites. A clinical development
program for IN-105 in type I diabetes
patients was also initiated.
Anti-CD6 MAb Program (T1h) A
Phase III clinical trial to evaluate safety
and efficacy of Biocon’s anti-CD6
201141
Biocon Annual Report Highlights
monoclonal antibody T1h, in 250
patients with active psoriasis, is
ongoing. Clinigene completed patient
recruitment well within the scheduled
timeline, across 20 study sites.
Biocon, Mylan & Vaccinex Programs Clinigene has initiated pre-study
activities for early phase studies in
various indications.
Erythropoietin Program Clinigene
recently completed a Phase II clinical
trial with long-acting erythropoietin in
30 CKD patients. The results obtained
were positive for both efficacy and
safety. While other CROs were unable
to recruit patients for this difficult
protocol, Clinigene successfully
implemented it.
Looking to the Future • Clinigene is focusing on conducting
intense Phase I patient PK/PD studies in
oncology, cardiology, immunology and
respiratory diseases and is currently
facilitating setting up of a state-of-
the-art Phase I unit at the Mazumdar-
Shaw Cancer Center, Bangalore.
• Clinigene and Syngene will together
offer integrated drug development
solutions to small and large pharma and
biotech companies based on an efficient
“discovery to decision” paradigm.
• The newly acquired Bioanalytical
Laboratory for large molecules aims
at obtaining Indian Good Laboratory
Practice (GLP) certification shortly. The
lab also plans on investing in a state-of-
the-art Laboratory Information
Management System (LIMS) and
advanced multiplexing instrumentation.
• With the implementation of key IT
and web-enabled solutions, Clinigene
will enhance its ability to provide
sponsors and project teams real-time
access to study specific documents.
In this regard, Clinigene also offers
a unified IWRS and EDC solution.
Human Resources
Biocon and its subsidiary companies
are today a dynamic force of 5,500+
coworkers, making the HR function
more critical, challenging and rewarding.
Whether through recruiting, upgrading
performance management or designing
and implementing leadership develop-
ment programs, Biocon HR continues
to shape the Company’s high perfor-
ming teams and culture. In 2010-11,
a number of employee centric inter-
ventions were implemented across
Biocon to motivate a more engaged
and competitive talent pool.
Key Initiatives for 2010-11Launching a Leadership Development Initiative for Biocon’s
top 150 leaders to arrive at a common
leadership language across the org-
anization. In the first phase, an
organizational diagnostic study was
carried out to examine the current
leadership framework, Biocon imper-
atives, changing organizational
requirements, developmental gaps
and the overall program content.
Establishing Recruitment Alliances with tier-1 business schools (ISB, IIMs,
XLRI, NMIMS, NITIE, MDI) and well
reputed engineering/pharmacy
colleges (IITs, BITS-Pilani & Goa, NIPER
and UICT) to ensure a steady stream of
high quality talent. We have also
utilized customized technology
solutions to manage the employee
hiring lifecycle more efficiently. In the
year gone by, we enlarged our pool of
consultants and executive search firms
to hire for leadership positions, while
optimally leveraging social media for
niche positions.
Strengthening the Goal-Setting Process for the organization by dove-
tailing vertical goals with individual
objectives. Based on focus-group
discussions centered around the results
of Expressions-2010 (engagement
survey conducted in-house), relevant
process improvement changes were
made to the online Performance
Management System fulfilling
department-specific requirements.
Stabilizing our Online Training Tool, iLearn during the year to better
facilitate management of technical
as well as behavioral training programs.
Technical training programs were
conducted by reputed international
trainers on subjects like OOS & CAPA,
CTD dossier requirements, etc. as well
as on operational excellence through
programs such as Kaizen and TPM.
Focus areas in behavioral training were
personal effectiveness, effective com-
munication, teamwork, decision
making, conflict management and
creative problem solving.
Developing Industry-ready Talent, through an MOU signed with
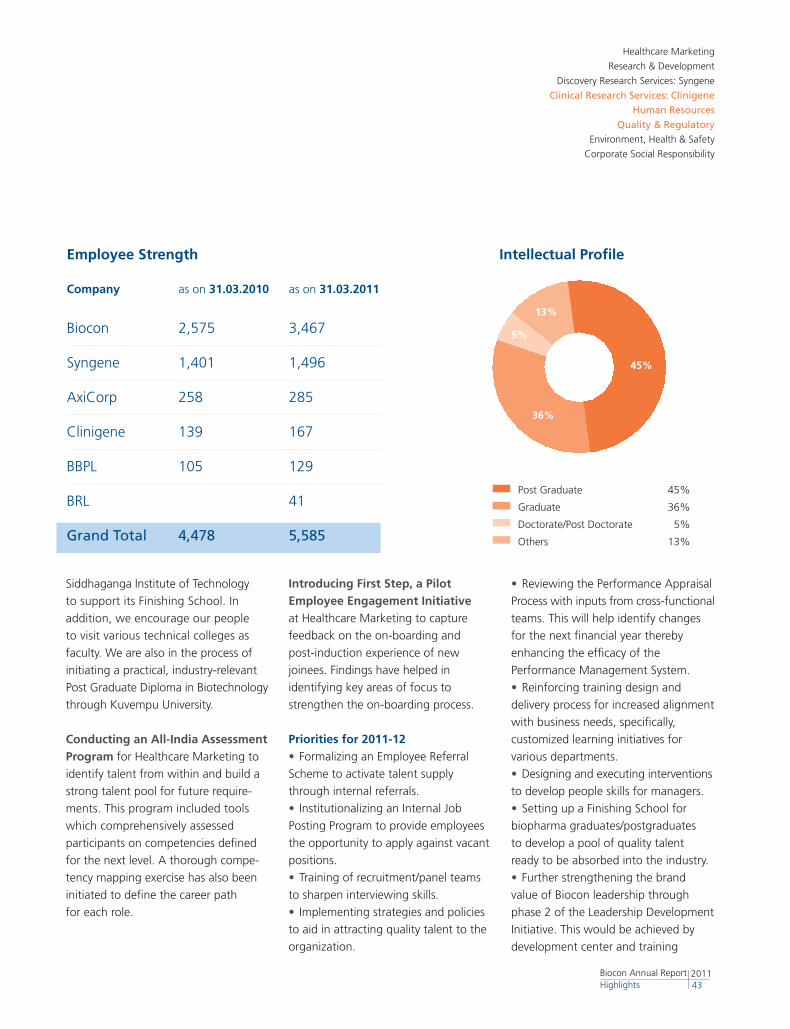
Siddhaganga Institute of Technology
to support its Finishing School. In
addition, we encourage our people
to visit various technical colleges as
faculty. We are also in the process of
initiating a practical, industry-relevant
Post Graduate Diploma in Biotechnology
through Kuvempu University.
Conducting an All-India Assessment Program for Healthcare Marketing to
identify talent from within and build a
strong talent pool for future require-
ments. This program included tools
which comprehensively assessed
participants on competencies defined
for the next level. A thorough compe-
tency mapping exercise has also been
initiated to define the career path
for each role.
Introducing First Step, a Pilot Employee Engagement Initiative
at Healthcare Marketing to capture
feedback on the on-boarding and
post-induction experience of new
joinees. Findings have helped in
identifying key areas of focus to
strengthen the on-boarding process.
Priorities for 2011-12• Formalizing an Employee Referral
Scheme to activate talent supply
through internal referrals.
• Institutionalizing an Internal Job
Posting Program to provide employees
the opportunity to apply against vacant
positions.
• Training of recruitment/panel teams
to sharpen interviewing skills.
• Implementing strategies and policies
to aid in attracting quality talent to the
organization.
Healthcare Marketing
Research & Development
Discovery Research Services: Syngene
Clinical Research Services: Clinigene
Human Resources
Quality & Regulatory
Environment, Health & Safety
Corporate Social Responsibility
• Reviewing the Performance Appraisal
Process with inputs from cross-functional
teams. This will help identify changes
for the next financial year thereby
enhancing the efficacy of the
Performance Management System.
• Reinforcing training design and
delivery process for increased alignment
with business needs, specifically,
customized learning initiatives for
various departments.
• Designing and executing interventions
to develop people skills for managers.
• Setting up a Finishing School for
biopharma graduates/postgraduates
to develop a pool of quality talent
ready to be absorbed into the industry.
• Further strengthening the brand
value of Biocon leadership through
phase 2 of the Leadership Development
Initiative. This would be achieved by
development center and training
201143
Biocon Annual Report Highlights
Biocon 2,575 3,467
Syngene 1,401 1,496
AxiCorp 258 285
Clinigene 139 167
BBPL 105 129
BRL 41
Grand Total 4,478 5,585
Employee Strength Intellectual Profile
Post Graduate 45%
Graduate 36%
Doctorate/Post Doctorate 5%
Others 13%
13%
45%
36%
5%
Company as on 31.03.2010 as on 31.03.2011
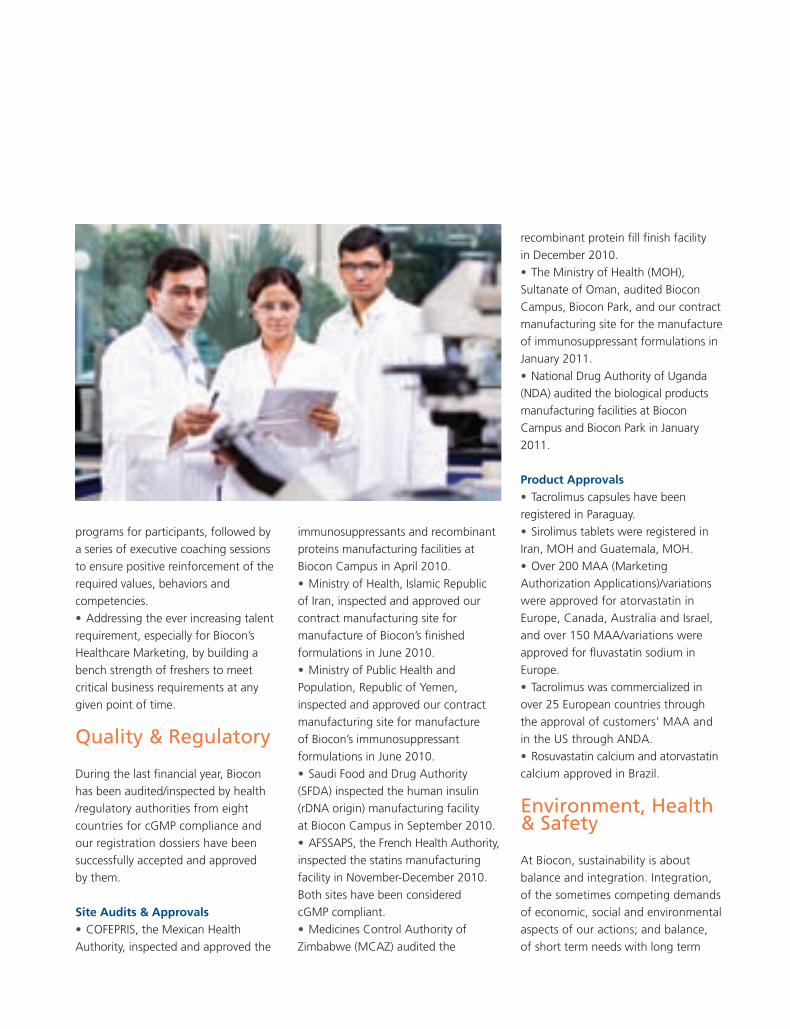
programs for participants, followed by
a series of executive coaching sessions
to ensure positive reinforcement of the
required values, behaviors and
competencies.
• Addressing the ever increasing talent
requirement, especially for Biocon’s
Healthcare Marketing, by building a
bench strength of freshers to meet
critical business requirements at any
given point of time.
Quality & Regulatory
During the last financial year, Biocon
has been audited/inspected by health
/regulatory authorities from eight
countries for cGMP compliance and
our registration dossiers have been
successfully accepted and approved
by them.
Site Audits & Approvals• COFEPRIS, the Mexican Health
Authority, inspected and approved the
immunosuppressants and recombinant
proteins manufacturing facilities at
Biocon Campus in April 2010.
• Ministry of Health, Islamic Republic
of Iran, inspected and approved our
contract manufacturing site for
manufacture of Biocon’s finished
formulations in June 2010.
• Ministry of Public Health and
Population, Republic of Yemen,
inspected and approved our contract
manufacturing site for manufacture
of Biocon’s immunosuppressant
formulations in June 2010.
• Saudi Food and Drug Authority
(SFDA) inspected the human insulin
(rDNA origin) manufacturing facility
at Biocon Campus in September 2010.
• AFSSAPS, the French Health Authority,
inspected the statins manufacturing
facility in November-December 2010.
Both sites have been considered
cGMP compliant.
• Medicines Control Authority of
Zimbabwe (MCAZ) audited the
recombinant protein fill finish facility
in December 2010.
• The Ministry of Health (MOH),
Sultanate of Oman, audited Biocon
Campus, Biocon Park, and our contract
manufacturing site for the manufacture
of immunosuppressant formulations in
January 2011.
• National Drug Authority of Uganda
(NDA) audited the biological products
manufacturing facilities at Biocon
Campus and Biocon Park in January
2011.
Product Approvals• Tacrolimus capsules have been
registered in Paraguay.
• Sirolimus tablets were registered in
Iran, MOH and Guatemala, MOH.
• Over 200 MAA (Marketing
Authorization Applications)/variations
were approved for atorvastatin in
Europe, Canada, Australia and Israel,
and over 150 MAA/variations were
approved for fluvastatin sodium in
Europe.
• Tacrolimus was commercialized in
over 25 European countries through
the approval of customers’ MAA and
in the US through ANDA.
• Rosuvastatin calcium and atorvastatin
calcium approved in Brazil.
Environment, Health & Safety
At Biocon, sustainability is about
balance and integration. Integration,
of the sometimes competing demands
of economic, social and environmental
aspects of our actions; and balance,
of short term needs with long term
development. Sustainable develop-
ment at Biocon is manifested through
applying ‘sustainable thinking’ to the
everyday choices we make, ensuring
that they are integral to our strategic
vision and its implementation.
Biocon is committed to maintaining the
highest standards of EHS by complying
with applicable laws and regulations. To
minimize the environmental impact of
our operations, we have a compre-
hensive EHS Policy and are continually
implementing EHS measures through
specialized EHS teams, systems and
programs.
EHS Management SystemsBiocon has been certified ISO 14001:
2004 and OHSAS 18001: 2007 by TÜV
Nord. We are formalizing continual
improvement processes through
adoption of an EHS risk management
framework within our product manu-
facturing and quality organizational
units, consistent with best practices.
These units have the responsibility to
manage a substantial portion of the
EHS risks of the Company and commit
to safe work environment practices.
This initiative will involve regular audits,
eventually resulting in a score that rates
the effectiveness of the Company’s
environmental and safety protection
management system processes. We
have 10 lead auditors on our team.
Environment ManagementAs a new initiative, in this year we
have organized cross-functional teams
to reduce water consumption across
all manufacturing units. The outcome
of this effort has been reduction of
water consumption by 10%.
• All available recycled water is being
used for utilities.
• Waste minimization teams were
formed at all manufacturing units to
achieve significant effluent load
reduction
• Rooftop rain harvesting system was
adopted and collected rainwater is
being used for gardening.
Safety Update : Training Biocon is committed to high quality
training for all personnel. In this year,
we have implemented an integrated,
modular-based, training program for
our workmen. This system consists of
12 modules which include chemical
safety, laboratory safety, safety in
process operations, operation of
emergency safety equipment, EHS
systems, EHS legislations, emergency
response procedure, and safety in
maintenance activities, contractor
safety, and specialized trainings.
In the last year, 11 safety related
incidents were reported across all
locations, all of which were minor,
first aid incidents. We have also
initiated a system of cross-unit audits
of all manufacturing units and a total
of 37 safety audits were conducted and
240 observations were noted. For 90%
of audit observations, corrective actions
were implemented and closed as in
February, 2011. Five new safety
guidelines and six audit protocols
were released during the year.
Healthcare Marketing
Research & Development
Discovery Research Services: Syngene
Clinical Research Services: Clinigene
Human Resources
Quality & Regulatory
Environment, Health & Safety
Corporate Social Responsibility
Safety Awareness & Emergency Preparedness94 safety campaigns were carried out
on themes like emergency manage-
ment, work permit system, etc. across
our manufacturing sites. Safety month
was observed in facilities to promote a
culture of safety at the work place. 577
internal training programs (equivalent
to 20,479 man hours of training) on
safety were conducted by internal
faculty. Some specialized external
training programs like dust explosion
hazard, tank farm and warehouse
management, safe handling of
chemicals, were also organized. During
the year, 24 mock drills, 45 fire drills
and 8 first aid training programs were
conducted. As on date, 369 trained
first aiders, 794 trained fire fighters are
available at various locations.
Process Safety ManagementOur focus during the year was on
embedding EHS aspects into our
existing and new product development
processes. The objective was to make
our manufacturing processes safer,
through a comprehensive method for
analyzing process hazards.
We have implemented an integrated
process safety management system
for all existing processes and for new
developments with integration of all
14 elements of process safety
management.
An EHS guideline for conducting risk
analysis of API manufacturing processes
was put in place. Aspects of process
hazard identification, risk analysis and
201145
Biocon Annual Report Highlights
measures towards risk reduction were
considered in the guideline.
Industrial Hygiene Management SystemSpecial focus on industrial hygiene has
been embedded into our existing and
new product development process.
Objective of the initiative is to make
our manufacturing processes safer,
specially pertaining to health of work-
men, Industrial hygiene qualitative risk
assessment was carried out at all
manufacturing facilities using in-house
tools, based on the hazard and control
banding concept.
An EHS guideline for conducting
occupational health risk analysis of
API manufacturing processes was put
in place. Aspects of health hazard
identification, health risk analysis and
measures towards risk reduction were
considered in the guideline. Three
training programs, including sessions by
globally recognized certified industrial
hygienists, ABIH were organized.
Annual medical examinations were
conducted for all employees and
contract workmen across Biocon.
Regulatory OverviewAll governmental agencies oversee the
safety and environmental performance
of Biocon’s facilities. These agencies
range from the local factories depart-
ment, fire departments to local,
regional and national environmental
agencies. Biocon Group complies with
all applicable local, national and
international legislations.
Commitment To GreeneryAs part of our corporate responsibility,
we have planted 2,500 tree saplings
in and around Biocon on June 5, 2010
commemorating World Environment
Day.
Achievements• Award from CII for meritorious
achievements in EHS
• First Prize in State Level Competition
for First Aid conducted by St. Johns
Ambulance, Bangalore
Corporate Social Responsibility
Biocon Foundation: Integrated Healthcare Delivery ProgramThis year, the team at Biocon Found-
ation has focussed on integrating
its health programs to increase their
effectiveness. With ARY clinics as nodal
points in their respective districts, we
have structured and broadened the
scope of our preventive health program,
both in terms of educating communities
about best practices in health/hygiene
and assisting/encouraging them to
implement what they learn.
The healthcare delivery program works
on three interdependent levels.
Level 1: Preventive HealthThe importance of preventive health
cannot be overstated or emphasized
enough. Our program focuses on:
• Water borne and hygiene related
illnesses, including typhoid, malaria,
dysentery, dehydration and dengue.
• Early detection, prevention and
management of chronic illnesses like
cardiovascular diseases, diabetes,
cancer and tuberculosis.
• Maternal and Childcare related
health issues including immunization,
antenatal, anemia and nutrition.
Methods for dissemination and
assistance include:
• Preventive Health Education through
workshops and door-to-door inter-
actions carried out by our community
health workers. They discuss best
practices in personal and environmental
hygiene, including good sanitation and
hand washing habits.
• Building or assisting with construction
of better sanitation facilities. We have
built 800 toilets in Huskur, Anekal
Taluk. We are now trying to find ways
to optimize this program by helping
people use government resources that
are available to them.
• Developing a mobile phone-based
diagnostic tool that community health
workers can use to get provisional
diagnoses that can be sent to the
doctor at the ARY clinic hub. This will
help the doctor decide if the patient
can be treated on the spot or needs
to be brought into the clinic.
• Screening and counseling for people
with chronic illnesses like CVD/diabetes/
cancer/TB through health screening
camps and mobile phone-based
screening tools.
• An oral cancer screening program
established in collaboration with the
Mazumdar-Shaw Cancer Centre (MSCC)
in Bangalore, India.
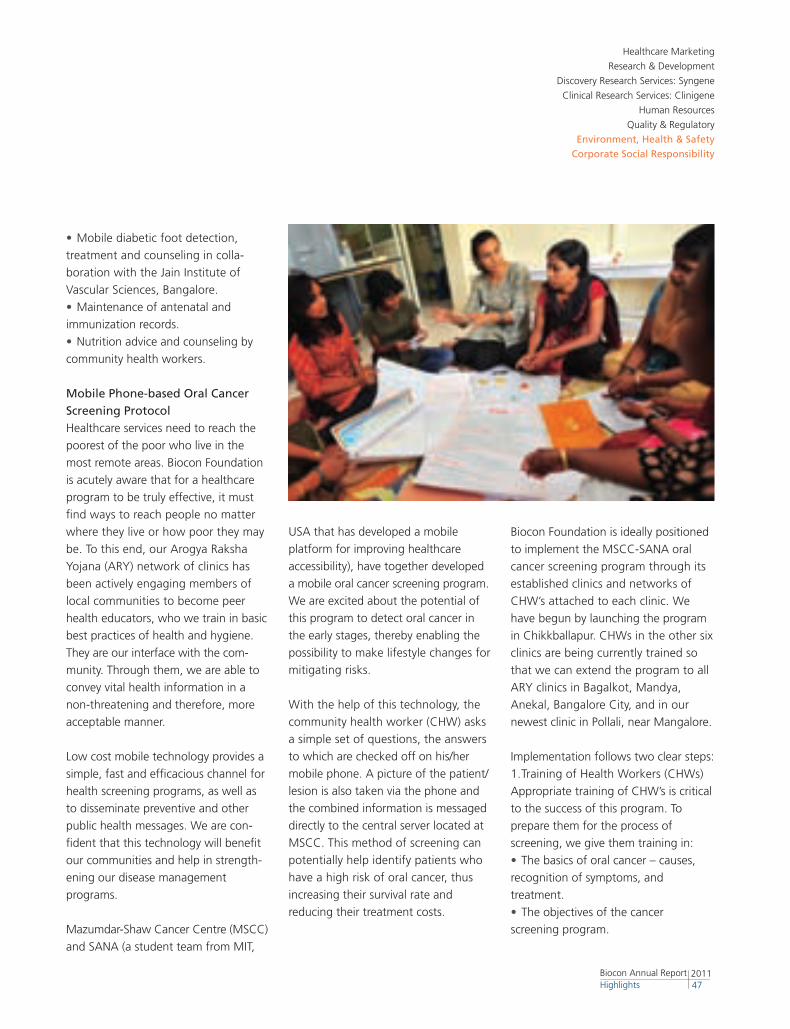
• Mobile diabetic foot detection,
treatment and counseling in colla-
boration with the Jain Institute of
Vascular Sciences, Bangalore.
• Maintenance of antenatal and
immunization records.
• Nutrition advice and counseling by
community health workers.
Mobile Phone-based Oral Cancer Screening Protocol Healthcare services need to reach the
poorest of the poor who live in the
most remote areas. Biocon Foundation
is acutely aware that for a healthcare
program to be truly effective, it must
find ways to reach people no matter
where they live or how poor they may
be. To this end, our Arogya Raksha
Yojana (ARY) network of clinics has
been actively engaging members of
local communities to become peer
health educators, who we train in basic
best practices of health and hygiene.
They are our interface with the com-
munity. Through them, we are able to
convey vital health information in a
non-threatening and therefore, more
acceptable manner.
Low cost mobile technology provides a
simple, fast and efficacious channel for
health screening programs, as well as
to disseminate preventive and other
public health messages. We are con-
fident that this technology will benefit
our communities and help in strength-
ening our disease management
programs.
Mazumdar-Shaw Cancer Centre (MSCC)
and SANA (a student team from MIT,
USA that has developed a mobile
platform for improving healthcare
accessibility), have together developed
a mobile oral cancer screening program.
We are excited about the potential of
this program to detect oral cancer in
the early stages, thereby enabling the
possibility to make lifestyle changes for
mitigating risks.
With the help of this technology, the
community health worker (CHW) asks
a simple set of questions, the answers
to which are checked off on his/her
mobile phone. A picture of the patient/
lesion is also taken via the phone and
the combined information is messaged
directly to the central server located at
MSCC. This method of screening can
potentially help identify patients who
have a high risk of oral cancer, thus
increasing their survival rate and
reducing their treatment costs.
Healthcare Marketing
Research & Development
Discovery Research Services: Syngene
Clinical Research Services: Clinigene
Human Resources
Quality & Regulatory
Environment, Health & Safety
Corporate Social Responsibility
Biocon Foundation is ideally positioned
to implement the MSCC-SANA oral
cancer screening program through its
established clinics and networks of
CHW’s attached to each clinic. We
have begun by launching the program
in Chikkballapur. CHWs in the other six
clinics are being currently trained so
that we can extend the program to all
ARY clinics in Bagalkot, Mandya,
Anekal, Bangalore City, and in our
newest clinic in Pollali, near Mangalore.
Implementation follows two clear steps:
1. Training of Health Workers (CHWs)
Appropriate training of CHW’s is critical
to the success of this program. To
prepare them for the process of
screening, we give them training in:
• The basics of oral cancer – causes,
recognition of symptoms, and
treatment.
• The objectives of the cancer
screening program.
201147
Biocon Annual Report Highlights
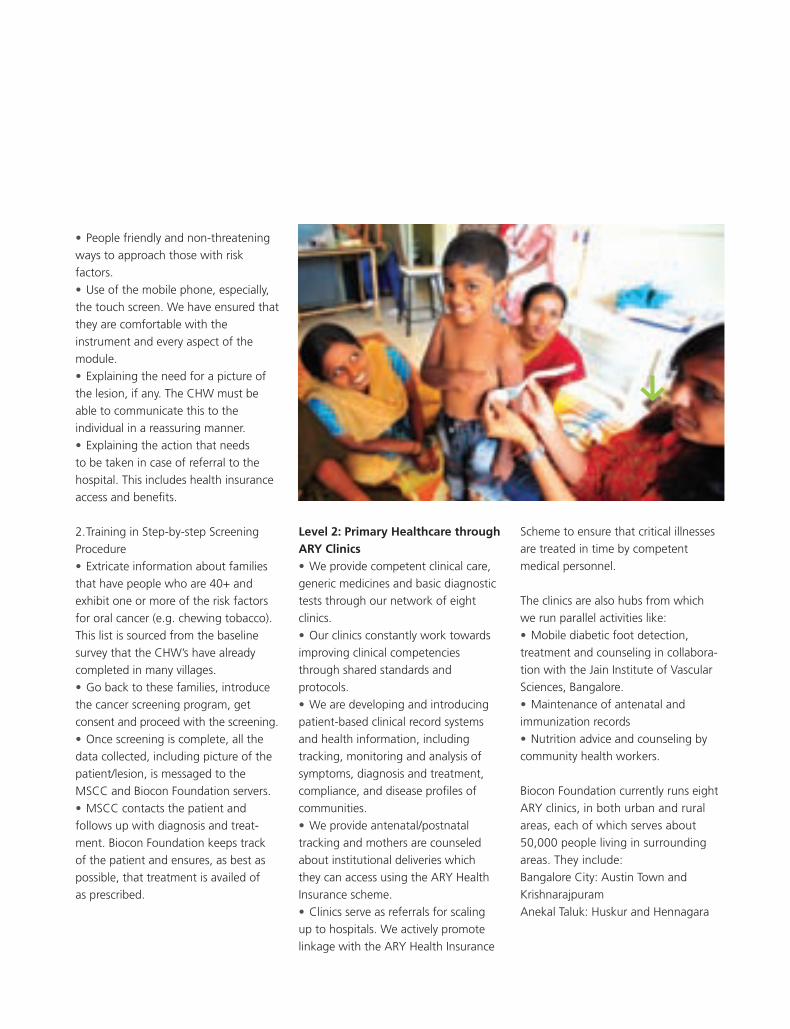
• People friendly and non-threatening
ways to approach those with risk
factors.
• Use of the mobile phone, especially,
the touch screen. We have ensured that
they are comfortable with the
instrument and every aspect of the
module.
• Explaining the need for a picture of
the lesion, if any. The CHW must be
able to communicate this to the
individual in a reassuring manner.
• Explaining the action that needs
to be taken in case of referral to the
hospital. This includes health insurance
access and benefits.
2. Training in Step-by-step Screening
Procedure
• Extricate information about families
that have people who are 40+ and
exhibit one or more of the risk factors
for oral cancer (e.g. chewing tobacco).
This list is sourced from the baseline
survey that the CHW’s have already
completed in many villages.
• Go back to these families, introduce
the cancer screening program, get
consent and proceed with the screening.
• Once screening is complete, all the
data collected, including picture of the
patient/lesion, is messaged to the
MSCC and Biocon Foundation servers.
• MSCC contacts the patient and
follows up with diagnosis and treat-
ment. Biocon Foundation keeps track
of the patient and ensures, as best as
possible, that treatment is availed of
as prescribed.
Level 2: Primary Healthcare through ARY Clinics• We provide competent clinical care,
generic medicines and basic diagnostic
tests through our network of eight
clinics.
• Our clinics constantly work towards
improving clinical competencies
through shared standards and
protocols.
• We are developing and introducing
patient-based clinical record systems
and health information, including
tracking, monitoring and analysis of
symptoms, diagnosis and treatment,
compliance, and disease profiles of
communities.
• We provide antenatal/postnatal
tracking and mothers are counseled
about institutional deliveries which
they can access using the ARY Health
Insurance scheme.
• Clinics serve as referrals for scaling
up to hospitals. We actively promote
linkage with the ARY Health Insurance
Scheme to ensure that critical illnesses
are treated in time by competent
medical personnel.
The clinics are also hubs from which
we run parallel activities like:
• Mobile diabetic foot detection,
treatment and counseling in collabora-
tion with the Jain Institute of Vascular
Sciences, Bangalore.
• Maintenance of antenatal and
immunization records
• Nutrition advice and counseling by
community health workers.
Biocon Foundation currently runs eight
ARY clinics, in both urban and rural
areas, each of which serves about
50,000 people living in surrounding
areas. They include:
Bangalore City: Austin Town and
Krishnarajpuram
Anekal Taluk: Huskur and Hennagara
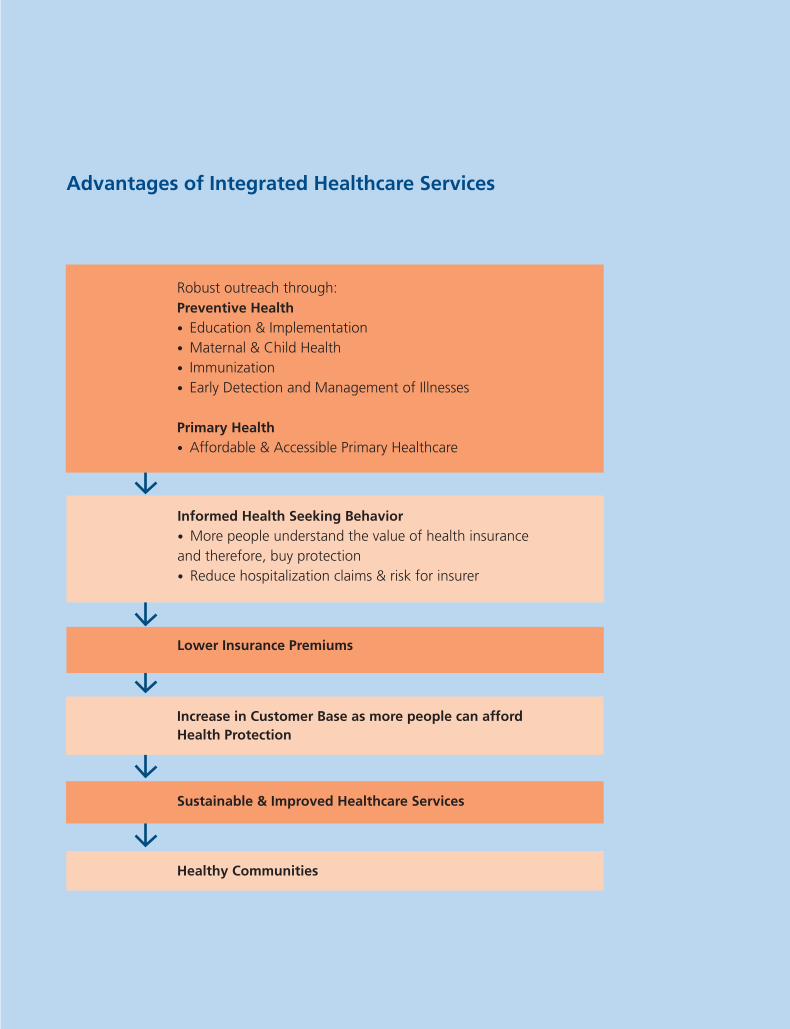
Advantages of Integrated Healthcare Services
Healthy Communities
Robust outreach through:Preventive Health• Education & Implementation• Maternal & Child Health• Immunization• Early Detection and Management of Illnesses
Primary Health• Affordable & Accessible Primary Healthcare
Informed Health Seeking Behavior• More people understand the value of health insurance and therefore, buy protection• Reduce hospitalization claims & risk for insurer
Lower Insurance Premiums
Increase in Customer Base as more people can afford Health Protection
Sustainable & Improved Healthcare Services
Karnataka: Districts of Mandya,
Chickballapur, Bagalkote, Mandya
and Polali (Dakshin Kannada)
Level 3: Tertiary & Secondary Care (Hospitalization)Arogya Raksha Yojana (ARY) Micro Health Insurance SchemeARY Health Insurance has enrolled
1,00,000 members who can avail of
the services of highly qualified surgeons
and doctors. In the five years of its
operation, our scheme has facilitated
more that 1,000 surgeries, 225 of
which have been cardiac procedures
and surgeries, and 250 OB/GYN related.
In Huksur, where we launched the
scheme in 2005, we have achieved
100% renewal rate, and in Chikk-
ballapur more than 50% of the 10,000
members have enrolled for the fourth
year in succession. This is a significant
endorsement of our services from the
community.
To facilitate automation and scaling
up of the enrolment process, we have
advanced from a paper-based, manual
member enrolment system to a mobile
phone-based solution that is trans-
mitted directly to a centralized server.
This shift has considerably reduced
errors during transmission and related
data loss. Each year, we touch more
than 2,00,000 lives through our holistic
approach to healthcare. We believe
that we can enhance the impact of our
services by expanding our network of
clinics, improving our preventive health
and disease prevention activities and
bettering the quality of care at our
clinics and in the ARY network hospitals.
Most importantly, by expanding and
improving our services, we hope to
scale up into a nationwide, effective
and sustainable healthcare operation.
EducationThe education initiatives of Biocon
Foundation have grown in the number
of children reached as well as in the
nature of interventions rolled out.
The Chinnara Ganitha (self learning math) program was launched in 2006
and initially targeted children studying
in 1st and 2nd Grade in Government
schools. By the academic year 2008-09,
the program included students from 1st
to 7th Grade, reaching over 50,000
students in 500 schools. In 2010-11,
this module reached over 70,000
children in 800 schools in three districts
of Karnataka.
During this year, the content for each
class was reviewed keeping in mind
changes and additions made to the
curriculum. The focus this year was
clearly on the lower primary classes
being introduced to the activity-based
Nali Kali program initiated by the
Government. With the intention of
supporting this innovative attempt at
enriching the learning environment in
Government schools, we reworked the
entire content of the main book for
Grades 1 and 2 and introduced work-
books as well. The response from
students and teachers from all classes
have been encouraging. Older children
find the books engaging and fun and
tend to complete the activities quite
fast. For younger classes, the teachers
say the books supplement their daily
teaching and the workbooks help
children improve their writing skills as
well. The quality of the content and the
books themselves have been much
appreciated. The Foundation has
increased its interaction with teachers
and students through coordinators
appointed in the area where the
program is rolled out, thus enabling
constant innovation vis-à-vis needs
expressed by the communities.
As an extension of the Chinnara
Ganitha program, we initiated a
Travelling Science and Math Mela
called the Chinnara Mela in November,
2010. A unique mela and the first of
its kind, we launched it in Huskur
village (near Bangalore) with the help
of 15 volunteers from Biocon. Through
the mela, we reached 250 children
from the local primary school who
participated in this fun-filled event
designed around basic science and
math concepts. Biocon Foundation
aims to have a number of such events
in the coming years.
The Aata Pata Wadi program saw
three batches of children from mainly
tribal communities avail of its services
this year. Each batch consisted of 22-25
children from lower income groups.
They were given access to high quality,
digital learning material in Kannada
and English created by the Azim Premji
Foundation. They were also involved in
focussed, activity-based learning in the
fields of functional english, life skills, art
and crafts, personality development
and sports. As part of their daily rou-
tine, the children were exposed to the
Centre’s Children’s Library where they
were encouraged to read in English
and Kannada to increase their voca-
bulary, general knowledge and interests.
A number of workshops and field trips
were organised in the summer vacations
which the children thoroughly enjoyed.
During the Music Workshop, the
children were exposed to the idea of
creating music out of everyday objects.
They got the opportunity to interact
with musicians and play instruments
like the guitar, keyboard, bongos and
the tambourine, which many of them
experienced for the first time. The level
of enthusiasm displayed by the child-
ren spoke volumes about the need for
access to recreational learning. Another
workshop on pottery allowed the
children to explore clay as a medium
of expression, also introducing them to
the idea of pottery as a profession. The
children were also taken on a fun-filled
recreation trip to Madikeri and its
surrounding areas.
The Flood Relief and Rehabilitation efforts of the Foundation are ongoing
through our involvement with the
Government-led Aasare – a public
private partnership that channelizes
Healthcare Marketing
Research & Development
Discovery Research Services: Syngene
Clinical Research Services: Clinigene
Human Resources
Quality & Regulatory
Environment, Health & Safety
Corporate Social Responsibility
private sector assistance for the
reconstruction of villages on higher
ground to protect them from future
calamities. Biocon is also building
houses in Mangalgudda village,
Badami Taluk.
201151
Biocon Annual Report Highlights
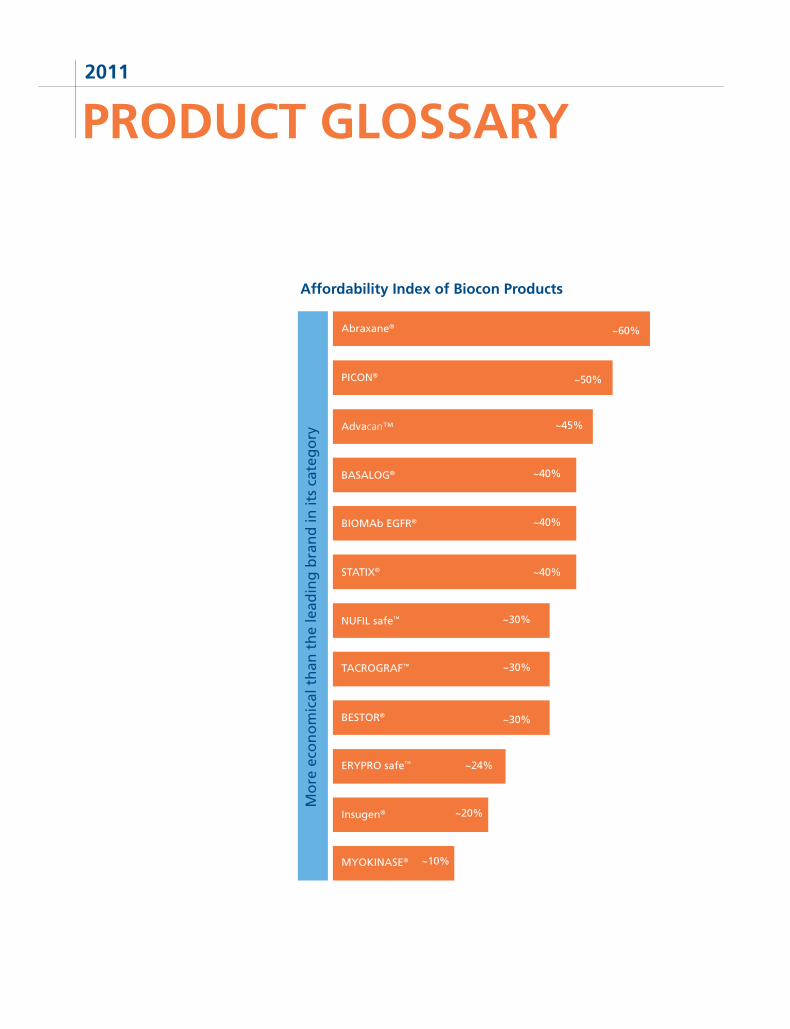
PRODUCT GLOSSARY2011
Affordability Index of Biocon Products
Mo
re e
con
om
ical
th
an t
he
lead
ing
bra
nd
in it
s ca
teg
ory
ERYPRO safe™
PICON®
Advacan™
Abraxane®
BESTOR®
BASALOG®
BIOMAb EGFR®
STATIX®
Insugen®
NUFIL safe™
~24%
~10%
~45%
~40%
~40%
~40%
~20%
~30%
~30%
~50%
~60%
~30%
TACROGRAF™
MYOKINASE®
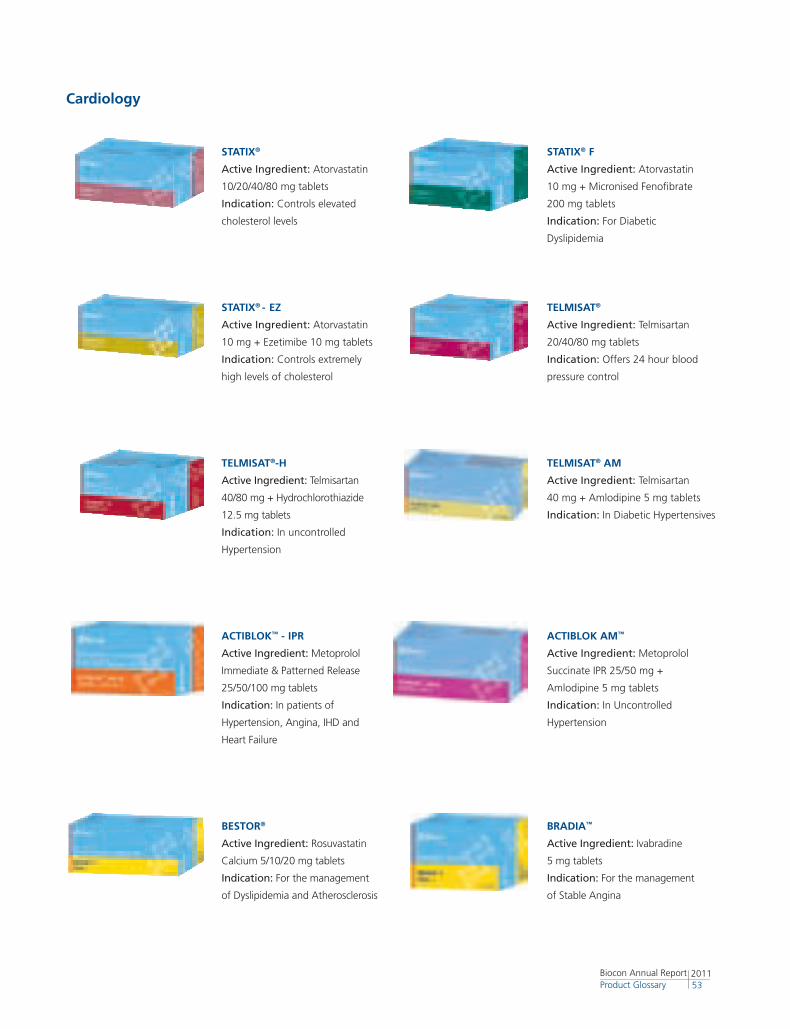
Cardiology
TELMISAT® AM
Active Ingredient: Telmisartan
40 mg + Amlodipine 5 mg tablets
Indication: In Diabetic Hypertensives
STATIx® - Ez
Active Ingredient: Atorvastatin
10 mg + Ezetimibe 10 mg tablets
Indication: Controls extremely
high levels of cholesterol
STATIx®
Active Ingredient: Atorvastatin
10/20/40/80 mg tablets
Indication: Controls elevated
cholesterol levels
STATIx® f
Active Ingredient: Atorvastatin
10 mg + Micronised Fenofibrate
200 mg tablets
Indication: For Diabetic
Dyslipidemia
TELMISAT®
Active Ingredient: Telmisartan
20/40/80 mg tablets
Indication: Offers 24 hour blood
pressure control
TELMISAT®-h
Active Ingredient: Telmisartan
40/80 mg + Hydrochlorothiazide
12.5 mg tablets
Indication: In uncontrolled
Hypertension
ACTIBLOK™ - IPR
Active Ingredient: Metoprolol
Immediate & Patterned Release
25/50/100 mg tablets
Indication: In patients of
Hypertension, Angina, IHD and
Heart Failure
BRADIA™
Active Ingredient: Ivabradine
5 mg tablets
Indication: For the management
of Stable Angina
BESTOR®
Active Ingredient: Rosuvastatin
Calcium 5/10/20 mg tablets
Indication: For the management
of Dyslipidemia and Atherosclerosis
ACTIBLOK AM™
Active Ingredient: Metoprolol
Succinate IPR 25/50 mg +
Amlodipine 5 mg tablets
Indication: In Uncontrolled
Hypertension
201153
Biocon Annual Report Product Glossary
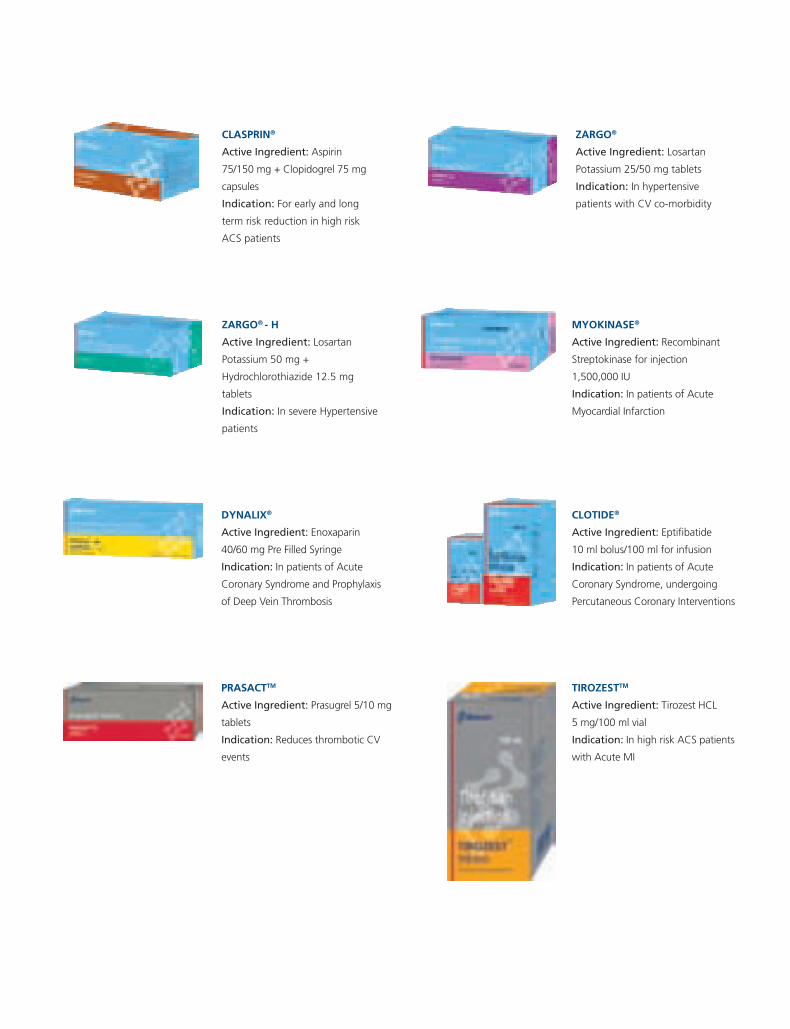
zARgO®
Active Ingredient: Losartan
Potassium 25/50 mg tablets
Indication: In hypertensive
patients with CV co-morbidity
MYOKINASE®
Active Ingredient: Recombinant
Streptokinase for injection
1,500,000 IU
Indication: In patients of Acute
Myocardial Infarction
DYNALIx®
Active Ingredient: Enoxaparin
40/60 mg Pre Filled Syringe
Indication: In patients of Acute
Coronary Syndrome and Prophylaxis
of Deep Vein Thrombosis
PRASACTTM
Active Ingredient: Prasugrel 5/10 mg
tablets
Indication: Reduces thrombotic CV
events
CLOTIDE®
Active Ingredient: Eptifibatide
10 ml bolus/100 ml for infusion
Indication: In patients of Acute
Coronary Syndrome, undergoing
Percutaneous Coronary Interventions
TIROzESTTM
Active Ingredient: Tirozest HCL
5 mg/100 ml vial
Indication: In high risk ACS patients
with Acute MI
zARgO® - h
Active Ingredient: Losartan
Potassium 50 mg +
Hydrochlorothiazide 12.5 mg
tablets
Indication: In severe Hypertensive
patients
CLASPRIN®
Active Ingredient: Aspirin
75/150 mg + Clopidogrel 75 mg
capsules
Indication: For early and long
term risk reduction in high risk
ACS patients
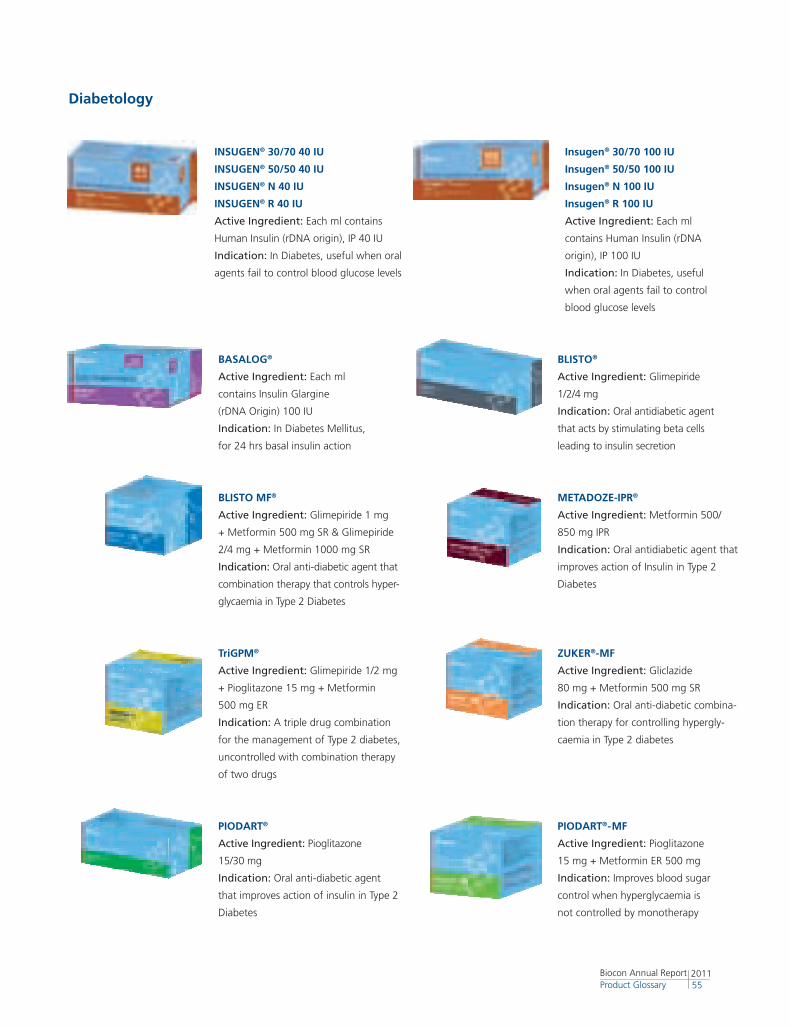
Insugen® 30/70 100 IU
Insugen® 50/50 100 IU
Insugen® N 100 IU
Insugen® R 100 IU
Active Ingredient: Each ml
contains Human Insulin (rDNA
origin), IP 100 IU
Indication: In Diabetes, useful
when oral agents fail to control
blood glucose levels
BASALOg®
Active Ingredient: Each ml
contains Insulin Glargine
(rDNA Origin) 100 IU
Indication: In Diabetes Mellitus,
for 24 hrs basal insulin action
BLISTO Mf®
Active Ingredient: Glimepiride 1 mg
+ Metformin 500 mg SR & Glimepiride
2/4 mg + Metformin 1000 mg SR
Indication: Oral anti-diabetic agent that
combination therapy that controls hyper-
glycaemia in Type 2 Diabetes
Diabetology
INSUgEN® 30/70 40 IU
INSUgEN® 50/50 40 IU
INSUgEN® N 40 IU
INSUgEN® R 40 IU
Active Ingredient: Each ml contains
Human Insulin (rDNA origin), IP 40 IU
Indication: In Diabetes, useful when oral
agents fail to control blood glucose levels
BLISTO®
Active Ingredient: Glimepiride
1/2/4 mg
Indication: Oral antidiabetic agent
that acts by stimulating beta cells
leading to insulin secretion
zUKER®-Mf
Active Ingredient: Gliclazide
80 mg + Metformin 500 mg SR
Indication: Oral anti-diabetic combina-
tion therapy for controlling hypergly-
caemia in Type 2 diabetes
PIODART®
Active Ingredient: Pioglitazone
15/30 mg
Indication: Oral anti-diabetic agent
that improves action of insulin in Type 2
Diabetes
PIODART®-Mf
Active Ingredient: Pioglitazone
15 mg + Metformin ER 500 mg
Indication: Improves blood sugar
control when hyperglycaemia is
not controlled by monotherapy
METADOzE-IPR®
Active Ingredient: Metformin 500/
850 mg IPR
Indication: Oral antidiabetic agent that
improves action of Insulin in Type 2
Diabetes
TrigPM®
Active Ingredient: Glimepiride 1/2 mg
+ Pioglitazone 15 mg + Metformin
500 mg ER
Indication: A triple drug combination
for the management of Type 2 diabetes,
uncontrolled with combination therapy
of two drugs
201155
Biocon Annual Report Product Glossary
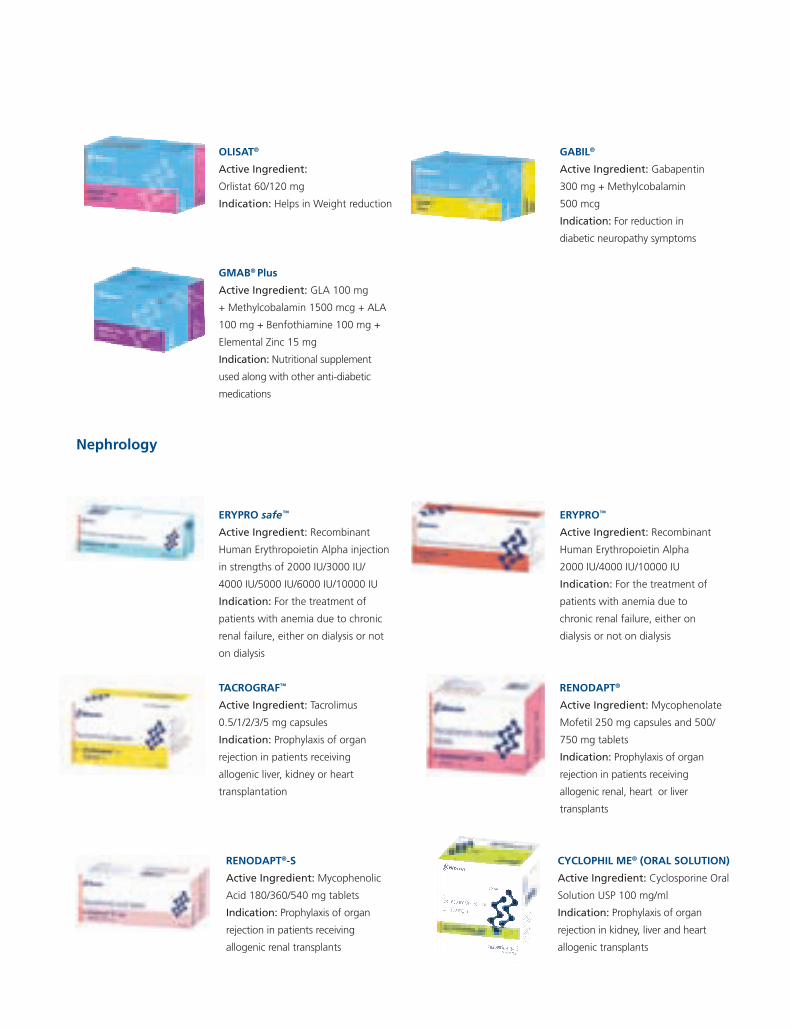
CYCLOPhIL ME® (ORAL SOLUTION)
Active Ingredient: Cyclosporine Oral
Solution USP 100 mg/ml
Indication: Prophylaxis of organ
rejection in kidney, liver and heart
allogenic transplants
RENODAPT®
Active Ingredient: Mycophenolate
Mofetil 250 mg capsules and 500/
750 mg tablets
Indication: Prophylaxis of organ
rejection in patients receiving
allogenic renal, heart or liver
transplants
TACROgRAf™
Active Ingredient: Tacrolimus
0.5/1/2/3/5 mg capsules
Indication: Prophylaxis of organ
rejection in patients receiving
allogenic liver, kidney or heart
transplantation
ERYPRO safe™
Active Ingredient: Recombinant
Human Erythropoietin Alpha injection
in strengths of 2000 IU/3000 IU/
4000 IU/5000 IU/6000 IU/10000 IU
Indication: For the treatment of
patients with anemia due to chronic
renal failure, either on dialysis or not
on dialysis
Nephrology
ERYPRO™
Active Ingredient: Recombinant
Human Erythropoietin Alpha
2000 IU/4000 IU/10000 IU
Indication: For the treatment of
patients with anemia due to
chronic renal failure, either on
dialysis or not on dialysis
OLISAT®
Active Ingredient:
Orlistat 60/120 mg
Indication: Helps in Weight reduction
gMAB® Plus
Active Ingredient: GLA 100 mg
+ Methylcobalamin 1500 mcg + ALA
100 mg + Benfothiamine 100 mg +
Elemental Zinc 15 mg
Indication: Nutritional supplement
used along with other anti-diabetic
medications
gABIL®
Active Ingredient: Gabapentin
300 mg + Methylcobalamin
500 mcg
Indication: For reduction in
diabetic neuropathy symptoms
RENODAPT®-S
Active Ingredient: Mycophenolic
Acid 180/360/540 mg tablets
Indication: Prophylaxis of organ
rejection in patients receiving
allogenic renal transplants
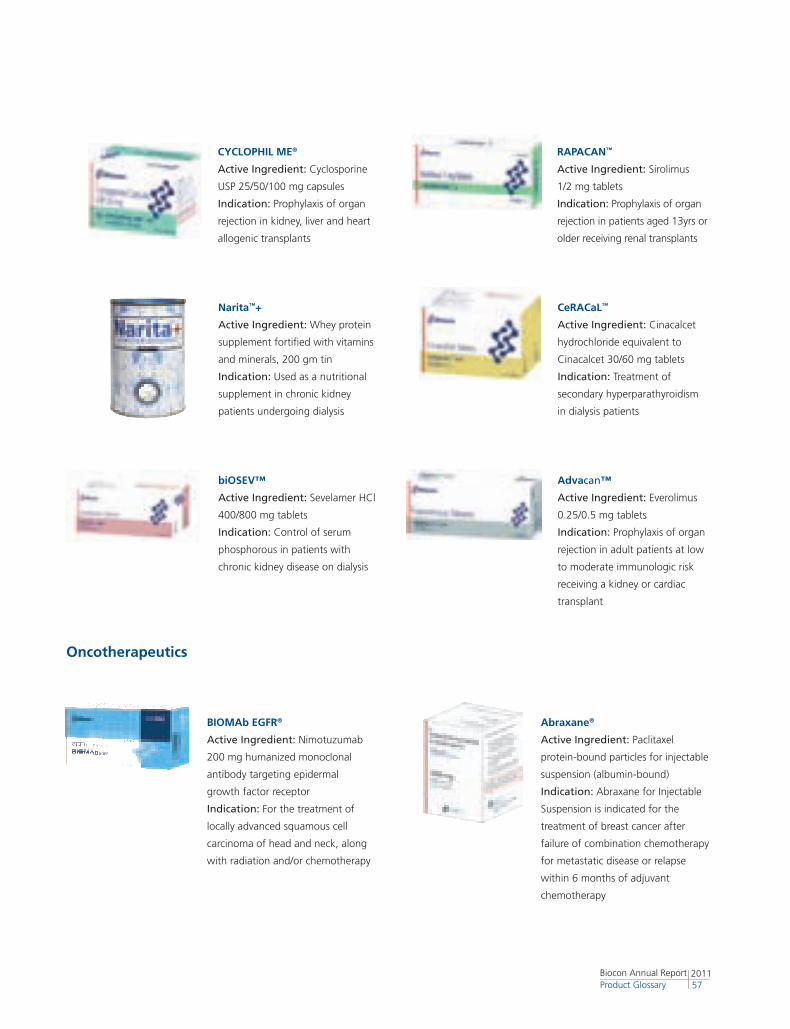
CeRACaL™
Active Ingredient: Cinacalcet
hydrochloride equivalent to
Cinacalcet 30/60 mg tablets
Indication: Treatment of
secondary hyperparathyroidism
in dialysis patients
Narita™+
Active Ingredient: Whey protein
supplement fortified with vitamins
and minerals, 200 gm tin
Indication: Used as a nutritional
supplement in chronic kidney
patients undergoing dialysis
RAPACAN™
Active Ingredient: Sirolimus
1/2 mg tablets
Indication: Prophylaxis of organ
rejection in patients aged 13yrs or
older receiving renal transplants
biOSEV™
Active Ingredient: Sevelamer HCl
400/800 mg tablets
Indication: Control of serum
phosphorous in patients with
chronic kidney disease on dialysis
Advacan™
Active Ingredient: Everolimus
0.25/0.5 mg tablets
Indication: Prophylaxis of organ
rejection in adult patients at low
to moderate immunologic risk
receiving a kidney or cardiac
transplant
CYCLOPhIL ME®
Active Ingredient: Cyclosporine
USP 25/50/100 mg capsules
Indication: Prophylaxis of organ
rejection in kidney, liver and heart
allogenic transplants
ERYPRO™
Active Ingredient: Recombinant
Human Erythropoietin Alpha
2000 IU/4000 IU/10000 IU
Indication: For the treatment of
patients with anemia due to
chronic renal failure, either on
dialysis or not on dialysis
201157
Biocon Annual Report Product Glossary
Oncotherapeutics
Abraxane®
Active Ingredient: Paclitaxel
protein-bound particles for injectable
suspension (albumin-bound)
Indication: Abraxane for Injectable
Suspension is indicated for the
treatment of breast cancer after
failure of combination chemotherapy
for metastatic disease or relapse
within 6 months of adjuvant
chemotherapy
BIOMAb EgfR®
Active Ingredient: Nimotuzumab
200 mg humanized monoclonal
antibody targeting epidermal
growth factor receptor
Indication: For the treatment of
locally advanced squamous cell
carcinoma of head and neck, along
with radiation and/or chemotherapy
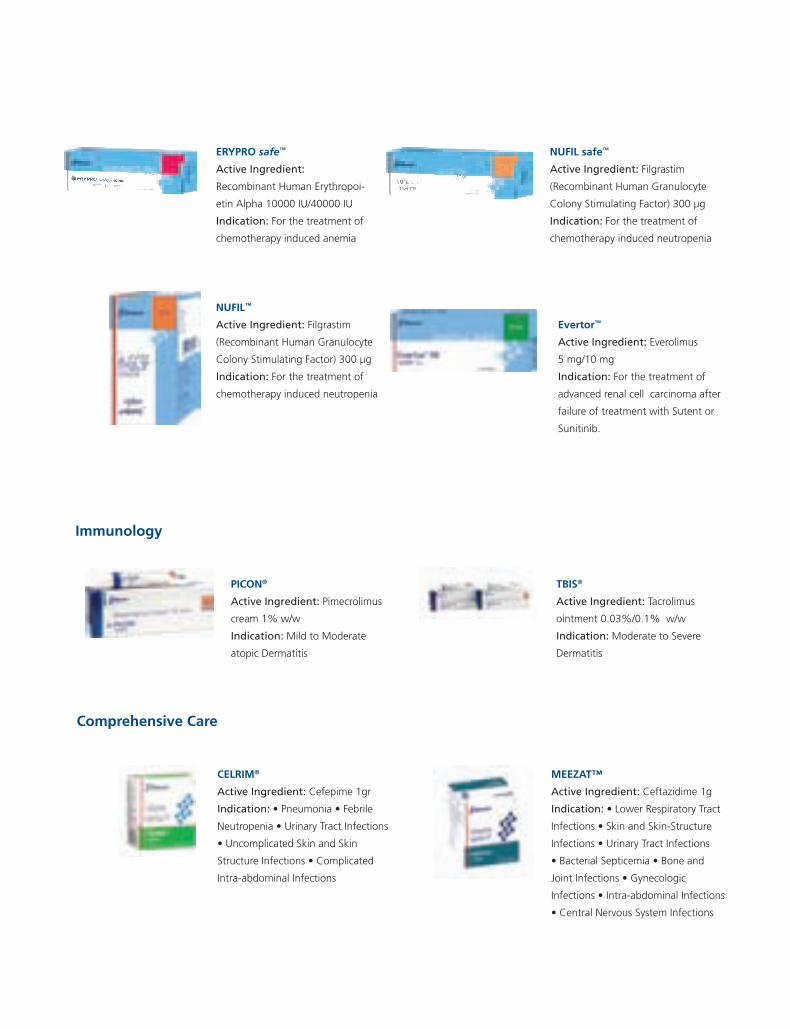
Immunology
Comprehensive Care
PICON®
Active Ingredient: Pimecrolimus
cream 1% w/w
Indication: Mild to Moderate
atopic Dermatitis
TBIS®
Active Ingredient: Tacrolimus
ointment 0.03%/0.1% w/w
Indication: Moderate to Severe
Dermatitis
MEEzAT™
Active Ingredient: Ceftazidime 1g
Indication: • Lower Respiratory Tract
Infections • Skin and Skin-Structure
Infections • Urinary Tract Infections
• Bacterial Septicemia • Bone and
Joint Infections • Gynecologic
Infections • Intra-abdominal Infections
• Central Nervous System Infections
NUfIL safe™
Active Ingredient: Filgrastim
(Recombinant Human Granulocyte
Colony Stimulating Factor) 300 μg
Indication: For the treatment of
chemotherapy induced neutropenia
Evertor™
Active Ingredient: Everolimus
5 mg/10 mg
Indication: For the treatment of
advanced renal cell carcinoma after
failure of treatment with Sutent or
Sunitinib.
CELRIM®
Active Ingredient: Cefepime 1gr
Indication: • Pneumonia • Febrile
Neutropenia • Urinary Tract Infections
• Uncomplicated Skin and Skin
Structure Infections • Complicated
Intra-abdominal Infections
ERYPRO safe™
Active Ingredient:
Recombinant Human Erythropoi-
etin Alpha 10000 IU/40000 IU
Indication: For the treatment of
chemotherapy induced anemia
NUfIL™
Active Ingredient: Filgrastim
(Recombinant Human Granulocyte
Colony Stimulating Factor) 300 μg
Indication: For the treatment of
chemotherapy induced neutropenia
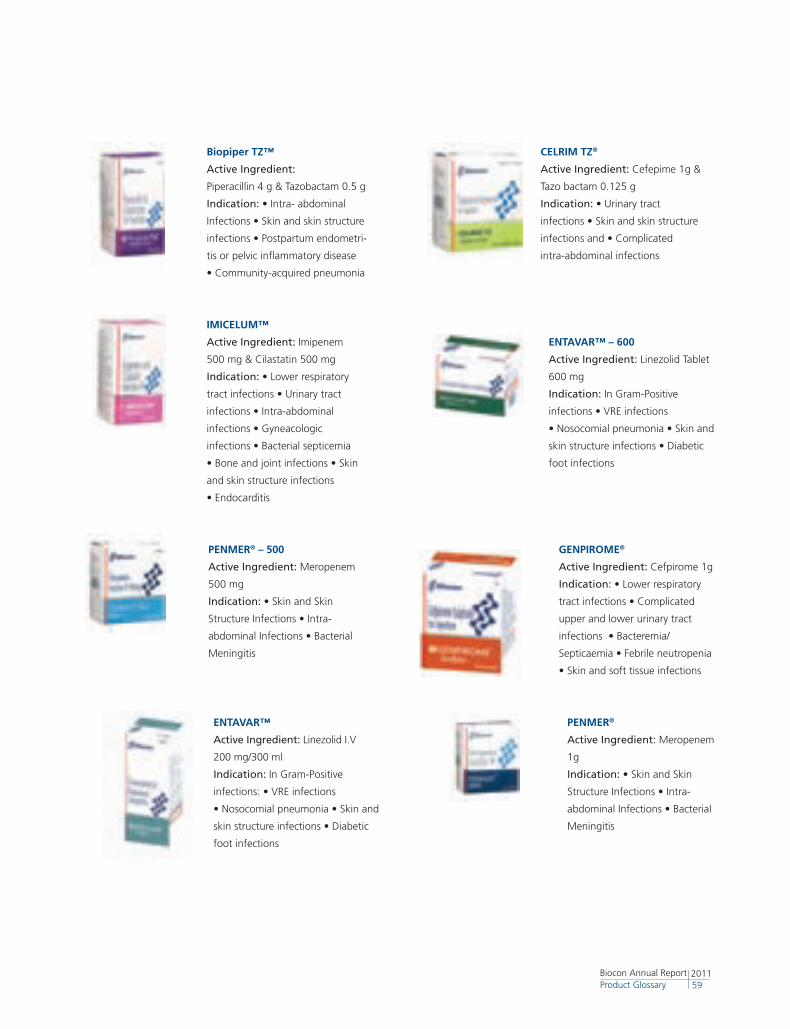
CELRIM Tz®
Active Ingredient: Cefepime 1g &
Tazo bactam 0.125 g
Indication: • Urinary tract
infections • Skin and skin structure
infections and • Complicated
intra-abdominal infections
ENTAVAR™ – 600
Active Ingredient: Linezolid Tablet
600 mg
Indication: In Gram-Positive
infections • VRE infections
• Nosocomial pneumonia • Skin and
skin structure infections • Diabetic
foot infections
Biopiper Tz™
Active Ingredient:
Piperacillin 4 g & Tazobactam 0.5 g
Indication: • Intra- abdominal
Infections • Skin and skin structure
infections • Postpartum endometri-
tis or pelvic inflammatory disease
• Community-acquired pneumonia
IMICELUM™
Active Ingredient: Imipenem
500 mg & Cilastatin 500 mg
Indication: • Lower respiratory
tract infections • Urinary tract
infections • Intra-abdominal
infections • Gyneacologic
infections • Bacterial septicemia
• Bone and joint infections • Skin
and skin structure infections
• Endocarditis
201159
Biocon Annual Report Product Glossary
PENMER®
Active Ingredient: Meropenem
1g
Indication: • Skin and Skin
Structure Infections • Intra-
abdominal Infections • Bacterial
Meningitis
ENTAVAR™
Active Ingredient: Linezolid I.V
200 mg/300 ml
Indication: In Gram-Positive
infections: • VRE infections
• Nosocomial pneumonia • Skin and
skin structure infections • Diabetic
foot infections
gENPIROME®
Active Ingredient: Cefpirome 1g
Indication: • Lower respiratory
tract infections • Complicated
upper and lower urinary tract
infections • Bacteremia/
Septicaemia • Febrile neutropenia
• Skin and soft tissue infections
PENMER® – 500
Active Ingredient: Meropenem
500 mg
Indication: • Skin and Skin
Structure Infections • Intra-
abdominal Infections • Bacterial
Meningitis
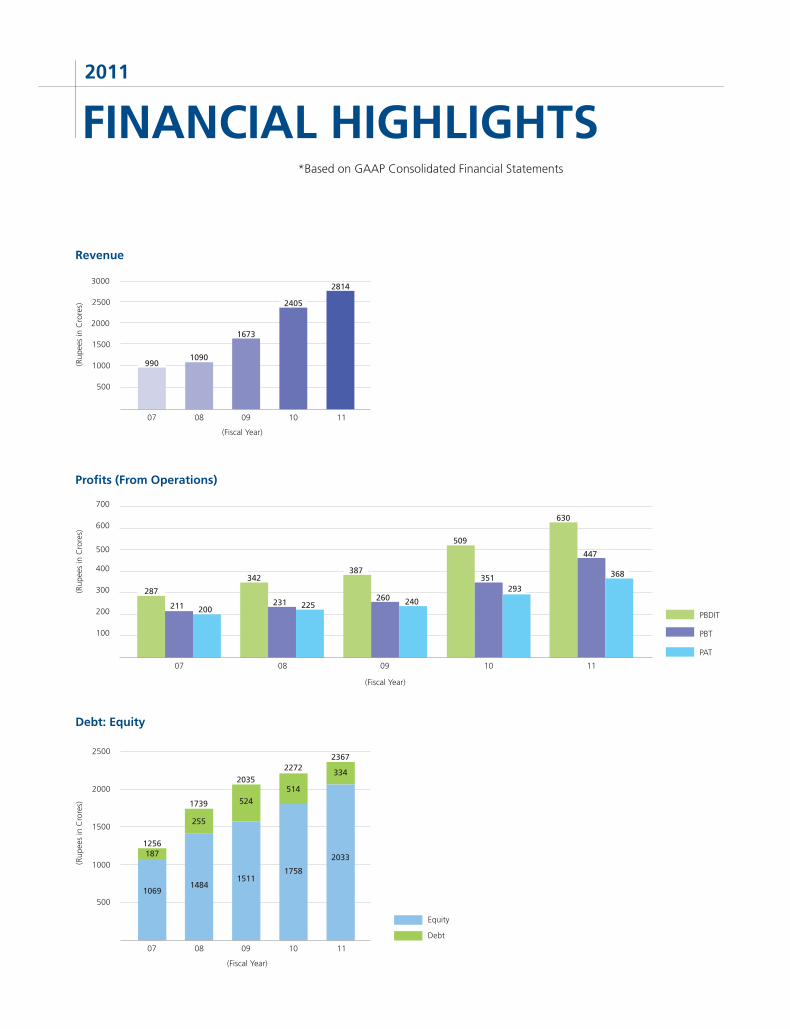
FINANCIAL HIGHLIGHTS2011
*Based on GAAP Consolidated Financial Statements
Revenue
1090
1673
2405
07 08 09 10 11
2500
2000
1500
3000
1000
500
(Rup
ees
in C
rore
s)
(Fiscal Year)
990
2814
Profits (From Operations)
(Rup
ees
in C
rore
s)
07 08 09 10 11
500
400
700
300
600
200
100
PAT
PBDIT
PBT
211 200
287231 225
342
260 240
387
447
368
630
351293
509
(Fiscal Year)
Debt: Equity
741
07 08 09 10 11
2500
2000
1500
1000
500
(Rup
ees
in C
rore
s)
Equity
Debt
334
2367
2033187
255
524
514
10691484
1511
1256
1739
2035
2272
1758
(Fiscal Year)
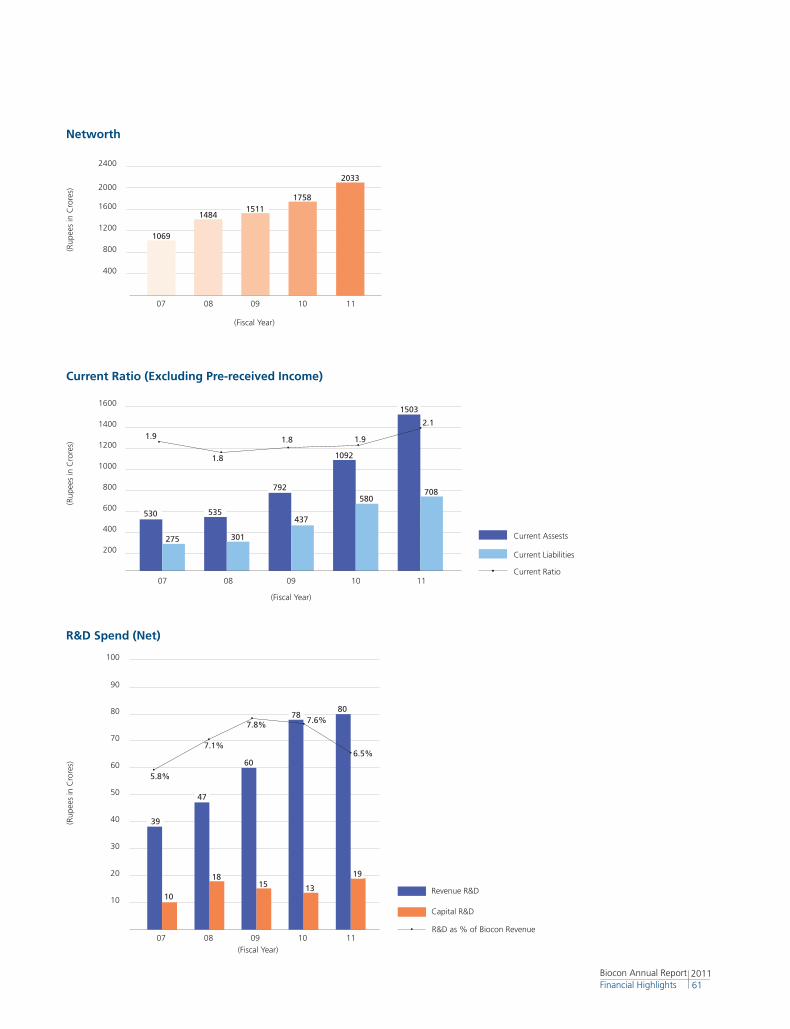
201161
Biocon Annual Report Financial Highlights
2000
1600
1200
2400
800
400
07 08 09 10 11
(Rup
ees
in C
rore
s)
Networth
(Fiscal Year)
1069
14841511
1758
2033
Current Ratio (Excluding Pre-received Income)
(Rup
ees
in C
rore
s)
Current Assests
Current Liabilities
Current Ratio07 08 09 10 11
1600
1200
800
1000
1400
400
200
600
301
530 535
275
792
1092
1503
437
580
1.9
1.8
1.8 1.9
2.1
(Fiscal Year)
708
R&D Spend (Net)
Revenue R&D
R&D as % of Biocon Revenue
Capital R&D
07 08 09 10 11
(Rup
ees
in C
rore
s)
39
5.8%
7.1%
7.8% 7.6%
6.5%
10
18
60
15
78
13
19
50
60
70
80
90
100
40
30
20
10
47
(Fiscal Year)
80
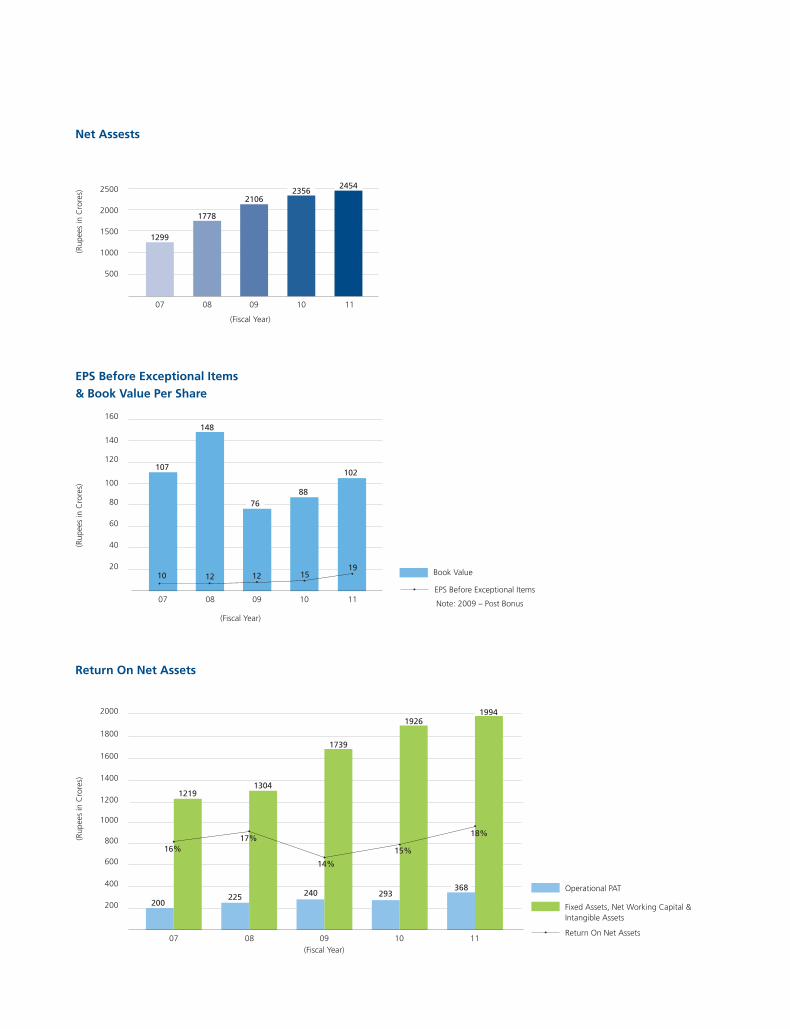
Net Assests
(Rup
ees
in C
rore
s)
1778
2356
07 08 09 10 11
2500
2000
1500
1000
500
(Fiscal Year)
1299
2454
2106
(Rup
ees
in C
rore
s)
EPS Before Exceptional Items & Book Value Per Share
Book Value
100
140
80
120
60
160
40
20
07 08 09 10 11
(Fiscal Year)
107
10 12 1219
15
148
7688
102
EPS Before Exceptional Items
Note: 2009 – Post Bonus
368
1994
07 08 09 10 11
1000
1600
1800
2000
800
1400
600
1200
400
200
(Rup
ees
in C
rore
s)
Return On Net Assets
Return On Net Assets
Operational PAT
Fixed Assets, Net Working Capital & Intangible Assets
225
1739
200
1304
293
1926
1219
16%17%
240
(Fiscal Year)
14%
15%
18%
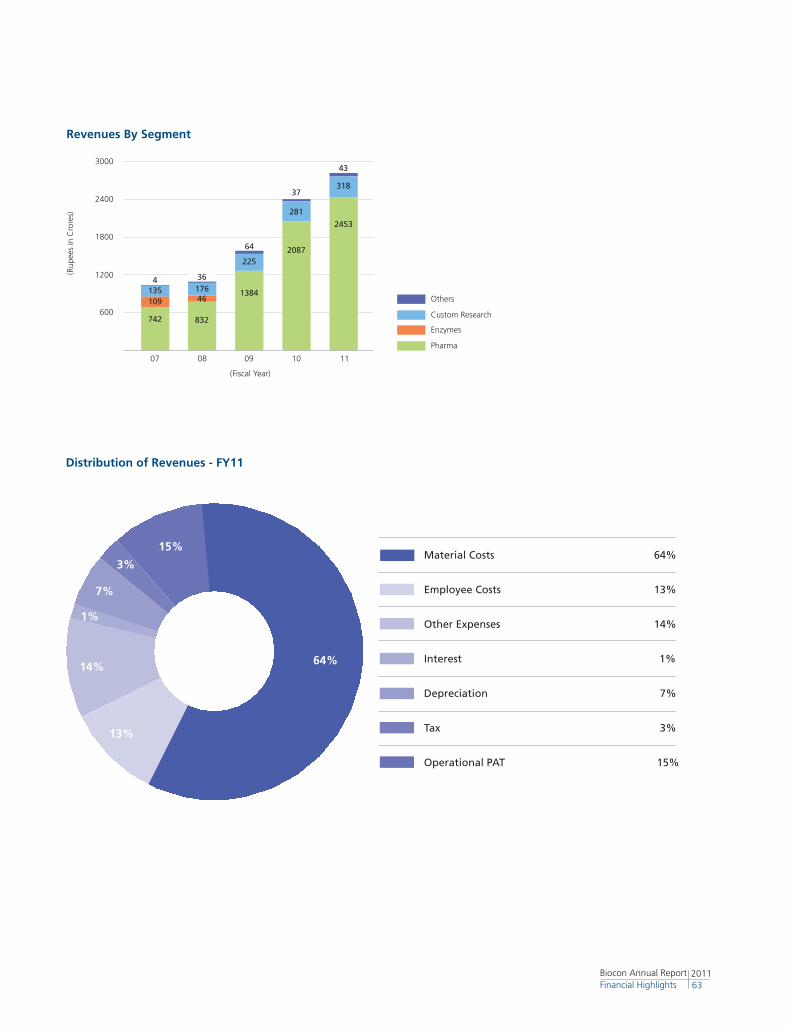
15%
14% 64%
13%
3%
7%
1%
Distribution of Revenues - FY11
Revenues By Segment
741
07 08 09 10 11
3000
2400
1800
1200
600
(Rup
ees
in C
rore
s)
Enzymes
Others
Pharma
Custom Research
2453
109 46
4 36
64
37
43
135 176
225
318
742 832
1384
2087
(Fiscal Year)
281
Material Costs 64%
Employee Costs 13%
Other Expenses 14%
Interest 1%
Depreciation 7%
Tax 3%
Operational PAT 15%
201163
Biocon Annual Report Financial Highlights

FINANCIAL REPORT
Directors’ Report
Management Discussion & Analysis
Corporate Governance Report
Financial IGAAP Stand Alone
Biocon Limited & Subsidiaries – IGAAP
66
73
83
95
129
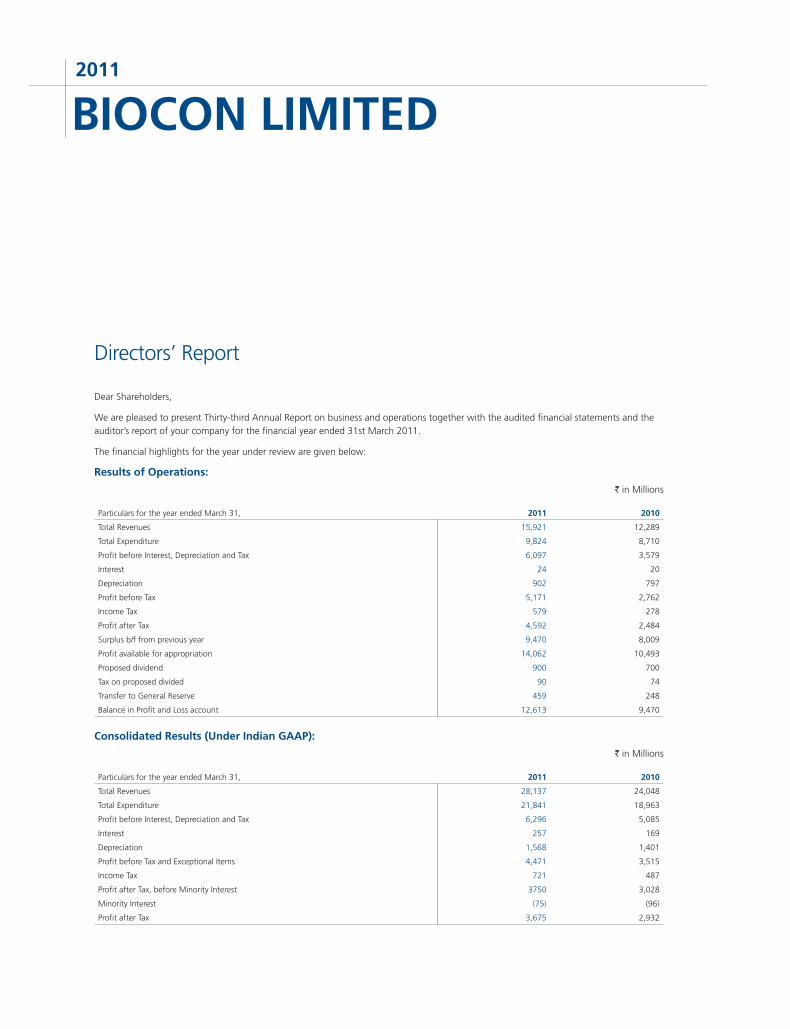
Directors’ Report
Dear Shareholders,
We are pleased to present Thirty-third Annual Report on business and operations together with the audited financial statements and the auditor’s report of your company for the financial year ended 31st March 2011.
The financial highlights for the year under review are given below:
Results of Operations:
` in Millions
Particulars for the year ended March 31, 2011 2010
Total Revenues 15,921 12,289
Total Expenditure 9,824 8,710
Profit before Interest, Depreciation and Tax 6,097 3,579
Interest 24 20
Depreciation 902 797
Profit before Tax 5,171 2,762
Income Tax 579 278
Profit after Tax 4,592 2,484
Surplus b/f from previous year 9,470 8,009
Profit available for appropriation 14,062 10,493
Proposed dividend 900 700
Tax on proposed divided 90 74
Transfer to General Reserve 459 248
Balance in Profit and Loss account 12,613 9,470
Consolidated Results (Under Indian GAAP):
` in Millions
Particulars for the year ended March 31, 2011 2010
Total Revenues 28,137 24,048
Total Expenditure 21,841 18,963
Profit before Interest, Depreciation and Tax 6,296 5,085
Interest 257 169
Depreciation 1,568 1,401
Profit before Tax and Exceptional Items 4,471 3,515
Income Tax 721 487
Profit after Tax, before Minority Interest 3750 3,028
Minority Interest (75) (96)
Profit after Tax 3,675 2,932
BIOCON LIMITED2011
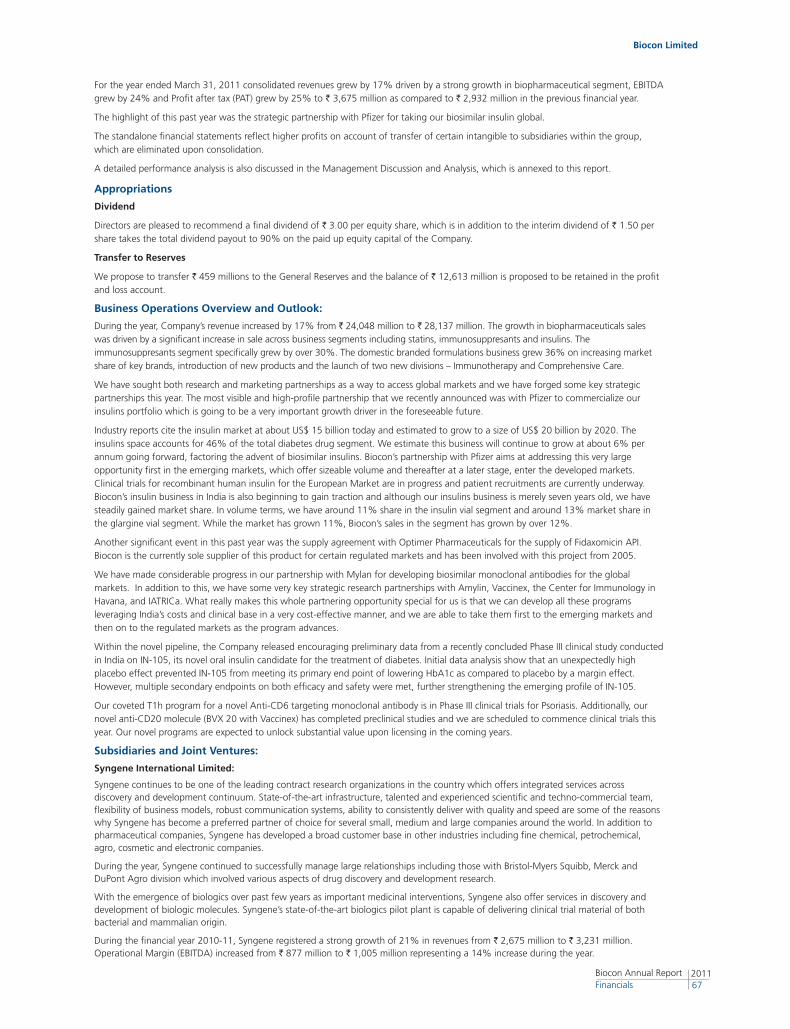
Biocon Limited
201167
Biocon Annual Report Financials
For the year ended March 31, 2011 consolidated revenues grew by 17% driven by a strong growth in biopharmaceutical segment, EBITDA grew by 24% and Profit after tax (PAT) grew by 25% to ` 3,675 million as compared to ` 2,932 million in the previous financial year.
The highlight of this past year was the strategic partnership with Pfizer for taking our biosimilar insulin global.
The standalone financial statements reflect higher profits on account of transfer of certain intangible to subsidiaries within the group, which are eliminated upon consolidation.
A detailed performance analysis is also discussed in the Management Discussion and Analysis, which is annexed to this report.
Appropriations
Dividend
Directors are pleased to recommend a final dividend of ` 3.00 per equity share, which is in addition to the interim dividend of ` 1.50 per share takes the total dividend payout to 90% on the paid up equity capital of the Company.
Transfer to Reserves
We propose to transfer ` 459 millions to the General Reserves and the balance of ` 12,613 million is proposed to be retained in the profit and loss account.
Business Operations Overview and Outlook:
During the year, Company’s revenue increased by 17% from ` 24,048 million to ` 28,137 million. The growth in biopharmaceuticals sales was driven by a significant increase in sale across business segments including statins, immunosuppresants and insulins. The immunosuppresants segment specifically grew by over 30%. The domestic branded formulations business grew 36% on increasing market share of key brands, introduction of new products and the launch of two new divisions – Immunotherapy and Comprehensive Care.
We have sought both research and marketing partnerships as a way to access global markets and we have forged some key strategic partnerships this year. The most visible and high-profile partnership that we recently announced was with Pfizer to commercialize our insulins portfolio which is going to be a very important growth driver in the foreseeable future.
Industry reports cite the insulin market at about US$ 15 billion today and estimated to grow to a size of US$ 20 billion by 2020. The insulins space accounts for 46% of the total diabetes drug segment. We estimate this business will continue to grow at about 6% per annum going forward, factoring the advent of biosimilar insulins. Biocon’s partnership with Pfizer aims at addressing this very large opportunity first in the emerging markets, which offer sizeable volume and thereafter at a later stage, enter the developed markets. Clinical trials for recombinant human insulin for the European Market are in progress and patient recruitments are currently underway. Biocon’s insulin business in India is also beginning to gain traction and although our insulins business is merely seven years old, we have steadily gained market share. In volume terms, we have around 11% share in the insulin vial segment and around 13% market share in the glargine vial segment. While the market has grown 11%, Biocon’s sales in the segment has grown by over 12%.
Another significant event in this past year was the supply agreement with Optimer Pharmaceuticals for the supply of Fidaxomicin API. Biocon is the currently sole supplier of this product for certain regulated markets and has been involved with this project from 2005.
We have made considerable progress in our partnership with Mylan for developing biosimilar monoclonal antibodies for the global markets. In addition to this, we have some very key strategic research partnerships with Amylin, Vaccinex, the Center for Immunology in Havana, and IATRICa. What really makes this whole partnering opportunity special for us is that we can develop all these programs leveraging India’s costs and clinical base in a very cost-effective manner, and we are able to take them first to the emerging markets and then on to the regulated markets as the program advances.
Within the novel pipeline, the Company released encouraging preliminary data from a recently concluded Phase III clinical study conducted in India on IN-105, its novel oral insulin candidate for the treatment of diabetes. Initial data analysis show that an unexpectedly high placebo effect prevented IN-105 from meeting its primary end point of lowering HbA1c as compared to placebo by a margin effect. However, multiple secondary endpoints on both efficacy and safety were met, further strengthening the emerging profile of IN-105.
Our coveted T1h program for a novel Anti-CD6 targeting monoclonal antibody is in Phase III clinical trials for Psoriasis. Additionally, our novel anti-CD20 molecule (BVX 20 with Vaccinex) has completed preclinical studies and we are scheduled to commence clinical trials this year. Our novel programs are expected to unlock substantial value upon licensing in the coming years.
Subsidiaries and Joint Ventures:
Syngene International Limited:
Syngene continues to be one of the leading contract research organizations in the country which offers integrated services across discovery and development continuum. State-of-the-art infrastructure, talented and experienced scientific and techno-commercial team, flexibility of business models, robust communication systems, ability to consistently deliver with quality and speed are some of the reasons why Syngene has become a preferred partner of choice for several small, medium and large companies around the world. In addition to pharmaceutical companies, Syngene has developed a broad customer base in other industries including fine chemical, petrochemical, agro, cosmetic and electronic companies.
During the year, Syngene continued to successfully manage large relationships including those with Bristol-Myers Squibb, Merck and DuPont Agro division which involved various aspects of drug discovery and development research.
With the emergence of biologics over past few years as important medicinal interventions, Syngene also offer services in discovery and development of biologic molecules. Syngene’s state-of-the-art biologics pilot plant is capable of delivering clinical trial material of both bacterial and mammalian origin.
During the financial year 2010-11, Syngene registered a strong growth of 21% in revenues from ` 2,675 million to ` 3,231 million. Operational Margin (EBITDA) increased from ` 877 million to ` 1,005 million representing a 14% increase during the year.
Increased charge on account of depreciation has led to a marginal decline in the net profit which was at ` 283 million for the year against of ` 308 million for the previous year.
Clinigene International Limited:
For the year under review, Clinigene registered revenues of ` 289 million Clinigene had a challenging year and has incurred a loss of ` 37 million on account unfavourable market conditions, delay in study startup and intensive pricing pressures.
Clinigene is continuing to evolve and adapt its capability platforms and service offerings against a background of continued macro market pressure as global R&D spends are being reduced, consolidation of market players continues and the shift to globally capable preferred partnerships accelerates. In addition to our standard service platforms, we have identified several more specialized areas, for example patient based early studies, complex BA/BE studies and immunoanalytical services where Clinigene offers strong capabilities. We believe that, these new speciality services, which have relatively high entry barriers, will allow us to drive new and differential revenue opportunities.
Biocon Biopharmaceuticals Private Limited:
During the year Biocon Biopharmaceuticals Private Limited (BBPL) became a wholly owned subsidiary of the Company.
For the year under review, BBPL earned revenues of ` 491 million as against ` 381 million in the previous year. The net profits for the year stood at ` 192 million as against ` 26 million in the previous year.
Biocon Research Limited:
Biocon Research Limited (BRL) is a wholly owned subsidiary set up to undertake discovery and development research work in biologics, antibody molecules and proteins.
For the current year BRL registered revenues of ` 649 million as against ` 392 million in the previous year. BRL continues to progress the development activity on the monoclonal antibody program in joint collaboration with Mylan. BRL has reported a net loss of ` 322 Million for the year ended March 31, 2011 against a loss of ` 51 million in the previous year.
Being a research driven enterprise, the Company is in the initial stage of operations and has enlarged its scope to other challenging research projects during the year.
Biocon SA:
Biocon SA, a wholly owned subsidiary in Switzerland is primarily engaged in development and commercialisation of biopharmaceuticals across the globe. Clinical Development of Insulin is currently ongoing in the European region.
AxiCorp GmbH:
AxiCorp is a specialized Pharma marketing and distribution company based in Germany.
For the current financial year AxiCorp revenues rose from ` 9,117 million to ` 9,800 million. The Company earned a net profit of ` 353 million for the year against ` 299 million for the previous year. Given the synergies brought about by the Pfizer partnership, the Company has decided to divest its 78% stake in AxiCorp to the existing group of promoter shareholders.
NeoBiocon FZ LLC:
NeoBiocon FZ LLC is a pharmaceutical research and marketing company based at Abu Dhabi. Incorporated in January 2008, NeoBiocon is an equal joint venture with Dr. B.R. Shetty of NeoPharma.
During the current year, NeoBiocon registered significant growth in revenue to ` 60 million and a net profit of ` 21 million.
In addition to launching oncology products. NeoBiocon’s range of branded generic products, now approved by the UAE Ministry of Health, has been successfully launched to address the therapeutic segments of cardiology, diabetology and infection management.
Biocon SDN. BHD.
During the year, Company has incorporated a wholly owned subsidiary in Malaysia to set up a state of the art manufacturing facility at BioXcell a biotechnology park promoted by the Government of Malaysia.
In the first phase of capital outlay the Company envisages an investment of US$ 161 million and expects the facility to go on stream by year 2015.
Consolidated financial statements:
The consolidated financial statements have been prepared by the Company in accordance with the Accounting Standards as prescribed by the Companies (Accounting Standards) Rules, 2006. The audited consolidated financial statements together with Auditors Report thereon also form part of the Annual report.
Accounts of subsidiary companies:
The Ministry of Company Affairs has granted General Exemption to Companies from attaching the financial accounts of the subsidiary companies to this Report pursuant to Section 212 of the Companies Act, 1956. However, a statement showing the relevant details of the Subsidiaries is enclosed and is a part of the Annual Report. The members can write to the Company for obtaining the annual accounts of the subsidiary companies and copies will also be available for inspection at the registered office in Bangalore, India.
Employees Stock Option Plan (ESOP):
Pursuant to the provisions of Guideline 12 of the Securities and Exchange Board of India (Employee Stock Option Scheme and Employee Stock Purchase Scheme), Guidelines, 1999, as amended, the details of stock options as on March 31, 2011 are set out in the Annexure to the Directors’ Report.
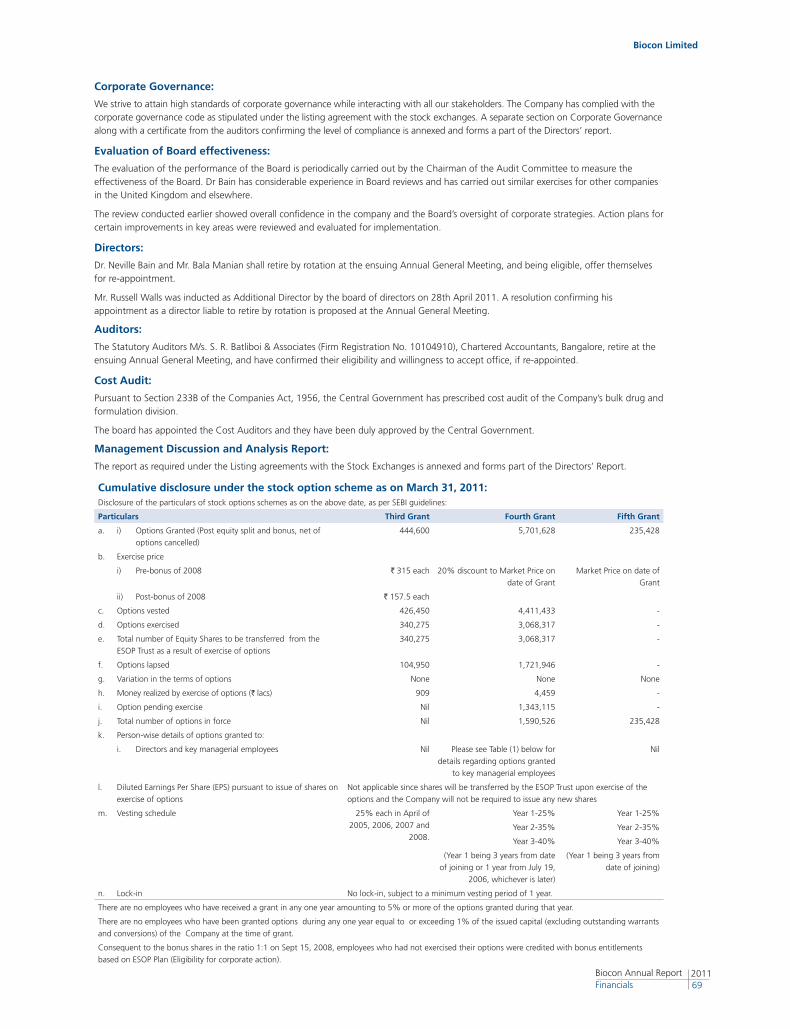
Biocon Limited
201169
Biocon Annual Report Financials
Corporate Governance:
We strive to attain high standards of corporate governance while interacting with all our stakeholders. The Company has complied with the corporate governance code as stipulated under the listing agreement with the stock exchanges. A separate section on Corporate Governance along with a certificate from the auditors confirming the level of compliance is annexed and forms a part of the Directors’ report.
Evaluation of Board effectiveness:
The evaluation of the performance of the Board is periodically carried out by the Chairman of the Audit Committee to measure the effectiveness of the Board. Dr Bain has considerable experience in Board reviews and has carried out similar exercises for other companies in the United Kingdom and elsewhere.
The review conducted earlier showed overall confidence in the company and the Board’s oversight of corporate strategies. Action plans for certain improvements in key areas were reviewed and evaluated for implementation.
Directors:
Dr. Neville Bain and Mr. Bala Manian shall retire by rotation at the ensuing Annual General Meeting, and being eligible, offer themselves for re-appointment.
Mr. Russell Walls was inducted as Additional Director by the board of directors on 28th April 2011. A resolution confirming his appointment as a director liable to retire by rotation is proposed at the Annual General Meeting.
Auditors:
The Statutory Auditors M/s. S. R. Batliboi & Associates (Firm Registration No. 10104910), Chartered Accountants, Bangalore, retire at the ensuing Annual General Meeting, and have confirmed their eligibility and willingness to accept office, if re-appointed.
Cost Audit:
Pursuant to Section 233B of the Companies Act, 1956, the Central Government has prescribed cost audit of the Company’s bulk drug and formulation division.
The board has appointed the Cost Auditors and they have been duly approved by the Central Government.
Management Discussion and Analysis Report:
The report as required under the Listing agreements with the Stock Exchanges is annexed and forms part of the Directors’ Report.
Cumulative disclosure under the stock option scheme as on March 31, 2011:Disclosure of the particulars of stock options schemes as on the above date, as per SEBI guidelines:
Particulars Third Grant Fourth Grant Fifth Grant
a. i) Options Granted (Post equity split and bonus, net of
options cancelled)
444,600 5,701,628 235,428
b. Exercise price
i) Pre-bonus of 2008 ` 315 each 20% discount to Market Price on
date of Grant
Market Price on date of
Grant
ii) Post-bonus of 2008 ` 157.5 each
c. Options vested 426,450 4,411,433 -
d. Options exercised 340,275 3,068,317 -
e. Total number of Equity Shares to be transferred from the
ESOP Trust as a result of exercise of options
340,275 3,068,317 -
f. Options lapsed 104,950 1,721,946 -
g. Variation in the terms of options None None None
h. Money realized by exercise of options (` lacs) 909 4,459 -
i. Option pending exercise Nil 1,343,115 -
j. Total number of options in force Nil 1,590,526 235,428
k. Person-wise details of options granted to:
i. Directors and key managerial employees Nil Please see Table (1) below for
details regarding options granted
to key managerial employees
Nil
l. Diluted Earnings Per Share (EPS) pursuant to issue of shares on
exercise of options
Not applicable since shares will be transferred by the ESOP Trust upon exercise of the
options and the Company will not be required to issue any new shares
m. Vesting schedule 25% each in April of
2005, 2006, 2007 and
2008.
Year 1-25% Year 1-25%
Year 2-35% Year 2-35%
Year 3-40% Year 3-40%
(Year 1 being 3 years from date
of joining or 1 year from July 19,
2006, whichever is later)
(Year 1 being 3 years from
date of joining)
n. Lock-in No lock-in, subject to a minimum vesting period of 1 year.
There are no employees who have received a grant in any one year amounting to 5% or more of the options granted during that year.
There are no employees who have been granted options during any one year equal to or exceeding 1% of the issued capital (excluding outstanding warrants
and conversions) of the Company at the time of grant.
Consequent to the bonus shares in the ratio 1:1 on Sept 15, 2008, employees who had not exercised their options were credited with bonus entitlements
based on ESOP Plan (Eligibility for corporate action).
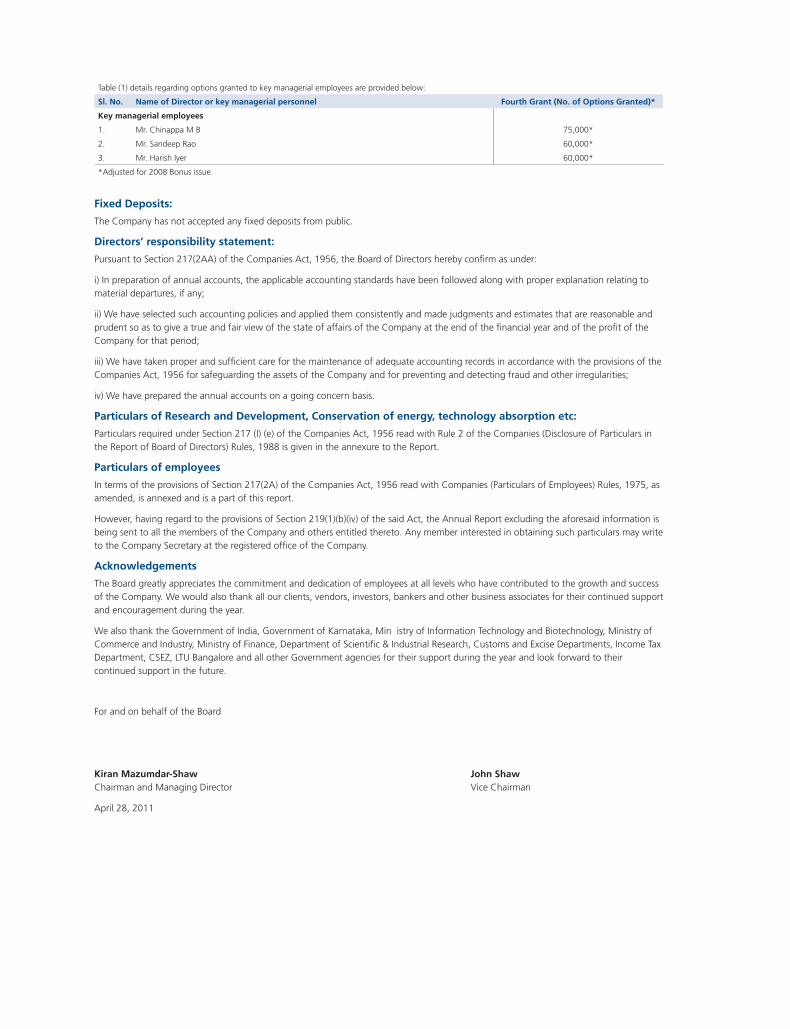
Table (1) details regarding options granted to key managerial employees are provided below:
Sl. No. Name of Director or key managerial personnel Fourth Grant (No. of Options Granted)*
Key managerial employees
1. Mr. Chinappa M B 75,000*
2. Mr. Sandeep Rao 60,000*
3. Mr. Harish Iyer 60,000*
*Adjusted for 2008 Bonus issue.
Fixed Deposits:
The Company has not accepted any fixed deposits from public.
Directors’ responsibility statement:
Pursuant to Section 217(2AA) of the Companies Act, 1956, the Board of Directors hereby confirm as under:
i) In preparation of annual accounts, the applicable accounting standards have been followed along with proper explanation relating to material departures, if any;
ii) We have selected such accounting policies and applied them consistently and made judgments and estimates that are reasonable and prudent so as to give a true and fair view of the state of affairs of the Company at the end of the financial year and of the profit of the Company for that period;
iii) We have taken proper and sufficient care for the maintenance of adequate accounting records in accordance with the provisions of the Companies Act, 1956 for safeguarding the assets of the Company and for preventing and detecting fraud and other irregularities;
iv) We have prepared the annual accounts on a going concern basis.
Particulars of Research and Development, Conservation of energy, technology absorption etc:
Particulars required under Section 217 (I) (e) of the Companies Act, 1956 read with Rule 2 of the Companies (Disclosure of Particulars in the Report of Board of Directors) Rules, 1988 is given in the annexure to the Report.
Particulars of employees
In terms of the provisions of Section 217(2A) of the Companies Act, 1956 read with Companies (Particulars of Employees) Rules, 1975, as amended, is annexed and is a part of this report.
However, having regard to the provisions of Section 219(1)(b)(iv) of the said Act, the Annual Report excluding the aforesaid information is being sent to all the members of the Company and others entitled thereto. Any member interested in obtaining such particulars may write to the Company Secretary at the registered office of the Company.
Acknowledgements
The Board greatly appreciates the commitment and dedication of employees at all levels who have contributed to the growth and success of the Company. We would also thank all our clients, vendors, investors, bankers and other business associates for their continued support and encouragement during the year.
We also thank the Government of India, Government of Karnataka, Min istry of Information Technology and Biotechnology, Ministry of Commerce and Industry, Ministry of Finance, Department of Scientific & Industrial Research, Customs and Excise Departments, Income Tax Department, CSEZ, LTU Bangalore and all other Government agencies for their support during the year and look forward to their continued support in the future.
For and on behalf of the Board
Kiran Mazumdar-Shaw John ShawChairman and Managing Director Vice Chairman
April 28, 2011
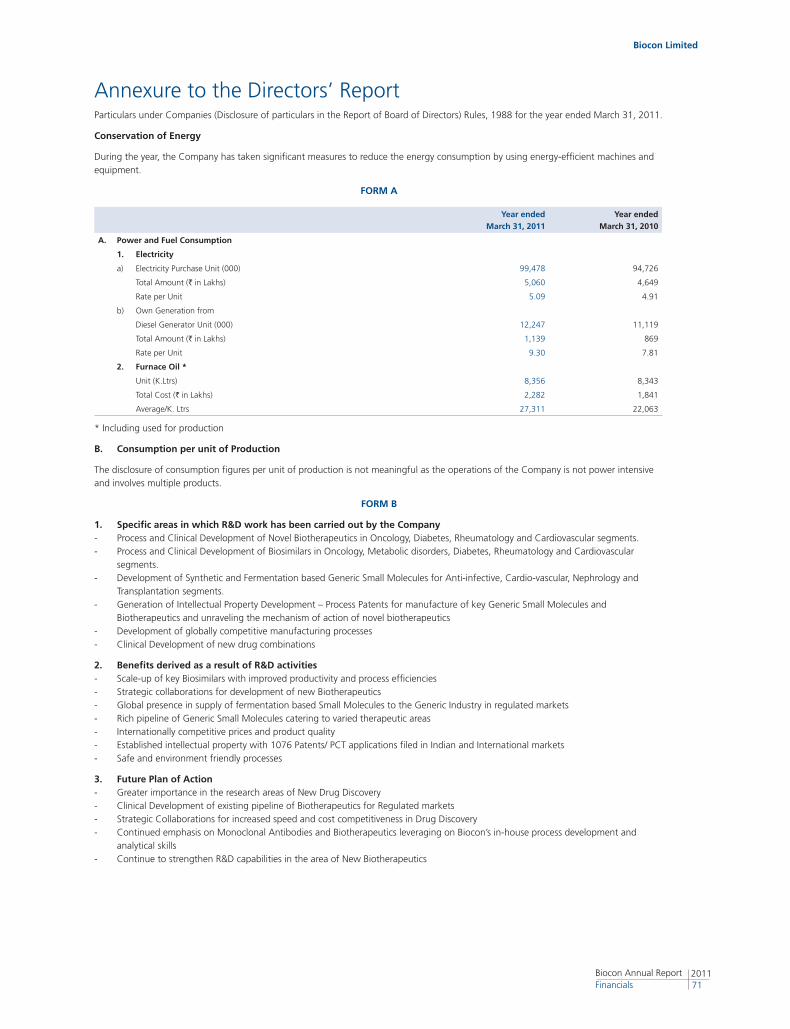
Biocon Limited
201171
Biocon Annual Report Financials
Annexure to the Directors’ ReportParticulars under Companies (Disclosure of particulars in the Report of Board of Directors) Rules, 1988 for the year ended March 31, 2011.
Conservation of Energy
During the year, the Company has taken significant measures to reduce the energy consumption by using energy-efficient machines and equipment.
FORM A
Year endedMarch 31, 2011
Year endedMarch 31, 2010
A. Power and Fuel Consumption
1. Electricity
a) Electricity Purchase Unit (000) 99,478 94,726
Total Amount (` in Lakhs) 5,060 4,649
Rate per Unit 5.09 4.91
b) Own Generation from
Diesel Generator Unit (000) 12,247 11,119
Total Amount (` in Lakhs) 1,139 869
Rate per Unit 9.30 7.81
2. Furnace Oil *
Unit (K.Ltrs) 8,356 8,343
Total Cost (` in Lakhs) 2,282 1,841
Average/K. Ltrs 27,311 22,063
* Including used for production
B. Consumption per unit of Production
The disclosure of consumption figures per unit of production is not meaningful as the operations of the Company is not power intensive and involves multiple products.
FORM B
1. Specific areas in which R&D work has been carried out by the Company- Process and Clinical Development of Novel Biotherapeutics in Oncology, Diabetes, Rheumatology and Cardiovascular segments.- Process and Clinical Development of Biosimilars in Oncology, Metabolic disorders, Diabetes, Rheumatology and Cardiovascular
segments.- Development of Synthetic and Fermentation based Generic Small Molecules for Anti-infective, Cardio-vascular, Nephrology and
Transplantation segments.- Generation of Intellectual Property Development – Process Patents for manufacture of key Generic Small Molecules and
Biotherapeutics and unraveling the mechanism of action of novel biotherapeutics- Development of globally competitive manufacturing processes- Clinical Development of new drug combinations
2. Benefits derived as a result of R&D activities- Scale-up of key Biosimilars with improved productivity and process efficiencies- Strategic collaborations for development of new Biotherapeutics- Global presence in supply of fermentation based Small Molecules to the Generic Industry in regulated markets- Rich pipeline of Generic Small Molecules catering to varied therapeutic areas- Internationally competitive prices and product quality- Established intellectual property with 1076 Patents/ PCT applications filed in Indian and International markets- Safe and environment friendly processes
3. Future Plan of Action- Greater importance in the research areas of New Drug Discovery- Clinical Development of existing pipeline of Biotherapeutics for Regulated markets- Strategic Collaborations for increased speed and cost competitiveness in Drug Discovery- Continued emphasis on Monoclonal Antibodies and Biotherapeutics leveraging on Biocon’s in-house process development and
analytical skills - Continue to strengthen R&D capabilities in the area of New Biotherapeutics
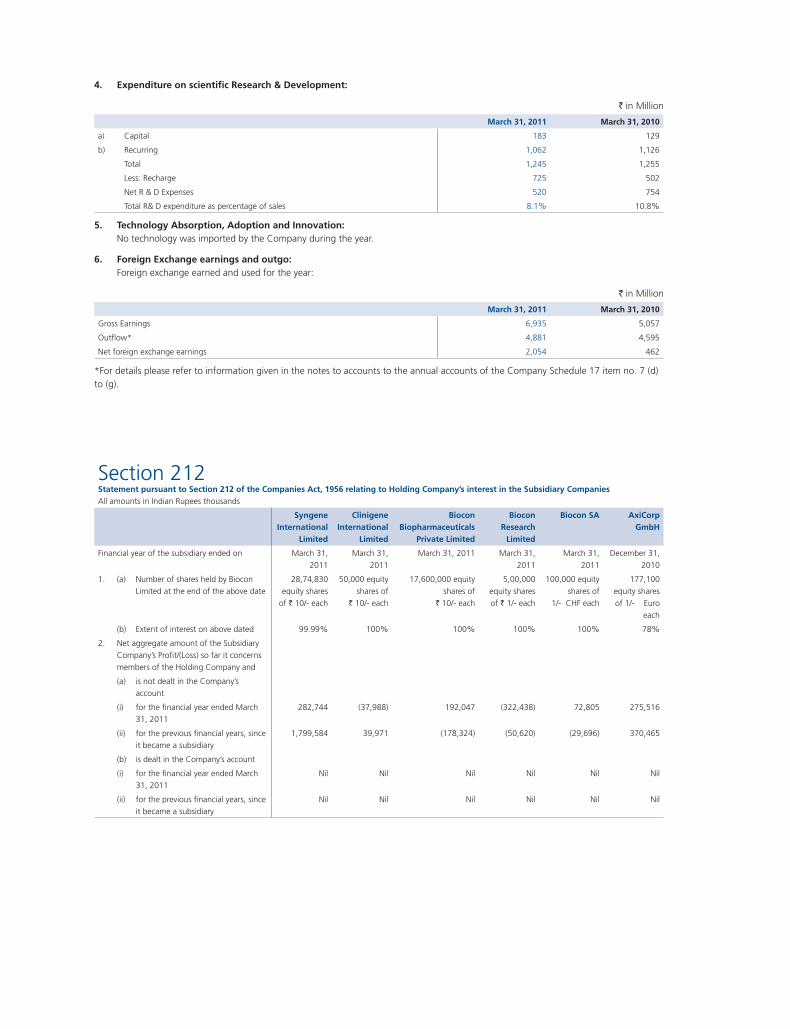
4. Expenditure on scientific Research & Development:
` in Million
March 31, 2011 March 31, 2010
a) Capital 183 129
b) Recurring 1,062 1,126
Total 1,245 1,255
Less: Recharge 725 502
Net R & D Expenses 520 754
Total R& D expenditure as percentage of sales 8.1% 10.8%
5. Technology Absorption, Adoption and Innovation: No technology was imported by the Company during the year.
6. Foreign Exchange earnings and outgo: Foreign exchange earned and used for the year:
` in Million
March 31, 2011 March 31, 2010
Gross Earnings 6,935 5,057
Outflow* 4,881 4,595
Net foreign exchange earnings 2,054 462
*For details please refer to information given in the notes to accounts to the annual accounts of the Company Schedule 17 item no. 7 (d) to (g).
Section 212Statement pursuant to Section 212 of the Companies Act, 1956 relating to Holding Company’s interest in the Subsidiary CompaniesAll amounts in Indian Rupees thousands
Syngene International
Limited
Clinigene International
Limited
Biocon Biopharmaceuticals
Private Limited
Biocon Research
Limited
Biocon SA AxiCorp GmbH
Financial year of the subsidiary ended on March 31,
2011
March 31,
2011
March 31, 2011 March 31,
2011
March 31,
2011
December 31,
2010
1. (a) Number of shares held by Biocon
Limited at the end of the above date
28,74,830
equity shares
of ` 10/- each
50,000 equity
shares of
` 10/- each
17,600,000 equity
shares of
` 10/- each
5,00,000
equity shares
of ` 1/- each
100,000 equity
shares of
1/- CHF each
177,100
equity shares
of 1/- Euro
each
(b) Extent of interest on above dated 99.99% 100% 100% 100% 100% 78%
2. Net aggregate amount of the Subsidiary
Company’s Profit/(Loss) so far it concerns
members of the Holding Company and
(a) is not dealt in the Company’s
account
(i) for the financial year ended March
31, 2011
282,744 (37,988) 192,047 (322,438) 72,805 275,516
(ii) for the previous financial years, since
it became a subsidiary
1,799,584 39,971 (178,324) (50,620) (29,696) 370,465
(b) is dealt in the Company’s account
(i) for the financial year ended March
31, 2011
Nil Nil Nil Nil Nil Nil
(ii) for the previous financial years, since
it became a subsidiary
Nil Nil Nil Nil Nil Nil
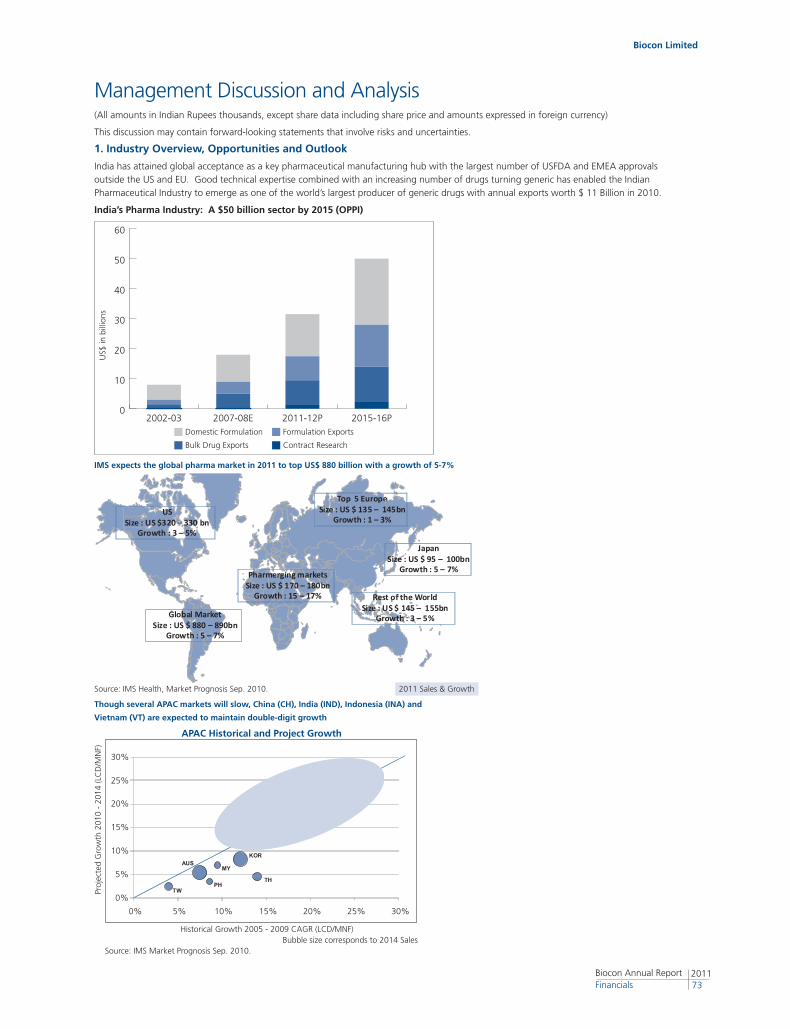
Biocon Limited
201173
Biocon Annual Report Financials
US Size : US $320 – 330 bn
Growth : 3 – 5%
Top 5 EuropeSize : US $ 135 – 145bn
Growth : 1 – 3%
JapanSize : US $ 95 – 100bn
Growth : 5 – 7%
Rest of the WorldSize : US $ 145 – 155bn
Growth : 3 – 5%
Pharmerging marketsSize : US $ 170 – 180bn
Growth : 15 – 17%
Global MarketSize : US $ 880 – 890bn
Growth : 5 – 7%
Management Discussion and Analysis(All amounts in Indian Rupees thousands, except share data including share price and amounts expressed in foreign currency)
This discussion may contain forward-looking statements that involve risks and uncertainties.
1. Industry Overview, Opportunities and Outlook
India has attained global acceptance as a key pharmaceutical manufacturing hub with the largest number of USFDA and EMEA approvals outside the US and EU. Good technical expertise combined with an increasing number of drugs turning generic has enabled the Indian Pharmaceutical Industry to emerge as one of the world’s largest producer of generic drugs with annual exports worth $ 11 Billion in 2010.
India’s Pharma Industry: A $50 billion sector by 2015 (OPPI)
0
10
20
30
40
50
60
2015-16P2011-12P2007-08E2002-03Domestic Formulation Formulation Exports
US$
in b
illio
ns
Bulk Drug Exports Contract Research
Though several APAC markets will slow, China (CH), India (IND), Indonesia (INA) and
Vietnam (VT) are expected to maintain double-digit growth
APAC Historical and Project Growth
Proj
ecte
d G
row
th 2
010
- 20
14 (L
CD
/MN
F)
Source: IMS Market Prognosis Sep. 2010.Bubble size corresponds to 2014 Sales
Historical Growth 2005 - 2009 CAGR (LCD/MNF)
Source: IMS Health, Market Prognosis Sep. 2010.
TWPH
TH
KOR
MY
INA
IND
AUS
VT
CH
0%
5%
10%
15%
20%
25%
30%
0% 5% 10% 15% 20% 25% 30%
IMS expects the global pharma market in 2011 to top US$ 880 billion with a growth of 5-7%
2011 Sales & Growth
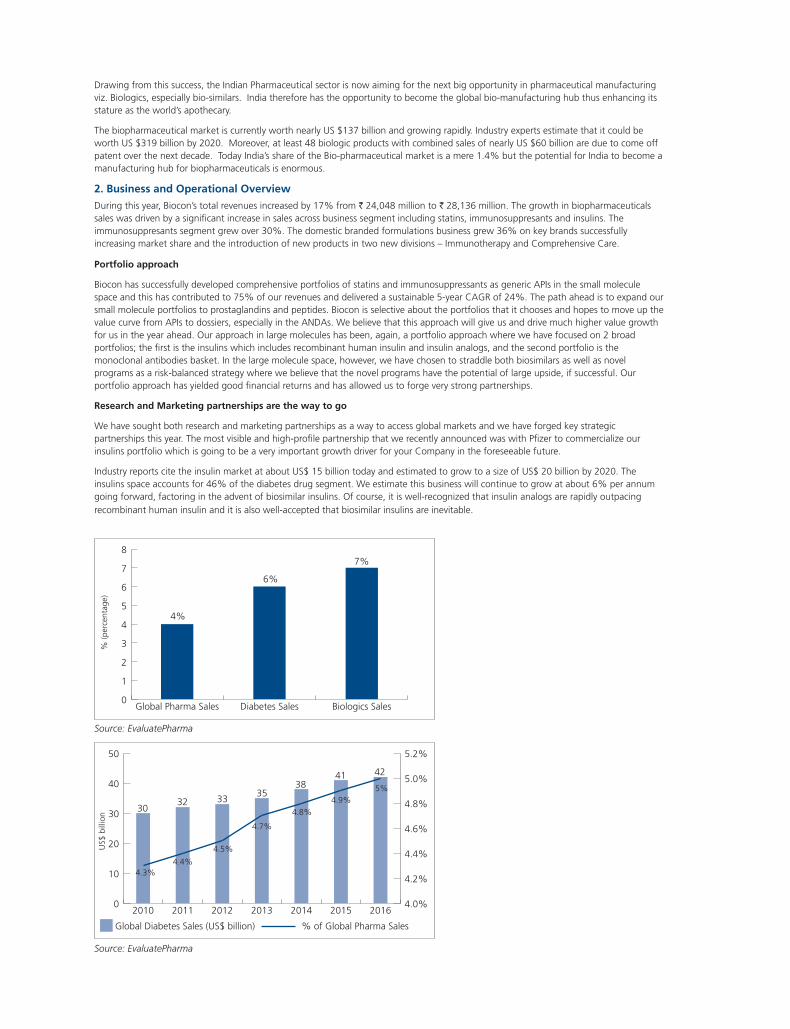
Drawing from this success, the Indian Pharmaceutical sector is now aiming for the next big opportunity in pharmaceutical manufacturing viz. Biologics, especially bio-similars. India therefore has the opportunity to become the global bio-manufacturing hub thus enhancing its stature as the world’s apothecary.
The biopharmaceutical market is currently worth nearly US $137 billion and growing rapidly. Industry experts estimate that it could be worth US $319 billion by 2020. Moreover, at least 48 biologic products with combined sales of nearly US $60 billion are due to come off patent over the next decade. Today India’s share of the Bio-pharmaceutical market is a mere 1.4% but the potential for India to become a manufacturing hub for biopharmaceuticals is enormous.
2. Business and Operational Overview
During this year, Biocon’s total revenues increased by 17% from ` 24,048 million to ` 28,136 million. The growth in biopharmaceuticals sales was driven by a significant increase in sales across business segment including statins, immunosuppresants and insulins. The immunosuppresants segment grew over 30%. The domestic branded formulations business grew 36% on key brands successfully increasing market share and the introduction of new products in two new divisions – Immunotherapy and Comprehensive Care.
Portfolio approach
Biocon has successfully developed comprehensive portfolios of statins and immunosuppressants as generic APIs in the small molecule space and this has contributed to 75% of our revenues and delivered a sustainable 5-year CAGR of 24%. The path ahead is to expand our small molecule portfolios to prostaglandins and peptides. Biocon is selective about the portfolios that it chooses and hopes to move up the value curve from APIs to dossiers, especially in the ANDAs. We believe that this approach will give us and drive much higher value growth for us in the year ahead. Our approach in large molecules has been, again, a portfolio approach where we have focused on 2 broad portfolios; the first is the insulins which includes recombinant human insulin and insulin analogs, and the second portfolio is the monoclonal antibodies basket. In the large molecule space, however, we have chosen to straddle both biosimilars as well as novel programs as a risk-balanced strategy where we believe that the novel programs have the potential of large upside, if successful. Our portfolio approach has yielded good financial returns and has allowed us to forge very strong partnerships.
Research and Marketing partnerships are the way to go
We have sought both research and marketing partnerships as a way to access global markets and we have forged key strategic partnerships this year. The most visible and high-profile partnership that we recently announced was with Pfizer to commercialize our insulins portfolio which is going to be a very important growth driver for your Company in the foreseeable future.
Industry reports cite the insulin market at about US$ 15 billion today and estimated to grow to a size of US$ 20 billion by 2020. The insulins space accounts for 46% of the diabetes drug segment. We estimate this business will continue to grow at about 6% per annum going forward, factoring in the advent of biosimilar insulins. Of course, it is well-recognized that insulin analogs are rapidly outpacing recombinant human insulin and it is also well-accepted that biosimilar insulins are inevitable.
Source: EvaluatePharma
% (p
erce
ntag
e)U
S$ b
illio
n
Source: EvaluatePharma
0
1
2
3
4
5
6
7
8
Biologics SalesDiabetes SalesGlobal Pharma Sales
4%
6%
7%
0
10
20
30
40
50
20162015201420132012201120104.0%
4.2%
4.4%
4.6%
4.8%
5.0%
5.2%
Global Diabetes Sales (US$ billion) % of Global Pharma Sales
3032 33
3538
41 42
4.3%4.4%
4.5%
4.7%
4.8%
4.9%5%
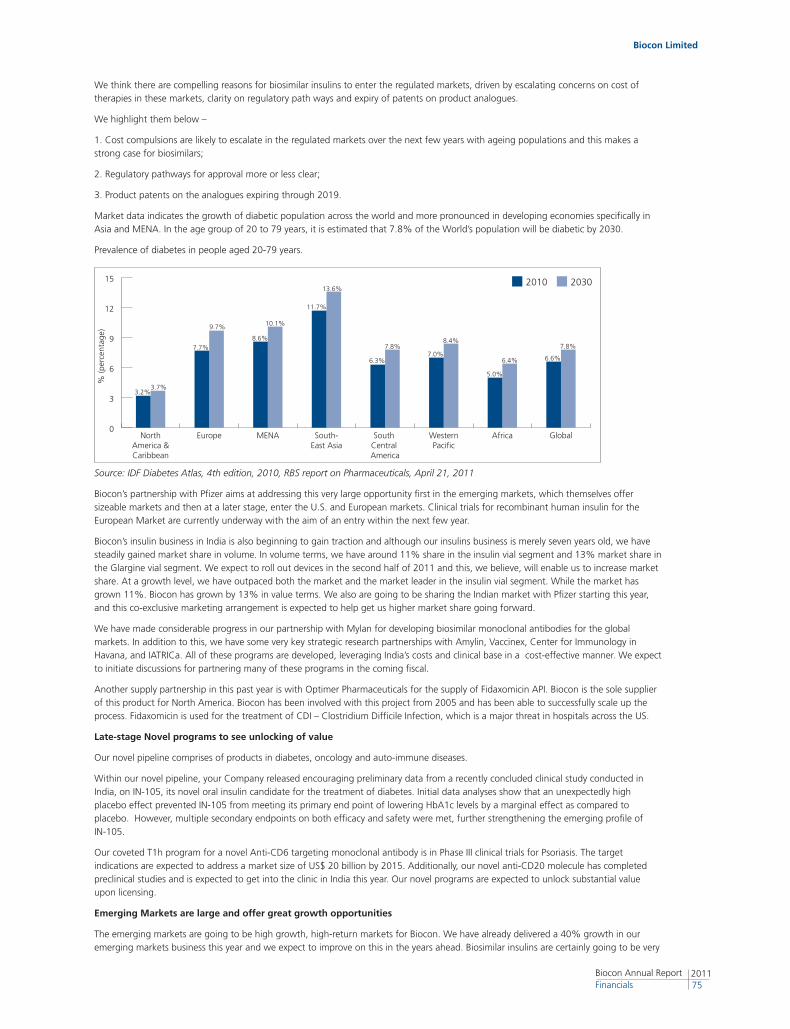
Biocon Limited
201175
Biocon Annual Report Financials
% (p
erce
ntag
e)
We think there are compelling reasons for biosimilar insulins to enter the regulated markets, driven by escalating concerns on cost of therapies in these markets, clarity on regulatory path ways and expiry of patents on product analogues.
We highlight them below –
1. Cost compulsions are likely to escalate in the regulated markets over the next few years with ageing populations and this makes a strong case for biosimilars;
2. Regulatory pathways for approval more or less clear;
3. Product patents on the analogues expiring through 2019.
Market data indicates the growth of diabetic population across the world and more pronounced in developing economies specifically in Asia and MENA. In the age group of 20 to 79 years, it is estimated that 7.8% of the World’s population will be diabetic by 2030.
Prevalence of diabetes in people aged 20-79 years.
Source: IDF Diabetes Atlas, 4th edition, 2010, RBS report on Pharmaceuticals, April 21, 2011
Biocon’s partnership with Pfizer aims at addressing this very large opportunity first in the emerging markets, which themselves offer sizeable markets and then at a later stage, enter the U.S. and European markets. Clinical trials for recombinant human insulin for the European Market are currently underway with the aim of an entry within the next few year.
Biocon’s insulin business in India is also beginning to gain traction and although our insulins business is merely seven years old, we have steadily gained market share in volume. In volume terms, we have around 11% share in the insulin vial segment and 13% market share in the Glargine vial segment. We expect to roll out devices in the second half of 2011 and this, we believe, will enable us to increase market share. At a growth level, we have outpaced both the market and the market leader in the insulin vial segment. While the market has grown 11%. Biocon has grown by 13% in value terms. We also are going to be sharing the Indian market with Pfizer starting this year, and this co-exclusive marketing arrangement is expected to help get us higher market share going forward.
We have made considerable progress in our partnership with Mylan for developing biosimilar monoclonal antibodies for the global markets. In addition to this, we have some very key strategic research partnerships with Amylin, Vaccinex, Center for Immunology in Havana, and IATRICa. All of these programs are developed, leveraging India’s costs and clinical base in a cost-effective manner. We expect to initiate discussions for partnering many of these programs in the coming fiscal.
Another supply partnership in this past year is with Optimer Pharmaceuticals for the supply of Fidaxomicin API. Biocon is the sole supplier of this product for North America. Biocon has been involved with this project from 2005 and has been able to successfully scale up the process. Fidaxomicin is used for the treatment of CDI – Clostridium Difficile Infection, which is a major threat in hospitals across the US.
Late-stage Novel programs to see unlocking of value
Our novel pipeline comprises of products in diabetes, oncology and auto-immune diseases.
Within our novel pipeline, your Company released encouraging preliminary data from a recently concluded clinical study conducted in India, on IN-105, its novel oral insulin candidate for the treatment of diabetes. Initial data analyses show that an unexpectedly high placebo effect prevented IN-105 from meeting its primary end point of lowering HbA1c levels by a marginal effect as compared to placebo. However, multiple secondary endpoints on both efficacy and safety were met, further strengthening the emerging profile of IN-105.
Our coveted T1h program for a novel Anti-CD6 targeting monoclonal antibody is in Phase III clinical trials for Psoriasis. The target indications are expected to address a market size of US$ 20 billion by 2015. Additionally, our novel anti-CD20 molecule has completed preclinical studies and is expected to get into the clinic in India this year. Our novel programs are expected to unlock substantial value upon licensing.
Emerging Markets are large and offer great growth opportunities
The emerging markets are going to be high growth, high-return markets for Biocon. We have already delivered a 40% growth in our emerging markets business this year and we expect to improve on this in the years ahead. Biosimilar insulins are certainly going to be very
0
3
6
9
12
15
GlobalAfricaWesternPacific
South Central America
South-East Asia
MENAEuropeNorthAmerica &Caribbean
2010 2030
3.2%3.7%
7.7%
9.7%
8.6%
10.1%
11.7%
13.6%
6.3%
7.8%7.0%
8.4%
5.0%
6.4% 6.6%
7.8%
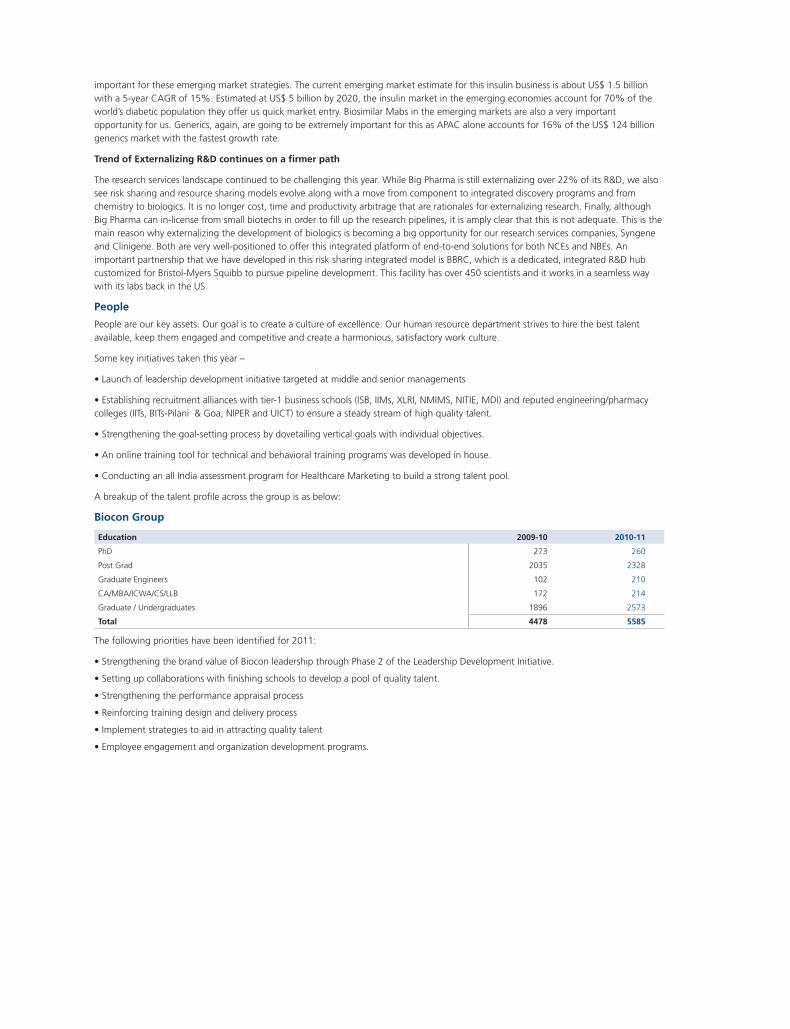
important for these emerging market strategies. The current emerging market estimate for this insulin business is about US$ 1.5 billion with a 5-year CAGR of 15%. Estimated at US$ 5 billion by 2020, the insulin market in the emerging economies account for 70% of the world’s diabetic population they offer us quick market entry. Biosimilar Mabs in the emerging markets are also a very important opportunity for us. Generics, again, are going to be extremely important for this as APAC alone accounts for 16% of the US$ 124 billion generics market with the fastest growth rate.
Trend of Externalizing R&D continues on a firmer path
The research services landscape continued to be challenging this year. While Big Pharma is still externalizing over 22% of its R&D, we also see risk sharing and resource sharing models evolve along with a move from component to integrated discovery programs and from chemistry to biologics. It is no longer cost, time and productivity arbitrage that are rationales for externalizing research. Finally, although Big Pharma can in-license from small biotechs in order to fill up the research pipelines, it is amply clear that this is not adequate. This is the main reason why externalizing the development of biologics is becoming a big opportunity for our research services companies, Syngene and Clinigene. Both are very well-positioned to offer this integrated platform of end-to-end solutions for both NCEs and NBEs. An important partnership that we have developed in this risk sharing integrated model is BBRC, which is a dedicated, integrated R&D hub customized for Bristol-Myers Squibb to pursue pipeline development. This facility has over 450 scientists and it works in a seamless way with its labs back in the US.
People
People are our key assets. Our goal is to create a culture of excellence. Our human resource department strives to hire the best talent available, keep them engaged and competitive and create a harmonious, satisfactory work culture.
Some key initiatives taken this year –
• Launch of leadership development initiative targeted at middle and senior managements
• Establishing recruitment alliances with tier-1 business schools (ISB, IIMs, XLRI, NMIMS, NITIE, MDI) and reputed engineering/pharmacy colleges (IITs, BITs-Pilani & Goa, NIPER and UICT) to ensure a steady stream of high quality talent.
• Strengthening the goal-setting process by dovetailing vertical goals with individual objectives.
• An online training tool for technical and behavioral training programs was developed in house.
• Conducting an all India assessment program for Healthcare Marketing to build a strong talent pool.
A breakup of the talent profile across the group is as below:
Biocon Group
Education 2009-10 2010-11
PhD 273 260
Post Grad 2035 2328
Graduate Engineers 102 210
CA/MBA/ICWA/CS/LLB 172 214
Graduate / Undergraduates 1896 2573
Total 4478 5585
The following priorities have been identified for 2011:
• Strengthening the brand value of Biocon leadership through Phase 2 of the Leadership Development Initiative.
• Setting up collaborations with finishing schools to develop a pool of quality talent.
• Strengthening the performance appraisal process
• Reinforcing training design and delivery process
• Implement strategies to aid in attracting quality talent
• Employee engagement and organization development programs.
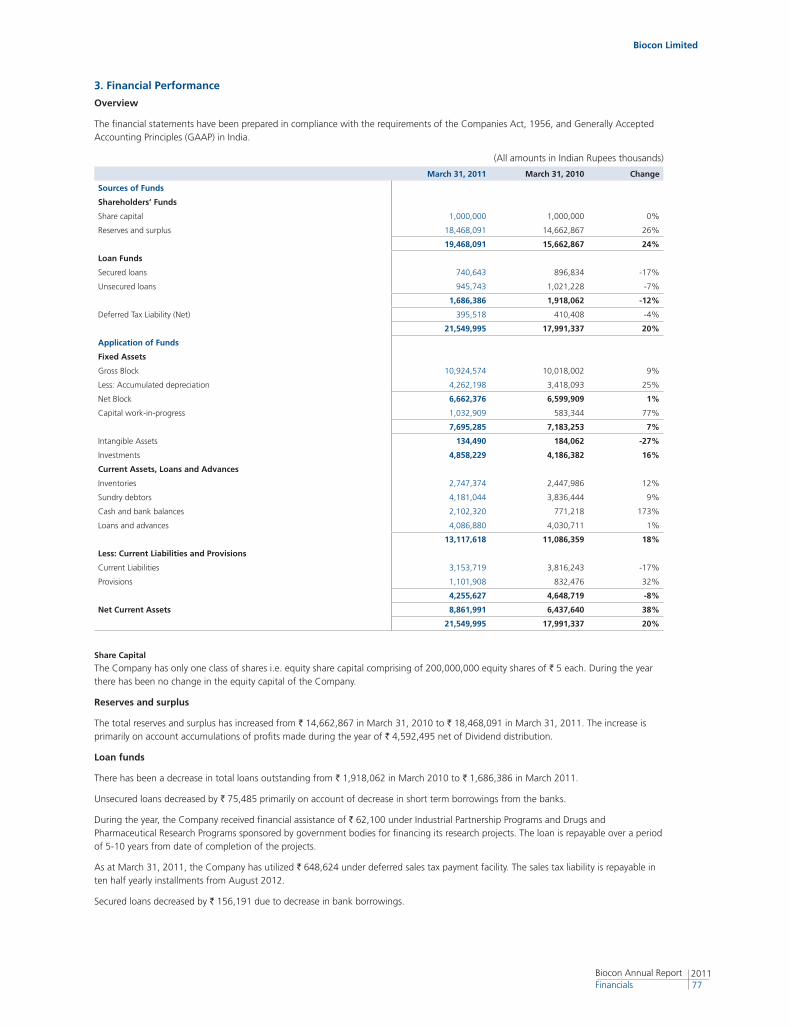
Biocon Limited
201177
Biocon Annual Report Financials
3. Financial Performance
Overview
The financial statements have been prepared in compliance with the requirements of the Companies Act, 1956, and Generally Accepted Accounting Principles (GAAP) in India.
(All amounts in Indian Rupees thousands)
March 31, 2011 March 31, 2010 Change
Sources of Funds
Shareholders’ Funds
Share capital 1,000,000 1,000,000 0%
Reserves and surplus 18,468,091 14,662,867 26%
19,468,091 15,662,867 24%
Loan Funds
Secured loans 740,643 896,834 -17%
Unsecured loans 945,743 1,021,228 -7%
1,686,386 1,918,062 -12%
Deferred Tax Liability (Net) 395,518 410,408 -4%
21,549,995 17,991,337 20%
Application of Funds
Fixed Assets
Gross Block 10,924,574 10,018,002 9%
Less: Accumulated depreciation 4,262,198 3,418,093 25%
Net Block 6,662,376 6,599,909 1%
Capital work-in-progress 1,032,909 583,344 77%
7,695,285 7,183,253 7%
Intangible Assets 134,490 184,062 -27%
Investments 4,858,229 4,186,382 16%
Current Assets, Loans and Advances
Inventories 2,747,374 2,447,986 12%
Sundry debtors 4,181,044 3,836,444 9%
Cash and bank balances 2,102,320 771,218 173%
Loans and advances 4,086,880 4,030,711 1%
13,117,618 11,086,359 18%
Less: Current Liabilities and Provisions
Current Liabilities 3,153,719 3,816,243 -17%
Provisions 1,101,908 832,476 32%
4,255,627 4,648,719 -8%
Net Current Assets 8,861,991 6,437,640 38%
21,549,995 17,991,337 20%
Share Capital
The Company has only one class of shares i.e. equity share capital comprising of 200,000,000 equity shares of ` 5 each. During the year there has been no change in the equity capital of the Company.
Reserves and surplus
The total reserves and surplus has increased from ` 14,662,867 in March 31, 2010 to ` 18,468,091 in March 31, 2011. The increase is primarily on account accumulations of profits made during the year of ` 4,592,495 net of Dividend distribution.
Loan funds
There has been a decrease in total loans outstanding from ` 1,918,062 in March 2010 to ` 1,686,386 in March 2011.
Unsecured loans decreased by ` 75,485 primarily on account of decrease in short term borrowings from the banks.
During the year, the Company received financial assistance of ` 62,100 under Industrial Partnership Programs and Drugs and Pharmaceutical Research Programs sponsored by government bodies for financing its research projects. The loan is repayable over a period of 5-10 years from date of completion of the projects.
As at March 31, 2011, the Company has utilized ` 648,624 under deferred sales tax payment facility. The sales tax liability is repayable in ten half yearly installments from August 2012.
Secured loans decreased by ` 156,191 due to decrease in bank borrowings.
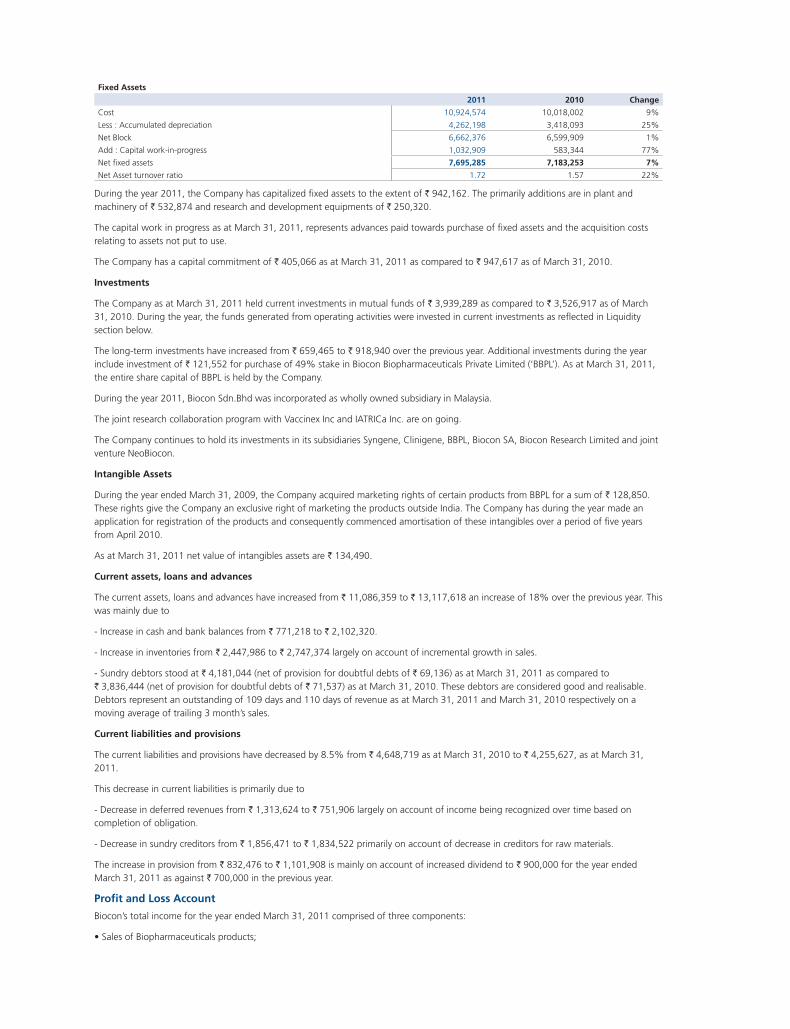
Fixed Assets
2011 2010 Change
Cost 10,924,574 10,018,002 9%
Less : Accumulated depreciation 4,262,198 3,418,093 25%
Net Block 6,662,376 6,599,909 1%
Add : Capital work-in-progress 1,032,909 583,344 77%
Net fixed assets 7,695,285 7,183,253 7%
Net Asset turnover ratio 1.72 1.57 22%
During the year 2011, the Company has capitalized fixed assets to the extent of ` 942,162. The primarily additions are in plant and machinery of ` 532,874 and research and development equipments of ` 250,320.
The capital work in progress as at March 31, 2011, represents advances paid towards purchase of fixed assets and the acquisition costs relating to assets not put to use.
The Company has a capital commitment of ` 405,066 as at March 31, 2011 as compared to ` 947,617 as of March 31, 2010.
Investments
The Company as at March 31, 2011 held current investments in mutual funds of ` 3,939,289 as compared to ` 3,526,917 as of March 31, 2010. During the year, the funds generated from operating activities were invested in current investments as reflected in Liquidity section below.
The long-term investments have increased from ` 659,465 to ` 918,940 over the previous year. Additional investments during the year include investment of ` 121,552 for purchase of 49% stake in Biocon Biopharmaceuticals Private Limited (‘BBPL’). As at March 31, 2011, the entire share capital of BBPL is held by the Company.
During the year 2011, Biocon Sdn.Bhd was incorporated as wholly owned subsidiary in Malaysia.
The joint research collaboration program with Vaccinex Inc and IATRICa Inc. are on going.
The Company continues to hold its investments in its subsidiaries Syngene, Clinigene, BBPL, Biocon SA, Biocon Research Limited and joint venture NeoBiocon.
Intangible Assets
During the year ended March 31, 2009, the Company acquired marketing rights of certain products from BBPL for a sum of ` 128,850. These rights give the Company an exclusive right of marketing the products outside India. The Company has during the year made an application for registration of the products and consequently commenced amortisation of these intangibles over a period of five years from April 2010.
As at March 31, 2011 net value of intangibles assets are ` 134,490.
Current assets, loans and advances
The current assets, loans and advances have increased from ` 11,086,359 to ` 13,117,618 an increase of 18% over the previous year. This was mainly due to
- Increase in cash and bank balances from ` 771,218 to ` 2,102,320.
- Increase in inventories from ` 2,447,986 to ` 2,747,374 largely on account of incremental growth in sales.
- Sundry debtors stood at ` 4,181,044 (net of provision for doubtful debts of ` 69,136) as at March 31, 2011 as compared to ` 3,836,444 (net of provision for doubtful debts of ` 71,537) as at March 31, 2010. These debtors are considered good and realisable. Debtors represent an outstanding of 109 days and 110 days of revenue as at March 31, 2011 and March 31, 2010 respectively on a moving average of trailing 3 month’s sales.
Current liabilities and provisions
The current liabilities and provisions have decreased by 8.5% from ` 4,648,719 as at March 31, 2010 to ` 4,255,627, as at March 31, 2011.
This decrease in current liabilities is primarily due to
- Decrease in deferred revenues from ` 1,313,624 to ` 751,906 largely on account of income being recognized over time based on completion of obligation.
- Decrease in sundry creditors from ` 1,856,471 to ` 1,834,522 primarily on account of decrease in creditors for raw materials.
The increase in provision from ` 832,476 to ` 1,101,908 is mainly on account of increased dividend to ` 900,000 for the year ended March 31, 2011 as against ` 700,000 in the previous year.
Profit and Loss Account
Biocon’s total income for the year ended March 31, 2011 comprised of three components:
• Sales of Biopharmaceuticals products;
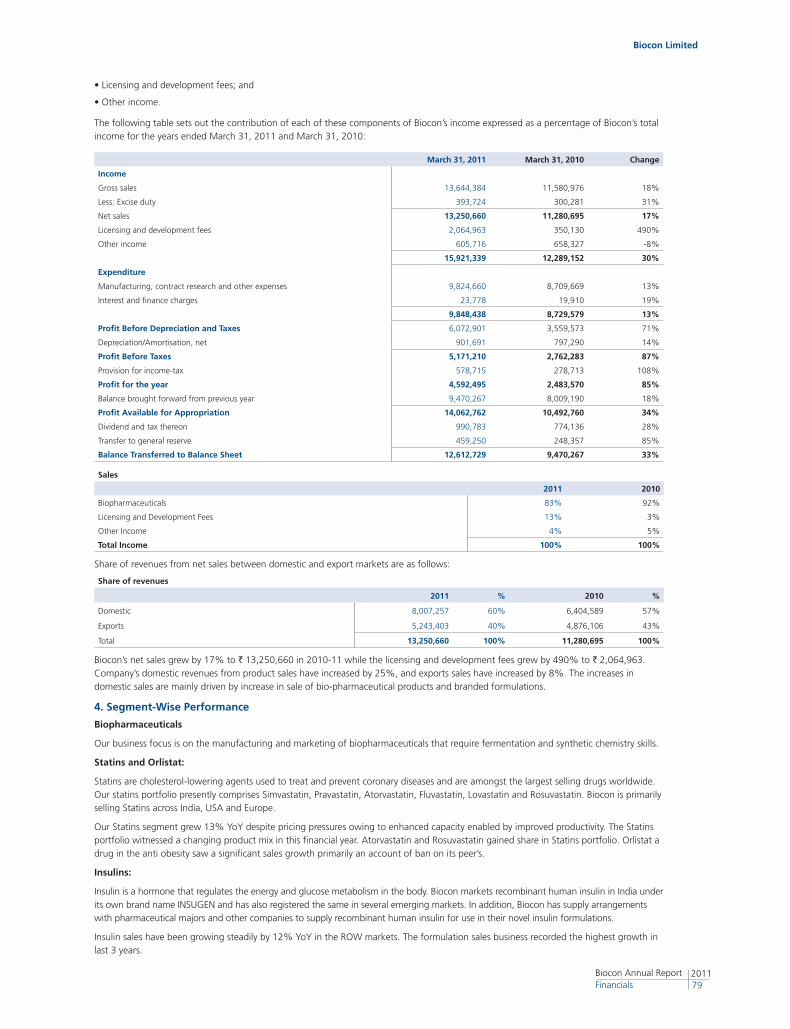
Biocon Limited
201179
Biocon Annual Report Financials
• Licensing and development fees; and
• Other income.
The following table sets out the contribution of each of these components of Biocon’s income expressed as a percentage of Biocon’s total income for the years ended March 31, 2011 and March 31, 2010:
March 31, 2011 March 31, 2010 Change
Income
Gross sales 13,644,384 11,580,976 18%
Less: Excise duty 393,724 300,281 31%
Net sales 13,250,660 11,280,695 17%
Licensing and development fees 2,064,963 350,130 490%
Other income 605,716 658,327 -8%
15,921,339 12,289,152 30%
Expenditure
Manufacturing, contract research and other expenses 9,824,660 8,709,669 13%
Interest and finance charges 23,778 19,910 19%
9,848,438 8,729,579 13%
Profit Before Depreciation and Taxes 6,072,901 3,559,573 71%
Depreciation/Amortisation, net 901,691 797,290 14%
Profit Before Taxes 5,171,210 2,762,283 87%
Provision for income-tax 578,715 278,713 108%
Profit for the year 4,592,495 2,483,570 85%
Balance brought forward from previous year 9,470,267 8,009,190 18%
Profit Available for Appropriation 14,062,762 10,492,760 34%
Dividend and tax thereon 990,783 774,136 28%
Transfer to general reserve 459,250 248,357 85%
Balance Transferred to Balance Sheet 12,612,729 9,470,267 33%
Sales
2011 2010
Biopharmaceuticals 83% 92%
Licensing and Development Fees 13% 3%
Other Income 4% 5%
Total Income 100% 100%
Share of revenues from net sales between domestic and export markets are as follows:
Share of revenues
2011 % 2010 %
Domestic 8,007,257 60% 6,404,589 57%
Exports 5,243,403 40% 4,876,106 43%
Total 13,250,660 100% 11,280,695 100%
Biocon’s net sales grew by 17% to ` 13,250,660 in 2010-11 while the licensing and development fees grew by 490% to ` 2,064,963. Company’s domestic revenues from product sales have increased by 25%, and exports sales have increased by 8%. The increases in domestic sales are mainly driven by increase in sale of bio-pharmaceutical products and branded formulations.
4. Segment-Wise Performance
Biopharmaceuticals
Our business focus is on the manufacturing and marketing of biopharmaceuticals that require fermentation and synthetic chemistry skills.
Statins and Orlistat:
Statins are cholesterol-lowering agents used to treat and prevent coronary diseases and are amongst the largest selling drugs worldwide. Our statins portfolio presently comprises Simvastatin, Pravastatin, Atorvastatin, Fluvastatin, Lovastatin and Rosuvastatin. Biocon is primarily selling Statins across India, USA and Europe.
Our Statins segment grew 13% YoY despite pricing pressures owing to enhanced capacity enabled by improved productivity. The Statins portfolio witnessed a changing product mix in this financial year. Atorvastatin and Rosuvastatin gained share in Statins portfolio. Orlistat a drug in the anti obesity saw a significant sales growth primarily an account of ban on its peer’s.
Insulins:
Insulin is a hormone that regulates the energy and glucose metabolism in the body. Biocon markets recombinant human insulin in India under its own brand name INSUGEN and has also registered the same in several emerging markets. In addition, Biocon has supply arrangements with pharmaceutical majors and other companies to supply recombinant human insulin for use in their novel insulin formulations.
Insulin sales have been growing steadily by 12% YoY in the ROW markets. The formulation sales business recorded the highest growth in last 3 years.
Immunosuppressants:
Immunosuppressants prevent organ and tissue rejection in transplants and require high technology based manufacturing capabilities. Currently Biocon produces mycophenolate mofetil (MMF), sirolimus and tacrolimus.
This segment posted a 35% YoY growth driven by patent expiry despite pricing pressures.
Branded Formulations:
Branded formulations are finished dosages currently sold in India and emerging market geographies. Our Company is present in six therapeutic areas – Diabetology, Oncology, Cardiology, Nephrology, Dermatology and Comprehensive Care. Branded formulations grew 36% YoY on the back of strong sales in diabetology and oncology segments.
Our Company is positioning itself as a key player in diabetes therapy on a global scale. There was significant revival in the insulins franchise both in the Insugen and Basalog. The launch of Insugen 100, the global standard, has been widely accepted by diabetic fraternity. Biocon has focused its efforts to improving diabetes care in India through an awareness campaign on monitoring and control of blood glucose and early detection of the disease.
The Comprehensive Care and immunology division was launched in the current fiscal with a vision of providing quality and affordable therapy in the critical care segment.
Biocon’s pipeline of innovative and biosimilar molecules as well as marketing partnerships will be the driving force to expand in India and other markets in the years to come.
The Biocon’s formulation division dedicated marketing team of over 1,100 people for the finished dosages business.
5. Other Financial Data
Licensing and Development Fees
These fees represent income received by Biocon towards transfer of proprietary technology with respect to certain bio-generics under long-term contracts and out-licensing its proprietary products. During the year, the Company has a registered licensing income of ` 2,064,963, an increase of ` 1,714,833 as compared to previous year. This includes transfer of certain intangible to subsidiary within the group.
Other Income
The Other income has registered a decrease of 8% compared to the previous year. Other income consists primarily of dividend income from investments amounting to ` 167,114 as compared to ` 98,604 in fiscal 2010. It also includes cross charge of utility and other common costs towards use of Biocon Park facility (SEZ Developer) to subsidiaries which has decreased from ` 336,046 in the fiscal 2010 to ` 297,690 in the fiscal 2011.
Material costs
Materials costs have increased by 17% from ` 5,472,390 to ` 6,392,513 over the previous year. As a percentage of sales, the material cost has remained constant at 48% YoY.
Employee costs
Staff cost comprises:
• Salaries, wages, allowances and bonuses;
• Contributions to provident fund;
• Gratuity and leave provisions;
• Amortisation of Employees stock compensation expenses; and
• Welfare expenses (including employee insurance schemes)
Staff costs have increased from ` 997,275 for the fiscal year 2010 to ` 1,460,020 for the fiscal year 2011. The increase in employee costs is due to
a) Staff increment which was 15% YoY.
b) Addition of employees.
Operating and other expenses
Operating and other expenses comprises traveling and conveyance; communication; professional charges; power and fuel; lab consumables; repairs and maintenance; selling expenses like freight outwards; sales promotion and commissions; research and development costs, provision for doubtful debts; exchange fluctuations and other general expenses.
Operating and other expenses have decreased by 12% from ` 2,240,004 for the year 2010 to ` 1,972,127 for the year 2011 mainly on account of
a) Foreign exchange gain of ` 262,377 as compared to loss of ` 33,179 in the previous fiscal.
b) 16% decrease in professional charges from ` 175,928 to ` 148,242
c) The decrease is offset by a 41% increase in selling expenses from ` 401,733 to ` 564,493 primarily on account of increase in freight charges; and
d) 21% increase in power charges from ` 672,485 to ` 816,291and 19% increase in repair and maintenance charges from ` 280,911 to ` 334,686.
Interest and Finance Charges
Interest and finance charges have increased from ` 19,910 in fiscal 2010 to ` 23,778 in fiscal 2011 due to increase in bank charges.
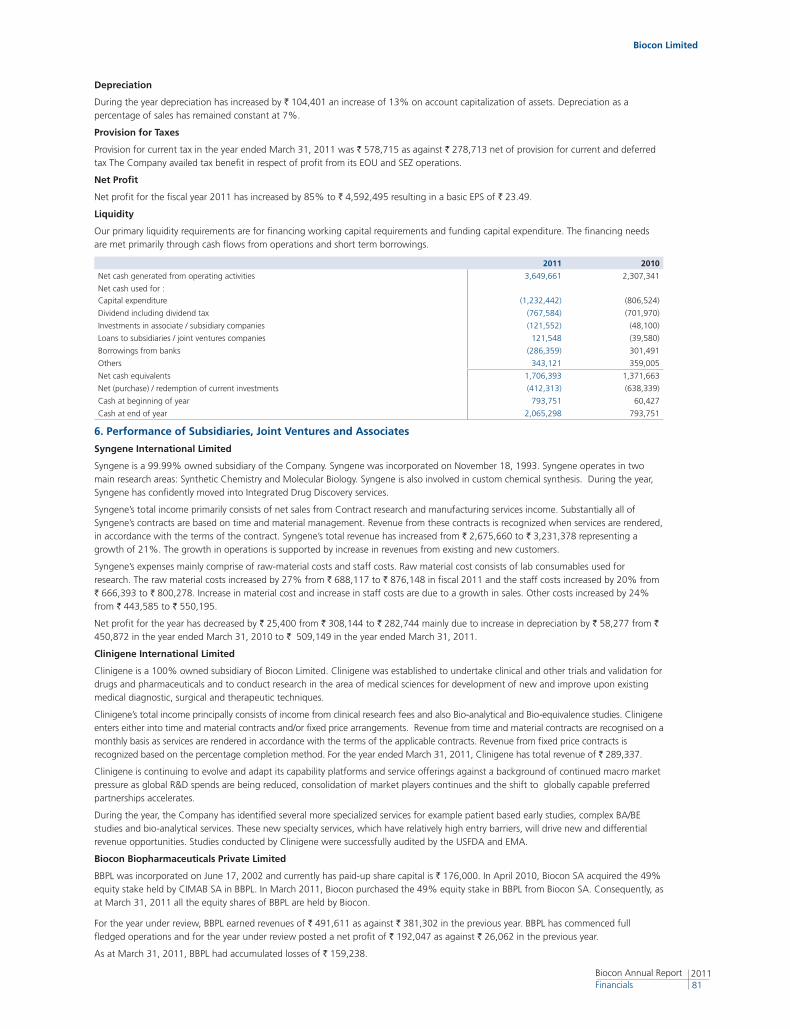
Biocon Limited
201181
Biocon Annual Report Financials
Depreciation
During the year depreciation has increased by ` 104,401 an increase of 13% on account capitalization of assets. Depreciation as a percentage of sales has remained constant at 7%.
Provision for Taxes
Provision for current tax in the year ended March 31, 2011 was ` 578,715 as against ` 278,713 net of provision for current and deferred tax The Company availed tax benefit in respect of profit from its EOU and SEZ operations.
Net Profit
Net profit for the fiscal year 2011 has increased by 85% to ` 4,592,495 resulting in a basic EPS of ` 23.49.
Liquidity
Our primary liquidity requirements are for financing working capital requirements and funding capital expenditure. The financing needs are met primarily through cash flows from operations and short term borrowings.
2011 2010
Net cash generated from operating activities 3,649,661 2,307,341
Net cash used for :
Capital expenditure
(1,232,442) (806,524)
Dividend including dividend tax (767,584) (701,970)
Investments in associate / subsidiary companies (121,552) (48,100)
Loans to subsidiaries / joint ventures companies 121,548 (39,580)
Borrowings from banks (286,359) 301,491
Others 343,121 359,005
Net cash equivalents 1,706,393 1,371,663
Net (purchase) / redemption of current investments (412,313) (638,339)
Cash at beginning of year 793,751 60,427
Cash at end of year 2,065,298 793,751
6. Performance of Subsidiaries, Joint Ventures and Associates
Syngene International Limited
Syngene is a 99.99% owned subsidiary of the Company. Syngene was incorporated on November 18, 1993. Syngene operates in two main research areas: Synthetic Chemistry and Molecular Biology. Syngene is also involved in custom chemical synthesis. During the year, Syngene has confidently moved into Integrated Drug Discovery services.
Syngene’s total income primarily consists of net sales from Contract research and manufacturing services income. Substantially all of Syngene’s contracts are based on time and material management. Revenue from these contracts is recognized when services are rendered, in accordance with the terms of the contract. Syngene’s total revenue has increased from ` 2,675,660 to ` 3,231,378 representing a growth of 21%. The growth in operations is supported by increase in revenues from existing and new customers.
Syngene’s expenses mainly comprise of raw-material costs and staff costs. Raw material cost consists of lab consumables used for research. The raw material costs increased by 27% from ` 688,117 to ` 876,148 in fiscal 2011 and the staff costs increased by 20% from ` 666,393 to ` 800,278. Increase in material cost and increase in staff costs are due to a growth in sales. Other costs increased by 24% from ` 443,585 to ` 550,195.
Net profit for the year has decreased by ` 25,400 from ` 308,144 to ` 282,744 mainly due to increase in depreciation by ` 58,277 from `
450,872 in the year ended March 31, 2010 to ` 509,149 in the year ended March 31, 2011.
Clinigene International Limited
Clinigene is a 100% owned subsidiary of Biocon Limited. Clinigene was established to undertake clinical and other trials and validation for drugs and pharmaceuticals and to conduct research in the area of medical sciences for development of new and improve upon existing medical diagnostic, surgical and therapeutic techniques.
Clinigene’s total income principally consists of income from clinical research fees and also Bio-analytical and Bio-equivalence studies. Clinigene enters either into time and material contracts and/or fixed price arrangements. Revenue from time and material contracts are recognised on a monthly basis as services are rendered in accordance with the terms of the applicable contracts. Revenue from fixed price contracts is recognized based on the percentage completion method. For the year ended March 31, 2011, Clinigene has total revenue of ` 289,337.
Clinigene is continuing to evolve and adapt its capability platforms and service offerings against a background of continued macro market pressure as global R&D spends are being reduced, consolidation of market players continues and the shift to globally capable preferred partnerships accelerates.
During the year, the Company has identified several more specialized services for example patient based early studies, complex BA/BE studies and bio-analytical services. These new specialty services, which have relatively high entry barriers, will drive new and differential revenue opportunities. Studies conducted by Clinigene were successfully audited by the USFDA and EMA.
Biocon Biopharmaceuticals Private Limited
BBPL was incorporated on June 17, 2002 and currently has paid-up share capital is ` 176,000. In April 2010, Biocon SA acquired the 49% equity stake held by CIMAB SA in BBPL. In March 2011, Biocon purchased the 49% equity stake in BBPL from Biocon SA. Consequently, as at March 31, 2011 all the equity shares of BBPL are held by Biocon.
For the year under review, BBPL earned revenues of ` 491,611 as against ` 381,302 in the previous year. BBPL has commenced full fledged operations and for the year under review posted a net profit of ` 192,047 as against ` 26,062 in the previous year.
As at March 31, 2011, BBPL had accumulated losses of ` 159,238.
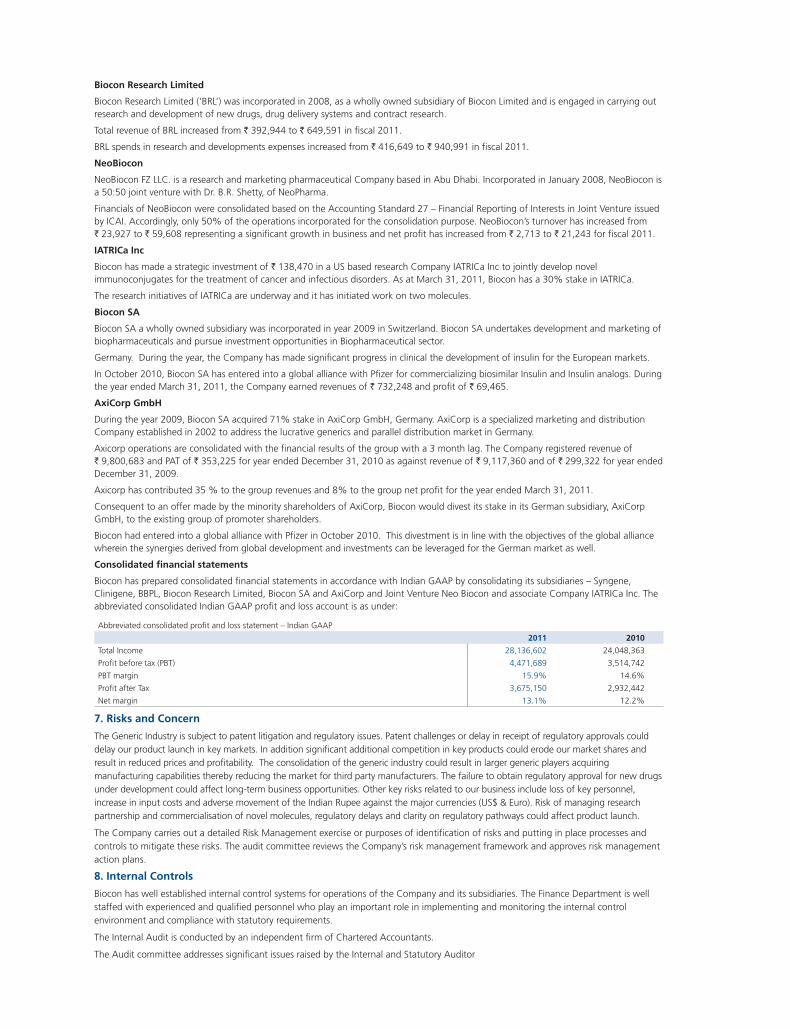
Biocon Research Limited
Biocon Research Limited (‘BRL’) was incorporated in 2008, as a wholly owned subsidiary of Biocon Limited and is engaged in carrying out research and development of new drugs, drug delivery systems and contract research.
Total revenue of BRL increased from ` 392,944 to ` 649,591 in fiscal 2011.
BRL spends in research and developments expenses increased from ` 416,649 to ` 940,991 in fiscal 2011.
NeoBiocon
NeoBiocon FZ LLC. is a research and marketing pharmaceutical Company based in Abu Dhabi. Incorporated in January 2008, NeoBiocon is a 50:50 joint venture with Dr. B.R. Shetty, of NeoPharma.
Financials of NeoBiocon were consolidated based on the Accounting Standard 27 – Financial Reporting of Interests in Joint Venture issued by ICAI. Accordingly, only 50% of the operations incorporated for the consolidation purpose. NeoBiocon’s turnover has increased from ` 23,927 to ` 59,608 representing a significant growth in business and net profit has increased from ` 2,713 to ` 21,243 for fiscal 2011.
IATRICa Inc
Biocon has made a strategic investment of ` 138,470 in a US based research Company IATRICa Inc to jointly develop novel immunoconjugates for the treatment of cancer and infectious disorders. As at March 31, 2011, Biocon has a 30% stake in IATRICa.
The research initiatives of IATRICa are underway and it has initiated work on two molecules.
Biocon SA
Biocon SA a wholly owned subsidiary was incorporated in year 2009 in Switzerland. Biocon SA undertakes development and marketing of biopharmaceuticals and pursue investment opportunities in Biopharmaceutical sector.
Germany. During the year, the Company has made significant progress in clinical the development of insulin for the European markets.
In October 2010, Biocon SA has entered into a global alliance with Pfizer for commercializing biosimilar Insulin and Insulin analogs. During the year ended March 31, 2011, the Company earned revenues of ` 732,248 and profit of ` 69,465.
AxiCorp GmbH
During the year 2009, Biocon SA acquired 71% stake in AxiCorp GmbH, Germany. AxiCorp is a specialized marketing and distribution Company established in 2002 to address the lucrative generics and parallel distribution market in Germany.
Axicorp operations are consolidated with the financial results of the group with a 3 month lag. The Company registered revenue of ` 9,800,683 and PAT of ` 353,225 for year ended December 31, 2010 as against revenue of ` 9,117,360 and of ` 299,322 for year ended December 31, 2009.
Axicorp has contributed 35 % to the group revenues and 8% to the group net profit for the year ended March 31, 2011.
Consequent to an offer made by the minority shareholders of AxiCorp, Biocon would divest its stake in its German subsidiary, AxiCorp GmbH, to the existing group of promoter shareholders.
Biocon had entered into a global alliance with Pfizer in October 2010. This divestment is in line with the objectives of the global alliance wherein the synergies derived from global development and investments can be leveraged for the German market as well.
Consolidated financial statements
Biocon has prepared consolidated financial statements in accordance with Indian GAAP by consolidating its subsidiaries – Syngene, Clinigene, BBPL, Biocon Research Limited, Biocon SA and AxiCorp and Joint Venture Neo Biocon and associate Company IATRICa Inc. The abbreviated consolidated Indian GAAP profit and loss account is as under:
Abbreviated consolidated profit and loss statement – Indian GAAP
2011 2010
Total Income 28,136,602 24,048,363
Profit before tax (PBT) 4,471,689 3,514,742
PBT margin 15.9% 14.6%
Profit after Tax 3,675,150 2,932,442
Net margin 13.1% 12.2%
7. Risks and Concern
The Generic Industry is subject to patent litigation and regulatory issues. Patent challenges or delay in receipt of regulatory approvals could delay our product launch in key markets. In addition significant additional competition in key products could erode our market shares and result in reduced prices and profitability. The consolidation of the generic industry could result in larger generic players acquiring manufacturing capabilities thereby reducing the market for third party manufacturers. The failure to obtain regulatory approval for new drugs under development could affect long-term business opportunities. Other key risks related to our business include loss of key personnel, increase in input costs and adverse movement of the Indian Rupee against the major currencies (US$ & Euro). Risk of managing research partnership and commercialisation of novel molecules, regulatory delays and clarity on regulatory pathways could affect product launch.
The Company carries out a detailed Risk Management exercise or purposes of identification of risks and putting in place processes and controls to mitigate these risks. The audit committee reviews the Company’s risk management framework and approves risk management action plans.
8. Internal Controls
Biocon has well established internal control systems for operations of the Company and its subsidiaries. The Finance Department is well staffed with experienced and qualified personnel who play an important role in implementing and monitoring the internal control environment and compliance with statutory requirements.
The Internal Audit is conducted by an independent firm of Chartered Accountants.
The Audit committee addresses significant issues raised by the Internal and Statutory Auditor
Biocon Limited
201183
Biocon Annual Report Financials
Corporate Governance ReportThe detailed report on Corporate Governance for the financial year from April 1, 2010 to March 31, 2011, as per the format prescribed by Securities and Exchange Board of India (SEBI) and incorporated in the revised Clause 49 of the Listing Agreement is set out below:
1. Company's philosophy on Corporate Governance:
Biocon is committed to doing business in an efficient, responsible, honest and ethical manner. Good corporate governance goes beyond compliance and involves a Company wide commitment. This commitment starts with the Board of Directors, which executes its corporate governance responsibilities by focusing on the Company's strategic and operational excellence in the best interests of all our stakeholders, in particular, shareholders, employees and our customers in a balanced fashion with long-term benefits to all.
The core values of the Company’s governance process include independence, integrity, accountability, transparency, responsibility and fairness. The business policies are based on ethical conduct, health, safety and a commitment to building long-term sustainable relationships.
Biocon is committed to continually evolving and adopting appropriate corporate governance best practices.
2. Board of Directors:
2. i. Composition:The Board of Directors comprises seven members including two executive directors, five non-executive directors, of which four are independent directors. Dr. Kiran Mazumdar-Shaw is the Chairman and Managing Director (CMD) of the Company and Mr. John Shaw is the Vice-Chairman. Dr. Kiran Mazumdar-Shaw and Mr. John Shaw conduct the day-to-day management of the Company, subject to the supervision and control of the Board of Directors. The independent directors on the Board are scientists, professionals and technocrats who are senior, competent and highly respected persons from their respective fields. The brief profile of the Company's Board of Directors is as under:
Dr. Kiran Mazumdar-Shaw, 58 years, Chairman and Managing Director, is a first generation entrepreneur with more than 33 years’ experience in the field of biotechnology. After graduating in B.Sc. (Zoology Hons.) from Bangalore University in 1973, she completed her post-graduate degree in malting and brewing from Ballarat College, Melbourne University in 1975. She has been awarded with several honorary degrees including Honorary Doctorate of Science from Ballarat University, in recognition of pre-eminent contribution to the field of Biotechnology, 2004, Doctor of Technology from the University of Abertay Dundee, 2007, Doctor of Science from the University of Glasgow, 2008 and Doctor of Science from the Heriot-Watt University, Edinburgh, 2008. She is a founder promoter and has led the Company since its inception in 1978. She is the recipient of several awards, the most noteworthy being the ‘Padmabhushan’ Award (one of the highest civilian awards in India) in 2005 conferred by the President of India, the Nikkei Asia Prize, 2009 for Regional Growth, Express Pharmaceutical Leadership Summit Award 2009 for Dynamic Entrepreneur, the Economic Times ‘Businesswoman of the Year’, the ‘Veuve Clicquot Initiative for Economic Development For Asia, Ernst & Young's Entrepreneur of the Year Award for Life Sciences & Healthcare, ‘Technology Pioneer’ recognition by World Economic Forum and The Indian Chamber of Commerce Lifetime Achievement Award. She heads several biotechnology task forces including the Karnataka Vision Group on Biotechnology, an initiative by the Government of Karnataka and the National Taskforce on Biotechnology for the Confederation of Indian Industry (CII). She is a member of the Prime Minister’s Council on Trade and Industry and also serves as a Member, Governing Body and General Body of the Indian Pharmacopoeia Commission, an Autonomous Body of the Government of India. She has been nominated as a Member of the Board of Trade, Directorate General of Foreign Trade, Ministry of Commerce & Industry.
Mr. John Shaw, 62 years, Vice Chairman, is a foreign promoter and a whole-time director of the Company. He is also a controlling shareholder and director of Glentec International. He completed his M.A. (Economic Hons.) in History and Political Economy from Glasgow University, U.K. in 1970. He had 27 years’ experience with Coats Viyella plc. in various capacities including finance and general administration. He had served as Finance Director and Managing Director of Coats Viyella group companies in various locations around the world, before he came on the Board of Biocon Limited in 1999.
Dr. Neville Bain, 70 years, has vast experience in the field of finance, strategy and general management. He graduated from Otago University, New Zealand, with a Master of Commerce (Hons) degree and double Bachelor degrees in Accounting and Economics. He has also been awarded the degree of Doctor of Law, is a Fellow Chartered Accountant, a Fellow Cost and Management Accountant, a Fellow Chartered Secretary and a Fellow of the Institute of Directors. He spent 27 years with the Cadbury Schweppes group, having responsibility for the world-wide confectionery business and then as Deputy Chief Executive and Finance Director. This was followed by a six-year term as Chief Executive Officer of Coats Viyella plc, and then as Chairman and Director of various organisations. He is the Chairman of the UK Institute of Directors, a Chairman of the Board of Scottish Newcastle Pension Trustees Limited as well as Hogg Robinson Group. He has published 5 books on corporate governance, strategy and the effective utilisation of people in organisations.
Prof. Charles Cooney, 67 years, is the Professor of Chemical & Biochemical Engineering, Faculty Director of the Deshpande Center for Technological Innovation. He obtained his Bachelor’s degree in Chemical Engineering from the University of Pennsylvania in 1966, his Master’s degree and his Ph.D. in Biochemical Engineering from MIT in 1967 and 1970 respectively. His research interests span topics in biochemical engineering and pharmaceutical manufacturing. He is a recipient of several prestigious awards, including Gold Medal of the Institute of Biotechnology Studies (London), the Food, Pharmaceutical and Bioengineering Award from the American Institute of Chemical Engineers and the James Van Lanen Distinguished Service Award from the American Chemical Society. He serves as a consultant to and director of a number of biotech and pharmaceutical companies globally and is on the editorial boards of several professional journals.
Mr. Suresh Talwar, 72 years, is a partner in Talwar Thakore & Associates, a law firm of repute. He completed his B.Com from the University of Bombay in 1959, his LL.B. from the Government Law College, Bombay in 1961 and is a solicitor of the Incorporated Law
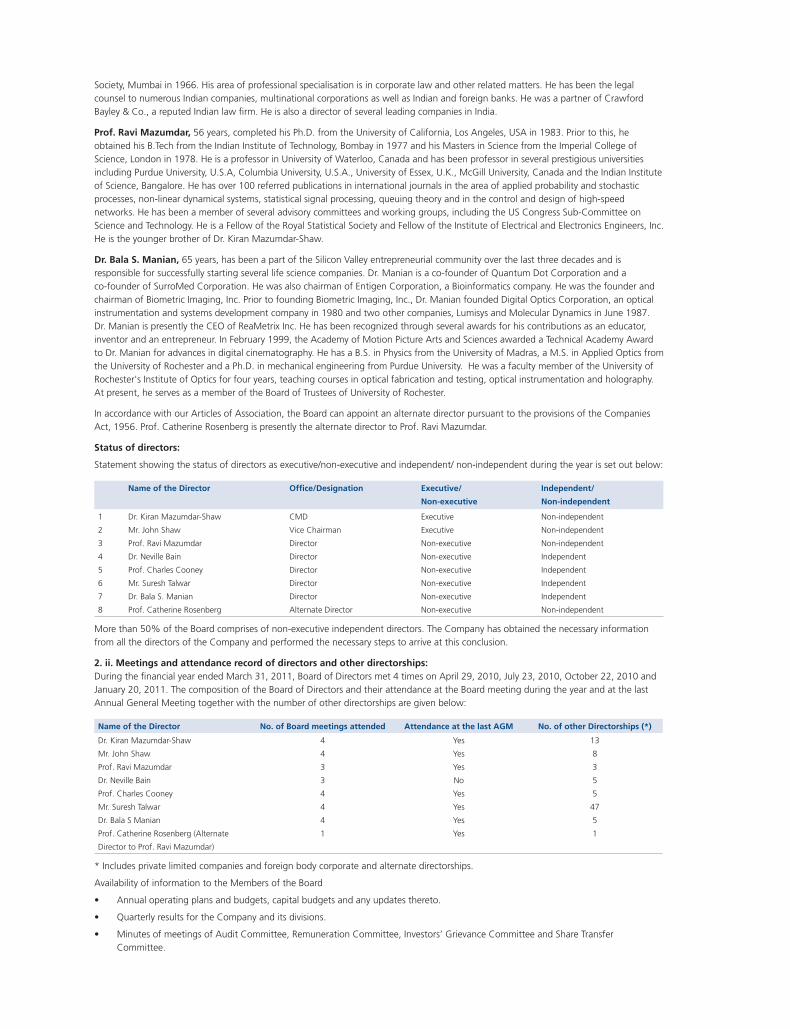
Society, Mumbai in 1966. His area of professional specialisation is in corporate law and other related matters. He has been the legal counsel to numerous Indian companies, multinational corporations as well as Indian and foreign banks. He was a partner of Crawford Bayley & Co., a reputed Indian law firm. He is also a director of several leading companies in India.
Prof. Ravi Mazumdar, 56 years, completed his Ph.D. from the University of California, Los Angeles, USA in 1983. Prior to this, he obtained his B.Tech from the Indian Institute of Technology, Bombay in 1977 and his Masters in Science from the Imperial College of Science, London in 1978. He is a professor in University of Waterloo, Canada and has been professor in several prestigious universities including Purdue University, U.S.A, Columbia University, U.S.A., University of Essex, U.K., McGill University, Canada and the Indian Institute of Science, Bangalore. He has over 100 referred publications in international journals in the area of applied probability and stochastic processes, non-linear dynamical systems, statistical signal processing, queuing theory and in the control and design of high-speed networks. He has been a member of several advisory committees and working groups, including the US Congress Sub-Committee on Science and Technology. He is a Fellow of the Royal Statistical Society and Fellow of the Institute of Electrical and Electronics Engineers, Inc. He is the younger brother of Dr. Kiran Mazumdar-Shaw.
Dr. Bala S. Manian, 65 years, has been a part of the Silicon Valley entrepreneurial community over the last three decades and is responsible for successfully starting several life science companies. Dr. Manian is a co-founder of Quantum Dot Corporation and a co-founder of SurroMed Corporation. He was also chairman of Entigen Corporation, a Bioinformatics company. He was the founder and chairman of Biometric Imaging, Inc. Prior to founding Biometric Imaging, Inc., Dr. Manian founded Digital Optics Corporation, an optical instrumentation and systems development company in 1980 and two other companies, Lumisys and Molecular Dynamics in June 1987. Dr. Manian is presently the CEO of ReaMetrix Inc. He has been recognized through several awards for his contributions as an educator, inventor and an entrepreneur. In February 1999, the Academy of Motion Picture Arts and Sciences awarded a Technical Academy Award to Dr. Manian for advances in digital cinematography. He has a B.S. in Physics from the University of Madras, a M.S. in Applied Optics from the University of Rochester and a Ph.D. in mechanical engineering from Purdue University. He was a faculty member of the University of Rochester's Institute of Optics for four years, teaching courses in optical fabrication and testing, optical instrumentation and holography. At present, he serves as a member of the Board of Trustees of University of Rochester.
In accordance with our Articles of Association, the Board can appoint an alternate director pursuant to the provisions of the Companies Act, 1956. Prof. Catherine Rosenberg is presently the alternate director to Prof. Ravi Mazumdar.
Status of directors:
Statement showing the status of directors as executive/non-executive and independent/ non-independent during the year is set out below:
Name of the Director Office/Designation Executive/
Non-executive
Independent/
Non-independent
1
2
3
4
5
6
7
8
Dr. Kiran Mazumdar-Shaw
Mr. John Shaw
Prof. Ravi Mazumdar
Dr. Neville Bain
Prof. Charles Cooney
Mr. Suresh Talwar
Dr. Bala S. Manian
Prof. Catherine Rosenberg
CMD
Vice Chairman
Director
Director
Director
Director
Director
Alternate Director
Executive
Executive
Non-executive
Non-executive
Non-executive
Non-executive
Non-executive
Non-executive
Non-independent
Non-independent
Non-independent
Independent
Independent
Independent
Independent
Non-independent
More than 50% of the Board comprises of non-executive independent directors. The Company has obtained the necessary information from all the directors of the Company and performed the necessary steps to arrive at this conclusion.
2. ii. Meetings and attendance record of directors and other directorships:During the financial year ended March 31, 2011, Board of Directors met 4 times on April 29, 2010, July 23, 2010, October 22, 2010 and January 20, 2011. The composition of the Board of Directors and their attendance at the Board meeting during the year and at the last Annual General Meeting together with the number of other directorships are given below:
Name of the Director No. of Board meetings attended Attendance at the last AGM No. of other Directorships (*)
Dr. Kiran Mazumdar-Shaw
Mr. John Shaw
Prof. Ravi Mazumdar
Dr. Neville Bain
Prof. Charles Cooney
Mr. Suresh Talwar
Dr. Bala S Manian
Prof. Catherine Rosenberg (Alternate
Director to Prof. Ravi Mazumdar)
4
4
3
3
4
4
4
1
Yes
Yes
Yes
No
Yes
Yes
Yes
Yes
13
8
3
5
5
47
5
1
* Includes private limited companies and foreign body corporate and alternate directorships.
Availability of information to the Members of the Board
• Annual operating plans and budgets, capital budgets and any updates thereto.
• Quarterly results for the Company and its divisions.
• Minutes of meetings of Audit Committee, Remuneration Committee, Investors’ Grievance Committee and Share Transfer Committee.
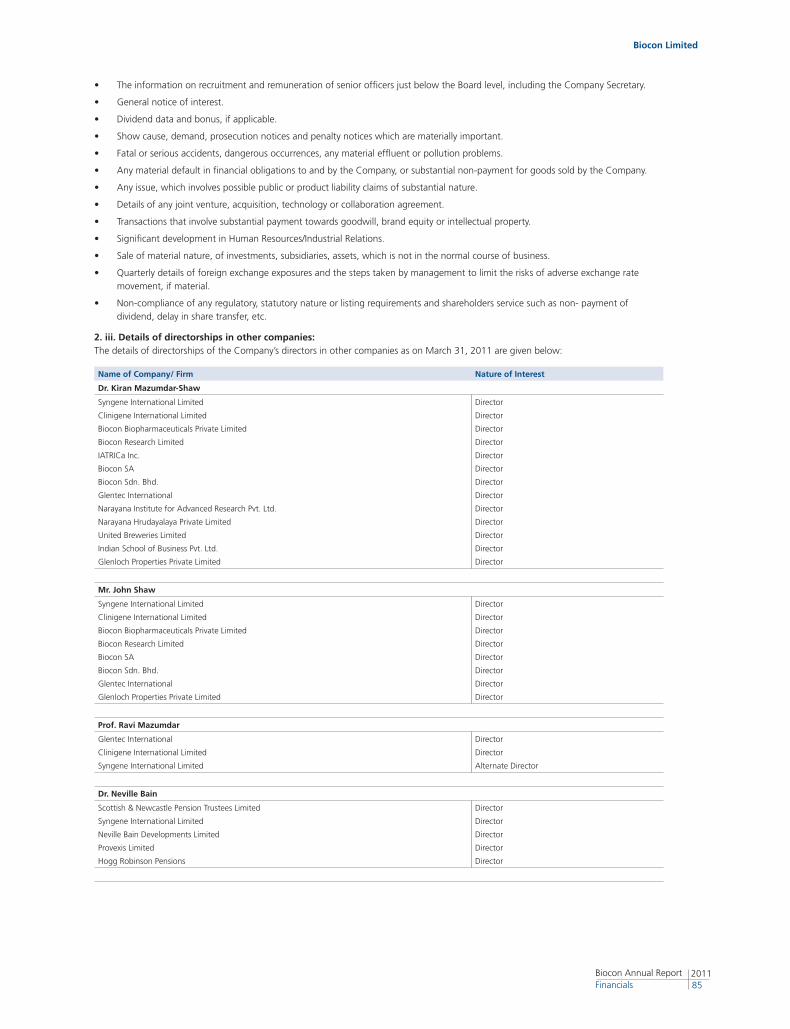
Biocon Limited
201185
Biocon Annual Report Financials
• The information on recruitment and remuneration of senior officers just below the Board level, including the Company Secretary.
• General notice of interest.
• Dividend data and bonus, if applicable.
• Show cause, demand, prosecution notices and penalty notices which are materially important.
• Fatal or serious accidents, dangerous occurrences, any material effluent or pollution problems.
• Any material default in financial obligations to and by the Company, or substantial non-payment for goods sold by the Company.
• Any issue, which involves possible public or product liability claims of substantial nature.
• Details of any joint venture, acquisition, technology or collaboration agreement.
• Transactions that involve substantial payment towards goodwill, brand equity or intellectual property.
• Significant development in Human Resources/Industrial Relations.
• Sale of material nature, of investments, subsidiaries, assets, which is not in the normal course of business.
• Quarterly details of foreign exchange exposures and the steps taken by management to limit the risks of adverse exchange rate movement, if material.
• Non-compliance of any regulatory, statutory nature or listing requirements and shareholders service such as non- payment of dividend, delay in share transfer, etc.
2. iii. Details of directorships in other companies:The details of directorships of the Company’s directors in other companies as on March 31, 2011 are given below:
Name of Company/ Firm Nature of Interest
Dr. Kiran Mazumdar-Shaw
Syngene International Limited
Clinigene International Limited
Biocon Biopharmaceuticals Private Limited
Biocon Research Limited
IATRICa Inc.
Biocon SA
Biocon Sdn. Bhd.
Glentec International
Narayana Institute for Advanced Research Pvt. Ltd.
Narayana Hrudayalaya Private Limited
United Breweries Limited
Indian School of Business Pvt. Ltd.
Glenloch Properties Private Limited
Director
Director
Director
Director
Director
Director
Director
Director
Director
Director
Director
Director
Director
Mr. John Shaw
Syngene International Limited
Clinigene International Limited
Biocon Biopharmaceuticals Private Limited
Biocon Research Limited
Biocon SA
Biocon Sdn. Bhd.
Glentec International
Glenloch Properties Private Limited
Director
Director
Director
Director
Director
Director
Director
Director
Prof. Ravi Mazumdar
Glentec International
Clinigene International Limited
Syngene International Limited
Director
Director
Alternate Director
Dr. Neville Bain
Scottish & Newcastle Pension Trustees Limited
Syngene International Limited
Neville Bain Developments Limited
Provexis Limited
Hogg Robinson Pensions
Director
Director
Director
Director
Director
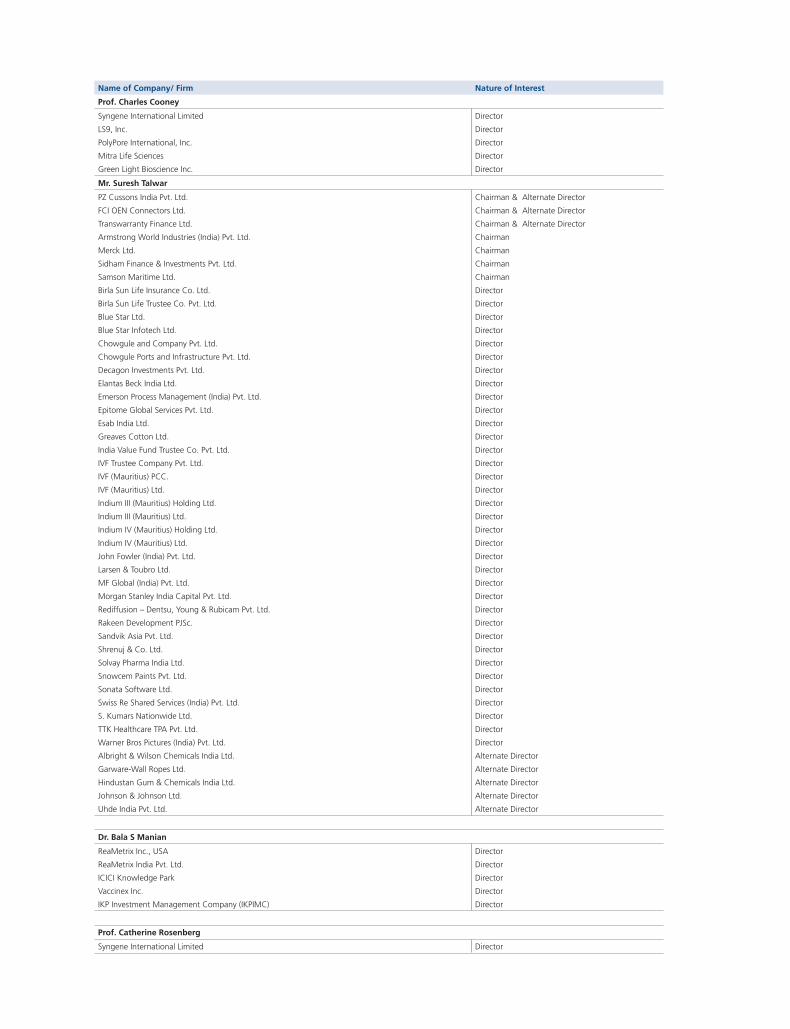
Name of Company/ Firm Nature of Interest
Prof. Charles Cooney
Syngene International Limited
LS9, Inc.
PolyPore International, Inc.
Mitra Life Sciences
Green Light Bioscience Inc.
Director
Director
Director
Director
Director
Mr. Suresh Talwar
PZ Cussons India Pvt. Ltd.
FCI OEN Connectors Ltd.
Transwarranty Finance Ltd.
Armstrong World Industries (India) Pvt. Ltd.
Merck Ltd.
Sidham Finance & Investments Pvt. Ltd.
Samson Maritime Ltd.
Birla Sun Life Insurance Co. Ltd.
Birla Sun Life Trustee Co. Pvt. Ltd.
Blue Star Ltd.
Blue Star Infotech Ltd.
Chowgule and Company Pvt. Ltd.
Chowgule Ports and Infrastructure Pvt. Ltd.
Decagon Investments Pvt. Ltd.
Elantas Beck India Ltd.
Emerson Process Management (India) Pvt. Ltd.
Epitome Global Services Pvt. Ltd.
Esab India Ltd.
Greaves Cotton Ltd.
India Value Fund Trustee Co. Pvt. Ltd.
IVF Trustee Company Pvt. Ltd.
IVF (Mauritius) PCC.
IVF (Mauritius) Ltd.
Indium III (Mauritius) Holding Ltd.
Indium III (Mauritius) Ltd.
Indium IV (Mauritius) Holding Ltd.
Indium IV (Mauritius) Ltd.
John Fowler (India) Pvt. Ltd.
Larsen & Toubro Ltd.
MF Global (India) Pvt. Ltd.
Morgan Stanley India Capital Pvt. Ltd.
Rediffusion – Dentsu, Young & Rubicam Pvt. Ltd.
Rakeen Development PJSc.
Sandvik Asia Pvt. Ltd.
Shrenuj & Co. Ltd.
Solvay Pharma India Ltd.
Snowcem Paints Pvt. Ltd.
Sonata Software Ltd.
Swiss Re Shared Services (India) Pvt. Ltd.
S. Kumars Nationwide Ltd.
TTK Healthcare TPA Pvt. Ltd.
Warner Bros Pictures (India) Pvt. Ltd.
Albright & Wilson Chemicals India Ltd.
Garware-Wall Ropes Ltd.
Hindustan Gum & Chemicals India Ltd.
Johnson & Johnson Ltd.
Uhde India Pvt. Ltd.
Chairman & Alternate Director
Chairman & Alternate Director
Chairman & Alternate Director
Chairman
Chairman
Chairman
Chairman
Director
Director
Director
Director
Director
Director
Director
Director
Director
Director
Director
Director
Director
Director
Director
Director
Director
Director
Director
Director
Director
Director
Director
Director
Director
Director
Director
Director
Director
Director
Director
Director
Director
Director
Director
Alternate Director
Alternate Director
Alternate Director
Alternate Director
Alternate Director
Dr. Bala S Manian
ReaMetrix Inc., USA
ReaMetrix India Pvt. Ltd.
ICICI Knowledge Park
Vaccinex Inc.
IKP Investment Management Company (IKPIMC)
Director
Director
Director
Director
Director
Prof. Catherine Rosenberg
Syngene International Limited Director
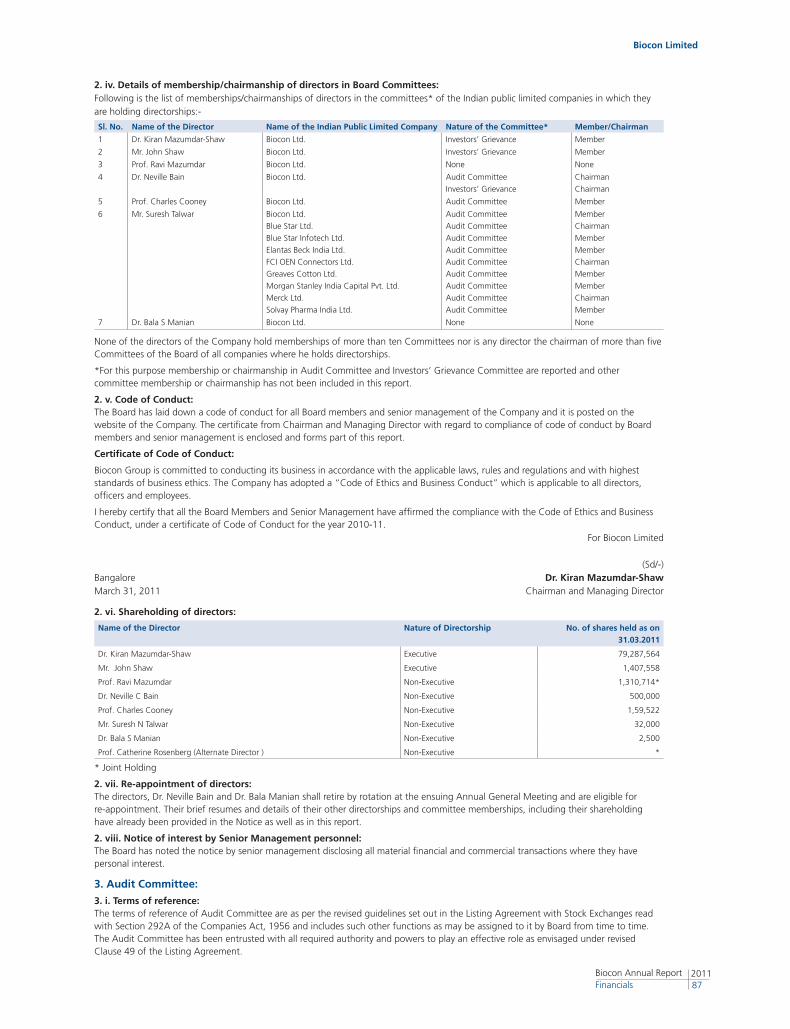
Biocon Limited
201187
Biocon Annual Report Financials
2. iv. Details of membership/chairmanship of directors in Board Committees:Following is the list of memberships/chairmanships of directors in the committees* of the Indian public limited companies in which they are holding directorships:-
Sl. No. Name of the Director Name of the Indian Public Limited Company Nature of the Committee* Member/Chairman
1 Dr. Kiran Mazumdar-Shaw Biocon Ltd. Investors’ Grievance Member
2 Mr. John Shaw Biocon Ltd. Investors’ Grievance Member
3 Prof. Ravi Mazumdar Biocon Ltd. None None
4 Dr. Neville Bain Biocon Ltd. Audit Committee
Investors’ Grievance
Chairman
Chairman
5 Prof. Charles Cooney Biocon Ltd. Audit Committee Member
6 Mr. Suresh Talwar Biocon Ltd.
Blue Star Ltd.
Blue Star Infotech Ltd.
Elantas Beck India Ltd.
FCI OEN Connectors Ltd.
Greaves Cotton Ltd.
Morgan Stanley India Capital Pvt. Ltd.
Merck Ltd.
Solvay Pharma India Ltd.
Audit Committee
Audit Committee
Audit Committee
Audit Committee
Audit Committee
Audit Committee
Audit Committee
Audit Committee
Audit Committee
Member
Chairman
Member
Member
Chairman
Member
Member
Chairman
Member
7 Dr. Bala S Manian Biocon Ltd. None None
None of the directors of the Company hold memberships of more than ten Committees nor is any director the chairman of more than five Committees of the Board of all companies where he holds directorships.
*For this purpose membership or chairmanship in Audit Committee and Investors’ Grievance Committee are reported and other committee membership or chairmanship has not been included in this report.
2. v. Code of Conduct: The Board has laid down a code of conduct for all Board members and senior management of the Company and it is posted on the website of the Company. The certificate from Chairman and Managing Director with regard to compliance of code of conduct by Board members and senior management is enclosed and forms part of this report.
Certificate of Code of Conduct:
Biocon Group is committed to conducting its business in accordance with the applicable laws, rules and regulations and with highest standards of business ethics. The Company has adopted a “Code of Ethics and Business Conduct” which is applicable to all directors, officers and employees.
I hereby certify that all the Board Members and Senior Management have affirmed the compliance with the Code of Ethics and Business Conduct, under a certificate of Code of Conduct for the year 2010-11.
For Biocon Limited (Sd/-)Bangalore Dr. Kiran Mazumdar-Shaw March 31, 2011 Chairman and Managing Director
2. vi. Shareholding of directors:
Name of the Director Nature of Directorship No. of shares held as on 31.03.2011
Dr. Kiran Mazumdar-Shaw Executive 79,287,564
Mr. John Shaw Executive 1,407,558
Prof. Ravi Mazumdar Non-Executive 1,310,714*
Dr. Neville C Bain Non-Executive 500,000
Prof. Charles Cooney Non-Executive 1,59,522
Mr. Suresh N Talwar Non-Executive 32,000
Dr. Bala S Manian Non-Executive 2,500
Prof. Catherine Rosenberg (Alternate Director ) Non-Executive *
* Joint Holding
2. vii. Re-appointment of directors:The directors, Dr. Neville Bain and Dr. Bala Manian shall retire by rotation at the ensuing Annual General Meeting and are eligible for re-appointment. Their brief resumes and details of their other directorships and committee memberships, including their shareholding have already been provided in the Notice as well as in this report.
2. viii. Notice of interest by Senior Management personnel:The Board has noted the notice by senior management disclosing all material financial and commercial transactions where they have personal interest.
3. Audit Committee:
3. i. Terms of reference:The terms of reference of Audit Committee are as per the revised guidelines set out in the Listing Agreement with Stock Exchanges read with Section 292A of the Companies Act, 1956 and includes such other functions as may be assigned to it by Board from time to time. The Audit Committee has been entrusted with all required authority and powers to play an effective role as envisaged under revised Clause 49 of the Listing Agreement.

3. ii. Composition: The Board constituted the Audit Committee on April 16, 2001. The following directors are the current members of the Committee:
a) Dr. Neville Bain
b) Prof. Charles Cooney
c) Mr. Suresh Talwar
The members of the Committee are non-executive and independent directors and possess sound knowledge of accounts, finance, audit and legal matters. Dr. Neville Bain is the Chairman of the Committee.
3. iii. Meetings and attendance during the year:
Name No. of meetings held No. of meetings attended
Dr. Neville Bain 4 3
Prof. Charles Cooney 4 4
Mr. Suresh Talwar 4 4
During the year 2010-11, the Committee met 4 times on April 28, 2010, July 22, 2010, October 21, 2010 and January 19, 2011. The Senior Management and Auditors were invited to attend the meetings of the Audit Committee and attended all meetings. The Company Secretary acts as the Secretary to the Audit Committee.
The Committee reviewed the financial results of the Company prepared in accordance with Indian GAAP (including consolidated results) and recommended the same to the Board of Directors for their adoption.
The Committee also recommended to the Board of Directors the re-appointment of M/s S. R. Batliboi & Associates, Chartered Accountants (Firm Registration No. 101049W), as Statutory Auditors of the Company from conclusion of 2011 Annual General Meeting to the forthcoming Annual General Meeting.
The Committee also reviewed Internal Audit reports, Internal Control Systems, risk management policies, related party transactions, etc. from time to time.
Audit Committee members are advised of the work of independent internal auditors. M/s Grant Thornton was appointed to review the control processes in place and report quarterly to the Audit Committee. Considering the best practice of rotation of internal audit function, M/s. KPMG Pvt. Ltd. was appointed as internal auditors for the forthcoming financial year.
3. iv. Subsidiary Companies: The Company has seven subsidiary companies, Syngene International Limited, Clinigene International Limited, Biocon Biopharmaceuticals Private Limited, Biocon Research Limited, Biocon SA, Biocon Sdn. Bhd. and Axicorp GmbH and one joint venture, NeoBiocon, as explained in the Directors’ Report. None of the subsidiary companies represent more than 20% of the consolidated turnover or net worth of the Company in the immediately preceding financial year. However, two independent directors of the Company are on the Board of Syngene International Limited.
The Audit Committee of the Company reviews the financial statements of all the subsidiary companies. The minutes of the Board meetings of the subsidiary companies are placed before the Board meetings of the Company and reviewed.
3. v. CEO/CFO Certification:The Board has recognized the Chairman and Managing Director of the Company as the CEO and President – Group Finance as the CFO for the limited purpose of compliance under the Listing Agreement. The CEO and CFO have certified, in terms of revised Clause 49 of the Listing Agreement, to the Board that the financial statements present a true and fair view of the Company’s affairs and are in compliance with existing accounting standards.
4. Remuneration Committee:
4. i. Terms of reference: The terms of reference of the Remuneration Committee, inter alia, includes determination of compensation package of executive directors and senior management of the Company, determination and supervision of the bonus scheme of the Company and to investigate any activities within the terms of reference, etc. The Committee also oversees the employee stock option scheme and recommends the same for the approval of the Board/shareholders. The Committee is empowered to decide the eligibility of the category of employees and the terms and conditions of grants to be extended under the ESOP schemes of the Company.
4. ii. Constitution:The Board constituted the Remuneration Committee on April 16, 2001. The following directors are the current members of the Committee:
a) Prof. Charles Cooney
b) Dr. Neville Bain
The members of the committee are non-executive and independent directors. Prof. Charles Cooney is the Chairman of the Committee.
4. iii. Meetings and attendance during the year:
Name No. of meetings held No. of meetings attended
Dr. Neville Bain 4 3
Prof. Charles Cooney 4 4
During the year 2010-11, the Committee met 4 times on April 28, 2010, July 22, 2010, October 21, 2010 and January 19, 2011.
4. iv. Remuneration policy:
The remuneration policy of the Company is broadly based on the following criteria:
a) Job responsibilities
b) Key performance areas of the employees/directors
c) Industry trend
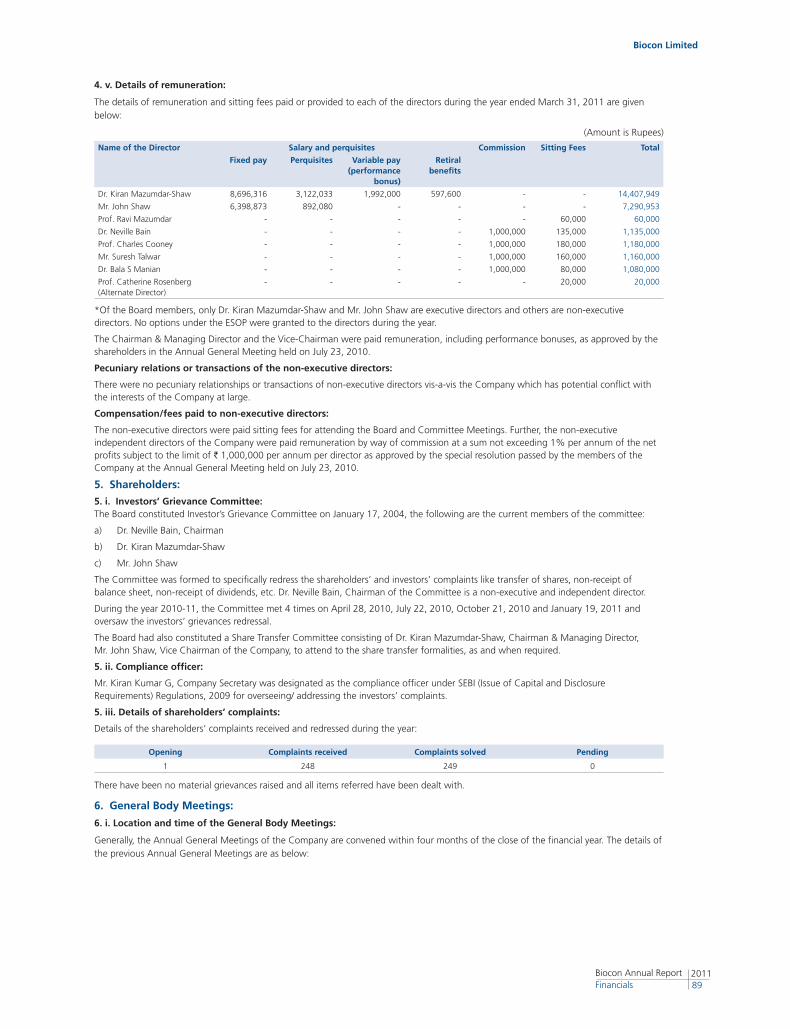
Biocon Limited
201189
Biocon Annual Report Financials
4. v. Details of remuneration:
The details of remuneration and sitting fees paid or provided to each of the directors during the year ended March 31, 2011 are given below:
(Amount is Rupees)
Name of the Director Salary and perquisites Commission Sitting Fees Total
Fixed pay Perquisites Variable pay (performance
bonus)
Retiral benefits
Dr. Kiran Mazumdar-Shaw 8,696,316 3,122,033 1,992,000 597,600 - - 14,407,949
Mr. John Shaw 6,398,873 892,080 - - - - 7,290,953
Prof. Ravi Mazumdar - - - - - 60,000 60,000
Dr. Neville Bain - - - - 1,000,000 135,000 1,135,000
Prof. Charles Cooney - - - - 1,000,000 180,000 1,180,000
Mr. Suresh Talwar - - - - 1,000,000 160,000 1,160,000
Dr. Bala S Manian - - - - 1,000,000 80,000 1,080,000
Prof. Catherine Rosenberg (Alternate Director)
- - - - - 20,000 20,000
*Of the Board members, only Dr. Kiran Mazumdar-Shaw and Mr. John Shaw are executive directors and others are non-executive directors. No options under the ESOP were granted to the directors during the year.
The Chairman & Managing Director and the Vice-Chairman were paid remuneration, including performance bonuses, as approved by the shareholders in the Annual General Meeting held on July 23, 2010.
Pecuniary relations or transactions of the non-executive directors:
There were no pecuniary relationships or transactions of non-executive directors vis-a-vis the Company which has potential conflict with the interests of the Company at large.
Compensation/fees paid to non-executive directors:
The non-executive directors were paid sitting fees for attending the Board and Committee Meetings. Further, the non-executive independent directors of the Company were paid remuneration by way of commission at a sum not exceeding 1% per annum of the net profits subject to the limit of ` 1,000,000 per annum per director as approved by the special resolution passed by the members of the Company at the Annual General Meeting held on July 23, 2010.
5. Shareholders:
5. i. Investors’ Grievance Committee:The Board constituted Investor’s Grievance Committee on January 17, 2004, the following are the current members of the committee:
a) Dr. Neville Bain, Chairman
b) Dr. Kiran Mazumdar-Shaw
c) Mr. John Shaw
The Committee was formed to specifically redress the shareholders’ and investors’ complaints like transfer of shares, non-receipt of balance sheet, non-receipt of dividends, etc. Dr. Neville Bain, Chairman of the Committee is a non-executive and independent director.
During the year 2010-11, the Committee met 4 times on April 28, 2010, July 22, 2010, October 21, 2010 and January 19, 2011 and oversaw the investors’ grievances redressal.
The Board had also constituted a Share Transfer Committee consisting of Dr. Kiran Mazumdar-Shaw, Chairman & Managing Director, Mr. John Shaw, Vice Chairman of the Company, to attend to the share transfer formalities, as and when required.
5. ii. Compliance officer:
Mr. Kiran Kumar G, Company Secretary was designated as the compliance officer under SEBI (Issue of Capital and Disclosure Requirements) Regulations, 2009 for overseeing/ addressing the investors’ complaints.
5. iii. Details of shareholders’ complaints:
Details of the shareholders’ complaints received and redressed during the year:
Opening Complaints received Complaints solved Pending
1 248 249 0
There have been no material grievances raised and all items referred have been dealt with.
6. General Body Meetings:
6. i. Location and time of the General Body Meetings:
Generally, the Annual General Meetings of the Company are convened within four months of the close of the financial year. The details of the previous Annual General Meetings are as below:
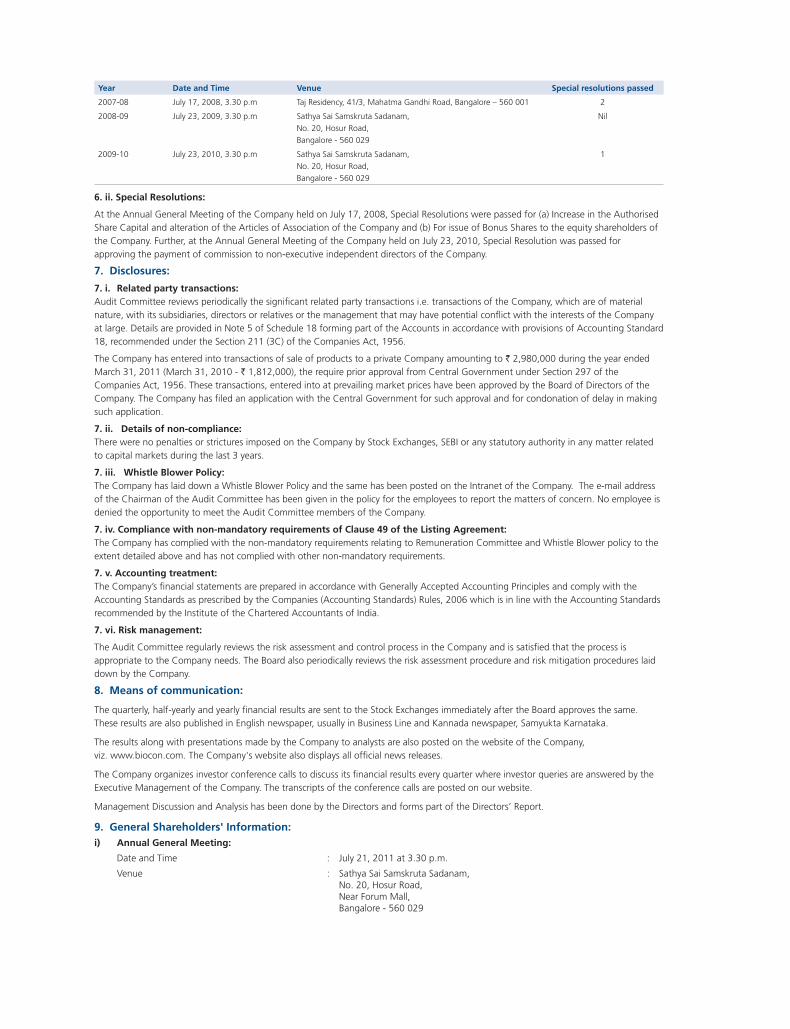
Year Date and Time Venue Special resolutions passed
2007-08 July 17, 2008, 3.30 p.m Taj Residency, 41/3, Mahatma Gandhi Road, Bangalore – 560 001 2
2008-09 July 23, 2009, 3.30 p.m Sathya Sai Samskruta Sadanam,
No. 20, Hosur Road,
Bangalore - 560 029
Nil
2009-10 July 23, 2010, 3.30 p.m Sathya Sai Samskruta Sadanam,
No. 20, Hosur Road,
Bangalore - 560 029
1
6. ii. Special Resolutions:
At the Annual General Meeting of the Company held on July 17, 2008, Special Resolutions were passed for (a) Increase in the Authorised Share Capital and alteration of the Articles of Association of the Company and (b) For issue of Bonus Shares to the equity shareholders of the Company. Further, at the Annual General Meeting of the Company held on July 23, 2010, Special Resolution was passed for approving the payment of commission to non-executive independent directors of the Company.
7. Disclosures:
7. i. Related party transactions:Audit Committee reviews periodically the significant related party transactions i.e. transactions of the Company, which are of material nature, with its subsidiaries, directors or relatives or the management that may have potential conflict with the interests of the Company at large. Details are provided in Note 5 of Schedule 18 forming part of the Accounts in accordance with provisions of Accounting Standard 18, recommended under the Section 211 (3C) of the Companies Act, 1956.
The Company has entered into transactions of sale of products to a private Company amounting to ` 2,980,000 during the year ended March 31, 2011 (March 31, 2010 - ` 1,812,000), the require prior approval from Central Government under Section 297 of the Companies Act, 1956. These transactions, entered into at prevailing market prices have been approved by the Board of Directors of the Company. The Company has filed an application with the Central Government for such approval and for condonation of delay in making such application.
7. ii. Details of non-compliance:There were no penalties or strictures imposed on the Company by Stock Exchanges, SEBI or any statutory authority in any matter related to capital markets during the last 3 years.
7. iii. Whistle Blower Policy: The Company has laid down a Whistle Blower Policy and the same has been posted on the Intranet of the Company. The e-mail address of the Chairman of the Audit Committee has been given in the policy for the employees to report the matters of concern. No employee is denied the opportunity to meet the Audit Committee members of the Company.
7. iv. Compliance with non-mandatory requirements of Clause 49 of the Listing Agreement:The Company has complied with the non-mandatory requirements relating to Remuneration Committee and Whistle Blower policy to the extent detailed above and has not complied with other non-mandatory requirements.
7. v. Accounting treatment: The Company’s financial statements are prepared in accordance with Generally Accepted Accounting Principles and comply with the Accounting Standards as prescribed by the Companies (Accounting Standards) Rules, 2006 which is in line with the Accounting Standards recommended by the Institute of the Chartered Accountants of India.
7. vi. Risk management:
The Audit Committee regularly reviews the risk assessment and control process in the Company and is satisfied that the process is appropriate to the Company needs. The Board also periodically reviews the risk assessment procedure and risk mitigation procedures laid down by the Company.
8. Means of communication:
The quarterly, half-yearly and yearly financial results are sent to the Stock Exchanges immediately after the Board approves the same. These results are also published in English newspaper, usually in Business Line and Kannada newspaper, Samyukta Karnataka.
The results along with presentations made by the Company to analysts are also posted on the website of the Company, viz. www.biocon.com. The Company's website also displays all official news releases.
The Company organizes investor conference calls to discuss its financial results every quarter where investor queries are answered by the Executive Management of the Company. The transcripts of the conference calls are posted on our website.
Management Discussion and Analysis has been done by the Directors and forms part of the Directors’ Report.
9. General Shareholders' Information:i) Annual General Meeting:
Date and Time : July 21, 2011 at 3.30 p.m.
Venue : Sathya Sai Samskruta Sadanam, No. 20, Hosur Road, Near Forum Mall, Bangalore - 560 029
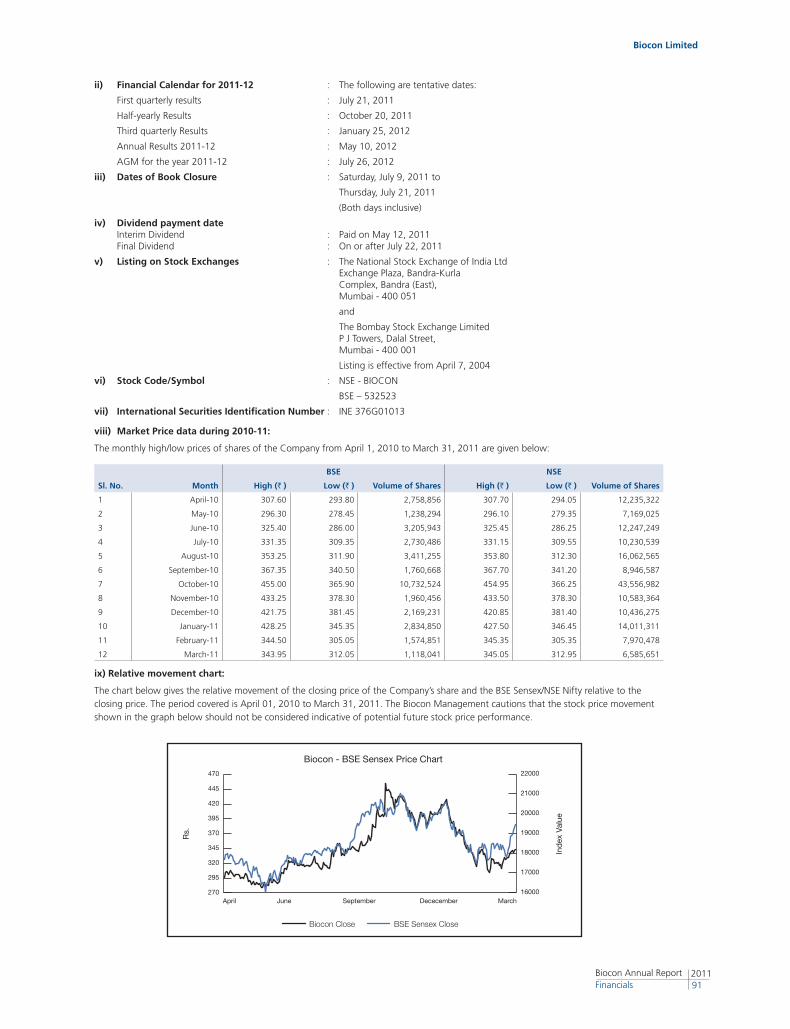
Biocon Limited
201191
Biocon Annual Report Financials
ii) Financial Calendar for 2011-12 : The following are tentative dates:
First quarterly results : July 21, 2011
Half-yearly Results : October 20, 2011
Third quarterly Results : January 25, 2012
Annual Results 2011-12 : May 10, 2012
AGM for the year 2011-12 : July 26, 2012
iii) Dates of Book Closure : Saturday, July 9, 2011 to
Thursday, July 21, 2011
(Both days inclusive)
iv) Dividend payment date Interim Dividend : Paid on May 12, 2011 Final Dividend : On or after July 22, 2011
v) Listing on Stock Exchanges : The National Stock Exchange of India Ltd Exchange Plaza, Bandra-Kurla Complex, Bandra (East), Mumbai - 400 051
and
The Bombay Stock Exchange Limited P J Towers, Dalal Street, Mumbai - 400 001
Listing is effective from April 7, 2004
vi) Stock Code/Symbol : NSE - BIOCON
BSE – 532523
vii) International Securities Identification Number : INE 376G01013
viii) Market Price data during 2010-11:
The monthly high/low prices of shares of the Company from April 1, 2010 to March 31, 2011 are given below:
BSE NSE
Sl. No. Month High (` ) Low (` ) Volume of Shares High (` ) Low (` ) Volume of Shares
1 April-10 307.60 293.80 2,758,856 307.70 294.05 12,235,322
2 May-10 296.30 278.45 1,238,294 296.10 279.35 7,169,025
3 June-10 325.40 286.00 3,205,943 325.45 286.25 12,247,249
4 July-10 331.35 309.35 2,730,486 331.15 309.55 10,230,539
5 August-10 353.25 311.90 3,411,255 353.80 312.30 16,062,565
6 September-10 367.35 340.50 1,760,668 367.70 341.20 8,946,587
7 October-10 455.00 365.90 10,732,524 454.95 366.25 43,556,982
8 November-10 433.25 378.30 1,960,456 433.50 378.30 10,583,364
9 December-10 421.75 381.45 2,169,231 420.85 381.40 10,436,275
10 January-11 428.25 345.35 2,834,850 427.50 346.45 14,011,311
11 February-11 344.50 305.05 1,574,851 345.35 305.35 7,970,478
12 March-11 343.95 312.05 1,118,041 345.05 312.95 6,585,651
ix) Relative movement chart:
The chart below gives the relative movement of the closing price of the Company’s share and the BSE Sensex/NSE Nifty relative to the closing price. The period covered is April 01, 2010 to March 31, 2011. The Biocon Management cautions that the stock price movement shown in the graph below should not be considered indicative of potential future stock price performance.
270
295
320
345
370
395
420
445
470
MarchDececemberSeptemberJuneApril
Biocon Close BSE Sensex Close
Rs.
Biocon - BSE Sensex Price Chart
Ind
ex V
alue
16000
17000
18000
19000
20000
21000
22000
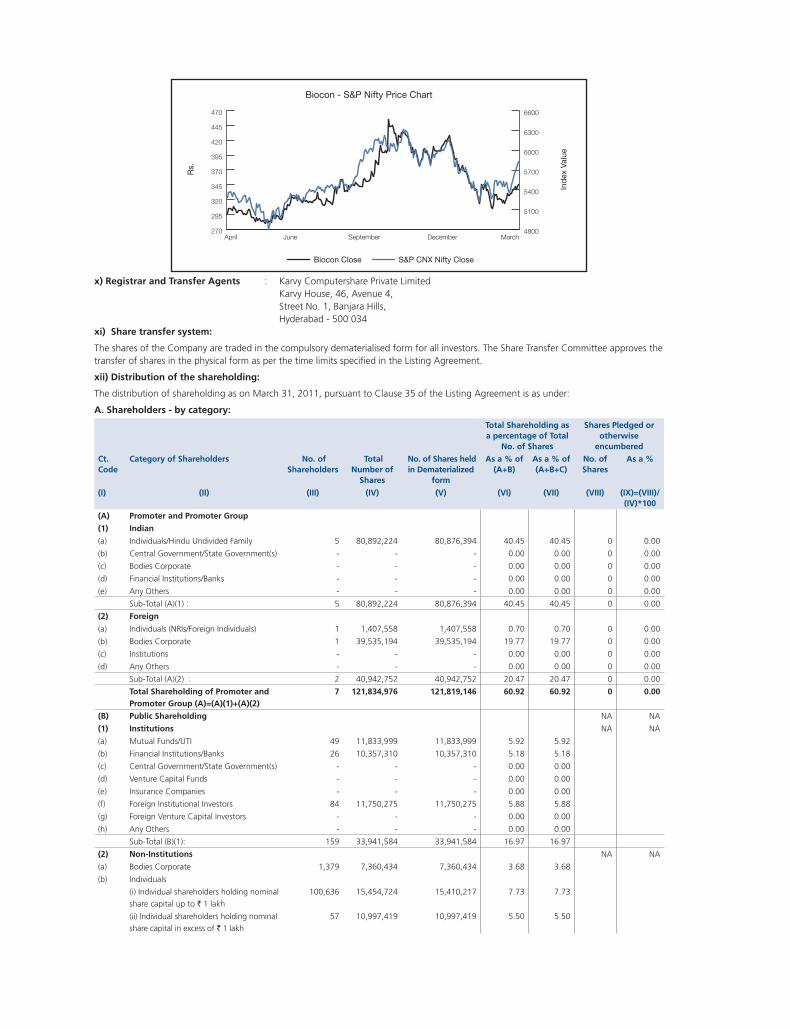
x) Registrar and Transfer Agents : Karvy Computershare Private Limited Karvy House, 46, Avenue 4, Street No. 1, Banjara Hills, Hyderabad - 500 034xi) Share transfer system:
The shares of the Company are traded in the compulsory dematerialised form for all investors. The Share Transfer Committee approves the transfer of shares in the physical form as per the time limits specified in the Listing Agreement.
xii) Distribution of the shareholding:
The distribution of shareholding as on March 31, 2011, pursuant to Clause 35 of the Listing Agreement is as under:
A. Shareholders - by category:
Total Shareholding as a percentage of Total
No. of Shares
Shares Pledged or otherwise
encumbered
Ct. Code
Category of Shareholders No. of Shareholders
Total Number of
Shares
No. of Shares held in Dematerialized
form
As a % of (A+B)
As a % of (A+B+C)
No. of Shares
As a %
(I) (II) (III) (IV) (V) (VI) (VII) (VIII) (Ix)=(VIII)/ (IV)*100
(A) Promoter and Promoter Group
(1) Indian
(a) Individuals/Hindu Undivided Family 5 80,892,224 80,876,394 40.45 40.45 0 0.00
(b) Central Government/State Government(s) - - - 0.00 0.00 0 0.00
(c) Bodies Corporate - - - 0.00 0.00 0 0.00
(d) Financial Institutions/Banks - - - 0.00 0.00 0 0.00
(e) Any Others - - - 0.00 0.00 0 0.00
Sub-Total (A)(1) : 5 80,892,224 80,876,394 40.45 40.45 0 0.00
(2) Foreign
(a) Individuals (NRIs/Foreign Individuals) 1 1,407,558 1,407,558 0.70 0.70 0 0.00
(b) Bodies Corporate 1 39,535,194 39,535,194 19.77 19.77 0 0.00
(c) Institutions - - - 0.00 0.00 0 0.00
(d) Any Others - - - 0.00 0.00 0 0.00
Sub-Total (A)(2) : 2 40,942,752 40,942,752 20.47 20.47 0 0.00
Total Shareholding of Promoter and Promoter Group (A)=(A)(1)+(A)(2)
7 121,834,976 121,819,146 60.92 60.92 0 0.00
(B) Public Shareholding NA NA
(1) Institutions NA NA
(a) Mutual Funds/UTI 49 11,833,999 11,833,999 5.92 5.92
(b) Financial Institutions/Banks 26 10,357,310 10,357,310 5.18 5.18
(c) Central Government/State Government(s) - - - 0.00 0.00
(d) Venture Capital Funds - - - 0.00 0.00
(e) Insurance Companies - - - 0.00 0.00
(f) Foreign Institutional Investors 84 11,750,275 11,750,275 5.88 5.88
(g) Foreign Venture Capital Investors - - - 0.00 0.00
(h) Any Others - - - 0.00 0.00
Sub-Total (B)(1): 159 33,941,584 33,941,584 16.97 16.97
(2) Non-Institutions NA NA
(a) Bodies Corporate 1,379 7,360,434 7,360,434 3.68 3.68
(b) Individuals
(i) Individual shareholders holding nominal
share capital up to ` 1 lakh
100,636 15,454,724 15,410,217 7.73 7.73
(ii) Individual shareholders holding nominal
share capital in excess of ` 1 lakh
57 10,997,419 10,997,419 5.50 5.50
270
295
320
345
370
395
420
445
470
MarchDecemberSeptemberJuneApril4800
5100
5400
5700
6000
6300
6600
Biocon Close S&P CNX Nifty Close
Rs.
Biocon - S&P Nifty Price Chart
Ind
ex V
alue
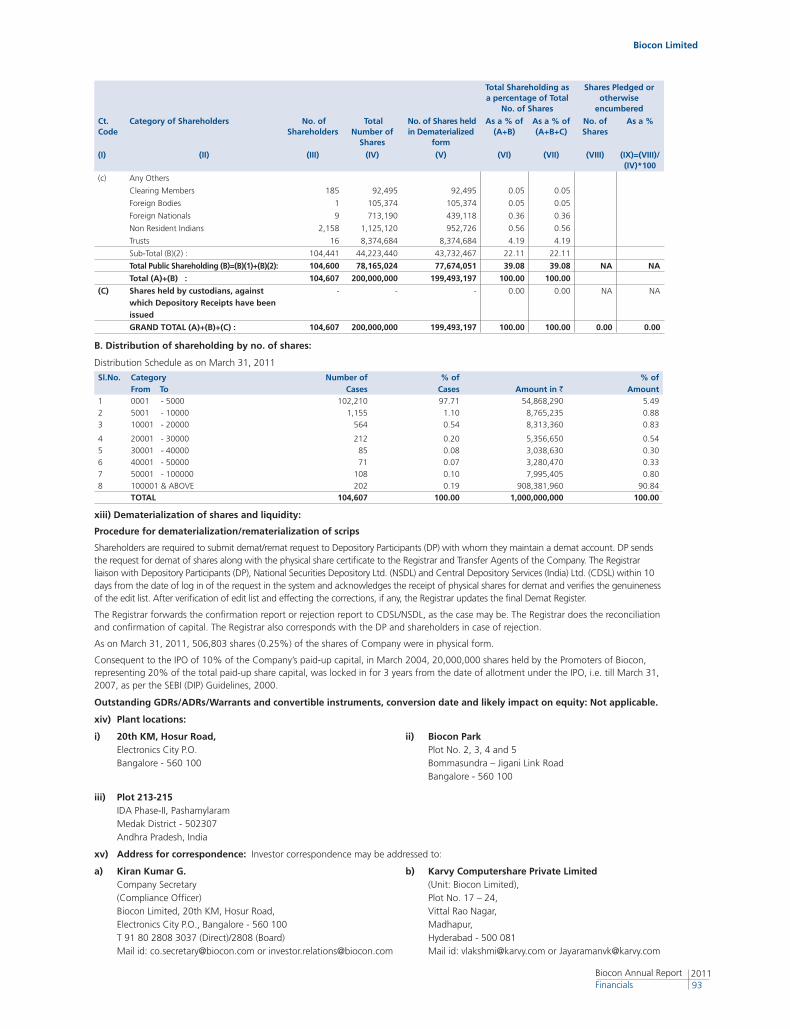
Biocon Limited
201193
Biocon Annual Report Financials
Total Shareholding as a percentage of Total
No. of Shares
Shares Pledged or otherwise
encumbered
Ct. Code
Category of Shareholders No. of Shareholders
Total Number of
Shares
No. of Shares held in Dematerialized
form
As a % of (A+B)
As a % of (A+B+C)
No. of Shares
As a %
(I) (II) (III) (IV) (V) (VI) (VII) (VIII) (Ix)=(VIII)/ (IV)*100
(c) Any Others
Clearing Members 185 92,495 92,495 0.05 0.05
Foreign Bodies 1 105,374 105,374 0.05 0.05
Foreign Nationals 9 713,190 439,118 0.36 0.36
Non Resident Indians 2,158 1,125,120 952,726 0.56 0.56
Trusts 16 8,374,684 8,374,684 4.19 4.19
Sub-Total (B)(2) : 104,441 44,223,440 43,732,467 22.11 22.11
Total Public Shareholding (B)=(B)(1)+(B)(2): 104,600 78,165,024 77,674,051 39.08 39.08 NA NA
Total (A)+(B) : 104,607 200,000,000 199,493,197 100.00 100.00
(C) Shares held by custodians, against which Depository Receipts have been issued
- - - 0.00 0.00 NA NA
GRAND TOTAL (A)+(B)+(C) : 104,607 200,000,000 199,493,197 100.00 100.00 0.00 0.00
B. Distribution of shareholding by no. of shares:
Distribution Schedule as on March 31, 2011
Sl.No. Category Number of % of % ofFrom To Cases Cases Amount in ` Amount
1 0001 - 5000 102,210 97.71 54,868,290 5.49
2 5001 - 10000 1,155 1.10 8,765,235 0.88
3 10001 - 20000 564 0.54 8,313,360 0.83
4 20001 - 30000 212 0.20 5,356,650 0.54
5 30001 - 40000 85 0.08 3,038,630 0.30
6 40001 - 50000 71 0.07 3,280,470 0.33
7 50001 - 100000 108 0.10 7,995,405 0.80
8 100001 & ABOVE 202 0.19 908,381,960 90.84
TOTAL 104,607 100.00 1,000,000,000 100.00
xiii) Dematerialization of shares and liquidity:
Procedure for dematerialization/rematerialization of scrips
Shareholders are required to submit demat/remat request to Depository Participants (DP) with whom they maintain a demat account. DP sends the request for demat of shares along with the physical share certificate to the Registrar and Transfer Agents of the Company. The Registrar liaison with Depository Participants (DP), National Securities Depository Ltd. (NSDL) and Central Depository Services (India) Ltd. (CDSL) within 10 days from the date of log in of the request in the system and acknowledges the receipt of physical shares for demat and verifies the genuineness of the edit list. After verification of edit list and effecting the corrections, if any, the Registrar updates the final Demat Register.
The Registrar forwards the confirmation report or rejection report to CDSL/NSDL, as the case may be. The Registrar does the reconciliation and confirmation of capital. The Registrar also corresponds with the DP and shareholders in case of rejection.
As on March 31, 2011, 506,803 shares (0.25%) of the shares of Company were in physical form.
Consequent to the IPO of 10% of the Company’s paid-up capital, in March 2004, 20,000,000 shares held by the Promoters of Biocon, representing 20% of the total paid-up share capital, was locked in for 3 years from the date of allotment under the IPO, i.e. till March 31, 2007, as per the SEBI (DIP) Guidelines, 2000.
Outstanding GDRs/ADRs/Warrants and convertible instruments, conversion date and likely impact on equity: Not applicable.
xiv) Plant locations:
i) 20th KM, Hosur Road, ii) Biocon Park Electronics City P.O. Plot No. 2, 3, 4 and 5 Bangalore - 560 100 Bommasundra – Jigani Link Road Bangalore - 560 100
iii) Plot 213-215 IDA Phase-II, Pashamylaram Medak District - 502307 Andhra Pradesh, India
xv) Address for correspondence: Investor correspondence may be addressed to:
a) Kiran Kumar G. b) Karvy Computershare Private Limited Company Secretary (Unit: Biocon Limited), (Compliance Officer) Plot No. 17 – 24, Biocon Limited, 20th KM, Hosur Road, Vittal Rao Nagar, Electronics City P.O., Bangalore - 560 100 Madhapur, T 91 80 2808 3037 (Direct)/2808 (Board) Hyderabad - 500 081 Mail id: [email protected] or [email protected] Mail id: [email protected] or [email protected]
Auditors’ Certificate
To The Members of Biocon Limited
We have examined the compliance of conditions of corporate governance by Biocon Limited, for the year ended on March 31, 2011, as stipulated in clause 49 of the Listing Agreement of the said Company with stock exchange(s).
The compliance of conditions of corporate governance is the responsibility of the management. Our examination was limited to procedures and implementation thereof, adopted by the Company for ensuring the compliance of the conditions of the Corporate Governance. It is neither an audit nor an expression of opinion on the financial statements of the Company.
In our opinion and to the best of our information and according to the explanations given to us, we certify that the Company has complied with the conditions of Corporate Governance as stipulated in the above mentioned Listing Agreement.
We further state that such compliance is neither an assurance as to the future viability of the Company nor the efficiency or effectiveness with which the management has conducted the affairs of the Company.
For S.R. BATLIBOI & ASSOCIATESFirm registration number: 101049WChartered Accountants
per Aditya Vikram Bhauwala PartnerMembership No. 208382
BangaloreApril 28, 2011
(THIS SPACE HAS BEEN INTENTIONALLY LEFT BLANK)
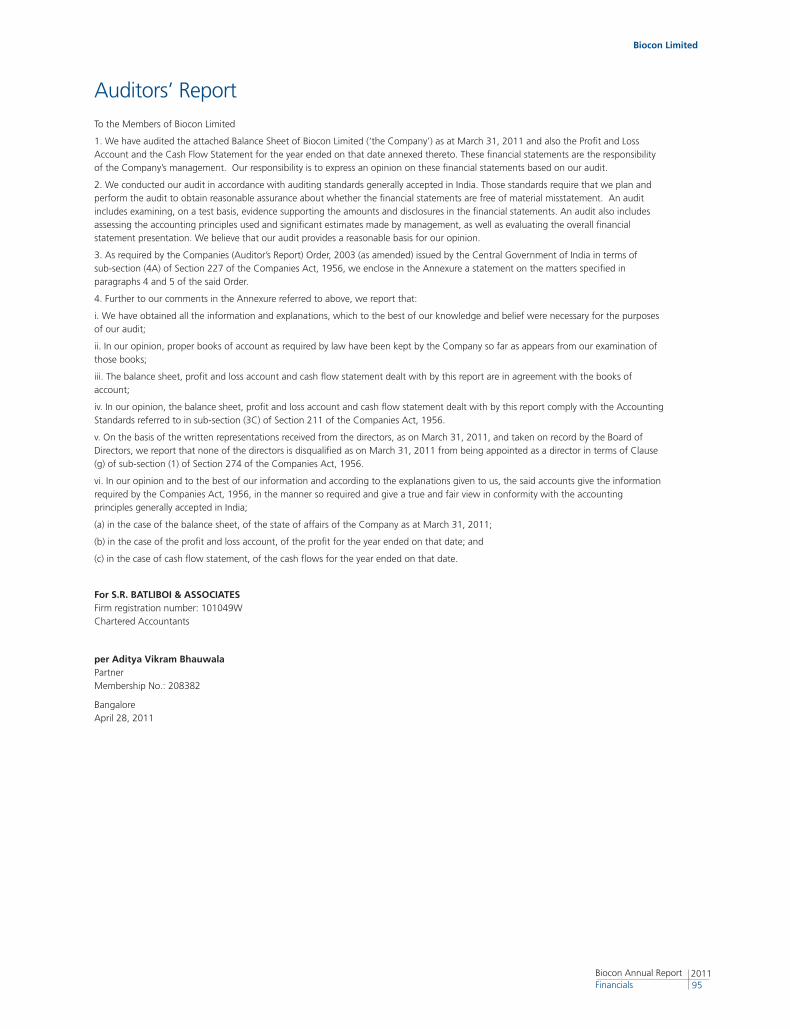
Biocon Limited
201195
Biocon Annual Report Financials
Auditors’ ReportTo the Members of Biocon Limited
1. We have audited the attached Balance Sheet of Biocon Limited (‘the Company’) as at March 31, 2011 and also the Profit and Loss Account and the Cash Flow Statement for the year ended on that date annexed thereto. These financial statements are the responsibility of the Company’s management. Our responsibility is to express an opinion on these financial statements based on our audit.
2. We conducted our audit in accordance with auditing standards generally accepted in India. Those standards require that we plan and perform the audit to obtain reasonable assurance about whether the financial statements are free of material misstatement. An audit includes examining, on a test basis, evidence supporting the amounts and disclosures in the financial statements. An audit also includes assessing the accounting principles used and significant estimates made by management, as well as evaluating the overall financial statement presentation. We believe that our audit provides a reasonable basis for our opinion.
3. As required by the Companies (Auditor’s Report) Order, 2003 (as amended) issued by the Central Government of India in terms of sub-section (4A) of Section 227 of the Companies Act, 1956, we enclose in the Annexure a statement on the matters specified in paragraphs 4 and 5 of the said Order.
4. Further to our comments in the Annexure referred to above, we report that:
i. We have obtained all the information and explanations, which to the best of our knowledge and belief were necessary for the purposes of our audit;
ii. In our opinion, proper books of account as required by law have been kept by the Company so far as appears from our examination of those books;
iii. The balance sheet, profit and loss account and cash flow statement dealt with by this report are in agreement with the books of account;
iv. In our opinion, the balance sheet, profit and loss account and cash flow statement dealt with by this report comply with the Accounting Standards referred to in sub-section (3C) of Section 211 of the Companies Act, 1956.
v. On the basis of the written representations received from the directors, as on March 31, 2011, and taken on record by the Board of Directors, we report that none of the directors is disqualified as on March 31, 2011 from being appointed as a director in terms of Clause (g) of sub-section (1) of Section 274 of the Companies Act, 1956.
vi. In our opinion and to the best of our information and according to the explanations given to us, the said accounts give the information required by the Companies Act, 1956, in the manner so required and give a true and fair view in conformity with the accounting principles generally accepted in India;
(a) in the case of the balance sheet, of the state of affairs of the Company as at March 31, 2011;
(b) in the case of the profit and loss account, of the profit for the year ended on that date; and
(c) in the case of cash flow statement, of the cash flows for the year ended on that date.
For S.R. BATLIBOI & ASSOCIATESFirm registration number: 101049WChartered Accountants
per Aditya Vikram BhauwalaPartner Membership No.: 208382
Bangalore April 28, 2011
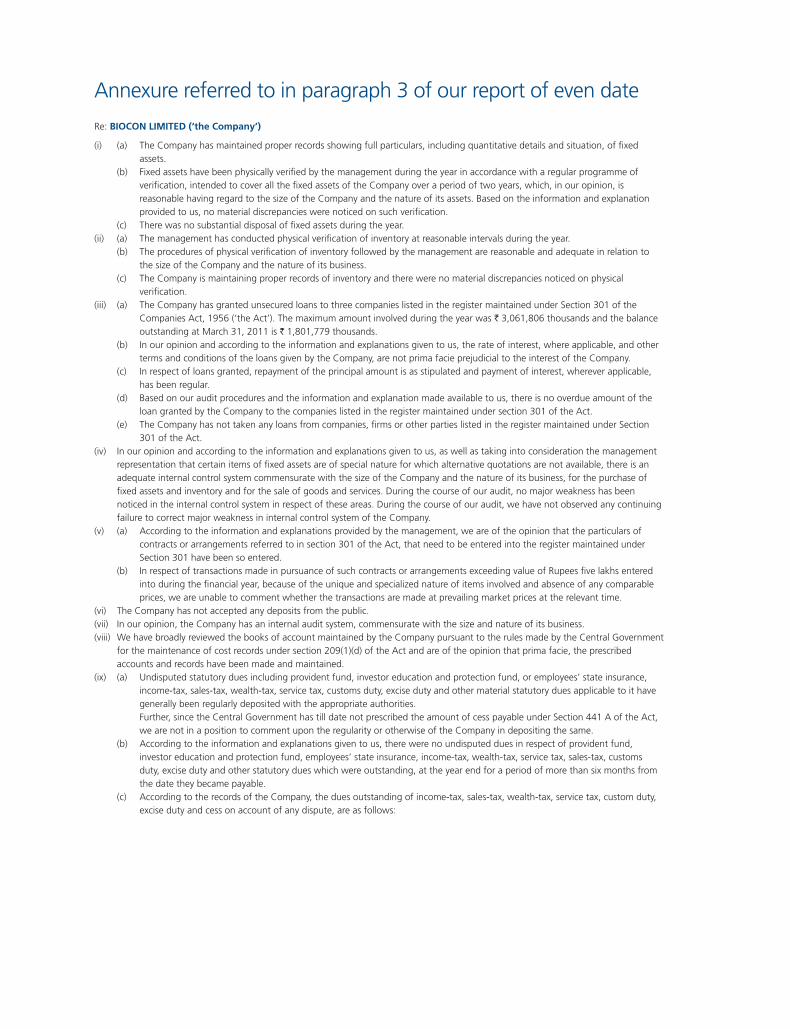
Annexure referred to in paragraph 3 of our report of even date
Re: BIOCON LIMITED (‘the Company’)
(i) (a) The Company has maintained proper records showing full particulars, including quantitative details and situation, of fixed assets.
(b) Fixed assets have been physically verified by the management during the year in accordance with a regular programme of verification, intended to cover all the fixed assets of the Company over a period of two years, which, in our opinion, is reasonable having regard to the size of the Company and the nature of its assets. Based on the information and explanation provided to us, no material discrepancies were noticed on such verification.
(c) There was no substantial disposal of fixed assets during the year.(ii) (a) The management has conducted physical verification of inventory at reasonable intervals during the year. (b) The procedures of physical verification of inventory followed by the management are reasonable and adequate in relation to
the size of the Company and the nature of its business. (c) The Company is maintaining proper records of inventory and there were no material discrepancies noticed on physical
verification. (iii) (a) The Company has granted unsecured loans to three companies listed in the register maintained under Section 301 of the
Companies Act, 1956 (‘the Act’). The maximum amount involved during the year was ` 3,061,806 thousands and the balance outstanding at March 31, 2011 is ` 1,801,779 thousands.
(b) In our opinion and according to the information and explanations given to us, the rate of interest, where applicable, and other terms and conditions of the loans given by the Company, are not prima facie prejudicial to the interest of the Company.
(c) In respect of loans granted, repayment of the principal amount is as stipulated and payment of interest, wherever applicable, has been regular.
(d) Based on our audit procedures and the information and explanation made available to us, there is no overdue amount of the loan granted by the Company to the companies listed in the register maintained under section 301 of the Act.
(e) The Company has not taken any loans from companies, firms or other parties listed in the register maintained under Section 301 of the Act.
(iv) In our opinion and according to the information and explanations given to us, as well as taking into consideration the management representation that certain items of fixed assets are of special nature for which alternative quotations are not available, there is an adequate internal control system commensurate with the size of the Company and the nature of its business, for the purchase of fixed assets and inventory and for the sale of goods and services. During the course of our audit, no major weakness has been noticed in the internal control system in respect of these areas. During the course of our audit, we have not observed any continuing failure to correct major weakness in internal control system of the Company.
(v) (a) According to the information and explanations provided by the management, we are of the opinion that the particulars of contracts or arrangements referred to in section 301 of the Act, that need to be entered into the register maintained under Section 301 have been so entered.
(b) In respect of transactions made in pursuance of such contracts or arrangements exceeding value of Rupees five lakhs entered into during the financial year, because of the unique and specialized nature of items involved and absence of any comparable prices, we are unable to comment whether the transactions are made at prevailing market prices at the relevant time.
(vi) The Company has not accepted any deposits from the public. (vii) In our opinion, the Company has an internal audit system, commensurate with the size and nature of its business. (viii) We have broadly reviewed the books of account maintained by the Company pursuant to the rules made by the Central Government
for the maintenance of cost records under section 209(1)(d) of the Act and are of the opinion that prima facie, the prescribed accounts and records have been made and maintained.
(ix) (a) Undisputed statutory dues including provident fund, investor education and protection fund, or employees’ state insurance, income-tax, sales-tax, wealth-tax, service tax, customs duty, excise duty and other material statutory dues applicable to it have generally been regularly deposited with the appropriate authorities.
Further, since the Central Government has till date not prescribed the amount of cess payable under Section 441 A of the Act, we are not in a position to comment upon the regularity or otherwise of the Company in depositing the same.
(b) According to the information and explanations given to us, there were no undisputed dues in respect of provident fund, investor education and protection fund, employees’ state insurance, income-tax, wealth-tax, service tax, sales-tax, customs duty, excise duty and other statutory dues which were outstanding, at the year end for a period of more than six months from the date they became payable.
(c) According to the records of the Company, the dues outstanding of income-tax, sales-tax, wealth-tax, service tax, custom duty, excise duty and cess on account of any dispute, are as follows:
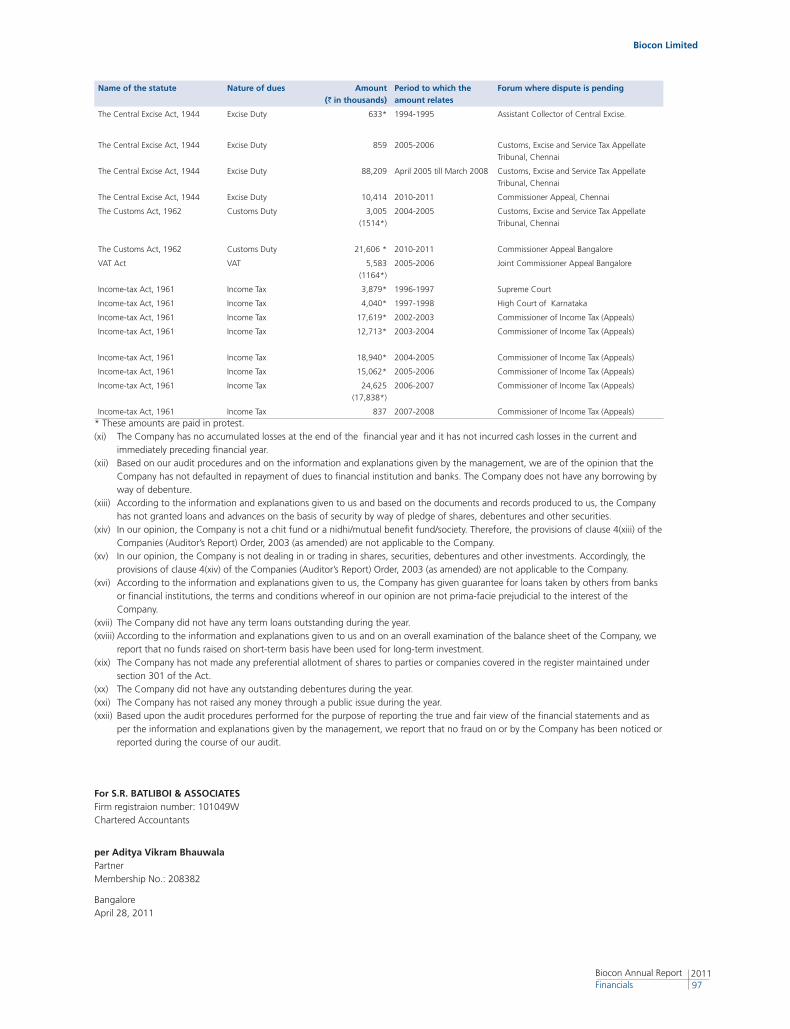
Biocon Limited
201197
Biocon Annual Report Financials
Name of the statute Nature of dues Amount (` in thousands)
Period to which the amount relates
Forum where dispute is pending
The Central Excise Act, 1944 Excise Duty 633* 1994-1995 Assistant Collector of Central Excise.
The Central Excise Act, 1944 Excise Duty 859 2005-2006 Customs, Excise and Service Tax Appellate
Tribunal, Chennai
The Central Excise Act, 1944 Excise Duty 88,209 April 2005 till March 2008 Customs, Excise and Service Tax Appellate
Tribunal, Chennai
The Central Excise Act, 1944 Excise Duty 10,414 2010-2011 Commissioner Appeal, Chennai
The Customs Act, 1962 Customs Duty 3,005
(1514*)
2004-2005 Customs, Excise and Service Tax Appellate
Tribunal, Chennai
The Customs Act, 1962 Customs Duty 21,606 * 2010-2011 Commissioner Appeal Bangalore
VAT Act VAT 5,583
(1164*)
2005-2006 Joint Commissioner Appeal Bangalore
Income-tax Act, 1961 Income Tax 3,879* 1996-1997 Supreme Court
Income-tax Act, 1961 Income Tax 4,040* 1997-1998 High Court of Karnataka
Income-tax Act, 1961 Income Tax 17,619* 2002-2003 Commissioner of Income Tax (Appeals)
Income-tax Act, 1961 Income Tax 12,713* 2003-2004 Commissioner of Income Tax (Appeals)
Income-tax Act, 1961 Income Tax 18,940* 2004-2005 Commissioner of Income Tax (Appeals)
Income-tax Act, 1961 Income Tax 15,062* 2005-2006 Commissioner of Income Tax (Appeals)
Income-tax Act, 1961 Income Tax 24,625
(17,838*)
2006-2007 Commissioner of Income Tax (Appeals)
Income-tax Act, 1961 Income Tax 837 2007-2008 Commissioner of Income Tax (Appeals)
* These amounts are paid in protest.(xi) The Company has no accumulated losses at the end of the financial year and it has not incurred cash losses in the current and
immediately preceding financial year. (xii) Based on our audit procedures and on the information and explanations given by the management, we are of the opinion that the
Company has not defaulted in repayment of dues to financial institution and banks. The Company does not have any borrowing by way of debenture.
(xiii) According to the information and explanations given to us and based on the documents and records produced to us, the Company has not granted loans and advances on the basis of security by way of pledge of shares, debentures and other securities.
(xiv) In our opinion, the Company is not a chit fund or a nidhi/mutual benefit fund/society. Therefore, the provisions of clause 4(xiii) of the Companies (Auditor’s Report) Order, 2003 (as amended) are not applicable to the Company.
(xv) In our opinion, the Company is not dealing in or trading in shares, securities, debentures and other investments. Accordingly, the provisions of clause 4(xiv) of the Companies (Auditor’s Report) Order, 2003 (as amended) are not applicable to the Company.
(xvi) According to the information and explanations given to us, the Company has given guarantee for loans taken by others from banks or financial institutions, the terms and conditions whereof in our opinion are not prima-facie prejudicial to the interest of the Company.
(xvii) The Company did not have any term loans outstanding during the year.(xviii) According to the information and explanations given to us and on an overall examination of the balance sheet of the Company, we
report that no funds raised on short-term basis have been used for long-term investment.(xix) The Company has not made any preferential allotment of shares to parties or companies covered in the register maintained under
section 301 of the Act.(xx) The Company did not have any outstanding debentures during the year.(xxi) The Company has not raised any money through a public issue during the year.(xxii) Based upon the audit procedures performed for the purpose of reporting the true and fair view of the financial statements and as
per the information and explanations given by the management, we report that no fraud on or by the Company has been noticed or reported during the course of our audit.
For S.R. BATLIBOI & ASSOCIATESFirm registraion number: 101049WChartered Accountants
per Aditya Vikram BhauwalaPartner Membership No.: 208382
Bangalore April 28, 2011
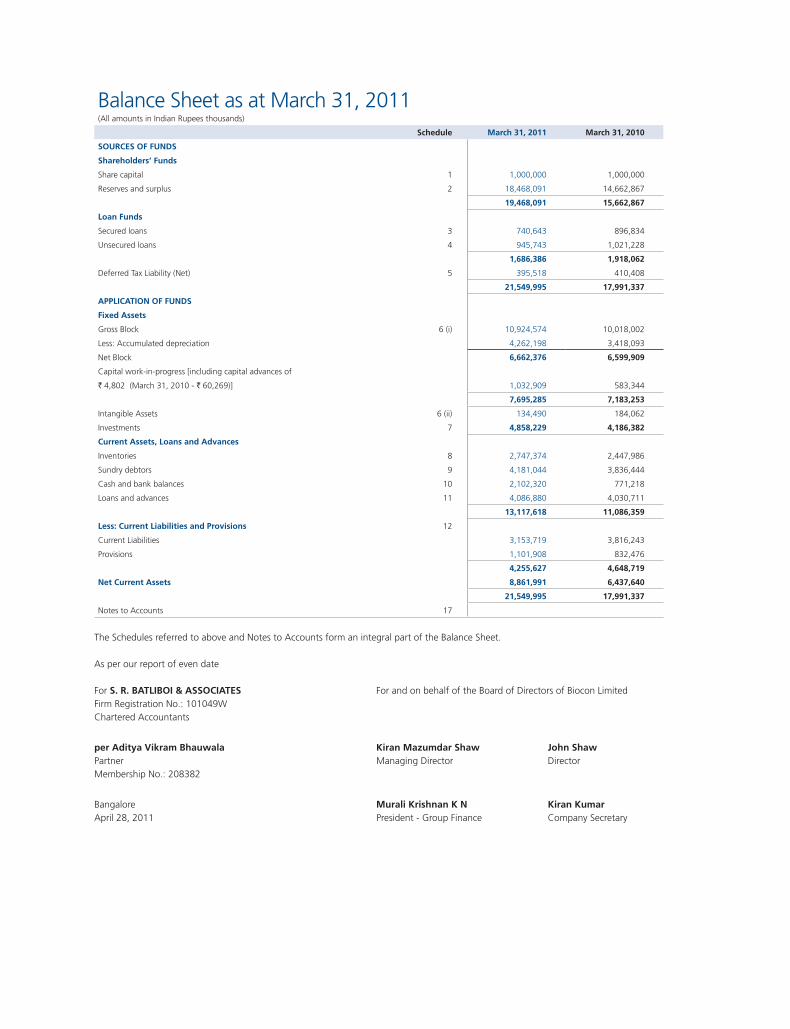
Balance Sheet as at March 31, 2011(All amounts in Indian Rupees thousands)
Schedule March 31, 2011 March 31, 2010
SOURCES OF FUNDS
Shareholders’ Funds
Share capital 1 1,000,000 1,000,000
Reserves and surplus 2 18,468,091 14,662,867
19,468,091 15,662,867
Loan Funds
Secured loans 3 740,643 896,834
Unsecured loans 4 945,743 1,021,228
1,686,386 1,918,062
Deferred Tax Liability (Net) 5 395,518 410,408
21,549,995 17,991,337
APPLICATION OF FUNDS
Fixed Assets
Gross Block 6 (i) 10,924,574 10,018,002
Less: Accumulated depreciation 4,262,198 3,418,093
Net Block 6,662,376 6,599,909
Capital work-in-progress [including capital advances of
` 4,802 (March 31, 2010 - ` 60,269)] 1,032,909 583,344
7,695,285 7,183,253
Intangible Assets 6 (ii) 134,490 184,062
Investments 7 4,858,229 4,186,382
Current Assets, Loans and Advances
Inventories 8 2,747,374 2,447,986
Sundry debtors 9 4,181,044 3,836,444
Cash and bank balances 10 2,102,320 771,218
Loans and advances 11 4,086,880 4,030,711
13,117,618 11,086,359
Less: Current Liabilities and Provisions 12
Current Liabilities 3,153,719 3,816,243
Provisions 1,101,908 832,476
4,255,627 4,648,719
Net Current Assets 8,861,991 6,437,640
21,549,995 17,991,337
Notes to Accounts 17
The Schedules referred to above and Notes to Accounts form an integral part of the Balance Sheet.
As per our report of even date
For S. R. BATLIBOI & ASSOCIATES For and on behalf of the Board of Directors of Biocon LimitedFirm Registration No.: 101049WChartered Accountants
per Aditya Vikram Bhauwala Kiran Mazumdar Shaw John ShawPartner Managing Director DirectorMembership No.: 208382
Bangalore Murali Krishnan K N Kiran KumarApril 28, 2011 President - Group Finance Company Secretary
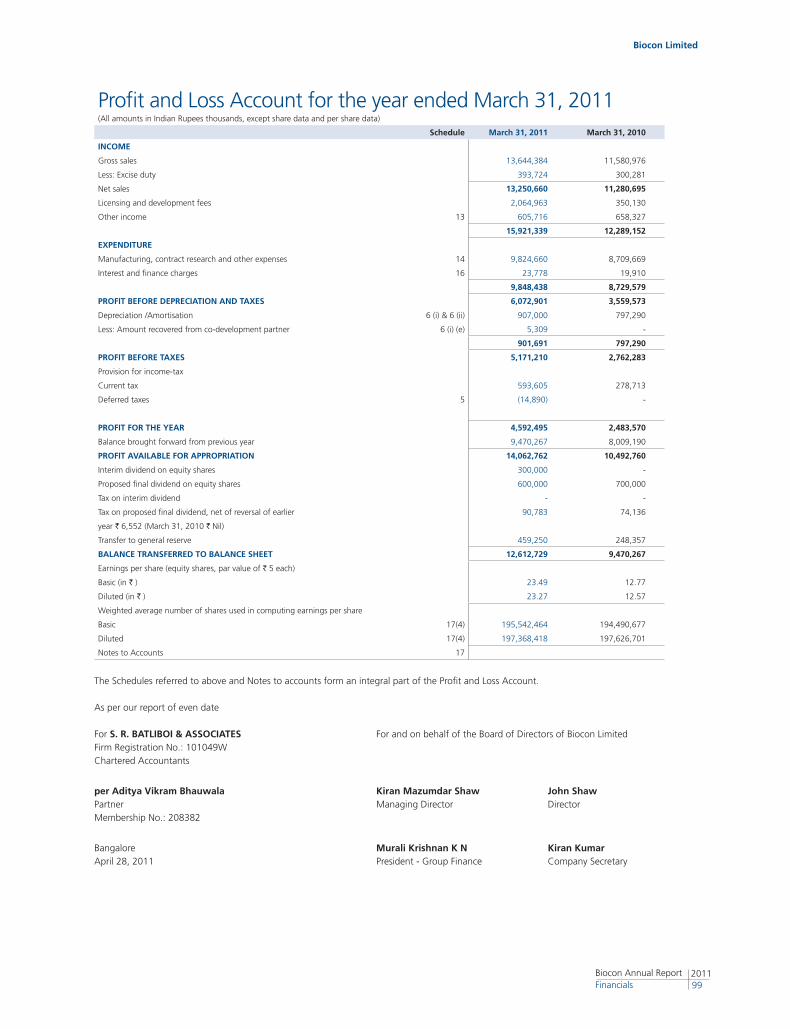
Biocon Limited
201199
Biocon Annual Report Financials
The Schedules referred to above and Notes to accounts form an integral part of the Profit and Loss Account.
As per our report of even date
For S. R. BATLIBOI & ASSOCIATES For and on behalf of the Board of Directors of Biocon LimitedFirm Registration No.: 101049WChartered Accountants
per Aditya Vikram Bhauwala Kiran Mazumdar Shaw John ShawPartner Managing Director DirectorMembership No.: 208382
Bangalore Murali Krishnan K N Kiran KumarApril 28, 2011 President - Group Finance Company Secretary
Profit and Loss Account for the year ended March 31, 2011(All amounts in Indian Rupees thousands, except share data and per share data)
Schedule March 31, 2011 March 31, 2010
INCOME
Gross sales 13,644,384 11,580,976
Less: Excise duty 393,724 300,281
Net sales 13,250,660 11,280,695
Licensing and development fees 2,064,963 350,130
Other income 13 605,716 658,327
15,921,339 12,289,152
EXPENDITURE
Manufacturing, contract research and other expenses 14 9,824,660 8,709,669
Interest and finance charges 16 23,778 19,910
9,848,438 8,729,579
PROFIT BEFORE DEPRECIATION AND TAXES 6,072,901 3,559,573
Depreciation /Amortisation 6 (i) & 6 (ii) 907,000 797,290
Less: Amount recovered from co-development partner 6 (i) (e) 5,309 -
901,691 797,290
PROFIT BEFORE TAXES 5,171,210 2,762,283
Provision for income-tax
Current tax 593,605 278,713
Deferred taxes 5 (14,890) -
PROFIT FOR THE YEAR 4,592,495 2,483,570
Balance brought forward from previous year 9,470,267 8,009,190
PROFIT AVAILABLE FOR APPROPRIATION 14,062,762 10,492,760
Interim dividend on equity shares 300,000 -
Proposed final dividend on equity shares 600,000 700,000
Tax on interim dividend - -
Tax on proposed final dividend, net of reversal of earlier 90,783 74,136
year ` 6,552 (March 31, 2010 ` Nil)
Transfer to general reserve 459,250 248,357
BALANCE TRANSFERRED TO BALANCE SHEET 12,612,729 9,470,267
Earnings per share (equity shares, par value of ` 5 each)
Basic (in ` ) 23.49 12.77
Diluted (in ` ) 23.27 12.57
Weighted average number of shares used in computing earnings per share
Basic 17(4) 195,542,464 194,490,677
Diluted 17(4) 197,368,418 197,626,701
Notes to Accounts 17
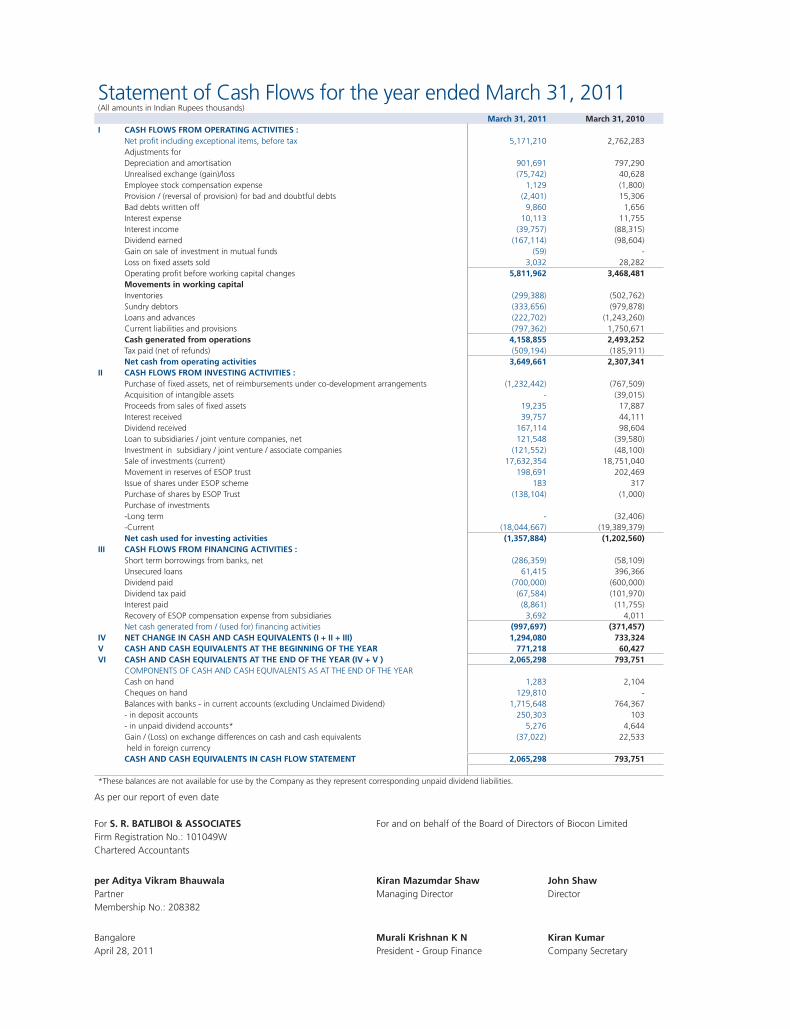
Statement of Cash Flows for the year ended March 31, 2011(All amounts in Indian Rupees thousands)
March 31, 2011 March 31, 2010I CASH FLOWS FROM OPERATING ACTIVITIES :
Net profit including exceptional items, before tax 5,171,210 2,762,283 Adjustments for Depreciation and amortisation 901,691 797,290 Unrealised exchange (gain)/loss (75,742) 40,628 Employee stock compensation expense 1,129 (1,800)Provision / (reversal of provision) for bad and doubtful debts (2,401) 15,306 Bad debts written off 9,860 1,656 Interest expense 10,113 11,755 Interest income (39,757) (88,315)Dividend earned (167,114) (98,604)Gain on sale of investment in mutual funds (59) - Loss on fixed assets sold 3,032 28,282 Operating profit before working capital changes 5,811,962 3,468,481 Movements in working capitalInventories (299,388) (502,762)Sundry debtors (333,656) (979,878)Loans and advances (222,702) (1,243,260)Current liabilities and provisions (797,362) 1,750,671 Cash generated from operations 4,158,855 2,493,252 Tax paid (net of refunds) (509,194) (185,911)Net cash from operating activities 3,649,661 2,307,341
II CASH FLOWS FROM INVESTING ACTIVITIES :Purchase of fixed assets, net of reimbursements under co-development arrangements (1,232,442) (767,509)Acquisition of intangible assets - (39,015)Proceeds from sales of fixed assets 19,235 17,887 Interest received 39,757 44,111 Dividend received 167,114 98,604 Loan to subsidiaries / joint venture companies, net 121,548 (39,580)Investment in subsidiary / joint venture / associate companies (121,552) (48,100)Sale of investments (current) 17,632,354 18,751,040 Movement in reserves of ESOP trust 198,691 202,469 Issue of shares under ESOP scheme 183 317 Purchase of shares by ESOP Trust (138,104) (1,000)Purchase of investments-Long term - (32,406)-Current (18,044,667) (19,389,379)Net cash used for investing activities (1,357,884) (1,202,560)
III CASH FLOWS FROM FINANCING ACTIVITIES :Short term borrowings from banks, net (286,359) (58,109)Unsecured loans 61,415 396,366 Dividend paid (700,000) (600,000)Dividend tax paid (67,584) (101,970)Interest paid (8,861) (11,755)Recovery of ESOP compensation expense from subsidiaries 3,692 4,011 Net cash generated from / (used for) financing activities (997,697) (371,457)
IV NET CHANGE IN CASH AND CASH EQUIVALENTS (I + II + III) 1,294,080 733,324 V CASH AND CASH EQUIVALENTS AT THE BEGINNING OF THE YEAR 771,218 60,427 VI CASH AND CASH EQUIVALENTS AT THE END OF THE YEAR (IV + V ) 2,065,298 793,751
COMPONENTS OF CASH AND CASH EQUIVALENTS AS AT THE END OF THE YEARCash on hand 1,283 2,104 Cheques on hand 129,810 - Balances with banks - in current accounts (excluding Unclaimed Dividend) 1,715,648 764,367 - in deposit accounts 250,303 103 - in unpaid dividend accounts* 5,276 4,644 Gain / (Loss) on exchange differences on cash and cash equivalents (37,022) 22,533 held in foreign currencyCASH AND CASH EQUIVALENTS IN CASH FLOW STATEMENT 2,065,298 793,751
*These balances are not available for use by the Company as they represent corresponding unpaid dividend liabilities.
As per our report of even date
For S. R. BATLIBOI & ASSOCIATES For and on behalf of the Board of Directors of Biocon LimitedFirm Registration No.: 101049WChartered Accountants
per Aditya Vikram Bhauwala Kiran Mazumdar Shaw John ShawPartner Managing Director DirectorMembership No.: 208382
Bangalore Murali Krishnan K N Kiran KumarApril 28, 2011 President - Group Finance Company Secretary
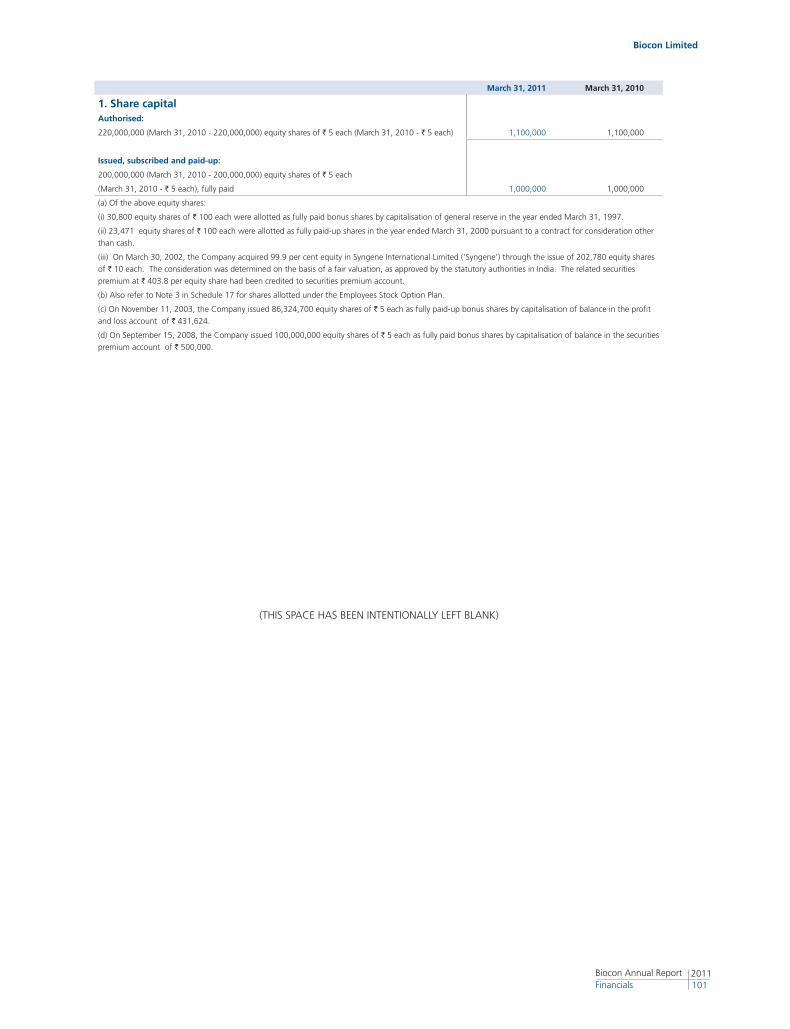
Biocon Limited
2011101
Biocon Annual Report Financials
March 31, 2011 March 31, 2010
1. Share capitalAuthorised:
220,000,000 (March 31, 2010 - 220,000,000) equity shares of ` 5 each (March 31, 2010 - ` 5 each) 1,100,000 1,100,000
Issued, subscribed and paid-up:
200,000,000 (March 31, 2010 - 200,000,000) equity shares of ` 5 each
(March 31, 2010 - ` 5 each), fully paid 1,000,000 1,000,000
(a) Of the above equity shares:
(i) 30,800 equity shares of ` 100 each were allotted as fully paid bonus shares by capitalisation of general reserve in the year ended March 31, 1997.
(ii) 23,471 equity shares of ` 100 each were allotted as fully paid-up shares in the year ended March 31, 2000 pursuant to a contract for consideration other
than cash.
(iii) On March 30, 2002, the Company acquired 99.9 per cent equity in Syngene International Limited (‘Syngene’) through the issue of 202,780 equity shares
of ` 10 each. The consideration was determined on the basis of a fair valuation, as approved by the statutory authorities in India. The related securities
premium at ` 403.8 per equity share had been credited to securities premium account.
(b) Also refer to Note 3 in Schedule 17 for shares allotted under the Employees Stock Option Plan.
(c) On November 11, 2003, the Company issued 86,324,700 equity shares of ` 5 each as fully paid-up bonus shares by capitalisation of balance in the profit
and loss account of ` 431,624.
(d) On September 15, 2008, the Company issued 100,000,000 equity shares of ` 5 each as fully paid bonus shares by capitalisation of balance in the securities
premium account of ` 500,000.
(THIS SPACE HAS BEEN INTENTIONALLY LEFT BLANK)
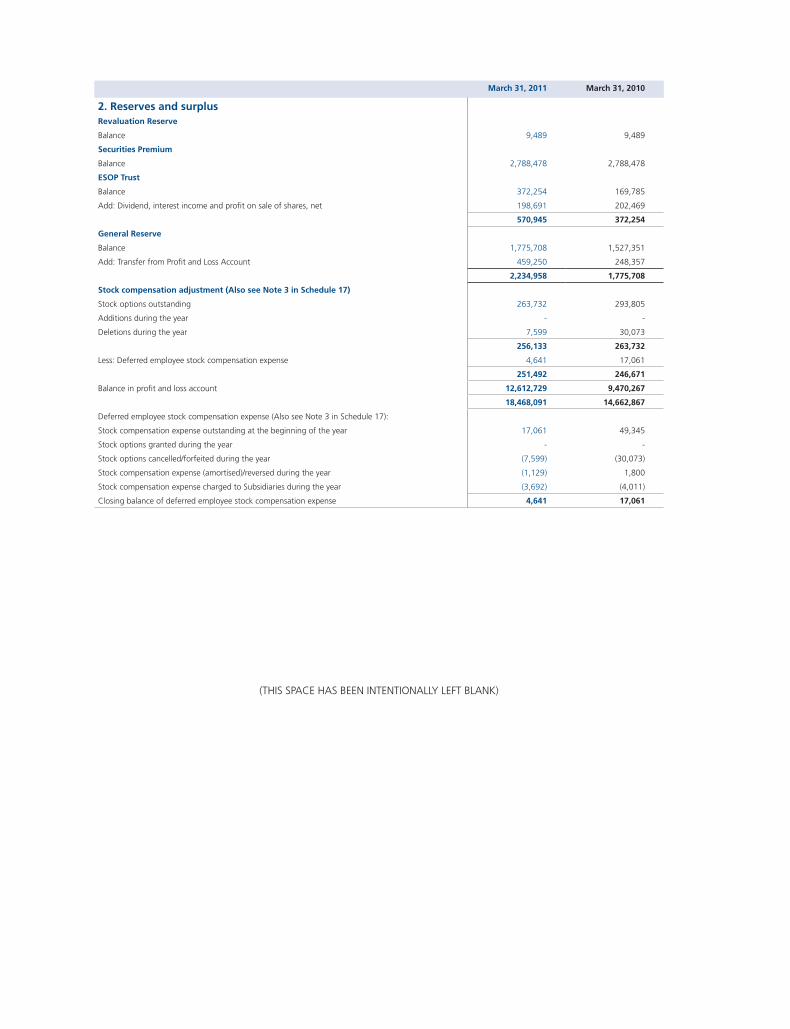
March 31, 2011 March 31, 2010
2. Reserves and surplusRevaluation Reserve
Balance 9,489 9,489
Securities Premium
Balance 2,788,478 2,788,478
ESOP Trust
Balance 372,254 169,785
Add: Dividend, interest income and profit on sale of shares, net 198,691 202,469
570,945 372,254
General Reserve
Balance 1,775,708 1,527,351
Add: Transfer from Profit and Loss Account 459,250 248,357
2,234,958 1,775,708
Stock compensation adjustment (Also see Note 3 in Schedule 17)
Stock options outstanding 263,732 293,805
Additions during the year - -
Deletions during the year 7,599 30,073
256,133 263,732
Less: Deferred employee stock compensation expense 4,641 17,061
251,492 246,671
Balance in profit and loss account 12,612,729 9,470,267
18,468,091 14,662,867
Deferred employee stock compensation expense (Also see Note 3 in Schedule 17):
Stock compensation expense outstanding at the beginning of the year 17,061 49,345
Stock options granted during the year - -
Stock options cancelled/forfeited during the year (7,599) (30,073)
Stock compensation expense (amortised)/reversed during the year (1,129) 1,800
Stock compensation expense charged to Subsidiaries during the year (3,692) (4,011)
Closing balance of deferred employee stock compensation expense 4,641 17,061
(THIS SPACE HAS BEEN INTENTIONALLY LEFT BLANK)
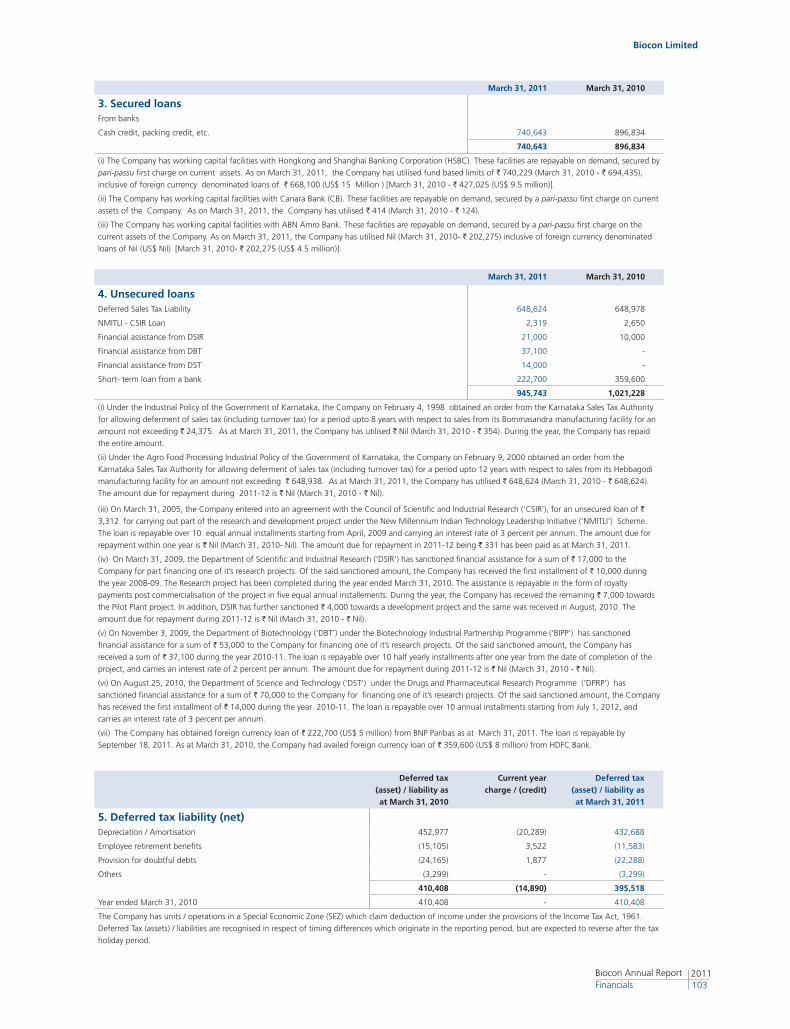
Biocon Limited
2011103
Biocon Annual Report Financials
March 31, 2011 March 31, 2010
3. Secured loansFrom banks
Cash credit, packing credit, etc. 740,643 896,834
740,643 896,834
(i) The Company has working capital facilities with Hongkong and Shanghai Banking Corporation (HSBC). These facilities are repayable on demand, secured by
pari-passu first charge on current assets. As on March 31, 2011, the Company has utilised fund based limits of ` 740,229 (March 31, 2010 - ` 694,435),
inclusive of foreign currency denominated loans of ` 668,100 (US$ 15 Million ) [March 31, 2010 - ` 427,025 (US$ 9.5 million)].
(ii) The Company has working capital facilities with Canara Bank (CB). These facilities are repayable on demand, secured by a pari-passu first charge on current
assets of the Company. As on March 31, 2011, the Company has utilised ` 414 (March 31, 2010 - ` 124).
(iii) The Company has working capital facilities with ABN Amro Bank. These facilities are repayable on demand, secured by a pari-passu first charge on the
current assets of the Company. As on March 31, 2011, the Company has utilised Nil (March 31, 2010- ` 202,275) inclusive of foreign currency denominated
loans of Nil (US$ Nil) [March 31, 2010- ` 202,275 (US$ 4.5 million)].
March 31, 2011 March 31, 2010
4. Unsecured loansDeferred Sales Tax Liability 648,624 648,978
NMITLI - CSIR Loan 2,319 2,650
Financial assistance from DSIR 21,000 10,000
Financial assistance from DBT 37,100 -
Financial assistance from DST 14,000 -
Short- term loan from a bank 222,700 359,600
945,743 1,021,228
(i) Under the Industrial Policy of the Government of Karnataka, the Company on February 4, 1998 obtained an order from the Karnataka Sales Tax Authority
for allowing deferment of sales tax (including turnover tax) for a period upto 8 years with respect to sales from its Bommasandra manufacturing facility for an
amount not exceeding ` 24,375. As at March 31, 2011, the Company has utilised ` Nil (March 31, 2010 - ` 354). During the year, the Company has repaid
the entire amount.
(ii) Under the Agro Food Processing Industrial Policy of the Government of Karnataka, the Company on February 9, 2000 obtained an order from the
Karnataka Sales Tax Authority for allowing deferment of sales tax (including turnover tax) for a period upto 12 years with respect to sales from its Hebbagodi
manufacturing facility for an amount not exceeding ` 648,938. As at March 31, 2011, the Company has utilised ` 648,624 (March 31, 2010 - ` 648,624).
The amount due for repayment during 2011-12 is ` Nil (March 31, 2010 - ` Nil).
(iii) On March 31, 2005, the Company entered into an agreement with the Council of Scientific and Industrial Research (‘CSIR’), for an unsecured loan of `
3,312 for carrying out part of the research and development project under the New Millennium Indian Technology Leadership Initiative (‘NMITLI’) Scheme.
The loan is repayable over 10 equal annual installments starting from April, 2009 and carrying an interest rate of 3 percent per annum. The amount due for
repayment within one year is ` Nil (March 31, 2010- Nil). The amount due for repayment in 2011-12 being ` 331 has been paid as at March 31, 2011.
(iv) On March 31, 2009, the Department of Scientific and Industrial Research (‘DSIR’) has sanctioned financial assistance for a sum of ` 17,000 to the
Company for part financing one of it’s research projects. Of the said sanctioned amount, the Company has received the first installment of ` 10,000 during
the year 2008-09. The Research project has been completed during the year ended March 31, 2010. The assistance is repayable in the form of royalty
payments post commercialisation of the project in five equal annual installements. During the year, the Company has received the remaining ` 7,000 towards
the Pilot Plant project. In addition, DSIR has further sanctioned ` 4,000 towards a development project and the same was received in August, 2010. The
amount due for repayment during 2011-12 is ` Nil (March 31, 2010 - ` Nil).
(v) On November 3, 2009, the Department of Biotechnology (‘DBT’) under the Biotechnology Industrial Partnership Programme (‘BIPP’) has sanctioned
financial assistance for a sum of ` 53,000 to the Company for financing one of it’s research projects. Of the said sanctioned amount, the Company has
received a sum of ` 37,100 during the year 2010-11. The loan is repayable over 10 half yearly installments after one year from the date of completion of the
project, and carries an interest rate of 2 percent per annum. The amount due for repayment during 2011-12 is ` Nil (March 31, 2010 - ` Nil).
(vi) On August 25, 2010, the Department of Science and Technology (‘DST’) under the Drugs and Pharmaceutical Research Programme (‘DPRP’) has
sanctioned financial assistance for a sum of ` 70,000 to the Company for financing one of it’s research projects. Of the said sanctioned amount, the Company
has received the first installment of ` 14,000 during the year 2010-11. The loan is repayable over 10 annual installments starting from July 1, 2012, and
carries an interest rate of 3 percent per annum.
(vii) The Company has obtained foreign currency loan of ` 222,700 (US$ 5 million) from BNP Paribas as at March 31, 2011. The loan is repayable by
September 18, 2011. As at March 31, 2010, the Company had availed foreign currency loan of ` 359,600 (US$ 8 million) from HDFC Bank.
Deferred tax (asset) / liability as at March 31, 2010
Current year charge / (credit)
Deferred tax (asset) / liability as at March 31, 2011
5. Deferred tax liability (net)Depreciation / Amortisation 452,977 (20,289) 432,688
Employee retirement benefits (15,105) 3,522 (11,583)
Provision for doubtful debts (24,165) 1,877 (22,288)
Others (3,299) - (3,299)
410,408 (14,890) 395,518
Year ended March 31, 2010 410,408 - 410,408
The Company has units / operations in a Special Economic Zone (SEZ) which claim deduction of income under the provisions of the Income Tax Act, 1961.
Deferred Tax (assets) / liabilities are recognised in respect of timing differences which originate in the reporting period, but are expected to reverse after the tax
holiday period.
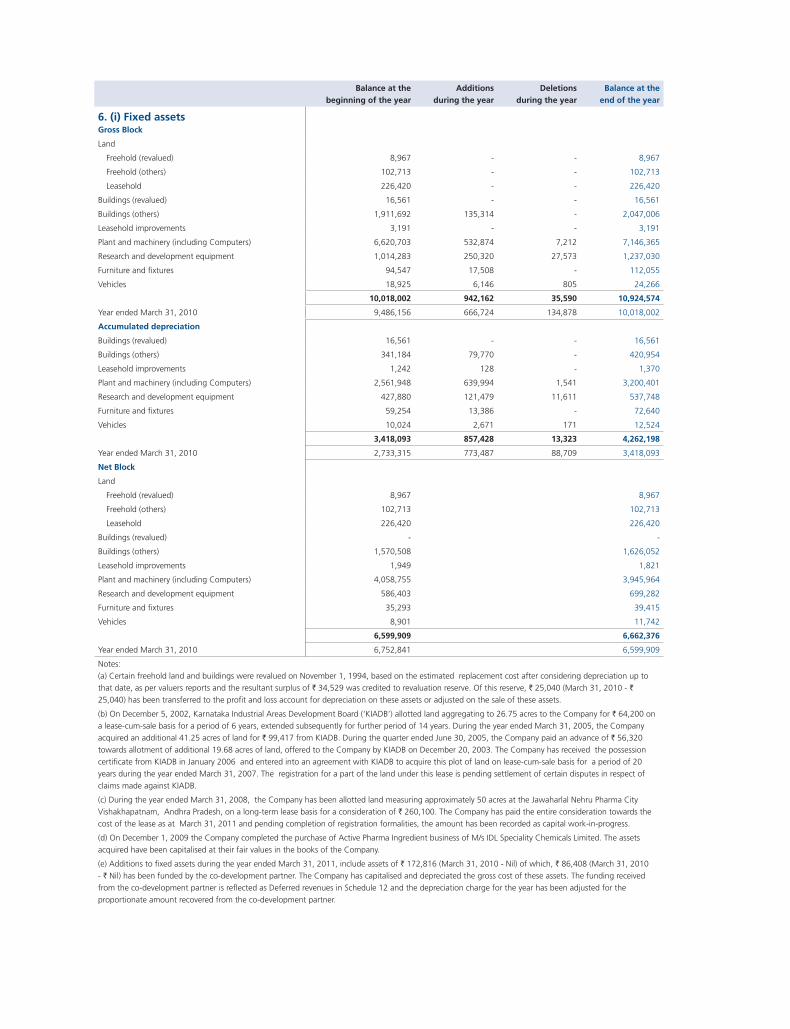
Balance at thebeginning of the year
Additions during the year
Deletionsduring the year
Balance at theend of the year
6. (i) Fixed assetsGross Block
Land
Freehold (revalued) 8,967 - - 8,967
Freehold (others) 102,713 - - 102,713
Leasehold 226,420 - - 226,420
Buildings (revalued) 16,561 - - 16,561
Buildings (others) 1,911,692 135,314 - 2,047,006
Leasehold improvements 3,191 - - 3,191
Plant and machinery (including Computers) 6,620,703 532,874 7,212 7,146,365
Research and development equipment 1,014,283 250,320 27,573 1,237,030
Furniture and fixtures 94,547 17,508 - 112,055
Vehicles 18,925 6,146 805 24,266
10,018,002 942,162 35,590 10,924,574
Year ended March 31, 2010 9,486,156 666,724 134,878 10,018,002
Accumulated depreciation
Buildings (revalued) 16,561 - - 16,561
Buildings (others) 341,184 79,770 - 420,954
Leasehold improvements 1,242 128 - 1,370
Plant and machinery (including Computers) 2,561,948 639,994 1,541 3,200,401
Research and development equipment 427,880 121,479 11,611 537,748
Furniture and fixtures 59,254 13,386 - 72,640
Vehicles 10,024 2,671 171 12,524
3,418,093 857,428 13,323 4,262,198
Year ended March 31, 2010 2,733,315 773,487 88,709 3,418,093
Net Block
Land
Freehold (revalued) 8,967 8,967
Freehold (others) 102,713 102,713
Leasehold 226,420 226,420
Buildings (revalued) - -
Buildings (others) 1,570,508 1,626,052
Leasehold improvements 1,949 1,821
Plant and machinery (including Computers) 4,058,755 3,945,964
Research and development equipment 586,403 699,282
Furniture and fixtures 35,293 39,415
Vehicles 8,901 11,742
6,599,909 6,662,376
Year ended March 31, 2010 6,752,841 6,599,909
Notes:
(a) Certain freehold land and buildings were revalued on November 1, 1994, based on the estimated replacement cost after considering depreciation up to
that date, as per valuers reports and the resultant surplus of ` 34,529 was credited to revaluation reserve. Of this reserve, ` 25,040 (March 31, 2010 - `
25,040) has been transferred to the profit and loss account for depreciation on these assets or adjusted on the sale of these assets.
(b) On December 5, 2002, Karnataka Industrial Areas Development Board (‘KIADB’) allotted land aggregating to 26.75 acres to the Company for ` 64,200 on
a lease-cum-sale basis for a period of 6 years, extended subsequently for further period of 14 years. During the year ended March 31, 2005, the Company
acquired an additional 41.25 acres of land for ` 99,417 from KIADB. During the quarter ended June 30, 2005, the Company paid an advance of ` 56,320
towards allotment of additional 19.68 acres of land, offered to the Company by KIADB on December 20, 2003. The Company has received the possession
certificate from KIADB in January 2006 and entered into an agreement with KIADB to acquire this plot of land on lease-cum-sale basis for a period of 20
years during the year ended March 31, 2007. The registration for a part of the land under this lease is pending settlement of certain disputes in respect of
claims made against KIADB.
(c) During the year ended March 31, 2008, the Company has been allotted land measuring approximately 50 acres at the Jawaharlal Nehru Pharma City
Vishakhapatnam, Andhra Pradesh, on a long-term lease basis for a consideration of ` 260,100. The Company has paid the entire consideration towards the
cost of the lease as at March 31, 2011 and pending completion of registration formalities, the amount has been recorded as capital work-in-progress.
(d) On December 1, 2009 the Company completed the purchase of Active Pharma Ingredient business of M/s IDL Speciality Chemicals Limited. The assets
acquired have been capitalised at their fair values in the books of the Company.
(e) Additions to fixed assets during the year ended March 31, 2011, include assets of ` 172,816 (March 31, 2010 - Nil) of which, ` 86,408 (March 31, 2010
- ` Nil) has been funded by the co-development partner. The Company has capitalised and depreciated the gross cost of these assets. The funding received
from the co-development partner is reflected as Deferred revenues in Schedule 12 and the depreciation charge for the year has been adjusted for the
proportionate amount recovered from the co-development partner.
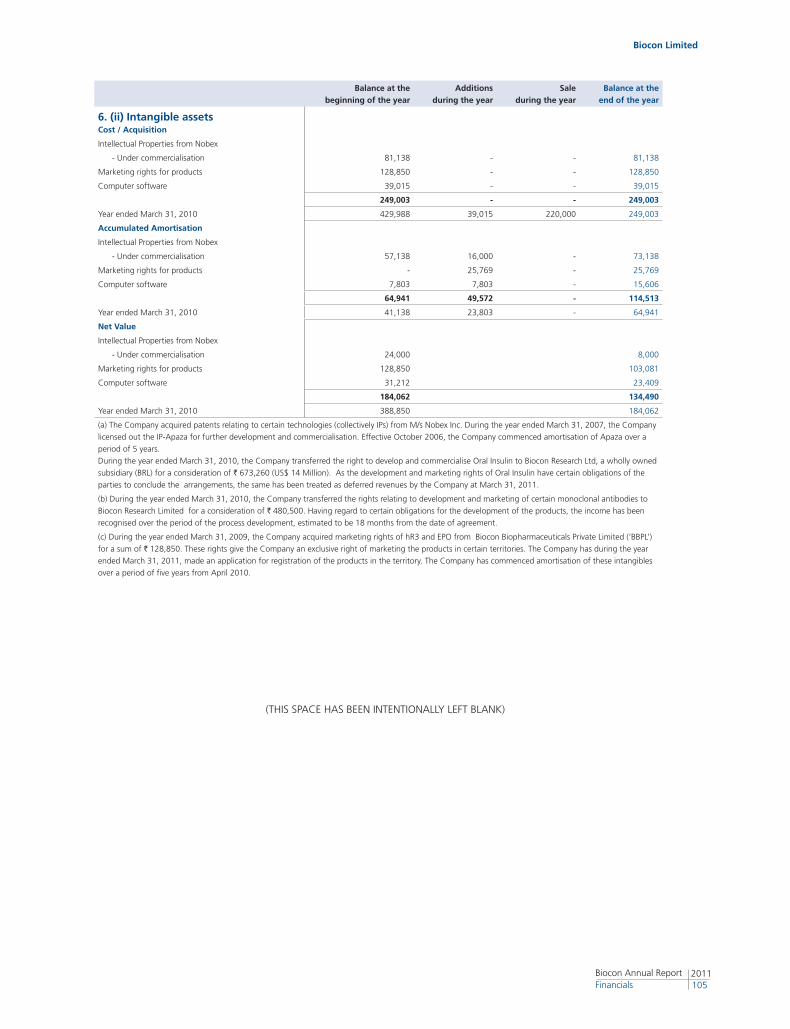
Biocon Limited
2011105
Biocon Annual Report Financials
Balance at thebeginning of the year
Additionsduring the year
Sale during the year
Balance at the end of the year
6. (ii) Intangible assetsCost / Acquisition
Intellectual Properties from Nobex
- Under commercialisation 81,138 - - 81,138
Marketing rights for products 128,850 - - 128,850
Computer software 39,015 - - 39,015
249,003 - - 249,003
Year ended March 31, 2010 429,988 39,015 220,000 249,003
Accumulated Amortisation
Intellectual Properties from Nobex
- Under commercialisation 57,138 16,000 - 73,138
Marketing rights for products - 25,769 - 25,769
Computer software 7,803 7,803 - 15,606
64,941 49,572 - 114,513
Year ended March 31, 2010 41,138 23,803 - 64,941
Net Value
Intellectual Properties from Nobex
- Under commercialisation 24,000 8,000
Marketing rights for products 128,850 103,081
Computer software 31,212 23,409
184,062 134,490
Year ended March 31, 2010 388,850 184,062
(a) The Company acquired patents relating to certain technologies (collectively IPs) from M/s Nobex Inc. During the year ended March 31, 2007, the Company
licensed out the IP-Apaza for further development and commercialisation. Effective October 2006, the Company commenced amortisation of Apaza over a
period of 5 years.
During the year ended March 31, 2010, the Company transferred the right to develop and commercialise Oral Insulin to Biocon Research Ltd, a wholly owned
subsidiary (BRL) for a consideration of ` 673,260 (US$ 14 Million). As the development and marketing rights of Oral Insulin have certain obligations of the
parties to conclude the arrangements, the same has been treated as deferred revenues by the Company at March 31, 2011.
(b) During the year ended March 31, 2010, the Company transferred the rights relating to development and marketing of certain monoclonal antibodies to
Biocon Research Limited for a consideration of ` 480,500. Having regard to certain obligations for the development of the products, the income has been
recognised over the period of the process development, estimated to be 18 months from the date of agreement.
(c) During the year ended March 31, 2009, the Company acquired marketing rights of hR3 and EPO from Biocon Biopharmaceuticals Private Limited (‘BBPL’)
for a sum of ` 128,850. These rights give the Company an exclusive right of marketing the products in certain territories. The Company has during the year
ended March 31, 2011, made an application for registration of the products in the territory. The Company has commenced amortisation of these intangibles
over a period of five years from April 2010.
(THIS SPACE HAS BEEN INTENTIONALLY LEFT BLANK)
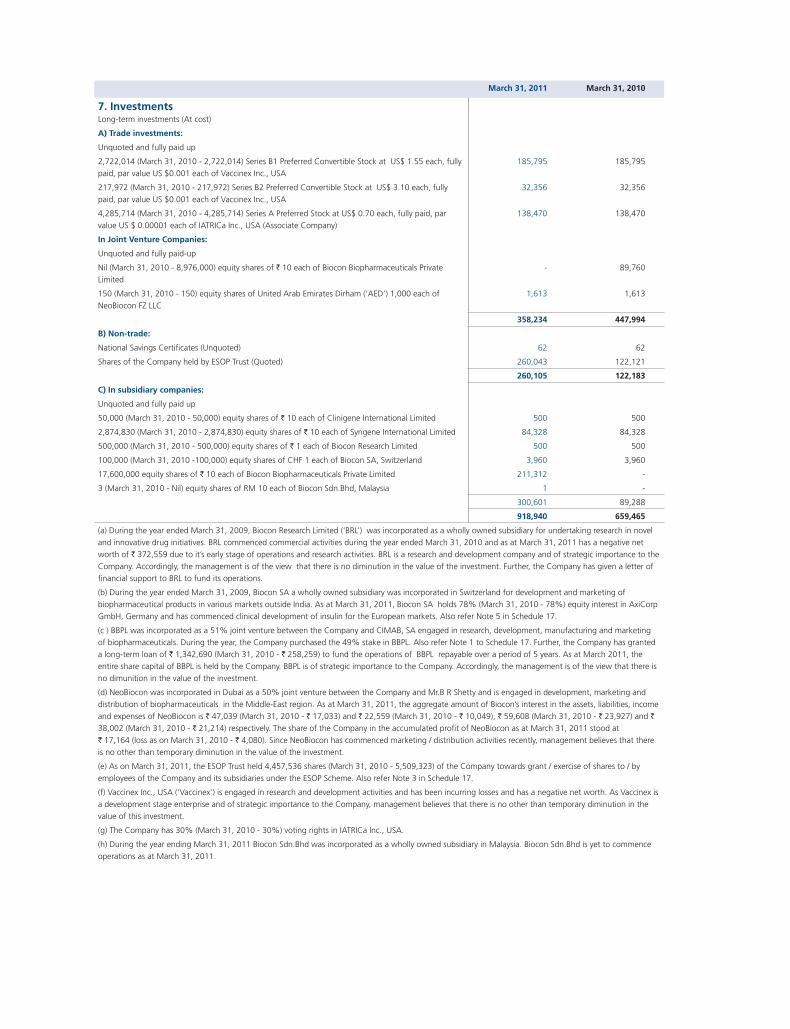
March 31, 2011 March 31, 2010
7. InvestmentsLong-term investments (At cost)
A) Trade investments:
Unquoted and fully paid up
2,722,014 (March 31, 2010 - 2,722,014) Series B1 Preferred Convertible Stock at US$ 1.55 each, fully
paid, par value US $0.001 each of Vaccinex Inc., USA
185,795 185,795
217,972 (March 31, 2010 - 217,972) Series B2 Preferred Convertible Stock at US$ 3.10 each, fully
paid, par value US $0.001 each of Vaccinex Inc., USA
32,356 32,356
4,285,714 (March 31, 2010 - 4,285,714) Series A Preferred Stock at US$ 0.70 each, fully paid, par
value US $ 0.00001 each of IATRICa Inc., USA (Associate Company)
138,470 138,470
In Joint Venture Companies:
Unquoted and fully paid-up
Nil (March 31, 2010 - 8,976,000) equity shares of ` 10 each of Biocon Biopharmaceuticals Private
Limited
- 89,760
150 (March 31, 2010 - 150) equity shares of United Arab Emirates Dirham (‘AED’) 1,000 each of
NeoBiocon FZ LLC
1,613 1,613
358,234 447,994
B) Non-trade:
National Savings Certificates (Unquoted) 62 62
Shares of the Company held by ESOP Trust (Quoted) 260,043 122,121
260,105 122,183
C) In subsidiary companies:
Unquoted and fully paid up
50,000 (March 31, 2010 - 50,000) equity shares of ` 10 each of Clinigene International Limited 500 500
2,874,830 (March 31, 2010 - 2,874,830) equity shares of ` 10 each of Syngene International Limited 84,328 84,328
500,000 (March 31, 2010 - 500,000) equity shares of ` 1 each of Biocon Research Limited 500 500
100,000 (March 31, 2010 -100,000) equity shares of CHF 1 each of Biocon SA, Switzerland 3,960 3,960
17,600,000 equity shares of ` 10 each of Biocon Biopharmaceuticals Private Limited 211,312 -
3 (March 31, 2010 - Nil) equity shares of RM 10 each of Biocon Sdn.Bhd, Malaysia 1 -
300,601 89,288
918,940 659,465
(a) During the year ended March 31, 2009, Biocon Research Limited (‘BRL’) was incorporated as a wholly owned subsidiary for undertaking research in novel
and innovative drug initiatives. BRL commenced commercial activities during the year ended March 31, 2010 and as at March 31, 2011 has a negative net
worth of ` 372,559 due to it’s early stage of operations and research activities. BRL is a research and development company and of strategic importance to the
Company. Accordingly, the management is of the view that there is no diminution in the value of the investment. Further, the Company has given a letter of
financial support to BRL to fund its operations.
(b) During the year ended March 31, 2009, Biocon SA a wholly owned subsidiary was incorporated in Switzerland for development and marketing of
biopharmaceutical products in various markets outside India. As at March 31, 2011, Biocon SA holds 78% (March 31, 2010 - 78%) equity interest in AxiCorp
GmbH, Germany and has commenced clinical development of insulin for the European markets. Also refer Note 5 in Schedule 17.
(c ) BBPL was incorporated as a 51% joint venture between the Company and CIMAB, SA engaged in research, development, manufacturing and marketing
of biopharmaceuticals. During the year, the Company purchased the 49% stake in BBPL. Also refer Note 1 to Schedule 17. Further, the Company has granted
a long-term loan of ` 1,342,690 (March 31, 2010 - ` 258,259) to fund the operations of BBPL repayable over a period of 5 years. As at March 2011, the
entire share capital of BBPL is held by the Company. BBPL is of strategic importance to the Company. Accordingly, the management is of the view that there is
no dimunition in the value of the investment.
(d) NeoBiocon was incorporated in Dubai as a 50% joint venture between the Company and Mr.B R Shetty and is engaged in development, marketing and
distribution of biopharmaceuticals in the Middle-East region. As at March 31, 2011, the aggregate amount of Biocon’s interest in the assets, liabilities, income
and expenses of NeoBiocon is ` 47,039 (March 31, 2010 - ` 17,033) and ` 22,559 (March 31, 2010 - ` 10,049), ` 59,608 (March 31, 2010 - ` 23,927) and `
38,002 (March 31, 2010 - ` 21,214) respectively. The share of the Company in the accumulated profit of NeoBiocon as at March 31, 2011 stood at
` 17,164 (loss as on March 31, 2010 - ` 4,080). Since NeoBiocon has commenced marketing / distribution activities recently, management believes that there
is no other than temporary diminution in the value of the investment.
(e) As on March 31, 2011, the ESOP Trust held 4,457,536 shares (March 31, 2010 - 5,509,323) of the Company towards grant / exercise of shares to / by
employees of the Company and its subsidiaries under the ESOP Scheme. Also refer Note 3 in Schedule 17.
(f) Vaccinex Inc., USA (‘Vaccinex’) is engaged in research and development activities and has been incurring losses and has a negative net worth. As Vaccinex is
a development stage enterprise and of strategic importance to the Company, management believes that there is no other than temporary diminution in the
value of this investment.
(g) The Company has 30% (March 31, 2010 - 30%) voting rights in IATRICa Inc., USA.
(h) During the year ending March 31, 2011 Biocon Sdn.Bhd was incorporated as a wholly owned subsidiary in Malaysia. Biocon Sdn.Bhd is yet to commence
operations as at March 31, 2011.
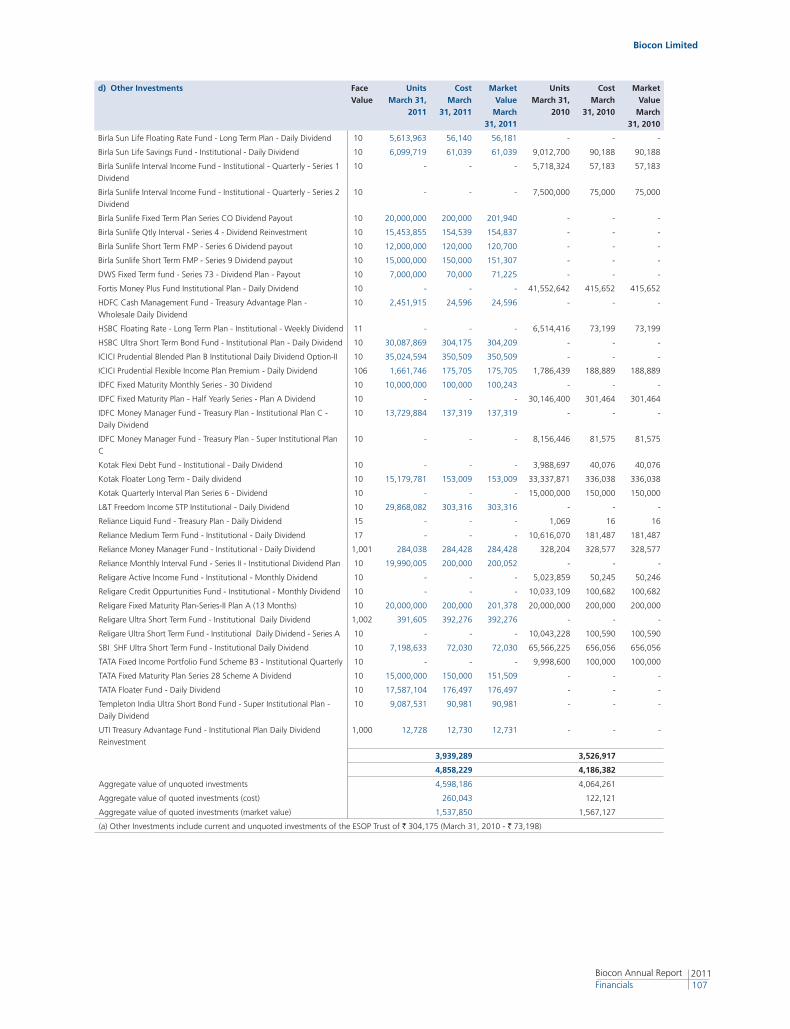
Biocon Limited
2011107
Biocon Annual Report Financials
d) Other Investments Face Value
UnitsMarch 31,
2011
Cost March
31, 2011
Market Value
March 31, 2011
UnitsMarch 31,
2010
Cost March
31, 2010
Market Value
March 31, 2010
Birla Sun Life Floating Rate Fund - Long Term Plan - Daily Dividend 10 5,613,963 56,140 56,181 - - -
Birla Sun Life Savings Fund - Institutional - Daily Dividend 10 6,099,719 61,039 61,039 9,012,700 90,188 90,188
Birla Sunlife Interval Income Fund - Institutional - Quarterly - Series 1
Dividend
10 - - - 5,718,324 57,183 57,183
Birla Sunlife Interval Income Fund - Institutional - Quarterly - Series 2
Dividend
10 - - - 7,500,000 75,000 75,000
Birla Sunlife Fixed Term Plan Series CO Dividend Payout 10 20,000,000 200,000 201,940 - - -
Birla Sunlife Qtly Interval - Series 4 - Dividend Reinvestment 10 15,453,855 154,539 154,837 - - -
Birla Sunlife Short Term FMP - Series 6 Dividend payout 10 12,000,000 120,000 120,700 - - -
Birla Sunlife Short Term FMP - Series 9 Dividend payout 10 15,000,000 150,000 151,307 - - -
DWS Fixed Term fund - Series 73 - Dividend Plan - Payout 10 7,000,000 70,000 71,225 - - -
Fortis Money Plus Fund Institutional Plan - Daily Dividend 10 - - - 41,552,642 415,652 415,652
HDFC Cash Management Fund - Treasury Advantage Plan -
Wholesale Daily Dividend
10 2,451,915 24,596 24,596 - - -
HSBC Floating Rate - Long Term Plan - Institutional - Weekly Dividend 11 - - - 6,514,416 73,199 73,199
HSBC Ultra Short Term Bond Fund - Institutional Plan - Daily Dividend 10 30,087,869 304,175 304,209 - - -
ICICI Prudential Blended Plan B Institutional Daily Dividend Option-II 10 35,024,594 350,509 350,509 - - -
ICICI Prudential Flexible Income Plan Premium - Daily Dividend 106 1,661,746 175,705 175,705 1,786,439 188,889 188,889
IDFC Fixed Maturity Monthly Series - 30 Dividend 10 10,000,000 100,000 100,243 - - -
IDFC Fixed Maturity Plan - Half Yearly Series - Plan A Dividend 10 - - - 30,146,400 301,464 301,464
IDFC Money Manager Fund - Treasury Plan - Institutional Plan C -
Daily Dividend
10 13,729,884 137,319 137,319 - - -
IDFC Money Manager Fund - Treasury Plan - Super Institutional Plan
C
10 - - - 8,156,446 81,575 81,575
Kotak Flexi Debt Fund - Institutional - Daily Dividend 10 - - - 3,988,697 40,076 40,076
Kotak Floater Long Term - Daily dividend 10 15,179,781 153,009 153,009 33,337,871 336,038 336,038
Kotak Quarterly Interval Plan Series 6 - Dividend 10 - - - 15,000,000 150,000 150,000
L&T Freedom Income STP Institutional - Daily Dividend 10 29,868,082 303,316 303,316 - - -
Reliance Liquid Fund - Treasury Plan - Daily Dividend 15 - - - 1,069 16 16
Reliance Medium Term Fund - Institutional - Daily Dividend 17 - - - 10,616,070 181,487 181,487
Reliance Money Manager Fund - Institutional - Daily Dividend 1,001 284,038 284,428 284,428 328,204 328,577 328,577
Reliance Monthly Interval Fund - Series II - Institutional Dividend Plan 10 19,990,005 200,000 200,052 - - -
Religare Active Income Fund - Institutional - Monthly Dividend 10 - - - 5,023,859 50,245 50,246
Religare Credit Oppurtunities Fund - Institutional - Monthly Dividend 10 - - - 10,033,109 100,682 100,682
Religare Fixed Maturity Plan-Series-II Plan A (13 Months) 10 20,000,000 200,000 201,378 20,000,000 200,000 200,000
Religare Ultra Short Term Fund - Institutional Daily Dividend 1,002 391,605 392,276 392,276 - - -
Religare Ultra Short Term Fund - Institutional Daily Dividend - Series A 10 - - - 10,043,228 100,590 100,590
SBI SHF Ultra Short Term Fund - Institutional Daily Dividend 10 7,198,633 72,030 72,030 65,566,225 656,056 656,056
TATA Fixed Income Portfolio Fund Scheme B3 - Institutional Quarterly 10 - - - 9,998,600 100,000 100,000
TATA Fixed Maturity Plan Series 28 Scheme A Dividend 10 15,000,000 150,000 151,509 - - -
TATA Floater Fund - Daily Dividend 10 17,587,104 176,497 176,497 - - -
Templeton India Ultra Short Bond Fund - Super Institutional Plan -
Daily Dividend
10 9,087,531 90,981 90,981 - - -
UTI Treasury Advantage Fund - Institutional Plan Daily Dividend
Reinvestment
1,000 12,728 12,730 12,731 - - -
3,939,289 3,526,917
4,858,229 4,186,382
Aggregate value of unquoted investments 4,598,186 4,064,261
Aggregate value of quoted investments (cost) 260,043 122,121
Aggregate value of quoted investments (market value) 1,537,850 1,567,127
(a) Other Investments include current and unquoted investments of the ESOP Trust of ` 304,175 (March 31, 2010 - ` 73,198)
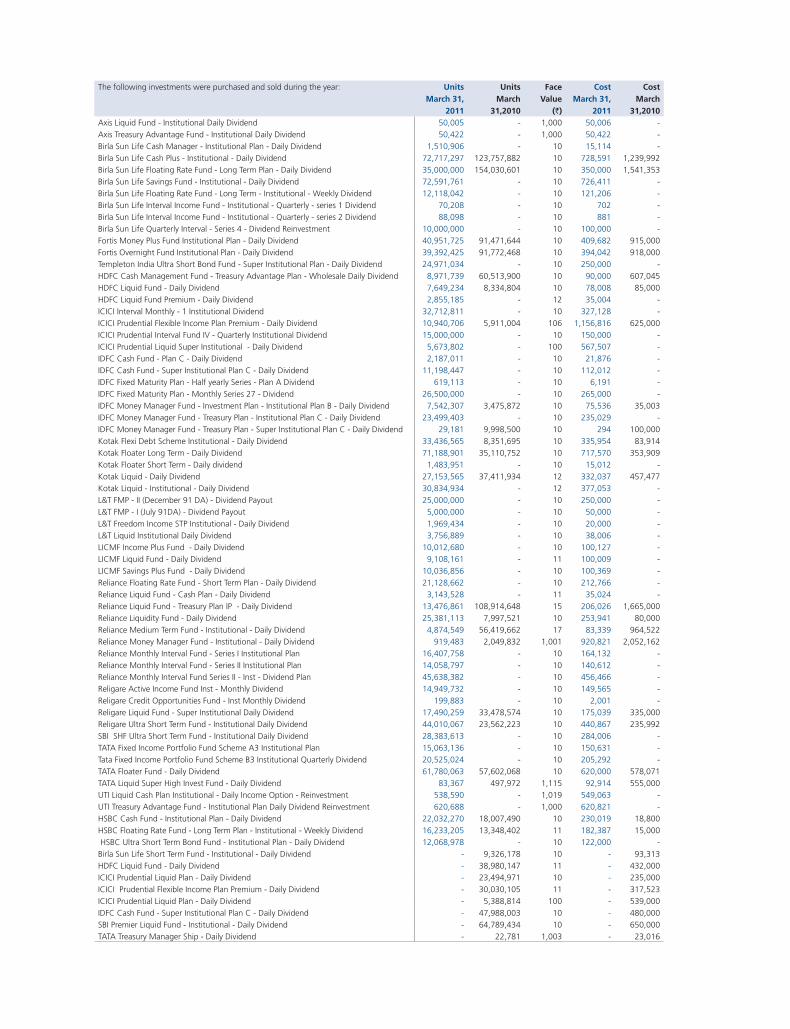
The following investments were purchased and sold during the year: UnitsMarch 31,
2011
Units March
31,2010
Face Value
(`)
CostMarch 31,
2011
Cost March
31,2010Axis Liquid Fund - Institutional Daily Dividend 50,005 - 1,000 50,006 -
Axis Treasury Advantage Fund - Institutional Daily Dividend 50,422 - 1,000 50,422 -
Birla Sun Life Cash Manager - Institutional Plan - Daily Dividend 1,510,906 - 10 15,114 -
Birla Sun Life Cash Plus - Institutional - Daily Dividend 72,717,297 123,757,882 10 728,591 1,239,992
Birla Sun Life Floating Rate Fund - Long Term Plan - Daily Dividend 35,000,000 154,030,601 10 350,000 1,541,353
Birla Sun Life Savings Fund - Institutional - Daily Dividend 72,591,761 - 10 726,411 -
Birla Sun Life Floating Rate Fund - Long Term - Institutional - Weekly Dividend 12,118,042 - 10 121,206 -
Birla Sun Life Interval Income Fund - Institutional - Quarterly - series 1 Dividend 70,208 - 10 702 -
Birla Sun Life Interval Income Fund - Institutional - Quarterly - series 2 Dividend 88,098 - 10 881 -
Birla Sun Life Quarterly Interval - Series 4 - Dividend Reinvestment 10,000,000 - 10 100,000 -
Fortis Money Plus Fund Institutional Plan - Daily Dividend 40,951,725 91,471,644 10 409,682 915,000
Fortis Overnight Fund Institutional Plan - Daily Dividend 39,392,425 91,772,468 10 394,042 918,000
Templeton India Ultra Short Bond Fund - Super Institutional Plan - Daily Dividend 24,971,034 - 10 250,000 -
HDFC Cash Management Fund - Treasury Advantage Plan - Wholesale Daily Dividend 8,971,739 60,513,900 10 90,000 607,045
HDFC Liquid Fund - Daily Dividend 7,649,234 8,334,804 10 78,008 85,000
HDFC Liquid Fund Premium - Daily Dividend 2,855,185 - 12 35,004 -
ICICI Interval Monthly - 1 Institutional Dividend 32,712,811 - 10 327,128 -
ICICI Prudential Flexible Income Plan Premium - Daily Dividend 10,940,706 5,911,004 106 1,156,816 625,000
ICICI Prudential Interval Fund IV - Quarterly Institutional Dividend 15,000,000 - 10 150,000 -
ICICI Prudential Liquid Super Institutional - Daily Dividend 5,673,802 - 100 567,507 -
IDFC Cash Fund - Plan C - Daily Dividend 2,187,011 - 10 21,876 -
IDFC Cash Fund - Super Institutional Plan C - Daily Dividend 11,198,447 - 10 112,012 -
IDFC Fixed Maturity Plan - Half yearly Series - Plan A Dividend 619,113 - 10 6,191 -
IDFC Fixed Maturity Plan - Monthly Series 27 - Dividend 26,500,000 - 10 265,000 -
IDFC Money Manager Fund - Investment Plan - Institutional Plan B - Daily Dividend 7,542,307 3,475,872 10 75,536 35,003
IDFC Money Manager Fund - Treasury Plan - Institutional Plan C - Daily Dividend 23,499,403 - 10 235,029 -
IDFC Money Manager Fund - Treasury Plan - Super Institutional Plan C - Daily Dividend 29,181 9,998,500 10 294 100,000
Kotak Flexi Debt Scheme Institutional - Daily Dividend 33,436,565 8,351,695 10 335,954 83,914
Kotak Floater Long Term - Daily Dividend 71,188,901 35,110,752 10 717,570 353,909
Kotak Floater Short Term - Daily dividend 1,483,951 - 10 15,012 -
Kotak Liquid - Daily Dividend 27,153,565 37,411,934 12 332,037 457,477
Kotak Liquid - Institutional - Daily Dividend 30,834,934 - 12 377,053 -
L&T FMP - II (December 91 DA) - Dividend Payout 25,000,000 - 10 250,000 -
L&T FMP - I (July 91DA) - Dividend Payout 5,000,000 - 10 50,000 -
L&T Freedom Income STP Institutional - Daily Dividend 1,969,434 - 10 20,000 -
L&T Liquid Institutional Daily Dividend 3,756,889 - 10 38,006 -
LICMF Income Plus Fund - Daily Dividend 10,012,680 - 10 100,127 -
LICMF Liquid Fund - Daily Dividend 9,108,161 - 11 100,009 -
LICMF Savings Plus Fund - Daily Dividend 10,036,856 - 10 100,369 -
Reliance Floating Rate Fund - Short Term Plan - Daily Dividend 21,128,662 - 10 212,766 -
Reliance Liquid Fund - Cash Plan - Daily Dividend 3,143,528 - 11 35,024 -
Reliance Liquid Fund - Treasury Plan IP - Daily Dividend 13,476,861 108,914,648 15 206,026 1,665,000
Reliance Liquidity Fund - Daily Dividend 25,381,113 7,997,521 10 253,941 80,000
Reliance Medium Term Fund - Institutional - Daily Dividend 4,874,549 56,419,662 17 83,339 964,522
Reliance Money Manager Fund - Institutional - Daily Dividend 919,483 2,049,832 1,001 920,821 2,052,162
Reliance Monthly Interval Fund - Series I Institutional Plan 16,407,758 - 10 164,132 -
Reliance Monthly Interval Fund - Series II Institutional Plan 14,058,797 - 10 140,612 -
Reliance Monthly Interval Fund Series II - Inst - Dividend Plan 45,638,382 - 10 456,466 -
Religare Active Income Fund Inst - Monthly Dividend 14,949,732 - 10 149,565 -
Religare Credit Opportunities Fund - Inst Monthly Dividend 199,883 - 10 2,001 -
Religare Liquid Fund - Super Institutional Daily Dividend 17,490,259 33,478,574 10 175,039 335,000
Religare Ultra Short Term Fund - Institutional Daily Dividend 44,010,067 23,562,223 10 440,867 235,992
SBI SHF Ultra Short Term Fund - Institutional Daily Dividend 28,383,613 - 10 284,006 -
TATA Fixed Income Portfolio Fund Scheme A3 Institutional Plan 15,063,136 - 10 150,631 -
Tata Fixed Income Portfolio Fund Scheme B3 Institutional Quarterly Dividend 20,525,024 - 10 205,292 -
TATA Floater Fund - Daily Dividend 61,780,063 57,602,068 10 620,000 578,071
TATA Liquid Super High Invest Fund - Daily Dividend 83,367 497,972 1,115 92,914 555,000
UTI Liquid Cash Plan Institutional - Daily Income Option - Reinvestment 538,590 - 1,019 549,063 -
UTI Treasury Advantage Fund - Institutional Plan Daily Dividend Reinvestment 620,688 - 1,000 620,821 -
HSBC Cash Fund - Institutional Plan - Daily Dividend 22,032,270 18,007,490 10 230,019 18,800
HSBC Floating Rate Fund - Long Term Plan - Institutional - Weekly Dividend 16,233,205 13,348,402 11 182,387 15,000
HSBC Ultra Short Term Bond Fund - Institutional Plan - Daily Dividend 12,068,978 - 10 122,000 -
Birla Sun Life Short Term Fund - Institutional - Daily Dividend - 9,326,178 10 - 93,313
HDFC Liquid Fund - Daily Dividend - 38,980,147 11 - 432,000
ICICI Prudential Liquid Plan - Daily Dividend - 23,494,971 10 - 235,000
ICICI Prudential Flexible Income Plan Premium - Daily Dividend - 30,030,105 11 - 317,523
ICICI Prudential Liquid Plan - Daily Dividend - 5,388,814 100 - 539,000
IDFC Cash Fund - Super Institutional Plan C - Daily Dividend - 47,988,003 10 - 480,000
SBI Premier Liquid Fund - Institutional - Daily Dividend - 64,789,434 10 - 650,000
TATA Treasury Manager Ship - Daily Dividend - 22,781 1,003 - 23,016
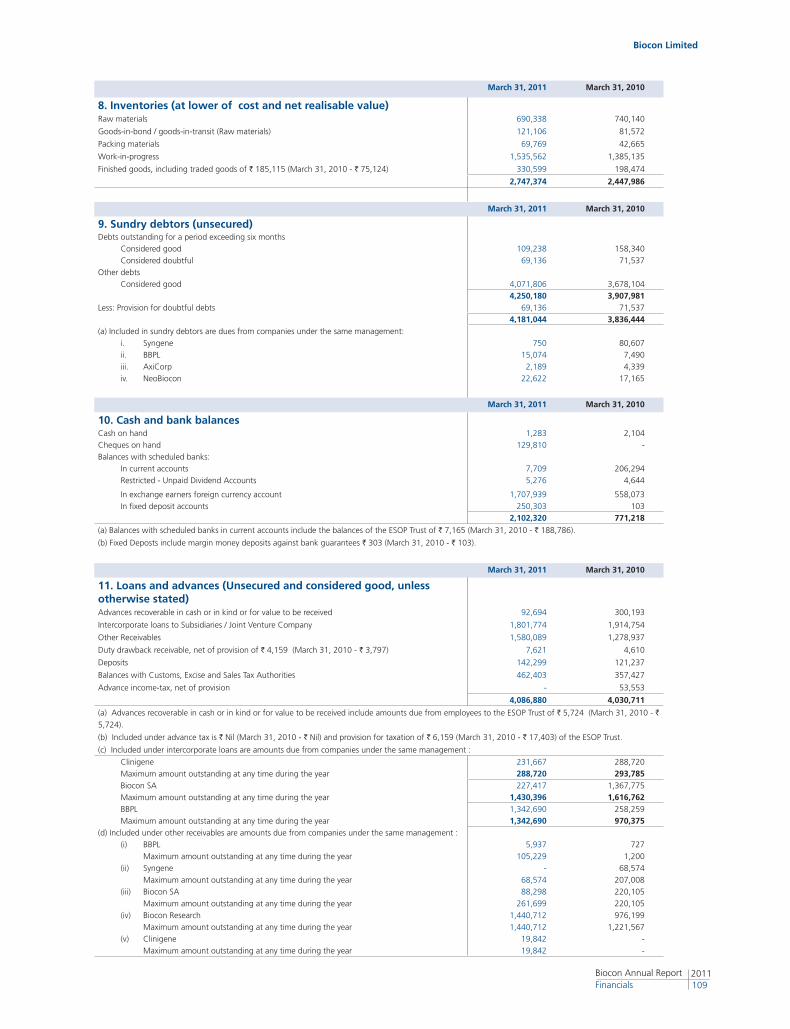
Biocon Limited
2011109
Biocon Annual Report Financials
March 31, 2011 March 31, 2010
8. Inventories (at lower of cost and net realisable value)Raw materials 690,338 740,140
Goods-in-bond / goods-in-transit (Raw materials) 121,106 81,572
Packing materials 69,769 42,665
Work-in-progress 1,535,562 1,385,135
Finished goods, including traded goods of ` 185,115 (March 31, 2010 - ` 75,124) 330,599 198,474
2,747,374 2,447,986
March 31, 2011 March 31, 2010
9. Sundry debtors (unsecured)Debts outstanding for a period exceeding six months
Considered good 109,238 158,340
Considered doubtful 69,136 71,537
Other debts
Considered good 4,071,806 3,678,104
4,250,180 3,907,981 Less: Provision for doubtful debts 69,136 71,537
4,181,044 3,836,444 (a) Included in sundry debtors are dues from companies under the same management:
i. Syngene 750 80,607
ii. BBPL 15,074 7,490
iii. AxiCorp 2,189 4,339
iv. NeoBiocon 22,622 17,165
March 31, 2011 March 31, 2010
10. Cash and bank balancesCash on hand 1,283 2,104
Cheques on hand 129,810 -
Balances with scheduled banks:
In current accounts 7,709 206,294
Restricted - Unpaid Dividend Accounts 5,276 4,644
In exchange earners foreign currency account 1,707,939 558,073
In fixed deposit accounts 250,303 103
2,102,320 771,218
(a) Balances with scheduled banks in current accounts include the balances of the ESOP Trust of ` 7,165 (March 31, 2010 - ` 188,786).
(b) Fixed Deposts include margin money deposits against bank guarantees ` 303 (March 31, 2010 - ` 103).
March 31, 2011 March 31, 2010
11. Loans and advances (Unsecured and considered good, unless otherwise stated)Advances recoverable in cash or in kind or for value to be received 92,694 300,193
Intercorporate loans to Subsidiaries / Joint Venture Company 1,801,774 1,914,754
Other Receivables 1,580,089 1,278,937
Duty drawback receivable, net of provision of ` 4,159 (March 31, 2010 - ` 3,797) 7,621 4,610
Deposits 142,299 121,237
Balances with Customs, Excise and Sales Tax Authorities 462,403 357,427
Advance income-tax, net of provision - 53,553
4,086,880 4,030,711
(a) Advances recoverable in cash or in kind or for value to be received include amounts due from employees to the ESOP Trust of ` 5,724 (March 31, 2010 - `
5,724).
(b) Included under advance tax is ` Nil (March 31, 2010 - ` Nil) and provision for taxation of ` 6,159 (March 31, 2010 - ` 17,403) of the ESOP Trust.
(c) Included under intercorporate loans are amounts due from companies under the same management :
Clinigene 231,667 288,720
Maximum amount outstanding at any time during the year 288,720 293,785 Biocon SA 227,417 1,367,775
Maximum amount outstanding at any time during the year 1,430,396 1,616,762 BBPL 1,342,690 258,259
Maximum amount outstanding at any time during the year 1,342,690 970,375 (d) Included under other receivables are amounts due from companies under the same management :
(i) BBPL 5,937 727
Maximum amount outstanding at any time during the year 105,229 1,200
(ii) Syngene - 68,574
Maximum amount outstanding at any time during the year 68,574 207,008
(iii) Biocon SA 88,298 220,105
Maximum amount outstanding at any time during the year 261,699 220,105
(iv) Biocon Research 1,440,712 976,199
Maximum amount outstanding at any time during the year 1,440,712 1,221,567
(v) Clinigene 19,842 -
Maximum amount outstanding at any time during the year 19,842 -
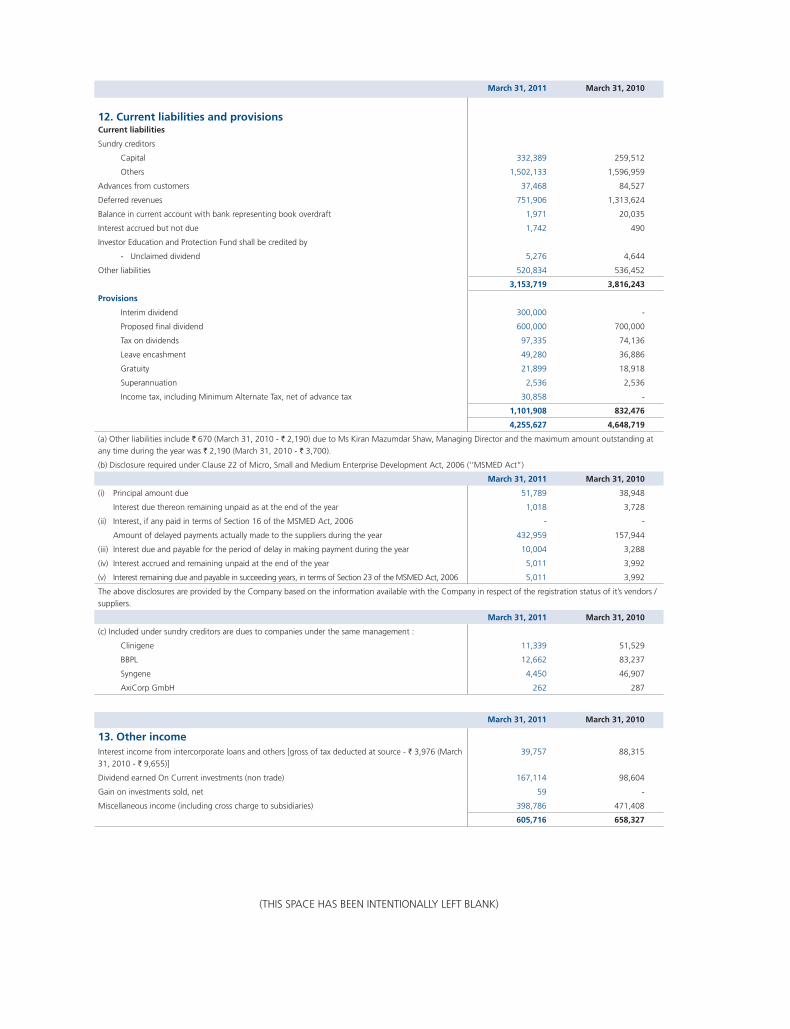
March 31, 2011 March 31, 2010
12. Current liabilities and provisionsCurrent liabilities
Sundry creditors
Capital 332,389 259,512
Others 1,502,133 1,596,959
Advances from customers 37,468 84,527
Deferred revenues 751,906 1,313,624
Balance in current account with bank representing book overdraft 1,971 20,035
Interest accrued but not due 1,742 490
Investor Education and Protection Fund shall be credited by
- Unclaimed dividend 5,276 4,644
Other liabilities 520,834 536,452
3,153,719 3,816,243
Provisions
Interim dividend 300,000 -
Proposed final dividend 600,000 700,000
Tax on dividends 97,335 74,136
Leave encashment 49,280 36,886
Gratuity 21,899 18,918
Superannuation 2,536 2,536
Income tax, including Minimum Alternate Tax, net of advance tax 30,858 -
1,101,908 832,476
4,255,627 4,648,719
(a) Other liabilities include ` 670 (March 31, 2010 - ` 2,190) due to Ms Kiran Mazumdar Shaw, Managing Director and the maximum amount outstanding at
any time during the year was ` 2,190 (March 31, 2010 - ` 3,700).
(b) Disclosure required under Clause 22 of Micro, Small and Medium Enterprise Development Act, 2006 (‘’MSMED Act”)
March 31, 2011 March 31, 2010
(i) Principal amount due 51,789 38,948
Interest due thereon remaining unpaid as at the end of the year 1,018 3,728
(ii) Interest, if any paid in terms of Section 16 of the MSMED Act, 2006 - -
Amount of delayed payments actually made to the suppliers during the year 432,959 157,944
(iii) Interest due and payable for the period of delay in making payment during the year 10,004 3,288
(iv) Interest accrued and remaining unpaid at the end of the year 5,011 3,992
(v) Interest remaining due and payable in succeeding years, in terms of Section 23 of the MSMED Act, 2006 5,011 3,992
The above disclosures are provided by the Company based on the information available with the Company in respect of the registration status of it’s vendors /
suppliers.
March 31, 2011 March 31, 2010
(c) Included under sundry creditors are dues to companies under the same management :
Clinigene 11,339 51,529
BBPL 12,662 83,237
Syngene 4,450 46,907
AxiCorp GmbH 262 287
March 31, 2011 March 31, 2010
13. Other incomeInterest income from intercorporate loans and others [gross of tax deducted at source - ` 3,976 (March
31, 2010 - ` 9,655)]
39,757 88,315
Dividend earned On Current investments (non trade) 167,114 98,604
Gain on investments sold, net 59 -
Miscellaneous income (including cross charge to subsidiaries) 398,786 471,408
605,716 658,327
(THIS SPACE HAS BEEN INTENTIONALLY LEFT BLANK)
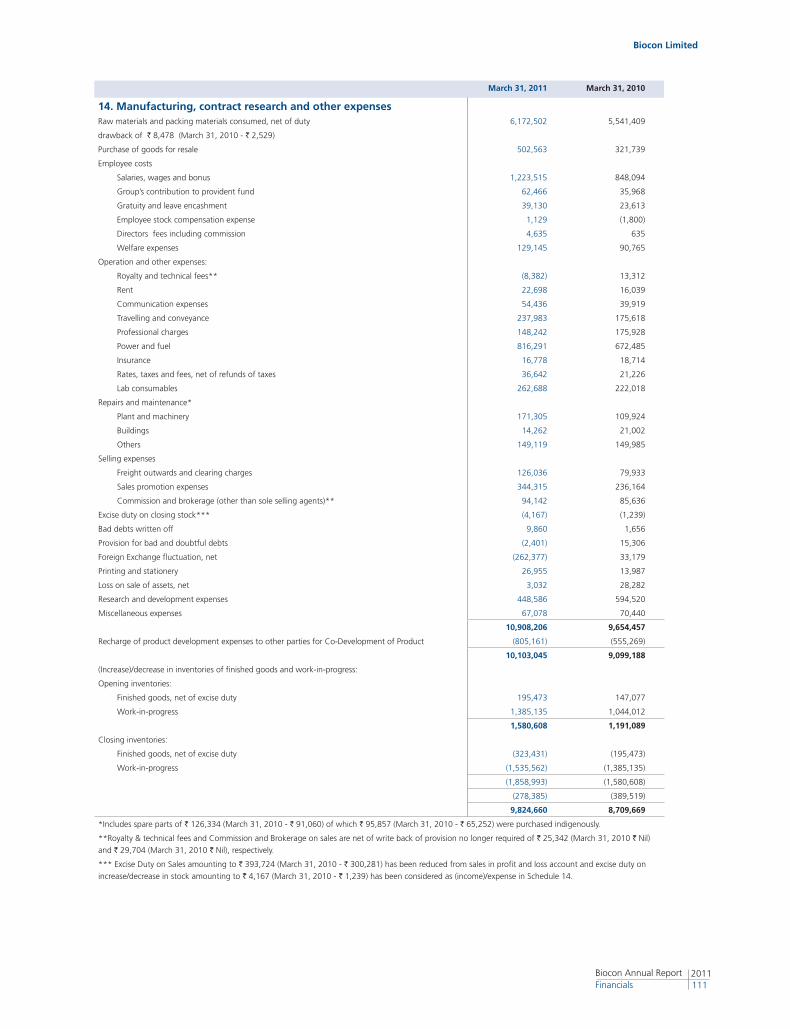
Biocon Limited
2011111
Biocon Annual Report Financials
March 31, 2011 March 31, 2010
14. Manufacturing, contract research and other expensesRaw materials and packing materials consumed, net of duty 6,172,502 5,541,409
drawback of ` 8,478 (March 31, 2010 - ` 2,529)
Purchase of goods for resale 502,563 321,739
Employee costs
Salaries, wages and bonus 1,223,515 848,094
Group’s contribution to provident fund 62,466 35,968
Gratuity and leave encashment 39,130 23,613
Employee stock compensation expense 1,129 (1,800)
Directors fees including commission 4,635 635
Welfare expenses 129,145 90,765
Operation and other expenses:
Royalty and technical fees** (8,382) 13,312
Rent 22,698 16,039
Communication expenses 54,436 39,919
Travelling and conveyance 237,983 175,618
Professional charges 148,242 175,928
Power and fuel 816,291 672,485
Insurance 16,778 18,714
Rates, taxes and fees, net of refunds of taxes 36,642 21,226
Lab consumables 262,688 222,018
Repairs and maintenance*
Plant and machinery 171,305 109,924
Buildings 14,262 21,002
Others 149,119 149,985
Selling expenses
Freight outwards and clearing charges 126,036 79,933
Sales promotion expenses 344,315 236,164
Commission and brokerage (other than sole selling agents)** 94,142 85,636
Excise duty on closing stock*** (4,167) (1,239)
Bad debts written off 9,860 1,656
Provision for bad and doubtful debts (2,401) 15,306
Foreign Exchange fluctuation, net (262,377) 33,179
Printing and stationery 26,955 13,987
Loss on sale of assets, net 3,032 28,282
Research and development expenses 448,586 594,520
Miscellaneous expenses 67,078 70,440
10,908,206 9,654,457
Recharge of product development expenses to other parties for Co-Development of Product (805,161) (555,269)
10,103,045 9,099,188
(Increase)/decrease in inventories of finished goods and work-in-progress:
Opening inventories:
Finished goods, net of excise duty 195,473 147,077
Work-in-progress 1,385,135 1,044,012
1,580,608 1,191,089
Closing inventories:
Finished goods, net of excise duty (323,431) (195,473)
Work-in-progress (1,535,562) (1,385,135)
(1,858,993) (1,580,608)
(278,385) (389,519)
9,824,660 8,709,669
*Includes spare parts of ` 126,334 (March 31, 2010 - ` 91,060) of which ` 95,857 (March 31, 2010 - ` 65,252) were purchased indigenously.
**Royalty & technical fees and Commission and Brokerage on sales are net of write back of provision no longer required of ` 25,342 (March 31, 2010 ` Nil)
and ` 29,704 (March 31, 2010 ` Nil), respectively.
*** Excise Duty on Sales amounting to ` 393,724 (March 31, 2010 - ` 300,281) has been reduced from sales in profit and loss account and excise duty on
increase/decrease in stock amounting to ` 4,167 (March 31, 2010 - ` 1,239) has been considered as (income)/expense in Schedule 14.
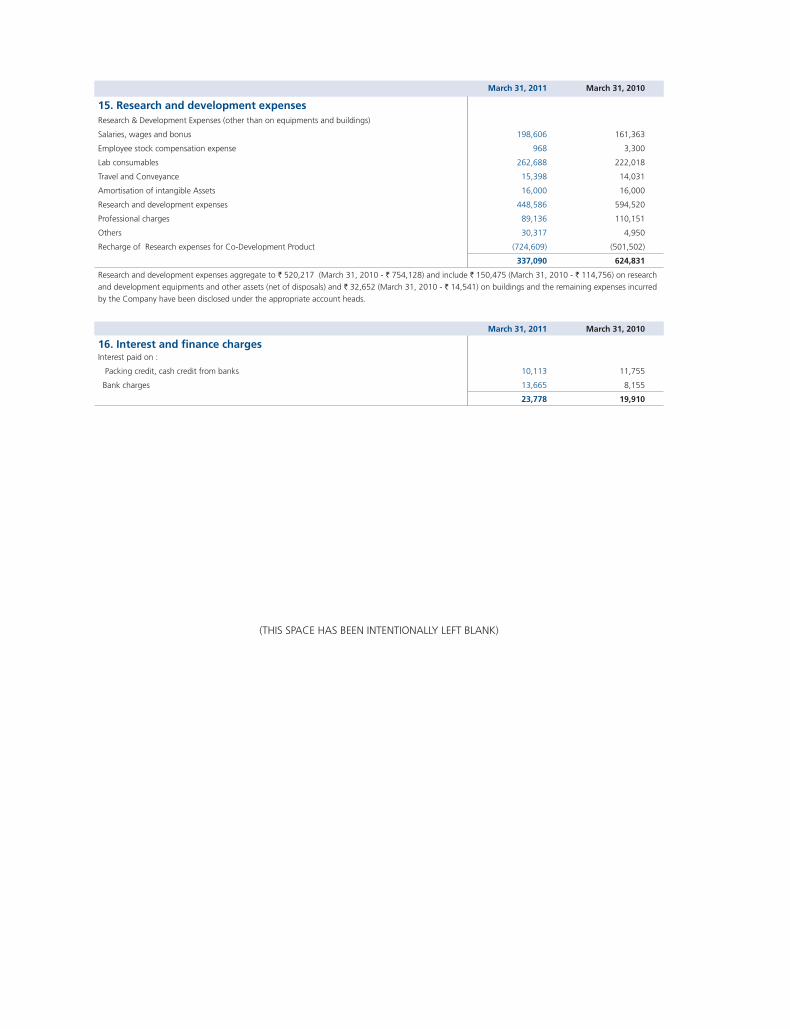
March 31, 2011 March 31, 2010
15. Research and development expensesResearch & Development Expenses (other than on equipments and buildings)
Salaries, wages and bonus 198,606 161,363
Employee stock compensation expense 968 3,300
Lab consumables 262,688 222,018
Travel and Conveyance 15,398 14,031
Amortisation of intangible Assets 16,000 16,000
Research and development expenses 448,586 594,520
Professional charges 89,136 110,151
Others 30,317 4,950
Recharge of Research expenses for Co-Development Product (724,609) (501,502)
337,090 624,831
Research and development expenses aggregate to ` 520,217 (March 31, 2010 - ` 754,128) and include ` 150,475 (March 31, 2010 - ` 114,756) on research
and development equipments and other assets (net of disposals) and ` 32,652 (March 31, 2010 - ` 14,541) on buildings and the remaining expenses incurred
by the Company have been disclosed under the appropriate account heads.
March 31, 2011 March 31, 2010
16. Interest and finance charges Interest paid on :
Packing credit, cash credit from banks 10,113 11,755
Bank charges 13,665 8,155
23,778 19,910
(THIS SPACE HAS BEEN INTENTIONALLY LEFT BLANK)
Biocon Limited
2011113
Biocon Annual Report Financials
Schedule 17: Notes to Accounts for the year ended March 31, 2011(All amounts in Indian Rupees, US Dollars and Euro are in thousands, except share and per share data)
1. BackgroundBiocon Limited ('Biocon' or 'the Company'), was incorporated at Bangalore in 1978 for manufacture of biotechnology products. Syngene International Limited ('Syngene'), promoted by Dr Kiran Mazumdar Shaw, was incorporated at Bangalore in 1993. In March 2002, Biocon acquired 99.99 per cent of the equity shares of Syngene and, resultantly, Syngene became the subsidiary of Biocon. Clinigene International Limited ('Clinigene') was incorporated on August 4, 2000 at Bangalore and became a wholly owned subsidiary of Biocon on March 31, 2001.
On January 10, 2008, Biocon entered into an agreement with Dr. B.R. Shetty to set up a joint venture company NeoBiocon FZ-LLC, incorporated in Dubai (‘NeoBiocon’).
The Company has also established Biocon Research Limited (‘BRL’), a subsidiary of the Company to undertake research and development in novel and innovative drug initiatives.
Effective April 30, 2008, Biocon acquired 71% equity interest in AxiCorp GmbH, Germany (‘AxiCorp’) through its newly incorporated wholly owned subsidiary company Biocon SA, Switzerland. In February 2009, Biocon SA acquired an additional 7.4% equity interest in AxiCorp. Also, refer note 5 of Schedule 17.
Biocon entered into an agreement with CIMAB SA (‘CIMAB’) to set up a Joint Venture Company Biocon Biopharmaceuticals Private Limited (‘BBPL’) to manufacture and market products and carry out research activities. BBPL was incorporated on June 17, 2002 with Biocon holding 51 per cent of share capital. In April 2010, Biocon SA acquired the 49% equity stake held by CIMAB SA in BBPL. In March 2011, Biocon purchased the 49% equity stake in BBPL from Biocon SA. Consequently, as at March 31, 2011 all the equity shares of BBPL are held by Biocon.
Biocon is an integrated healthcare company engaged in manufacture of biotechnology products for the pharmaceutical sector. The Company is also engaged in research and development in the biotechnology sector. During the year ended March 31, 2007, the Company had received an approval as the developer as Biocon SEZ at the Biocon Park facility and also received an approval for SEZ unit to be located within Biocon SEZ.
2. Statement of significant accounting policiesa. (i) Basis of preparation
The financial statements have been prepared to comply in all material respects with the Accounting Standards, notified by the Companies (Accounting Standards) Rules, 2006 (as amended) and the relevant provisions of the Companies Act, 1956. The financial statements have been prepared under the historical cost convention except in case of assets for which provision for impairment is made and revaluation is carried out, on an accrual basis. The accounting policies have been consistently applied by the Company and are consistent with those used in the previous year except where a newly issued accounting standard is initially adopted or a revision to an existing accounting standard requires a change in accounting policy hitherto in use.
For the purpose of administration of the employee stock option plans of the Company, the Company has established the Biocon India Limited Employee Welfare Trust (‘ESOP Trust’). In accordance with the guidelines framed by the Securities and Exchange Board of India (‘SEBI’), financial statements of the Company have been prepared as if the Company itself is administering the ESOP Scheme.
(ii) Use of estimates
The preparation of financial statements in conformity with generally accepted accounting principles requires management to make estimates and assumptions that affect the reported amounts of assets and liabilities and disclosure of contingent liabilities at the date of the financial statements and the results of operations during the reporting period. Although these estimates are based upon management’s best knowledge of current events and actions, actual results could differ from these estimates.
b. Fixed assets and depreciation
Fixed assets are stated at cost, except for revalued freehold land and buildings, which are shown at estimated replacement cost as determined by valuers less impairment loss, if any, and accumulated depreciation. The Company capitalises all costs relating to the acquisition and installation of fixed assets. Assets partly funded by third parties are capitalised at gross value and the funds so received are recorded as deferred revenue and amortised over the useful life of the assets.
Fixed assets, other than freehold land, but including revalued buildings, are depreciated pro rata to the period of use, on the straight line method at the annual rates based on the estimated useful lives, or at the rates prescribed under schedule XIV of the Companies Act, 1956 whichever is higher as follows:
Nature of Asset Per cent
Buildings 4.00
Plant and machinery (including Computers) 9.09 - 33.33
Research and development equipment 11.11
Furniture and fixtures 16.67
Vehicles 16.67
Leasehold land on a lease-cum-sale basis are capitalised at the allotment rates charged by the Municipal Authorities. Leasehold improvements are being depreciated over the lease term or useful life whichever is lower. Used assets acquired from third parties are depreciated on a straight line basis over their remaining useful life of such assets.
The depreciation charge over and above the depreciation calculated on the original cost of the revalued assets is transferred from the revaluation reserve to the profit and loss account.
Assets individually costing less than ` 5 are fully depreciated in the year of purchase.
c. Impairment of assets
The carrying amounts of assets are reviewed at each balance sheet date if there is any indication of impairment based on internal/external factors. An impairment loss is recognised wherever the carrying amount of an asset exceeds its recoverable amount. The recoverable amount is the greater of the asset’s net selling price and value in use. In assessing value in use, the estimated future cash flows are discounted to their present value using a pre-tax discount rate that reflects current market assessments of the time value of money and risks specific to the asset. After impairment, depreciation is provided on the revised carrying amount of the asset over its remaining useful life. A previously recognised impairment loss is increased or reversed depending on changes in circumstances. However the carrying value after reversal is not increased beyond the carrying value that would have prevailed by charging usual depreciation if there was no impairment.
d. Intangible assets
Intellectual Property rights/marketing rights
Costs relating to intellectual property/marketing rights are capitalised and amortised on a straight-line basis over the period of expected future sales from the use of the said intangible asset, i.e. over their estimated useful lives not exceeding ten years.
Computer Software
Software which is not an integral part of the related hardware is classified as an intangible asset and is being amortised over a period of three - five years, being its estimated useful life.
Research and Development Costs
Research and development costs, including technical know-how fees, incurred for development of products are expensed as incurred, except for development costs which relate to the design and testing of new or improved materials, products or processes or for existing products in new territories which are recognised as an intangible asset to the extent that it is expected that such assets will generate future economic benefits. Research and development expenditure of a capital nature is added to fixed assets. Development costs carried forward is amortised on a straight line basis, over the period of expected future sales from the related project, not exceeding ten years.
The carrying value of intellectual property/marketing rights and development costs is reviewed for impairment annually when the asset is not yet in use, and otherwise when events or changes in circumstances indicate that the carrying value may not be recoverable.
e. Inventories
Inventories are valued as follows:
Raw materials and packing materials
Lower of cost and net realizable value. However, materials and other items held for use in the production of inventories are not written down below cost if the finished products in which they will be incorporated are expected to be sold at or above cost. Cost is determined on a first-in-first-out basis. Customs duty on imported raw materials (excluding stocks in the bonded warehouse) is treated as part of the cost of the inventories.
Work-in-progress and finished goods
Lower of cost and net realizable value. Cost includes direct materials and labour and a proportion of manufacturing overheads based on normal operating capacity. Cost of finished goods includes excise duty.
Traded goods Lower of cost and net realizable value. Cost includes the purchase price and other associated costs directly incurred in bringing the inventory to its present location.
Net realizable value is the estimated selling price in the ordinary course of business, less estimated costs of completion and estimated costs necessary to make the sale.
f. Revenue recognition
Revenue is recognised to the extent that it is probable that the economic benefits will flow to the Company and the revenue can be reliably measured.
(i) Revenue is recognised when the significant risks and rewards of ownership of the goods have passed to the buyer and are recorded net of excise duty, sales tax and other levies. For the purposes of disclosure in these financial statements, sales are reflected gross and net of excise duty in the profit and loss account.
(ii) The Company enters into certain dossier sales, licensing and supply agreements relating to various products. Revenue from such arrangements is recognised upon completion of performance obligations or on a proportional performance basis over the period the
Biocon Limited
2011115
Biocon Annual Report Financials
Company performs its obligations, under the terms of the agreements. Proportionate performance is measured based upon the efforts incurred to date in relation to the total estimated efforts to complete the contract. The Company monitors estimates of the total contract revenue and cost on a routine basis throughout the contract period. The cumulative impact of any change in estimates of the contract revenue or costs is reflected in the period in which the changes become known. In the event that the loss is anticipated on a particular contract, provision is made for the estimated loss.
(iii) Interest income is recognised on an accrual basis. Dividends are accounted for when the right to receive the payment is established.
g. Investments
Investments that are readily realisable and intended to be held for not more than twelve months are classified as current investments. All other investments are classified as long-term investments. Long-term investments are stated at cost. However, provision for diminution in value is made to recognise a decline other than temporary in the value of the investments. Current investments are carried at lower of cost and fair value and determined on an individual investment basis.
h. Retirement benefits
(i) Retirement benefit in the form of Provident Fund is a defined contribution scheme and the contributions are charged to the Profit and Loss Account of the year when the contributions to the government funds are due.
(ii) Gratuity liability is a defined benefit obligation and is provided for on the basis of an actuarial valuation on projected unit credit method made at the end of each financial year. The gratuity benefit of the Company is administered by a trust formed for this purpose through the group gratuity scheme.
(iii) Short-term compensated absences are provided for based on estimates. Long-term compensated absences are provided for based on actuarial valuation made at the end of each financial year. The actuarial valuation is done as per projected unit credit method made at the end of each financial year.
(iv) Actuarial gains/losses are immediately taken to profit and loss account and are not deferred.
i. Foreign currency transactions
Initial Recognition
Foreign currency transactions are recorded in the reporting currency, by applying to the foreign currency amount the exchange rate between the reporting currency and the foreign currency at the date of the transaction.
Conversion
Foreign currency monetary items are reported using the closing rate. Non-monetary items which are carried in terms of historical cost denominated in a foreign currency are reported using the exchange rate at the date of the transaction; and non-monetary items which are carried at fair value or other similar valuation denominated in a foreign currency are reported using the exchange rates that existed when the values were determined.
Exchange Differences
Exchange differences arising on a monetary item that, in substance, form part of the Company's net investment in a non-integral foreign operation is accumulated in a foreign currency translation reserve in the financial statements until the disposal of the net investment, at which time they are recognised as income or as expenses.
Exchange differences, in respect of accounting periods commencing on or after December 7, 2006, arising on reporting of long-term foreign currency monetary items at rates different from those at which they were initially recorded during the period, or reported in previous financial statements, in so far as they relate to the acquisition of a depreciable capital asset, are added to or deducted from the cost of the asset and are depreciated over the balance life of the asset, and in other cases, are accumulated in a “Foreign Currency Monetary Item Translation Difference Account” in the financial statements and amortized over the balance period of such long-term asset/liability but not beyond accounting period ending on or before March 31, 2011.
Exchange differences arising on the settlement of monetary items not covered above, or on reporting such monetary items at rates different from those at which they were initially recorded during the year, or reported in previous financial statements, are recognised as income or as expenses in the year in which they arise.
Forward Exchange Contracts not intended for trading or speculation purposes
The premium or discount arising at the inception of forward exchange contracts is amortised as expense or income over the life of the contract. Exchange differences on such contracts are recognised in the statement of profit and loss in the year in which the exchange rates change. Any profit or loss arising on cancellation or renewal of forward exchange contract is recognised as income or as expense on the date of such cancellation/renewal. However, exchange difference in respect of accounting period commencing on or after December 7, 2006 arising on the forward exchange contract undertaken to hedge the long term foreign currency monetary item, in so far as they
relate to the acquisition of depreciable capital asset, are added to or deducted from the cost of asset and in other cases, are accumulated in “Foreign Currency Monetary Item Translation Difference Account” and amortised over the balance period of such long-term asset / liability but not beyond March 31, 2011.
j. Income tax
Tax expense comprises current and deferred tax. Current income tax is measured at the amount expected to be paid to the tax authorities in accordance with the Indian Income Tax Act 1961. Deferred income taxes reflects the impact of current period timing differences between taxable income and accounting income for the year net of reversals of timing differences of earlier years.
Deferred tax is measured based on the tax rates and the tax laws enacted or substantively enacted at the balance sheet date. Deferred tax assets are recognised only to the extent that there is reasonable certainty that sufficient future taxable income will be available against which such deferred tax assets can be realised. In situations where the Company has unabsorbed depreciation or carry forward tax losses, all deferred tax assets are recognised only if there is virtual certainty supported by convincing evidence that they can be realised against future taxable profits. At each balance sheet date the Company re-assesses unrecognised deferred tax assets. It recognises unrecognised deferred tax assets to the extent that it has become reasonably certain or virtually certain, as the case may be that sufficient future taxable income will be available against which such deferred tax assets can be realised.
The carrying amount of deferred tax assets are reviewed at each balance sheet date. The Company writes-down the carrying amount of a deferred tax asset to the extent that it is no longer reasonably certain or virtually certain, as the case may be, that sufficient future taxable income will be available against which deferred tax asset can be realised. Any such write-down is reversed to the extent that it becomes reasonably certain or virtually certain, as the case may be, that sufficient future taxable income will be available.
Minimum Alternative Tax (MAT) credit is recognised as an asset only when and to the extent there is convincing evidence that the Company will pay normal income tax during the specified period. In the year in which the MAT credit becomes eligible to be recognised as an asset in accordance with the recommendations contained in the Guidance Note issued by the Institute of Chartered Accountants of India, the said asset is created by way of a credit to the profit and loss account and shown as MAT Credit Entitlement. The Company reviews the same at each balance sheet date and writes down the carrying amount of MAT Credit Entitlement to the extent there is no longer convincing evidence to the effect that Company will pay normal Income Tax during the specified period.
k. Borrowing costs
Borrowing costs that are attributable to the acquisition and construction of a qualifying asset are capitalised as a part of the cost of the asset. Other borrowing costs are recognised as an expense in the year in which they are incurred.
l. Employee stock compensation costs
Measurement and disclosure of the employee share-based payment plans is done in accordance with SEBI (Employee Stock Option Scheme and Employee Stock Purchase Scheme) Guidelines, 1999 and the Guidance Note on Accounting for Employee Share-based Payments, issued by the Institute of Chartered Accountants of India. The Company measures compensation cost relating to employee stock options using the intrinsic value method. Compensation expense is amortized over the vesting period of the option on a straight line basis.
m. Earnings per share (EPS)Basic earnings per share are calculated by dividing the net profit or loss for the year attributable to equity shareholders by the weighted average number of equity shares outstanding during the year. Partly paid equity shares are treated as a fraction of an equity share to the extent that they were entitled to participate in dividends relative to a fully paid equity share during the reporting year. The weighted average number of equity shares outstanding during the year is adjusted for events of bonus issue; bonus element in a rights issue to existing shareholders; share split; and reverse share split (consolidation of shares).
For the purpose of calculating diluted earnings per share, the net profit or loss for the year attributable to equity shareholders and the weighted average number of shares outstanding during the year are adjusted for the effects of all dilutive potential equity shares.
n. Operating leaseWhere the Company is a Lessee
Leases of assets under which all the risks and rewards of ownership are effectively retained by the lessor are classified as operating leases. Lease payments under operating leases are recognised as an expense on a straight-line basis over the lease term.
Where the Company is a Lessor
Assets subject to operating leases are included in fixed assets. Lease income is recognised on a straight-line basis over the lease term. Costs, including depreciation are recognised as an expense. Initial direct costs such as legal costs, brokerage costs, etc are recognised immediately.
Biocon Limited
2011117
Biocon Annual Report Financials
o. Segment reporting Identification of segments
The Company’s operating businesses are organised and managed separately according to the nature of products manufactured/traded, with each segment representing a strategic business unit that offers different products to different markets. The analysis of geographical segments is based on the areas in which the Company's products are sold.
Inter-segment Transfers
The Company generally accounts for inter-segment sales and transfers at an agreed marked-up price.
Allocation of common costs
Common allocable costs are allocated to each segment according to the relative contribution of each segment to the total common costs.
Unallocated items
The Corporate and other segment include general corporate income and expense items which are not allocated to any business segment.
Segment policies
The Company prepares its segment information in conformity with the accounting policies adopted for preparing and presenting the financial statements of the Company as a whole.
p. Provisions
A provision is recognised when an enterprise has a present obligation as a result of past event; it is probable that an outflow of resources will be required to settle the obligation, in respect of which a reliable estimate can be made. Provisions are not discounted to its present value and are determined based on best estimate required to settle the obligation at the balance sheet date. These are reviewed at each balance sheet date and adjusted to reflect the current best estimates.
q. Expenditure on new projects and substantial expansionExpenditure directly relating to construction activity is capitalised. Indirect expenditure incurred during construction period is capitalised as part of the indirect construction cost to the extent to which the expenditure is directly related to construction or is incidental thereto. Other indirect expenditure (including borrowing costs) incurred during the construction period which is not related to the construction activity nor is incidental thereto is charged to the Profit and Loss Account. Income earned during construction period is deducted from the total of the indirect expenditure. All direct capital expenditure on expansion is capitalised. As regards indirect expenditure on expansion, only that portion is capitalised which represents the marginal increase in such expenditure involved as a result of capital expansion. Both direct and indirect expenditure are capitalised only if they increase the value of the asset beyond its original standard of performance.
r. Cash and Cash EquivalentsCash and cash equivalents for the purposes of cash flow statement comprise cash at bank and in hand and short-term investments with an original maturity of three months or less.
s. Derivative InstrumentsAs per the ICAI Announcement, accounting for derivative contracts, other than those covered under AS-11, are marked to market on a portfolio basis, and the net loss after considering the offsetting effect on the underlying hedge item is charged to the profit and loss account. Net gains are ignored.
3. Employee stock compensationOn September 27, 2001, Biocon’s Board of Directors approved the Biocon Employee Stock Option Plan (‘ESOP Plan 2000’) for the grant of stock options to the employees of the Company and its subsidiaries/joint venture company. A Compensation Committee has been constituted to administer the plan through a trust established specifically for this purpose, called the Biocon India Limited Employee Welfare Trust (ESOP Trust).
The ESOP Trust shall make additional purchase of equity shares of the Company using the proceeds from the loan obtained from the Company, other cash inflows from allotment of shares to employees under the ESOP Plan and shall subscribe, when allotted to such number of shares as is necessary for transferring to the employees. The ESOP Trust may also receive shares from the promoters for the purpose of issuance to the employees under the ESOP Plan. The Compensation Committee shall determine the exercise price which will not be less than the face value of the shares.
Grant IIn September 2001, the Company granted 71,510 options under the ESOP Plan 2000 to be exercised at a grant price of ` 10 (before adjusting bonus and share split). The options vested with the employees equally over a four year period.

Grant IIIn January 2004, the Company granted 142,100 options (shares of ` 5 each) under ESOP Plan 2000 to be exercised at a price of ` 5 per share.
The options vest with the employees equally over a four year period.
Details of Grant II
Particulars March 31, 2011 March 31, 2010
No of Options
Weighted Average Exercise Price (` )
No of Options *
Weighted Average Exercise Price (` )*
Outstanding at the beginning of the year - - 7,840 2.5
Granted during the year - - - -
Forfeited during the year - - - -
Exercised during the year - - 1,960 2.5
Expired during the year - - 5,880 2.5
Outstanding at the end of the year - - - -
Exercisable at the end of the year - - - -
Weighted average remaining contractual life (in years) - - - -
*adjusted for the effect of bonus shares
Grant III
In January 2004, the Board of Directors announced the Biocon Employee Stock Option Plan (ESOP Plan 2004) for the grant of stock options to the employees
of the Company and its subsidiaries / joint venture company, pursuant to which the Compensation Committee on March 19, 2004 granted 422,000 options
(face value of shares - ` 5 each) under the ESOP Plan 2004 to be exercised at a grant price of ` 315 being the issue price determined for the IPO through the
book building process. The options vest with the employees equally over a four year period.
Details of Grant III
Particulars March 31, 2011 March 31, 2010
No of Options *
Weighted Average Exercise Price (` )*
No of Options *
Weighted Average Exercise Price (` )*
Outstanding at the beginning of the year 17,700 157.5 112,950 157.5
Granted during the year - - - -
Forfeited during the year - - - -
Exercised during the year 6,250 157.5 95,250 157.5
Expired during the year 11,450 157.5 - -
Outstanding at the end of the year - - 17,700 157.5
Exercisable at the end of the year - - 17,700 157.5
Weighted average remaining contractual life (in years) - - 1
*adjusted for the effect of bonus shares
Grant IVIn July 2006, the Company approved the grant of 3,478,200 options (face value of shares - ` 5 each) to its employees under the existing ESOP Plan 2000. The
options under this grant would vest to the employees as 25%, 35% and 40% of the total grant at the end of first, second, third year from from the date of the
grant, respectively, with an exercise period of three years for each grant. The vesting conditions include service terms and performance grade of the employees.
These options are exercisable at a discount of 20% to the market price of Company’s’ shares on the date of grant.
Details of Grant IV
Particulars March 31, 2011 March 31, 2010
No. of Options*
Weighted Average Exercise Price (` )*
No. of Options*
Weighted Average Exercise Price (` )*
Outstanding at the beginning of the year 3,030,129 150 5,224,178 147.0
Granted during the year - - - -
Forfeited during the year 3,066 139 741,548 153.0
Exercised during the year 1,436,537 139 1,452,500 137.5
Expired during the year - - - -
Outstanding at the end of the year 1,590,526 160.0 3,030,129 150.0
Exercisable at the end of the year 1,343,115 157.8 1,388,545 137.5
Weighted average remaining contractual life (in years) 1.5 - 2.3 -
*adjusted for the effect of bonus shares.
Grant VIn April 2008, the Company approved the grant of 813,860 options (face value of shares - ` 5 each) to its employees under the existing ESOP Plan
2000. The options under this grant would vest to the employees as 25%, 35% and 40% of the total grant at the end of first, second, third year from the
date of grant, respectively, with an exercise period of three years for each grant. The vesting conditions include service terms and performance grade of
the employees. These options are exercisable at the market price of Company’s shares on the date of grant.
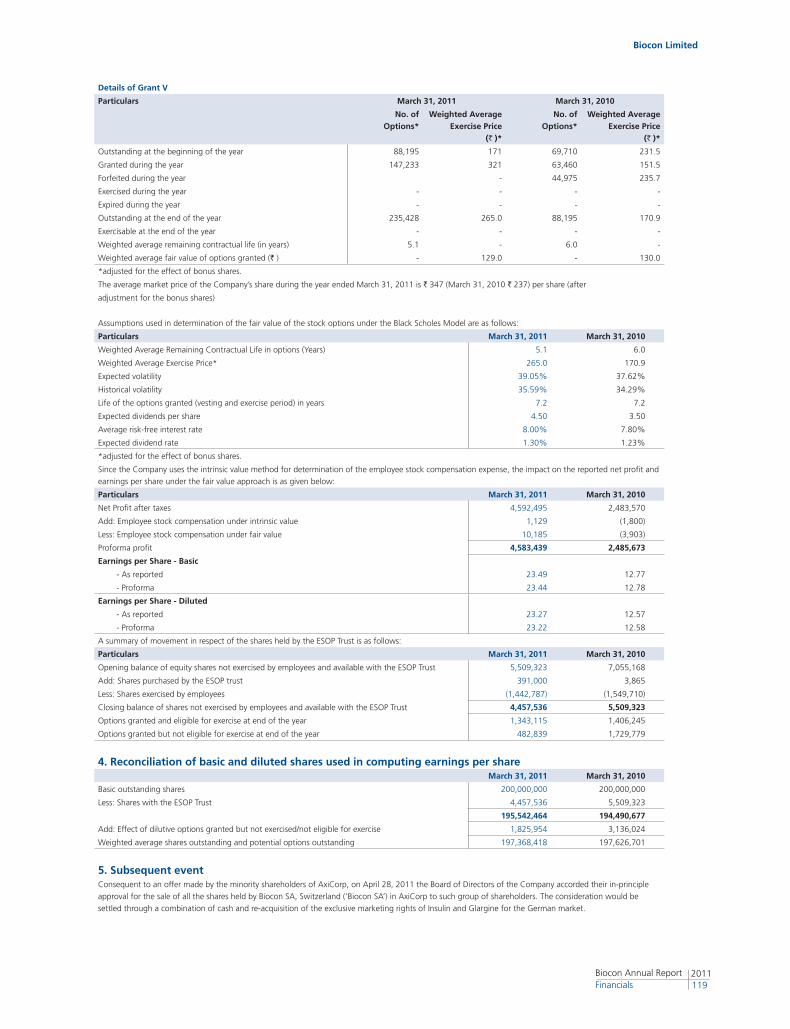
Biocon Limited
2011119
Biocon Annual Report Financials
Details of Grant V
Particulars March 31, 2011 March 31, 2010
No. of Options*
Weighted Average Exercise Price
(` )*
No. of Options*
Weighted Average Exercise Price
(` )*
Outstanding at the beginning of the year 88,195 171 69,710 231.5
Granted during the year 147,233 321 63,460 151.5
Forfeited during the year - 44,975 235.7
Exercised during the year - - - -
Expired during the year - - - -
Outstanding at the end of the year 235,428 265.0 88,195 170.9
Exercisable at the end of the year - - - -
Weighted average remaining contractual life (in years) 5.1 - 6.0 -
Weighted average fair value of options granted (` ) - 129.0 - 130.0
*adjusted for the effect of bonus shares.
The average market price of the Company’s share during the year ended March 31, 2011 is ` 347 (March 31, 2010 ` 237) per share (after
adjustment for the bonus shares)
Assumptions used in determination of the fair value of the stock options under the Black Scholes Model are as follows:
Particulars March 31, 2011 March 31, 2010
Weighted Average Remaining Contractual Life in options (Years) 5.1 6.0
Weighted Average Exercise Price* 265.0 170.9
Expected volatility 39.05% 37.62%
Historical volatility 35.59% 34.29%
Life of the options granted (vesting and exercise period) in years 7.2 7.2
Expected dividends per share 4.50 3.50
Average risk-free interest rate 8.00% 7.80%
Expected dividend rate 1.30% 1.23%
*adjusted for the effect of bonus shares.
Since the Company uses the intrinsic value method for determination of the employee stock compensation expense, the impact on the reported net profit and
earnings per share under the fair value approach is as given below:
Particulars March 31, 2011 March 31, 2010
Net Profit after taxes 4,592,495 2,483,570
Add: Employee stock compensation under intrinsic value 1,129 (1,800)
Less: Employee stock compensation under fair value 10,185 (3,903)
Proforma profit 4,583,439 2,485,673
Earnings per Share - Basic
- As reported 23.49 12.77
- Proforma 23.44 12.78
Earnings per Share - Diluted
- As reported 23.27 12.57
- Proforma 23.22 12.58
A summary of movement in respect of the shares held by the ESOP Trust is as follows:
Particulars March 31, 2011 March 31, 2010
Opening balance of equity shares not exercised by employees and available with the ESOP Trust 5,509,323 7,055,168
Add: Shares purchased by the ESOP trust 391,000 3,865
Less: Shares exercised by employees (1,442,787) (1,549,710)
Closing balance of shares not exercised by employees and available with the ESOP Trust 4,457,536 5,509,323
Options granted and eligible for exercise at end of the year 1,343,115 1,406,245
Options granted but not eligible for exercise at end of the year 482,839 1,729,779
4. Reconciliation of basic and diluted shares used in computing earnings per shareMarch 31, 2011 March 31, 2010
Basic outstanding shares 200,000,000 200,000,000
Less: Shares with the ESOP Trust 4,457,536 5,509,323
195,542,464 194,490,677
Add: Effect of dilutive options granted but not exercised/not eligible for exercise 1,825,954 3,136,024
Weighted average shares outstanding and potential options outstanding 197,368,418 197,626,701
5. Subsequent eventConsequent to an offer made by the minority shareholders of AxiCorp, on April 28, 2011 the Board of Directors of the Company accorded their in-principle
approval for the sale of all the shares held by Biocon SA, Switzerland (‘Biocon SA’) in AxiCorp to such group of shareholders. The consideration would be
settled through a combination of cash and re-acquisition of the exclusive marketing rights of Insulin and Glargine for the German market.
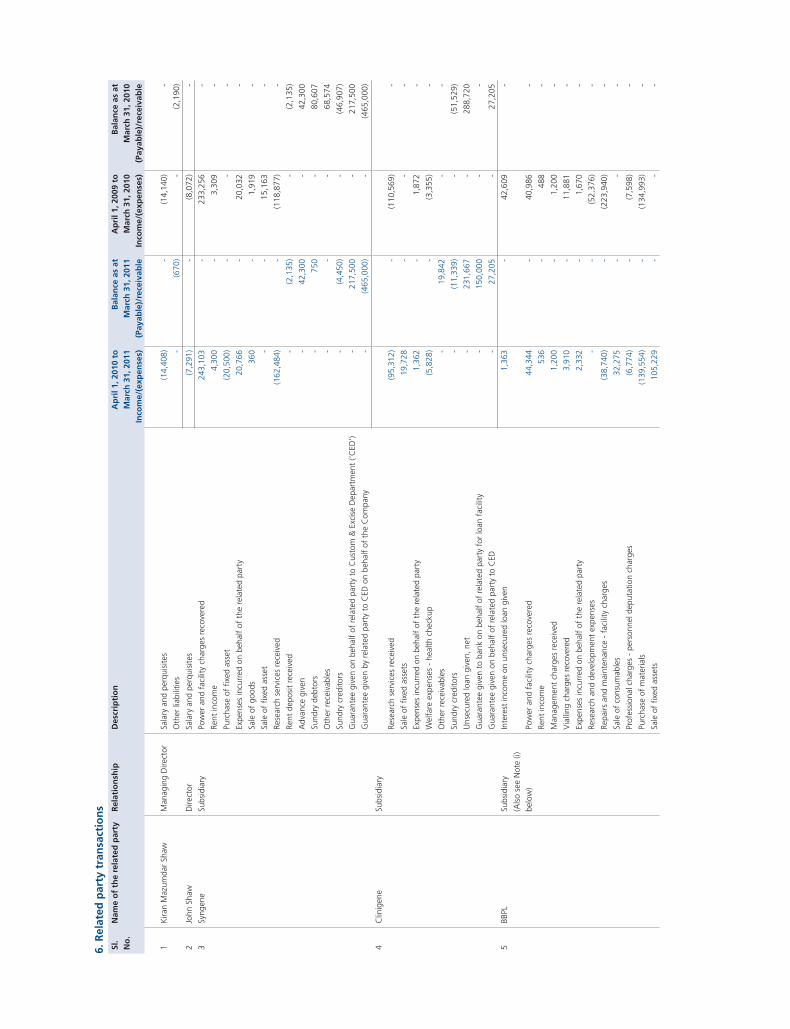
6. R
elat
ed p
arty
tra
nsa
ctio
ns
Sl.
No
.N
ame
of
the
rela
ted
par
ty
Rel
atio
nsh
ipD
escr
ipti
on
Ap
ril 1
, 201
0 to
Mar
ch 3
1, 2
011
Inco
me/
(exp
ense
s)
Bal
ance
as
atM
arch
31,
201
1(P
ayab
le)/
rece
ivab
le
Ap
ril 1
, 200
9 to
Mar
ch 3
1, 2
010
Inco
me/
(exp
ense
s)
Bal
ance
as
atM
arch
31,
201
0(P
ayab
le)/
rece
ivab
le
1 K
iran
Maz
umda
r Sh
awM
anag
ing
Dire
ctor
Sala
ry a
nd p
erqu
isite
s (1
4,40
8) -
(1
4,14
0) -
Oth
er li
abili
ties
-
(670
) -
(2
,190
)
2 Jo
hn S
haw
Dire
ctor
Sala
ry a
nd p
erqu
isite
s (7
,291
) -
(8
,072
) -
3 Sy
ngen
eSu
bsid
iary
Po
wer
and
fac
ility
cha
rges
rec
over
ed 2
43,1
03
-
233
,256
-
Rent
inco
me
4,3
00
-
3,3
09
-
Purc
hase
of
fixed
ass
et (2
0,50
0) -
-
-
Expe
nses
incu
rred
on
beha
lf of
the
rel
ated
par
ty 2
0,76
6 -
2
0,03
2 -
Sale
of
good
s 3
60
-
1,9
19
-
Sale
of
fixed
ass
et -
-
1
5,16
3 -
Rese
arch
ser
vice
s re
ceiv
ed
(162
,484
) -
(1
18,8
77)
-
Rent
dep
osit
rece
ived
-
(2
,135
) -
(2
,135
)
Adv
ance
giv
en
-
42,
300
-
42,
300
Sund
ry d
ebto
rs -
7
50
-
80,
607
Oth
er r
ecei
vabl
es -
-
-
6
8,57
4
Sund
ry c
redi
tors
-
(4,4
50)
-
(46,
907)
Gua
rant
ee g
iven
on
beha
lf of
rel
ated
par
ty t
o C
usto
m &
Exc
ise
Dep
artm
ent
(‘CED
’) -
2
17,5
00
-
217
,500
Gua
rant
ee g
iven
by
rela
ted
part
y to
CED
on
beha
lf of
the
Com
pany
-
(465
,000
) -
(4
65,0
00)
4 C
linig
ene
Subs
idia
ry
Rese
arch
ser
vice
s re
ceiv
ed (9
5,31
2) -
(1
10,5
69)
-
Sale
of
fixed
ass
ets
19,
728
-
-
-
Expe
nses
incu
rred
on
beha
lf of
the
rel
ated
par
ty 1
,362
-
1
,872
-
Wel
fare
exp
ense
s -
heal
th c
heck
up (5
,828
) -
(3
,355
) -
Oth
er r
ecei
vabl
es -
1
9,84
2 -
-
Sund
ry c
redi
tors
-
(11,
339)
-
(51,
529)
Uns
ecur
ed lo
an g
iven
, net
-
231
,667
-
2
88,7
20
Gua
rant
ee g
iven
to
bank
on
beha
lf of
rel
ated
par
ty f
or lo
an f
acili
ty -
1
50,0
00
-
-
Gua
rant
ee g
iven
on
beha
lf of
rel
ated
par
ty t
o C
ED -
2
7,20
5 -
2
7,20
5
5 BB
PLSu
bsid
iary
Inte
rest
inco
me
on u
nsec
ured
loan
giv
en 1
,363
-
4
2,60
9 -
(Als
o se
e N
ote
(i)
belo
w)
Pow
er a
nd f
acili
ty c
harg
es r
ecov
ered
4
4,34
4 -
4
0,98
6 -
Rent
inco
me
536
-
4
88
-
Man
agem
ent
char
ges
rece
ived
1,2
00
-
1,2
00
-
Via
lling
cha
rges
rec
over
ed 3
,910
-
1
1,88
1 -
Expe
nses
incu
rred
on
beha
lf of
the
rel
ated
par
ty 2
,332
-
1
,670
-
Rese
arch
and
dev
elop
men
t ex
pens
es -
-
(5
2,37
6) -
Repa
irs a
nd m
aint
enan
ce -
fac
ility
cha
rges
(38,
740)
-
(223
,940
) -
Sale
of
cons
umab
les
32,
275
-
-
-
Prof
essi
onal
cha
rges
- p
erso
nnel
dep
utat
ion
char
ges
(6,7
74)
-
(7,5
98)
-
Purc
hase
of
mat
eria
ls (1
39,5
54)
-
(134
,993
) -
Sale
of
fixed
ass
ets
105
,229
-
-
-
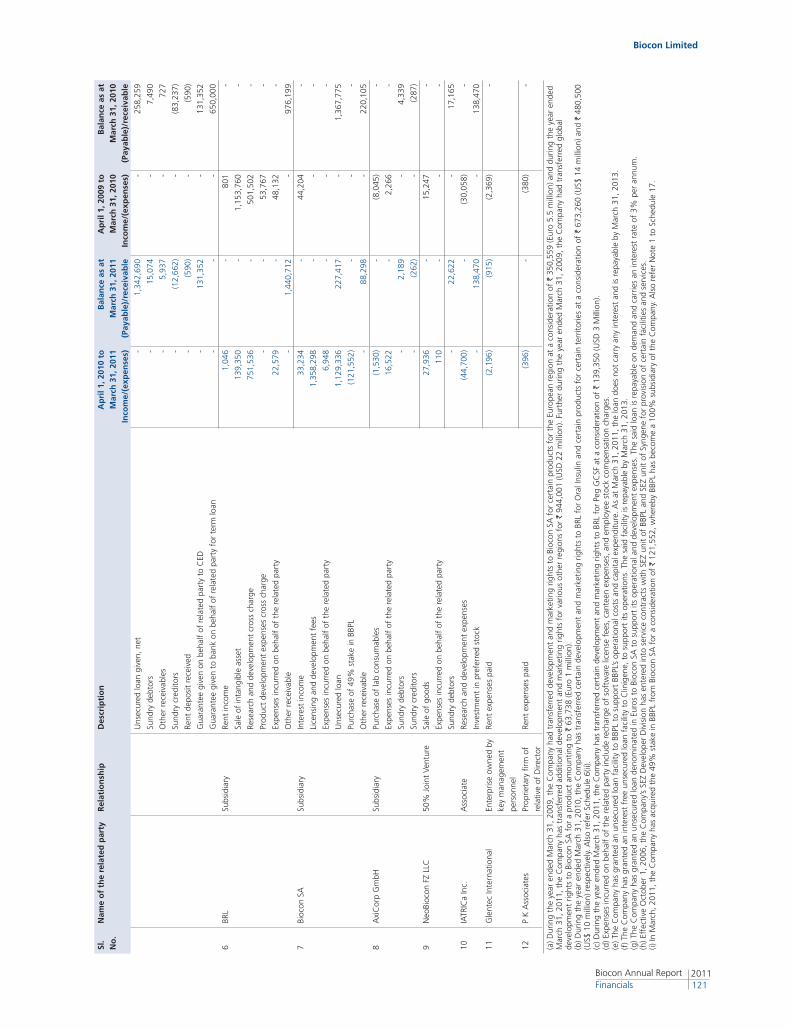
Biocon Limited
2011121
Biocon Annual Report Financials
Sl.
No
.N
ame
of
the
rela
ted
par
ty
Rel
atio
nsh
ipD
escr
ipti
on
Ap
ril 1
, 201
0 to
Mar
ch 3
1, 2
011
Inco
me/
(exp
ense
s)
Bal
ance
as
atM
arch
31,
201
1(P
ayab
le)/
rece
ivab
le
Ap
ril 1
, 200
9 to
Mar
ch 3
1, 2
010
Inco
me/
(exp
ense
s)
Bal
ance
as
atM
arch
31,
201
0(P
ayab
le)/
rece
ivab
le
Uns
ecur
ed lo
an g
iven
, net
-
1,3
42,6
90
-
258
,259
Sund
ry d
ebto
rs -
1
5,07
4 -
7
,490
Oth
er r
ecei
vabl
es -
5
,937
-
7
27
Sund
ry c
redi
tors
-
(12,
662)
-
(83,
237)
Rent
dep
osit
rece
ived
-
(590
) -
(5
90)
Gua
rant
ee g
iven
on
beha
lf of
rel
ated
par
ty t
o C
ED -
1
31,3
52
-
131
,352
Gua
rant
ee g
iven
to
bank
on
beha
lf of
rel
ated
par
ty f
or t
erm
loan
-
-
-
6
50,0
00
6 BR
LSu
bsid
iary
Rent
inco
me
1,0
46
-
801
-
Sale
of
inta
ngib
le a
sset
139
,350
-
1
,153
,760
-
Rese
arch
and
dev
elop
men
t cr
oss
char
ge
751
,536
-
5
01,5
02
-
Prod
uct
deve
lopm
ent
expe
nses
cro
ss c
harg
e -
-
5
3,76
7 -
Expe
nses
incu
rred
on
beha
lf of
the
rel
ated
par
ty 2
2,57
9 -
4
8,13
2 -
Oth
er r
ecei
vabl
e -
1
,440
,712
-
9
76,1
99
7 Bi
ocon
SA
Subs
idia
ryIn
tere
st in
com
e 3
3,23
4 -
4
4,20
4 -
Lice
nsin
g an
d de
velo
pmen
t fe
es 1
,358
,298
-
-
-
Expe
nses
incu
rred
on
beha
lf of
the
rel
ated
par
ty 6
,948
-
-
-
Uns
ecur
ed lo
an 1
,129
,336
2
27,4
17
-
1,3
67,7
75
Purc
hase
of
49%
sta
ke in
BBP
L (1
21,5
52)
-
-
-
Oth
er r
ecei
vabl
e -
8
8,29
8 -
2
20,1
05
8 A
xiC
orp
Gm
bHSu
bsid
iary
Purc
hase
of
lab
cons
umab
les
(1,5
30)
-
(8,0
45)
-
Expe
nses
incu
rred
on
beha
lf of
the
rel
ated
par
ty 1
6,52
2 -
2
,266
-
Sund
ry d
ebto
rs -
2
,189
-
4
,339
Sund
ry c
redi
tors
-
(262
) -
(2
87)
9 N
eoBi
ocon
FZ
LLC
50%
Joi
nt V
entu
reSa
le o
f go
ods
27,
936
-
15,
247
-
Expe
nses
incu
rred
on
beha
lf of
the
rel
ated
par
ty 1
10
-
-
-
Sund
ry d
ebto
rs -
2
2,62
2 -
1
7,16
5
10
IATR
ICa
Inc.
Ass
ocia
teRe
sear
ch a
nd d
evel
opm
ent
expe
nses
(44,
700)
-
(30,
058)
-
Inve
stm
ent
in p
refe
rred
sto
ck -
1
38,4
70
-
138
,470
11
Gle
ntec
Inte
rnat
iona
lEn
terp
rise
owne
d by
key
man
agem
ent
pers
onne
l
Rent
exp
ense
s pa
id
(2,1
96)
(915
) (2
,369
) -
12
P K
Ass
ocia
tes
Prop
rieta
ry fi
rm o
f
rela
tive
of D
irect
or
Rent
exp
ense
s pa
id
(396
) -
(3
80)
-
(a) D
urin
g th
e ye
ar e
nded
Mar
ch 3
1, 2
009,
the
Com
pany
had
tra
nsfe
rred
dev
elop
men
t an
d m
arke
ting
right
s to
Bio
con
SA f
or c
erta
in p
rodu
cts
for
the
Euro
pean
reg
ion
at a
con
side
ratio
n of
` 3
50,5
59 (E
uro
5.5
mill
ion)
and
dur
ing
the
year
end
ed
Mar
ch 3
1, 2
011,
the
Com
pany
has
tra
nsfe
rred
add
ition
al d
evel
opm
ent
and
mar
ketin
g rig
hts
for
vario
us o
ther
reg
ions
for
` 9
44,0
01 (U
SD 2
2 m
illio
n). F
urth
er d
urin
g th
e ye
ar e
nded
Mar
ch 3
1, 2
009,
the
Com
pany
had
tra
nsfe
rred
glo
bal
deve
lopm
ent
right
s to
Bio
con
SA f
or a
pro
duct
am
ount
ing
to `
63,
738
(Eur
o 1
mill
ion)
. (b
) Dur
ing
the
year
end
ed M
arch
31,
201
0, t
he C
ompa
ny h
as t
rans
ferr
ed c
erta
in d
evel
opm
ent
and
mar
ketin
g rig
hts
to B
RL f
or O
ral I
nsul
in a
nd c
erta
in p
rodu
cts
for
cert
ain
terr
itorie
s at
a c
onsi
dera
tion
of `
673
,260
(US$
14
mill
ion)
and
` 4
80,5
00
(US$
10
mill
ion)
res
pect
ivel
y. A
lso
refe
r Sc
hedu
le 6
(ii).
(c) D
urin
g th
e ye
ar e
nded
Mar
ch 3
1, 2
011,
the
Com
pany
has
tra
nsfe
rred
cer
tain
dev
elop
men
t an
d m
arke
ting
right
s to
BRL
for
Peg
GC
SF a
t a
cons
ider
atio
n of
` 1
39,3
50 (U
SD 3
Mill
ion)
.(d
) Exp
ense
s in
curr
ed o
n be
half
of t
he r
elat
ed p
arty
incl
ude
rech
arge
of
soft
war
e lic
ense
fee
s, c
ante
en e
xpen
ses,
and
em
ploy
ee s
tock
com
pens
atio
n ch
arge
s.(e
) The
Com
pany
has
gra
nted
an
unse
cure
d lo
an f
acili
ty t
o BB
PL t
o su
ppor
t BB
PL’s
oper
atio
nal c
osts
and
cap
ital e
xpen
ditu
re. A
s at
Mar
ch 3
1, 2
011,
the
loan
doe
s no
t ca
rry
any
inte
rest
and
is r
epay
able
by
Mar
ch 3
1, 2
013.
(f
) The
Com
pany
has
gra
nted
an
inte
rest
fre
e un
secu
red
loan
fac
ility
to
Clin
igen
e, t
o su
ppor
t its
ope
ratio
ns. T
he s
aid
faci
lity
is r
epay
able
by
Mar
ch 3
1, 2
013.
(g) T
he C
ompa
ny h
as g
rant
ed a
n un
secu
red
loan
den
omin
ated
in E
uros
to
Bioc
on S
A t
o su
ppor
t its
ope
ratio
nal a
nd d
evel
opm
ent
expe
nses
. The
sai
d lo
an is
rep
ayab
le o
n de
man
d an
d ca
rrie
s an
inte
rest
rat
e of
3%
per
ann
um.
(h) E
ffec
tive
Oct
ober
1, 2
006,
the
Com
pany
’s SE
Z D
evel
oper
Div
isio
n ha
s en
tere
d in
to s
ervi
ce c
ontr
acts
with
SEZ
uni
t of
BBP
L an
d SE
Z un
it of
Syn
gene
for
pro
visi
on o
f ce
rtai
n fa
cilit
ies
and
serv
ices
.(i)
In M
arch
, 201
1, t
he C
ompa
ny h
as a
cqui
red
the
49%
sta
ke in
BBP
L fr
om B
ioco
n SA
for
a c
onsi
dera
tion
of `
121
,552
, whe
reby
BBP
L ha
s be
com
e a
100%
sub
sidi
ary
of t
he C
ompa
ny. A
lso
refe
r N
ote
1 to
Sch
edul
e 17
.
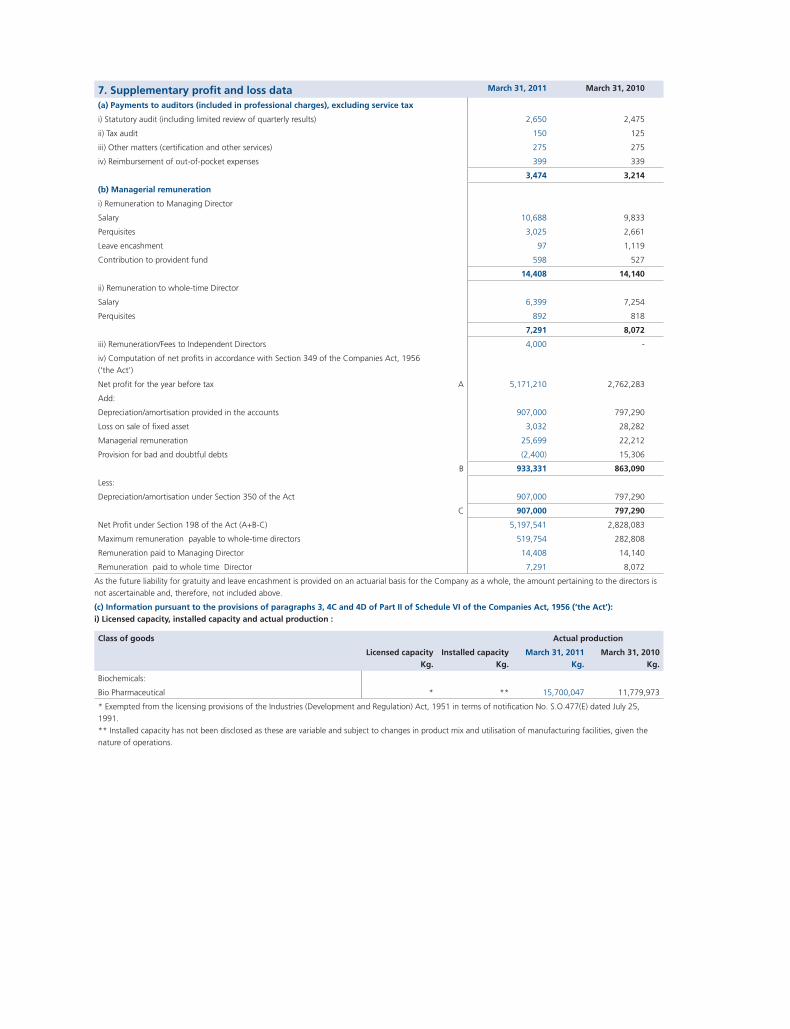
7. Supplementary profit and loss data March 31, 2011 March 31, 2010
(a) Payments to auditors (included in professional charges), excluding service tax
i) Statutory audit (including limited review of quarterly results) 2,650 2,475
ii) Tax audit 150 125
iii) Other matters (certification and other services) 275 275
iv) Reimbursement of out-of-pocket expenses 399 339
3,474 3,214
(b) Managerial remuneration
i) Remuneration to Managing Director
Salary 10,688 9,833
Perquisites 3,025 2,661
Leave encashment 97 1,119
Contribution to provident fund 598 527
14,408 14,140
ii) Remuneration to whole-time Director
Salary 6,399 7,254
Perquisites 892 818
7,291 8,072
iii) Remuneration/Fees to Independent Directors 4,000 -
iv) Computation of net profits in accordance with Section 349 of the Companies Act, 1956
(‘the Act’)
Net profit for the year before tax A 5,171,210 2,762,283
Add:
Depreciation/amortisation provided in the accounts 907,000 797,290
Loss on sale of fixed asset 3,032 28,282
Managerial remuneration 25,699 22,212
Provision for bad and doubtful debts (2,400) 15,306
B 933,331 863,090
Less:
Depreciation/amortisation under Section 350 of the Act 907,000 797,290
C 907,000 797,290
Net Profit under Section 198 of the Act (A+B-C) 5,197,541 2,828,083
Maximum remuneration payable to whole-time directors 519,754 282,808
Remuneration paid to Managing Director 14,408 14,140
Remuneration paid to whole time Director 7,291 8,072
As the future liability for gratuity and leave encashment is provided on an actuarial basis for the Company as a whole, the amount pertaining to the directors is
not ascertainable and, therefore, not included above.
(c) Information pursuant to the provisions of paragraphs 3, 4C and 4D of Part II of Schedule VI of the Companies Act, 1956 (‘the Act’):i) Licensed capacity, installed capacity and actual production :
Class of goods Actual production
Licensed capacityKg.
Installed capacity Kg.
March 31, 2011Kg.
March 31, 2010 Kg.
Biochemicals:
Bio Pharmaceutical * ** 15,700,047 11,779,973
* Exempted from the licensing provisions of the Industries (Development and Regulation) Act, 1951 in terms of notification No. S.O.477(E) dated July 25,
1991.
** Installed capacity has not been disclosed as these are variable and subject to changes in product mix and utilisation of manufacturing facilities, given the
nature of operations.
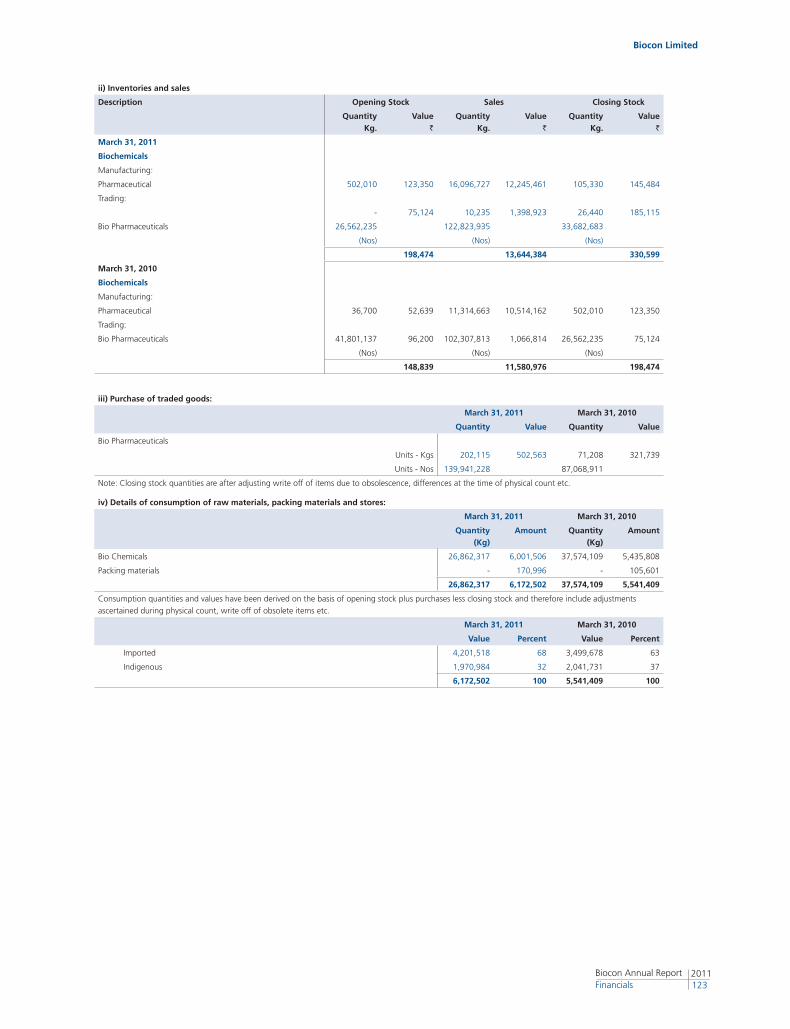
Biocon Limited
2011123
Biocon Annual Report Financials
ii) Inventories and sales
Description Opening Stock Sales Closing Stock
Quantity Kg.
Value`
QuantityKg.
Value `
QuantityKg.
Value`
March 31, 2011
Biochemicals
Manufacturing:
Pharmaceutical 502,010 123,350 16,096,727 12,245,461 105,330 145,484
Trading:
- 75,124 10,235 1,398,923 26,440 185,115
Bio Pharmaceuticals 26,562,235 122,823,935 33,682,683
(Nos) (Nos) (Nos)
198,474 13,644,384 330,599
March 31, 2010
Biochemicals
Manufacturing:
Pharmaceutical 36,700 52,639 11,314,663 10,514,162 502,010 123,350
Trading:
Bio Pharmaceuticals 41,801,137 96,200 102,307,813 1,066,814 26,562,235 75,124
(Nos) (Nos) (Nos)
148,839 11,580,976 198,474
iii) Purchase of traded goods:
March 31, 2011 March 31, 2010
Quantity Value Quantity Value
Bio Pharmaceuticals
Units - Kgs 202,115 502,563 71,208 321,739
Units - Nos 139,941,228 87,068,911
Note: Closing stock quantities are after adjusting write off of items due to obsolescence, differences at the time of physical count etc.
iv) Details of consumption of raw materials, packing materials and stores:
March 31, 2011 March 31, 2010
Quantity(Kg)
Amount Quantity(Kg)
Amount
Bio Chemicals 26,862,317 6,001,506 37,574,109 5,435,808
Packing materials - 170,996 - 105,601
26,862,317 6,172,502 37,574,109 5,541,409
Consumption quantities and values have been derived on the basis of opening stock plus purchases less closing stock and therefore include adjustments
ascertained during physical count, write off of obsolete items etc.
March 31, 2011 March 31, 2010
Value Percent Value Percent
Imported 4,201,518 68 3,499,678 63
Indigenous 1,970,984 32 2,041,731 37
6,172,502 100 5,541,409 100
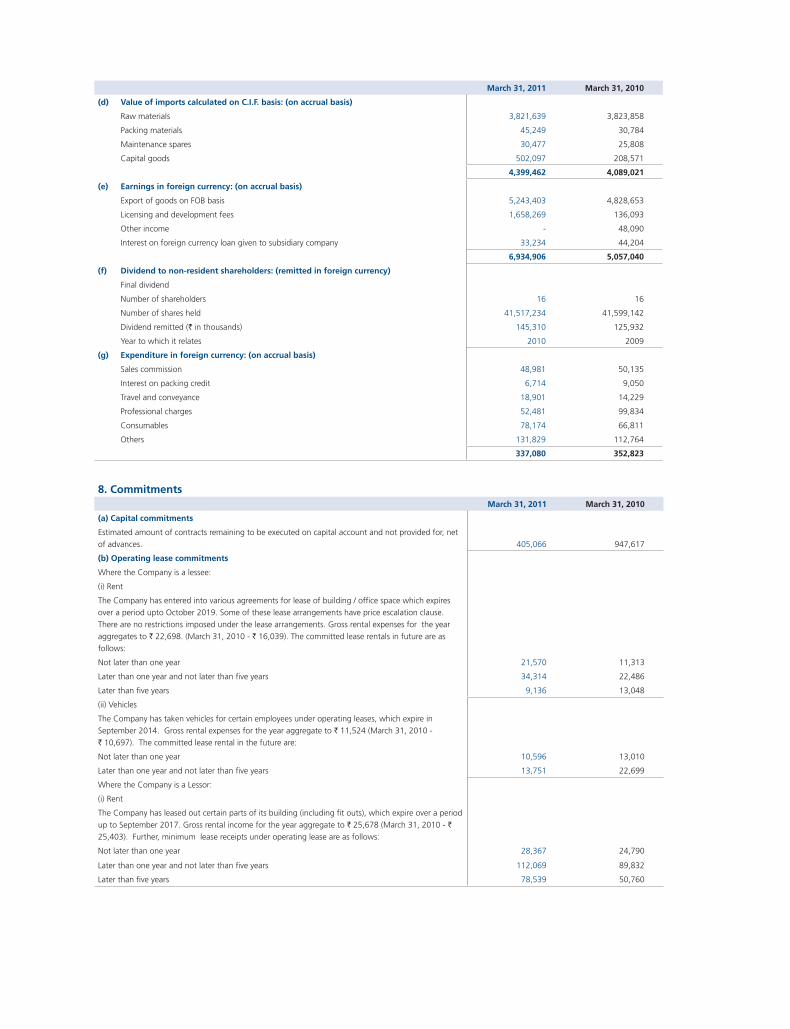
March 31, 2011 March 31, 2010
(d) Value of imports calculated on C.I.F. basis: (on accrual basis)
Raw materials 3,821,639 3,823,858
Packing materials 45,249 30,784
Maintenance spares 30,477 25,808
Capital goods 502,097 208,571
4,399,462 4,089,021
(e) Earnings in foreign currency: (on accrual basis)
Export of goods on FOB basis 5,243,403 4,828,653
Licensing and development fees 1,658,269 136,093
Other income - 48,090
Interest on foreign currency loan given to subsidiary company 33,234 44,204
6,934,906 5,057,040
(f) Dividend to non-resident shareholders: (remitted in foreign currency)
Final dividend
Number of shareholders 16 16
Number of shares held 41,517,234 41,599,142
Dividend remitted (` in thousands) 145,310 125,932
Year to which it relates 2010 2009
(g) Expenditure in foreign currency: (on accrual basis)
Sales commission 48,981 50,135
Interest on packing credit 6,714 9,050
Travel and conveyance 18,901 14,229
Professional charges 52,481 99,834
Consumables 78,174 66,811
Others 131,829 112,764
337,080 352,823
8. CommitmentsMarch 31, 2011 March 31, 2010
(a) Capital commitments
Estimated amount of contracts remaining to be executed on capital account and not provided for, net
of advances. 405,066 947,617
(b) Operating lease commitments
Where the Company is a lessee:
(i) Rent
The Company has entered into various agreements for lease of building / office space which expires
over a period upto October 2019. Some of these lease arrangements have price escalation clause.
There are no restrictions imposed under the lease arrangements. Gross rental expenses for the year
aggregates to ` 22,698. (March 31, 2010 - ` 16,039). The committed lease rentals in future are as
follows:
Not later than one year 21,570 11,313
Later than one year and not later than five years 34,314 22,486
Later than five years 9,136 13,048
(ii) Vehicles
The Company has taken vehicles for certain employees under operating leases, which expire in
September 2014. Gross rental expenses for the year aggregate to ` 11,524 (March 31, 2010 -
` 10,697). The committed lease rental in the future are:
Not later than one year 10,596 13,010
Later than one year and not later than five years 13,751 22,699
Where the Company is a Lessor:
(i) Rent
The Company has leased out certain parts of its building (including fit outs), which expire over a period
up to September 2017. Gross rental income for the year aggregate to ` 25,678 (March 31, 2010 - `
25,403). Further, minimum lease receipts under operating lease are as follows:
Not later than one year 28,367 24,790
Later than one year and not later than five years 112,069 89,832
Later than five years 78,539 50,760
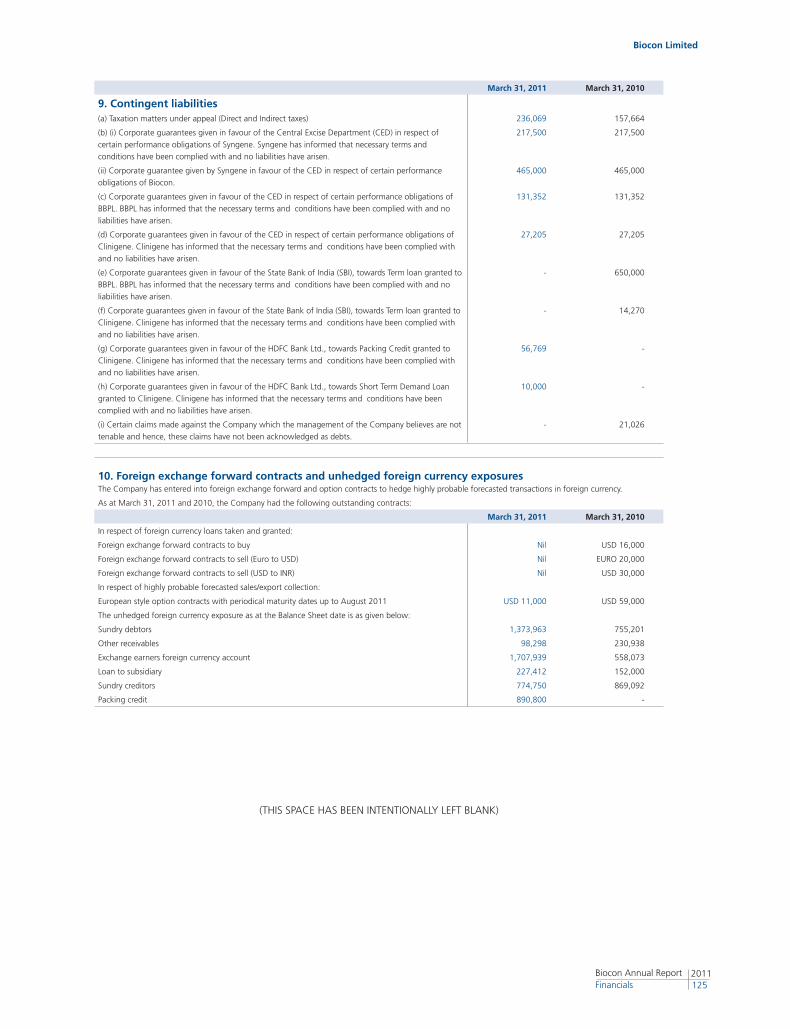
Biocon Limited
2011125
Biocon Annual Report Financials
(THIS SPACE HAS BEEN INTENTIONALLY LEFT BLANK)
March 31, 2011 March 31, 2010
9. Contingent liabilities(a) Taxation matters under appeal (Direct and Indirect taxes) 236,069 157,664
(b) (i) Corporate guarantees given in favour of the Central Excise Department (CED) in respect of
certain performance obligations of Syngene. Syngene has informed that necessary terms and
conditions have been complied with and no liabilities have arisen.
217,500 217,500
(ii) Corporate guarantee given by Syngene in favour of the CED in respect of certain performance
obligations of Biocon.
465,000 465,000
(c) Corporate guarantees given in favour of the CED in respect of certain performance obligations of
BBPL. BBPL has informed that the necessary terms and conditions have been complied with and no
liabilities have arisen.
131,352 131,352
(d) Corporate guarantees given in favour of the CED in respect of certain performance obligations of
Clinigene. Clinigene has informed that the necessary terms and conditions have been complied with
and no liabilities have arisen.
27,205 27,205
(e) Corporate guarantees given in favour of the State Bank of India (SBI), towards Term loan granted to
BBPL. BBPL has informed that the necessary terms and conditions have been complied with and no
liabilities have arisen.
- 650,000
(f) Corporate guarantees given in favour of the State Bank of India (SBI), towards Term loan granted to
Clinigene. Clinigene has informed that the necessary terms and conditions have been complied with
and no liabilities have arisen.
- 14,270
(g) Corporate guarantees given in favour of the HDFC Bank Ltd., towards Packing Credit granted to
Clinigene. Clinigene has informed that the necessary terms and conditions have been complied with
and no liabilities have arisen.
56,769 -
(h) Corporate guarantees given in favour of the HDFC Bank Ltd., towards Short Term Demand Loan
granted to Clinigene. Clinigene has informed that the necessary terms and conditions have been
complied with and no liabilities have arisen.
10,000 -
(i) Certain claims made against the Company which the management of the Company believes are not
tenable and hence, these claims have not been acknowledged as debts.
- 21,026
10. Foreign exchange forward contracts and unhedged foreign currency exposuresThe Company has entered into foreign exchange forward and option contracts to hedge highly probable forecasted transactions in foreign currency.
As at March 31, 2011 and 2010, the Company had the following outstanding contracts:
March 31, 2011 March 31, 2010
In respect of foreign currency loans taken and granted:
Foreign exchange forward contracts to buy Nil USD 16,000
Foreign exchange forward contracts to sell (Euro to USD) Nil EURO 20,000
Foreign exchange forward contracts to sell (USD to INR) Nil USD 30,000
In respect of highly probable forecasted sales/export collection:
European style option contracts with periodical maturity dates up to August 2011 USD 11,000 USD 59,000
The unhedged foreign currency exposure as at the Balance Sheet date is as given below:
Sundry debtors 1,373,963 755,201
Other receivables 98,298 230,938
Exchange earners foreign currency account 1,707,939 558,073
Loan to subsidiary 227,412 152,000
Sundry creditors 774,750 869,092
Packing credit 890,800 -
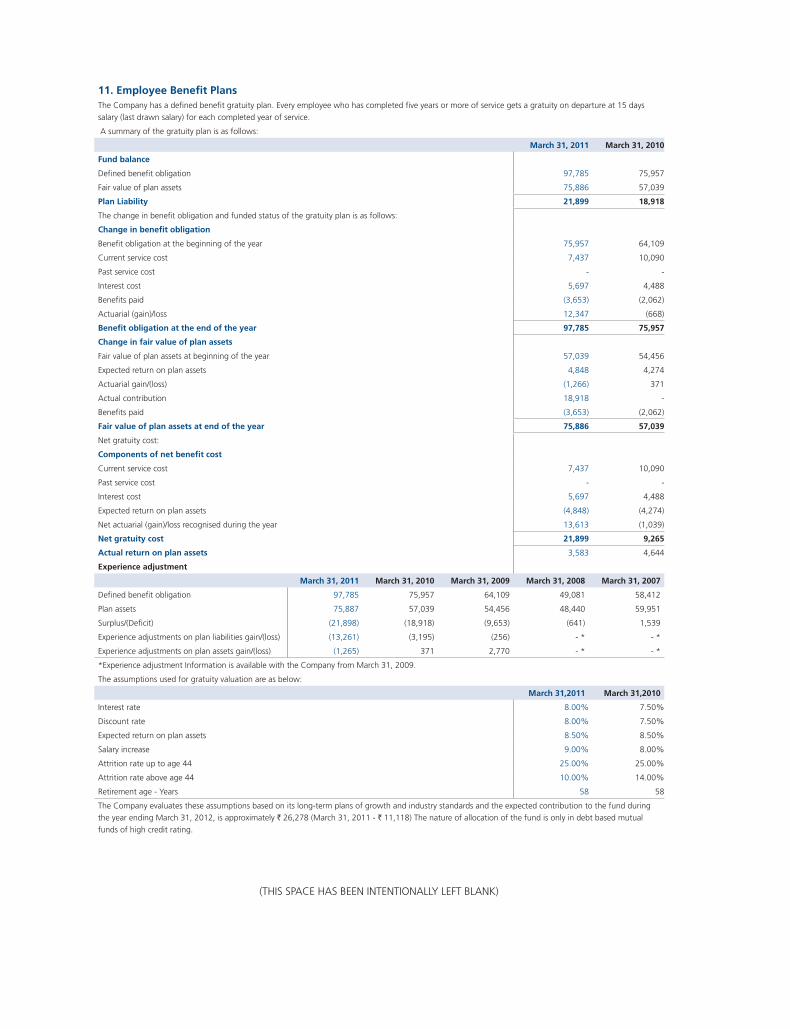
(THIS SPACE HAS BEEN INTENTIONALLY LEFT BLANK)
11. Employee Benefit Plans The Company has a defined benefit gratuity plan. Every employee who has completed five years or more of service gets a gratuity on departure at 15 days
salary (last drawn salary) for each completed year of service.
A summary of the gratuity plan is as follows:
March 31, 2011 March 31, 2010
Fund balance
Defined benefit obligation 97,785 75,957
Fair value of plan assets 75,886 57,039
Plan Liability 21,899 18,918
The change in benefit obligation and funded status of the gratuity plan is as follows:
Change in benefit obligation
Benefit obligation at the beginning of the year 75,957 64,109
Current service cost 7,437 10,090
Past service cost - -
Interest cost 5,697 4,488
Benefits paid (3,653) (2,062)
Actuarial (gain)/loss 12,347 (668)
Benefit obligation at the end of the year 97,785 75,957
Change in fair value of plan assets
Fair value of plan assets at beginning of the year 57,039 54,456
Expected return on plan assets 4,848 4,274
Actuarial gain/(loss) (1,266) 371
Actual contribution 18,918 -
Benefits paid (3,653) (2,062)
Fair value of plan assets at end of the year 75,886 57,039
Net gratuity cost:
Components of net benefit cost
Current service cost 7,437 10,090
Past service cost - -
Interest cost 5,697 4,488
Expected return on plan assets (4,848) (4,274)
Net actuarial (gain)/loss recognised during the year 13,613 (1,039)
Net gratuity cost 21,899 9,265
Actual return on plan assets 3,583 4,644
Experience adjustment
March 31, 2011 March 31, 2010 March 31, 2009 March 31, 2008 March 31, 2007
Defined benefit obligation 97,785 75,957 64,109 49,081 58,412
Plan assets 75,887 57,039 54,456 48,440 59,951
Surplus/(Deficit) (21,898) (18,918) (9,653) (641) 1,539
Experience adjustments on plan liabilities gain/(loss) (13,261) (3,195) (256) - * - *
Experience adjustments on plan assets gain/(loss) (1,265) 371 2,770 - * - *
*Experience adjustment Information is available with the Company from March 31, 2009.
The assumptions used for gratuity valuation are as below:
March 31,2011 March 31,2010
Interest rate 8.00% 7.50%
Discount rate 8.00% 7.50%
Expected return on plan assets 8.50% 8.50%
Salary increase 9.00% 8.00%
Attrition rate up to age 44 25.00% 25.00%
Attrition rate above age 44 10.00% 14.00%
Retirement age - Years 58 58
The Company evaluates these assumptions based on its long-term plans of growth and industry standards and the expected contribution to the fund during
the year ending March 31, 2012, is approximately ` 26,278 (March 31, 2011 - ` 11,118) The nature of allocation of the fund is only in debt based mutual
funds of high credit rating.
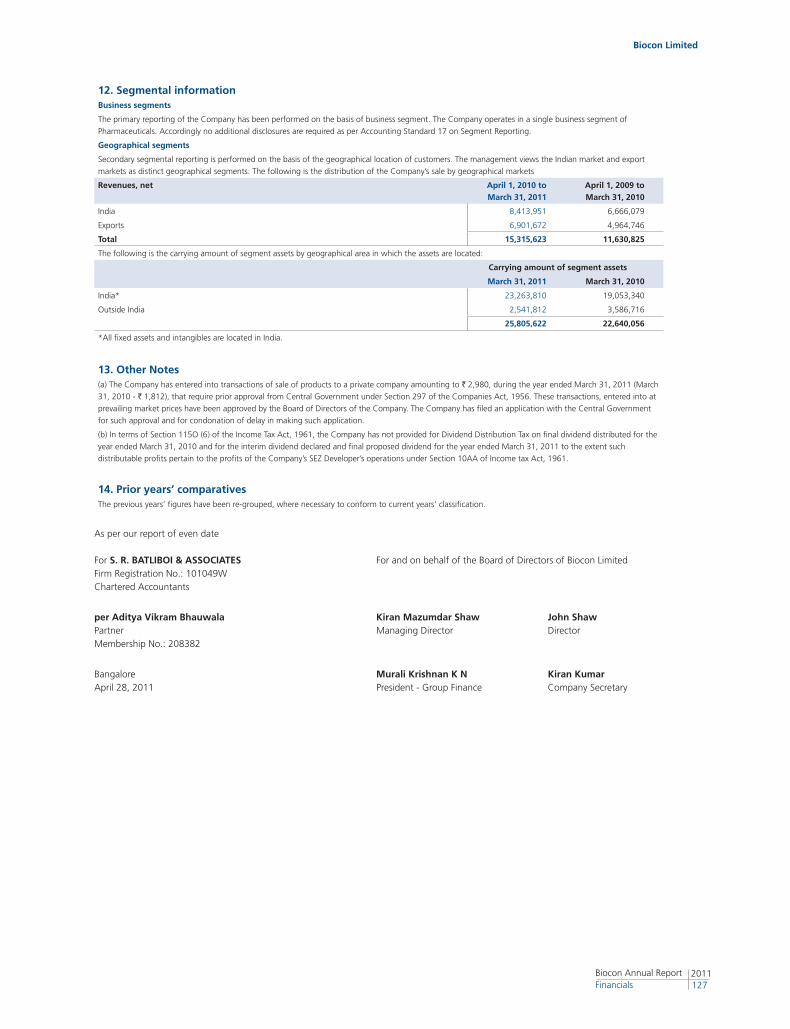
Biocon Limited
2011127
Biocon Annual Report Financials
12. Segmental informationBusiness segments
The primary reporting of the Company has been performed on the basis of business segment. The Company operates in a single business segment of
Pharmaceuticals. Accordingly no additional disclosures are required as per Accounting Standard 17 on Segment Reporting.
Geographical segments
Secondary segmental reporting is performed on the basis of the geographical location of customers. The management views the Indian market and export
markets as distinct geographical segments. The following is the distribution of the Company’s sale by geographical markets
Revenues, net April 1, 2010 to March 31, 2011
April 1, 2009 to March 31, 2010
India 8,413,951 6,666,079
Exports 6,901,672 4,964,746
Total 15,315,623 11,630,825
The following is the carrying amount of segment assets by geographical area in which the assets are located:
Carrying amount of segment assets
March 31, 2011 March 31, 2010
India* 23,263,810 19,053,340
Outside India 2,541,812 3,586,716
25,805,622 22,640,056
*All fixed assets and intangibles are located in India.
13. Other Notes(a) The Company has entered into transactions of sale of products to a private company amounting to ` 2,980, during the year ended March 31, 2011 (March
31, 2010 - ` 1,812), that require prior approval from Central Government under Section 297 of the Companies Act, 1956. These transactions, entered into at
prevailing market prices have been approved by the Board of Directors of the Company. The Company has filed an application with the Central Government
for such approval and for condonation of delay in making such application.
(b) In terms of Section 115O (6) of the Income Tax Act, 1961, the Company has not provided for Dividend Distribution Tax on final dividend distributed for the
year ended March 31, 2010 and for the interim dividend declared and final proposed dividend for the year ended March 31, 2011 to the extent such
distributable profits pertain to the profits of the Company’s SEZ Developer’s operations under Section 10AA of Income tax Act, 1961.
14. Prior years’ comparativesThe previous years’ figures have been re-grouped, where necessary to conform to current years’ classification.
As per our report of even date
For S. R. BATLIBOI & ASSOCIATES For and on behalf of the Board of Directors of Biocon LimitedFirm Registration No.: 101049WChartered Accountants
per Aditya Vikram Bhauwala Kiran Mazumdar Shaw John ShawPartner Managing Director DirectorMembership No.: 208382
Bangalore Murali Krishnan K N Kiran KumarApril 28, 2011 President - Group Finance Company Secretary

For and on behalf of the Board of Directors of Biocon Limited
Kiran Mazumdar Shaw John Shaw Managing Director Director
Bangalore Murali Krishnan K N Kiran KumarApril 28, 2011 President - Group Finance Company Secretary
Balance sheet abstract and Company’s general business profile (All amounts in thousands of Rupees)
(a) Registration Details
Registration No. 3417
State Code 08
Balance Sheet Date March 31, 2011
(b) Capital raised during the year
Public Issue Nil
Right Issue Nil
Bonus Issue Nil
Private Placement Nil
(c) Position of Mobilisation and Deployment of Funds
Total Liabilities and shareholders funds 25,805,622
Total Assets 25,805,622
Sources of Funds
Paid up Capital 1,000,000
Reserves 18,468,091
Secured Loans 740,643
Unsecured Loans 945,743
Deferred tax liability 395,518
Application of Funds
Net Fixed Assets 6,662,376
Capital work in progress 1,032,909
Intangible Assets 134,490
Investments 4,858,229
Net Current Assets 8,861,991
(d) Performance of the Company
Turnover 15,921,339
Total expenditure 9,848,438
Profit before tax 5,171,210
Profit after tax 4,592,495
Earnings per share in Rupees 23.49
Dividend rate % 90
(e) Generic Name of principal products of the Company
Item Code No.(ITC Code) 280000 & 290000
Product Description Organic & Inorganic Chemicals
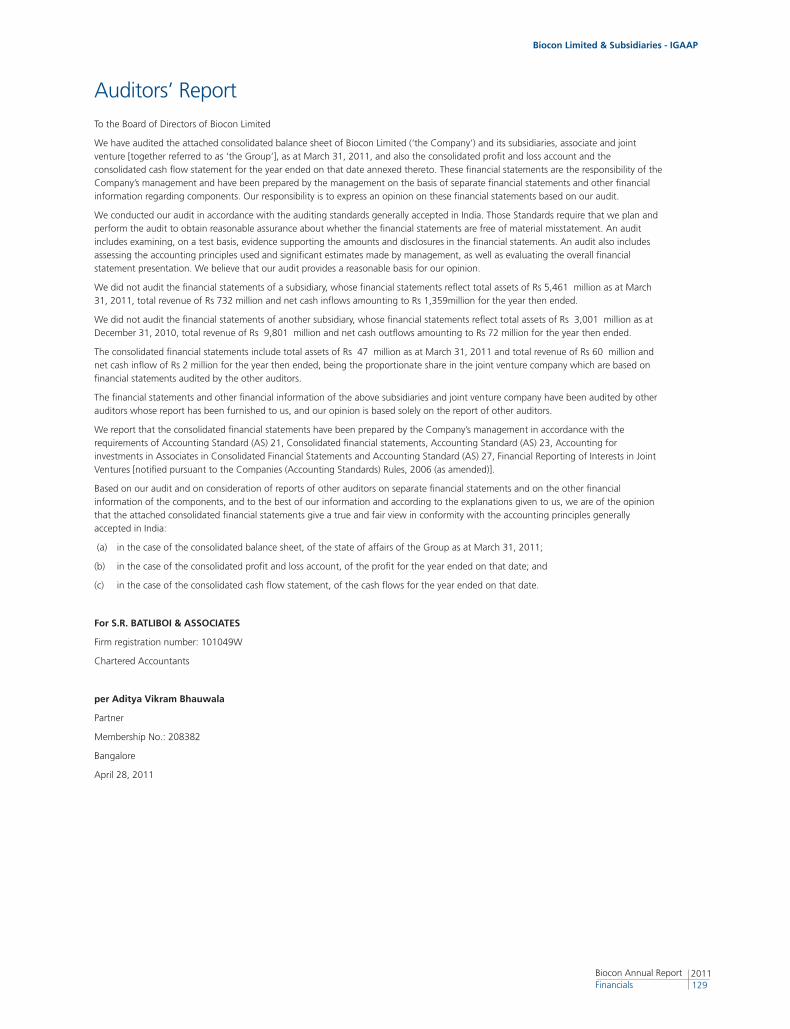
Biocon Limited & Subsidiaries - IGAAP
2011129
Biocon Annual Report Financials
Auditors’ ReportTo the Board of Directors of Biocon Limited
We have audited the attached consolidated balance sheet of Biocon Limited (‘the Company’) and its subsidiaries, associate and joint venture [together referred to as ‘the Group’], as at March 31, 2011, and also the consolidated profit and loss account and the consolidated cash flow statement for the year ended on that date annexed thereto. These financial statements are the responsibility of the Company’s management and have been prepared by the management on the basis of separate financial statements and other financial information regarding components. Our responsibility is to express an opinion on these financial statements based on our audit.
We conducted our audit in accordance with the auditing standards generally accepted in India. Those Standards require that we plan and perform the audit to obtain reasonable assurance about whether the financial statements are free of material misstatement. An audit includes examining, on a test basis, evidence supporting the amounts and disclosures in the financial statements. An audit also includes assessing the accounting principles used and significant estimates made by management, as well as evaluating the overall financial statement presentation. We believe that our audit provides a reasonable basis for our opinion.
We did not audit the financial statements of a subsidiary, whose financial statements reflect total assets of Rs 5,461 million as at March 31, 2011, total revenue of Rs 732 million and net cash inflows amounting to Rs 1,359million for the year then ended.
We did not audit the financial statements of another subsidiary, whose financial statements reflect total assets of Rs 3,001 million as at December 31, 2010, total revenue of Rs 9,801 million and net cash outflows amounting to Rs 72 million for the year then ended.
The consolidated financial statements include total assets of Rs 47 million as at March 31, 2011 and total revenue of Rs 60 million and net cash inflow of Rs 2 million for the year then ended, being the proportionate share in the joint venture company which are based on financial statements audited by the other auditors.
The financial statements and other financial information of the above subsidiaries and joint venture company have been audited by other auditors whose report has been furnished to us, and our opinion is based solely on the report of other auditors.
We report that the consolidated financial statements have been prepared by the Company’s management in accordance with the requirements of Accounting Standard (AS) 21, Consolidated financial statements, Accounting Standard (AS) 23, Accounting for investments in Associates in Consolidated Financial Statements and Accounting Standard (AS) 27, Financial Reporting of Interests in Joint Ventures [notified pursuant to the Companies (Accounting Standards) Rules, 2006 (as amended)].
Based on our audit and on consideration of reports of other auditors on separate financial statements and on the other financial information of the components, and to the best of our information and according to the explanations given to us, we are of the opinion that the attached consolidated financial statements give a true and fair view in conformity with the accounting principles generally accepted in India:
(a) in the case of the consolidated balance sheet, of the state of affairs of the Group as at March 31, 2011;
(b) in the case of the consolidated profit and loss account, of the profit for the year ended on that date; and
(c) in the case of the consolidated cash flow statement, of the cash flows for the year ended on that date.
For S.R. BATLIBOI & ASSOCIATES
Firm registration number: 101049W
Chartered Accountants
per Aditya Vikram Bhauwala
Partner
Membership No.: 208382
Bangalore
April 28, 2011
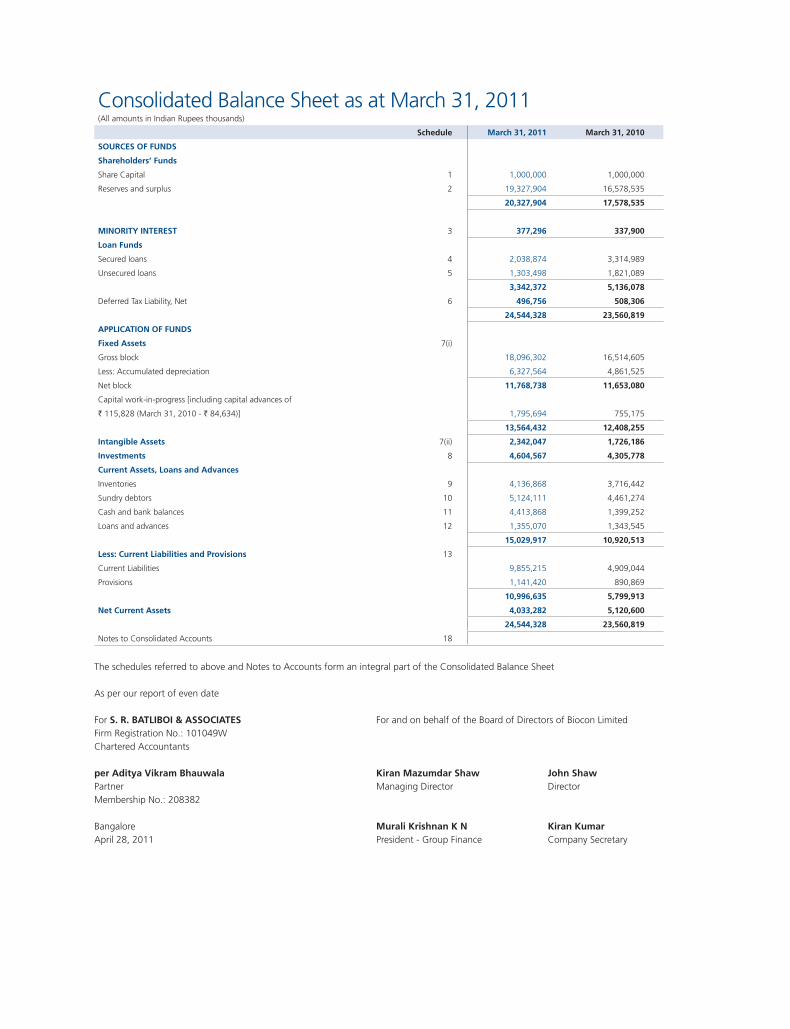
Consolidated Balance Sheet as at March 31, 2011(All amounts in Indian Rupees thousands)
Schedule March 31, 2011 March 31, 2010
SOURCES OF FUNDS
Shareholders’ Funds
Share Capital 1 1,000,000 1,000,000
Reserves and surplus 2 19,327,904 16,578,535
20,327,904 17,578,535
MINORITY INTEREST 3 377,296 337,900
Loan Funds
Secured loans 4 2,038,874 3,314,989
Unsecured loans 5 1,303,498 1,821,089
3,342,372 5,136,078
Deferred Tax Liability, Net 6 496,756 508,306
24,544,328 23,560,819
APPLICATION OF FUNDS
Fixed Assets 7(i)
Gross block 18,096,302 16,514,605
Less: Accumulated depreciation 6,327,564 4,861,525
Net block 11,768,738 11,653,080
Capital work-in-progress [including capital advances of
` 115,828 (March 31, 2010 - ` 84,634)] 1,795,694 755,175
13,564,432 12,408,255
Intangible Assets 7(ii) 2,342,047 1,726,186
Investments 8 4,604,567 4,305,778
Current Assets, Loans and Advances
Inventories 9 4,136,868 3,716,442
Sundry debtors 10 5,124,111 4,461,274
Cash and bank balances 11 4,413,868 1,399,252
Loans and advances 12 1,355,070 1,343,545
15,029,917 10,920,513
Less: Current Liabilities and Provisions 13
Current Liabilities 9,855,215 4,909,044
Provisions 1,141,420 890,869
10,996,635 5,799,913
Net Current Assets 4,033,282 5,120,600
24,544,328 23,560,819
Notes to Consolidated Accounts 18
The schedules referred to above and Notes to Accounts form an integral part of the Consolidated Balance Sheet
As per our report of even date
For S. R. BATLIBOI & ASSOCIATES For and on behalf of the Board of Directors of Biocon LimitedFirm Registration No.: 101049WChartered Accountants per Aditya Vikram Bhauwala Kiran Mazumdar Shaw John ShawPartner Managing Director DirectorMembership No.: 208382
Bangalore Murali Krishnan K N Kiran KumarApril 28, 2011 President - Group Finance Company Secretary
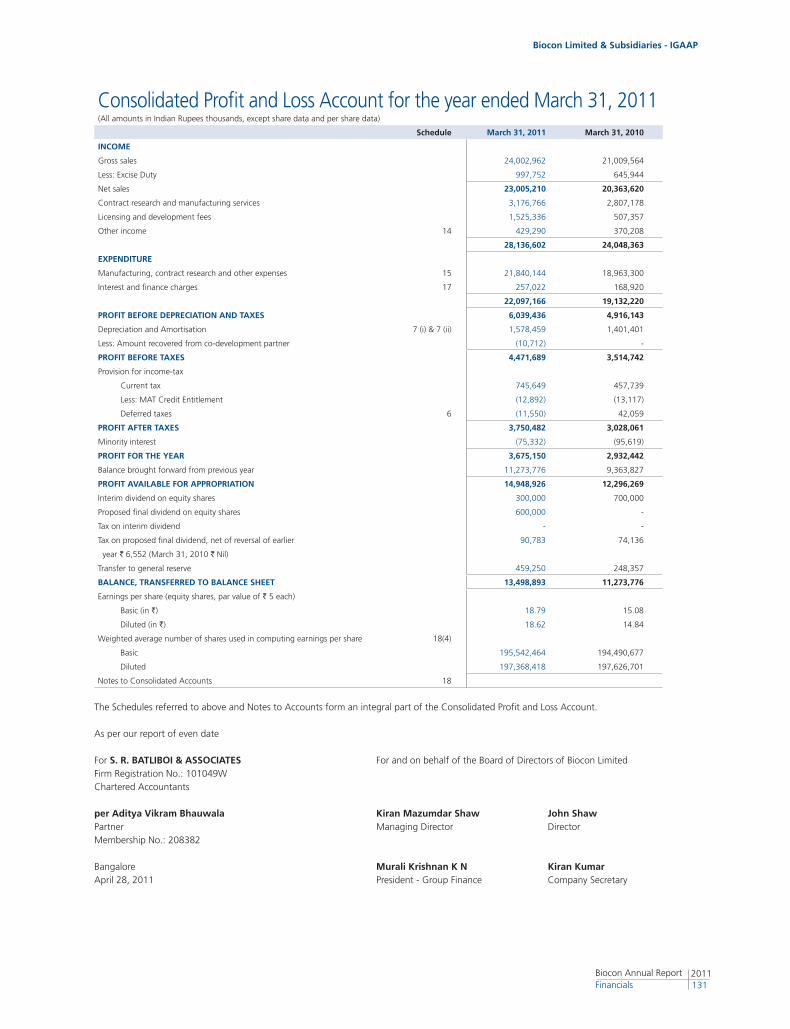
Biocon Limited & Subsidiaries - IGAAP
2011131
Biocon Annual Report Financials
The Schedules referred to above and Notes to Accounts form an integral part of the Consolidated Profit and Loss Account.
As per our report of even date
For S. R. BATLIBOI & ASSOCIATES For and on behalf of the Board of Directors of Biocon LimitedFirm Registration No.: 101049WChartered Accountants per Aditya Vikram Bhauwala Kiran Mazumdar Shaw John ShawPartner Managing Director DirectorMembership No.: 208382
Bangalore Murali Krishnan K N Kiran KumarApril 28, 2011 President - Group Finance Company Secretary
Consolidated Profit and Loss Account for the year ended March 31, 2011(All amounts in Indian Rupees thousands, except share data and per share data)
Schedule March 31, 2011 March 31, 2010
INCOME
Gross sales 24,002,962 21,009,564
Less: Excise Duty 997,752 645,944
Net sales 23,005,210 20,363,620
Contract research and manufacturing services 3,176,766 2,807,178
Licensing and development fees 1,525,336 507,357
Other income 14 429,290 370,208
28,136,602 24,048,363
EXPENDITURE
Manufacturing, contract research and other expenses 15 21,840,144 18,963,300
Interest and finance charges 17 257,022 168,920
22,097,166 19,132,220
PROFIT BEFORE DEPRECIATION AND TAXES 6,039,436 4,916,143
Depreciation and Amortisation 7 (i) & 7 (ii) 1,578,459 1,401,401
Less: Amount recovered from co-development partner (10,712) -
PROFIT BEFORE TAXES 4,471,689 3,514,742
Provision for income-tax
Current tax 745,649 457,739
Less: MAT Credit Entitlement (12,892) (13,117)
Deferred taxes 6 (11,550) 42,059
PROFIT AFTER TAXES 3,750,482 3,028,061
Minority interest (75,332) (95,619)
PROFIT FOR THE YEAR 3,675,150 2,932,442
Balance brought forward from previous year 11,273,776 9,363,827
PROFIT AVAILABLE FOR APPROPRIATION 14,948,926 12,296,269
Interim dividend on equity shares 300,000 700,000
Proposed final dividend on equity shares 600,000 -
Tax on interim dividend - -
Tax on proposed final dividend, net of reversal of earlier 90,783 74,136
year ` 6,552 (March 31, 2010 ` Nil)
Transfer to general reserve 459,250 248,357
BALANCE, TRANSFERRED TO BALANCE SHEET 13,498,893 11,273,776
Earnings per share (equity shares, par value of ` 5 each)
Basic (in `) 18.79 15.08
Diluted (in `) 18.62 14.84
Weighted average number of shares used in computing earnings per share 18(4)
Basic 195,542,464 194,490,677
Diluted 197,368,418 197,626,701
Notes to Consolidated Accounts 18

As per our report of even date
For S. R. BATLIBOI & ASSOCIATES For and on behalf of the Board of Directors of Biocon LimitedFirm Registration No.: 101049WChartered Accountants per Aditya Vikram Bhauwala Kiran Mazumdar Shaw John ShawPartner Managing Director DirectorMembership No.: 208382
Bangalore Murali Krishnan K N Kiran KumarApril 28, 2011 President - Group Finance Company Secretary
Consolidated Statement of Cash Flows for the year ended March 31, 2011(All amounts in Indian Rupees thousands)
March 31, 2011 March 31, 2010I. CASH FLOWS FROM OPERATING ACTIVITIES:
Net profit before tax 4,471,689 3,514,742Adjustments for: Depreciation and Amortisation 1,567,747 1,401,401Miscellaneous expenses (Refer Note (v) in Schedule 7 (ii)) - 82,576Clinical trial and development expenses (Refer Note (iii) in Schedule 7 (ii)) 155,245 -Unrealised exchange (gain)/loss (55,814) 6,977Employee Stock Compensation Expense 4,821 2,211Provision for bad and doubtful debts 19 16,852Bad debts written off 9,860 1,656Interest expense 239,393 157,434Interest income (10,140) (2,064)Dividend earned (178,625) (113,583)Gain on sale of investment in mutual funds (150) -(Gain)/loss on assets sold, net 7,503 43,059Operating profit before working capital changes 6,211,548 5,111,261 Movements in working capitalInventories (509,886) (626,210)Sundry debtors (703,365) (797,294)Loans and advances (42,870) (338,274)Current liabilities and provisions 3,947,174 1,416,522 Cash generated from operations 8,902,601 4,766,005 Tax paid (net of refunds) (812,972) (327,936)Net cash provided by operating activities 8,089,629 4,438,069
II. CASH FLOWS FROM INVESTING ACTIVITIES:Purchase of fixed assets, net of reimbursements from customers/co-development partners (1,891,381) (1,670,343)Acquisition of Intangible assets (508,410) (193,827)Investment in Associate - (48,100)Acquisition of minority interest (Refer Note (v) & Note (vii) in Schedule 7 (ii)) (121,552) (102,515)Interest received 10,140 2,064 Dividend received 178,625 113,583 Sale of investments 21,104,837 23,276,452 Proceeds from sale of fixed assets 5,916 17,987 Movement in reserves of ESOP trust 198,691 202,469 Issue of shares by ESOP Trust 183 317 Purchase of shares by ESOP Trust (138,104) (1,000)Purchase of investments Other Long term - (32,406) Current (21,265,555) (23,825,377)Net cash used for investing activities (2,426,610) (2,260,696)
III. CASH FLOWS FROM FINANCING ACTIVITIES :Long-term borrowings 566,465 92,898 Repayment of long-term borrowings (1,769,126) (697,738)Short-term borrowings, net (594,457) 215,633 Other unsecured Loans 57,490 399,892 Interest paid (238,131) (160,782)Dividend paid (700,000) (600,000)Dividend tax paid (67,584) (101,970)Net cash used for financing activities (2,745,343) (852,067)
IV. NET CHANGE IN CASH AND CASH EQUIVALENTS ( I + II + III) 2,917,676 1,325,306 V. FOREIGN CURRENCY TRANSLATION RESERVE 56,976 (12,376)VI. CASH AND CASH EQUIVALENTS AT THE BEGINNING OF THE YEAR 1,399,252 118,051 VII. CASH AND CASH EQUIVALENTS AT THE END OF THE YEAR (IV + V) 4,373,904 1,430,981
COMPONENTS OF CASH AND CASH EQUIVALENTS AS AT THE END OF THE YEARCash on Hand 1,789 2,173 Balances with Banks - in current accounts (excluding Unclaimed Dividend) 712,565 773,040 - in exchange earners foreign currency account 2,268,663 619,292 - in deposit accounts 1,425,575 103 - in unpaid dividend accounts* 5,276 4,644
4,413,868 1,399,252 (Gain)/Loss on exchange differences on cash and cash equivalents held in foreign currency (39,964) 31,729 CASH AND CASH EQUIVALENTS IN CASH FLOW STATEMENT 4,373,904 1,430,981
* These balances are not available for use by the Company as they represent corresponding unpaid dividend liabilities.
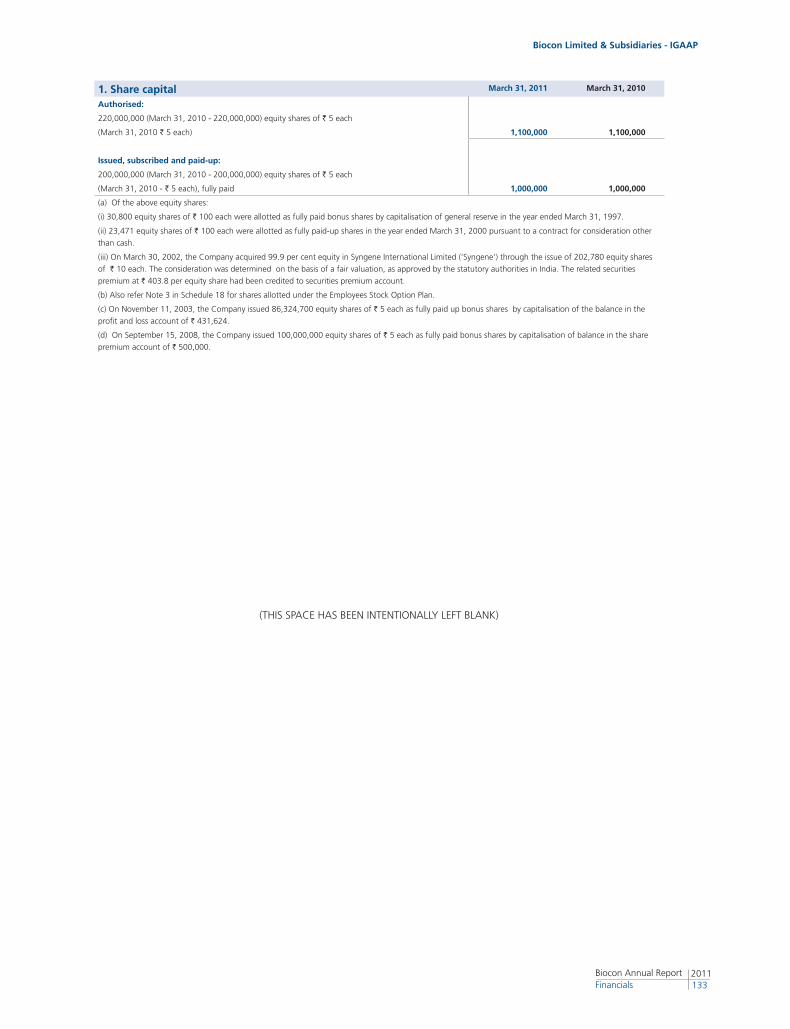
Biocon Limited & Subsidiaries - IGAAP
2011133
Biocon Annual Report Financials
(THIS SPACE HAS BEEN INTENTIONALLY LEFT BLANK)
1. Share capital March 31, 2011 March 31, 2010
Authorised:
220,000,000 (March 31, 2010 - 220,000,000) equity shares of ` 5 each
(March 31, 2010 ` 5 each) 1,100,000 1,100,000
Issued, subscribed and paid-up:
200,000,000 (March 31, 2010 - 200,000,000) equity shares of ` 5 each
(March 31, 2010 - ` 5 each), fully paid 1,000,000 1,000,000
(a) Of the above equity shares:
(i) 30,800 equity shares of ` 100 each were allotted as fully paid bonus shares by capitalisation of general reserve in the year ended March 31, 1997.
(ii) 23,471 equity shares of ` 100 each were allotted as fully paid-up shares in the year ended March 31, 2000 pursuant to a contract for consideration other
than cash.
(iii) On March 30, 2002, the Company acquired 99.9 per cent equity in Syngene International Limited (‘Syngene’) through the issue of 202,780 equity shares
of ` 10 each. The consideration was determined on the basis of a fair valuation, as approved by the statutory authorities in India. The related securities
premium at ` 403.8 per equity share had been credited to securities premium account.
(b) Also refer Note 3 in Schedule 18 for shares allotted under the Employees Stock Option Plan.
(c) On November 11, 2003, the Company issued 86,324,700 equity shares of ` 5 each as fully paid up bonus shares by capitalisation of the balance in the
profit and loss account of ` 431,624.
(d) On September 15, 2008, the Company issued 100,000,000 equity shares of ` 5 each as fully paid bonus shares by capitalisation of balance in the share
premium account of ` 500,000.
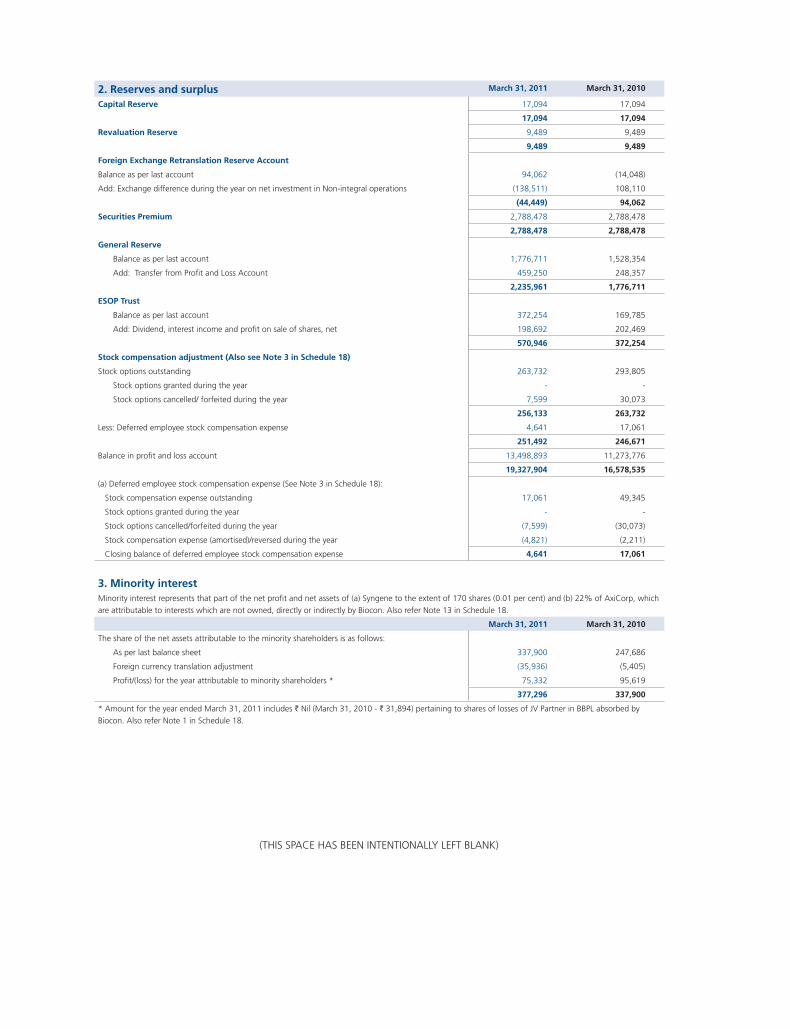
(THIS SPACE HAS BEEN INTENTIONALLY LEFT BLANK)
2. Reserves and surplus March 31, 2011 March 31, 2010
Capital Reserve 17,094 17,094
17,094 17,094
Revaluation Reserve 9,489 9,489
9,489 9,489
Foreign Exchange Retranslation Reserve Account
Balance as per last account 94,062 (14,048)
Add: Exchange difference during the year on net investment in Non-integral operations (138,511) 108,110
(44,449) 94,062
Securities Premium 2,788,478 2,788,478
2,788,478 2,788,478
General Reserve
Balance as per last account 1,776,711 1,528,354
Add: Transfer from Profit and Loss Account 459,250 248,357
2,235,961 1,776,711
ESOP Trust
Balance as per last account 372,254 169,785
Add: Dividend, interest income and profit on sale of shares, net 198,692 202,469
570,946 372,254
Stock compensation adjustment (Also see Note 3 in Schedule 18)
Stock options outstanding 263,732 293,805
Stock options granted during the year - -
Stock options cancelled/ forfeited during the year 7,599 30,073
256,133 263,732
Less: Deferred employee stock compensation expense 4,641 17,061
251,492 246,671
Balance in profit and loss account 13,498,893 11,273,776
19,327,904 16,578,535
(a) Deferred employee stock compensation expense (See Note 3 in Schedule 18):
Stock compensation expense outstanding 17,061 49,345
Stock options granted during the year - -
Stock options cancelled/forfeited during the year (7,599) (30,073)
Stock compensation expense (amortised)/reversed during the year (4,821) (2,211)
Closing balance of deferred employee stock compensation expense 4,641 17,061
3. Minority interestMinority interest represents that part of the net profit and net assets of (a) Syngene to the extent of 170 shares (0.01 per cent) and (b) 22% of AxiCorp, which
are attributable to interests which are not owned, directly or indirectly by Biocon. Also refer Note 13 in Schedule 18.
March 31, 2011 March 31, 2010
The share of the net assets attributable to the minority shareholders is as follows:
As per last balance sheet 337,900 247,686
Foreign currency translation adjustment (35,936) (5,405)
Profit/(loss) for the year attributable to minority shareholders * 75,332 95,619
377,296 337,900
* Amount for the year ended March 31, 2011 includes ` Nil (March 31, 2010 - ` 31,894) pertaining to shares of losses of JV Partner in BBPL absorbed by
Biocon. Also refer Note 1 in Schedule 18.
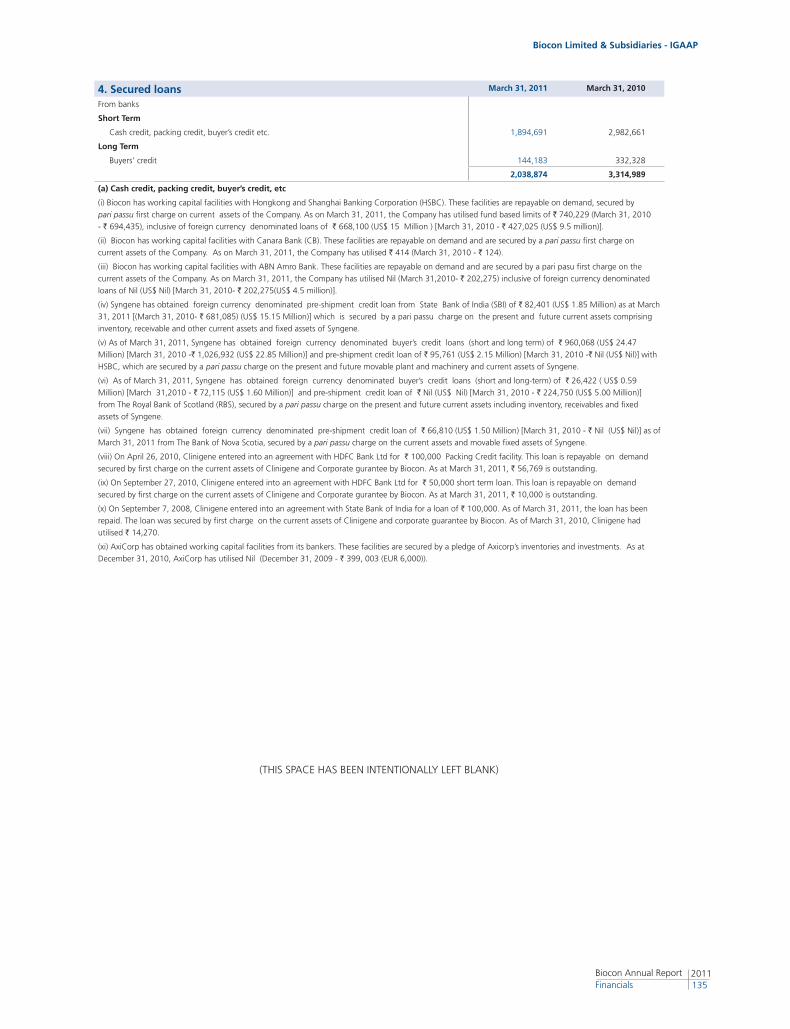
Biocon Limited & Subsidiaries - IGAAP
2011135
Biocon Annual Report Financials
(THIS SPACE HAS BEEN INTENTIONALLY LEFT BLANK)
4. Secured loans March 31, 2011 March 31, 2010
From banks
Short Term
Cash credit, packing credit, buyer’s credit etc. 1,894,691 2,982,661
Long Term
Buyers’ credit 144,183 332,328
2,038,874 3,314,989
(a) Cash credit, packing credit, buyer’s credit, etc
(i) Biocon has working capital facilities with Hongkong and Shanghai Banking Corporation (HSBC). These facilities are repayable on demand, secured by
pari passu first charge on current assets of the Company. As on March 31, 2011, the Company has utilised fund based limits of ` 740,229 (March 31, 2010
- ` 694,435), inclusive of foreign currency denominated loans of ` 668,100 (US$ 15 Million ) [March 31, 2010 - ` 427,025 (US$ 9.5 million)].
(ii) Biocon has working capital facilities with Canara Bank (CB). These facilities are repayable on demand and are secured by a pari passu first charge on
current assets of the Company. As on March 31, 2011, the Company has utilised ` 414 (March 31, 2010 - ` 124).
(iii) Biocon has working capital facilities with ABN Amro Bank. These facilities are repayable on demand and are secured by a pari pasu first charge on the
current assets of the Company. As on March 31, 2011, the Company has utilised Nil (March 31,2010- ` 202,275) inclusive of foreign currency denominated
loans of Nil (US$ Nil) [March 31, 2010- ` 202,275(US$ 4.5 million)].
(iv) Syngene has obtained foreign currency denominated pre-shipment credit loan from State Bank of India (SBI) of ` 82,401 (US$ 1.85 Million) as at March
31, 2011 [(March 31, 2010- ` 681,085) (US$ 15.15 Million)] which is secured by a pari passu charge on the present and future current assets comprising
inventory, receivable and other current assets and fixed assets of Syngene.
(v) As of March 31, 2011, Syngene has obtained foreign currency denominated buyer’s credit loans (short and long term) of ` 960,068 (US$ 24.47
Million) [March 31, 2010 -` 1,026,932 (US$ 22.85 Million)] and pre-shipment credit loan of ` 95,761 (US$ 2.15 Million) [March 31, 2010 -` Nil (US$ Nil)] with
HSBC, which are secured by a charge on the present and future movable plant and machinery and current assets of Syngene.
(vi) As of March 31, 2011, Syngene has obtained foreign currency denominated buyer’s credit loans (short and long-term) of ` 26,422 ( US$ 0.59
Million) [March 31,2010 - ` 72,115 (US$ 1.60 Million)] and pre-shipment credit loan of ` Nil (US$ Nil) [March 31, 2010 - ` 224,750 (US$ 5.00 Million)]
from The Royal Bank of Scotland (RBS), secured by a pari passu charge on the present and future current assets including inventory, receivables and fixed
assets of Syngene.
(vii) Syngene has obtained foreign currency denominated pre-shipment credit loan of ` 66,810 (US$ 1.50 Million) [March 31, 2010 - ` Nil (US$ Nil)] as of
March 31, 2011 from The Bank of Nova Scotia, secured by a pari passu charge on the current assets and movable fixed assets of Syngene.
(viii) On April 26, 2010, Clinigene entered into an agreement with HDFC Bank Ltd for ` 100,000 Packing Credit facility. This loan is repayable on demand
secured by first charge on the current assets of Clinigene and Corporate gurantee by Biocon. As at March 31, 2011, ` 56,769 is outstanding.
(ix) On September 27, 2010, Clinigene entered into an agreement with HDFC Bank Ltd for ` 50,000 short term loan. This loan is repayable on demand
secured by first charge on the current assets of Clinigene and Corporate gurantee by Biocon. As at March 31, 2011, ` 10,000 is outstanding.
(x) On September 7, 2008, Clinigene entered into an agreement with State Bank of India for a loan of ` 100,000. As of March 31, 2011, the loan has been
repaid. The loan was secured by first charge on the current assets of Clinigene and corporate guarantee by Biocon. As of March 31, 2010, Clinigene had
utilised ` 14,270.
(xi) AxiCorp has obtained working capital facilities from its bankers. These facilities are secured by a pledge of Axicorp’s inventories and investments. As at
December 31, 2010, AxiCorp has utilised Nil (December 31, 2009 - ` 399, 003 (EUR 6,000)).
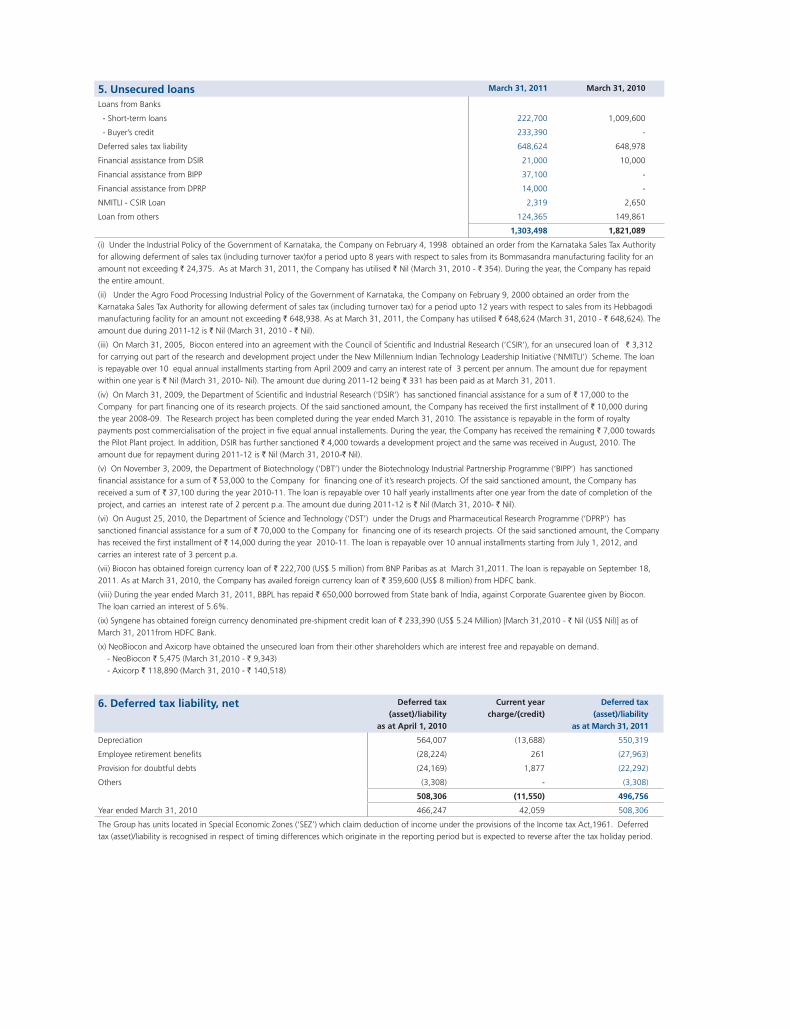
5. Unsecured loans March 31, 2011 March 31, 2010
Loans from Banks
- Short-term loans 222,700 1,009,600
- Buyer’s credit 233,390 -
Deferred sales tax liability 648,624 648,978
Financial assistance from DSIR 21,000 10,000
Financial assistance from BIPP 37,100 -
Financial assistance from DPRP 14,000 -
NMITLI - CSIR Loan 2,319 2,650
Loan from others 124,365 149,861
1,303,498 1,821,089
(i) Under the Industrial Policy of the Government of Karnataka, the Company on February 4, 1998 obtained an order from the Karnataka Sales Tax Authority
for allowing deferment of sales tax (including turnover tax)for a period upto 8 years with respect to sales from its Bommasandra manufacturing facility for an
amount not exceeding ` 24,375. As at March 31, 2011, the Company has utilised ` Nil (March 31, 2010 - ` 354). During the year, the Company has repaid
the entire amount.
(ii) Under the Agro Food Processing Industrial Policy of the Government of Karnataka, the Company on February 9, 2000 obtained an order from the
Karnataka Sales Tax Authority for allowing deferment of sales tax (including turnover tax) for a period upto 12 years with respect to sales from its Hebbagodi
manufacturing facility for an amount not exceeding ` 648,938. As at March 31, 2011, the Company has utilised ` 648,624 (March 31, 2010 - ` 648,624). The
amount due during 2011-12 is ` Nil (March 31, 2010 - ` Nil).
(iii) On March 31, 2005, Biocon entered into an agreement with the Council of Scientific and Industrial Research (‘CSIR’), for an unsecured loan of ` 3,312
for carrying out part of the research and development project under the New Millennium Indian Technology Leadership Initiative (‘NMITLI’) Scheme. The loan
is repayable over 10 equal annual installments starting from April 2009 and carry an interest rate of 3 percent per annum. The amount due for repayment
within one year is ` Nil (March 31, 2010- Nil). The amount due during 2011-12 being ` 331 has been paid as at March 31, 2011.
(iv) On March 31, 2009, the Department of Scientific and Industrial Research (‘DSIR’) has sanctioned financial assistance for a sum of ` 17,000 to the
Company for part financing one of its research projects. Of the said sanctioned amount, the Company has received the first installment of ` 10,000 during
the year 2008-09. The Research project has been completed during the year ended March 31, 2010. The assistance is repayable in the form of royalty
payments post commercialisation of the project in five equal annual installements. During the year, the Company has received the remaining ` 7,000 towards
the Pilot Plant project. In addition, DSIR has further sanctioned ` 4,000 towards a development project and the same was received in August, 2010. The
amount due for repayment during 2011-12 is ` Nil (March 31, 2010-` Nil).
(v) On November 3, 2009, the Department of Biotechnology (‘DBT’) under the Biotechnology Industrial Partnership Programme (‘BIPP’) has sanctioned
financial assistance for a sum of ` 53,000 to the Company for financing one of it’s research projects. Of the said sanctioned amount, the Company has
received a sum of ` 37,100 during the year 2010-11. The loan is repayable over 10 half yearly installments after one year from the date of completion of the
project, and carries an interest rate of 2 percent p.a. The amount due during 2011-12 is ` Nil (March 31, 2010- ` Nil).
(vi) On August 25, 2010, the Department of Science and Technology (‘DST’) under the Drugs and Pharmaceutical Research Programme (‘DPRP’) has
sanctioned financial assistance for a sum of ` 70,000 to the Company for financing one of its research projects. Of the said sanctioned amount, the Company
has received the first installment of ` 14,000 during the year 2010-11. The loan is repayable over 10 annual installments starting from July 1, 2012, and
carries an interest rate of 3 percent p.a.
(vii) Biocon has obtained foreign currency loan of ` 222,700 (US$ 5 million) from BNP Paribas as at March 31,2011. The loan is repayable on September 18,
2011. As at March 31, 2010, the Company has availed foreign currency loan of ` 359,600 (US$ 8 million) from HDFC bank.
(viii) During the year ended March 31, 2011, BBPL has repaid ` 650,000 borrowed from State bank of India, against Corporate Guarentee given by Biocon.
The loan carried an interest of 5.6%.
(ix) Syngene has obtained foreign currency denominated pre-shipment credit loan of ` 233,390 (US$ 5.24 Million) [March 31,2010 - ` Nil (US$ Nil)] as of
March 31, 2011from HDFC Bank.
(x) NeoBiocon and Axicorp have obtained the unsecured loan from their other shareholders which are interest free and repayable on demand.
- NeoBiocon ` 5,475 (March 31,2010 - ` 9,343)
- Axicorp ` 118,890 (March 31, 2010 - ` 140,518)
6. Deferred tax liability, net Deferred tax (asset)/liability
as at April 1, 2010
Current yearcharge/(credit)
Deferred tax (asset)/liability
as at March 31, 2011
Depreciation 564,007 (13,688) 550,319
Employee retirement benefits (28,224) 261 (27,963)
Provision for doubtful debts (24,169) 1,877 (22,292)
Others (3,308) - (3,308)
508,306 (11,550) 496,756
Year ended March 31, 2010 466,247 42,059 508,306
The Group has units located in Special Economic Zones (‘SEZ’) which claim deduction of income under the provisions of the Income tax Act,1961. Deferred
tax (asset)/liability is recognised in respect of timing differences which originate in the reporting period but is expected to reverse after the tax holiday period.
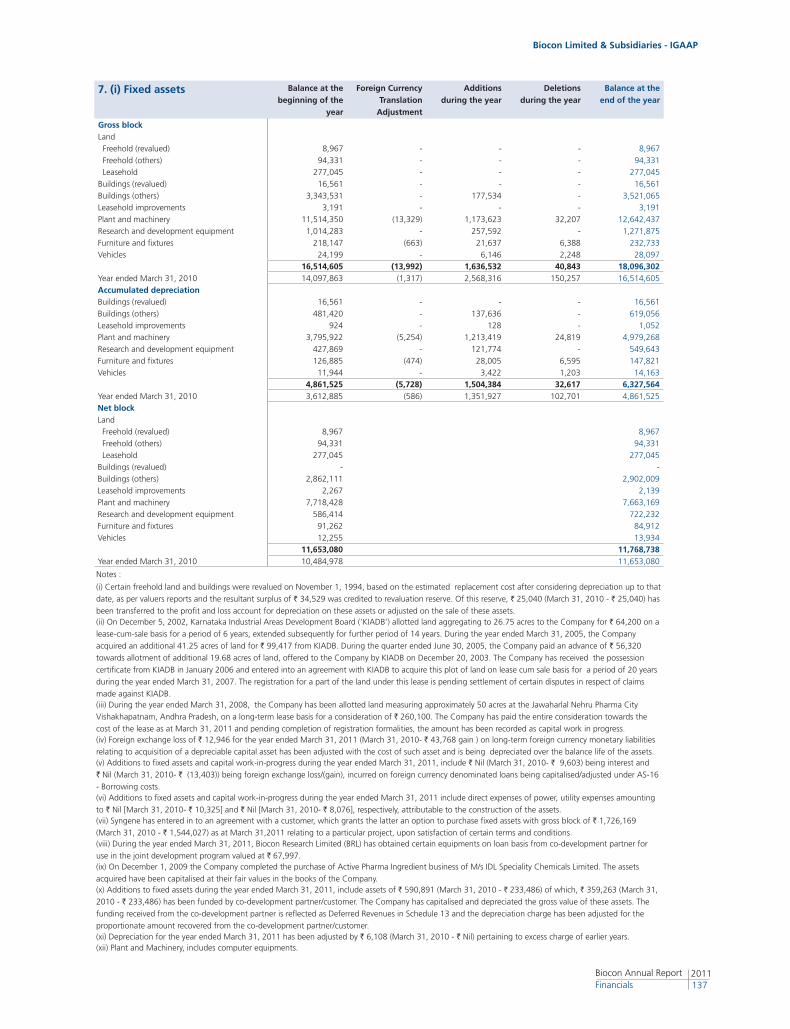
Biocon Limited & Subsidiaries - IGAAP
2011137
Biocon Annual Report Financials
7. (i) Fixed assets Balance at thebeginning of the
year
Foreign Currency Translation
Adjustment
Additionsduring the year
Deletionsduring the year
Balance at the end of the year
Gross blockLand
Freehold (revalued) 8,967 - - - 8,967
Freehold (others) 94,331 - - - 94,331
Leasehold 277,045 - - - 277,045
Buildings (revalued) 16,561 - - - 16,561
Buildings (others) 3,343,531 - 177,534 - 3,521,065
Leasehold improvements 3,191 - - - 3,191
Plant and machinery 11,514,350 (13,329) 1,173,623 32,207 12,642,437
Research and development equipment 1,014,283 - 257,592 - 1,271,875
Furniture and fixtures 218,147 (663) 21,637 6,388 232,733
Vehicles 24,199 - 6,146 2,248 28,097
16,514,605 (13,992) 1,636,532 40,843 18,096,302 Year ended March 31, 2010 14,097,863 (1,317) 2,568,316 150,257 16,514,605
Accumulated depreciationBuildings (revalued) 16,561 - - - 16,561
Buildings (others) 481,420 - 137,636 - 619,056
Leasehold improvements 924 - 128 - 1,052
Plant and machinery 3,795,922 (5,254) 1,213,419 24,819 4,979,268
Research and development equipment 427,869 - 121,774 - 549,643
Furniture and fixtures 126,885 (474) 28,005 6,595 147,821
Vehicles 11,944 - 3,422 1,203 14,163
4,861,525 (5,728) 1,504,384 32,617 6,327,564 Year ended March 31, 2010 3,612,885 (586) 1,351,927 102,701 4,861,525
Net blockLand
Freehold (revalued) 8,967 8,967
Freehold (others) 94,331 94,331
Leasehold 277,045 277,045
Buildings (revalued) - -
Buildings (others) 2,862,111 2,902,009
Leasehold improvements 2,267 2,139
Plant and machinery 7,718,428 7,663,169
Research and development equipment 586,414 722,232
Furniture and fixtures 91,262 84,912
Vehicles 12,255 13,934
11,653,080 11,768,738 Year ended March 31, 2010 10,484,978 11,653,080
Notes :
(i) Certain freehold land and buildings were revalued on November 1, 1994, based on the estimated replacement cost after considering depreciation up to that
date, as per valuers reports and the resultant surplus of ` 34,529 was credited to revaluation reserve. Of this reserve, ` 25,040 (March 31, 2010 - ` 25,040) has
been transferred to the profit and loss account for depreciation on these assets or adjusted on the sale of these assets.(ii) On December 5, 2002, Karnataka Industrial Areas Development Board (‘KIADB’) allotted land aggregating to 26.75 acres to the Company for ` 64,200 on a
lease-cum-sale basis for a period of 6 years, extended subsequently for further period of 14 years. During the year ended March 31, 2005, the Company
acquired an additional 41.25 acres of land for ` 99,417 from KIADB. During the quarter ended June 30, 2005, the Company paid an advance of ` 56,320
towards allotment of additional 19.68 acres of land, offered to the Company by KIADB on December 20, 2003. The Company has received the possession
certificate from KIADB in January 2006 and entered into an agreement with KIADB to acquire this plot of land on lease cum sale basis for a period of 20 years
during the year ended March 31, 2007. The registration for a part of the land under this lease is pending settlement of certain disputes in respect of claims
made against KIADB.(iii) During the year ended March 31, 2008, the Company has been allotted land measuring approximately 50 acres at the Jawaharlal Nehru Pharma City
Vishakhapatnam, Andhra Pradesh, on a long-term lease basis for a consideration of ` 260,100. The Company has paid the entire consideration towards the
cost of the lease as at March 31, 2011 and pending completion of registration formalities, the amount has been recorded as capital work in progress.(iv) Foreign exchange loss of ` 12,946 for the year ended March 31, 2011 (March 31, 2010- ` 43,768 gain ) on long-term foreign currency monetary liabilities
relating to acquisition of a depreciable capital asset has been adjusted with the cost of such asset and is being depreciated over the balance life of the assets. (v) Additions to fixed assets and capital work-in-progress during the year ended March 31, 2011, include ` Nil (March 31, 2010- ` 9,603) being interest and
` Nil (March 31, 2010- ` (13,403)) being foreign exchange loss/(gain), incurred on foreign currency denominated loans being capitalised/adjusted under AS-16
- Borrowing costs.(vi) Additions to fixed assets and capital work-in-progress during the year ended March 31, 2011 include direct expenses of power, utility expenses amounting
to ` Nil [March 31, 2010- ` 10,325] and ` Nil [March 31, 2010- ` 8,076], respectively, attributable to the construction of the assets.(vii) Syngene has entered in to an agreement with a customer, which grants the latter an option to purchase fixed assets with gross block of ` 1,726,169
(March 31, 2010 - ` 1,544,027) as at March 31,2011 relating to a particular project, upon satisfaction of certain terms and conditions. (viii) During the year ended March 31, 2011, Biocon Research Limited (BRL) has obtained certain equipments on loan basis from co-development partner for
use in the joint development program valued at ` 67,997.(ix) On December 1, 2009 the Company completed the purchase of Active Pharma Ingredient business of M/s IDL Speciality Chemicals Limited. The assets
acquired have been capitalised at their fair values in the books of the Company. (x) Additions to fixed assets during the year ended March 31, 2011, include assets of ` 590,891 (March 31, 2010 - ` 233,486) of which, ` 359,263 (March 31,
2010 - ` 233,486) has been funded by co-development partner/customer. The Company has capitalised and depreciated the gross value of these assets. The
funding received from the co-development partner is reflected as Deferred Revenues in Schedule 13 and the depreciation charge has been adjusted for the
proportionate amount recovered from the co-development partner/customer.(xi) Depreciation for the year ended March 31, 2011 has been adjusted by ` 6,108 (March 31, 2010 - ` Nil) pertaining to excess charge of earlier years.(xii) Plant and Machinery, includes computer equipments.
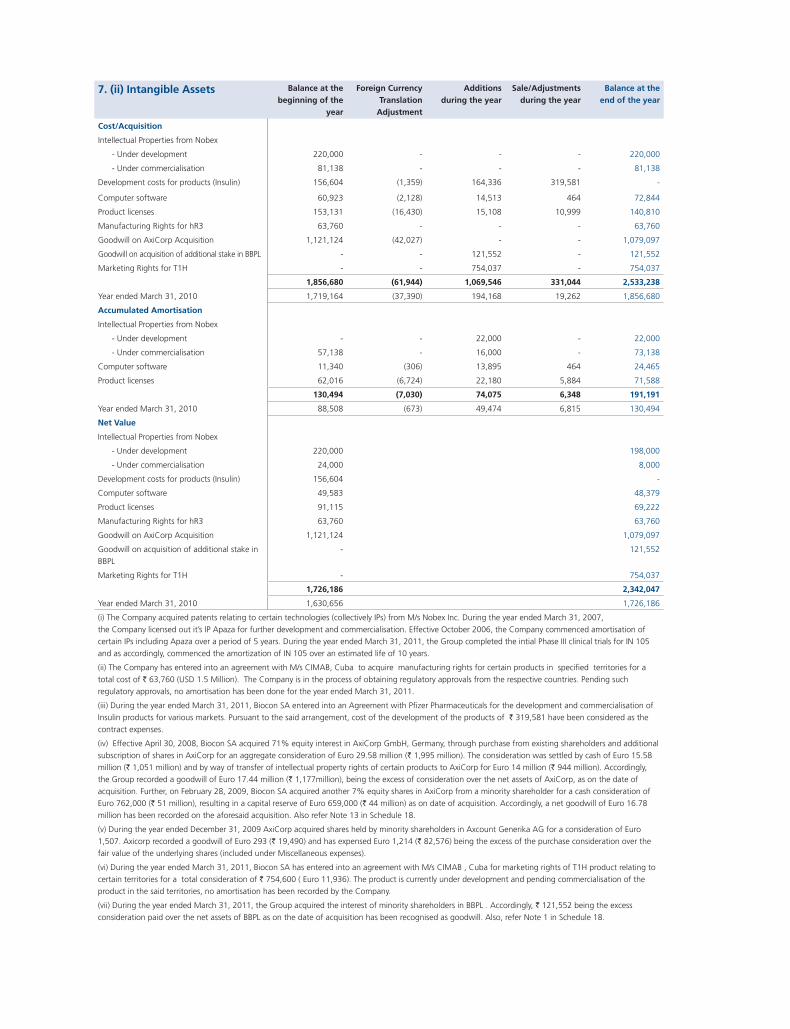
7. (ii) Intangible Assets Balance at thebeginning of the
year
Foreign Currency Translation
Adjustment
Additionsduring the year
Sale/Adjustmentsduring the year
Balance at the end of the year
Cost/Acquisition
Intellectual Properties from Nobex
- Under development 220,000 - - - 220,000
- Under commercialisation 81,138 - - - 81,138
Development costs for products (Insulin) 156,604 (1,359) 164,336 319,581 -
Computer software 60,923 (2,128) 14,513 464 72,844
Product licenses 153,131 (16,430) 15,108 10,999 140,810
Manufacturing Rights for hR3 63,760 - - - 63,760
Goodwill on AxiCorp Acquisition 1,121,124 (42,027) - - 1,079,097
Goodwill on acquisition of additional stake in BBPL - - 121,552 - 121,552
Marketing Rights for T1H - - 754,037 - 754,037
1,856,680 (61,944) 1,069,546 331,044 2,533,238
Year ended March 31, 2010 1,719,164 (37,390) 194,168 19,262 1,856,680
Accumulated Amortisation
Intellectual Properties from Nobex
- Under development - - 22,000 - 22,000
- Under commercialisation 57,138 - 16,000 - 73,138
Computer software 11,340 (306) 13,895 464 24,465
Product licenses 62,016 (6,724) 22,180 5,884 71,588
130,494 (7,030) 74,075 6,348 191,191
Year ended March 31, 2010 88,508 (673) 49,474 6,815 130,494
Net Value
Intellectual Properties from Nobex
- Under development 220,000 198,000
- Under commercialisation 24,000 8,000
Development costs for products (Insulin) 156,604 -
Computer software 49,583 48,379
Product licenses 91,115 69,222
Manufacturing Rights for hR3 63,760 63,760
Goodwill on AxiCorp Acquisition 1,121,124 1,079,097
Goodwill on acquisition of additional stake in
BBPL
- 121,552
Marketing Rights for T1H - 754,037
1,726,186 2,342,047
Year ended March 31, 2010 1,630,656 1,726,186
(i) The Company acquired patents relating to certain technologies (collectively IPs) from M/s Nobex Inc. During the year ended March 31, 2007,
the Company licensed out it’s IP Apaza for further development and commercialisation. Effective October 2006, the Company commenced amortisation of
certain IPs including Apaza over a period of 5 years. During the year ended March 31, 2011, the Group completed the intial Phase III clinical trials for IN 105
and as accordingly, commenced the amortization of IN 105 over an estimated life of 10 years.
(ii) The Company has entered into an agreement with M/s CIMAB, Cuba to acquire manufacturing rights for certain products in specified territories for a
total cost of ` 63,760 (USD 1.5 Million). The Company is in the process of obtaining regulatory approvals from the respective countries. Pending such
regulatory approvals, no amortisation has been done for the year ended March 31, 2011.
(iii) During the year ended March 31, 2011, Biocon SA entered into an Agreement with Pfizer Pharmaceuticals for the development and commercialisation of
Insulin products for various markets. Pursuant to the said arrangement, cost of the development of the products of ` 319,581 have been considered as the
contract expenses.
(iv) Effective April 30, 2008, Biocon SA acquired 71% equity interest in AxiCorp GmbH, Germany, through purchase from existing shareholders and additional
subscription of shares in AxiCorp for an aggregate consideration of Euro 29.58 million (` 1,995 million). The consideration was settled by cash of Euro 15.58
million (` 1,051 million) and by way of transfer of intellectual property rights of certain products to AxiCorp for Euro 14 million (` 944 million). Accordingly,
the Group recorded a goodwill of Euro 17.44 million (` 1,177million), being the excess of consideration over the net assets of AxiCorp, as on the date of
acquisition. Further, on February 28, 2009, Biocon SA acquired another 7% equity shares in AxiCorp from a minority shareholder for a cash consideration of
Euro 762,000 (` 51 million), resulting in a capital reserve of Euro 659,000 (` 44 million) as on date of acquisition. Accordingly, a net goodwill of Euro 16.78
million has been recorded on the aforesaid acquisition. Also refer Note 13 in Schedule 18.
(v) During the year ended December 31, 2009 AxiCorp acquired shares held by minority shareholders in Axcount Generika AG for a consideration of Euro
1,507. Axicorp recorded a goodwill of Euro 293 (` 19,490) and has expensed Euro 1,214 (` 82,576) being the excess of the purchase consideration over the
fair value of the underlying shares (included under Miscellaneous expenses).
(vi) During the year ended March 31, 2011, Biocon SA has entered into an agreement with M/s CIMAB , Cuba for marketing rights of T1H product relating to
certain territories for a total consideration of ` 754,600 ( Euro 11,936). The product is currently under development and pending commercialisation of the
product in the said territories, no amortisation has been recorded by the Company.
(vii) During the year ended March 31, 2011, the Group acquired the interest of minority shareholders in BBPL . Accordingly, ` 121,552 being the excess
consideration paid over the net assets of BBPL as on the date of acquisition has been recognised as goodwill. Also, refer Note 1 in Schedule 18.
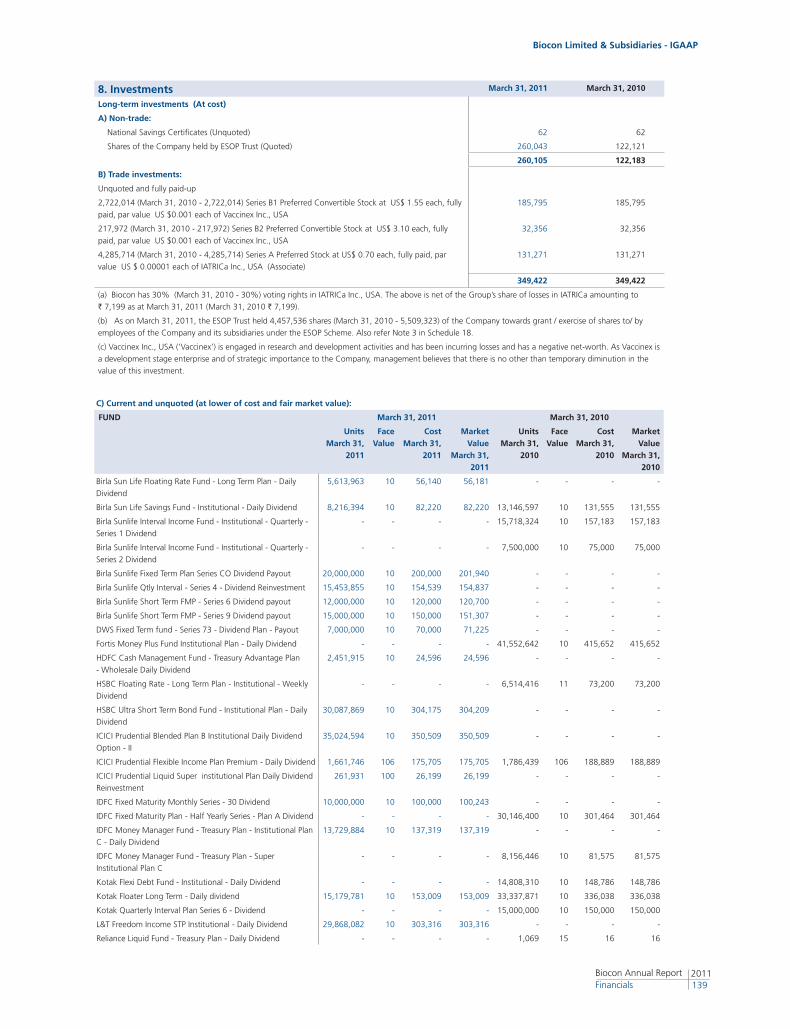
Biocon Limited & Subsidiaries - IGAAP
2011139
Biocon Annual Report Financials
8. Investments March 31, 2011 March 31, 2010
Long-term investments (At cost)
A) Non-trade:
National Savings Certificates (Unquoted) 62 62
Shares of the Company held by ESOP Trust (Quoted) 260,043 122,121
260,105 122,183
B) Trade investments:
Unquoted and fully paid-up
2,722,014 (March 31, 2010 - 2,722,014) Series B1 Preferred Convertible Stock at US$ 1.55 each, fully
paid, par value US $0.001 each of Vaccinex Inc., USA
185,795 185,795
217,972 (March 31, 2010 - 217,972) Series B2 Preferred Convertible Stock at US$ 3.10 each, fully
paid, par value US $0.001 each of Vaccinex Inc., USA
32,356 32,356
4,285,714 (March 31, 2010 - 4,285,714) Series A Preferred Stock at US$ 0.70 each, fully paid, par
value US $ 0.00001 each of IATRICa Inc., USA (Associate)
131,271 131,271
349,422 349,422
(a) Biocon has 30% (March 31, 2010 - 30%) voting rights in IATRICa Inc., USA. The above is net of the Group’s share of losses in IATRICa amounting to
` 7,199 as at March 31, 2011 (March 31, 2010 ` 7,199).
(b) As on March 31, 2011, the ESOP Trust held 4,457,536 shares (March 31, 2010 - 5,509,323) of the Company towards grant / exercise of shares to/ by
employees of the Company and its subsidiaries under the ESOP Scheme. Also refer Note 3 in Schedule 18.
(c) Vaccinex Inc., USA (‘Vaccinex’) is engaged in research and development activities and has been incurring losses and has a negative net-worth. As Vaccinex is
a development stage enterprise and of strategic importance to the Company, management believes that there is no other than temporary diminution in the
value of this investment.
C) Current and unquoted (at lower of cost and fair market value):
FUND March 31, 2011 March 31, 2010
Units March 31,
2011
Face Value
Cost March 31,
2011
Market Value
March 31, 2011
Units March 31,
2010
Face Value
Cost March 31,
2010
Market Value
March 31, 2010
Birla Sun Life Floating Rate Fund - Long Term Plan - Daily
Dividend
5,613,963 10 56,140 56,181 - - - -
Birla Sun Life Savings Fund - Institutional - Daily Dividend 8,216,394 10 82,220 82,220 13,146,597 10 131,555 131,555
Birla Sunlife Interval Income Fund - Institutional - Quarterly -
Series 1 Dividend
- - - - 15,718,324 10 157,183 157,183
Birla Sunlife Interval Income Fund - Institutional - Quarterly -
Series 2 Dividend
- - - - 7,500,000 10 75,000 75,000
Birla Sunlife Fixed Term Plan Series CO Dividend Payout 20,000,000 10 200,000 201,940 - - - -
Birla Sunlife Qtly Interval - Series 4 - Dividend Reinvestment 15,453,855 10 154,539 154,837 - - - -
Birla Sunlife Short Term FMP - Series 6 Dividend payout 12,000,000 10 120,000 120,700 - - - -
Birla Sunlife Short Term FMP - Series 9 Dividend payout 15,000,000 10 150,000 151,307 - - - -
DWS Fixed Term fund - Series 73 - Dividend Plan - Payout 7,000,000 10 70,000 71,225 - - - -
Fortis Money Plus Fund Institutional Plan - Daily Dividend - - - - 41,552,642 10 415,652 415,652
HDFC Cash Management Fund - Treasury Advantage Plan
- Wholesale Daily Dividend
2,451,915 10 24,596 24,596 - - - -
HSBC Floating Rate - Long Term Plan - Institutional - Weekly
Dividend
- - - - 6,514,416 11 73,200 73,200
HSBC Ultra Short Term Bond Fund - Institutional Plan - Daily
Dividend
30,087,869 10 304,175 304,209 - - - -
ICICI Prudential Blended Plan B Institutional Daily Dividend
Option - II
35,024,594 10 350,509 350,509 - - - -
ICICI Prudential Flexible Income Plan Premium - Daily Dividend 1,661,746 106 175,705 175,705 1,786,439 106 188,889 188,889
ICICI Prudential Liquid Super institutional Plan Daily Dividend
Reinvestment
261,931 100 26,199 26,199 - - - -
IDFC Fixed Maturity Monthly Series - 30 Dividend 10,000,000 10 100,000 100,243 - - - -
IDFC Fixed Maturity Plan - Half Yearly Series - Plan A Dividend - - - - 30,146,400 10 301,464 301,464
IDFC Money Manager Fund - Treasury Plan - Institutional Plan
C - Daily Dividend
13,729,884 10 137,319 137,319 - - - -
IDFC Money Manager Fund - Treasury Plan - Super
Institutional Plan C
- - - - 8,156,446 10 81,575 81,575
Kotak Flexi Debt Fund - Institutional - Daily Dividend - - - - 14,808,310 10 148,786 148,786
Kotak Floater Long Term - Daily dividend 15,179,781 10 153,009 153,009 33,337,871 10 336,038 336,038
Kotak Quarterly Interval Plan Series 6 - Dividend - - - - 15,000,000 10 150,000 150,000
L&T Freedom Income STP Institutional - Daily Dividend 29,868,082 10 303,316 303,316 - - - -
Reliance Liquid Fund - Treasury Plan - Daily Dividend - - - - 1,069 15 16 16
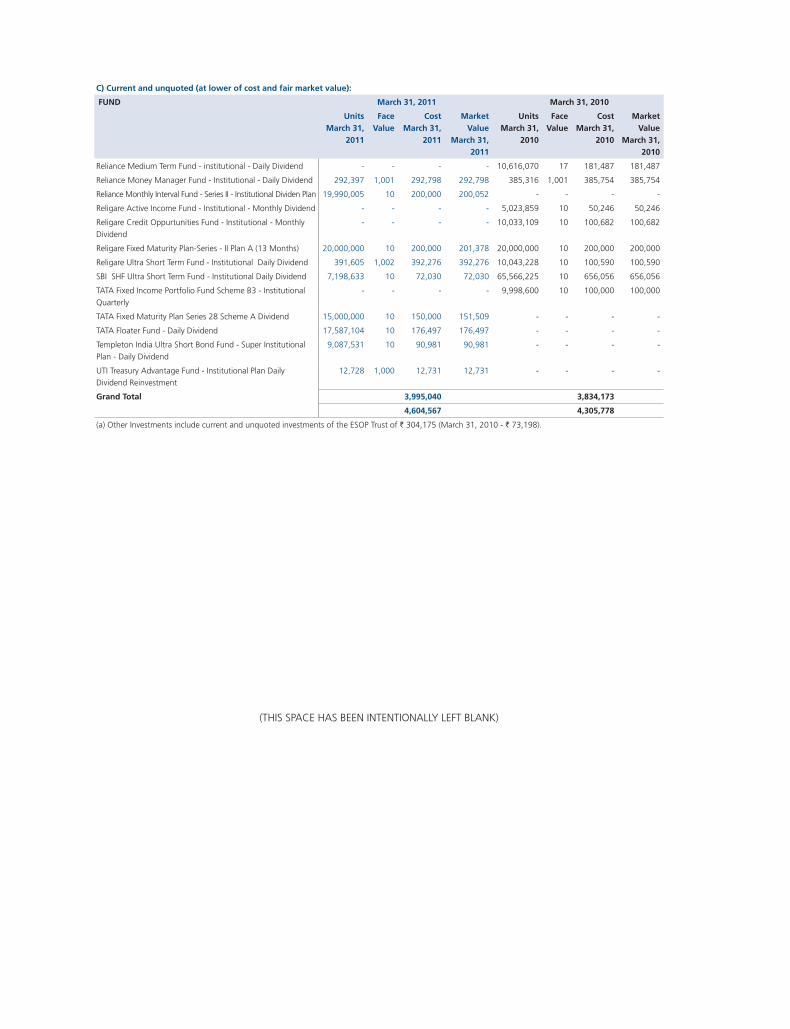
C) Current and unquoted (at lower of cost and fair market value):
FUND March 31, 2011 March 31, 2010
Units March 31,
2011
Face Value
Cost March 31,
2011
Market Value
March 31, 2011
Units March 31,
2010
Face Value
Cost March 31,
2010
Market Value
March 31, 2010
Reliance Medium Term Fund - institutional - Daily Dividend - - - - 10,616,070 17 181,487 181,487
Reliance Money Manager Fund - Institutional - Daily Dividend 292,397 1,001 292,798 292,798 385,316 1,001 385,754 385,754
Reliance Monthly Interval Fund - Series II - Institutional Dividen Plan 19,990,005 10 200,000 200,052 - - - -
Religare Active Income Fund - Institutional - Monthly Dividend - - - - 5,023,859 10 50,246 50,246
Religare Credit Oppurtunities Fund - Institutional - Monthly
Dividend
- - - - 10,033,109 10 100,682 100,682
Religare Fixed Maturity Plan-Series - II Plan A (13 Months) 20,000,000 10 200,000 201,378 20,000,000 10 200,000 200,000
Religare Ultra Short Term Fund - Institutional Daily Dividend 391,605 1,002 392,276 392,276 10,043,228 10 100,590 100,590
SBI SHF Ultra Short Term Fund - Institutional Daily Dividend 7,198,633 10 72,030 72,030 65,566,225 10 656,056 656,056
TATA Fixed Income Portfolio Fund Scheme B3 - Institutional
Quarterly
- - - - 9,998,600 10 100,000 100,000
TATA Fixed Maturity Plan Series 28 Scheme A Dividend 15,000,000 10 150,000 151,509 - - - -
TATA Floater Fund - Daily Dividend 17,587,104 10 176,497 176,497 - - - -
Templeton India Ultra Short Bond Fund - Super Institutional
Plan - Daily Dividend
9,087,531 10 90,981 90,981 - - - -
UTI Treasury Advantage Fund - Institutional Plan Daily
Dividend Reinvestment
12,728 1,000 12,731 12,731 - - - -
Grand Total 3,995,040 3,834,173
4,604,567 4,305,778
(a) Other Investments include current and unquoted investments of the ESOP Trust of ` 304,175 (March 31, 2010 - ` 73,198).
(THIS SPACE HAS BEEN INTENTIONALLY LEFT BLANK)
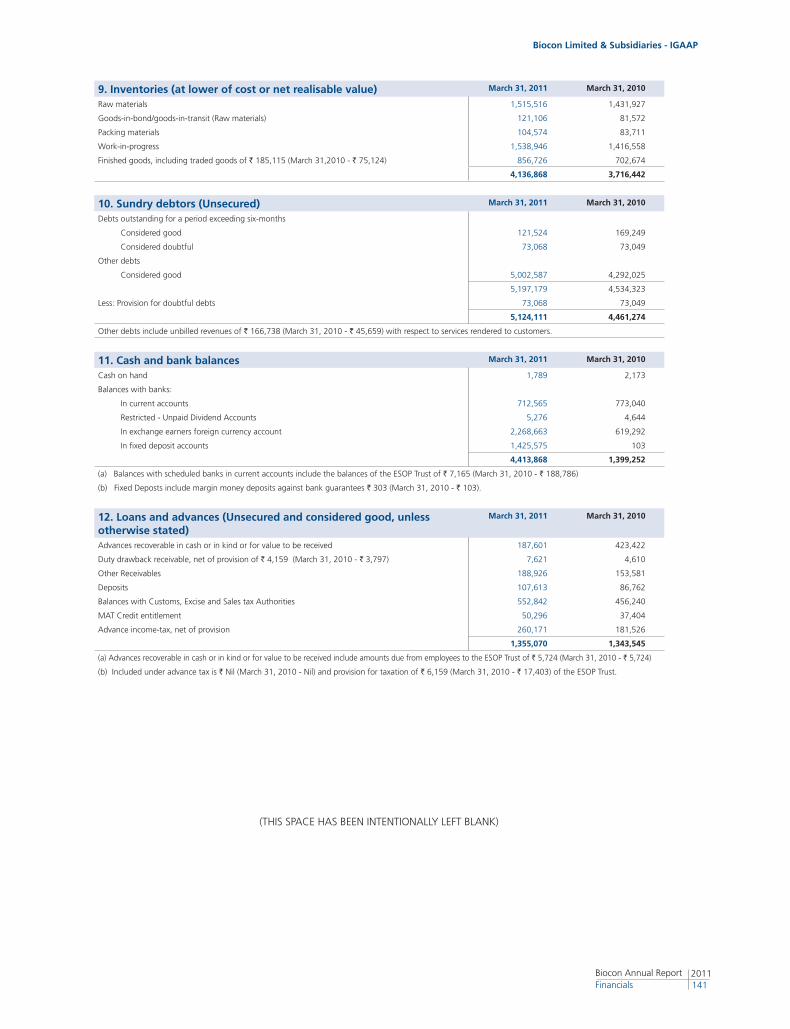
Biocon Limited & Subsidiaries - IGAAP
2011141
Biocon Annual Report Financials
(THIS SPACE HAS BEEN INTENTIONALLY LEFT BLANK)
9. Inventories (at lower of cost or net realisable value) March 31, 2011 March 31, 2010
Raw materials 1,515,516 1,431,927
Goods-in-bond/goods-in-transit (Raw materials) 121,106 81,572
Packing materials 104,574 83,711
Work-in-progress 1,538,946 1,416,558
Finished goods, including traded goods of ` 185,115 (March 31,2010 - ` 75,124) 856,726 702,674
4,136,868 3,716,442
10. Sundry debtors (Unsecured) March 31, 2011 March 31, 2010
Debts outstanding for a period exceeding six-months
Considered good 121,524 169,249
Considered doubtful 73,068 73,049
Other debts
Considered good 5,002,587 4,292,025
5,197,179 4,534,323
Less: Provision for doubtful debts 73,068 73,049
5,124,111 4,461,274
Other debts include unbilled revenues of ` 166,738 (March 31, 2010 - ` 45,659) with respect to services rendered to customers.
11. Cash and bank balances March 31, 2011 March 31, 2010
Cash on hand 1,789 2,173
Balances with banks:
In current accounts 712,565 773,040
Restricted - Unpaid Dividend Accounts 5,276 4,644
In exchange earners foreign currency account 2,268,663 619,292
In fixed deposit accounts 1,425,575 103
4,413,868 1,399,252
(a) Balances with scheduled banks in current accounts include the balances of the ESOP Trust of ` 7,165 (March 31, 2010 - ` 188,786)
(b) Fixed Deposts include margin money deposits against bank guarantees ` 303 (March 31, 2010 - ` 103).
12. Loans and advances (Unsecured and considered good, unless otherwise stated)
March 31, 2011 March 31, 2010
Advances recoverable in cash or in kind or for value to be received 187,601 423,422
Duty drawback receivable, net of provision of ` 4,159 (March 31, 2010 - ` 3,797) 7,621 4,610
Other Receivables 188,926 153,581
Deposits 107,613 86,762
Balances with Customs, Excise and Sales tax Authorities 552,842 456,240
MAT Credit entitlement 50,296 37,404
Advance income-tax, net of provision 260,171 181,526
1,355,070 1,343,545
(a) Advances recoverable in cash or in kind or for value to be received include amounts due from employees to the ESOP Trust of ` 5,724 (March 31, 2010 - ` 5,724)
(b) Included under advance tax is ` Nil (March 31, 2010 - Nil) and provision for taxation of ` 6,159 (March 31, 2010 - ` 17,403) of the ESOP Trust.
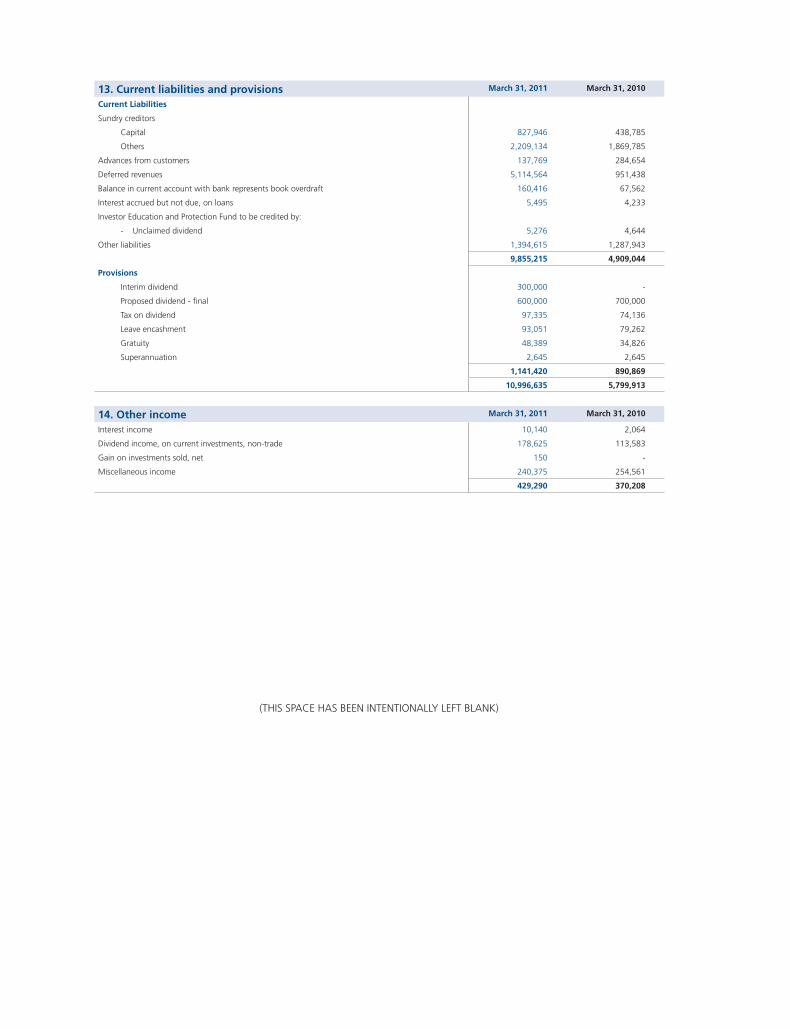
(THIS SPACE HAS BEEN INTENTIONALLY LEFT BLANK)
13. Current liabilities and provisions March 31, 2011 March 31, 2010
Current Liabilities
Sundry creditors
Capital 827,946 438,785
Others 2,209,134 1,869,785
Advances from customers 137,769 284,654
Deferred revenues 5,114,564 951,438
Balance in current account with bank represents book overdraft 160,416 67,562
Interest accrued but not due, on loans 5,495 4,233
Investor Education and Protection Fund to be credited by:
- Unclaimed dividend 5,276 4,644
Other liabilities 1,394,615 1,287,943
9,855,215 4,909,044
Provisions
Interim dividend 300,000 -
Proposed dividend - final 600,000 700,000
Tax on dividend 97,335 74,136
Leave encashment 93,051 79,262
Gratuity 48,389 34,826
Superannuation 2,645 2,645
1,141,420 890,869
10,996,635 5,799,913
14. Other income March 31, 2011 March 31, 2010
Interest income 10,140 2,064
Dividend income, on current investments, non-trade 178,625 113,583
Gain on investments sold, net 150 -
Miscellaneous income 240,375 254,561
429,290 370,208

Biocon Limited & Subsidiaries - IGAAP
2011143
Biocon Annual Report Financials
15. Manufacturing, contract research and other expenses March 31, 2011 March 31, 2010
Raw materials and packing material consumed, net of duty drawback of ` 8,478 15,121,513 13,560,571
(March 31, 2010 - ` 2,529)
Sub-Contracting and Outsourcing Expenses 96,768 83,029
Purchase of goods for resale 381,527 186,748
Employee costs
Salaries, wages and bonus 2,671,254 2,105,859
Group’s contribution to provident and other fund 206,780 157,448
Gratuity and leave encashment 55,190 39,502
Employee stock compensation expense 4,821 2,211
Directors’ fees including commission 4,795 805
Welfare expenses 185,208 144,805
Operation and other expenses:
Royalty and technical fees * (7,768) 13,312
Rent 70,024 67,869
Communication expenses 77,466 65,108
Travelling and conveyance 297,914 232,835
Professional charges 360,463 267,651
Power and fuel 825,289 676,267
Insurance 78,529 77,670
Rates, taxes and fees, net of refunds of taxes 42,167 26,145
Lab consumables 263,878 218,792
Repairs and maintenance:
Plant and machinery 244,745 176,462
Buildings 27,081 36,553
Others 155,756 129,535
Selling expenses:
Freight outwards and clearing charges 206,122 140,647
Sales promotion expenses 428,718 338,137
Commission and brokerage (other than sole selling agents)* 99,249 86,160
Excise duty on closing stock, net ** (4,167) (1,239)
Bad debts written off 9,860 1,656
Provision for bad and doubtful debts 19 16,852
Foreign exchange fluctuation (net) (214,936) 58,982
Printing and stationery 44,357 30,563
Loss on sale of assets (net) 7,503 43,059
Research and development expenses 374,254 189,434
Clinical trial and development expenses 507,996 181,098
Miscellaneous expenses 208,703 321,389
22,831,078 19,675,914
Recharge of product development expenses to other party for Co-Development of Product (718,661) (341,956)
(Increase)/decrease in inventories of finished goods and work-in-progress
Opening inventories:
Finished goods, net of excise duty 699,673 618,869
Work-in-progress 1,416,558 1,126,704
2,116,231 1,745,573
Closing inventories:
Finished goods, net of excise duty (849,558) (699,673)
Work-in-progress (1,538,946) (1,416,558)
(2,388,504) (2,116,231)
(272,273) (370,658)
21,840,144 18,963,300
*Royalty & technical fees and Commission and brokerage are net of write back of provision no longer required of ` 25,342 (March 31, 2010 ` Nil) and
` 29,704 (March 31, 2010 ` Nil), respectively.
** Excise Duty on Sales amounting to ` 997,752 (March 31, 2010 - ` 645,944) has been reduced from sales in profit and loss account and excise duty on
increase/decrease in stock amounting to ` 4,167 (March 31, 2010 - ` 1,239) has been considered as (income)/expense in Schedule 15 of financial statements
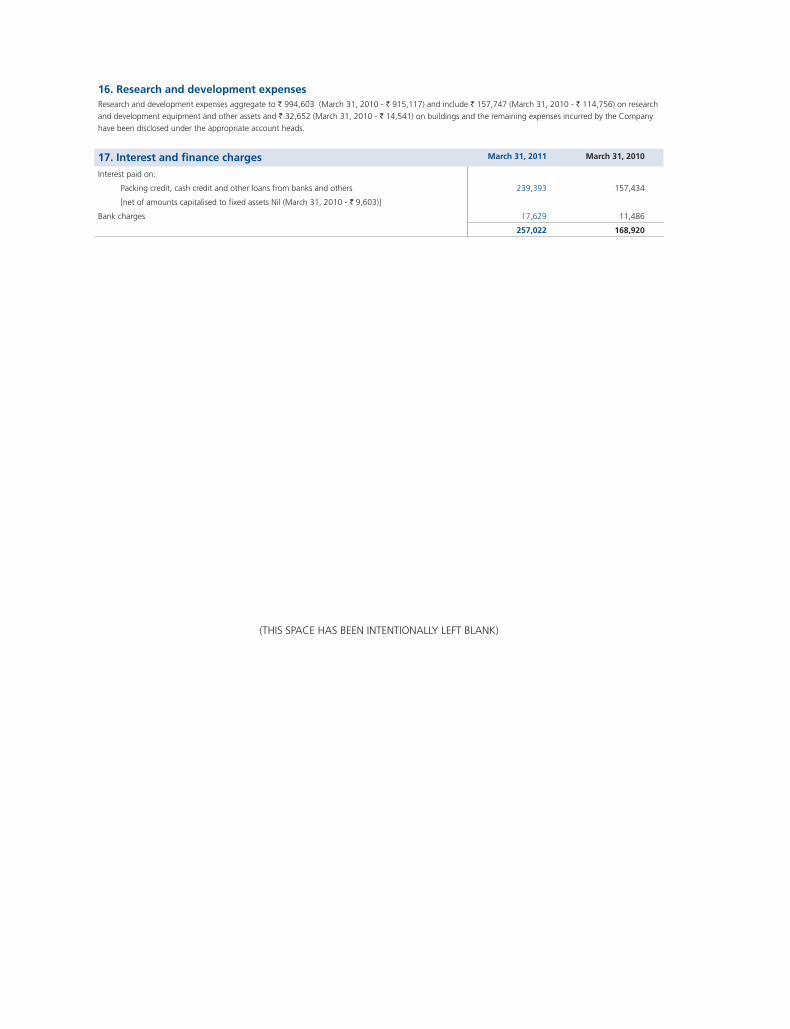
(THIS SPACE HAS BEEN INTENTIONALLY LEFT BLANK)
16. Research and development expensesResearch and development expenses aggregate to ` 994,603 (March 31, 2010 - ` 915,117) and include ` 157,747 (March 31, 2010 - ` 114,756) on research
and development equipment and other assets and ` 32,652 (March 31, 2010 - ` 14,541) on buildings and the remaining expenses incurred by the Company
have been disclosed under the appropriate account heads.
17. Interest and finance charges March 31, 2011 March 31, 2010
Interest paid on:
Packing credit, cash credit and other loans from banks and others 239,393 157,434
[net of amounts capitalised to fixed assets Nil (March 31, 2010 - ` 9,603)]
Bank charges 17,629 11,486
257,022 168,920
Biocon Limited & Subsidiaries - IGAAP
2011145
Biocon Annual Report Financials
Schedule 18: Notes to Accounts for the year ended March 31, 2011(All amounts in Indian Rupees, US Dollars and Euro are in thousands, except share and per share data)
1. BackgroundBiocon Limited ('Biocon' or 'the Company'), was incorporated at Bangalore in 1978 for manufacture of biotechnology products. Syngene International Limited ('Syngene'), promoted by Dr Kiran Mazumdar Shaw, was incorporated at Bangalore in 1993. In March 2002, Biocon acquired 99.99 per cent of the equity shares of Syngene and, resultantly, Syngene became the subsidiary of Biocon. Clinigene International Limited ('Clinigene') was incorporated on August 4, 2000 at Bangalore and became a wholly owned subsidiary of Biocon on March 31, 2001.
On January 10, 2008, Biocon entered into an agreement with Dr B R Shetty to set up a joint venture company NeoBiocon FZ-LLC, incorporated in Dubai (‘NeoBiocon’). NeoBiocon is engaged in development, marketing and distribution of biopharmaceuticals in the Middle East region.
The Company has also established Biocon Research Limited (‘BRL’), a subsidiary of the Company to undertake research and development in novel and innovative drug initiatives.
Effective April 30, 2008, Biocon acquired 71% equity interest in AxiCorp GmbH, Germany (‘AxiCorp’) through its newly incorporated wholly owned subsidiary company Biocon SA., Switzerland. In February 2009, Biocon SA acquired an additional 7.4% equity interest in AxiCorp. Also, refer Note 13 below.
Biocon entered into an agreement with CIMAB SA (‘CIMAB’) to set up a Joint Venture Company Biocon Biopharmaceuticals Private Limited (‘BBPL’) to manufacture and market products and carry out research activities. BBPL was incorporated on June 17, 2002 with Biocon holding 51 per cent of share capital. In April 2010, Biocon SA acquired the 49% equity stake held by CIMAB SA in BBPL. In March 2011, Biocon purchased the 49% equity stake in BBPL from Biocon SA. Consequently, as at March 31, 2011 all the equity shares of BBPL are held by Biocon.
The Company has 30% voting rights in IATRICa Inc. incorporated in USA. IATRICa Inc. is involved in research and development activities..
Biocon and its subsidiaries (‘the Group’) and joint venture/associate companies are engaged in manufacture of biotechnology products for the pharmaceutical sector. The Company is also engaged in research and development in the biotechnology sector. The Group is also engaged in providing contract research services to overseas customers in the field of synthetic chemistry and molecular biology, sale of products arising from research activities and undertakes clinical research activities on discovering new biomarkers and is extending its activity to discovering new diseases subsets and novel data based on pharmacogenomics.
During the year ended March 31, 2007, the Company had received an approval as the developer as Biocon SEZ at the Biocon Park facility and also received an approval for SEZ unit to be located within Biocon SEZ.
2. Statement of significant accounting policiesa) (i) Basis of presentation and consolidation
The consolidated financial statements have been prepared under the historical cost convention except in case of assets for which provision for impairment is made and revaluation is carried out, on an accrual basis. The consolidated financial statements have been prepared to comply in all material respects with accounting standards, notified by the Companies (Accounting Standards) Rules, 2006 (as amended) to reflect the financial position and the results of operations of Biocon together with its subsidiaries, joint venture company and associate company.
In accordance with Accounting Standard 27, ‘Financial Reporting of Interests in Joint ventures’, the interest in the joint venture company is accounted using proportionate consolidation on a line-by-line basis.
In accordance with Accounting Standard 23, ‘Accounting for Investments in Associates in Consolidated Financial Statements’, the Group has accounted for its investments in associate under the equity method as per which the share of profit/(loss) of the associate company has been added to/reduced from the cost of investment.
The accounting policies have been consistently applied by the Group and are consistent with those used in the previous year.
The consolidated financial statements of AxiCorp are drawn up to December 31, 2010 for the purpose of consolidation. Accordingly, the consolidated balance sheet as at March 31, 2011 and the financial results of the Group for the year then ended, include the consolidated balance sheet of AxiCorp as at December 31, 2010 and financial results for the period January 1, 2010 to December 31, 2010. The financial statements of other subsidiaries, joint ventres company and associate company have been drawn upto the same reporting date as that of the Company i.e. March 31, 2011.
All material inter-company transactions and balances between the entities included in the consolidated financial statements have been eliminated. The excess of the purchase price over the proportionate share of the book value of the net assets of the acquired subsidiary company on the date of investment is recognised in the consolidated financial statements as goodwill and disclosed under Intangible Assets. In case the cost of investment in subsidiary companies is less than the proportionate share of the book value of the net assets of the acquired subsidiary company on the date of investment, the difference is treated as capital reserve and shown under Reserves and surplus.
For the purpose of administration of the employee stock option plans of the Company, the Company has established the Biocon India Limited Employee Welfare Trust (‘ESOP Trust’). In accordance with the guidelines framed by the Securities and Exchange Board of India (‘SEBI’), financial statements of the Company have been prepared as if the Company itself is administering the ESOP Scheme.
(ii) Use of estimates
The preparation of consolidated financial statements in conformity with generally accepted accounting principles requires management to make estimates and assumptions that affect the reported amounts of assets and liabilities and disclosure of contingent liabilities at the date of the financial statements and the results of operations during the reporting period. Although these estimates are based upon management’s best knowledge of current events and actions, actual results could differ from these estimates.
b) Fixed assets and depreciation
Fixed assets are stated at cost, except for revalued freehold land and buildings, which are shown at estimated replacement cost as determined by valuers less impairment loss, if any, and accumulated depreciation. The Group capitalises all costs relating to the acquisition and installation of fixed assets.
Fixed assets, other than freehold land, but including revalued buildings, are depreciated pro rata to the period of use, on the straight line method at the annual rates based on the estimated useful lives, as follows:
Nature of asset Per cent
Buildings 4.00
Plant and machinery (including Computers) 9.09 – 33.33
Research and development equipment 11.11
Furniture and fixtures 8.33 -16.67
Vehicles 16.67
Leasehold land on a lease-cum-sale basis are capitalised at the allotment rates currently charged by the Municipal Authorities. Leasehold improvements are being depreciated over the lease term or useful life whichever is lower. Used assets acquired from third parties are depreciated on a straight line basis over their remaining useful life of such assets.
The depreciation charge over-and-above the depreciation calculated on the original cost of the revalued assets is transferred from the revaluation reserve to the consolidated profit and loss account.
Assets individually costing less than ` 5 are fully depreciated in the year of purchase.
c) Impairment of assets
The carrying amounts of assets are reviewed at each balance sheet date if there is any indication of impairment based on internal/external factors. An impairment loss is recognized wherever the carrying amount of an asset exceeds its recoverable amount. The recoverable amount is the greater of the asset’s net selling price and value in use. In assessing value in use, the estimated future cash flows are discounted to their present value using a pre-tax discount rate that reflects current market assessments of the time value of money and risks specific to the asset. After impairment, depreciation is provided on the revised carrying amount of the asset over its remaining useful life. A previously recognised impairment loss is increased or reversed depending on changes in circumstances. However the carrying value after reversal is not increased beyond the carrying value that would have prevailed by charging usual depreciation if there was no impairment.
d) Intangible assets
Goodwill
Goodwill represents the excess of the purchase price over the book value of the net assets of the acquired subsidiary company on the date of investment. Goodwill is not amortised but is tested for impairment on a yearly basis.
Intellectual Property rights, contract rights, manufacturing/marketing rights and product licenses
Costs relating to intellectual property rights, contract rights, manufacturing/marketing rights and product licenses are capitalized and amortized on a straight-line basis over the period of expected future sales from the use of the said intangible asset, i.e. over their estimated useful lives not exceeding ten years.
Computer Software
Software which is not an integral part of the related hardware is classified as an intangible asset and is being amortised over a period of three-five years, being its estimated useful life.
Research and Development Costs
Research and development costs, including technical know-how fees, incurred for development of products are expensed as incurred, except for development costs which relate to the design and testing of new or improved materials, products or processes which are recognised as an intangible asset to the extent that it is expected that such assets will generate future economic benefits. Research and development expenditure of a capital nature is added to fixed assets. Development costs carried forward is amortised over the period of expected future sales from the related project, not exceeding ten years.
The carrying value of development costs is reviewed for impairment annually when the asset is not yet in use, and otherwise when events or changes in circumstances indicate that the carrying value may not be recoverable.
Biocon Limited & Subsidiaries - IGAAP
2011147
Biocon Annual Report Financials
e) Inventories
Inventories are valued as follows:
Raw materials, chemicals & reagents, consumables and packing materials
Lower of cost and net realizable value. However, materials and other items held for use in the production of inventories are not written down below cost if the finished products in which they will be incorporated are expected to be sold at or above cost. Cost is determined on a first-in-first-out basis. Customs duties on imported raw materials (excluding stocks in the bonded warehouse) are treated as part of the cost of the inventories. Consumables in the nature of Columns are amortised over a period of twelve months from the date of issue for consumption.
Work-in-progress and finished goods
Lower of cost and net realizable value. Cost includes direct materials and labour and a proportion of manufacturing overheads based on normal operating capacity. Cost of finished goods includes excise duty.
Traded goods Lower of cost and net realizable value. Cost includes the purchase price and other associated costs directly incurred in bringing the inventory to its present location.
Net realizable value is the estimated selling price in the ordinary course of business, less estimated costs of completion and estimated costs necessary to make the sale.
f) Revenue recognition
Revenue is recognized to the extent that it is probable that the economic benefits will flow to the Group and the revenue can be reliably measured.
Sale of pharmaceuticals and compounds
Revenue is recognised when the significant risks and rewards of ownership of the goods have passed to the buyer and are recorded net of excise duty, sales tax and other levies. For the purpose of disclosure in these consolidated financial statements, sales are reflected gross and net of excise duty in the consolidated profit and loss account.
Technical license agreements
The Group enters into certain dossier sales, licensing and supply agreements relating to various products. Revenue from such arrangements is recognised upon completion of performance obligations or on a proportional performance basis over the period the Group performs its obligations, under the terms of the agreements. Proportionate performance is measured based upon the efforts incurred to date in relation to the total estimated efforts to complete the contract. The Group monitors estimates of the total contract revenue and cost on a routine basis throughout the contract period. The cumulative impact of any change in estimates of the contract revenue or costs is reflected in the period in which the changes become known. In the event that the loss is anticipated on a particular contract, provision is made for the estimated loss.
Contract research agreements
In respect of contracts involving research services and in case of “time and materials” contracts, contract research fees are recognised as services are rendered, in accordance with the terms of the contracts in case of services performed on “time and material basis”. Revenues relating to fixed price contracts are recognised based on the percentage of completion method determined based on efforts expended as a proportion to total estimated efforts.
In respect of contracts involving sale of compounds arising out of contract research services for which separate invoices are raised, revenues is recognized when the significant risks and rewards of ownership of the compounds have passed to the buyer, and comprise of amounts invoiced for compounds sold.
Interest and Dividend Income
Interest income is recognised on an accrual basis. Dividends are accounted for when the right to receive the payment is established.
g) Investments
Investments that are readily realisable and intended to be held for not more than twelve months are classified as current investments. All other investments are classified as long-term investments. Long-term investments are stated at cost. However, provision for diminution in value is made to recognise a decline other than temporary in the value of the investments. Current investments are carried at lower of cost and fair value and determined on an individual investment basis.
h) Retirement benefits
(i) Retirement benefit in the form of Provident Fund is a defined contribution scheme and the contributions are charged to the Profit and Loss Account of the year when the contributions to the government funds are due.
(ii) Gratuity liability is a defined benefit obligation and is provided for on the basis of an actuarial valuation on projected unit credit method made at the end of each financial year. The gratuity benefit of the Group is administered by a trust formed for this purpose through the group gratuity scheme.
(iii) Leave encashment liability is in accordance with the rules of the Group. Short-term compensated absences are provided for based on estimates. Long-term compensated absences are provided for based on actuarial valuation. The actuarial valuation is done as per projected unit credit method made at the end of each financial year.
(iv) Actuarial gains/losses are immediately taken to profit and loss account and are not deferred.
(v) In case of foreign subsidiary companies, contributions are made as per the respective country laws and regulations. The same is charged to Profit and Loss Account on accrual basis. There are no obligations beyond the company’s contribution.
i) Foreign currency transactions
Initial Recognition
Foreign currency transactions are recorded in the reporting currency, by applying to the foreign currency amount the exchange rate between the reporting currency and the foreign currency at the date of the transaction.
Conversion
Foreign currency monetary items are reported using the closing rate. Non-monetary items which are carried in terms of historical cost denominated in a foreign currency are reported using the exchange rate at the date of the transaction; and non-monetary items which are carried at fair value or other similar valuation denominated in a foreign currency are reported using the exchange rates that existed when the values were determined.
Exchange Differences
Exchange differences, in respect of accounting periods commencing on or after December 7, 2006, arising on reporting of long-term foreign currency monetary items at rates different from those at which they were initially recorded during the period, or reported in previous financial statements, in so far as they relate to the acquisition of a depreciable capital asset, are added to or deducted from the cost of the asset and are depreciated over the balance life of the asset, and in other cases, are accumulated in a “Foreign Currency Monetary Item Translation Difference Account” in the financial statements and amortized over the balance period of such long-term asset/liability but not beyond accounting period ending on or before March 31, 2011.
Exchange differences arising on the settlement of monetary items not covered above, or on reporting such monetary items at rates different from those at which they were initially recorded during the year, or reported in previous financial statements, are recognized as income or as expenses in the year in which they arise.
Forward Exchange Contracts not intended for trading or speculation purposes
The premium or discount arising at the inception of forward exchange contracts is amortised as expense or income over the life of the contract. Exchange differences on such contracts are recognised in the statement of profit and loss in the year in which the exchange rates change. Any profit or loss arising on cancellation or renewal of forward exchange contract is recognised as income or as expense for the year. However, exchange difference in respect of accounting period commencing on or after December 7, 2006 arising on the forward exchange contract undertaken to hedge the long term foreign currency monetary item, in so far as they relate to the acquisition of depreciable capital asset, are added to or deducted from the cost of asset and in other cases, are accumulated in “Foreign Currency Monetary Item Translation Difference Account” and amortised over the balance period of such long term asset/liability but not beyond March 31, 2011
Translation of Integral and Non-integral foreign operation
The financial statements of an integral foreign operation are translated as if the transactions of the foreign operation have been those of the Group itself.
In translating the financial statements of a non-integral foreign operation for incorporation in financial statements, the assets and liabilities, both monetary and non-monetary, of the non-integral foreign operation are translated at the closing rate; income and expense items of the non-integral foreign operation are translated at exchange rates at the dates of the transactions; and all resulting exchange differences are accumulated in a foreign currency translation reserve until the disposal of the net investment.
On the disposal of a non-integral foreign operation, the cumulative amount of the exchange differences which have been deferred and which relate to that operation are recognised as income or as expenses in the same period in which the gain or loss on disposal is recognised.
When there is a change in the classification of a foreign operation, the translation procedures applicable to the revised classification are applied from the date of the change in the classification.
j) Income tax
Tax expense comprises current and deferred tax. Current income tax is measured at the amount expected to be paid to the tax authorities in accordance with the Income Tax Act. Deferred income taxes reflects the impact of current period timing differences between taxable income and accounting income for the period and reversal of timing differences of earlier years.
Biocon Limited & Subsidiaries - IGAAP
2011149
Biocon Annual Report Financials
Deferred tax is measured based on the tax rates and the tax laws enacted or substantively enacted at the balance sheet date. Deferred tax assets and deferred tax liabilities are offset, if a legally enforceable right exists to set off current tax assets against current tax liabilities and the deferred tax assets and deferred tax liabilities relate to the taxes on income levied by same governing taxation laws. Deferred tax assets are recognised only to the extent that there is reasonable certainty that sufficient future taxable income will be available against which such deferred tax assets can be realised. In situations where the Group has unabsorbed depreciation or carry forward tax losses, all deferred tax assets are recognised only if there is virtual certainty supported by convincing evidence that they can be realised against future taxable profits. At each balance sheet date the Group re-assesses unrecognised deferred tax assets. It recognises unrecognised deferred tax assets to the extent that it has become reasonably certain or virtually certain, as the case may be that sufficient future taxable income will be available against which such deferred tax assets can be realised.
The carrying amount of deferred tax assets are reviewed at each balance sheet date. The Group writes-down the carrying amount of a deferred tax asset to the extent that it is no longer reasonably certain or virtually certain, as the case may be, that sufficient future taxable income will be available against which deferred tax asset can be realised. Any such write-down is reversed to the extent that it becomes reasonably certain or virtually certain, as the case may be, that sufficient future taxable income will be available
Minimum Alternative Tax (MAT) credit is recognised as an asset only when and to the extent there is convincing evidence that the company will pay normal income tax during the specified period. In the year in which the MAT credit becomes eligible to be recognized as an asset in accordance with the recommendations contained in Guidance Note issued by the Institute of Chartered Accountants of India, the said asset is created by way of a credit to the profit and loss account and shown as MAT Credit Entitlement. The Company reviews the same at each balance sheet date and writes down the carrying amount of MAT Credit Entitlement to the extent there is no longer convincing evidence to the effect that company will pay normal Income Tax during the specified period.
k) Borrowing costs
Borrowing costs that are attributable to the acquisition and construction of a qualifying asset are capitalised as a part of the cost of the asset. Other borrowing costs are recognised as an expense in the year in which they are incurred.
l) Employee stock compensation costs
Measurement and disclosure of the employee share-based payment plans is done in accordance with SEBI (Employee Stock Option Scheme and Employee Stock Purchase Scheme) Guidelines, 1999 and the Guidance Note on Accounting for Employee Share-based Payments, issued by the Institute of Chartered Accountants of India. The Group measures compensation cost relating to employee stock options using the intrinsic value method. Compensation expense is amortized over the vesting period of the option on a straight line basis.
m) Earnings per share (EPS)
Basic earnings per share are calculated by dividing the net profit or loss for the year attributable to equity shareholders by the weighted average number of equity shares outstanding during the year. Partly paid equity shares are treated as a fraction of an equity share to the extent that they were entitled to participate in dividends relative to a fully paid equity share during the reporting year. The weighted average number of equity shares outstanding during the year is adjusted for events of bonus issue; bonus element in a rights issue to existing shareholders; share split and reverse share split (consolidation of shares).
For the purpose of calculating diluted earnings per share, the net profit or loss for the year attributable to equity shareholders and the weighted average number of shares outstanding during the year are adjusted for the effects of all dilutive potential equity shares.
n) Operating lease
Where the Company is a Lessee:
Leases of assets under which all the risks and rewards of ownership are effectively retained by the lessor are classified as operating leases. Lease payments under operating leases are recognised as an expense on a straight-line basis over the lease term.
Where the Company is a Lessor:
Assets subject to operating leases are included in fixed assets. Lease income is recognised on a straight-line basis over the lease term. Costs, including depreciation are recognised as an expense. Initial direct costs such as legal costs, brokerage costs, etc. are recognised immediately.
o) Segment reporting
Identification of segments:
The Group’s operating businesses are organized and managed separately according to the nature of products manufactured/traded, with each segment representing a strategic business unit that offers different products to different markets. The analysis of geographical segments is based on the areas in which the Group's products are sold.
Inter-segment Transfers:
The Group generally accounts for inter-segment sales and transfers at an agreed marked-up price.
Allocation of common costs:
Common allocable costs are allocated to each segment according to the relative contribution of each segment to the total common costs.
Unallocated items:
The Corporate and other segment include general corporate income and expense items which are not allocated to any business segment.
Segment policies:
The Group prepares its segment information in conformity with the accounting policies adopted for preparing and presenting the financial statements of the Group as a whole.
p) Provisions
A provision is recognised for a present obligation as a result of past event; it is probable that an outflow of resources will be required to settle the obligation and in respect of which a reliable estimate can be made. Provisions are not discounted to its present value and are determined based on best management estimate required to settle the obligation at the balance sheet date. These are reviewed at each balance sheet date and adjusted to reflect the current best estimates.
q) Expenditure on new projects and substantial expansion
Expenditure directly relating to construction activity is capitalized. Indirect expenditure incurred during construction period is capitalized as part of the indirect construction cost to the extent to which the expenditure is directly related to construction or is incidental thereto. Other indirect expenditure (including borrowing costs) incurred during the construction period which is not related to the construction activity nor is incidental thereto is charged to the Profit and Loss Account. Income earned during construction period is deducted from the total of the indirect expenditure. All direct capital expenditure on expansion is capitalized. As regards indirect expenditure on expansion, only that portion is capitalized which represents the marginal increase in such expenditure involved as a result of capital expansion. Both direct and indirect expenditure are capitalized only if they increase the value of the asset beyond its original standard of performance.
r) Cash and Cash Equivalents
Cash and cash equivalents for the purposes of cash flow statement comprise cash at bank and in hand and short-term investments with an original maturity of three months or less.
s) Derivate Instruments
As per the ICAI Announcement, accounting for derivative contracts, other than those covered under AS-11, are marked to market on a portfolio basis, and the net loss after considering the offsetting effect on the underlying hedge item is charged to the profit and loss account. Net gains are ignored.
(THIS SPACE HAS BEEN INTENTIONALLY LEFT BLANK)
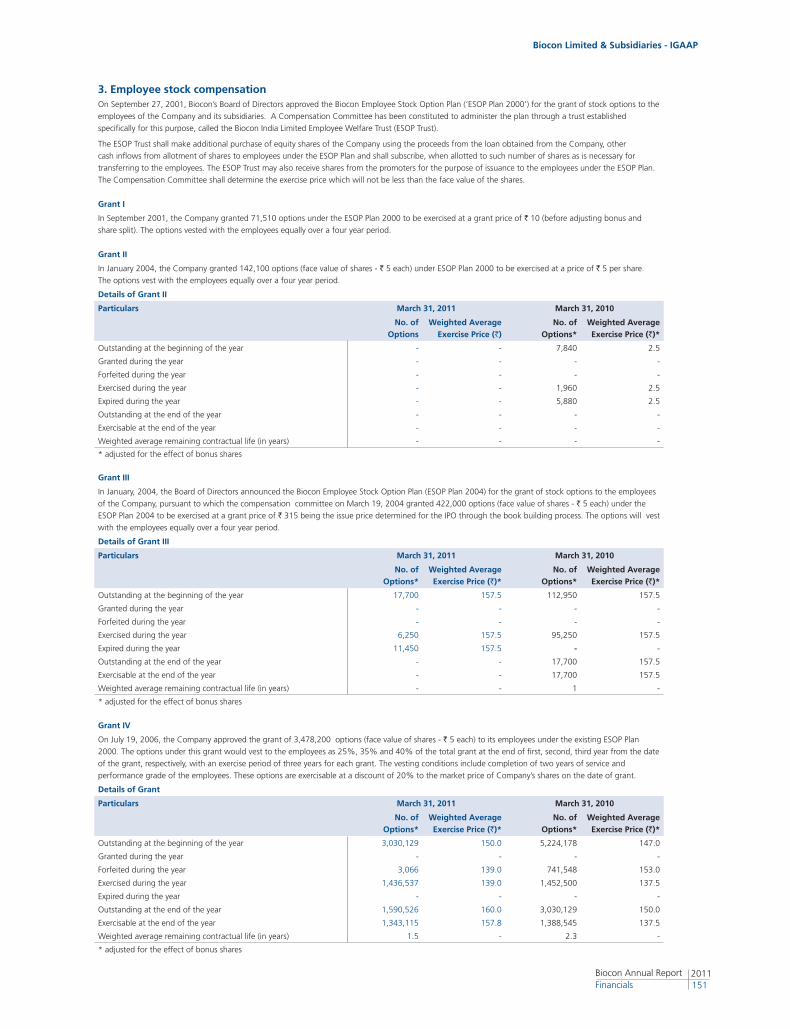
Biocon Limited & Subsidiaries - IGAAP
2011151
Biocon Annual Report Financials
3. Employee stock compensationOn September 27, 2001, Biocon’s Board of Directors approved the Biocon Employee Stock Option Plan (‘ESOP Plan 2000’) for the grant of stock options to the
employees of the Company and its subsidiaries. A Compensation Committee has been constituted to administer the plan through a trust established
specifically for this purpose, called the Biocon India Limited Employee Welfare Trust (ESOP Trust).
The ESOP Trust shall make additional purchase of equity shares of the Company using the proceeds from the loan obtained from the Company, other
cash inflows from allotment of shares to employees under the ESOP Plan and shall subscribe, when allotted to such number of shares as is necessary for
transferring to the employees. The ESOP Trust may also receive shares from the promoters for the purpose of issuance to the employees under the ESOP Plan.
The Compensation Committee shall determine the exercise price which will not be less than the face value of the shares.
Grant I
In September 2001, the Company granted 71,510 options under the ESOP Plan 2000 to be exercised at a grant price of ` 10 (before adjusting bonus and
share split). The options vested with the employees equally over a four year period.
Grant II
In January 2004, the Company granted 142,100 options (face value of shares - ` 5 each) under ESOP Plan 2000 to be exercised at a price of ` 5 per share.
The options vest with the employees equally over a four year period.
Details of Grant II
Particulars March 31, 2011 March 31, 2010
No. of Options
Weighted Average Exercise Price (`)
No. of Options*
Weighted Average Exercise Price (`)*
Outstanding at the beginning of the year - - 7,840 2.5
Granted during the year - - - -
Forfeited during the year - - - -
Exercised during the year - - 1,960 2.5
Expired during the year - - 5,880 2.5
Outstanding at the end of the year - - - -
Exercisable at the end of the year - - - -
Weighted average remaining contractual life (in years) - - - -
* adjusted for the effect of bonus shares
Grant III
In January, 2004, the Board of Directors announced the Biocon Employee Stock Option Plan (ESOP Plan 2004) for the grant of stock options to the employees
of the Company, pursuant to which the compensation committee on March 19, 2004 granted 422,000 options (face value of shares - ` 5 each) under the
ESOP Plan 2004 to be exercised at a grant price of ` 315 being the issue price determined for the IPO through the book building process. The options will vest
with the employees equally over a four year period.
Details of Grant III
Particulars March 31, 2011 March 31, 2010
No. of Options*
Weighted Average Exercise Price (`)*
No. of Options*
Weighted Average Exercise Price (`)*
Outstanding at the beginning of the year 17,700 157.5 112,950 157.5
Granted during the year - - - -
Forfeited during the year - - - -
Exercised during the year 6,250 157.5 95,250 157.5
Expired during the year 11,450 157.5 - -
Outstanding at the end of the year - - 17,700 157.5
Exercisable at the end of the year - - 17,700 157.5
Weighted average remaining contractual life (in years) - - 1 -
* adjusted for the effect of bonus shares
Grant IV
On July 19, 2006, the Company approved the grant of 3,478,200 options (face value of shares - ` 5 each) to its employees under the existing ESOP Plan
2000. The options under this grant would vest to the employees as 25%, 35% and 40% of the total grant at the end of first, second, third year from the date
of the grant, respectively, with an exercise period of three years for each grant. The vesting conditions include completion of two years of service and
performance grade of the employees. These options are exercisable at a discount of 20% to the market price of Company’s shares on the date of grant.
Details of Grant
Particulars March 31, 2011 March 31, 2010
No. of Options*
Weighted Average Exercise Price (`)*
No. of Options*
Weighted Average Exercise Price (`)*
Outstanding at the beginning of the year 3,030,129 150.0 5,224,178 147.0
Granted during the year - - - -
Forfeited during the year 3,066 139.0 741,548 153.0
Exercised during the year 1,436,537 139.0 1,452,500 137.5
Expired during the year - - - -
Outstanding at the end of the year 1,590,526 160.0 3,030,129 150.0
Exercisable at the end of the year 1,343,115 157.8 1,388,545 137.5
Weighted average remaining contractual life (in years) 1.5 - 2.3 -
* adjusted for the effect of bonus shares
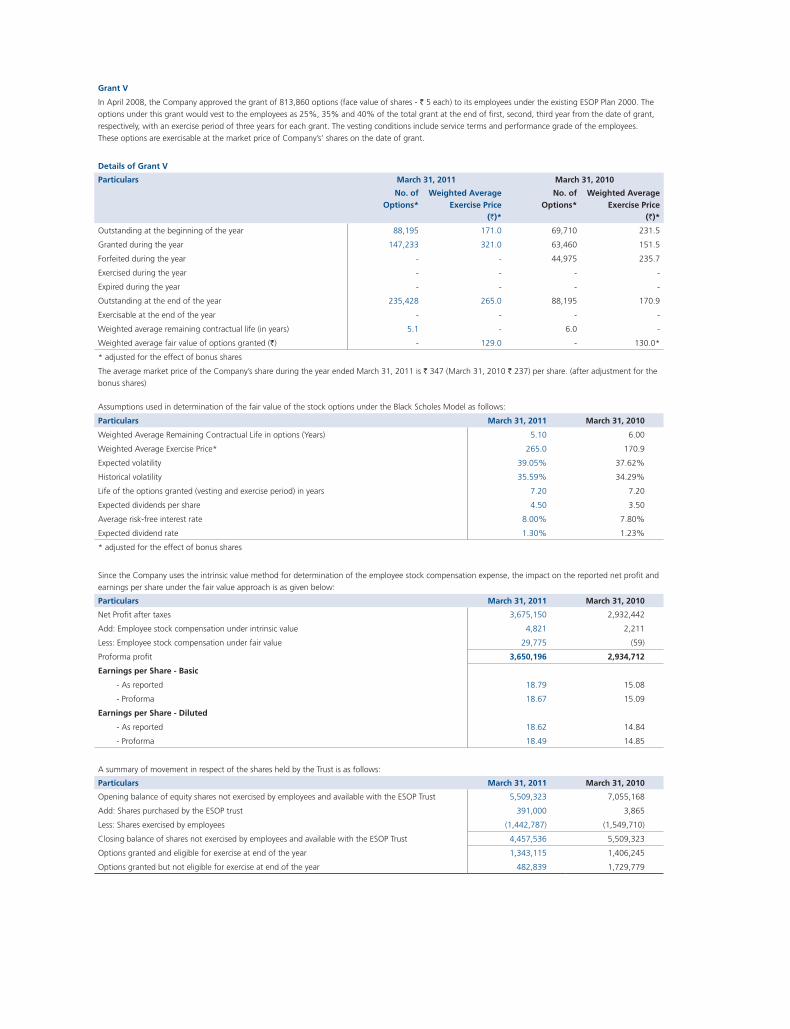
Assumptions used in determination of the fair value of the stock options under the Black Scholes Model as follows:
Particulars March 31, 2011 March 31, 2010
Weighted Average Remaining Contractual Life in options (Years) 5.10 6.00
Weighted Average Exercise Price* 265.0 170.9
Expected volatility 39.05% 37.62%
Historical volatility 35.59% 34.29%
Life of the options granted (vesting and exercise period) in years 7.20 7.20
Expected dividends per share 4.50 3.50
Average risk-free interest rate 8.00% 7.80%
Expected dividend rate 1.30% 1.23%
* adjusted for the effect of bonus shares
Since the Company uses the intrinsic value method for determination of the employee stock compensation expense, the impact on the reported net profit and
earnings per share under the fair value approach is as given below:
Particulars March 31, 2011 March 31, 2010
Net Profit after taxes 3,675,150 2,932,442
Add: Employee stock compensation under intrinsic value 4,821 2,211
Less: Employee stock compensation under fair value 29,775 (59)
Proforma profit 3,650,196 2,934,712
Earnings per Share - Basic
- As reported 18.79 15.08
- Proforma 18.67 15.09
Earnings per Share - Diluted
- As reported 18.62 14.84
- Proforma 18.49 14.85
A summary of movement in respect of the shares held by the Trust is as follows:
Particulars March 31, 2011 March 31, 2010
Opening balance of equity shares not exercised by employees and available with the ESOP Trust 5,509,323 7,055,168
Add: Shares purchased by the ESOP trust 391,000 3,865
Less: Shares exercised by employees (1,442,787) (1,549,710)
Closing balance of shares not exercised by employees and available with the ESOP Trust 4,457,536 5,509,323
Options granted and eligible for exercise at end of the year 1,343,115 1,406,245
Options granted but not eligible for exercise at end of the year 482,839 1,729,779
Grant V
In April 2008, the Company approved the grant of 813,860 options (face value of shares - ` 5 each) to its employees under the existing ESOP Plan 2000. The
options under this grant would vest to the employees as 25%, 35% and 40% of the total grant at the end of first, second, third year from the date of grant,
respectively, with an exercise period of three years for each grant. The vesting conditions include service terms and performance grade of the employees.
These options are exercisable at the market price of Company’s’ shares on the date of grant.
Details of Grant V
Particulars March 31, 2011 March 31, 2010
No. of Options*
Weighted Average Exercise Price
(`)*
No. of Options*
Weighted Average Exercise Price
(`)*
Outstanding at the beginning of the year 88,195 171.0 69,710 231.5
Granted during the year 147,233 321.0 63,460 151.5
Forfeited during the year - - 44,975 235.7
Exercised during the year - - - -
Expired during the year - - - -
Outstanding at the end of the year 235,428 265.0 88,195 170.9
Exercisable at the end of the year - - - -
Weighted average remaining contractual life (in years) 5.1 - 6.0 -
Weighted average fair value of options granted (`) - 129.0 - 130.0*
* adjusted for the effect of bonus shares
The average market price of the Company’s share during the year ended March 31, 2011 is ` 347 (March 31, 2010 ` 237) per share. (after adjustment for the
bonus shares)
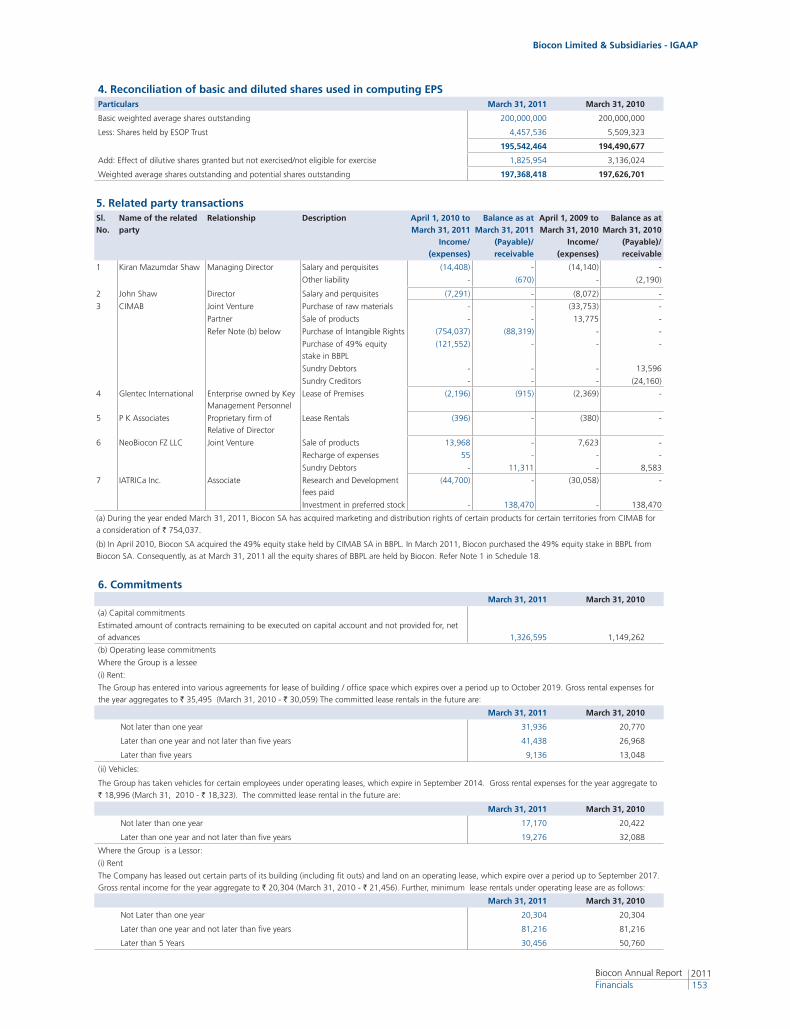
Biocon Limited & Subsidiaries - IGAAP
2011153
Biocon Annual Report Financials
4. Reconciliation of basic and diluted shares used in computing EPSParticulars March 31, 2011 March 31, 2010
Basic weighted average shares outstanding 200,000,000 200,000,000
Less: Shares held by ESOP Trust 4,457,536 5,509,323
195,542,464 194,490,677
Add: Effect of dilutive shares granted but not exercised/not eligible for exercise 1,825,954 3,136,024
Weighted average shares outstanding and potential shares outstanding 197,368,418 197,626,701
5. Related party transactionsSl. No.
Name of the related party
Relationship Description April 1, 2010 toMarch 31, 2011
Income/(expenses)
Balance as atMarch 31, 2011
(Payable)/receivable
April 1, 2009 toMarch 31, 2010
Income/(expenses)
Balance as atMarch 31, 2010
(Payable)/receivable
1 Kiran Mazumdar Shaw Managing Director Salary and perquisites (14,408) - (14,140) -
Other liability - (670) - (2,190)
2 John Shaw Director Salary and perquisites (7,291) - (8,072) -
3 CIMAB Joint Venture Purchase of raw materials - - (33,753) -
Partner Sale of products - - 13,775 -
Refer Note (b) below Purchase of Intangible Rights (754,037) (88,319) - -
Purchase of 49% equity
stake in BBPL
(121,552) - - -
Sundry Debtors - - - 13,596
Sundry Creditors - - - (24,160)
4 Glentec International Enterprise owned by Key
Management Personnel
Lease of Premises (2,196) (915) (2,369) -
5 P K Associates Proprietary firm of
Relative of Director
Lease Rentals (396) - (380) -
6 NeoBiocon FZ LLC Joint Venture Sale of products 13,968 - 7,623 -
Recharge of expenses 55 - - -
Sundry Debtors - 11,311 - 8,583
7 IATRICa Inc. Associate Research and Development
fees paid
(44,700) - (30,058) -
Investment in preferred stock - 138,470 - 138,470
(a) During the year ended March 31, 2011, Biocon SA has acquired marketing and distribution rights of certain products for certain territories from CIMAB for
a consideration of ` 754,037.
(b) In April 2010, Biocon SA acquired the 49% equity stake held by CIMAB SA in BBPL. In March 2011, Biocon purchased the 49% equity stake in BBPL from
Biocon SA. Consequently, as at March 31, 2011 all the equity shares of BBPL are held by Biocon. Refer Note 1 in Schedule 18.
6. CommitmentsMarch 31, 2011 March 31, 2010
(a) Capital commitments
Estimated amount of contracts remaining to be executed on capital account and not provided for, net
of advances 1,326,595 1,149,262
(b) Operating lease commitments
Where the Group is a lessee
(i) Rent:
The Group has entered into various agreements for lease of building / office space which expires over a period up to October 2019. Gross rental expenses for
the year aggregates to ` 35,495 (March 31, 2010 - ` 30,059) The committed lease rentals in the future are:
March 31, 2011 March 31, 2010
Not later than one year 31,936 20,770
Later than one year and not later than five years 41,438 26,968
Later than five years 9,136 13,048
(ii) Vehicles:
The Group has taken vehicles for certain employees under operating leases, which expire in September 2014. Gross rental expenses for the year aggregate to
` 18,996 (March 31, 2010 - ` 18,323). The committed lease rental in the future are:
March 31, 2011 March 31, 2010
Not later than one year 17,170 20,422
Later than one year and not later than five years 19,276 32,088
Where the Group is a Lessor:
(i) Rent
The Company has leased out certain parts of its building (including fit outs) and land on an operating lease, which expire over a period up to September 2017.
Gross rental income for the year aggregate to ` 20,304 (March 31, 2010 - ` 21,456). Further, minimum lease rentals under operating lease are as follows:
March 31, 2011 March 31, 2010
Not Later than one year 20,304 20,304
Later than one year and not later than five years 81,216 81,216
Later than 5 Years 30,456 50,760
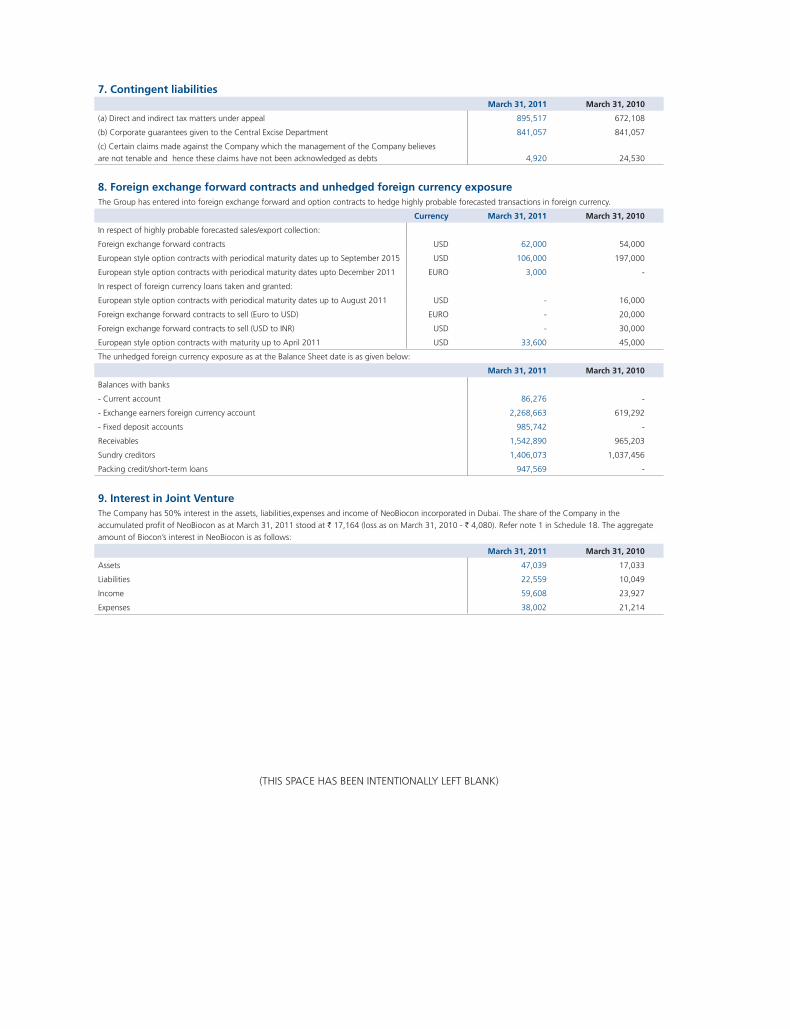
7. Contingent liabilitiesMarch 31, 2011 March 31, 2010
(a) Direct and indirect tax matters under appeal 895,517 672,108
(b) Corporate guarantees given to the Central Excise Department 841,057 841,057
(c) Certain claims made against the Company which the management of the Company believes
are not tenable and hence these claims have not been acknowledged as debts 4,920 24,530
8. Foreign exchange forward contracts and unhedged foreign currency exposureThe Group has entered into foreign exchange forward and option contracts to hedge highly probable forecasted transactions in foreign currency.
Currency March 31, 2011 March 31, 2010
In respect of highly probable forecasted sales/export collection:
Foreign exchange forward contracts USD 62,000 54,000
European style option contracts with periodical maturity dates up to September 2015 USD 106,000 197,000
European style option contracts with periodical maturity dates upto December 2011 EURO 3,000 -
In respect of foreign currency loans taken and granted:
European style option contracts with periodical maturity dates up to August 2011 USD - 16,000
Foreign exchange forward contracts to sell (Euro to USD) EURO - 20,000
Foreign exchange forward contracts to sell (USD to INR) USD - 30,000
European style option contracts with maturity up to April 2011 USD 33,600 45,000
The unhedged foreign currency exposure as at the Balance Sheet date is as given below:
March 31, 2011 March 31, 2010
Balances with banks
- Current account 86,276 -
- Exchange earners foreign currency account 2,268,663 619,292
- Fixed deposit accounts 985,742 -
Receivables 1,542,890 965,203
Sundry creditors 1,406,073 1,037,456
Packing credit/short-term loans 947,569 -
9. Interest in Joint Venture The Company has 50% interest in the assets, liabilities,expenses and income of NeoBiocon incorporated in Dubai. The share of the Company in the
accumulated profit of NeoBiocon as at March 31, 2011 stood at ` 17,164 (loss as on March 31, 2010 - ` 4,080). Refer note 1 in Schedule 18. The aggregate
amount of Biocon’s interest in NeoBiocon is as follows:
March 31, 2011 March 31, 2010
Assets 47,039 17,033
Liabilities 22,559 10,049
Income 59,608 23,927
Expenses 38,002 21,214
(THIS SPACE HAS BEEN INTENTIONALLY LEFT BLANK)
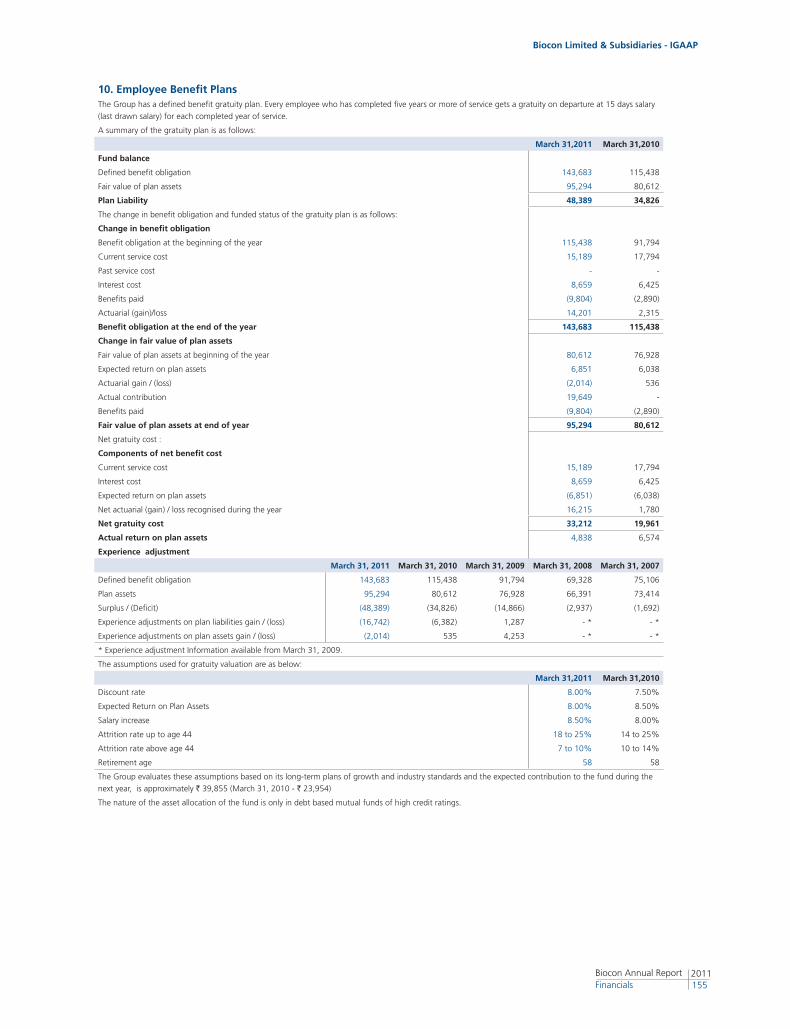
Biocon Limited & Subsidiaries - IGAAP
2011155
Biocon Annual Report Financials
10. Employee Benefit Plans The Group has a defined benefit gratuity plan. Every employee who has completed five years or more of service gets a gratuity on departure at 15 days salary
(last drawn salary) for each completed year of service.
A summary of the gratuity plan is as follows:
March 31,2011 March 31,2010
Fund balance
Defined benefit obligation 143,683 115,438
Fair value of plan assets 95,294 80,612
Plan Liability 48,389 34,826
The change in benefit obligation and funded status of the gratuity plan is as follows:
Change in benefit obligation
Benefit obligation at the beginning of the year 115,438 91,794
Current service cost 15,189 17,794
Past service cost - -
Interest cost 8,659 6,425
Benefits paid (9,804) (2,890)
Actuarial (gain)/loss 14,201 2,315
Benefit obligation at the end of the year 143,683 115,438
Change in fair value of plan assets
Fair value of plan assets at beginning of the year 80,612 76,928
Expected return on plan assets 6,851 6,038
Actuarial gain / (loss) (2,014) 536
Actual contribution 19,649 -
Benefits paid (9,804) (2,890)
Fair value of plan assets at end of year 95,294 80,612
Net gratuity cost :
Components of net benefit cost
Current service cost 15,189 17,794
Interest cost 8,659 6,425
Expected return on plan assets (6,851) (6,038)
Net actuarial (gain) / loss recognised during the year 16,215 1,780
Net gratuity cost 33,212 19,961
Actual return on plan assets 4,838 6,574
Experience adjustment
March 31, 2011 March 31, 2010 March 31, 2009 March 31, 2008 March 31, 2007
Defined benefit obligation 143,683 115,438 91,794 69,328 75,106
Plan assets 95,294 80,612 76,928 66,391 73,414
Surplus / (Deficit) (48,389) (34,826) (14,866) (2,937) (1,692)
Experience adjustments on plan liabilities gain / (loss) (16,742) (6,382) 1,287 - * - *
Experience adjustments on plan assets gain / (loss) (2,014) 535 4,253 - * - *
* Experience adjustment Information available from March 31, 2009.
The assumptions used for gratuity valuation are as below:
March 31,2011 March 31,2010
Discount rate 8.00% 7.50%
Expected Return on Plan Assets 8.00% 8.50%
Salary increase 8.50% 8.00%
Attrition rate up to age 44 18 to 25% 14 to 25%
Attrition rate above age 44 7 to 10% 10 to 14%
Retirement age 58 58
The Group evaluates these assumptions based on its long-term plans of growth and industry standards and the expected contribution to the fund during the
next year, is approximately ` 39,855 (March 31, 2010 - ` 23,954)
The nature of the asset allocation of the fund is only in debt based mutual funds of high credit ratings.
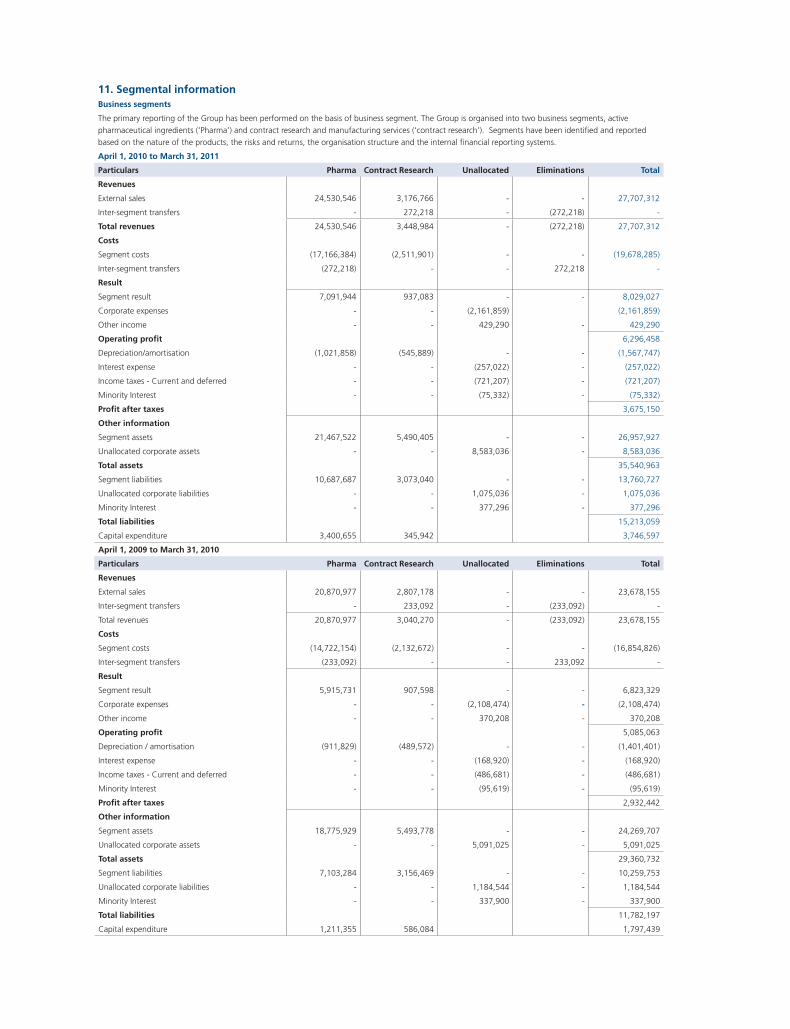
11. Segmental informationBusiness segments
The primary reporting of the Group has been performed on the basis of business segment. The Group is organised into two business segments, active
pharmaceutical ingredients (‘Pharma’) and contract research and manufacturing services (‘contract research’). Segments have been identified and reported
based on the nature of the products, the risks and returns, the organisation structure and the internal financial reporting systems.
April 1, 2010 to March 31, 2011
Particulars Pharma Contract Research Unallocated Eliminations Total
Revenues
External sales 24,530,546 3,176,766 - - 27,707,312
Inter-segment transfers - 272,218 - (272,218) -
Total revenues 24,530,546 3,448,984 - (272,218) 27,707,312
Costs
Segment costs (17,166,384) (2,511,901) - - (19,678,285)
Inter-segment transfers (272,218) - - 272,218 -
Result
Segment result 7,091,944 937,083 - - 8,029,027
Corporate expenses - - (2,161,859) (2,161,859)
Other income - - 429,290 - 429,290
Operating profit 6,296,458
Depreciation/amortisation (1,021,858) (545,889) - - (1,567,747)
Interest expense - - (257,022) - (257,022)
Income taxes - Current and deferred - - (721,207) - (721,207)
Minority Interest - - (75,332) - (75,332)
Profit after taxes 3,675,150
Other information
Segment assets 21,467,522 5,490,405 - - 26,957,927
Unallocated corporate assets - - 8,583,036 - 8,583,036
Total assets 35,540,963
Segment liabilities 10,687,687 3,073,040 - - 13,760,727
Unallocated corporate liabilities - - 1,075,036 - 1,075,036
Minority Interest - - 377,296 - 377,296
Total liabilities 15,213,059
Capital expenditure 3,400,655 345,942 3,746,597
April 1, 2009 to March 31, 2010
Particulars Pharma Contract Research Unallocated Eliminations Total
Revenues
External sales 20,870,977 2,807,178 - - 23,678,155
Inter-segment transfers - 233,092 - (233,092) -
Total revenues 20,870,977 3,040,270 - (233,092) 23,678,155
Costs
Segment costs (14,722,154) (2,132,672) - - (16,854,826)
Inter-segment transfers (233,092) - - 233,092 -
Result
Segment result 5,915,731 907,598 - - 6,823,329
Corporate expenses - - (2,108,474) - (2,108,474)
Other income - - 370,208 - 370,208
Operating profit 5,085,063
Depreciation / amortisation (911,829) (489,572) - - (1,401,401)
Interest expense - - (168,920) - (168,920)
Income taxes - Current and deferred - - (486,681) - (486,681)
Minority Interest - - (95,619) - (95,619)
Profit after taxes 2,932,442
Other information
Segment assets 18,775,929 5,493,778 - - 24,269,707
Unallocated corporate assets - - 5,091,025 - 5,091,025
Total assets 29,360,732
Segment liabilities 7,103,284 3,156,469 - - 10,259,753
Unallocated corporate liabilities - - 1,184,544 - 1,184,544
Minority Interest - - 337,900 - 337,900
Total liabilities 11,782,197
Capital expenditure 1,211,355 586,084 1,797,439
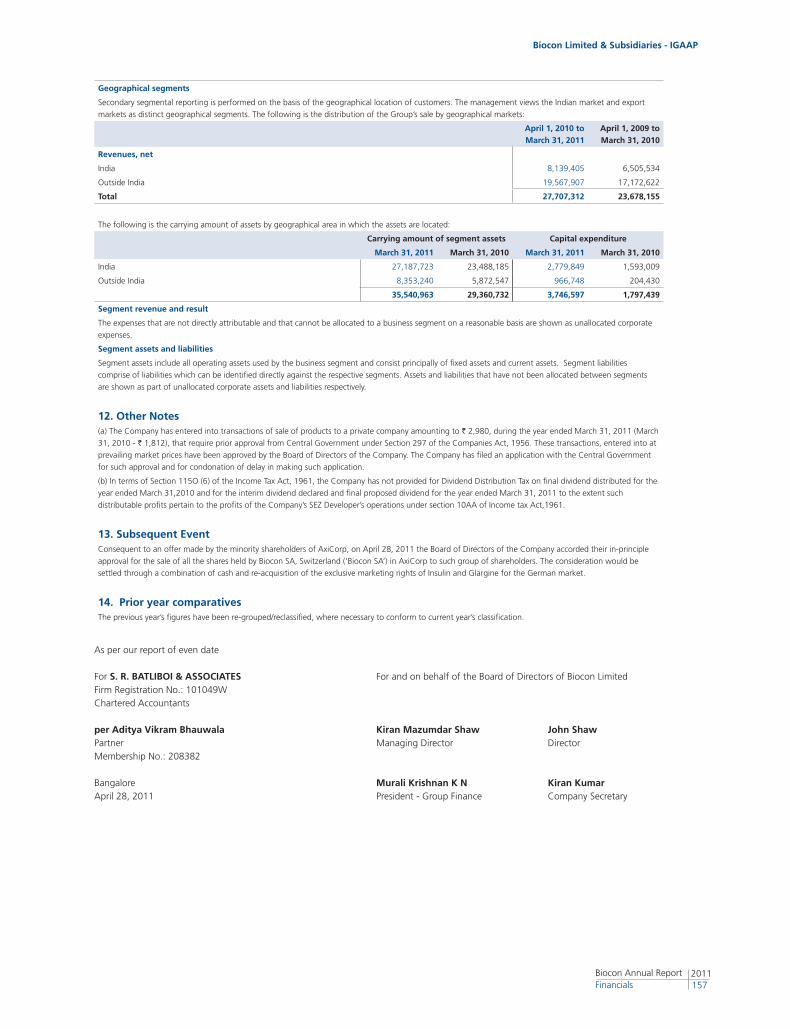
Biocon Limited & Subsidiaries - IGAAP
2011157
Biocon Annual Report Financials
Geographical segments
Secondary segmental reporting is performed on the basis of the geographical location of customers. The management views the Indian market and export
markets as distinct geographical segments. The following is the distribution of the Group’s sale by geographical markets:
April 1, 2010 to March 31, 2011
April 1, 2009 to March 31, 2010
Revenues, net
India 8,139,405 6,505,534
Outside India 19,567,907 17,172,622
Total 27,707,312 23,678,155
The following is the carrying amount of assets by geographical area in which the assets are located:
Carrying amount of segment assets Capital expenditure
March 31, 2011 March 31, 2010 March 31, 2011 March 31, 2010
India 27,187,723 23,488,185 2,779,849 1,593,009
Outside India 8,353,240 5,872,547 966,748 204,430
35,540,963 29,360,732 3,746,597 1,797,439
Segment revenue and result
The expenses that are not directly attributable and that cannot be allocated to a business segment on a reasonable basis are shown as unallocated corporate
expenses.
Segment assets and liabilities
Segment assets include all operating assets used by the business segment and consist principally of fixed assets and current assets. Segment liabilities
comprise of liabilities which can be identified directly against the respective segments. Assets and liabilities that have not been allocated between segments
are shown as part of unallocated corporate assets and liabilities respectively.
12. Other Notes(a) The Company has entered into transactions of sale of products to a private company amounting to ` 2,980, during the year ended March 31, 2011 (March
31, 2010 - ` 1,812), that require prior approval from Central Government under Section 297 of the Companies Act, 1956. These transactions, entered into at
prevailing market prices have been approved by the Board of Directors of the Company. The Company has filed an application with the Central Government
for such approval and for condonation of delay in making such application.
(b) In terms of Section 115O (6) of the Income Tax Act, 1961, the Company has not provided for Dividend Distribution Tax on final dividend distributed for the
year ended March 31,2010 and for the interim dividend declared and final proposed dividend for the year ended March 31, 2011 to the extent such
distributable profits pertain to the profits of the Company’s SEZ Developer’s operations under section 10AA of Income tax Act,1961.
13. Subsequent EventConsequent to an offer made by the minority shareholders of AxiCorp, on April 28, 2011 the Board of Directors of the Company accorded their in-principle
approval for the sale of all the shares held by Biocon SA, Switzerland (‘Biocon SA’) in AxiCorp to such group of shareholders. The consideration would be
settled through a combination of cash and re-acquisition of the exclusive marketing rights of Insulin and Glargine for the German market.
14. Prior year comparativesThe previous year’s figures have been re-grouped/reclassified, where necessary to conform to current year’s classification.
As per our report of even date
For S. R. BATLIBOI & ASSOCIATES For and on behalf of the Board of Directors of Biocon LimitedFirm Registration No.: 101049WChartered Accountants per Aditya Vikram Bhauwala Kiran Mazumdar Shaw John ShawPartner Managing Director DirectorMembership No.: 208382
Bangalore Murali Krishnan K N Kiran KumarApril 28, 2011 President - Group Finance Company Secretary
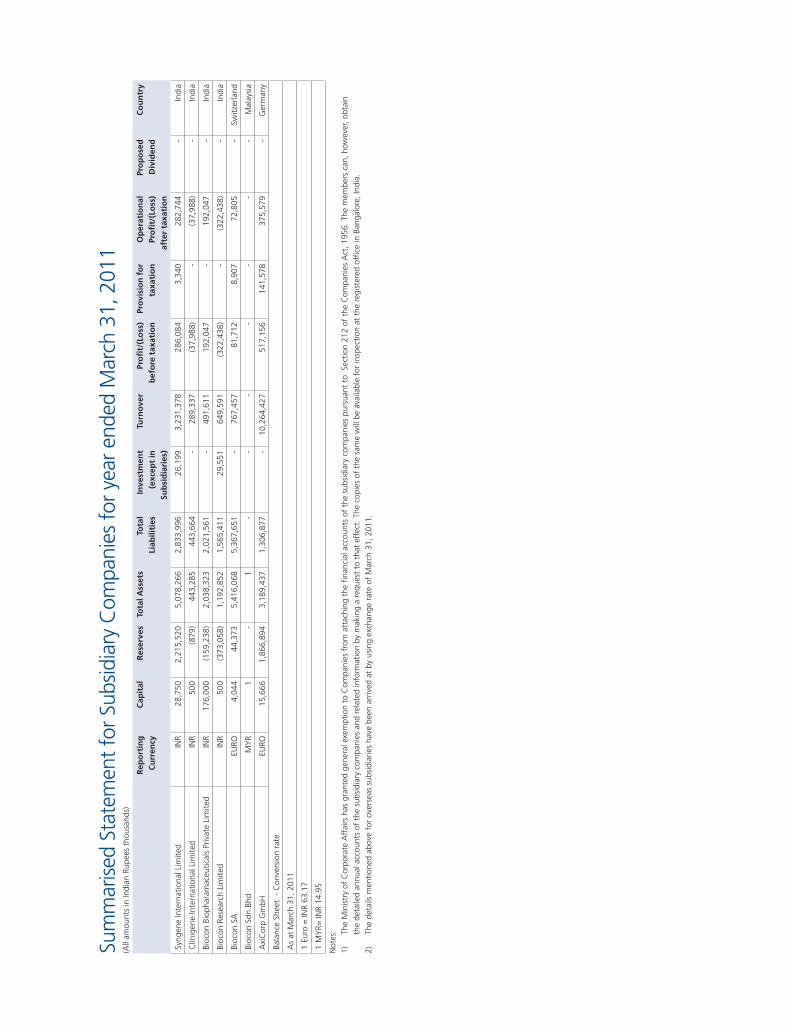
Sum
mar
ised
Sta
tem
ent
for
Subs
idia
ry C
ompa
nies
for
yea
r en
ded
Mar
ch 3
1, 2
011
(All
amou
nts
in In
dian
Rup
ees
thou
sand
s)
Rep
ort
ing
C
urr
ency
Cap
ital
R
eser
ves
Tota
l Ass
ets
Tota
l Li
abili
ties
Inve
stm
ent
(exc
ept
in
Sub
sid
iari
es)
Turn
ove
rPr
ofi
t/(L
oss
) b
efo
re t
axat
ion
Pro
visi
on
fo
r ta
xati
on
Op
erat
ion
al
Pro
fit/
(Lo
ss)
afte
r ta
xati
on
Pro
po
sed
D
ivid
end
Co
un
try
Syng
ene
Inte
rnat
iona
l Lim
ited
INR
28,
750
2,2
15,5
20
5,0
78,2
66
2,8
33,9
96
26,
199
3,2
31,3
78
286
,084
3
,340
2
82,7
44
-
Indi
a
Clin
igen
e In
tern
atio
nal L
imite
dIN
R 5
00
(879
) 4
43,2
85
443
,664
-
2
89,3
37
(37,
988)
-
(37,
988)
-
Indi
a
Bioc
on B
ioph
aram
aceu
tical
s Pr
ivat
e Li
mite
dIN
R 1
76,0
00
(159
,238
) 2
,038
,323
2
,021
,561
-
4
91,6
11
192
,047
-
1
92,0
47
-
Indi
a
Bioc
on R
esea
rch
Lim
ited
INR
500
(3
73,0
58)
1,1
92,8
52
1,5
65,4
11
29,
551
649
,591
(3
22,4
38)
-
(322
,438
) -
In
dia
Bioc
on S
AEU
RO 4
,044
4
4,37
3 5
,416
,068
5
,367
,651
-
7
67,4
57
81,
712
8,9
07
72,
805
-
Sw
itzer
land
Bioc
on S
dn.B
hdM
YR
1
-
1
-
-
-
-
-
-
-
Mal
aysi
a
Axi
Cor
p G
mbH
EURO
15,
666
1,8
66,8
94
3,1
89,4
37
1,3
06,8
77
-
10,
264,
427
517
,156
1
41,5
78
375
,579
-
G
erm
any
Bala
nce
Shee
t -
Con
vers
ion
rate
As
at M
arch
31,
201
1
1 Eu
ro =
INR
63.1
7
1 M
YR=
INR
14.9
5
Not
es:
1)
The
Min
istr
y of
Cor
pora
te A
ffai
rs h
as g
rant
ed g
ener
al e
xem
ptio
n to
Com
pani
es f
rom
att
achi
ng t
he fi
nanc
ial a
ccou
nts
of t
he s
ubsi
diar
y co
mpa
nies
pur
suan
t to
Sec
tion
212
of t
he C
ompa
nies
Act
, 195
6. T
he m
embe
rs c
an, h
owev
er, o
btai
n
the
deta
iled
annu
al a
ccou
nts
of t
he s
ubsi
diar
y co
mpa
nies
and
rel
ated
info
rmat
ion
by m
akin
g a
requ
est
to t
hat
effe
ct. T
he c
opie
s of
the
sam
e w
ill b
e av
aila
ble
for
insp
ectio
n at
the
reg
iste
red
offic
e in
Ban
galo
re, I
ndia
.
2)
The
deta
ils m
entio
ned
abov
e fo
r ov
erse
as s
ubsi
diar
ies
have
bee
n ar
rived
at
by u
sing
exc
hang
e ra
te o
f M
arch
31,
201
1.
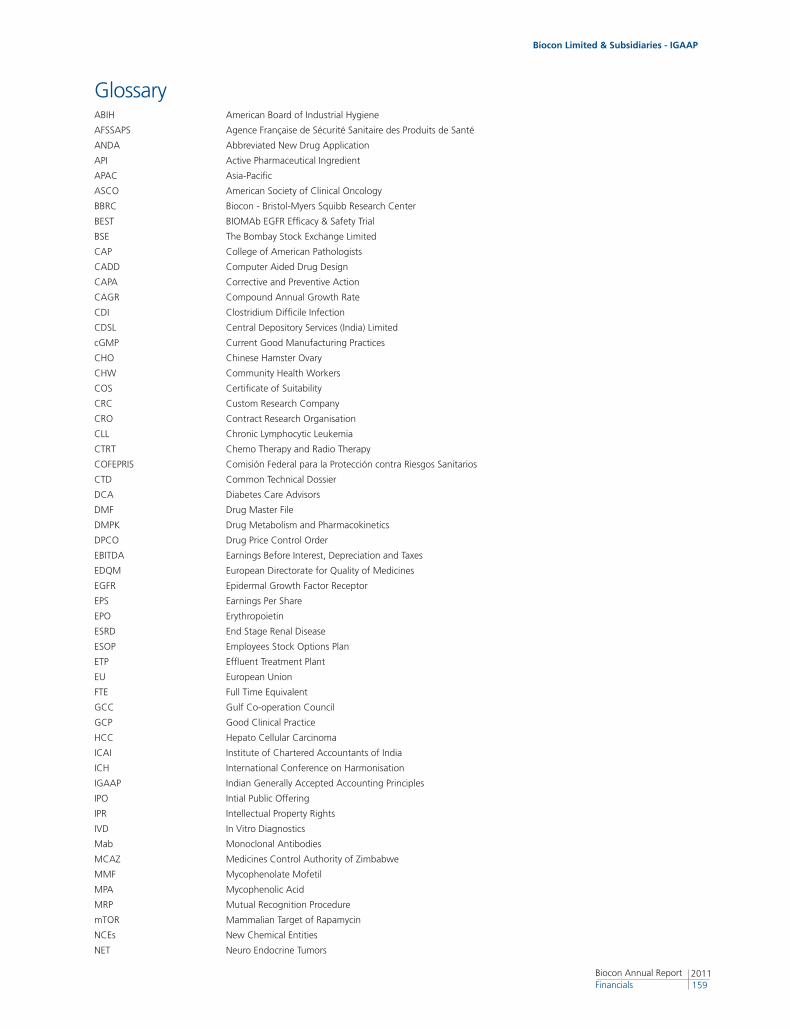
Biocon Limited & Subsidiaries - IGAAP
2011159
Biocon Annual Report Financials
GlossaryABIH American Board of Industrial Hygiene
AFSSAPS Agence Française de Sécurité Sanitaire des Produits de Santé
ANDA Abbreviated New Drug Application
API Active Pharmaceutical Ingredient
APAC Asia-Pacific
ASCO American Society of Clinical Oncology
BBRC Biocon - Bristol-Myers Squibb Research Center
BEST BIOMAb EGFR Efficacy & Safety Trial
BSE The Bombay Stock Exchange Limited
CAP College of American Pathologists
CADD Computer Aided Drug Design
CAPA Corrective and Preventive Action
CAGR Compound Annual Growth Rate
CDI Clostridium Difficile Infection
CDSL Central Depository Services (India) Limited
cGMP Current Good Manufacturing Practices
CHO Chinese Hamster Ovary
CHW Community Health Workers
COS Certificate of Suitability
CRC Custom Research Company
CRO Contract Research Organisation
CLL Chronic Lymphocytic Leukemia
CTRT Chemo Therapy and Radio Therapy
COFEPRIS Comisión Federal para la Protección contra Riesgos Sanitarios
CTD Common Technical Dossier
DCA Diabetes Care Advisors
DMF Drug Master File
DMPK Drug Metabolism and Pharmacokinetics
DPCO Drug Price Control Order
EBITDA Earnings Before Interest, Depreciation and Taxes
EDQM European Directorate for Quality of Medicines
EGFR Epidermal Growth Factor Receptor
EPS Earnings Per Share
EPO Erythropoietin
ESRD End Stage Renal Disease
ESOP Employees Stock Options Plan
ETP Effluent Treatment Plant
EU European Union
FTE Full Time Equivalent
GCC Gulf Co-operation Council
GCP Good Clinical Practice
HCC Hepato Cellular Carcinoma
ICAI Institute of Chartered Accountants of India
ICH International Conference on Harmonisation
IGAAP Indian Generally Accepted Accounting Principles
IPO Intial Public Offering
IPR Intellectual Property Rights
IVD In Vitro Diagnostics
Mab Monoclonal Antibodies
MCAZ Medicines Control Authority of Zimbabwe
MMF Mycophenolate Mofetil
MPA Mycophenolic Acid
MRP Mutual Recognition Procedure
mTOR Mammalian Target of Rapamycin
NCEs New Chemical Entities
NET Neuro Endocrine Tumors
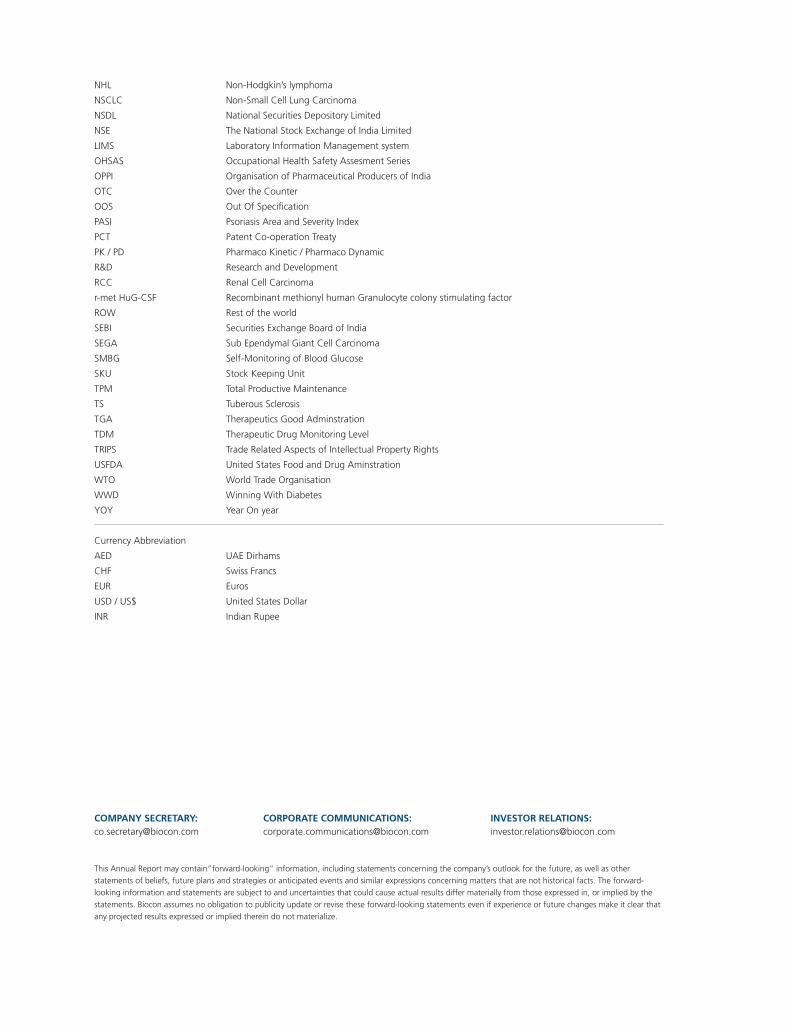
COMPANY SECRETARY: CORPORATE COMMUNICATIONS: INVESTOR RELATIONS:[email protected] [email protected] [email protected]
This Annual Report may contain”forward-looking” information, including statements concerning the company’s outlook for the future, as well as other
statements of beliefs, future plans and strategies or anticipated events and similar expressions concerning matters that are not historical facts. The forward-
looking information and statements are subject to and uncertainties that could cause actual results differ materially from those expressed in, or implied by the
statements. Biocon assumes no obligation to publicity update or revise these forward-looking statements even if experience or future changes make it clear that
any projected results expressed or implied therein do not materialize.
NHL Non-Hodgkin’s lymphoma
NSCLC Non-Small Cell Lung Carcinoma
NSDL National Securities Depository Limited
NSE The National Stock Exchange of India Limited
LIMS Laboratory Information Management system
OHSAS Occupational Health Safety Assesment Series
OPPI Organisation of Pharmaceutical Producers of India
OTC Over the Counter
OOS Out Of Specification
PASI Psoriasis Area and Severity Index
PCT Patent Co-operation Treaty
PK / PD Pharmaco Kinetic / Pharmaco Dynamic
R&D Research and Development
RCC Renal Cell Carcinoma
r-met HuG-CSF Recombinant methionyl human Granulocyte colony stimulating factor
ROW Rest of the world
SEBI Securities Exchange Board of India
SEGA Sub Ependymal Giant Cell Carcinoma
SMBG Self-Monitoring of Blood Glucose
SKU Stock Keeping Unit
TPM Total Productive Maintenance
TS Tuberous Sclerosis
TGA Therapeutics Good Adminstration
TDM Therapeutic Drug Monitoring Level
TRIPS Trade Related Aspects of Intellectual Property Rights
USFDA United States Food and Drug Aminstration
WTO World Trade Organisation
WWD Winning With Diabetes
YOY Year On year
Currency Abbreviation
AED UAE Dirhams
CHF Swiss Francs
EUR Euros
USD / US$ United States Dollar
INR Indian Rupee

Biocon Corporate Communications | tsk design www.tsk-design.comPhotography: Ryan Lobo Mallikarjun Katakol Shibu Arakkal

www.biocon.com
Biocon limited20th KM Hosur Road Electronic City Bangalore 560 100 IndiaT 91 80 2808 2808F 91 80 2852 3423
Biocon Limited
2011 Biocon Annual Report AGM Notice
NOTICE is hereby given that the Thirty Third Annual General Meeting of the members of Biocon Limited will be held on Thursday, July 21, 2011, at 3.30 p.m. at the ‘Sathya Sai Samskruta Sadanam’, No. 20, Hosur Road, Near Forum Mall, Bangalore - 560 029, to transact the following business:
Ordinary Business:
1. To receive, consider, approve and adopt the audited Balance Sheet as at March 31, 2011 and audited Profit & Loss Account for the year ended on that date together with the reports of the Directors and the Auditors thereon.
2. To declare a final dividend of Rs.3.00 per equity share and confirm the payment of interim dividend of Rs. 1.50 per equity share for the year ended 31st March 2011.
3. To appoint a director in place of Dr. Neville Bain who retires by rotation and being eligible, offers himself for re-appointment.
4. To appoint a director in place of Dr. Bala Manian who retires by rotation and being eligible, offers himself for re-appointment.
5. To appoint Statutory Auditors to hold office from the conclusion of this Annual General Meeting until the conclusion of the next Annual General Meeting and to authorise the Board of Directors to fix their remuneration. The retiring auditors M/s S R Batliboi & Associates, Chartered Accountants (Firm registration no: 101049W) are eligible for re-appointment and have confirmed their willingness to accept office, if re-appointed.
Special Business
6. To consider and if thought fit, to pass with or without modification(s), the following resolution as an Ordinary Resolution:
“RESOLVED that Mr. Russell Walls, who was appointed as an Additional Director of the Company by the Board of Directors with effect from 28th April, 2011, in terms of the Section 260 of the Companies Act, 1956 (“the Act”) and Article 74 of the Articles of Association of the Company and in respect of whom the Company having received notice in writing under Section 257 of the Act from a member proposing his candidature, be and is hereby appointed as a Director of the Company and the period of his office shall be liable to determination by retirement of directors by rotation.”
By Order of the Board of Directors For Biocon Limited
Place: Bangalore Kiran Mazumdar-ShawDate: April 28, 2011. Chairman and Managing Director
Registered office:20th KM, Hosur RoadElectronics City P. O.Bangalore - 560 100Karnataka, India
Notice
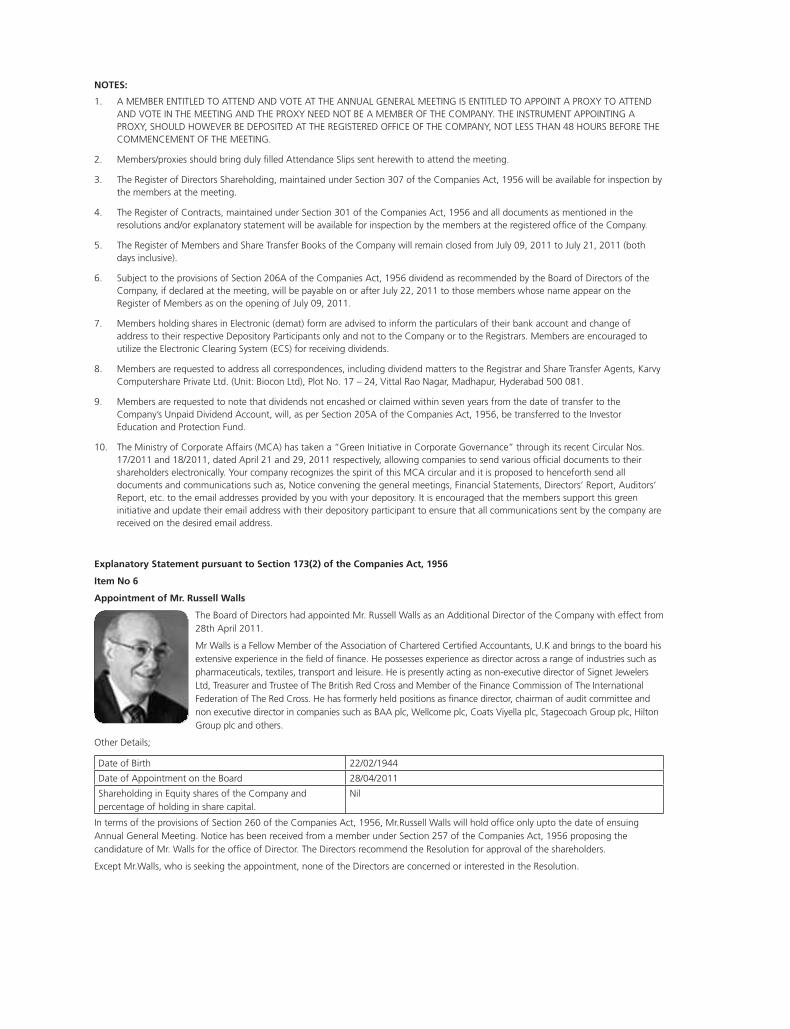
NOTES:
1. A MEMBER ENTITLED TO ATTEND AND VOTE AT THE ANNUAL GENERAL MEETING IS ENTITLED TO APPOINT A PROXY TO ATTEND AND VOTE IN THE MEETING AND THE PROXY NEED NOT BE A MEMBER OF THE COMPANY. THE INSTRUMENT APPOINTING A PROXY, SHOULD HOWEVER BE DEPOSITED AT THE REGISTERED OFFICE OF THE COMPANY, NOT LESS THAN 48 HOURS BEFORE THE COMMENCEMENT OF THE MEETING.
2. Members/proxies should bring duly filled Attendance Slips sent herewith to attend the meeting.
3. The Register of Directors Shareholding, maintained under Section 307 of the Companies Act, 1956 will be available for inspection by the members at the meeting.
4. The Register of Contracts, maintained under Section 301 of the Companies Act, 1956 and all documents as mentioned in the resolutions and/or explanatory statement will be available for inspection by the members at the registered office of the Company.
5. The Register of Members and Share Transfer Books of the Company will remain closed from July 09, 2011 to July 21, 2011 (both days inclusive).
6. Subject to the provisions of Section 206A of the Companies Act, 1956 dividend as recommended by the Board of Directors of the Company, if declared at the meeting, will be payable on or after July 22, 2011 to those members whose name appear on the Register of Members as on the opening of July 09, 2011.
7. Members holding shares in Electronic (demat) form are advised to inform the particulars of their bank account and change of address to their respective Depository Participants only and not to the Company or to the Registrars. Members are encouraged to utilize the Electronic Clearing System (ECS) for receiving dividends.
8. Members are requested to address all correspondences, including dividend matters to the Registrar and Share Transfer Agents, Karvy Computershare Private Ltd. (Unit: Biocon Ltd), Plot No. 17 – 24, Vittal Rao Nagar, Madhapur, Hyderabad 500 081.
9. Members are requested to note that dividends not encashed or claimed within seven years from the date of transfer to the Company’s Unpaid Dividend Account, will, as per Section 205A of the Companies Act, 1956, be transferred to the Investor Education and Protection Fund.
10. The Ministry of Corporate Affairs (MCA) has taken a “Green Initiative in Corporate Governance” through its recent Circular Nos. 17/2011 and 18/2011, dated April 21 and 29, 2011 respectively, allowing companies to send various official documents to their shareholders electronically. Your company recognizes the spirit of this MCA circular and it is proposed to henceforth send all documents and communications such as, Notice convening the general meetings, Financial Statements, Directors’ Report, Auditors’ Report, etc. to the email addresses provided by you with your depository. It is encouraged that the members support this green initiative and update their email address with their depository participant to ensure that all communications sent by the company are received on the desired email address.
Explanatory Statement pursuant to Section 173(2) of the Companies Act, 1956
Item No 6
Appointment of Mr. Russell Walls
The Board of Directors had appointed Mr. Russell Walls as an Additional Director of the Company with effect from 28th April 2011.
Mr Walls is a Fellow Member of the Association of Chartered Certified Accountants, U.K and brings to the board his extensive experience in the field of finance. He possesses experience as director across a range of industries such as pharmaceuticals, textiles, transport and leisure. He is presently acting as non-executive director of Signet Jewelers Ltd, Treasurer and Trustee of The British Red Cross and Member of the Finance Commission of The International Federation of The Red Cross. He has formerly held positions as finance director, chairman of audit committee and non executive director in companies such as BAA plc, Wellcome plc, Coats Viyella plc, Stagecoach Group plc, Hilton Group plc and others.
Other Details;
Date of Birth 22/02/1944
Date of Appointment on the Board 28/04/2011
Shareholding in Equity shares of the Company and percentage of holding in share capital.
Nil
In terms of the provisions of Section 260 of the Companies Act, 1956, Mr.Russell Walls will hold office only upto the date of ensuing Annual General Meeting. Notice has been received from a member under Section 257 of the Companies Act, 1956 proposing the candidature of Mr. Walls for the office of Director. The Directors recommend the Resolution for approval of the shareholders.
Except Mr.Walls, who is seeking the appointment, none of the Directors are concerned or interested in the Resolution.
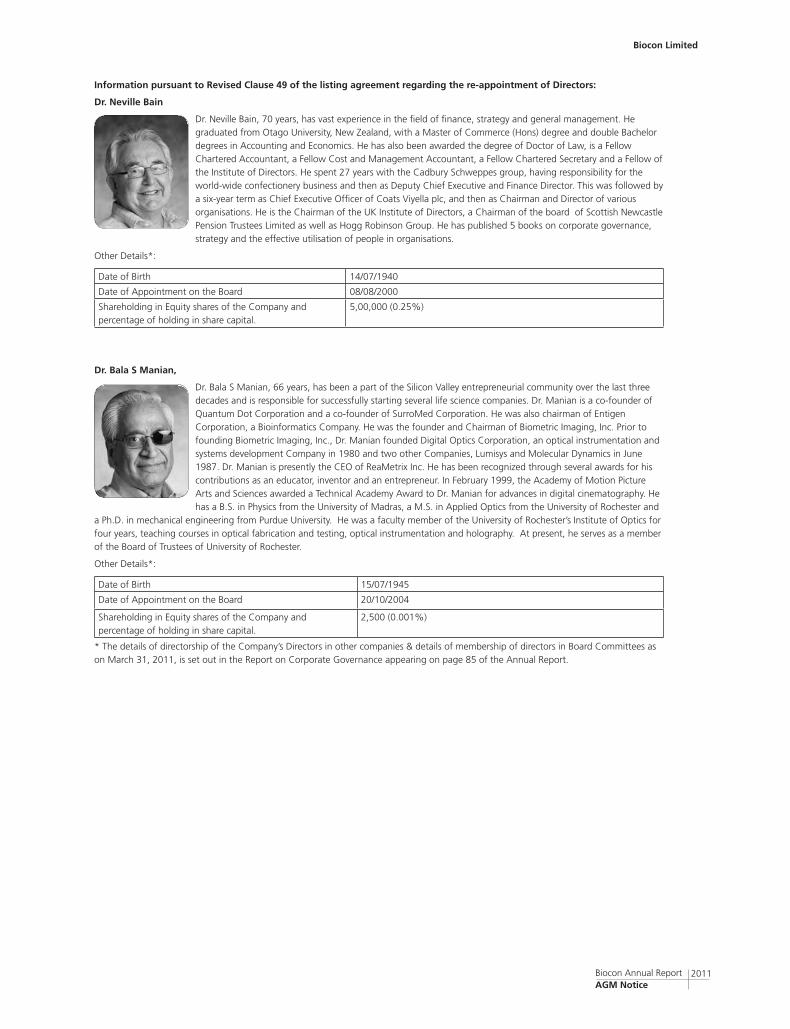
Biocon Limited
2011 Biocon Annual Report AGM Notice
Information pursuant to Revised Clause 49 of the listing agreement regarding the re-appointment of Directors:
Dr. Neville Bain
Dr. Neville Bain, 70 years, has vast experience in the field of finance, strategy and general management. He graduated from Otago University, New Zealand, with a Master of Commerce (Hons) degree and double Bachelor degrees in Accounting and Economics. He has also been awarded the degree of Doctor of Law, is a Fellow Chartered Accountant, a Fellow Cost and Management Accountant, a Fellow Chartered Secretary and a Fellow of the Institute of Directors. He spent 27 years with the Cadbury Schweppes group, having responsibility for the world-wide confectionery business and then as Deputy Chief Executive and Finance Director. This was followed by a six-year term as Chief Executive Officer of Coats Viyella plc, and then as Chairman and Director of various organisations. He is the Chairman of the UK Institute of Directors, a Chairman of the board of Scottish Newcastle Pension Trustees Limited as well as Hogg Robinson Group. He has published 5 books on corporate governance, strategy and the effective utilisation of people in organisations.
Other Details*:
Date of Birth 14/07/1940
Date of Appointment on the Board 08/08/2000
Shareholding in Equity shares of the Company and percentage of holding in share capital.
5,00,000 (0.25%)
Dr. Bala S Manian,
Dr. Bala S Manian, 66 years, has been a part of the Silicon Valley entrepreneurial community over the last three decades and is responsible for successfully starting several life science companies. Dr. Manian is a co-founder of Quantum Dot Corporation and a co-founder of SurroMed Corporation. He was also chairman of Entigen Corporation, a Bioinformatics Company. He was the founder and Chairman of Biometric Imaging, Inc. Prior to founding Biometric Imaging, Inc., Dr. Manian founded Digital Optics Corporation, an optical instrumentation and systems development Company in 1980 and two other Companies, Lumisys and Molecular Dynamics in June 1987. Dr. Manian is presently the CEO of ReaMetrix Inc. He has been recognized through several awards for his contributions as an educator, inventor and an entrepreneur. In February 1999, the Academy of Motion Picture Arts and Sciences awarded a Technical Academy Award to Dr. Manian for advances in digital cinematography. He has a B.S. in Physics from the University of Madras, a M.S. in Applied Optics from the University of Rochester and
a Ph.D. in mechanical engineering from Purdue University. He was a faculty member of the University of Rochester’s Institute of Optics for four years, teaching courses in optical fabrication and testing, optical instrumentation and holography. At present, he serves as a member of the Board of Trustees of University of Rochester.
Other Details*:
Date of Birth 15/07/1945
Date of Appointment on the Board 20/10/2004
Shareholding in Equity shares of the Company and percentage of holding in share capital.
2,500 (0.001%)
* The details of directorship of the Company’s Directors in other companies & details of membership of directors in Board Committees as on March 31, 2011, is set out in the Report on Corporate Governance appearing on page 85 of the Annual Report.
Dear Shareholder,
Sub: Implementing green initiative in corporate governance
The Ministry of Corporate Affairs (MCA) has taken a “Green Initiative in Corporate Governance” by allowing paperless compliances by
Companies through electronic mode, enabling the companies to send various official documents to their shareholders electronically.
Your Company recognizes the spirit of this initiative of MCA and supports this initiative of implementing an environmentally sustainable
way of communication and governance.
It is intended to send all shareholder communications including financial statements and annual reports in electronic form. In addition, the
full text of these reports and documents will also be made available on the Company’s website: www.biocon.com in the Investor Relations
section.
The electronic communication will be sent to your email id provided to us by your Depository Participant (DP). However, as per the records
shared by the Depositories, your email id has not been registered and to enable us to implement the said initiative, we request you to
please register / update your email id with your DP at the earliest.
We thank you for your co-operation in implementing this environmentally friendly initiative of paperless communication.
Yours Truly, For Biocon Limited,
Company Secretarial Team
P.S: Please note that as a member of the company you will be entitled to receive all such communications in physical form, upon request.
Important Shareholder Communication
Biocon Limited
2011 Biocon Annual Report AGM Notice
PROxy FORM
Regd. Folio No. / DP ID/Client ID
I/We…………………………………………………….………............................... of ……………………..….......................………. being a
member/members of Biocon Limited hereby appoint …………………….……………of ……………………….……….…….. as my/our
Proxy or failing him/her…….………...…….. of ……………………….....…….. as my/our proxy to vote for me/us on my/our behalf at the
Thirty Third Annual General Meeting of the Company to be held on Thursday, July 21, 2011 at 3.30 p.m. at ‘Sathya Sai Samskruta
Sadanam’, No. 20, Hosur Road, Near Forum Mall, Bangalore - 560 029, India and at any adjournment(s) thereof.
Signed this…………….. day of…………..2011
Note:
The proxy form in order to be effective, should be duly stamped, completed and deposited at the Registered Office of the Company at 20th KM, Hosur Road, Electronics City P.O., Bangalore - 560 100 not less than 48 hours before the time for holding the meeting.
BIOCON LIMITED20th K M, Hosur Road, Electronics City P.O., Bangalore – 560 100.
Affix1 RupeeRevenueStamp
ATTENDANCE SLIP
Thirty Third Annual General Meeting – July 21, 2011
Regd. Folio No./ DP ID/ Client ID
No. of shares held
I certify that I am registered shareholder/proxy for the registered shareholder of the Company. I hereby record my presence at the Thirty Third Annual General Meeting of the Company held on Thursday, July 21, 2011 at 3.30 p.m. at ‘Sathya Sai Samskruta Sadanam’, No. 20, Hosur Road, near Forum Mall, Bangalore - 560 029.
____________________________ ____________________________Name of the member/proxy Signature of member/proxy(in BLOCK letters)
Note:
Please fill up this attendance slip and hand it over at the entrance of the meeting hall.
Cut Here
BIOCON LIMITED20th K M, Hosur Road, Electronics City P.O., Bangalore – 560 100.

(THIS PAGE HAS BEEN INTENTIONALLY LEFT BLANK)