Embed Size (px)
Citation preview
Background Research Paper: Biodiversity and Ecosystem Health South Africa Environment Outlook October 2005
1
NATIONAL STATE OF THE ENVIRONMENT PROJECT
BIODIVERSITY AND ECOSYSTEM HEALTH
Background Research Paper produced for the South Africa Environment Outlook report on behalf of the Department of
Environmental Affairs and Tourism
Original Text and Research By: Dr Nick King, Tessa Rosmarin, Yolan Friedmann
Endangered Wildlife Trust &
Dr Belinda Reyers Council for Scientific and Industrial Research
Original Peer Review: Prof Richard Cowling
Nelson Mandela Metropolitan University &
Prof Albert van Jaarsveld Stellenbosch University
& Kristal Maze
South African National Biodiversity Institute
Additional Research, Editing and Integrative Writing: Dr Caroline Henderson, Donald Gibson
SRK Consulting &
Ester Koch Department of Environmental Affairs and Tourism
October 2005
Background Research Paper: Biodiversity and Ecosystem Health South Africa Environment Outlook October 2005
2
Disclaimer
This specialist study was commissioned by SRK Consulting (SRK) on behalf of the Department of Environmental Affairs and Tourism (DEAT) as part of the National State
of the Environment Reporting Programme. The material has been used in the compilation of the South Africa Environment Outlook report. The views it contains are
not necessarily the views of DEAT or SRK. The DEAT and SRK do not accept responsibility in respect of any information or advice given in relation to or as a
consequence of anything contained herein.
Background Research Paper: Biodiversity and Ecosystem Health South Africa Environment Outlook October 2005
3
5 BIODIVERSITY AND ECOSYSTEM HEALTH TABLE OF CONTENTS 5.1 WHAT IS BIODIVERSITY? ........................................................................................................4 5.2 WHAT CAUSES LOSS OF BIODIVERSITY AND ECOSYSTEM HEALTH? ...................8
5.2.1 LOSS, FRAGMENTATION AND DEGRADATION OF NATURAL HABITAT ...........................................8 5.2.2 INVASIVE ALIEN SPECIES............................................................................................................11 5.2.3 OVER-EXPLOITATION OF NATURAL RESOURCES .........................................................................13 5.2.4 CLIMATE CHANGE .......................................................................................................................15
5.3 THE STATE OF SOUTH AFRICA’S ECOSYSTEMS ...........................................................17 5.3.1 TERRESTRIAL ECOSYSTEMS ........................................................................................................17 5.3.2 RIVER ECOSYSTEMS ....................................................................................................................18 5.3.3 WETLANDS..................................................................................................................................19 5.3.4 ESTUARINE ECOSYSTEMS............................................................................................................21 5.3.5 MARINE ECOSYSTEMS.................................................................................................................22
5.4 STATUS OF SPECIES.................................................................................................................24 5.4.1 TERRESTRIAL SPECIES.................................................................................................................24 5.4.2 FRESHWATER SPECIES.................................................................................................................25 5.4.3 WETLAND SPECIES ......................................................................................................................26 5.4.4 ESTUARINE SPECIES ....................................................................................................................26 5.4.5 MARINE SPECIES .........................................................................................................................27
5.5 WHAT IMPACTS DO THESE ISSUES HAVE? .....................................................................28 5.5.1 OPPORTUNITY COSTS ..................................................................................................................28
5.6 WHAT ARE WE DOING ABOUT IT? .....................................................................................28 5.6.1 INTERNATIONAL AGREEMENTS AND OBLIGATIONS.....................................................................29 5.6.2 NATIONAL POLICY AND LEGISLATION ........................................................................................30 5.6.3 CONTROL AND REHABILITATION PROGRAMMES ........................................................................31 5.6.4 NATIONAL, PROVINCIAL AND LOCAL GOVERNMENT AND DEPARTMENTS ..................................32 5.6.5 BIOREGIONAL PLANS...................................................................................................................32 5.6.6 NGOS AND THE PRIVATE SECTOR ...............................................................................................33 5.6.7 CONSERVATION ON PRIVATE AND COMMUNAL LAND.................................................................33 5.6.8 CROSS-CUTTING PROGRAMMES AND PROJECTS ..........................................................................34
5.7 CONCLUSIONS ...........................................................................................................................34 5.7.1 PRIORITY AREAS..........................................................................................................................34 5.7.2 REDUCING THE RATE OF BIODIVERSITY LOSS (THE 2010 BIODIVERSITY TARGET) ....................34 5.7.3 IMPROVEMENT OF DATA BASE ....................................................................................................35 5.7.4 POSITIVE MESSAGES....................................................................................................................35
5.8 REFERENCES..............................................................................................................................36
Background Research Paper: Biodiversity and Ecosystem Health South Africa Environment Outlook October 2005
4
5.1 WHAT IS BIODIVERSITY? South Africa is one of the most biologically diverse countries in the world and has a rich and spectacular array of terrestrial, aquatic and marine ecosystems1,2. These resources underpin the livelihoods of the majority of South Africans and contribute significantly to the country’s economy3. Nevertheless, South Africa’s biodiversity is increasingly threatened by human activities, which in turn threaten the very resource base upon which we depend2. This chapter attempts to synthesize information on the current state of our biodiversity, the impacts of human activities on this state and reviews existing responses to these impacts.
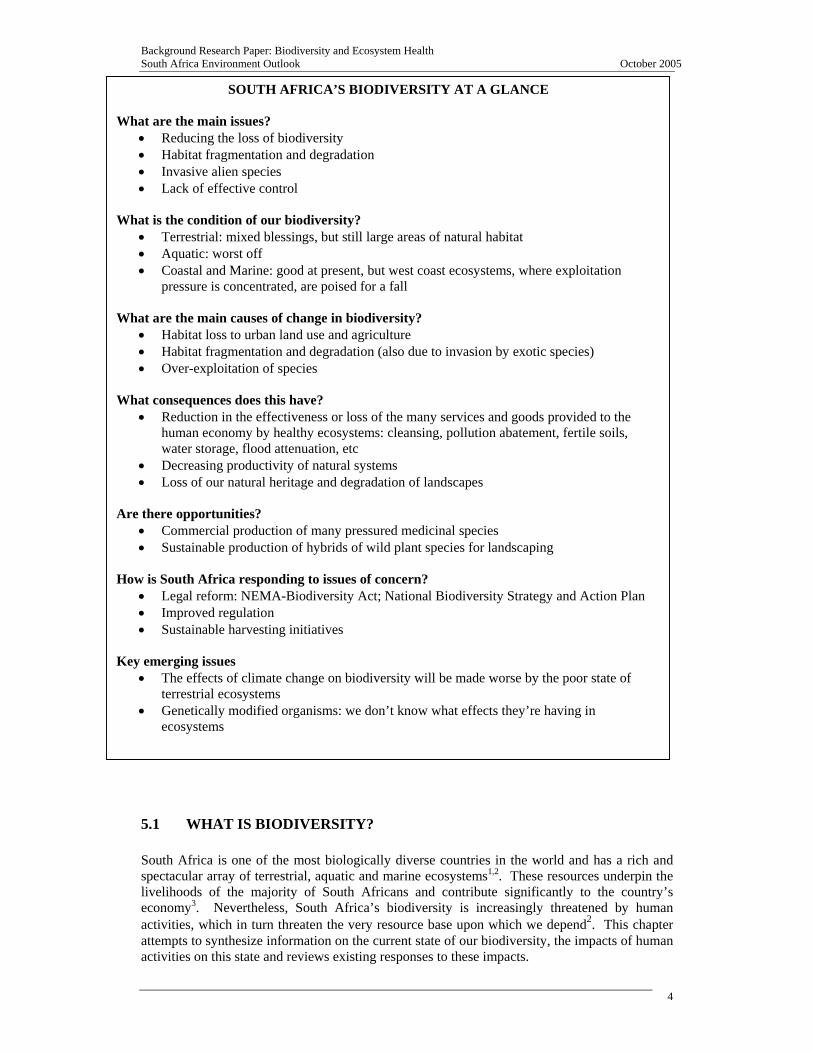
SOUTH AFRICA’S BIODIVERSITY AT A GLANCE
What are the main issues? • Reducing the loss of biodiversity • Habitat fragmentation and degradation • Invasive alien species • Lack of effective control
What is the condition of our biodiversity?
• Terrestrial: mixed blessings, but still large areas of natural habitat • Aquatic: worst off • Coastal and Marine: good at present, but west coast ecosystems, where exploitation
pressure is concentrated, are poised for a fall
What are the main causes of change in biodiversity? • Habitat loss to urban land use and agriculture • Habitat fragmentation and degradation (also due to invasion by exotic species) • Over-exploitation of species
What consequences does this have?
• Reduction in the effectiveness or loss of the many services and goods provided to the human economy by healthy ecosystems: cleansing, pollution abatement, fertile soils, water storage, flood attenuation, etc
• Decreasing productivity of natural systems • Loss of our natural heritage and degradation of landscapes
Are there opportunities?
• Commercial production of many pressured medicinal species • Sustainable production of hybrids of wild plant species for landscaping
How is South Africa responding to issues of concern?
• Legal reform: NEMA-Biodiversity Act; National Biodiversity Strategy and Action Plan • Improved regulation • Sustainable harvesting initiatives
Key emerging issues
• The effects of climate change on biodiversity will be made worse by the poor state of terrestrial ecosystems
• Genetically modified organisms: we don’t know what effects they’re having in ecosystems
Background Research Paper: Biodiversity and Ecosystem Health South Africa Environment Outlook October 2005
5
0
2000
4000
6000
8000
10000
Plants0
200
400
600
800
1000
Mammals Birds Reptiles Amphibians
FynbosForestSucculent KarooNama KarooSavannaThicketGrassland
So what is biodiversity or biological diversity? It is the variability within and between all living organisms, from the genetic level to the ecological complexes (or ecosystems) of which they are part (National Environmental Management: Biodiversity Act (No. 10 of 2004) (NEMBA). Thus, loss and degradation of ecosystems or habitats amount to losses of biodiversity.
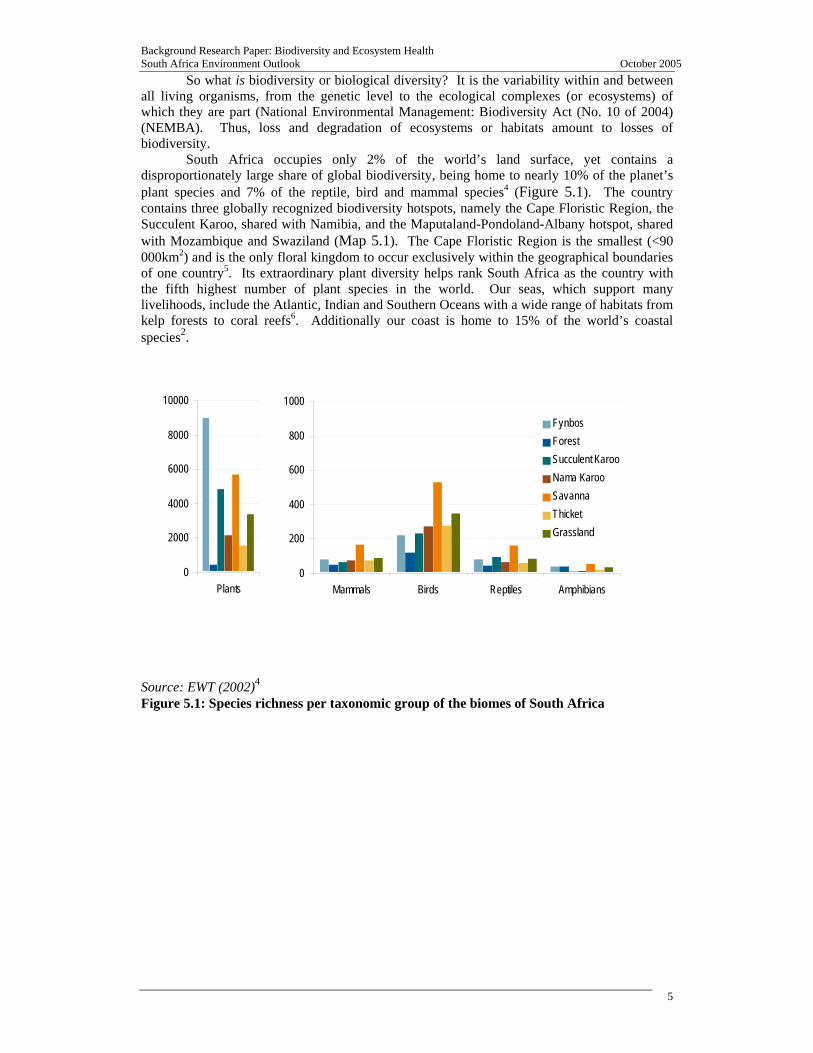
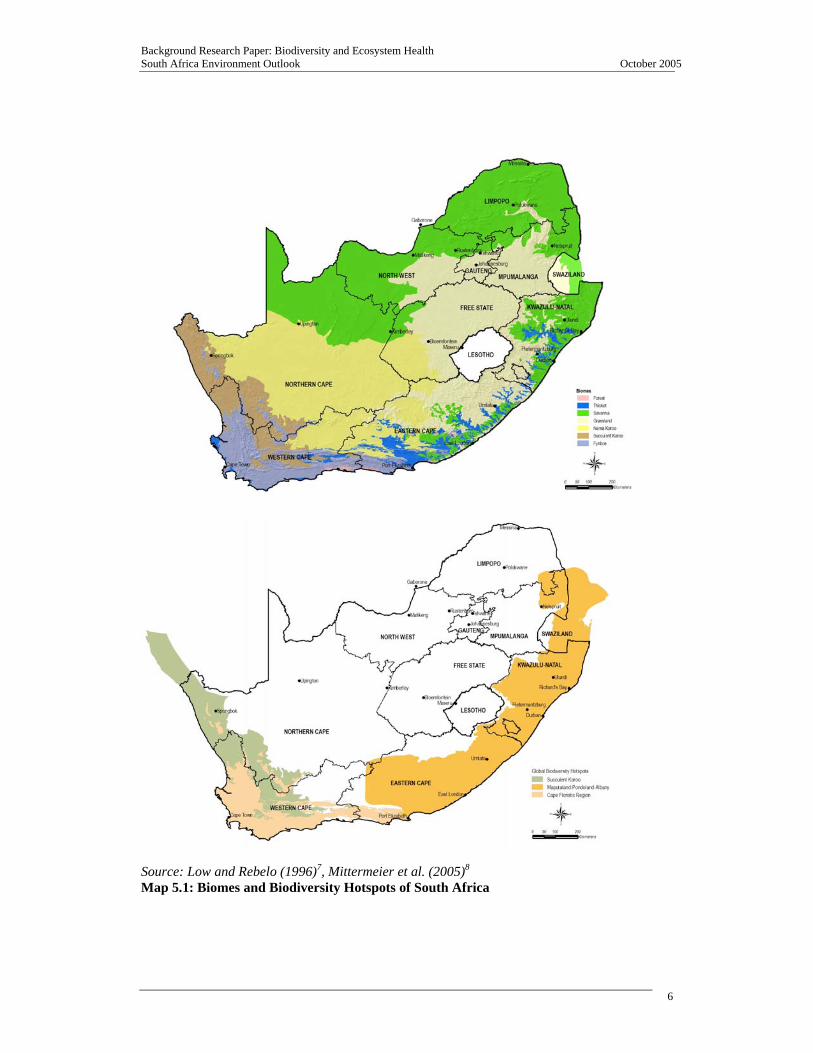
South Africa occupies only 2% of the world’s land surface, yet contains a disproportionately large share of global biodiversity, being home to nearly 10% of the planet’s plant species and 7% of the reptile, bird and mammal species4 (Figure 5.1). The country contains three globally recognized biodiversity hotspots, namely the Cape Floristic Region, the Succulent Karoo, shared with Namibia, and the Maputaland-Pondoland-Albany hotspot, shared with Mozambique and Swaziland (Map 5.1). The Cape Floristic Region is the smallest (<90 000km2) and is the only floral kingdom to occur exclusively within the geographical boundaries of one country5. Its extraordinary plant diversity helps rank South Africa as the country with the fifth highest number of plant species in the world. Our seas, which support many livelihoods, include the Atlantic, Indian and Southern Oceans with a wide range of habitats from kelp forests to coral reefs6. Additionally our coast is home to 15% of the world’s coastal species2.
Source: EWT (2002)4 Figure 5.1: Species richness per taxonomic group of the biomes of South Africa
Background Research Paper: Biodiversity and Ecosystem Health South Africa Environment Outlook October 2005
6
Source: Low and Rebelo (1996)7, Mittermeier et al. (2005)8 Map 5.1: Biomes and Biodiversity Hotspots of South Africa
Background Research Paper: Biodiversity and Ecosystem Health South Africa Environment Outlook October 2005
7
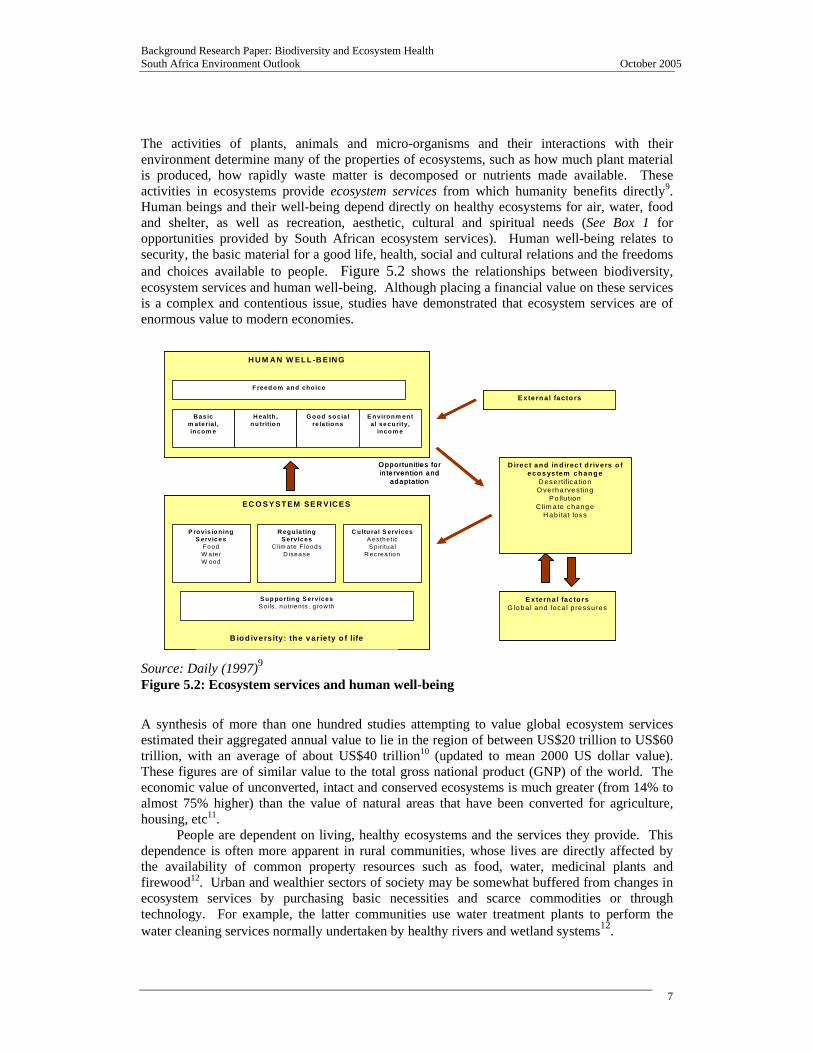
The activities of plants, animals and micro-organisms and their interactions with their environment determine many of the properties of ecosystems, such as how much plant material is produced, how rapidly waste matter is decomposed or nutrients made available. These activities in ecosystems provide ecosystem services from which humanity benefits directly9. Human beings and their well-being depend directly on healthy ecosystems for air, water, food and shelter, as well as recreation, aesthetic, cultural and spiritual needs (See Box 1 for opportunities provided by South African ecosystem services). Human well-being relates to security, the basic material for a good life, health, social and cultural relations and the freedoms and choices available to people. Figure 5.2 shows the relationships between biodiversity, ecosystem services and human well-being. Although placing a financial value on these services is a complex and contentious issue, studies have demonstrated that ecosystem services are of enormous value to modern economies. Source: Daily (1997)9 Figure 5.2: Ecosystem services and human well-being
A synthesis of more than one hundred studies attempting to value global ecosystem services estimated their aggregated annual value to lie in the region of between US$20 trillion to US$60 trillion, with an average of about US$40 trillion10 (updated to mean 2000 US dollar value). These figures are of similar value to the total gross national product (GNP) of the world. The economic value of unconverted, intact and conserved ecosystems is much greater (from 14% to almost 75% higher) than the value of natural areas that have been converted for agriculture, housing, etc11.
People are dependent on living, healthy ecosystems and the services they provide. This dependence is often more apparent in rural communities, whose lives are directly affected by the availability of common property resources such as food, water, medicinal plants and firewood12. Urban and wealthier sectors of society may be somewhat buffered from changes in ecosystem services by purchasing basic necessities and scarce commodities or through technology. For example, the latter communities use water treatment plants to perform the water cleaning services normally undertaken by healthy rivers and wetland systems12.
EC O SY ST EM SER VIC ES
P rovis io n ing S ervic es
Fo odW aterW ood
R egula ting S ervic es
C lim ate F loods D isea se
C ultu ral S ervicesA estheticS p iritua l
R ec rea tion
S up porting S ervicesS oils , nutrien ts , grow th
H U M AN W ELL -B EIN G
B as ic m ateria l, incom e
H ealth , nu trition
G o od so cia l re la tion s
E nvironm ental se curity,
inco m e
F reed om and choic e
D ire ct an d in d irec t d rivers o f e co s ystem ch an g e
D esertifica tionO ve rharve sting
P o llu tionC lim ate change
H ab itat loss
B iod iversity: the variety o f life
E x tern a l fac torsG loba l and local p ressures
E xte rn a l fac to rs
O ppo rtun ities fo r in te rvention and
adapta tion
Background Research Paper: Biodiversity and Ecosystem Health South Africa Environment Outlook October 2005
8
5.2 WHAT CAUSES LOSS OF BIODIVERSITY AND ECOSYSTEM HEALTH?
Current and predicted future pressures on declines in ecosystem health include loss of natural habitat (which includes land use changesa, loss of coral reefs, and damage to sea floors due to trawling), climate change, invasion by alien species, modification of rivers, water abstraction, external inputs of nutrient loading and pollution, over-exploitation (of, for example, fish stocks) and other factors. The relative importance of these pressures differs considerably amongst ecosystems13, but all are likely to contribute to continued species’ population decline and biodiversity loss over the next few decades. Humans and their activities currently dominate all ecosystem functions in South Africa. The sections below outline the main drivers of change to and their impacts on South African ecosystem health. Some pressures are dealt with more extensively in other chapters, e.g. pollution and water abstraction (see Inland Water, Marine and Coastal and Atmosphere Chapters)
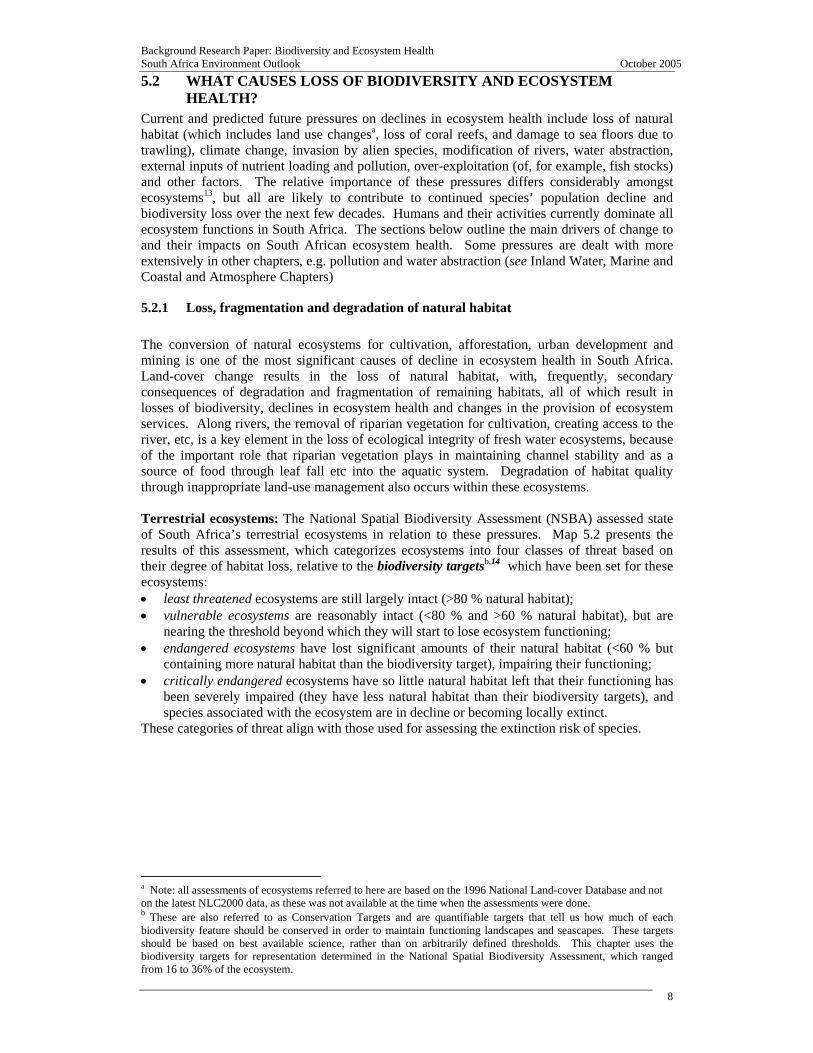
5.2.1 Loss, fragmentation and degradation of natural habitat The conversion of natural ecosystems for cultivation, afforestation, urban development and mining is one of the most significant causes of decline in ecosystem health in South Africa. Land-cover change results in the loss of natural habitat, with, frequently, secondary consequences of degradation and fragmentation of remaining habitats, all of which result in losses of biodiversity, declines in ecosystem health and changes in the provision of ecosystem services. Along rivers, the removal of riparian vegetation for cultivation, creating access to the river, etc, is a key element in the loss of ecological integrity of fresh water ecosystems, because of the important role that riparian vegetation plays in maintaining channel stability and as a source of food through leaf fall etc into the aquatic system. Degradation of habitat quality through inappropriate land-use management also occurs within these ecosystems. Terrestrial ecosystems: The National Spatial Biodiversity Assessment (NSBA) assessed state of South Africa’s terrestrial ecosystems in relation to these pressures. Map 5.2 presents the results of this assessment, which categorizes ecosystems into four classes of threat based on their degree of habitat loss, relative to the biodiversity targetsb,14 which have been set for these ecosystems: • least threatened ecosystems are still largely intact (>80 % natural habitat); • vulnerable ecosystems are reasonably intact (<80 % and >60 % natural habitat), but are
nearing the threshold beyond which they will start to lose ecosystem functioning; • endangered ecosystems have lost significant amounts of their natural habitat (<60 % but
containing more natural habitat than the biodiversity target), impairing their functioning; • critically endangered ecosystems have so little natural habitat left that their functioning has
been severely impaired (they have less natural habitat than their biodiversity targets), and species associated with the ecosystem are in decline or becoming locally extinct.
These categories of threat align with those used for assessing the extinction risk of species. a Note: all assessments of ecosystems referred to here are based on the 1996 National Land-cover Database and not on the latest NLC2000 data, as these was not available at the time when the assessments were done. b These are also referred to as Conservation Targets and are quantifiable targets that tell us how much of each biodiversity feature should be conserved in order to maintain functioning landscapes and seascapes. These targets should be based on best available science, rather than on arbitrarily defined thresholds. This chapter uses the biodiversity targets for representation determined in the National Spatial Biodiversity Assessment, which ranged from 16 to 36% of the ecosystem.
Background Research Paper: Biodiversity and Ecosystem Health South Africa Environment Outlook October 2005
9
Source: Driver et al (2005)2 Map 5.2: Ecosystem status of terrestrial ecosystems
34% of terrestrial ecosystems are rated as threatened (= vulnerable + endangered + critically endangered categories). These threatened ecosystems lie primarily within the South Western Cape’s fynbos biome, the central grasslands and the eastern coastal regions of South Africa. Of these: • 21 terrestrial ecosystems (5%) are critically endangered; 14 of these are in the Fynbos
biome, five are in the Forest biome; one is in the Grassland biome and one is a wetland vegetation type.
• 58 terrestrial ecosystems (13%) are endangered; most are in the Grassland and Savanna biomes.
• 70 terrestrial ecosystems (16%) are vulnerable; most are in the Fynbos and Grassland biomes.
An assessment of habitat fragmentation in South Africa highlights 17 vegetation types as being highly fragmented, occurring especially in the Western Cape Province (most Fynbos vegetation types, e.g. Renosterveld), and in the Grasslands and KwaZulu-Natal Coastal Belt15 (Table 5.1). However, other than the magisterial district-level estimates of land degradation by Hoffman et al.(1999)16 (see Land Chapter), we do not have adequate data to assess the state of habitat degradation throughout the country at a finer scale. This data gap is critical, as the impacts of degradation on biodiversity are significant2. These results should thus be interpreted with caution, as they are likely to underestimate the pressures facing habitats.
Background Research Paper: Biodiversity and Ecosystem Health South Africa Environment Outlook October 2005
10
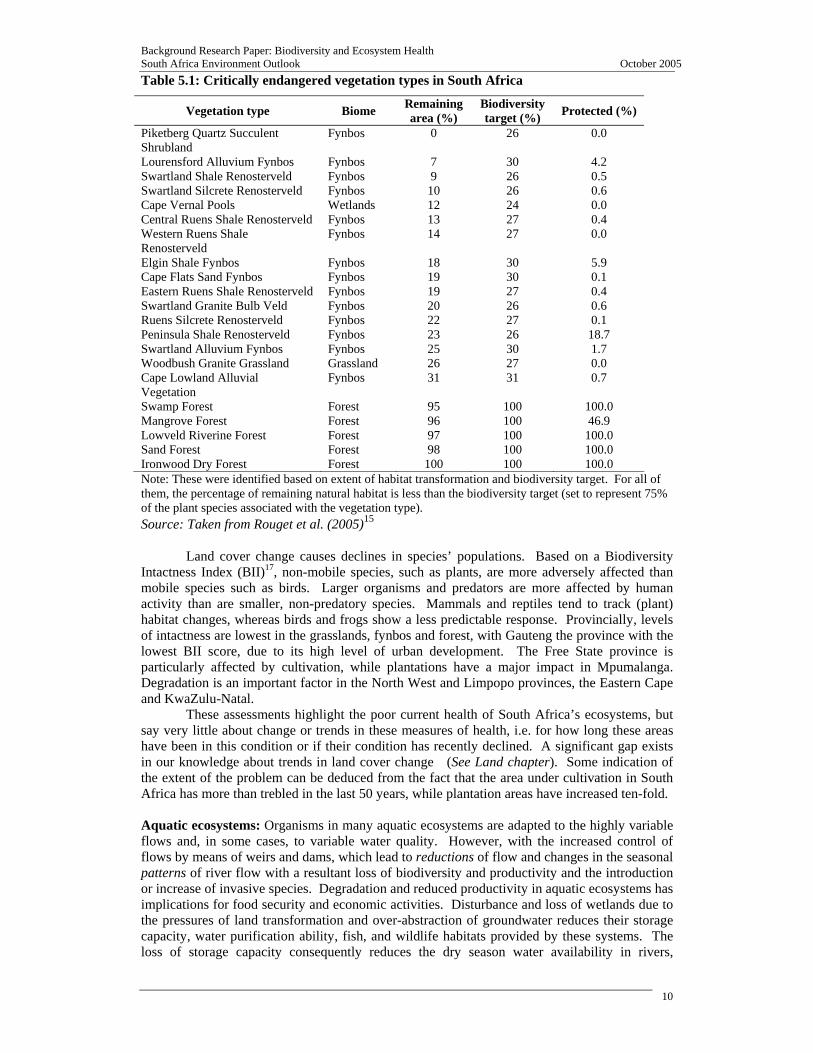
Table 5.1: Critically endangered vegetation types in South Africa
Vegetation type Biome Remaining area (%)
Biodiversity target (%) Protected (%)
Piketberg Quartz Succulent Shrubland
Fynbos 0 26 0.0
Lourensford Alluvium Fynbos Fynbos 7 30 4.2 Swartland Shale Renosterveld Fynbos 9 26 0.5 Swartland Silcrete Renosterveld Fynbos 10 26 0.6 Cape Vernal Pools Wetlands 12 24 0.0 Central Ruens Shale Renosterveld Fynbos 13 27 0.4 Western Ruens Shale Renosterveld
Fynbos 14 27 0.0
Elgin Shale Fynbos Fynbos 18 30 5.9 Cape Flats Sand Fynbos Fynbos 19 30 0.1 Eastern Ruens Shale Renosterveld Fynbos 19 27 0.4 Swartland Granite Bulb Veld Fynbos 20 26 0.6 Ruens Silcrete Renosterveld Fynbos 22 27 0.1 Peninsula Shale Renosterveld Fynbos 23 26 18.7 Swartland Alluvium Fynbos Fynbos 25 30 1.7 Woodbush Granite Grassland Grassland 26 27 0.0 Cape Lowland Alluvial Vegetation
Fynbos 31 31 0.7
Swamp Forest Forest 95 100 100.0 Mangrove Forest Forest 96 100 46.9 Lowveld Riverine Forest Forest 97 100 100.0 Sand Forest Forest 98 100 100.0 Ironwood Dry Forest Forest 100 100 100.0 Note: These were identified based on extent of habitat transformation and biodiversity target. For all of them, the percentage of remaining natural habitat is less than the biodiversity target (set to represent 75% of the plant species associated with the vegetation type). Source: Taken from Rouget et al. (2005)15
Land cover change causes declines in species’ populations. Based on a Biodiversity Intactness Index (BII)17, non-mobile species, such as plants, are more adversely affected than mobile species such as birds. Larger organisms and predators are more affected by human activity than are smaller, non-predatory species. Mammals and reptiles tend to track (plant) habitat changes, whereas birds and frogs show a less predictable response. Provincially, levels of intactness are lowest in the grasslands, fynbos and forest, with Gauteng the province with the lowest BII score, due to its high level of urban development. The Free State province is particularly affected by cultivation, while plantations have a major impact in Mpumalanga. Degradation is an important factor in the North West and Limpopo provinces, the Eastern Cape and KwaZulu-Natal.
These assessments highlight the poor current health of South Africa’s ecosystems, but say very little about change or trends in these measures of health, i.e. for how long these areas have been in this condition or if their condition has recently declined. A significant gap exists in our knowledge about trends in land cover change (See Land chapter). Some indication of the extent of the problem can be deduced from the fact that the area under cultivation in South Africa has more than trebled in the last 50 years, while plantation areas have increased ten-fold.
Aquatic ecosystems: Organisms in many aquatic ecosystems are adapted to the highly variable flows and, in some cases, to variable water quality. However, with the increased control of flows by means of weirs and dams, which lead to reductions of flow and changes in the seasonal patterns of river flow with a resultant loss of biodiversity and productivity and the introduction or increase of invasive species. Degradation and reduced productivity in aquatic ecosystems has implications for food security and economic activities. Disturbance and loss of wetlands due to the pressures of land transformation and over-abstraction of groundwater reduces their storage capacity, water purification ability, fish, and wildlife habitats provided by these systems. The loss of storage capacity consequently reduces the dry season water availability in rivers,
Background Research Paper: Biodiversity and Ecosystem Health South Africa Environment Outlook October 2005
11
resulting in longer drier periods and, conversely, more intense flows in the wet season, which exacerbate flooding. Coastal ecosystems: Development pressure and land use change is a major cause of coastal habitat modification and loss. As much as 40% of South Africa’s population live within 100 km of the coast, resulting in substantial development pressure for infrastructure, housing, roads etc, although there was only a small change in population densities within coastal provinces at a municipal level between the 1996 and 2001 censuses.
The National Land Cover Database18 classifies the current state of coastal land in South Africa as natural, degraded, urban or agricultural. Not surprisingly, the sparsely populated Namakwa region has the highest percentage natural land cover (98%) with Cacadu (92%), Eden (76%) and Amatole (75%) districts also having high percentages of natural land. The Nelson Mandela, Namakwa and Overberg regions have only 1% degraded land, while the West Coast has a mere 2% total land cover classified as degraded. By contrast, the O. R. Tambo region in the Eastern Cape has the highest percentage degraded land (20%) in South Africa.
The areas of natural or undeveloped coastal land in South Africa are increasingly under threat from • large-scale urban developments, mostly residential or recreational estates (e.g. golf estates); • constructing new or expanding existing harbours or ports; • industrial development, e.g. Coega Industrial Development Zone, a new export processing
zone being built on a greenfields site (in combination with the new, deep water Ngqura harbour whose development will require the dredging of an estuary)
5.2.2 Invasive Alien Species An ‘alien’ species is one that has been introduced, by deliberate or accidental human action, into an area in which it did not previously occur (‘indigenous’ species, by contrast, are native to a given place). In today’s globalized world, where travel and transport of goods are fast, easy and increasing, species are spread effortlessly between countries and continents. Whilst not all alien species thrive in their new environments, some do, becoming ‘invasive’, spreading at the expense of indigenous species and causing significant changes to habitats and ecosystem functioning. One of the main reasons why alien species flourish is because “they are no longer controlled by their natural predators and pathogens (diseases) with which they have co-evolved in their natural range”19. Correspondingly, indigenous species are at a competitive disadvantage when they encounter such alien species (no evolutionary history of them) and are easily out-competed.
Invasive alien species can occur on land, in the ocean or in freshwater systems, and can be drawn from any group of organisms. However, our knowledge of invasives is by the far the best for terrestrial species and ecosystems. Invasive alien plants have invaded over 10 million hectares of our country. Over 750 tree species and 8 000 herbaceous species have been introduced, with some 1000 introduced species now naturalized, and 200 considered invasive. 20% of listed alien plants are categorized as ‘major invaders’, and a further 15% as ‘emerging invaders’20. Plants constitute the majority of invasive species in South Africa, making up 62% of the 319 species listed as harmful and threaten 55% of the Red Data-listed plants in the country21,22. According to the Working for Water programme, invasive alien plant infestations are expected to double within 15 years if left uncontrolled (DWAF: http://www.dwaf.gov.za/wfw).
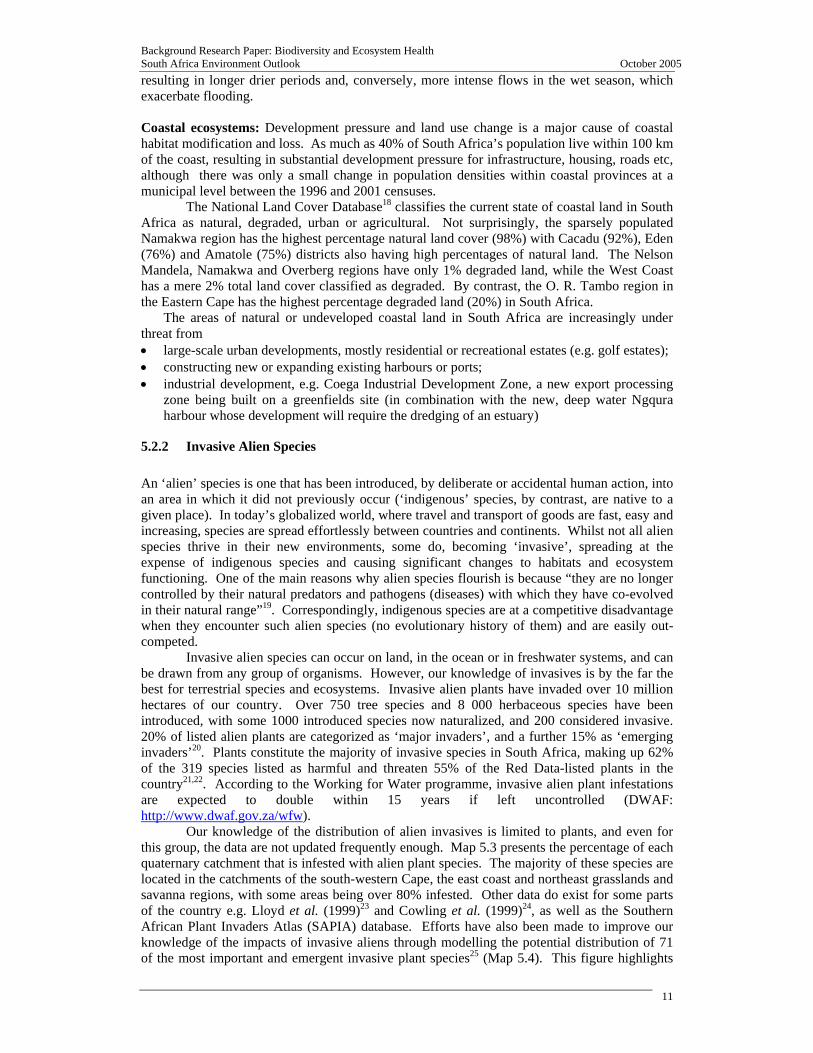
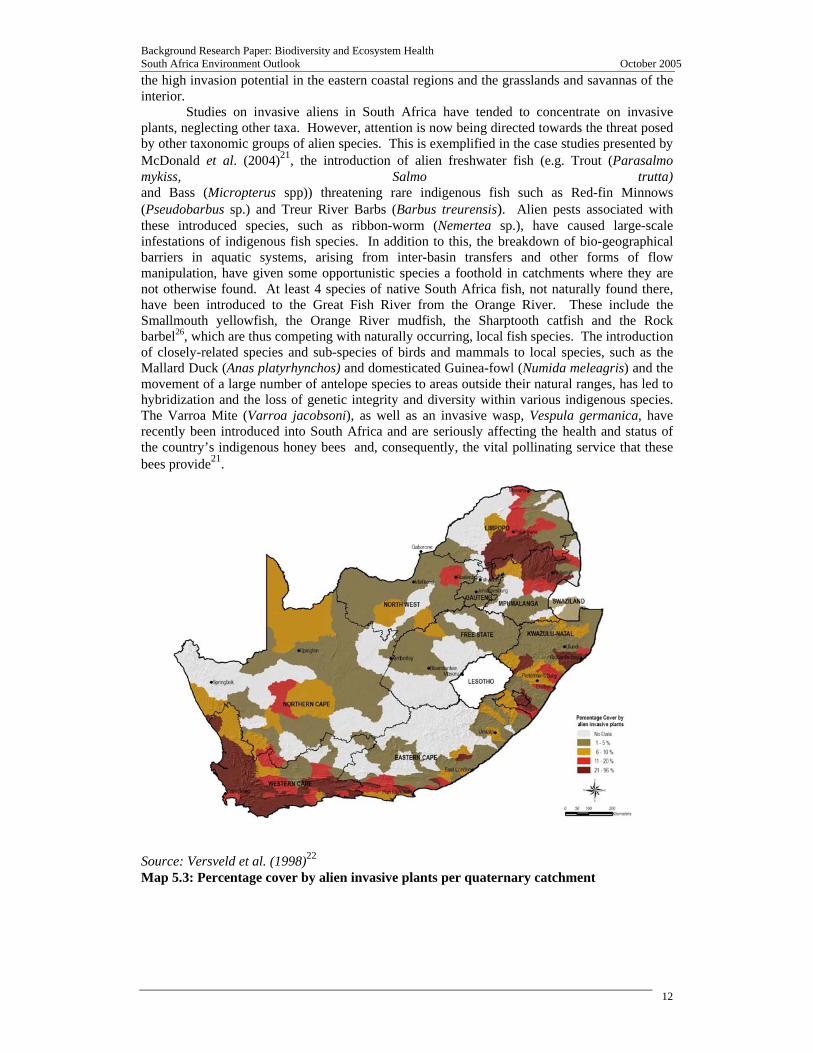
Our knowledge of the distribution of alien invasives is limited to plants, and even for this group, the data are not updated frequently enough. Map 5.3 presents the percentage of each quaternary catchment that is infested with alien plant species. The majority of these species are located in the catchments of the south-western Cape, the east coast and northeast grasslands and savanna regions, with some areas being over 80% infested. Other data do exist for some parts of the country e.g. Lloyd et al. (1999)23 and Cowling et al. (1999)24, as well as the Southern African Plant Invaders Atlas (SAPIA) database. Efforts have also been made to improve our knowledge of the impacts of invasive aliens through modelling the potential distribution of 71 of the most important and emergent invasive plant species25 (Map 5.4). This figure highlights
Background Research Paper: Biodiversity and Ecosystem Health South Africa Environment Outlook October 2005
12
the high invasion potential in the eastern coastal regions and the grasslands and savannas of the interior.
Studies on invasive aliens in South Africa have tended to concentrate on invasive plants, neglecting other taxa. However, attention is now being directed towards the threat posed by other taxonomic groups of alien species. This is exemplified in the case studies presented by McDonald et al. (2004)21, the introduction of alien freshwater fish (e.g. Trout (Parasalmo mykiss, Salmo trutta) and Bass (Micropterus spp)) threatening rare indigenous fish such as Red-fin Minnows (Pseudobarbus sp.) and Treur River Barbs (Barbus treurensis). Alien pests associated with these introduced species, such as ribbon-worm (Nemertea sp.), have caused large-scale infestations of indigenous fish species. In addition to this, the breakdown of bio-geographical barriers in aquatic systems, arising from inter-basin transfers and other forms of flow manipulation, have given some opportunistic species a foothold in catchments where they are not otherwise found. At least 4 species of native South Africa fish, not naturally found there, have been introduced to the Great Fish River from the Orange River. These include the Smallmouth yellowfish, the Orange River mudfish, the Sharptooth catfish and the Rock barbel26, which are thus competing with naturally occurring, local fish species. The introduction of closely-related species and sub-species of birds and mammals to local species, such as the Mallard Duck (Anas platyrhynchos) and domesticated Guinea-fowl (Numida meleagris) and the movement of a large number of antelope species to areas outside their natural ranges, has led to hybridization and the loss of genetic integrity and diversity within various indigenous species. The Varroa Mite (Varroa jacobsoni), as well as an invasive wasp, Vespula germanica, have recently been introduced into South Africa and are seriously affecting the health and status of the country’s indigenous honey bees and, consequently, the vital pollinating service that these bees provide21.
Source: Versveld et al. (1998)22 Map 5.3: Percentage cover by alien invasive plants per quaternary catchment
Background Research Paper: Biodiversity and Ecosystem Health South Africa Environment Outlook October 2005
13
Source: Rouget et al. (2004)25 Map 5.4: Potential distribution of alien invasive plant species
Invasive alien species are a threat to biodiversity in the coastal and marine environments. Marine fauna and flora have intentionally, or more often accidentally, been transported around the globe because of human activities27. The most frequent means of introducing marine alien species is through the ballast water of ships, which is discharged when loading cargo at ports or harbours, along with any surviving organisms. The highly dynamic nature of South Africa’s marine environment appears to have prevented many marine alien invasive species from becoming established. Of the ten currently known marine invasive species, only two (Mediterranean Mussel, Mytilus galloprovincialis and the ascidian, Ciona intestinalis) are considered to have major negative ecological or economic impacts, while one (European Green Crab, Carcinus maenas) has the potential for negative impact. Invasion by the Mediterranean mussel has resulted in the displacement of indigenous intertidal species along much of South Africa’s coastline. Since 2001, 1 ascidian species, 1 anemone, 1 oyster and 1 red algae (half the total number of recorded alien invasive species) have been recorded as invasive species in South Africa.
Microscopic algae (phytoplankton) too are easily transported around the world in ship ballast water and once discharged, could become invasive. There is some indication that two species of toxic phytoplankton responsible for red tide blooms in south-western Cape waters in recent years were introduced, alien species.
5.2.3 Over-exploitation of natural resources Economies and human settlements are dependent on the exploitation of natural resources in diverse ways, exploitation that is rapidly amounting to over-exploitation as populations and consumption grow:
Background Research Paper: Biodiversity and Ecosystem Health South Africa Environment Outlook October 2005
14
• Trade-driven exploitation, that occurs from a local to a global scale, with national and international trade and consumptive use of plants and animals e.g. freshwater and marine fisheries, and their derivatives are on the increase. Wildlife and wildlife commodities, including food, medicines and cultural artefacts, live animals for the food and pet markets, and timber and ornamental plants are traded legally and illegally around the world in a multi-billion rand industry. In South Africa, the national value of trade in medicinal plants alone (approximately 20 000 tonnes), is estimated at R270 million annually28,29.
• use of natural resources to support human settlement and urban populations, including the abstraction of freshwater for domestic and agricultural purposes, generation of electricity (modifications to rivers through hydropower development, or acid rain due to coal-fired power stations), deforestation for timber products, and agricultural over-exploitation of soils. This over-exploitation takes place at regional and sometimes global scales, as the supply of these resources is often remote from the demand. In parts of South Africa, urbanization rates are very high e.g., Gauteng has an urbanization rate of 94% and a population density of 375 people per square kilometre3.
• In South Africa and other African countries, local scale use of natural resources for subsistence purposes is a significant pressure for ecosystem change. Included in this form of over-exploitation are unsustainable levels of grazing by livestock, fuelwood harvesting, collection of building materials (e.g. thatch, wood, and reeds), bushmeat hunting, and medicinal plant harvesting. Community level over-exploitation can have severe consequences on biodiversity and the combined effects of deforestation and subsistence agriculture will totally denude natural woodlands in communal areas in southern Africa by 202030.
The natural resources that currently support a large percentage of the population are rapidly declining due to over-exploitation. This decline is not evenly spread across South African ecosystems, but is concentrated in the forests, grasslands, KwaZulu-Natal coastal belt and in the Cape Floristic Region – all areas of high biodiversity and conservation priority. A study on the trade and economic value of forest and woodland resources within the medicinal plant market in Johannesburg estimated that woodland and forest resources account for approximately 63% of the species traded, with 10% of those species shared with the grassland biome29.
Subsistence and commercial over-harvesting of indigenous plants are driving some species to extinction locally and even nationally, especially rare and slow-growing species with medicinal value, such as some endemic bulbs and succulents31. Other taxa threatened by commercial exploitation include cycads, colophon beetles, the Knysna Seahorse and the Southern Bluefin Tuna.
There is still a lack of awareness and information regarding the threats to many plant and animal species that are being harvested or collected for the bushmeat, medicinal plant, bio-prospecting, or pet trades or collected for pure rarity value by overzealous collectors (e.g. colophon beetles). Add to this inadequate baseline data about the distribution and abundance of organisms and it makes for a virtually impossible task to assess the overall impacts of biodiversity exploitation. (pers. comm. Markus Burgener – TRAFFIC SA, April 2005)
In the coastal and marine environments, commercial exploitation of species is of enormous economic value to the country and is a direct cause of over-exploitation in some cases (for details, see Coastal and Marine chapter). For instance, Abalone (Perlemoen) is presently facing a severe crisis and extreme management measures have been implemented in an attempt to prevent the targeted species, Haliotis midae, from becoming commercially extinct. A combination of extremely high international demand and exorbitant prices, coupled with insufficient enforcement capacity within South Africa, has led to the establishment of highly organized illegal abalone fishery syndicates. Illegal harvesting of abalone has always been a factor (abalone occur in shallow water, are easily removed and thus do not require expensive fishing gear), but, since 2000 the levels of abalone poaching have escalated dramatically, to the extent that recent data indicate that the fishery is unlikely to remain sustainable, unless improvements in compliance occur immediately. Even more dramatic was the complete closure of the recreational abalone fishery for the first time in history for the 2003/2004 abalone fishing season. Compounding the effects of abalone poaching is the ecological change occurring at the
Background Research Paper: Biodiversity and Ecosystem Health South Africa Environment Outlook October 2005
15
centre of the most productive abalone region, between Cape Hangklip and Hermanus in the south-western Cape. An increase in rock lobster (J. lalandii) abundance in this region was initially detected in 199432. Rock lobsters consume small invertebrates, including sea urchins (Parechinus angulosus) which provide essential shelter for juvenile abalone33,34. Decreasing abundance of sea urchins, due to increased predation by rock lobster, results in reduced recruitment to the abalone fishery.
Bycatch by commercial fishers is a serious problem in the marine environment, leading to incidental mortality on non-target species. These rates vary between five and 70% of the total catch. A serious bycatch issue is currently the mass mortality of seabirds killed by long-line operations.
Other pressures on fresh water and coastal and marine ecosystems are discussed in detail in those chapters.
5.2.4 Climate change Possibly the greatest threat now to biodiversity is climate change induced by human activities. Cyclical climate change over very long time horizons is a natural phenomenon and has happened in the prehistoric past. However, current, human-induced warming of the global atmosphere, linked to the 30% increase in atmospheric CO2 concentration since the start of the industrial revolution, is different in that it is happening 10 times faster and over a landscape is already fragmented by human activities35. The Intergovernmental Panel on Climate Change (IPCC) states that global average surface temperatures have increased, global mean sea level is rising and the concentration of ozone in the stratosphere has decreased. Annual average precipitation has also changed and the intensity and frequency of extreme weather events appear to have increased36. Monitoring of sea surface temperature, mean sea level, and rainfall in South Africa suggests that changes in the local environment are similar to those of global patterns. Globally, ecosystems have begun to show the effects of a changing climate37, while in South Africa several studies completed during the 1990s strongly indicated that the biodiversity of southern Africa is at risk38,39,40,12 from the effects of climate change. Currently some quantitative evidence of impacts on species is now emerging for southern Africa. For example, populations of Aloe dichotoma are declining in the northern (drier) part of its range, but appear more stable in the southern part41. Evidence also suggests that the expansion of tree cover into formerly open grasslands and savannas (bush-encroachment), beginning around the 1960s, may have been predisposed by the steadily-rising global CO2 concentration42.
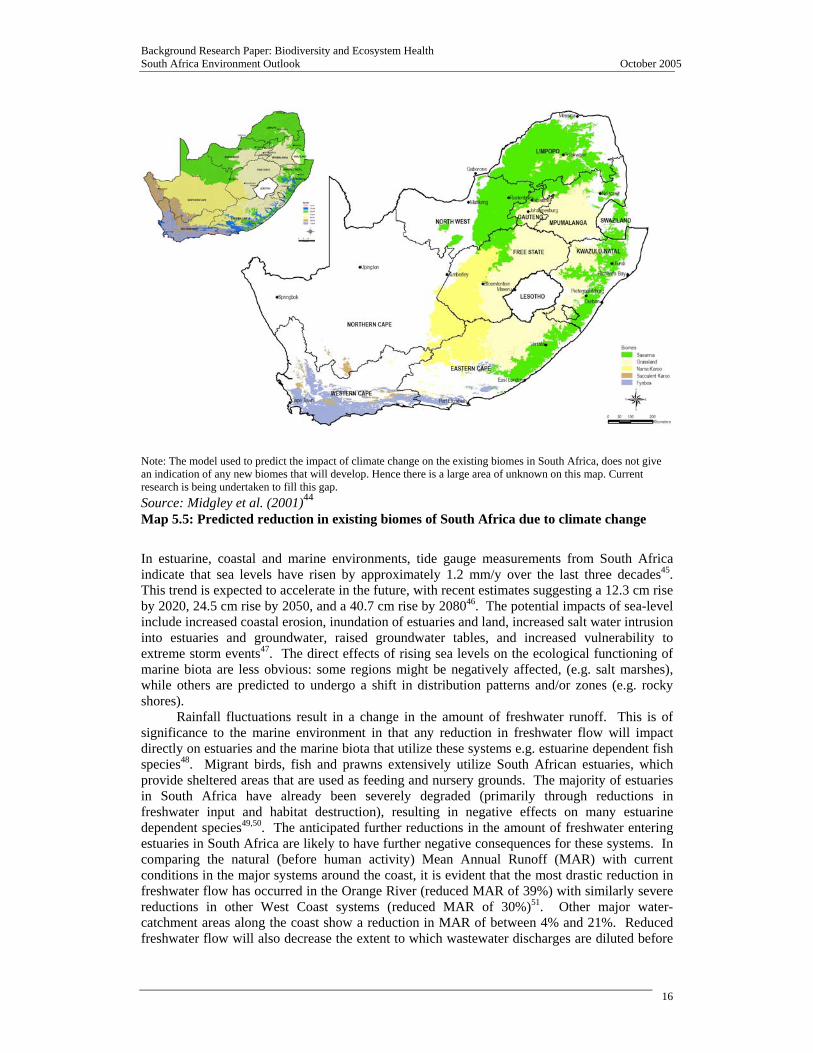
The South African Country Study on Climate Change predicted that the most dramatic responses to climate change would be in the biodiversity and human health sectors43. The area considered climatically suitable for South Africa’s seven existing terrestrial biomes could shrink by 40% by 205044 (Map 5.5). Much of the area currently occupied by grasslands could shrink and become increasingly susceptible to invasion by savanna species, expanding the extent of the savanna biome. A disturbing prediction is the likelihood of the loss of the Succulent Karoo biome from South Africa, home to the world’s largest diversity of succulent flora and arguably the world’s most botanically diverse arid region.
Countrywide, habitats are expected to shift along a west-to-east gradient of aridification, leading to an increased probability of extinction, as movement and available intact habitat is today greatly restricted. This is due in part to the fragmentation of landscapes and ecosystems because of human activities (agricultural, urban, and industrial expansion). Some 44% of plant and 80% of animal species will undergo some alteration to their existing ranges. The majority of range shifts in South Africa in both plant and animal species are predicted to take place in an easterly direction towards the eastern highlands, a pattern in keeping with the predictions of significant increases in aridity in the western parts of the country and less intense aridification in the east. Adding to the likelihood of local extinctions is the fact that these predicted range shifts would require that species move into the presently more transformed landscapes in South Africa.
Background Research Paper: Biodiversity and Ecosystem Health South Africa Environment Outlook October 2005
16
Note: The model used to predict the impact of climate change on the existing biomes in South Africa, does not give an indication of any new biomes that will develop. Hence there is a large area of unknown on this map. Current research is being undertaken to fill this gap. Source: Midgley et al. (2001)44 Map 5.5: Predicted reduction in existing biomes of South Africa due to climate change
In estuarine, coastal and marine environments, tide gauge measurements from South Africa indicate that sea levels have risen by approximately 1.2 mm/y over the last three decades45. This trend is expected to accelerate in the future, with recent estimates suggesting a 12.3 cm rise by 2020, 24.5 cm rise by 2050, and a 40.7 cm rise by 208046. The potential impacts of sea-level include increased coastal erosion, inundation of estuaries and land, increased salt water intrusion into estuaries and groundwater, raised groundwater tables, and increased vulnerability to extreme storm events47. The direct effects of rising sea levels on the ecological functioning of marine biota are less obvious: some regions might be negatively affected, (e.g. salt marshes), while others are predicted to undergo a shift in distribution patterns and/or zones (e.g. rocky shores).
Rainfall fluctuations result in a change in the amount of freshwater runoff. This is of significance to the marine environment in that any reduction in freshwater flow will impact directly on estuaries and the marine biota that utilize these systems e.g. estuarine dependent fish species48. Migrant birds, fish and prawns extensively utilize South African estuaries, which provide sheltered areas that are used as feeding and nursery grounds. The majority of estuaries in South Africa have already been severely degraded (primarily through reductions in freshwater input and habitat destruction), resulting in negative effects on many estuarine dependent species49,50. The anticipated further reductions in the amount of freshwater entering estuaries in South Africa are likely to have further negative consequences for these systems. In comparing the natural (before human activity) Mean Annual Runoff (MAR) with current conditions in the major systems around the coast, it is evident that the most drastic reduction in freshwater flow has occurred in the Orange River (reduced MAR of 39%) with similarly severe reductions in other West Coast systems (reduced MAR of 30%)51. Other major water-catchment areas along the coast show a reduction in MAR of between 4% and 21%. Reduced freshwater flow will also decrease the extent to which wastewater discharges are diluted before
Background Research Paper: Biodiversity and Ecosystem Health South Africa Environment Outlook October 2005
17
reaching estuaries, thereby increasing the concentration of pollutants in the coastal zone, and limiting their capacity to support natural biota48.
5.3 THE STATE OF SOUTH AFRICA’S ECOSYSTEMS This section is divided into terrestrial, riverine, estuarine and marine ecosystems. Under each section, the status of the ecosystems and species is described, as well as the protection levels of these ecosystems. In some cases, data are not readily available for these assessments (as identified). The coverage of terrestrial systems is more detailed here than that for freshwater and marine ecosystems, as the latter are presented in the Inland Water and Coastal and Marine chapters, respectively.
5.3.1 Terrestrial ecosystems The need to protect vulnerable components of biodiversity from threatening processes through the establishment of conservation areas is widely accepted as one of the primary ways to conserve biodiversity directly. These conservation areas include the formal statutory protected areas (PAs) (Type 1), as well as the less formal PAs e.g. mountain catchment areas, DWAF state forests (Type 2), and informal landowner activities such as game farms and conservancies (Type 3).
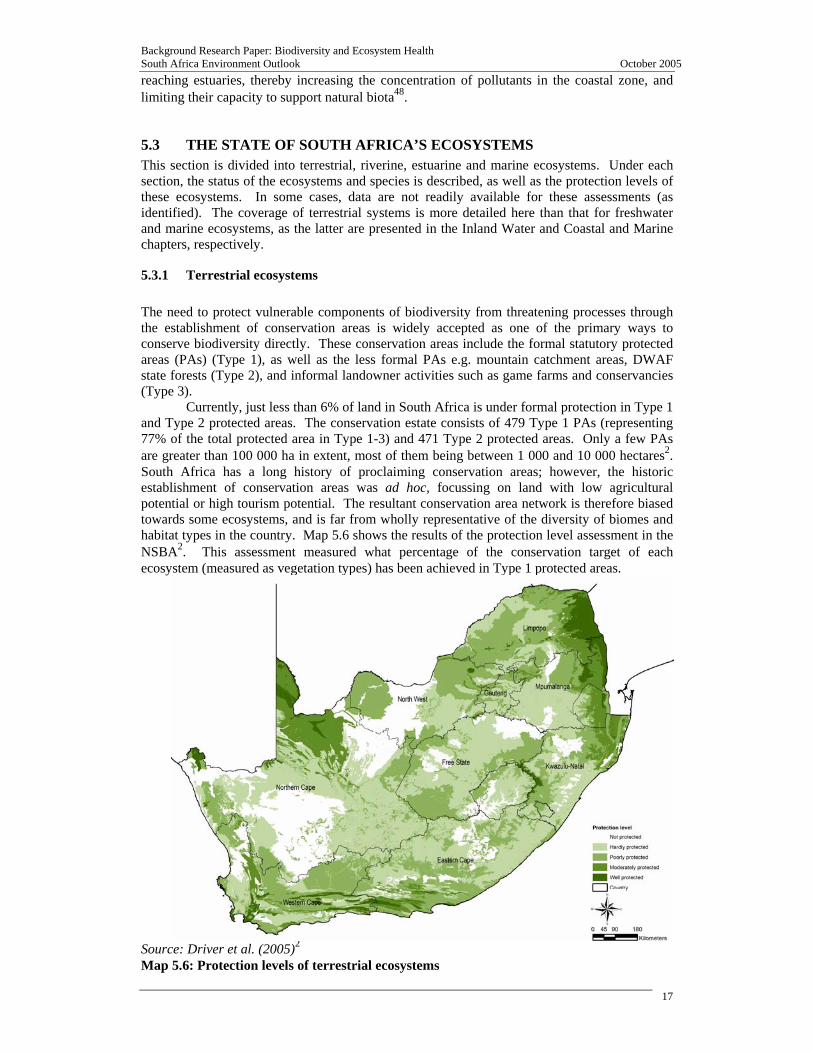
Currently, just less than 6% of land in South Africa is under formal protection in Type 1 and Type 2 protected areas. The conservation estate consists of 479 Type 1 PAs (representing 77% of the total protected area in Type 1-3) and 471 Type 2 protected areas. Only a few PAs are greater than 100 000 ha in extent, most of them being between 1 000 and 10 000 hectares2. South Africa has a long history of proclaiming conservation areas; however, the historic establishment of conservation areas was ad hoc, focussing on land with low agricultural potential or high tourism potential. The resultant conservation area network is therefore biased towards some ecosystems, and is far from wholly representative of the diversity of biomes and habitat types in the country. Map 5.6 shows the results of the protection level assessment in the NSBA2. This assessment measured what percentage of the conservation target of each ecosystem (measured as vegetation types) has been achieved in Type 1 protected areas. Source: Driver et al. (2005)2 Map 5.6: Protection levels of terrestrial ecosystems
Background Research Paper: Biodiversity and Ecosystem Health South Africa Environment Outlook October 2005
18
An assessment of the protection level of each vegetation type in relation to its conservation targets reveals that 110 South African vegetation types out of 447 are not protected at all. Furthermore, an additional 90 vegetation types, with less than 5% of their biodiversity target protected, are not adequately conserved. More than 300 vegetation types have less than half of their biodiversity target conserved in statutory protected areas. Only 67 vegetation types are adequately conserved (in relation to their biodiversity targets): 22 types of fynbos, 18 types of savanna, and 7 types of forest. No grassland types are adequately conserved.
Correcting these biases in coverage and ensuring the proper management of biodiversity and ecosystem processes in these conservation areas are essential ingredients to ensuring conservation success.
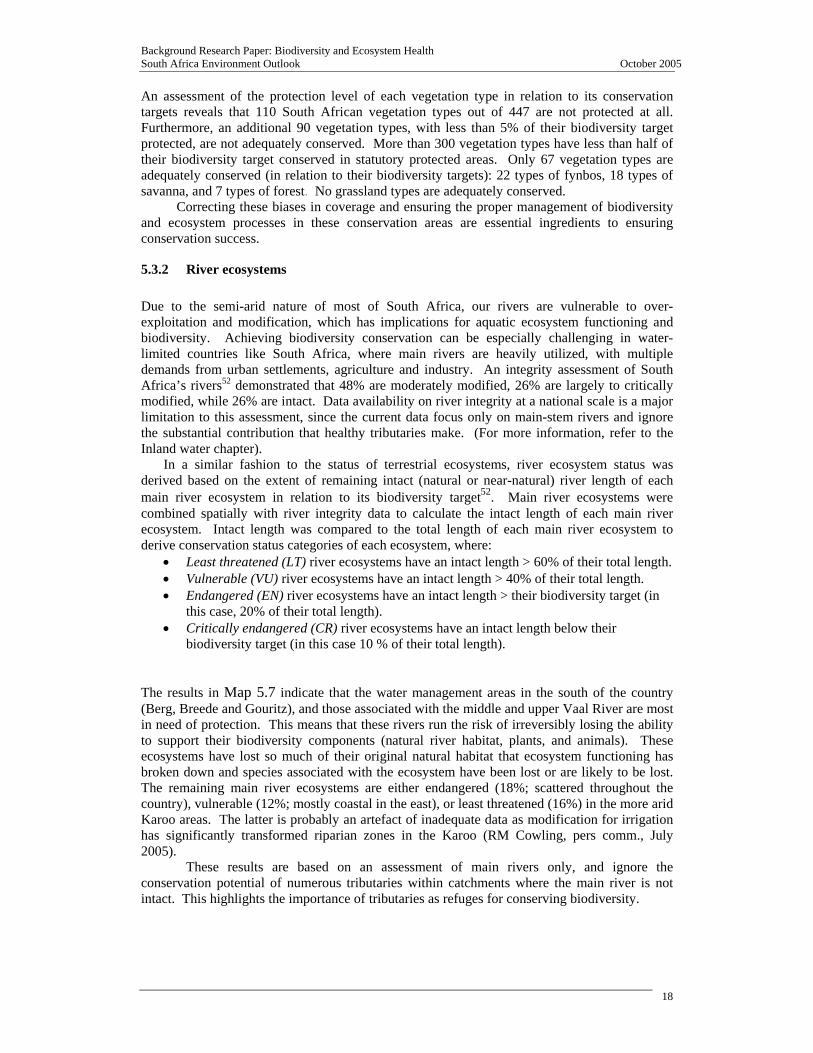
5.3.2 River ecosystems Due to the semi-arid nature of most of South Africa, our rivers are vulnerable to over-exploitation and modification, which has implications for aquatic ecosystem functioning and biodiversity. Achieving biodiversity conservation can be especially challenging in water-limited countries like South Africa, where main rivers are heavily utilized, with multiple demands from urban settlements, agriculture and industry. An integrity assessment of South Africa’s rivers52 demonstrated that 48% are moderately modified, 26% are largely to critically modified, while 26% are intact. Data availability on river integrity at a national scale is a major limitation to this assessment, since the current data focus only on main-stem rivers and ignore the substantial contribution that healthy tributaries make. (For more information, refer to the Inland water chapter).
In a similar fashion to the status of terrestrial ecosystems, river ecosystem status was derived based on the extent of remaining intact (natural or near-natural) river length of each main river ecosystem in relation to its biodiversity target52. Main river ecosystems were combined spatially with river integrity data to calculate the intact length of each main river ecosystem. Intact length was compared to the total length of each main river ecosystem to derive conservation status categories of each ecosystem, where:
• Least threatened (LT) river ecosystems have an intact length > 60% of their total length. • Vulnerable (VU) river ecosystems have an intact length > 40% of their total length. • Endangered (EN) river ecosystems have an intact length > their biodiversity target (in
this case, 20% of their total length). • Critically endangered (CR) river ecosystems have an intact length below their
biodiversity target (in this case 10 % of their total length).
The results in Map 5.7 indicate that the water management areas in the south of the country (Berg, Breede and Gouritz), and those associated with the middle and upper Vaal River are most in need of protection. This means that these rivers run the risk of irreversibly losing the ability to support their biodiversity components (natural river habitat, plants, and animals). These ecosystems have lost so much of their original natural habitat that ecosystem functioning has broken down and species associated with the ecosystem have been lost or are likely to be lost. The remaining main river ecosystems are either endangered (18%; scattered throughout the country), vulnerable (12%; mostly coastal in the east), or least threatened (16%) in the more arid Karoo areas. The latter is probably an artefact of inadequate data as modification for irrigation has significantly transformed riparian zones in the Karoo (RM Cowling, pers comm., July 2005).
These results are based on an assessment of main rivers only, and ignore the conservation potential of numerous tributaries within catchments where the main river is not intact. This highlights the importance of tributaries as refuges for conserving biodiversity.
Background Research Paper: Biodiversity and Ecosystem Health South Africa Environment Outlook October 2005
19
Source: Nel et al. (2004)52 Map 5.7: Ecosystem status of South African rivers
The need for urgent attention to be given to the state of river biodiversity in the country
can be highlighted by comparing the river ecosystem status outputs to similar outputs produced for terrestrial ecosystems (compare Map 5.2 and Map 5.7). These results show that the state of terrestrial biodiversity in the country, despite being in need of attention, is generally better than that of river and marine ecosystems2.
Formal protected areas in South Africa focus primarily on conserving terrestrial ecosystems and, in the process, inadvertently capture portions of river ecosystems that run through them. Little emphasis has been placed on proclaiming protected areas for the primary purpose of conserving entire river lengths (mostly because this is not a practical management option for rivers, which generally traverse great distances in the landscape) or that encapsulate important catchment areas. Statutory reserves or conservation agreements protect only 7% of the total river length in South Africa (this does not include privately owned areas). Approximately one third of South Africa’s main rivers define the boundaries of protected areas rather than occur within PAs, and therefore cannot be considered protected. This emphasizes the polarization of terrestrial and freshwater biodiversity conservation thinking and action over the past century52. There is evidence that significant recovery will be achieved downstream of protected areas.
5.3.3 Wetlands The National Water Act defines a wetland as “land which is transitional between terrestrial and aquatic systems where the water table is usually at or near the surface, or the land is periodically covered with shallow water, and which land in normal circumstances supports or would support vegetation typically adapted to life in saturated soil”. There are many diverse wetland types
Background Research Paper: Biodiversity and Ecosystem Health South Africa Environment Outlook October 2005
20
including springs, mires, bogs, floodplains, vleis, seeps, coastal lakes, estuaries and mangrove swamps. Wetlands perform many essential functions such as the “enhancement of water quality, erosion control, water storage, streamflow regulation, flood attenuation, and maintenance of biodiversity” as well as providing many essential goods and services53,54. They also provide food, plant, water, medicinal and livelihood resources to rural communities, and play an important role in tourism, subsistence farming, grazing and environmental education and awareness55, and therefore have significant social and economic value. More importantly, a healthy wetland system is indicative of a healthy functioning ecosystem. Most wetlands are either fed by groundwater inflows; lose water by seepage into the subsurface or both. During drier months, groundwater is generally the only source of water for many of these ecosystems56. Wetlands are essential in an arid, water-scarce country such as South Africa, yet an estimated 50% of South Africa’s wetlands have been destroyed or converted57,58. This serious loss is due to many factors such as the building of dams, incorrect burning and overgrazing, invasive alien species, the use of wetlands for waste disposal and the abstraction of water, the drainage of wetlands for agricultural cultivation or urban development and inappropriate land management. The exploitation and degradation of South Africa’s wetland ecosystems will rise as the human population grows and there is a subsequent increase in the demand for water and land for settlement in and around urban areas59.
Little reliable information exists on the distribution and state of wetlands. The NSBA used data from 1995 and the latest vegetation map to identify 740 wetlands divided into 17 wetland types and 12 wetlands/estuaries of international significance. Cowan’s (1995)60 wetland dataset is the best available for the country. The NSBA identified significant gaps in the dataset, especially in some parts of the country such as the Eastern Cape. A more comprehensive wetlands map, as well as information on the state of wetlands, is required (one is in development through the National Land Cover 2000) for any reliable future assessments of the state of wetlands.
About 10% of wetlands in South Africa are fully protected and another 8% are partly protected. 16% of the wetlands have no legal protection, with no available information on 66%, a serious impediment to our ability to adequately protect and manage this valuable resource.
Possibly the most important factor in the conservation of South African wetlands is South Africa’s participation as a founding member of the Ramsar Convention on Wetlands (fifth Contracting Party in 1975). The South African Wetlands Conservation Programme was implemented to enable South Africa to meet the obligations that South Africa has as a contracting party to the Ramsar Convention and to promote the conservation of wetlands throughout southern Africa. Since 1975, South Africa has had 17 sites added to the Ramsar List of Wetlands of International Importance (Table 5.2).
The importance of wetlands from an international perspective can be seen with wading birds from as far away as the Russian tundra wintering in the wetlands of southern Africa, while some southern-breeding birds fly to other parts of the world as part of their life cycles. According to the Ramsar Information Pack (available at http://www.ramsar.org ), “These [wetland] functions, values and attributes can only be maintained if the ecological processes of wetlands are allowed to continue functioning. Unfortunately, in spite of important progress made in recent decades, wetlands continue to be among the world’s most threatened ecosystems, owning mainly to ongoing drainage, conversion, pollution, and over-exploitation of their resources”. The protection of wetlands needs to combine water resource management with land use management strategies. To date, implementation has been weak due to fragmented institutional arrangements, confusion about overlapping jurisdiction and areas of responsibility, and lack of appropriate management strategies that mainstream wetlands in the water and natural resource sectors61.
Background Research Paper: Biodiversity and Ecosystem Health South Africa Environment Outlook October 2005
21
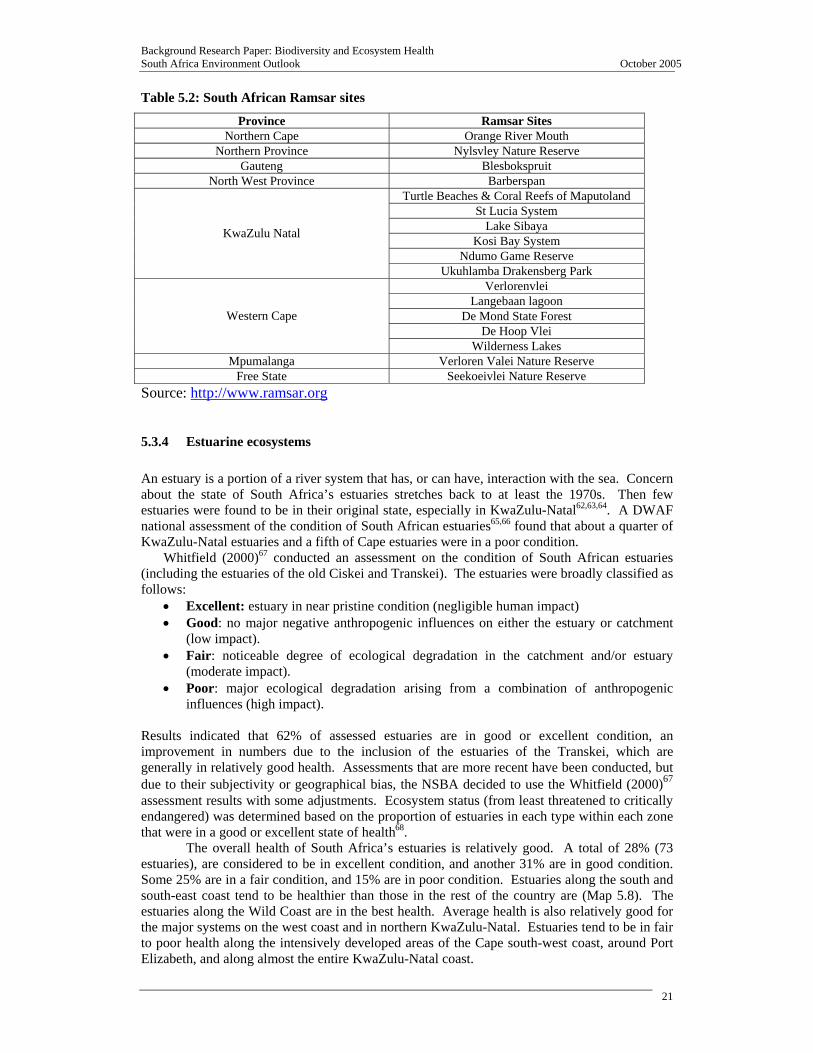
Table 5.2: South African Ramsar sites
Province Ramsar Sites Northern Cape Orange River Mouth
Northern Province Nylsvley Nature Reserve Gauteng Blesbokspruit
North West Province Barberspan Turtle Beaches & Coral Reefs of Maputoland
St Lucia System Lake Sibaya
Kosi Bay System Ndumo Game Reserve
KwaZulu Natal
Ukuhlamba Drakensberg Park Verlorenvlei
Langebaan lagoon De Mond State Forest
De Hoop Vlei Western Cape
Wilderness Lakes Mpumalanga Verloren Valei Nature Reserve
Free State Seekoeivlei Nature Reserve Source: http://www.ramsar.org
5.3.4 Estuarine ecosystems An estuary is a portion of a river system that has, or can have, interaction with the sea. Concern about the state of South Africa’s estuaries stretches back to at least the 1970s. Then few estuaries were found to be in their original state, especially in KwaZulu-Natal62,63,64. A DWAF national assessment of the condition of South African estuaries65,66 found that about a quarter of KwaZulu-Natal estuaries and a fifth of Cape estuaries were in a poor condition.
Whitfield (2000)67 conducted an assessment on the condition of South African estuaries (including the estuaries of the old Ciskei and Transkei). The estuaries were broadly classified as follows:
• Excellent: estuary in near pristine condition (negligible human impact) • Good: no major negative anthropogenic influences on either the estuary or catchment
(low impact). • Fair: noticeable degree of ecological degradation in the catchment and/or estuary
(moderate impact). • Poor: major ecological degradation arising from a combination of anthropogenic
influences (high impact). Results indicated that 62% of assessed estuaries are in good or excellent condition, an improvement in numbers due to the inclusion of the estuaries of the Transkei, which are generally in relatively good health. Assessments that are more recent have been conducted, but due to their subjectivity or geographical bias, the NSBA decided to use the Whitfield (2000)67 assessment results with some adjustments. Ecosystem status (from least threatened to critically endangered) was determined based on the proportion of estuaries in each type within each zone that were in a good or excellent state of health68.
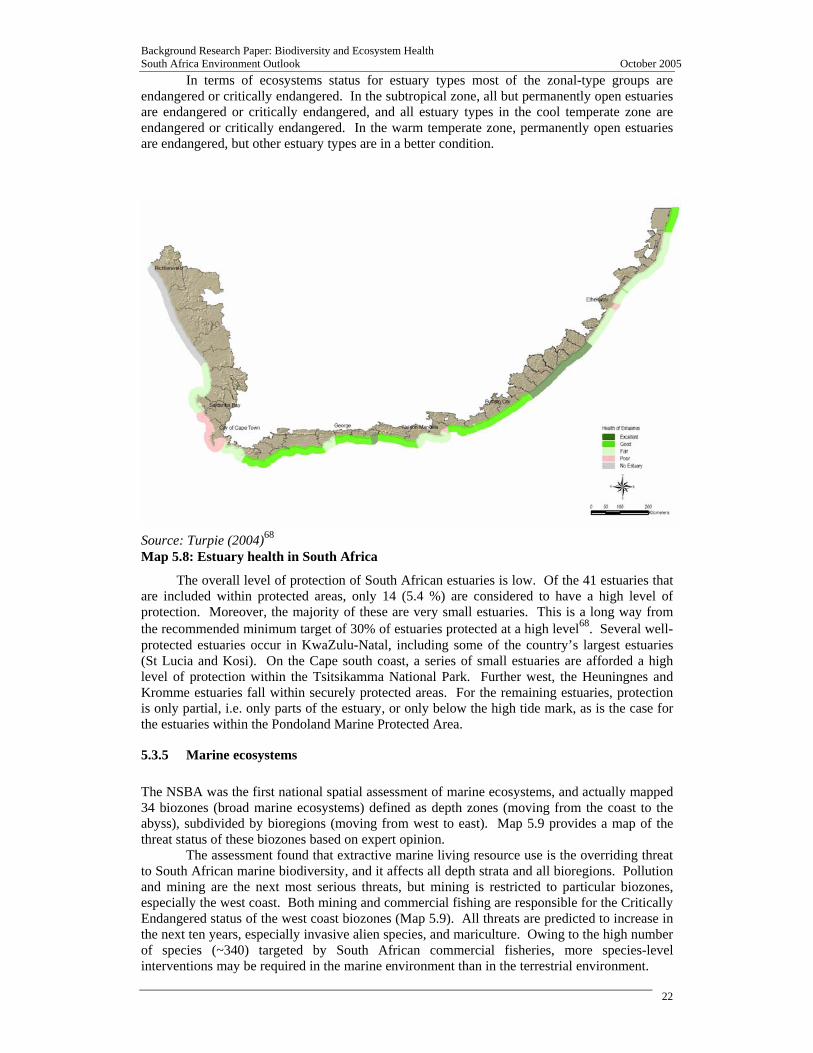
The overall health of South Africa’s estuaries is relatively good. A total of 28% (73 estuaries), are considered to be in excellent condition, and another 31% are in good condition. Some 25% are in a fair condition, and 15% are in poor condition. Estuaries along the south and south-east coast tend to be healthier than those in the rest of the country are (Map 5.8). The estuaries along the Wild Coast are in the best health. Average health is also relatively good for the major systems on the west coast and in northern KwaZulu-Natal. Estuaries tend to be in fair to poor health along the intensively developed areas of the Cape south-west coast, around Port Elizabeth, and along almost the entire KwaZulu-Natal coast.
Background Research Paper: Biodiversity and Ecosystem Health South Africa Environment Outlook October 2005
22
In terms of ecosystems status for estuary types most of the zonal-type groups are endangered or critically endangered. In the subtropical zone, all but permanently open estuaries are endangered or critically endangered, and all estuary types in the cool temperate zone are endangered or critically endangered. In the warm temperate zone, permanently open estuaries are endangered, but other estuary types are in a better condition.
Source: Turpie (2004)68 Map 5.8: Estuary health in South Africa
The overall level of protection of South African estuaries is low. Of the 41 estuaries that are included within protected areas, only 14 (5.4 %) are considered to have a high level of protection. Moreover, the majority of these are very small estuaries. This is a long way from the recommended minimum target of 30% of estuaries protected at a high level68. Several well-protected estuaries occur in KwaZulu-Natal, including some of the country’s largest estuaries (St Lucia and Kosi). On the Cape south coast, a series of small estuaries are afforded a high level of protection within the Tsitsikamma National Park. Further west, the Heuningnes and Kromme estuaries fall within securely protected areas. For the remaining estuaries, protection is only partial, i.e. only parts of the estuary, or only below the high tide mark, as is the case for the estuaries within the Pondoland Marine Protected Area.
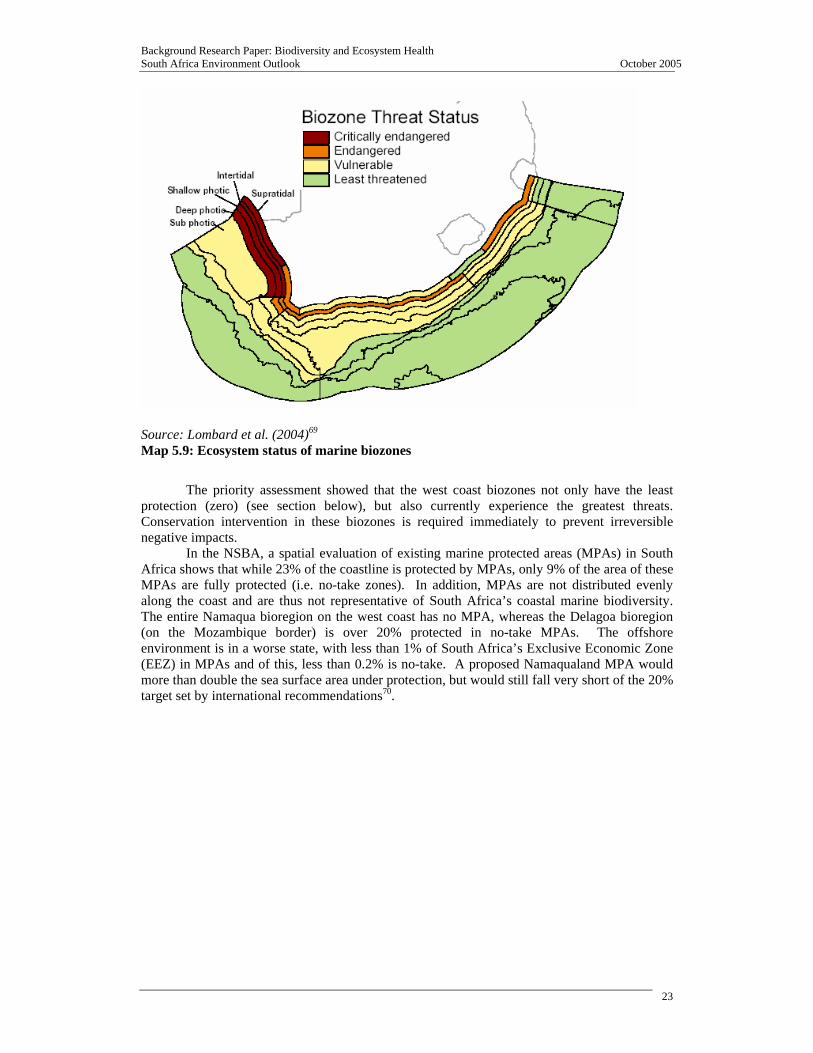
5.3.5 Marine ecosystems The NSBA was the first national spatial assessment of marine ecosystems, and actually mapped 34 biozones (broad marine ecosystems) defined as depth zones (moving from the coast to the abyss), subdivided by bioregions (moving from west to east). Map 5.9 provides a map of the threat status of these biozones based on expert opinion.
The assessment found that extractive marine living resource use is the overriding threat to South African marine biodiversity, and it affects all depth strata and all bioregions. Pollution and mining are the next most serious threats, but mining is restricted to particular biozones, especially the west coast. Both mining and commercial fishing are responsible for the Critically Endangered status of the west coast biozones (Map 5.9). All threats are predicted to increase in the next ten years, especially invasive alien species, and mariculture. Owing to the high number of species (~340) targeted by South African commercial fisheries, more species-level interventions may be required in the marine environment than in the terrestrial environment.
Background Research Paper: Biodiversity and Ecosystem Health South Africa Environment Outlook October 2005
23
Source: Lombard et al. (2004)69 Map 5.9: Ecosystem status of marine biozones
The priority assessment showed that the west coast biozones not only have the least
protection (zero) (see section below), but also currently experience the greatest threats. Conservation intervention in these biozones is required immediately to prevent irreversible negative impacts.
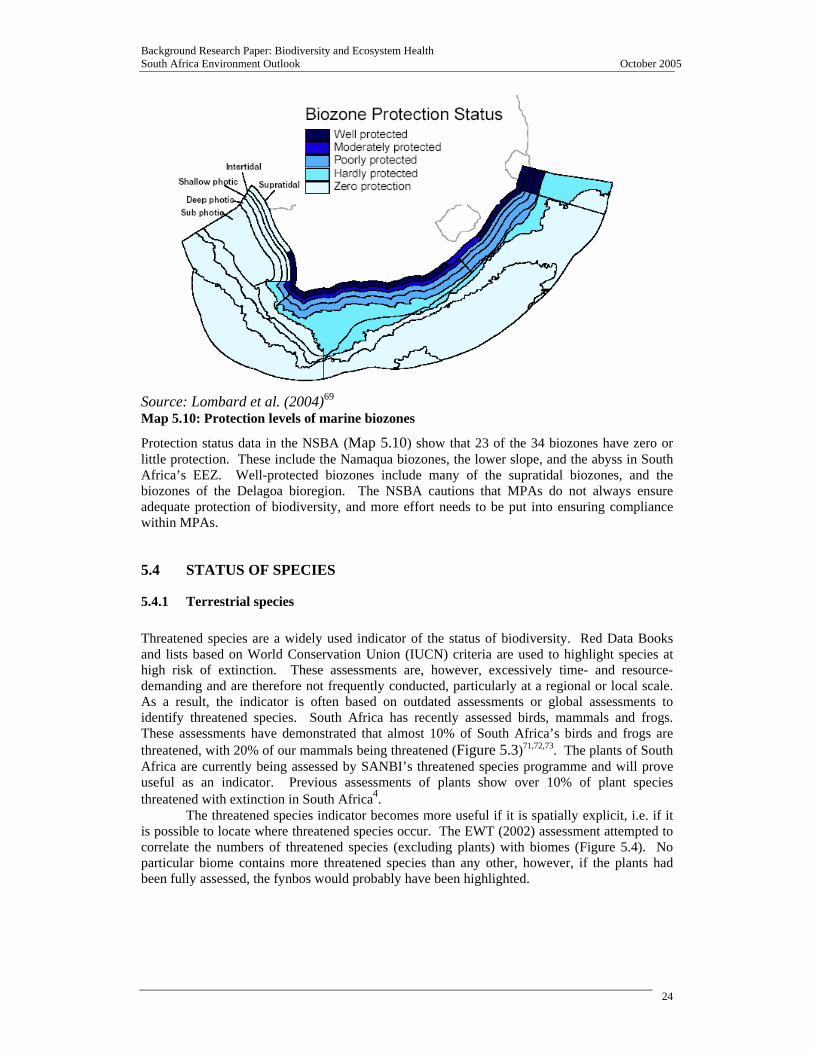
In the NSBA, a spatial evaluation of existing marine protected areas (MPAs) in South Africa shows that while 23% of the coastline is protected by MPAs, only 9% of the area of these MPAs are fully protected (i.e. no-take zones). In addition, MPAs are not distributed evenly along the coast and are thus not representative of South Africa’s coastal marine biodiversity. The entire Namaqua bioregion on the west coast has no MPA, whereas the Delagoa bioregion (on the Mozambique border) is over 20% protected in no-take MPAs. The offshore environment is in a worse state, with less than 1% of South Africa’s Exclusive Economic Zone (EEZ) in MPAs and of this, less than 0.2% is no-take. A proposed Namaqualand MPA would more than double the sea surface area under protection, but would still fall very short of the 20% target set by international recommendations70.
Background Research Paper: Biodiversity and Ecosystem Health South Africa Environment Outlook October 2005
24
Source: Lombard et al. (2004)69 Map 5.10: Protection levels of marine biozones
Protection status data in the NSBA (Map 5.10) show that 23 of the 34 biozones have zero or little protection. These include the Namaqua biozones, the lower slope, and the abyss in South Africa’s EEZ. Well-protected biozones include many of the supratidal biozones, and the biozones of the Delagoa bioregion. The NSBA cautions that MPAs do not always ensure adequate protection of biodiversity, and more effort needs to be put into ensuring compliance within MPAs.
5.4 STATUS OF SPECIES
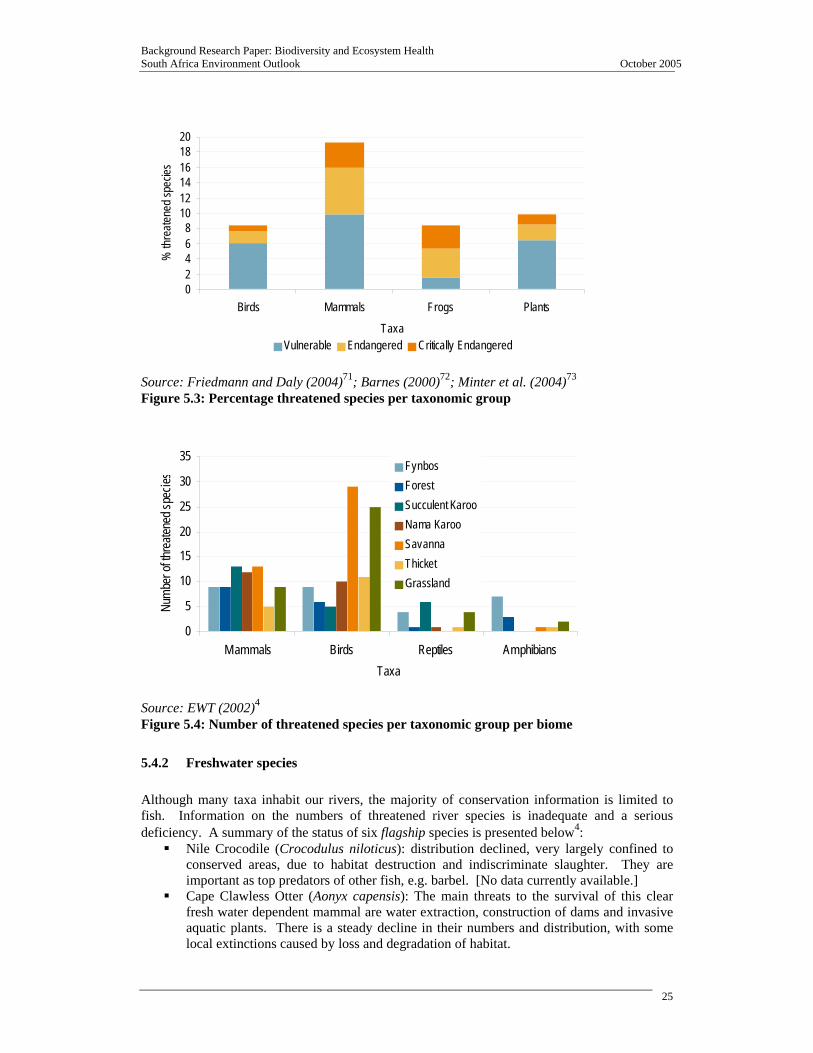
5.4.1 Terrestrial species Threatened species are a widely used indicator of the status of biodiversity. Red Data Books and lists based on World Conservation Union (IUCN) criteria are used to highlight species at high risk of extinction. These assessments are, however, excessively time- and resource-demanding and are therefore not frequently conducted, particularly at a regional or local scale. As a result, the indicator is often based on outdated assessments or global assessments to identify threatened species. South Africa has recently assessed birds, mammals and frogs. These assessments have demonstrated that almost 10% of South Africa’s birds and frogs are threatened, with 20% of our mammals being threatened (Figure 5.3)71,72,73. The plants of South Africa are currently being assessed by SANBI’s threatened species programme and will prove useful as an indicator. Previous assessments of plants show over 10% of plant species threatened with extinction in South Africa4.
The threatened species indicator becomes more useful if it is spatially explicit, i.e. if it is possible to locate where threatened species occur. The EWT (2002) assessment attempted to correlate the numbers of threatened species (excluding plants) with biomes (Figure 5.4). No particular biome contains more threatened species than any other, however, if the plants had been fully assessed, the fynbos would probably have been highlighted.
Background Research Paper: Biodiversity and Ecosystem Health South Africa Environment Outlook October 2005
25
Source: Friedmann and Daly (2004)71; Barnes (2000)72; Minter et al. (2004)73 Figure 5.3: Percentage threatened species per taxonomic group
Source: EWT (2002)4 Figure 5.4: Number of threatened species per taxonomic group per biome
5.4.2 Freshwater species Although many taxa inhabit our rivers, the majority of conservation information is limited to fish. Information on the numbers of threatened river species is inadequate and a serious deficiency. A summary of the status of six flagship species is presented below4:
Nile Crocodile (Crocodulus niloticus): distribution declined, very largely confined to conserved areas, due to habitat destruction and indiscriminate slaughter. They are important as top predators of other fish, e.g. barbel. [No data currently available.]
Cape Clawless Otter (Aonyx capensis): The main threats to the survival of this clear fresh water dependent mammal are water extraction, construction of dams and invasive aquatic plants. There is a steady decline in their numbers and distribution, with some local extinctions caused by loss and degradation of habitat.
02468
101214161820
Birds Mammals Frogs Plants
Taxa
% th
reate
ned s
pecie
s
Vulnerable Endangered Critically Endangered
0
5
10
15
20
25
30
35
Mammals Birds Reptiles AmphibiansTaxa
Num
ber o
f thre
atene
d spe
cies Fynbos
ForestSucculent KarooNama KarooSavannaThicketGrassland
Background Research Paper: Biodiversity and Ecosystem Health South Africa Environment Outlook October 2005
26
African Jacana (Actophilornis africanus): This bird is associated with aquatic habitats that contain floating hydrophytes, typically seasonal pans and floodplains, and slow-moving rivers. Wetlands suitable for breeding are becoming increasingly threatened by water management and extraction schemes. [No data available.]
East Coast Rocky (Sandelia bainsii): This fresh water fish occurs only in short sections of several rivers in the Eastern Cape. It is now considered to be critically endangered (in the past 30 years its population numbers have dropped exponentially), the main threats being habitat change, alien fish through inter-basin transfers (notably the Sharptooth catfish), dam building and excessive water extraction.
Small Scale Redfin Minnow (Pseudobarbus asper): Unlike their redfin minnow cousins confined to the Cape fold belt, this species has adapted to several Karoo streams, where in response to intermittent flow patterns they have evolved to mature early and produce large numbers of eggs, to take advantage of ‘boom and bust’ conditions. However, introduction of the alien catfish is severely reducing their numbers in the Gamtoos River system.
Basking Malachite Damselfly (Chloroestes apricanus): Described only in 1975 this damselfly was known from 10 locations in the clear, unspoilt streams of the Stutterheim area of the Eastern Cape. It is now known only from 2 sites. Nevertheless, the removal of alien invasive trees, especially Black wattle, is helping this sun-loving species to recover.
5.4.3 Wetland species Wetlands are crucial habitat to many species, often performing a vital role in a life cycle stage of a species e.g. migratory stop-overs, breeding grounds. They support high concentrations of birds (especially waterfowl), mammals, reptiles, amphibians, fish and invertebrate species. Wetlands are renowned for their high levels of endemic and specialized species. Unlike terrestrial ecosystems, the richness of freshwater biodiversity is still poorly known. Identification and classification of wetland species is hampered by the fact that many species may spend only part of their life cycle in wetlands. The African Jacana flagship species described above for freshwater systems, could equally be considered a wetland flagship species.
5.4.4 Estuarine species There appears to be little information too on the status of estuarine species, a serious gap in the overall conservation database. The estuaries of the Western and Eastern Cape play a vital role in providing a sanctuary to endemic species4. Six flagship species include4:
Knysna Seahorse (Hippocampus capensis): This estuarine fish is endemic to South Africa, known only from the Knysna and Swartvlei estuaries of the southern Cape coast. It is considered the most endangered seahorse in the world (according to the IUCN Red Data lists). Its threatened status is due to habitat degradation in its extremely limited habitat and mass mortalities in the Swartvlei estuary, caused by artificial breaching of the estuary mouth.
Peringuey’s Leaf-toed Gecko (Cryptactities peringueyi): This small gecko was re-discovered in 1992 after being ‘lost’ for 80 years. It is the only gecko in the world that lives in salt marshes, and is known only from the Kromme R estuary and a few sites near Port Elizabeth. As salt marshes disappear under bulldozers, so will this unique gecko.
White Steenbras (Lithognathus lithognathus): The once abundant White Steenbras is now severely depleted – down to 5% of its previous biomass - through over-fishing (due to its spawning aggregations it was vulnerable to heavy fishing pressure and beach seine nets) and habitat degradation (it is estuary dependent for juvenile nurseries). Severe restrictions on fishing are now in place to save this valuable endemic.
Estuarine Pipefish (Syngnathus watermeyeri): Another Eastern Cape endemic, this fish was known only from the Bushmans, Kariega and Kasuka estuaries, with the last known specimens in these estuaries collected in 1963. However, in 1996 a healthy population
Background Research Paper: Biodiversity and Ecosystem Health South Africa Environment Outlook October 2005
27
was discovered in the East Kleinemonde estuary, the only estuary where this species has again been found. The absence of the required fresh water pulses into the estuaries, in catchments where upstream impoundments have inadequate environmental flow allocations, is responsible for its precipitous decline.
Burrowing Prawn (Callianassa sp.): Abundant in estuaries from Saldanha on the West coast to southern Mozambique, burrowing prawns are targeted by fishermen for bait. Nevertheless, their populations appear robust and they are more at risk from isolated events, such as salinity fluctuations and pollution.
Eelgrass (Zostera sp.): Eelgrass, present in many South African estuaries, binds sediments, provides shelter for juveniles, and serves as a primary food producer. It is threatened by mismanaged catchments, pollution, and disturbance of estuaries. Eelgrass stands remain viable in smaller estuaries, but rehabilitation in larger systems in urgently needed.
Because of habitat degradation and increasing human pressures on estuaries, 4 South African estuarine fish species are listed on the IUCN Red Data List. These are Doublesash butterflyfish, Chaetdon marleyi, Knysna seahorse, Hippocampus capensis, St Lucia mullet, Liza luciae and Estuarine pipefish, Sygnathus watermeyeri, all of which are considered ‘critically endangered’.
5.4.5 Marine species Some 10 000 species of marine plants and animals have been recorded in South Africa’s marine environment4, almost 15% of global marine species diversity. Some of these species represent a very important resource base for coastal subsistence communities, as well as the millions of people who receive nutrition from eating these species. Little information exists on the status of species in the marine environment, and available data relate to particular species that are exploited for human use. Although many fisheries are stable and well managed, there are some alarming trends for some species e.g. lobster, abalone and line fish. One example is the Patagonian Toothfish (Dissostichus eleginoides), a threatened species found in the waters of South Africa’s EEZ around the Prince Edwards Islands. Illegal fishing of the Patagonian Toothfish in these waters, estimated at over 20 000 tons in 1996 (T. Akkers, MCM, pers. comm. June 2005), has decimated the stocks.
Five Critically Endangered, 15 Endangered, and 26 Vulnerable marine animal species have been recorded4. These numbers are low and reflect the poor state of our knowledge of marine species. Information on marine species is particularly inadequate, mostly because of the difficulties involved in collecting such information with the limitations on time spent underwater. Valuable marine species are mostly assessed in terms of their commercial status, rather than their absolute abundance.
All five species of marine turtles occurring in South African waters are listed on the IUCN Red List as either ‘vulnerable’ or ‘endangered’. Leatherback turtles, Dermochelys coriacea, are particularly susceptible to longline fishing and trawling, however, the use of turtle-excluder devices has been made mandatory and has assisted in promoting the status of leatherback turtles from ‘critically endangered’ in 2001 to ‘endangered’ in 2004. All turtle nesting sites in South Africa occur within the Greater St Lucia Wetland Park, a world heritage and Ramsar site, thus affording nesting grounds the highest level of protection in South Africa conservation.
The status of the blue whale, Balaenoptera musculus intermedia is classified as ‘endangered’ and although it is now fully protected in South African waters, populations are still struggling to recover from historic exploitation. Four other marine mammal species occurring in South African waters are considered to be ‘vulnerable’ namely, Indian Ocean Bottlenosed dolphin, Tursiops aduncus, Indian Ocean Humpback dolphin, Sousa plumbea, Sperm whale, Physeter macrocephalus and Bryde’s whale, Balaenoptera brydei.
Oceanic and coastal bird species are primarily threatened by longline fishing activities, habitat loss and disturbance while nesting. The Bittern, Botaurus stellarus is considered to be ‘critically endangered’ due to loss of habitat in the northern KwaZulu-Natal region while three
Background Research Paper: Biodiversity and Ecosystem Health South Africa Environment Outlook October 2005
28
tern species are listed as ‘endangered’, primarily due to habitat loss and disturbance. The Tristan albatross, Diomedea dabbenena and Spectacled petrel, Procellaria sp. are listed as ‘endangered’ and four other albatross species as ‘vulnerable’, mostly due to longline fishing induced mortalities. An additional six oceanic and coastal bird species (as mentioned above) have become listed as ‘endangered’ or ‘vulnerable’ within the past decade.
The IUCN lists 53 species of coastal fish found in South African waters on their Red List, however, this is a global assessment and its pertinence to actual fish populations in South Africa has been questioned74. The most recent evaluation of South Africa’s marine fish status has indicated that up to 20 species of commercial and recreational marine fish are considered over exploited and/or collapsed75,76. Since the turn of the century, specialized studies on specific fish species (e.g. Scotsman, Englishman, Belman, Carpenter, Red roman), all further confirm the continuing deteriorating status of these species (pers. comm. C. Attwood – MCM).
The NSBA marine species analyses based on seaweeds, intertidal invertebrates, and fish demonstrated that although many of these species may exist in MPAs, their status is uncertain and surveys are required in these MPAs69. Several gaps were identified in terms of species protection through MPAs. The study found that if the proposed Namaqualand MPA is proclaimed, it might possibly protect a representative sample of all of the species occurring along the Northern Cape coastline. Owing to the fact that the fish fauna are the most exploited and threatened component of marine-life, the NSBA stressed that an accurate fish distribution database needs to be compiled, to allow these analyses to be repeated. (see Marine & Coastal Chapter section 7.4)
5.5 WHAT IMPACTS DO THESE ISSUES HAVE?
5.5.1 Opportunity costs Destruction of ecosystems and biodiversity amounts to an opportunity cost to social and economic systems. The opportunity costs of declines in ecosystem health and the subsequent impaired ecosystem functions and services can be significant. For example, according to the Working for Water programme, invasive alien plants utilize 7% of South Africa’s water resources; restrict and decrease the country’s agricultural capacity; intensify flooding and fires; cause erosion, destruction of rivers, siltation of dams and estuaries and poor water quality. They may also directly cause the extinction of indigenous plants and animals. Total economic losses of ecosystem services in the Fynbos due to alien plant invasion amount to almost R700 million per year, a 10% loss of economic opportunity, and growing77. Global values of economic losses due to invasive alien species amount to almost 5% of the world economy, or some US$1.4 trillion a year19. Box 1 also provides an indication of what some of the opportunity costs of biodiversity loss are in KwaZulu-Natal.
The long-term impacts of over-exploitation of natural resources are the dysfunction of ecosystems and deterioration in their productivity. This problem is compounded by the lack of regulation and understanding of the impacts of over-exploitation. Negative consequences of over-exploitation also include indirect effects on non-target species e.g. by-catch by fishing industries of albatrosses while long-line fishing78.
5.6 WHAT ARE WE DOING ABOUT IT? Responses to the loss of biodiversity and ecosystem health include measures that aim to conserve biodiversity or ensure the sustainable use and equitable sharing of natural resources. These response strategies are important for human well-being as they conserve current and future ecosystem services and develop synergies and tradeoffs with other sectoral needs (e.g. agriculture, ecotourism). In South Africa, there has been an upsurge in responses to biodiversity loss and degradation, as awareness of the importance of ecosystem services to human well-being takes root. These range from local to global responses, and are continuously developing. A description of the legal framework and institutional arrangements for environmental
Background Research Paper: Biodiversity and Ecosystem Health South Africa Environment Outlook October 2005
29
management and protection is given in the Governance chapter. Here we provide a brief overview of the most important applicable responses.
5.6.1 International agreements and obligations The political transformation in South Africa in 1994 was accompanied by significant policy and legal changes, including in the environmental arena. This change is underlined by the leading regional and international role South Africa plays in the development and roll-out of the New Partnership for African Development (NEPAD), the World Summit on Sustainable Development (WSSD) in 2002 and the subsequent Johannesburg Plan of Implementation. Additionally, the South African government’s policy on strengthening participation in international multi-lateral fora has enhanced the country’s leadership role. International interest in the establishment of Trans-boundary Protected Areas (TBPAs), Transfrontier Conservation Areas (TFCAs), contractual parksc, a people-centred approach to conservation and the country having been approached to be a founding member of the Like-minded Group of Mega-Diverse Countries, attests to this. A Regional Biodiversity Strategy and Action Plan is presently being finalized with other members of SADC.
South Africa is signatory or Party to almost 100 different multilateral environmental agreements (MEAs) ranging from broadly-focused agreements such as the Convention on Biological Diversity (CBD) to something as specific as the Agreement on the Conservation of African-Eurasian Migratory Waterbirds. This situation places a significant obligation and burden on South Africa to abide by the terms of each one of these agreements, a challenge shared by the majority of participating countries.
Global concern for biodiversity loss culminated in the United Nations Conference on the Environment and Development (UNCED), the Earth Summit, in Rio in 1992, from which the Convention on Biological Diversity (CBD) emerged. The CBD is founded on the principles that the Earth’s environment and its biodiversity are inextricably linked and that human impacts on biodiversity have direct impacts on human well-being. It has three main tenets, namely, the conservation of biodiversity, the sustainable use of the components of biodiversity, and the sharing of benefits arising from the commercial and other utilization of genetic resources in a fair and equitable way. As one of the obligations as a party to the CBD, South Africa is currently in the process of developing a National Biodiversity Strategy and Action Plan (NBSAP) which will ultimately contribute towards a National Biodiversity Framework. Globally, biodiversity loss has increased markedly since the inception of the CBD in 1993, underlining the fact that political agreements mean little without the commitment of resources. In recognition of this continuing challenge, a key outcome of the World Summit on Sustainable Development (WSSD) in Johannesburg in 2002, was the political commitment to achieve by 2010 a significant reduction in the current rate of loss of biological diversity – the 2010 Biodiversity Target. Achieving the Millennium Development Goals to ensure environmental sustainability and to halve global poverty will be impossible without achieving the 2010 Biodiversity Target.
Other biodiversity conventions include the Convention to Combat Desertification, the Convention on Migratory Species and the RAMSAR Convention on Wetlands of International Importance especially as waterfowl habitat, whose objectives include promoting the wise-use and conservation of all wetlands and the special protection of listed wetlands. In terms of its obligations to the RAMSAR Convention, South Africa has declared 17 sites as Wetlands of International Importance.
International trade in wildlife and wildlife products is regulated through the Convention on International Trade in Endangered Species of Wild Fauna and Flora which accords varying degrees of protection to more than 30 000 species of animals and plants to ensure that trade does not threaten their survival (CITES)d. South Africa ratified CITES in 1975 and is a significant
c Contractual Park definition: A park established through a contractual agreement between historically disadvantaged indigenous peoples (landowners) with land claims within proclaimed protected areas and the government institution responsible for the biodiversity management within such areas, whereby agreed benefits are accrued by such peoples enabling their socio-economic development. d CITES (www.cites.org )
Background Research Paper: Biodiversity and Ecosystem Health South Africa Environment Outlook October 2005
30
importer and exporter of CITES-listed species. Social and economic incentives given to local communities engaging in both legal and illegal utilization of natural resources are increasingly being recognized and used in order to promote the principles of sustainable use.
In terms of evaluating responses, it is crucial to recognize that the signing of political agreements is not sufficient to address or solve the threats to biodiversity, and that for there to be significant outcomes, these agreements need to be implemented at both national and local levels.
5.6.2 National policy and legislation
Legislation South Africa’s progressive constitutional framework has enabled the development of innovative national environmental legislation (See Box 4). The Biodiversity White Paper of 1997 sets out a number of goals, strategies, and priorities for conservation, sustainable use and equitable benefit-sharing. It also sets out the legal framework provided by the National Environmental Management Act (Act 107 of 1998) (NEMA) introduced a new era of management of the environment, culminating in the recent promulgation of national legislation on biodiversity use and conservation (NEM:Biodiversity Act (NEMBA) and NEM:Protected Areas Act (NEMPA)). If used wisely, these statutes alongside the NBSAP will prove to be invaluable tools in revolutionising biodiversity conservation, use, protection and management in South Africa at large - an opportunity that, in all likelihood, would have been wasted if it had not been for the impetus provided by the CBD. Some critical elements of the legal framework are discussed below.
South African National Biodiversity Institute The South African National Biodiversity Institute (SANBI) replaced the previous National Botanical Institute in 2004 through the enactment of NEMBA. It can be considered as one of the most important developments with regards to the institutional structure for biodiversity management as it is the first time that a technical body for centralized monitoring and reporting on the status of the country’s biodiversity has been formally established at a national level.
SANBI’s responsibilities now relate to the full diversity of South Africa's fauna and flora and builds on international best practice and research with special emphasis on outreach programmes. SANBI will act as a comprehensive national consultative and advisory body on the full spectrum of biodiversity issues and the communication thereof.
South African National Parks The South African National Parks organization (SANParks), established in terms of the National Parks Act in 1926 (Act No. 56 of 1926), is today the leading statutory conservation authority, responsible for over 3 750 000 hectares of protected land in 20 National Parks. The SANParks Mission statement reads: To develop and manage a system of national parks that represents the biodiversity, landscapes, and associated heritage assets of South Africa for the sustainable use and benefit of all. Since 1994, the then National Parks Board, supported by the Department of Environmental Affairs and Tourism, has worked to make national parks more accessible to the public and tourists, both local and international, in order to ensure conservation contributes to overall social and economic development, whilst maintaining high standards of research and management and expanding the land under its protection. SANParks has also begun to generate 75% of its operating revenue – an impressive financial achievement compared to most conservation agencies in the world, including those in developed countries. This is not, however, without controversy, the debate raging between whether the country’s natural assets should be ‘sold-off’ to concessionaires or protected as the last undisturbed examples of our natural heritage.
The River Health Programme The River Health Programme (RHP) was initiated in 1994 by the Department of Water Affairs and Forestry. The programme was developed with the overall goal of expanding the ecological basis of information on aquatic resources, in order to support the rational management of these
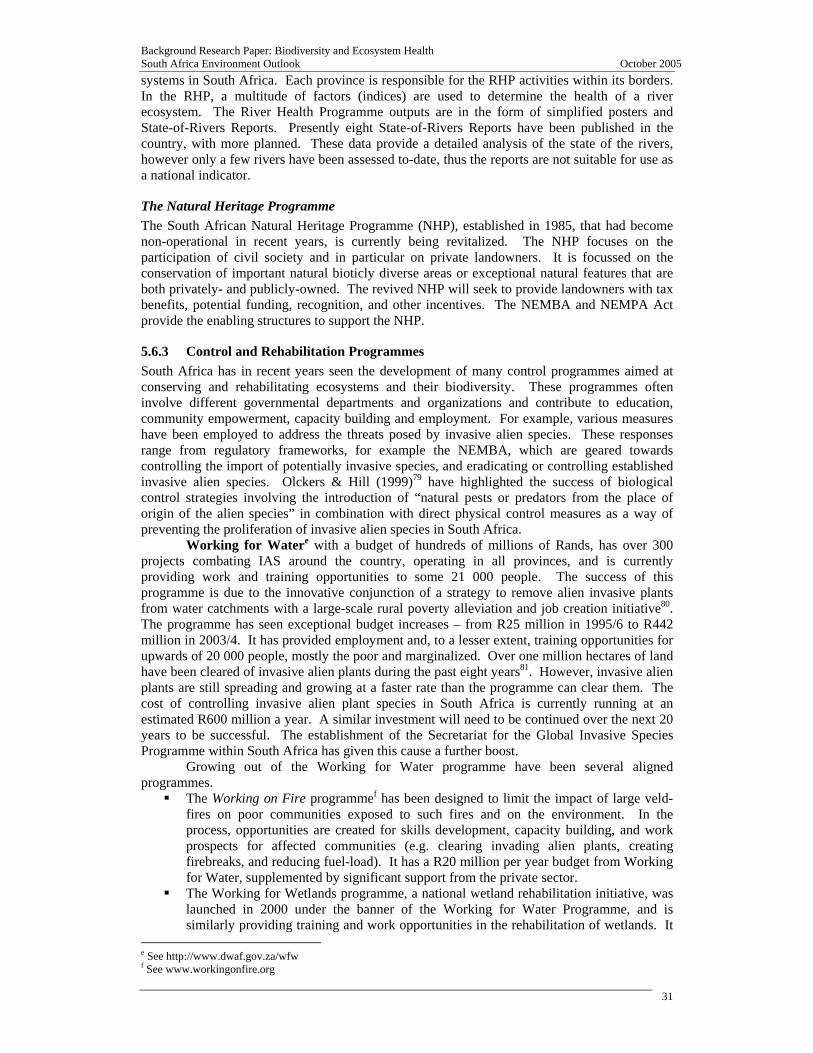
Background Research Paper: Biodiversity and Ecosystem Health South Africa Environment Outlook October 2005
31
systems in South Africa. Each province is responsible for the RHP activities within its borders. In the RHP, a multitude of factors (indices) are used to determine the health of a river ecosystem. The River Health Programme outputs are in the form of simplified posters and State-of-Rivers Reports. Presently eight State-of-Rivers Reports have been published in the country, with more planned. These data provide a detailed analysis of the state of the rivers, however only a few rivers have been assessed to-date, thus the reports are not suitable for use as a national indicator.
The Natural Heritage Programme The South African Natural Heritage Programme (NHP), established in 1985, that had become non-operational in recent years, is currently being revitalized. The NHP focuses on the participation of civil society and in particular on private landowners. It is focussed on the conservation of important natural bioticly diverse areas or exceptional natural features that are both privately- and publicly-owned. The revived NHP will seek to provide landowners with tax benefits, potential funding, recognition, and other incentives. The NEMBA and NEMPA Act provide the enabling structures to support the NHP.
5.6.3 Control and Rehabilitation Programmes South Africa has in recent years seen the development of many control programmes aimed at conserving and rehabilitating ecosystems and their biodiversity. These programmes often involve different governmental departments and organizations and contribute to education, community empowerment, capacity building and employment. For example, various measures have been employed to address the threats posed by invasive alien species. These responses range from regulatory frameworks, for example the NEMBA, which are geared towards controlling the import of potentially invasive species, and eradicating or controlling established invasive alien species. Olckers & Hill (1999)79 have highlighted the success of biological control strategies involving the introduction of “natural pests or predators from the place of origin of the alien species” in combination with direct physical control measures as a way of preventing the proliferation of invasive alien species in South Africa.
Working for Watere with a budget of hundreds of millions of Rands, has over 300 projects combating IAS around the country, operating in all provinces, and is currently providing work and training opportunities to some 21 000 people. The success of this programme is due to the innovative conjunction of a strategy to remove alien invasive plants from water catchments with a large-scale rural poverty alleviation and job creation initiative80. The programme has seen exceptional budget increases – from R25 million in 1995/6 to R442 million in 2003/4. It has provided employment and, to a lesser extent, training opportunities for upwards of 20 000 people, mostly the poor and marginalized. Over one million hectares of land have been cleared of invasive alien plants during the past eight years81. However, invasive alien plants are still spreading and growing at a faster rate than the programme can clear them. The cost of controlling invasive alien plant species in South Africa is currently running at an estimated R600 million a year. A similar investment will need to be continued over the next 20 years to be successful. The establishment of the Secretariat for the Global Invasive Species Programme within South Africa has given this cause a further boost.
Growing out of the Working for Water programme have been several aligned programmes.
The Working on Fire programmef has been designed to limit the impact of large veld-fires on poor communities exposed to such fires and on the environment. In the process, opportunities are created for skills development, capacity building, and work prospects for affected communities (e.g. clearing invading alien plants, creating firebreaks, and reducing fuel-load). It has a R20 million per year budget from Working for Water, supplemented by significant support from the private sector.
The Working for Wetlands programme, a national wetland rehabilitation initiative, was launched in 2000 under the banner of the Working for Water Programme, and is similarly providing training and work opportunities in the rehabilitation of wetlands. It
e See http://www.dwaf.gov.za/wfw f See www.workingonfire.org
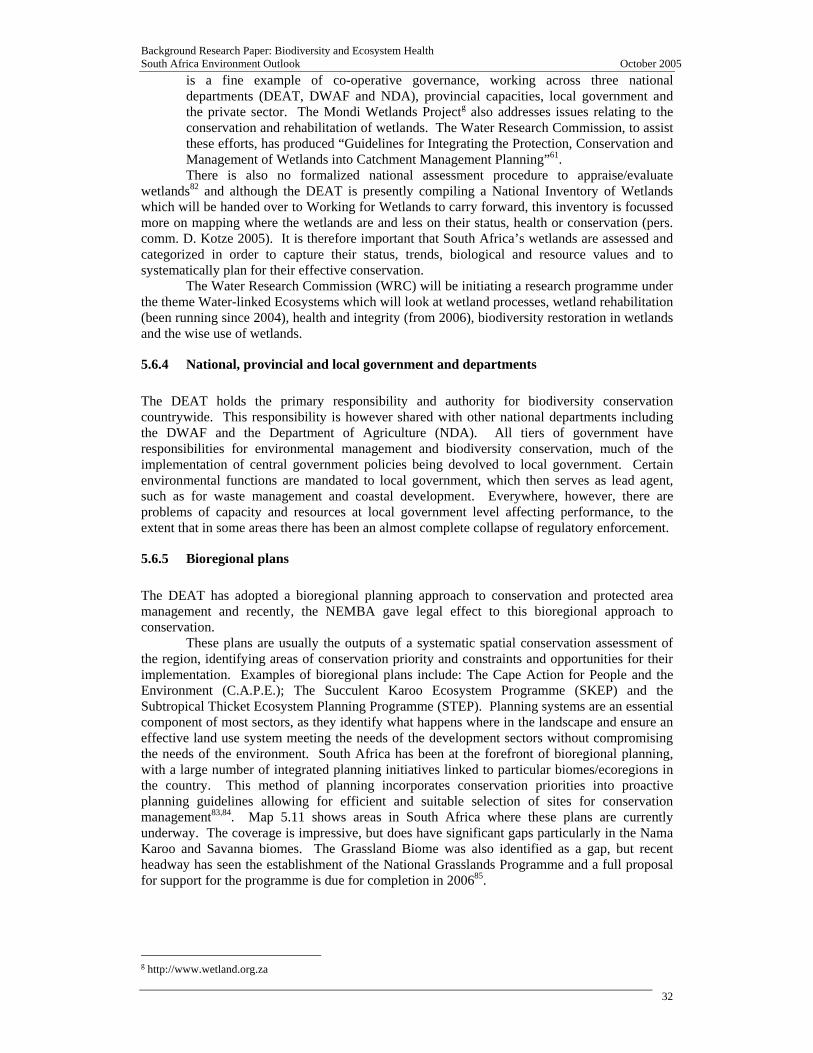
Background Research Paper: Biodiversity and Ecosystem Health South Africa Environment Outlook October 2005
32
is a fine example of co-operative governance, working across three national departments (DEAT, DWAF and NDA), provincial capacities, local government and the private sector. The Mondi Wetlands Projectg also addresses issues relating to the conservation and rehabilitation of wetlands. The Water Research Commission, to assist these efforts, has produced “Guidelines for Integrating the Protection, Conservation and Management of Wetlands into Catchment Management Planning”61. There is also no formalized national assessment procedure to appraise/evaluate
wetlands82 and although the DEAT is presently compiling a National Inventory of Wetlands which will be handed over to Working for Wetlands to carry forward, this inventory is focussed more on mapping where the wetlands are and less on their status, health or conservation (pers. comm. D. Kotze 2005). It is therefore important that South Africa’s wetlands are assessed and categorized in order to capture their status, trends, biological and resource values and to systematically plan for their effective conservation.
The Water Research Commission (WRC) will be initiating a research programme under the theme Water-linked Ecosystems which will look at wetland processes, wetland rehabilitation (been running since 2004), health and integrity (from 2006), biodiversity restoration in wetlands and the wise use of wetlands.
5.6.4 National, provincial and local government and departments The DEAT holds the primary responsibility and authority for biodiversity conservation countrywide. This responsibility is however shared with other national departments including the DWAF and the Department of Agriculture (NDA). All tiers of government have responsibilities for environmental management and biodiversity conservation, much of the implementation of central government policies being devolved to local government. Certain environmental functions are mandated to local government, which then serves as lead agent, such as for waste management and coastal development. Everywhere, however, there are problems of capacity and resources at local government level affecting performance, to the extent that in some areas there has been an almost complete collapse of regulatory enforcement.
5.6.5 Bioregional plans The DEAT has adopted a bioregional planning approach to conservation and protected area management and recently, the NEMBA gave legal effect to this bioregional approach to conservation.
These plans are usually the outputs of a systematic spatial conservation assessment of the region, identifying areas of conservation priority and constraints and opportunities for their implementation. Examples of bioregional plans include: The Cape Action for People and the Environment (C.A.P.E.); The Succulent Karoo Ecosystem Programme (SKEP) and the Subtropical Thicket Ecosystem Planning Programme (STEP). Planning systems are an essential component of most sectors, as they identify what happens where in the landscape and ensure an effective land use system meeting the needs of the development sectors without compromising the needs of the environment. South Africa has been at the forefront of bioregional planning, with a large number of integrated planning initiatives linked to particular biomes/ecoregions in the country. This method of planning incorporates conservation priorities into proactive planning guidelines allowing for efficient and suitable selection of sites for conservation management83,84. Map 5.11 shows areas in South Africa where these plans are currently underway. The coverage is impressive, but does have significant gaps particularly in the Nama Karoo and Savanna biomes. The Grassland Biome was also identified as a gap, but recent headway has seen the establishment of the National Grasslands Programme and a full proposal for support for the programme is due for completion in 200685.
g http://www.wetland.org.za
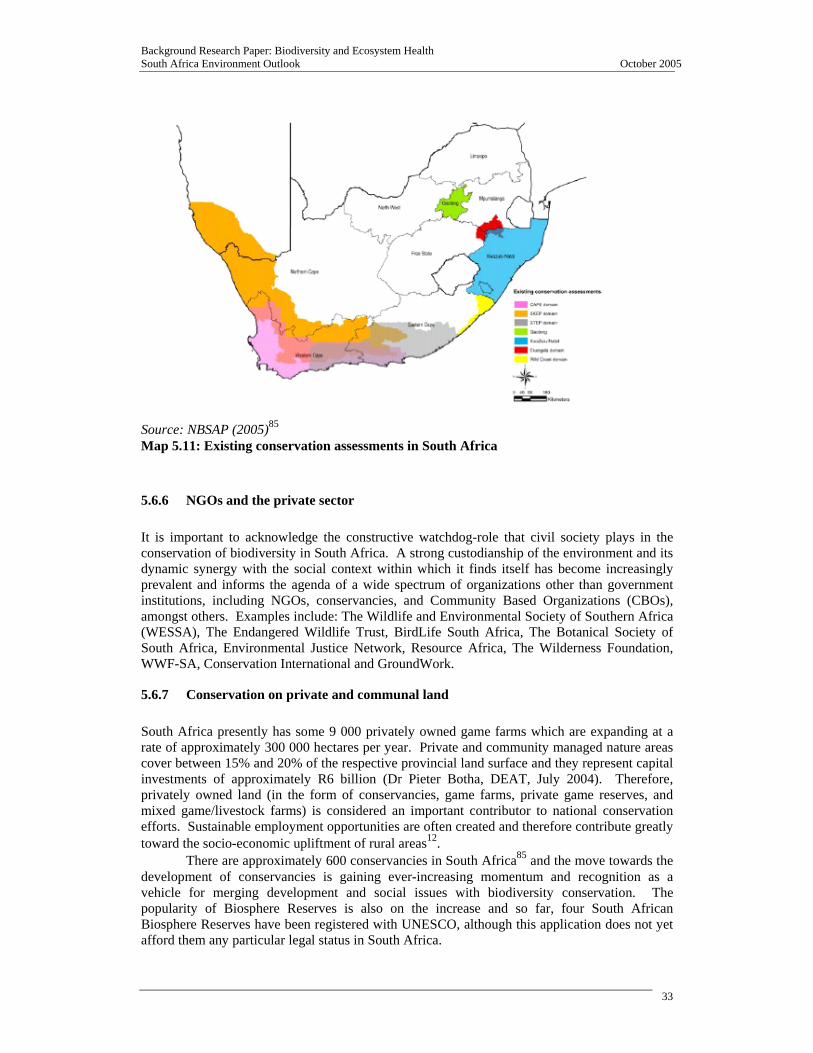
Background Research Paper: Biodiversity and Ecosystem Health South Africa Environment Outlook October 2005
33
Source: NBSAP (2005)85 Map 5.11: Existing conservation assessments in South Africa
5.6.6 NGOs and the private sector It is important to acknowledge the constructive watchdog-role that civil society plays in the conservation of biodiversity in South Africa. A strong custodianship of the environment and its dynamic synergy with the social context within which it finds itself has become increasingly prevalent and informs the agenda of a wide spectrum of organizations other than government institutions, including NGOs, conservancies, and Community Based Organizations (CBOs), amongst others. Examples include: The Wildlife and Environmental Society of Southern Africa (WESSA), The Endangered Wildlife Trust, BirdLife South Africa, The Botanical Society of South Africa, Environmental Justice Network, Resource Africa, The Wilderness Foundation, WWF-SA, Conservation International and GroundWork.
5.6.7 Conservation on private and communal land South Africa presently has some 9 000 privately owned game farms which are expanding at a rate of approximately 300 000 hectares per year. Private and community managed nature areas cover between 15% and 20% of the respective provincial land surface and they represent capital investments of approximately R6 billion (Dr Pieter Botha, DEAT, July 2004). Therefore, privately owned land (in the form of conservancies, game farms, private game reserves, and mixed game/livestock farms) is considered an important contributor to national conservation efforts. Sustainable employment opportunities are often created and therefore contribute greatly toward the socio-economic upliftment of rural areas12.
There are approximately 600 conservancies in South Africa85 and the move towards the development of conservancies is gaining ever-increasing momentum and recognition as a vehicle for merging development and social issues with biodiversity conservation. The popularity of Biosphere Reserves is also on the increase and so far, four South African Biosphere Reserves have been registered with UNESCO, although this application does not yet afford them any particular legal status in South Africa.
Background Research Paper: Biodiversity and Ecosystem Health South Africa Environment Outlook October 2005
34
In the South African context, the remnants of apartheid continue to have a very particular impact on the manner in which we protect our biodiversity and the management thereof. The outcome of land restitution claims lodged by communities who were forcibly dislodged from their land whilst the pre-1994 government was in the process of expanding protected areas, and who still hold title to these lands, has led to the establishment of contractual parks between government agencies and these communities. These agreements were flagged as a world-first during the 5th World Parks Congress in 2003. Examples include the Makuleke, Khomani San and Mier communities.
5.6.8 Cross-cutting programmes and projects The overall goal of all these programmes and actions is to integrate conservation and sustainable use of biodiversity into relevant sectoral and cross-sectoral plans, programmes and policies, as is highlighted as a requirement by the Convention of Biological Diversity. This mainstreaming of biodiversity includes situations where there can be the simultaneous achievement of biodiversity and economic gains, situations where biodiversity losses are exceeded by biodiversity gains, the recognition that a sectoral activity is dependant on sustainable use of biodiversity and the inclusion of biodiversity concerns into sectoral policies86. The overall objective of mainstreaming biodiversity entails the full-scale integration of conservation priorities into those sectors that are responsible for ongoing biodiversity loss87.
One of the main incentives that is driving the mainstreaming of biodiversity into other sectors is the fact that biodiversity contributes directly towards both economic and social development. Mainstreaming biodiversity involves the integration of the values and goals of biodiversity conservation and sustainable use into economic sectors and development policies and programmes.
Although mainstreaming initiatives may be catalysed by conservation agencies, increasingly often they originate within economic sectors, and typically involve a broad range of actors, with partnerships between NGOs, government, industry, small, medium and micro enterprizes, and communities88.
5.7 CONCLUSIONS
5.7.1 Priority areas It is obvious from the assessments covered in this report that neither biodiversity nor the pressures that threaten it are evenly distributed across the country. Areas of high biodiversity unfortunately coincide with areas that face the greatest accumulation of pressures. These priority areas include the south-western Cape, the central grasslands and the eastern coastal regions. These are some of South Africa's most biodiverse areas, as is evidenced by the presence of global biodiversity hotspots (based on a combination of plant diversity and pressures in these regions. In addition to the south-western Cape, it is the northern and eastern parts of the country that experience the greatest pressures, and yet the established bioregional programmes are mostly focussed in the southern region (although the newly established Grasslands Biome Programme, Mpumalanga Programme and Wild Coast Conservation and Development Project should help correct some of this bias). The northern and eastern parts of South Africa (particularly the Eastern Cape) are home to many poor and rural communities who are, because of these pressures, more adversely affected because they are reliant largely on the natural environment and the services it provides. There is thus great urgency for developing appropriate conservation responses for these important and threatened areas.
5.7.2 Reducing the rate of biodiversity loss (the 2010 Biodiversity Target) In line with global trends, South Africa’s biodiversity and ecosystem health have declined most rapidly in the past few decades89,90. Strong evidence exists that despite the fact that many people benefit from ecosystem services, ecosystem health and services worldwide are declining
Background Research Paper: Biodiversity and Ecosystem Health South Africa Environment Outlook October 2005
35
rapidly for at least 60% of the measured services due to land-use change, climate change, alien species invasions and other direct drivers of environmental change. These pressures show no signs of decreasing, they are either constant or increasing in strength and are projected to continue or to accelerate in the future90.
The predictions that drivers of change in biodiversity will stay stable or increase implies that for South Africa, similarly to the rest of the world, attaining the goal of reducing the rates of biodiversity loss by 2010 will not be possible90. The negative consequences of the subsequent opportunity costs cannot be over-emphasized. However, sub- components of this target may well be within our reach e.g., habitat loss is slowing in some regions of the country. The Millennium Ecosystem Assessment states that: “an unprecedented effort would be needed to achieve by 2010 a significant reduction in the rate of biodiversity loss at all levels”. They recommend that instead of short-term goals and targets, which do not align with the characteristic longer response times of political, socio-economic and ecological systems, longer term goals and targets are also necessary (e.g. 2050).
5.7.3 Improvement of data base The information on indicators presented in this chapter provides an overview of biodiversity status. The validity of some of the indicators is questionable in terms of their age and comprehensiveness, but they represent an appropriate set of biodiversity indicators. It is clear that there are some critical indicators for which we have no adequate data and without which our assessment of the current situation is incomplete. These include, most importantly, up-to-date land cover information, as well as information at finer scales of the spatial distribution of habitat degradation. Additionally, there are a few developing trends (e.g. the increased prevalence of Genetically Modified Organisms (GMOs, see Box 2)) which might prove, in the future, to have negative impacts on biodiversity, but for which we currently do not have reliable data.
5.7.4 Positive messages Reporting on the state of biodiversity is often an exercise in “doom and gloom”, due to the pervasiveness of the increasing negative trends in biodiversity loss and ecosystem health decline. However, South Africa is responding with a sense of urgency. The section on responses highlights the multitude of often cutting-edge responses that have put South Africa at the forefront of biodiversity conservation worldwide. The successful implementation of some of these responses will go a long way to achieving goals like the 2010 target. The establishment of the SANBI, the completion of the first National Spatial Biodiversity Assessment, a robust National Biodiversity Strategy and Action Plan, and the extensive coverage of bioregional plans (well supported by legislation), attest to a growing awareness in all sectors of society of the importance of biodiversity to humanity.
The involvement of a very active civil society in South Africa in many environmental issues has played a significant role in improving the state of the country’s biodiversity. As highlighted in the MA “less biodiversity would exist today had not communities, NGOs, governments, and, to a growing extent, business and industry taken actions to conserve biodiversity, mitigate its loss, and support its sustainable use”. In terms of the involvement of business and industry in biodiversity conservation, South Africa is already a world leader in the field of “mainstreaming”86. Moreover, this is all having positive results, problems of capacity and resources not withstanding, as is demonstrated in the story of the Blue Swallow, presented in Box 8.
Additionally, South Africa contains a wealth of further opportunities for good biodiversity conservation and sustainable use. With large swathes of natural habitat remaining in many parts of the country (a situation not common in many other countries; the opportunities for conservation and biodiversity-friendly land uses (e.g. game ranching) are significant. Our tourism industry, second only to manufacturing in contributing to GDP (and the fastest-growing
Background Research Paper: Biodiversity and Ecosystem Health South Africa Environment Outlook October 2005
36
sector), provides an excellent incentive for better biodiversity management and economic benefits.
However, it needs to be noted that all of the highly commendable policies, plans and strategies need to be fully entrenched and implemented on the ground to achieve the admirable stated objectives of not only biodiversity conservation, but sound ecosystem health and functioning to underpin socio-economic development.
5.8 REFERENCES 1 World Conservation Monitoring Centre (WCMC) (1992). Global Biodiversity: Status of the Earth’s
Living Resources. Chapman and Hall, London 2 Driver, A., Maze, K., Rouget, M., Lombard, A.T., Nel, J., Turpie, J.K., Cowling, R.M., Desmet, P.,
Goodman, P., Harris, J., Jonas, Z., Reyers, B., Sink, K. & Strauss, T. (2005). National Spatial Biodiversity Assessment 2004: priorities for biodiversity conservation in South Africa. Strelitzia 17. South African National Biodiversity Institute, Pretoria.
3 Bohensky, E., Reyers, B., van Jaarsveld, A.S., Fabricius, C., Erasmus, L., Ginsburg, A., Holgate, C., Knowles, T., Lebesa, L.N., Pfab, M., van der Merwe, M., Shackleton, C., and Zondo., L. (2004). Ecosystem Services in the Gariep Basin: a component of the Southern African Millennium Ecosystem Assessment (SAfMA), pp. 140. Millennium Ecosystem Assessment, Stellenbosch University, Stellenbosch, South Africa.
4 Endangered Wildlife Trust.(EWT) (2002). The Biodiversity of South Africa 2002: Indicators, Trends and Human Impacts. Cape Town: Struik.
5 Taken from (C.A.P.E. - Cape Action for People and the Environment URL: www.capeaction.org.za). 6 DEAT. (1997) White Paper on the Conservation and Sustainable Use of
South Africa's Biological Diversity. 7 Low, A.B., & Rebelo, A.G. (eds). Vegetation of South Africa, Lesotho and Swaziland. Department of
Environmental Affairs and Tourism, Pretoria. 8 Mittermeier, R. A., Gil, P.R., Hoffman, M., Pilgrim, J., Brooks, T., Mittermeier, C.G., Lamoreux, J., &
de Fonseca, G.A.B. (2005) Hotspots Revisited: Earth's Biologically Richest and Most Endangered Ecoregions. The University of Chicago Press
9 Daily, G. (ed) (1997). Nature’s Services. Societal Dependence on Natural Ecosystems. Island Press, Washington DC.
10 Costanza R, D’Arge R, DeGroot R, Farber S, Grasso M, Hannon B, Limburg K, Naeem S, O’Neill RV, Paruelo J, Raskin RG, Sutton P, van den Belt M (1997). The value of the world’s ecosystem services and natural capital. Nature 387, 253–260.
11 Balmford, A., Bruner, A., Cooper, P., Costanza, R., Farber, S., Green, R.E., Jenkins, M., Jefferiss, P., Jessamy, V., Madden, J., Munro, K., Myers, N., Naeem, S., Paavola, J., Rayment, M., Rosendo, S., Roughgarden, J., Trumper, K. and R. Kerry Turner (2002). Economic Reasons for Conserving Wild Nature. Science. Vol. 297, Issue 5583, 950-953, 9 August 2002.
12 Scholes, R.J. and Biggs, R. (eds). (2004). Ecosystem Services in Southern Africa: A Regional Assessment. Southern African Millennium Ecosystem Assessment (SAfMA). Council for Scientific and Industrial Research, Pretoria, South Africa.
13 Sala, O. E. (2000). Global biodiversity scenarios for the year 2100. Science 287: 1770-1774. 14 Pressey, R.L., R.M. Cowling, M. Rouget. (2003). Formulating conservation targets for biodiversity
pattern and process in the Cape Floristic Region, South Africa. Biological Conservation 112 99–127. 15 Rouget, M., Reyers, B., Jonas, Z., Desmet, P., Driver, A., Maze, K., Egoh, B. & Cowling, R.M. (2004).
South African National Spatial Biodiversity Assessment 2004: Technical Report. Volume 1: Terrestrial Component. Pretoria: South African National Biodiversity Institute.
16 Hoffman M.T., Todd, S.W., Ntshona, Z. & Turner, S.D. (1999). A national review of land degradation in South Africa. Department of Environmental Affairs and Tourism, Pretoria. 245 pp.
17 Scholes R. J. & Biggs R. (2005). A Biodiversity Intactness Index. Nature 434, 45 – 49. 18 National Land-cover database 1996, CSIR 19 NBI & GISP. (2004). Invasive Alien Species. A challenge to NEPAD. Africans working together to
protect life and livelihoods. Published by the National Botanical Institute and The Global Invasive Species Programme in 2004. ISBN NO. 1 – 919684 – 41 – 7.
20 Nel, J.L., Richardson, D.M.; Rouget, M.; Mgidi, T.N.; Mdzeke, N.; Le Maitre, D.C.; Van Wilgen, B.W.; Schonegevel, L.; Henderson, L.; Neser, S. (2004). A proposed classification of invasive alien
Background Research Paper: Biodiversity and Ecosystem Health South Africa Environment Outlook October 2005
37
plant species in South Africa: Towards prioritizing species and areas for management action: working for water. South African Journal of Science, Vol. 100, Issue 1 & 2, Jan / Feb. pp.53-64.
21 McDonald, I.A.W., van Wilgen, B.W. & Mgidi, T.N. (2004). Towards a National Strategy for Delaing with Invasive Alien Species in South Africa. Draft Report. Prepared for The Working for Water Programme. (http://www.environment.gov.za).
22 Versveld, D., D.C. le Maitre and R.A. Chapman. (1998). Alien Invading plants and Water Resources in South Africa: A Preliminary Assessment. Water Research Commission, Pretoria.
23 Lloyd JW, van den Berg EC and van Wyk E. (1999). The mapping of threats to biodiversity in the Cape Floristic Region with the aid of remote sensing and geographic information systems. Agricultural Research Council – Institute for Soil, Climate and Soil. Report No. GW/A1999/54. ARC, Pretoria.
24 Cowling, R.M., Pressey, R.L., Lombard, A.T., Heijnis, C.E., Richardson, D.M. & Cole, N. (1999). Framework for a conservation plan for the Cape Floristic Region. IPC Report 9902 submitted to WWF:SA.
25 Rouget, M., Richardson, D.M., Nel, J., Le Maitre, D.C., Egoh, B.N., Mgidi, T. (2004). Mapping the potential ranges of major plant invaders in South Africa, Lesotho and Swaziland using climatic suitability. Diversity and Distribution. Vol. 10, no. 5-6. Pp 475-482.
26 Snaddon C.D., Davies B.R and Wishart M.J. (1999) A global overview of inter-basin transfer schemes, with an appraisal of their ecological, socio-economic and socio-political implications, and recommendations for their management. WRC Report TT120/00.
27 Griffiths, C. L., van Sittert, L., Best, P. B., Brown, A. C., Clark, B. M., Cook, P. A., Crawford, R. J. M., David, J. H.M, Davies, B. R., Griffiths, M. H., Hutchings, K., Jerardino, A., Kruger, N., Lamberth, S., Leslie, R., Melville-Smith, R., Tarr, R. and van der Lingen, C. D. (2004). Impacts of Human Activities on Marine Animal Life in the Benguela: A Historical Overview. Oceanography and Marine Biology: An Annual Review. Vol. 42 303-392.
28 Mander, M. (1998). The Marketing of Indigenous Medicinal Plants in South Africa: A Case Study in KwaZulu–Natal. Forest Products Marketing Programme. Rome: FAO.
29 Williams, V.L. (2004). Trade and socio-economic value of forest and woodland resources within the medicinal plant market in Johannesburg. P439-472. In M.J. Lawes, H.A.C. Eeley, C.M. Shackleton & B.S. Geach (eds) Indigenous Forests and Woodlands in South Africa: Policy, People and Practice. University of Natal Press, Pietermaritzburg.
30 Eberhard, A. A. (1990) Energy Consumption Patterns and Supply Problems in Underdeveloped Areas in South Africa. Development South Africa, 7, 335-346.
31 DEAT. (2003). People, Parks and Transformation in South Africa: A Century of Conservation, a Decade of Democracy. Department of Environmental Affairs and Tourism.
32 Tarr R. J. P., Williams P. V. G., MacKenzie A. J. (1996) Abalone, sea urchins and rock lobsters: a possible ecological shift may affect traditional fisheries. South African Journal of Marine Science 17: 319-323.
33 Mayfield S. & Branch G. M. (2000) Interrelations among rock lobsters, sea urchins and juvenile abalone: implications for community management. Canadian Journal of Fisheries and Aquatic Science 57:2175-2185.
34 Day E, and Branch GM. Effects of sea urchins (Parechinus angulosus) on recruits and juveniles of abalone Haliotis midae). Ecology 2002;72:133-149.
35 Scholes, R.J. (2002). The winds of change. Science in Africa: Africa’s first on-line science magazine. URL: http://www.scienceinafrica.co.za/2002/december/change.htm .
36 Intergovernmental Panel on Climate Change (IPCC) (2001). 3rd Assessment Report Synthesis: Climate Change 2001.
37 Gitay, H., A. Suarez, R.T. Watson and D.J. Dokken (eds.). (2002). Climate change and biodiversity. Intergovernmental Panel on Climate Change Technical Paper, Geneva. 77.
38 Hulme, M. (ed.). (1996). Climate change in southern Africa: An exploration of some potential impacts and implications in the SADC region. Climate research Unit, University of East Anglia, Norwich, UK. 96 pp.
39 Rutherford, M.C., G.F. Midgley, W.J. Bond, L.W. Powrie, R. Roberts and J. Allsopp, (1999). Plant biodiversity. In: Climate Change Impacts in southern Africa, G. Kiker (ed.). South African Study on Climate Change, vulnerability and adaptation assessment. Department of Environment Affairs and Tourism, Pretoria, South Africa.
40 Erasmus, B.F.N., A.S. van Jaarsveld, S.L. Chown, M. Kshatriya and K. Wessels (2002). Vulnerability of South African animal taxa to climate change. Global Change Biology 8, 679–691.
41 Foden, W., G.F. Midgley, W.J. Bond and J. Bishop (2003). Population declines of Aloe dichotoma (Kokerboom) – revealing early impacts of climate change. National Symposium on Global Change and Regional Sustainability in South Africa, Kistenbosch, Cape Town 27-29 October 2003.
Background Research Paper: Biodiversity and Ecosystem Health South Africa Environment Outlook October 2005
38
42 Bond, W.J., G.F. Midgely and F.I. Woodward, (2003). The importance of low atmospheric CO2 and
fire in promoting the spread of grasslands and savannas. Global Change Biology 9, 973-982. 43 Van Jaarsveld, A. S. and S. L. Chown (2001). Climate change and its impacts in South Africa. Trends
in Ecology & Evolution 16(1): 13-14. 44 Midgley G, Rutherford, M & Bond, W. (2001). The Heat is On…: Impacts of climate change on plant
diversity in South Africa. National Botanic Institute, Cape Town, South Africa. 45 Brundrit GB. (1995). Trends in southern Africa sea level: statistical analysis and interpretation. South
African Journal of Marine Science; 16: 9-17. 46 Nicholls R. J., Hoozemans F. M. J. and Marchand M. (1999) Increasing flood risk and wetland losses
due to global sea-level rise: regional and global analyses. Global Environmental Change; 9: 69-87. 47 Klein R. J. T. and Nicholls R. J. (1999). Assessment of coastal vulnerability to climate change. Ambio;
28: 182-187. 48 Clark, B. M. in press. Climate change: a looming challenge for fisheries management in southern
Africa. Marine Policy. 49 Whitfield, A.K. (1998). Biology and ecology of fishes in southern African estuaries. JLB Smith
Institute of Ichthyology, Grahamstown. 50 Griffiths, M. H. (2000). Long-term trends in catch and effort of commercial linefish off South Africa’s
Cape Province: snapshots of the 20th century. South African Journal of Marine Science 22, 8-110. 51 Department of Water Affairs and Forestry (DWAF) (2004). Water Quality Management Series Sub-
Series No. MS 13.4. Operational policy for the disposal of land-derived water containing waste to the marine environment of South Africa: Appendices Edition 1. Pretoria.
52 Nel, J., Maree, G., Roux, D., Moolman, J., Kleynhans, N., Silberbauer, M. & Driver, A. (2004a). South African National Spatial Biodiversity Assessment 2004: Technical Report. Volume 2: River Component. CSIR Report Number ENV-S-I-2004-063. Stellenbosch: Council for Scientific and Industrial Research.
53 Mitsch, W. J., & Gosselink, J. G. (1986). Wetlands. Van Nostrand Reinhold, New York. Kotze, D.C. Breen, C.M. and Quinn, N. 1995. Wetland losses in South Africa. In: Cowan GI (ed.) Wetlands of South Africa. Department of Environmental Affairs and Tourism, Pretoria.
54 Kotze DC & Breen CM (1994) Agricultural Land-use impacts on Wetyland Functional Values. Water Research Commission Report 501-3-94.
55 Mondi Wetlands Project. URL: http://www.wetland.org.za 56 Parsons R (2004). Surface Water – Groundwater Interaction in a Southern African Context. Prepared
for the Water Research Commission WRC Report No. TT 218/03. 57 Kotze, D.C. Breen, C.M. and Quinn, N. 1995. Wetland losses in South Africa. In: Cowan GI (ed.)
Wetlands of South Africa. Department of Environmental Affairs and Tourism, Pretoria. 58 Begg, G. W. (1989). The wetlands of Natal (Part 3). The location, status and function of the priority
wetlands of Natal. Natal Town and Regional Planning Report 73. 59 Adie, H., Lewis, F. & Nxele, B. Institute of Natural Resources. (2004). National Biodiversity Strategy
and Action Plan. Stocktaking and Assessment. Sustainable Use of Biodiversity: Key issues, priorities and gaps. DRAFT REPORT. Prepared for DEAT. Investigational Report No.: 243.
60 Cowan, G.I. (1995) Wetlands of South Africa. Department of Environmental Affairs and Tourism. Pretoria.
61 Dickens C, Kotze D, Mashigo S, MacKay H and Graham M (2003). Guidelines for Integrating the Protection, Conservation and Management of Wetlands into Catchment Management Planning. Prepared for the Water Research Commission WRC Report No. TT 220/03 and WWF.
62 Heydorn, A.E.F. (1972). South African estuaries, their function and the threat to their existence. Findiver 32: 18–19.
63 Heydorn, A.E.F. (1973). South African estuaries: an economic asset or a national resource being squandered. Natal Wildlife 14: 10–15.
64 Morant, P. & Quinn, N. (1999). Influence of man and management of South African estuaries.In: Allanson, B.R. & Baird, D. (eds). Estuaries of South Africa. Pp. 289–320.Cambridge University Press, Cambridge.
65 Heydorn, A.E.F. (1986). An assessment of the state of the estuaries of the Cape and Natal in 1985/6. South African National Scientific Programmes Report No. 130. Pretoria: CSIR.
66 Heydorn, A.E.F. (1989). The conservation status of southern African estuaries. In: Huntley, B.J. (ed). Biotic diversity in southern Africa: concepts and conservation. Pp. 290–297. Oxford University Press, Cape Town.
67 Whitfield, A.K. (2000). Available scientific information on individual estuarine systems. WRC Report no. 577/3/00.
Background Research Paper: Biodiversity and Ecosystem Health South Africa Environment Outlook October 2005
39
68 Turpie, J. K. (2004). Estuaries component of the National Spatial Biodiversity Assessment for
development of South Africa's National Biodiversity Strategy and Action Plan. Report to National Botanical Institute, pp. 30.
69 Lombard, A. T., Strauss T., Harris, J., Sink, K., Attwood, C., Hutchings, L. (2004). South African National Spatial Biodiversity Assessment 2004 Technical Report. Volume 4: Marine Component. Pretoria: South African National Biodiversity Institute.
70 World Parks Congress (WPC) (2003). Stream: Marine. World Parks Congress Recommendation 5.22. IUCN World Parks Congress 2003, Durban, South Africa. IUCN.
71 Friedmann Y. and Daly B, (editors) 2004. Red Data Book of the Mammals of South Africa: A Conservation Assessment: CBSG Southern Africa, Conservation Breeding Specialist Group (SSC/IUCN), Endangered Wildlife Trust. South Africa.
72 Barnes, K. N. (ed) (2000). The Eskom Red Data Book of Birds of South Africa, Lesotho and Swaziland. Birdlife South Africa, Johannesburg.
73 Minter, L.R., M. Burger, J.A. Harrison, H.H. Braack, P.J. Bishop, and D. Kloepfer, eds. 2004. Atlas and Red Data Book of the Frogs of South Africa, Lesotho and Swaziland. SI/MAB Series #9. Smithsonian Institution, Washington, DC.
74 Van der Elst, R. and Beckley, L. (2001). Conservation of South African marine fishes. In: Verdoorn, G. H. and le Roux, J (eds). The State of South Africa’s species. Endangered Wildlife Trust.
75 Mann, B. Q. (ed.) (2000). Southern African marine linefish status reports. Oceanographic Research Institute, Durban: 257 p. (ORI Special Publication 7).
76 Griffiths, M. H. and Lamberth, S. J. (2002). Evaluating the marine recreational linefishery in South Africa. In: Recreational Fisheries: Ecological, Economic and Social Evaluation. Pitcher, T. and C. Hollingworth (Eds), Oxford, Blackwell Science. pp. 227-251.
77 Turpie, J.K., Heydenrych, B.J. & Lamberth, S.J. (2003). Economic value of terrestrial and marine biodiversity in the Cape Floristic Region: implications for defining effective and socially optimal conservation strategies. Biological Conservation 112: 233-251.
78 Ryan, P.G., Boix-hinzen, C., Enticott, J.W., Nel, D.C., Wanless, R. & Purves, M. (1997). Seabird mortality in the longline fishery for Patagonian Toothfish at the Prince Edward Islands: 1996/1997. CCAMLR-WG-FSA 97/51, Hobart, Tasmania.
79 Olckers, T. & Hill, M.P. (1999). Biological Control of weeds in South Africa (1990 – 1998). African Entomology Memoir No 1 of the Entomological Society of Southern Africa.
80 Van Wilgen, B.W., Le Maitre, D.C. and Cowling, R.M. (1998). Ecosystem services, efficiency, sustainability and equity: South Africa’s Working for Water programme. Trends in Ecology and Evolution 13, 378.
81 Preston, G. (2003). Invasive Alien Plants and Protected Areas in South Africa. Presentation to World Parks Congress, Durban, South Africa.
82 Kotze, D.C. (2003). Sustainable Management of Inland Wetlands in Southern Africa. A livelihoods and ecosystem approach. Country outline for South Africa. DRAFT COPY. Compiled for IWMI.
83 Cowling RM, Driver A, Lombard AT, Goodman PS and Botha MA. (2003). Building comprehensive protected area systems: experience with systematic conservation assessments. In: Cowan GI, Yawitch J and Swift M (eds), Strategic innovations in biodiversity conservation – the South African experience. Departments of Environmental Affairs and Tourism, Pretoria.
84 Driver A, Cowling RM and Maze K 2003. Planning for Living Landscapes: Perspectives and Lessons from South Africa. Center for Applied Biodiversity Science at Conservation International, Washington, DC and Botanical Society of South Africa, Cape Town.
85 NBSAP (South Africa’s National Biodiversity Strategy and Action Plan) (2005) South Africa Country Study: Situational Assessment undertaken to inform South Africa’s National Biodiversity Strategy and Action Plan (NBSAP) . Final draft. As at 6 May 2005. Department of Environmental Affairs and Tourism. (http://www.environment.gov.za)
86 Pierce, S.M., Cowling, R.M., Sandwith, T., MacKinnon, K. (Eds.) (2002). Mainstreaming Biodiversity in Development. Case Studies from South Africa. World Bank, Washington DC.
87 Cowling RM, Pierce, SM and Sandwith, T. (2002). Conclusions: the fundamentals of mainstreaming biodiversity. In: Pierce SM, Cowling RM and Sandwith T, MacKinnon K (eds), Mainstreaming biodiversity in development. Case studies from South Africa. World Bank, Washington.
88 UNEP (2004). STAP Mainstreaming Biodiversity in Production Landscapes and Sectors Discussion Paper. Mainstreaming Biodiversity in Production Landscapes Workshop. 20-24 September 2004, Cape Town, South Africa.
89 Biggs, R. & Scholes, R.J. (2002). Land-cover changes in South Africa 1911-1993. South African Journal of Science 98: 420-428.
90 Millennium Ecosystem Assessment (MA) (2005). Ecosystems and Human Well-being: Biodiversity Synthesis. World Resources Institute, Washington, DC.
Background Research Paper: Biodiversity and Ecosystem Health South Africa Environment Outlook October 2005
40