Embed Size (px)
Citation preview

Bioelectrical Impedance Analysis and Vasoconstriction
Taylor GuffeyLauren MorganHarry HanShelby HassbergerDaniel KimElizabeth MorrisRachel PatelRadu Reit

Problem Statement
• The purpose of this study is to evaluate whether the temperature of the room can affect the body fat percentage reading for an individual.

Sample Size• Sample size derived from pilot study• 23 estimated for statistical significance• 24 used in experiment
Exclusion/Inclusion Criteria: • Only students in BMED1300 will participate in this study as
part of a class project.

Hypothesis
Null Hypothesis• There will be no difference in the readings of body
fat percentage from 24oC to 4oC as measured by the bioelectrical impedance analysis.
Alternative Hypothesis • There will be a statistically significant increase in
body fat percentage when the readings are taken from 24oC to 4oC as measured by the bioelectrical impedance analysis.

Materials• Instruction Sheet• Name tags• Consent Form• Data Card• Survey• Jackets• Scale• Meter Stick• Omron HBF-360 Fat Analyzer• Thermometer• Space Heater • A room at 24o C• A room at 4o C
http://image3.examiner.com/images/blog/wysiwyg/image/omron_HBF-306.jpg

Methodology
• 2 groups of 12 subjects each• Read and sign consent form• Assign subject IDs and handout Data Card• Height and weight were measured• Subjects fill out survey• BIA measured after 10 minutes• Subjects transferred to Cold Room• BIA measured again after 10 minutes

Height
Survey & Time Table
Weight
Heater
BIA Reading Station
Chair
Door
Waiting Area
Warm Room 24oC
Time & BIA Reading Station
Door
Waiting Area
Ten Minutes Later Ten Minutes Later
Simulation
Cold Room 4oC

DataSubjects Height Weight (lbs) Gender Age Hot BIA Cold BIA
A1 6' 2" 184 Male 19 13.5 17.35A2 5' 8.5" 148 Male 18 15.9 17.65A3 5' 2" 137 Female 19 26.35 27.55A4 5' 11" 179 Male 19 16.65 16.7A5 5' 5" 141 Female 19 29.7 30.5A6 5' 8" 165 Male 20 18.25 19.05A7 5' 9.75" 166 Male 19 17.25 18.25A8 5' 4.75" 139 Female 18 25.1 26.35A9 5' 8.25" 135 Female 19 17.7 18.7
A10 5' 8" 155 Male 19 15.9 17.25A11 6' 0" 164 Male 18 13.2 15.6A12 5' 11.5" 182 Male 19 19.45 20.6B1 6' 2" 166 Male 19 11.95 13.65B2 5' 5.25" 148 Female 19 29.15 29.3B3 5' 10" 151 Male 19 7.5 9.85B4 6' 4" 211 Male 20 13.95 14.6B5 5' 10.75" 153 Male 18 14.7 16.95B6 6' 1" 186 Male 18 18.05 18.9B7 6' 2" 163 Male 18 13.7 14.4B8 5' 10" 170 Male 20 11.3 13.1B9 6' 0" 175 Female 19 24.5 25.6
B10 5' 11.75" 138 Male 19 9.65 11.05B11 6' 1.5" 171 Male 19 10.35 11.75B12 5' 10.5" 195 Male 19 18.6 19.95

Statistical Analysis
Statisticst-score 9.608p-value 1.2423E-09
Standard Deviation 0.617402438
Mean of Difference 1.237
•Student’s Dependent One-Tailed T-test
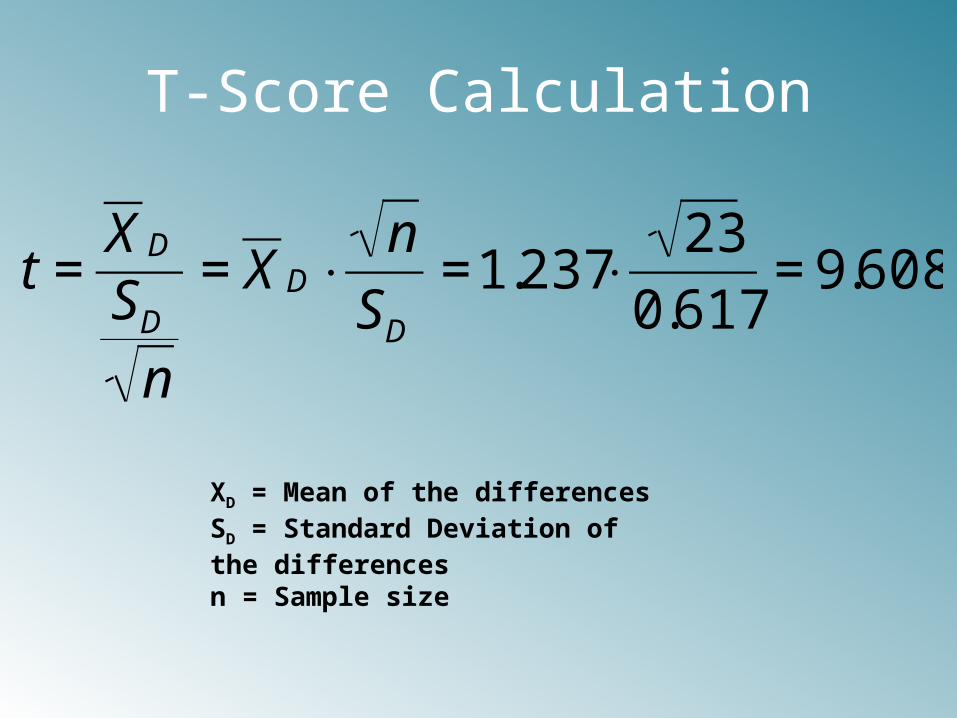
T-Score Calculation
XD = Mean of the differencesSD = Standard Deviation of the differencesn = Sample size
€
t =X DSDn
= X D ⋅n
SD=1.237⋅
23
0.617= 9.608

Analysis
T-value Needed= 1.72 for 95% confidence
T-score = 9.608P value = 1.24 x 10⁻⁹
Null Hypothesis is rejected0.2 0.4 0.6 0.8 1 1.2 1.4 1.6 1.8 2
0
0.5
1
1.5
2
2.5
Distribution of the Mean of the Dif-ferences
Mean of Differences
Nor
mal
Den
sity

Outliers
0 0.2 0.4 0.6 0.8 1 1.2 1.4 1.6 1.8

Discussion
• Null hypothesis is rejected
• Statistically significant increase in BIA readings
• Data supports the alternative hypothesis
• Strong correlation

Improvements
• Less subjects
• Smaller groups
• Multiple devices
• More time in each room
• Specific groups
– (e.g. gender, weight class, etc.)

Questions?