Embed Size (px)
Citation preview
© OECD/IEA 2011
Anselm Eisentraut
Bioenergy Analyst
Current status and future outlook for biofuels
EBTP 4th Stakeholder Plenary Meeting
Brussels, 14.09.2011
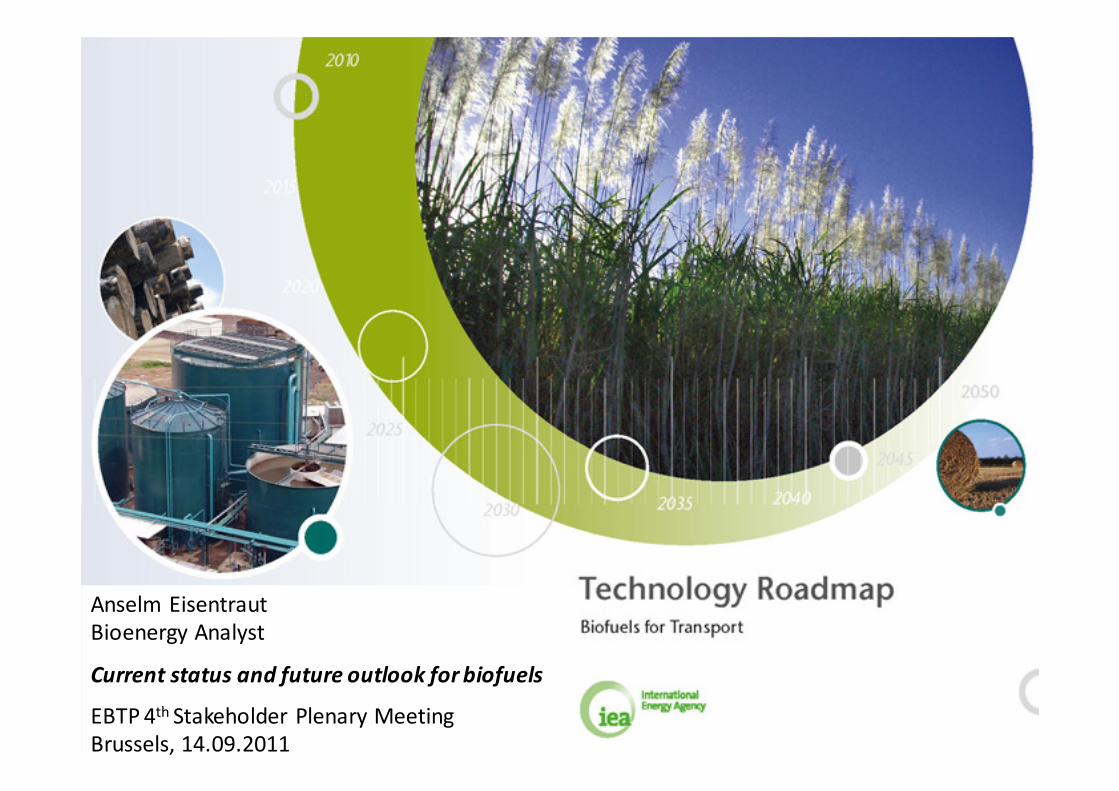
Global Biofuel Production – Medium-Term Outlook
• Global biofuels production rises from 1.8 mb/d (105 billion L) in
2010 to 2.3 mb/d (135 billion L) in 2016
– A total increase of 0.5 mb/d…
– …equivalent to an average yearly growth of 4.3% or 90 kb/d
• On an energy adjusted basis versus oil, biofuels supply increases
from 1.3 mb/d (2.4 EJ) in 2010 to 1.7 mb/d (3.4 EJ) in 2016
– Energy adjusted supply growth to meet 9% of gasoline and gasoil
growth, with ethanol at 24% of gasoline growth and biodiesel at 4%
of gasoil growth
– Yet, in 2016, biofuels satisfy only 1.8% of total global demand
0.0
0.4
0.8
1.2
1.6
2.0
2.4
2.8
2010 2011 2012 2013 2014 2015 2016
mb/d Global Biofuels Supply
US Biofuels Brazil Biofuels
OECD Europe Bio fuels Rest of Global Biofuels
World: Total Biofuels Demand
Adjusted for Energy Content
1.0
1.1
1.2
1.3
1.4
1.5
1.6
1.7
1.8
2008 2009 2010 2011 2012 2013 2014 2015 2016
mb/d
1.2%
1.4%
1.6%
1.8%
2.0%
Biofuels Share of Total Demand
© OECD/IEA 2011
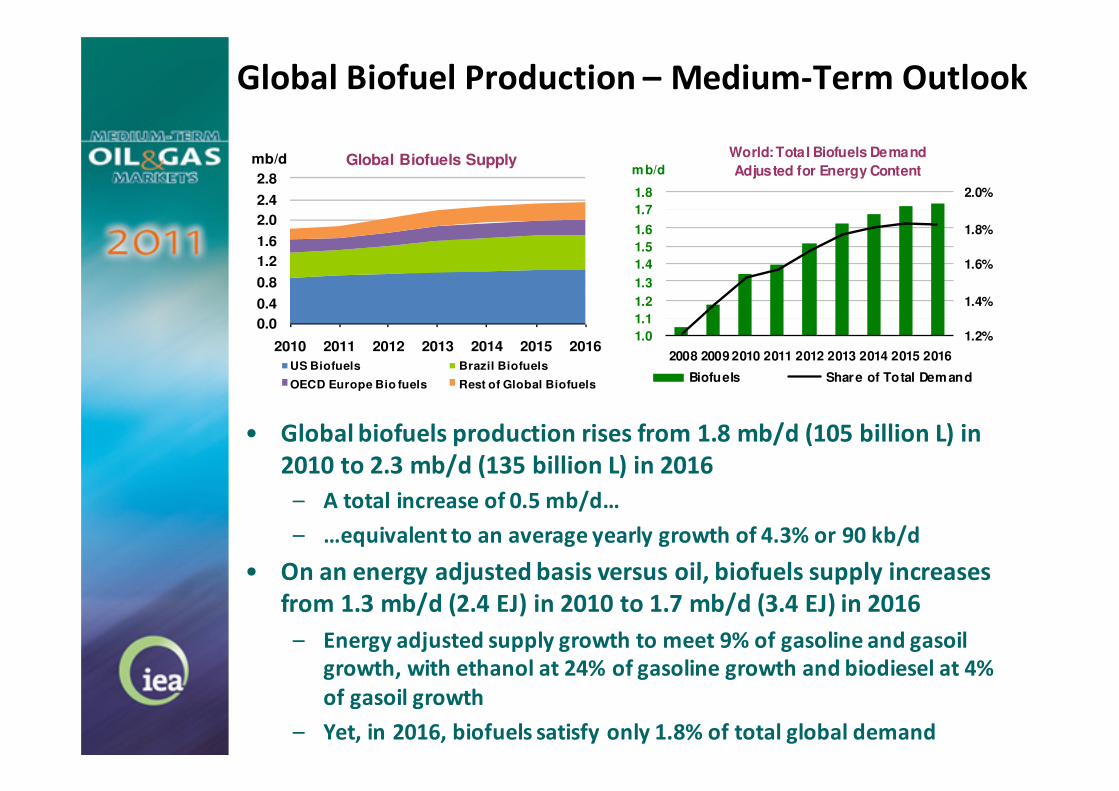
The BLUE Map Scenario – Towards a low-carbon energy sector
� Baseline Scenario – business-as-usual; no adoption of new energy and climate policies
� BLUE Map Scenario - energy-related CO2-emissions halved by 2050 through CO2-price
and strong support policies
� Serves as basis for all IEA Technology Roadmaps
� 23% of global emission savings occur in the transport sector
© OECD/IEA 2011
IEA Technology Roadmaps� Roadmaps are intended to:
� Highlight pathway(s) to reach large scale use of low-carbon technologies, consistent with Energy Technology
Perspectives publication
� Focus on the key steps over the next 5-10 years, as well as long-term milestones, including:
� Identify barriers and obstacles and how to overcome these
� Identify key conversion pathways
� Key RD&D gaps and how to fill them while ensuring s ustainability
� Identify market requirements and policy needs
� Define international collaboration needs
For more information: www.iea.org/roadmaps
� IEA Technology Roadmap - Biofuels for Transport
� Developed under consultation of industry, governmental and research institutions as well as NGOs
� 2 expert workshops on technologies and feedstock availability and sustainability
� the latter feeds also into the upcoming Technology Roadmap on Bioenergy for Heat and Power
Concentrated Solar Power Electric & Plug-in Hybrid Vehicles Smart Grids Solar Photovoltaic Energy Wind Energy
© OECD/IEA 2011
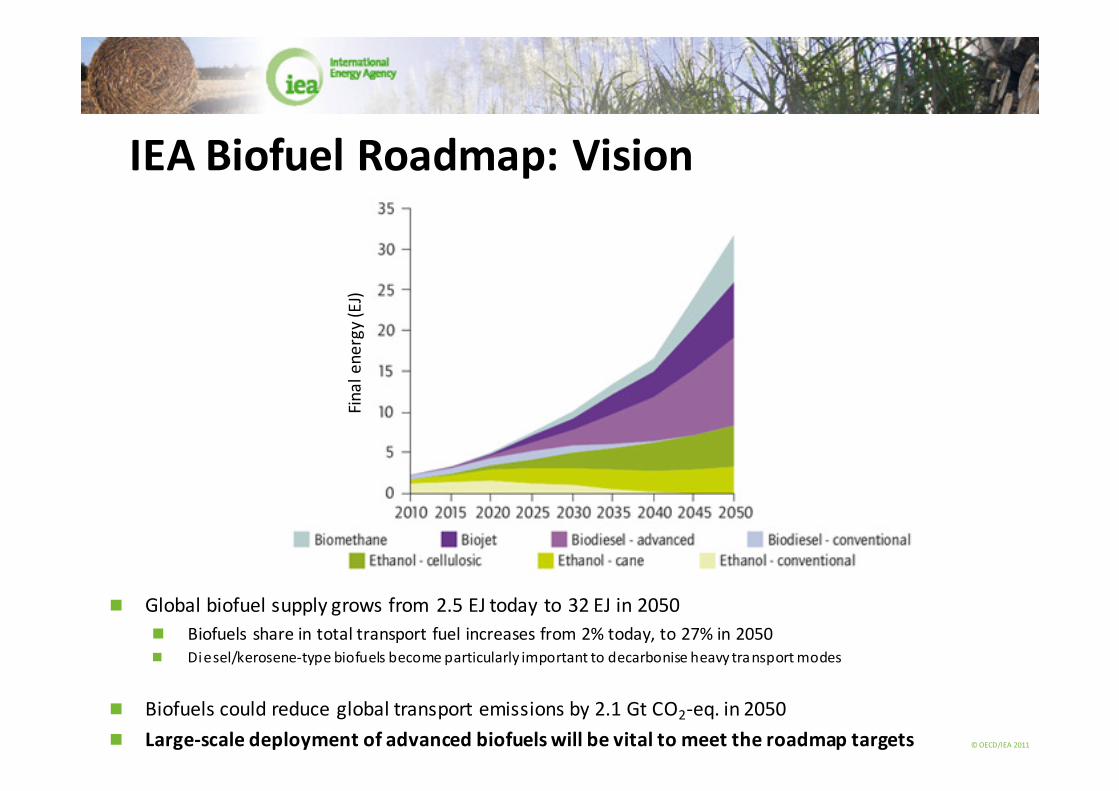
IEA Biofuel Roadmap: Vision
� Global biofuel supply grows from 2.5 EJ today to 32 EJ in 2050
� Biofuels share in total transport fuel increases from 2% today, to 27% in 2050
� Diesel/kerosene-type biofuels become particularly important to decarbonise heavy transport modes
� Biofuels could reduce global transport emissions by 2.1 Gt CO2-eq. in 2050
� Large-scale deployment of advanced biofuels will be vital to meet the roadmap targets
Fin
al
en
erg
y (E
J)
© OECD/IEA 2011
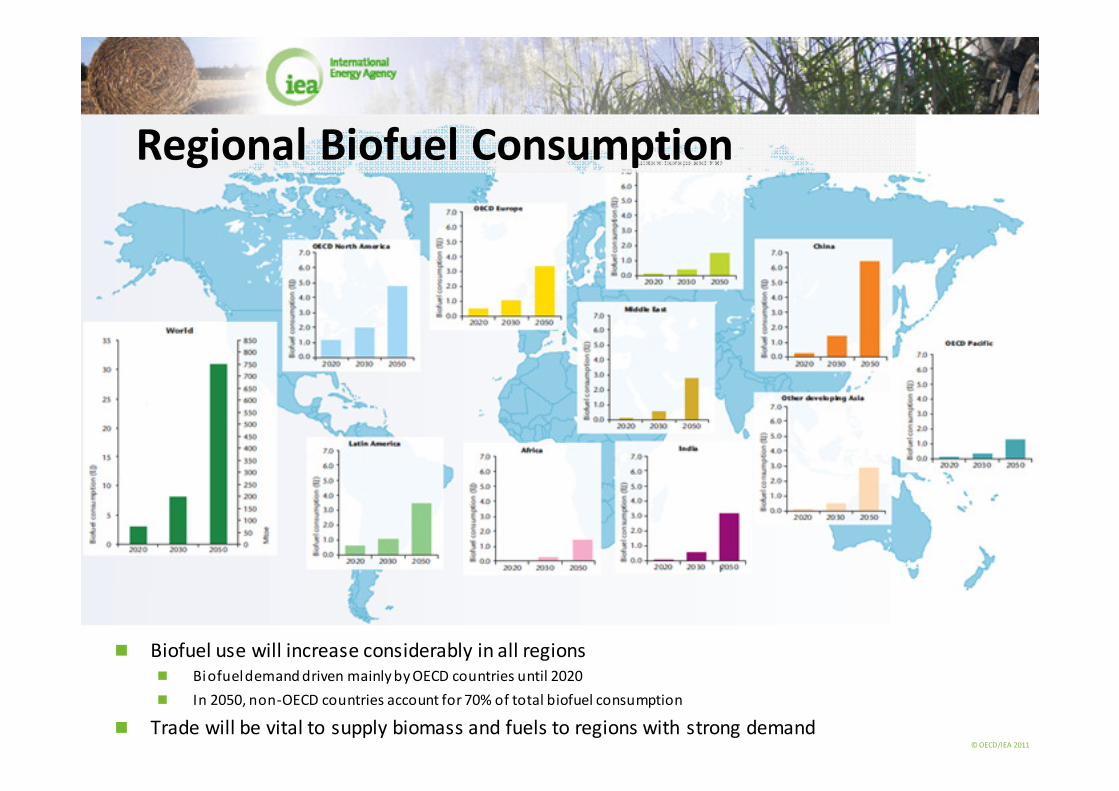
� Biofuel use will increase considerably in all regions
� Biofueldemand driven mainly by OECD countries until 2020
� In 2050, non-OECD countries account for 70% of total biofuel consumption
� Trade will be vital to supply biomass and fuels to regions with strong demand
Regional Biofuel Consumption
© OECD/IEA 2011
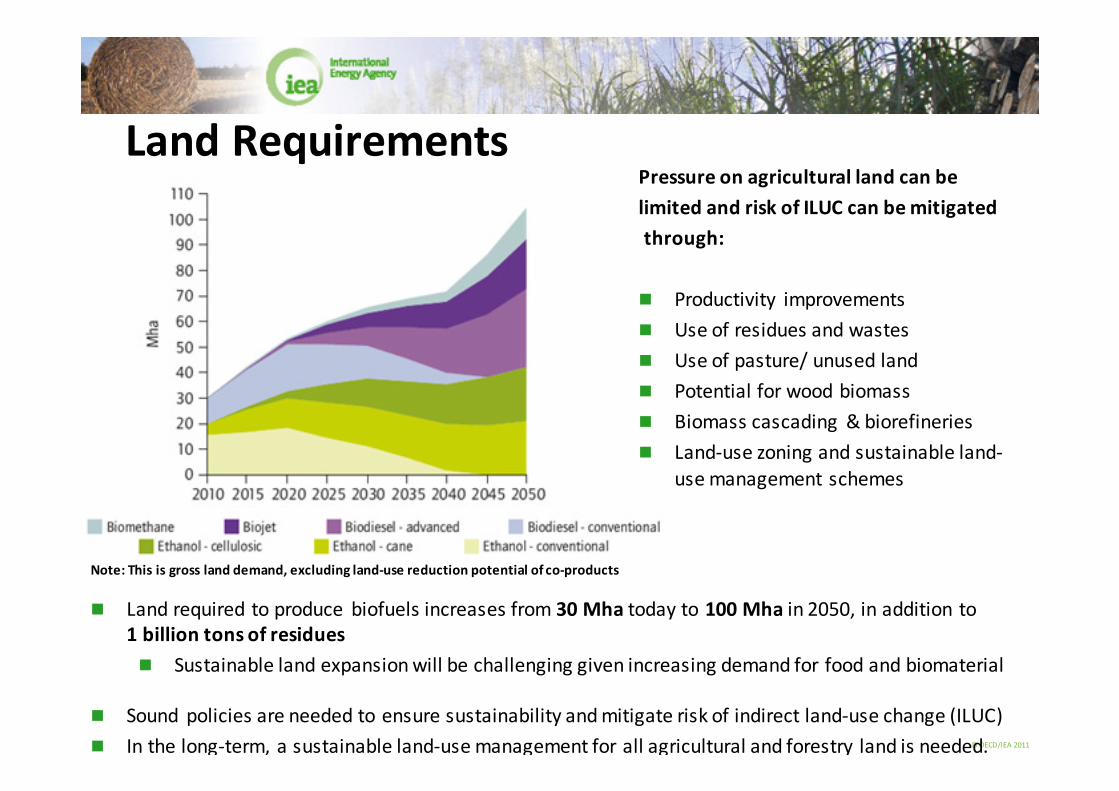
Land Requirements
� Land required to produce biofuels increases from 30 Mha today to 100 Mha in 2050, in addition to
1 billion tons of residues
� Sustainable land expansion will be challenging given increasing demand for food and biomaterial
� Sound policies are needed to ensure sustainability and mitigate risk of indirect land-use change (ILUC)
� In the long-term, a sustainable land-use management for all agricultural and forestry land is needed.
Pressure on agricultural land can be
limited and risk of ILUC can be mitigated
through:
� Productivity improvements
� Use of residues and wastes
� Use of pasture/ unused land
� Potential for wood biomass
� Biomass cascading & biorefineries
� Land-use zoning and sustainable land-
use management schemes
Note: This is gross land demand, excluding land-use reduction potential of co-products
© OECD/IEA 2011
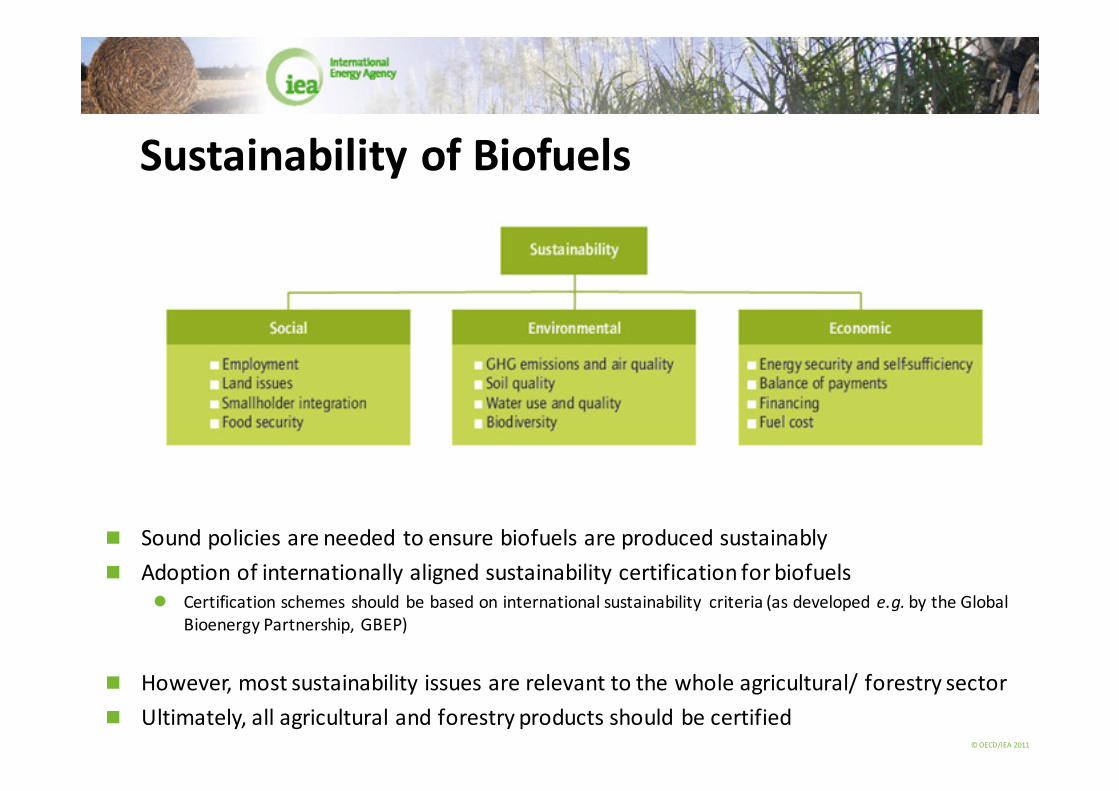
Sustainability of Biofuels
� Sound policies are needed to ensure biofuels are produced sustainably
� Adoption of internationally aligned sustainability certification for biofuels
� Certification schemes should be based on international sustainability criteria (as developed e.g. by the Global
Bioenergy Partnership, GBEP)
� However, most sustainability issues are relevant to the whole agricultural/ forestry sector
� Ultimately, all agricultural and forestry products should be certified
© OECD/IEA 2011
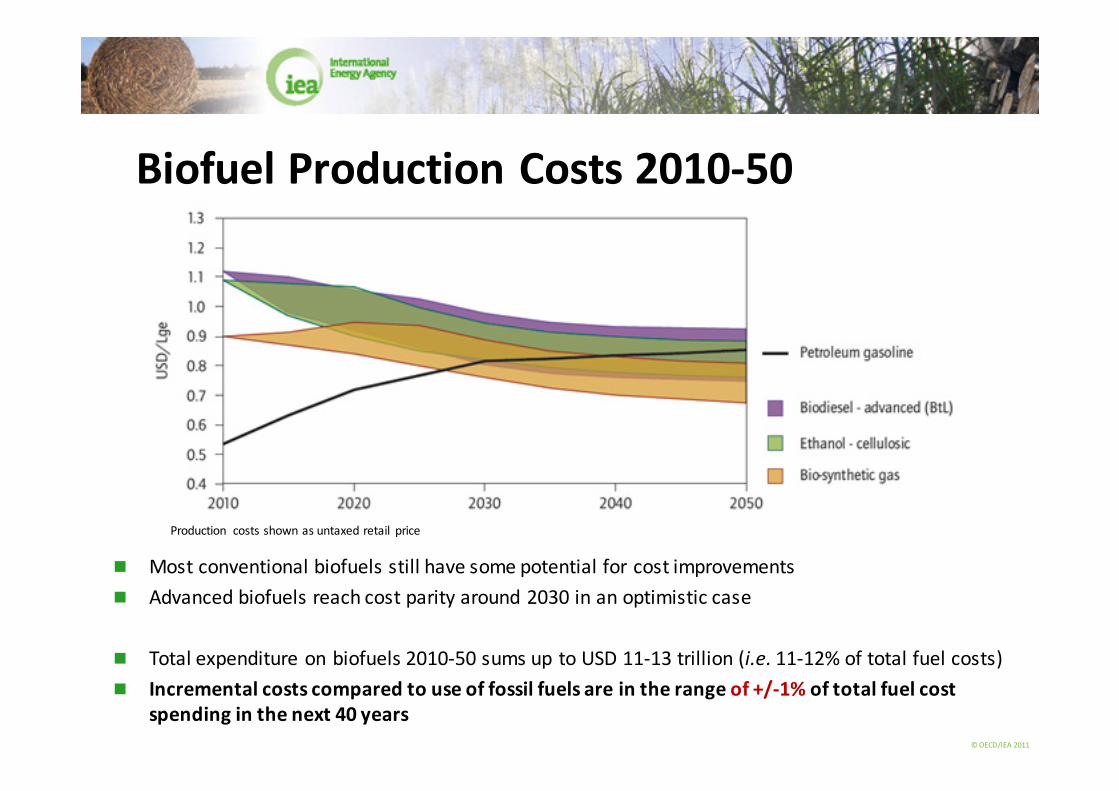
Biofuel Production Costs 2010-50
� Most conventional biofuels still have some potential for cost improvements
� Advanced biofuels reach cost parity around 2030 in an optimistic case
� Total expenditure on biofuels 2010-50 sums up to USD 11-13 trillion (i.e. 11-12% of total fuel costs)
� Incremental costs compared to use of fossil fuels are in the range of +/-1% of total fuel cost
spending in the next 40 years
Production costs shown as untaxed retail price
© OECD/IEA 2011
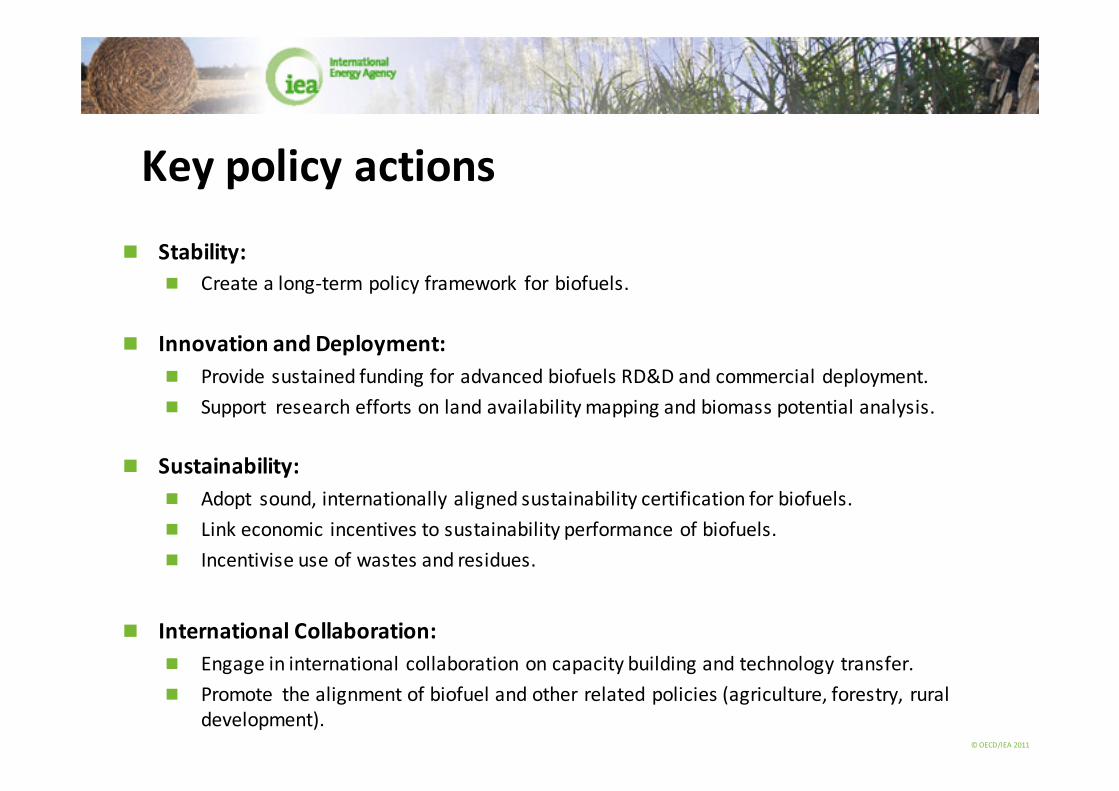
Key policy actions
� Stability:
� Create a long-term policy framework for biofuels.
� Innovation and Deployment:
� Provide sustained funding for advanced biofuels RD&D and commercial deployment.
� Support research efforts on land availability mapping and biomass potential analysis.
� Sustainability:
� Adopt sound, internationally aligned sustainability certification for biofuels.
� Link economic incentives to sustainability performance of biofuels.
� Incentivise use of wastes and residues.
� International Collaboration:
� Engage in international collaboration on capacity building and technology transfer.
� Promote the alignment of biofuel and other related policies (agriculture, forestry, rural
development).
© OECD/IEA 2011
Acknowledgements
� Thanks to the co-authors:� Adam Brown, Lew Fulton, Jana Hanova and Jack Saddler
� IEA Technology Roadmap - Biofuels for Transport
Available: www.iea.org/roadmaps
� Contact:
� Forthcoming:
IEA Technology Roadmap – Bioenergy for Heat and Power
Available early 2012
© OECD/IEA 2011
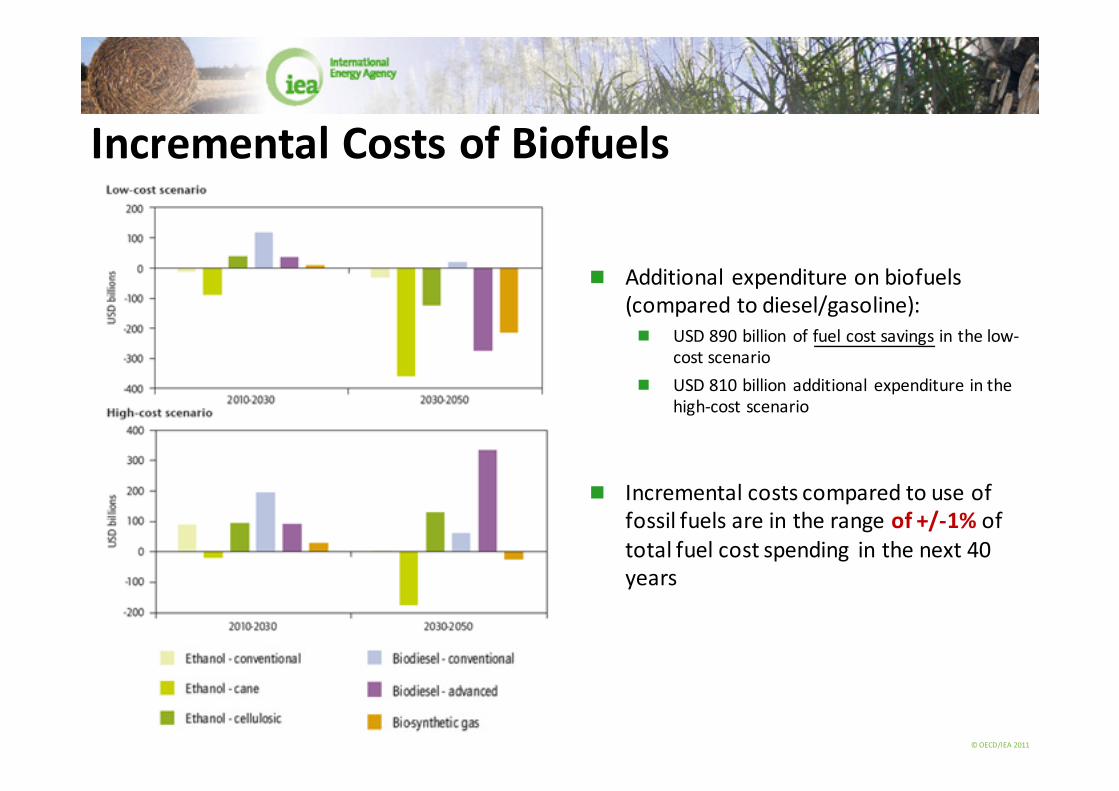
Incremental Costs of Biofuels
� Additional expenditure on biofuels
(compared to diesel/gasoline):
� USD 890 billion of fuel cost savings in the low-
cost scenario
� USD 810 billion additional expenditure in the
high-cost scenario
� Incremental costs compared to use of
fossil fuels are in the range of +/-1% of
total fuel cost spending in the next 40
years
© OECD/IEA 2011
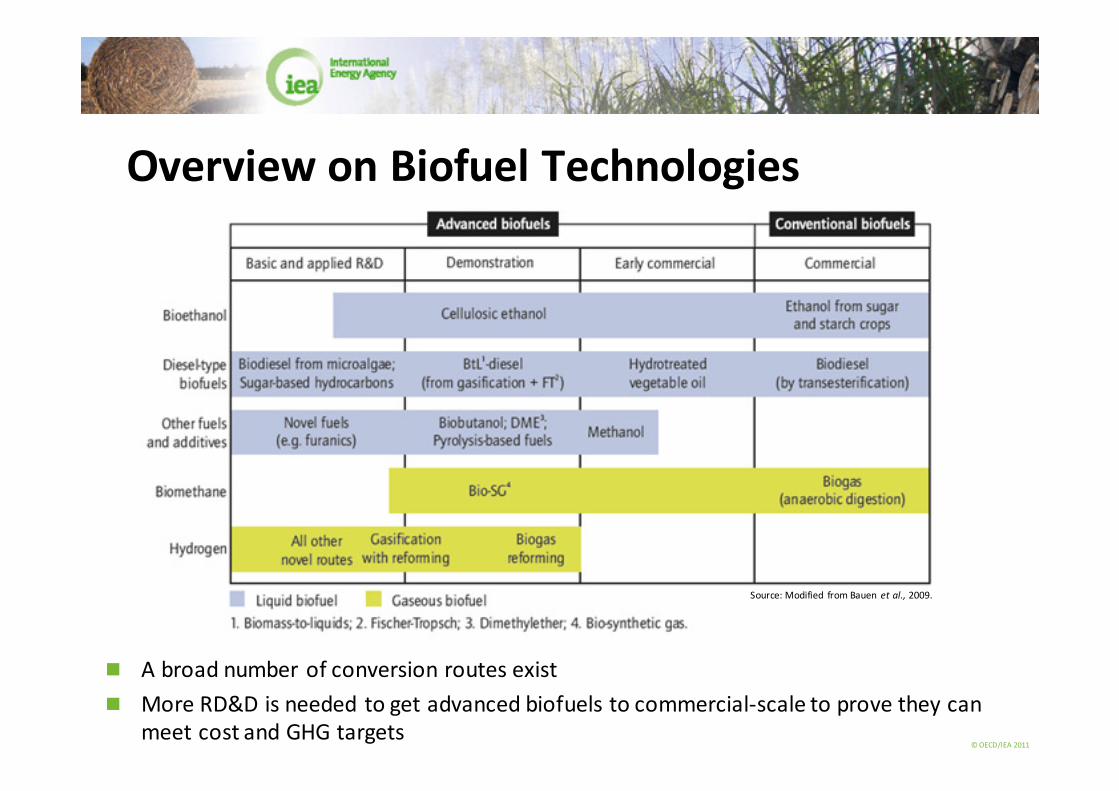
Overview on Biofuel Technologies
� A broad number of conversion routes exist
� More RD&D is needed to get advanced biofuels to commercial-scale to prove they can
meet cost and GHG targets
Source: Modified from Bauen et al., 2009.
© OECD/IEA 2011
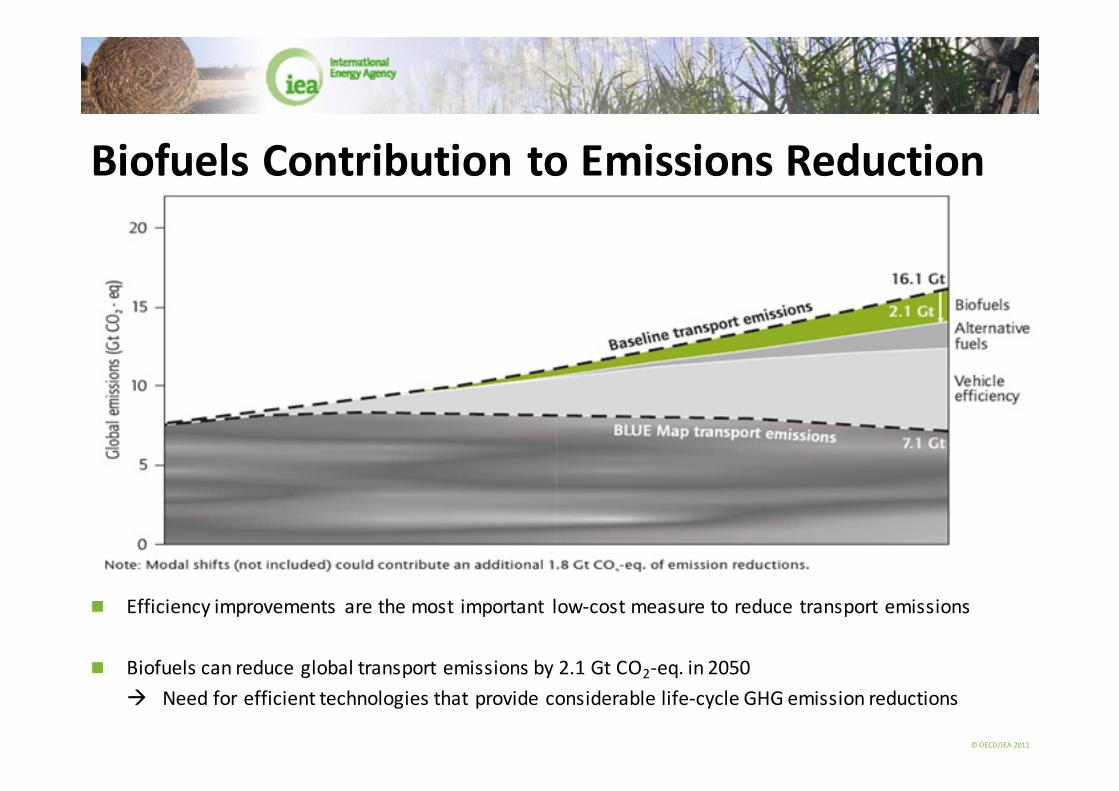
Biofuels Contribution to Emissions Reduction
� Efficiency improvements are the most important low-cost measure to reduce transport emissions
� Biofuels can reduce global transport emissions by 2.1 Gt CO2-eq. in 2050
� Need for efficient technologies that provide considerable life-cycle GHG emission reductions
© OECD/IEA 2011
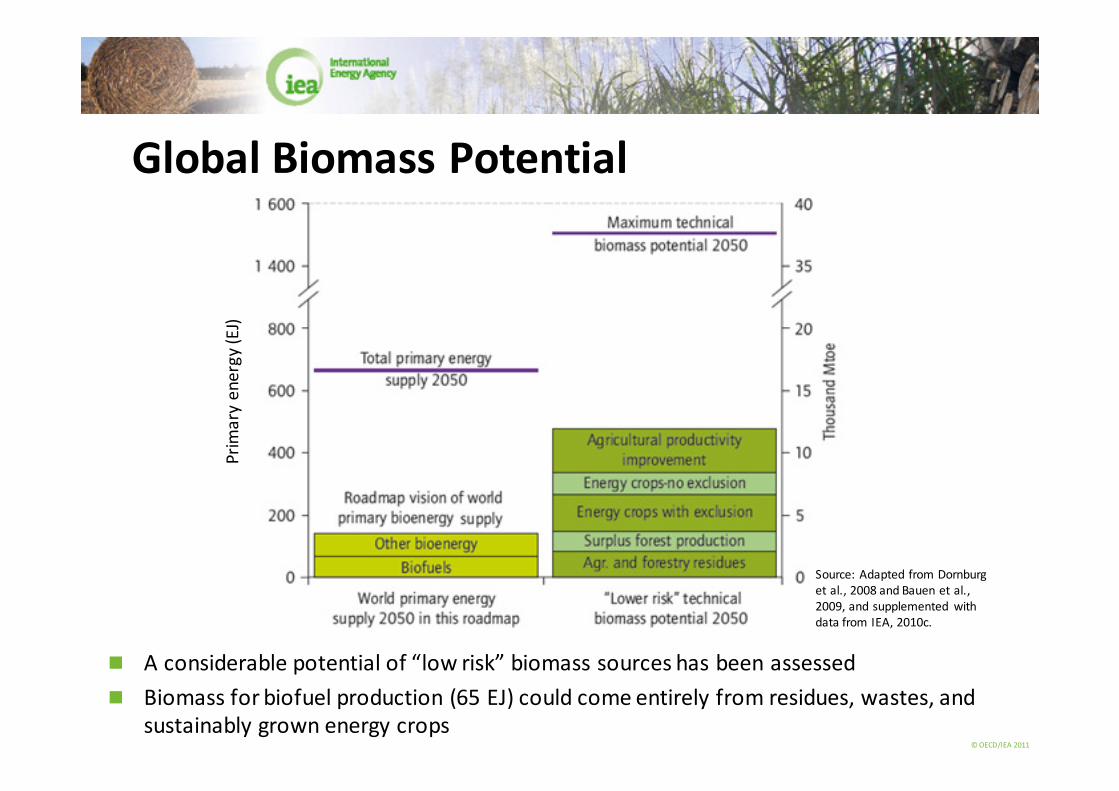
Global Biomass Potential
� A considerable potential of “low risk” biomass sources has been assessed
� Biomass for biofuel production (65 EJ) could come entirely from residues, wastes, and
sustainably grown energy crops
Source: Adapted from Dornburg
et al., 2008 and Bauen et al.,
2009, and supplemented with
data from IEA, 2010c.
Pri
ma
ry e
ne
rgy
(EJ)
© OECD/IEA 2011
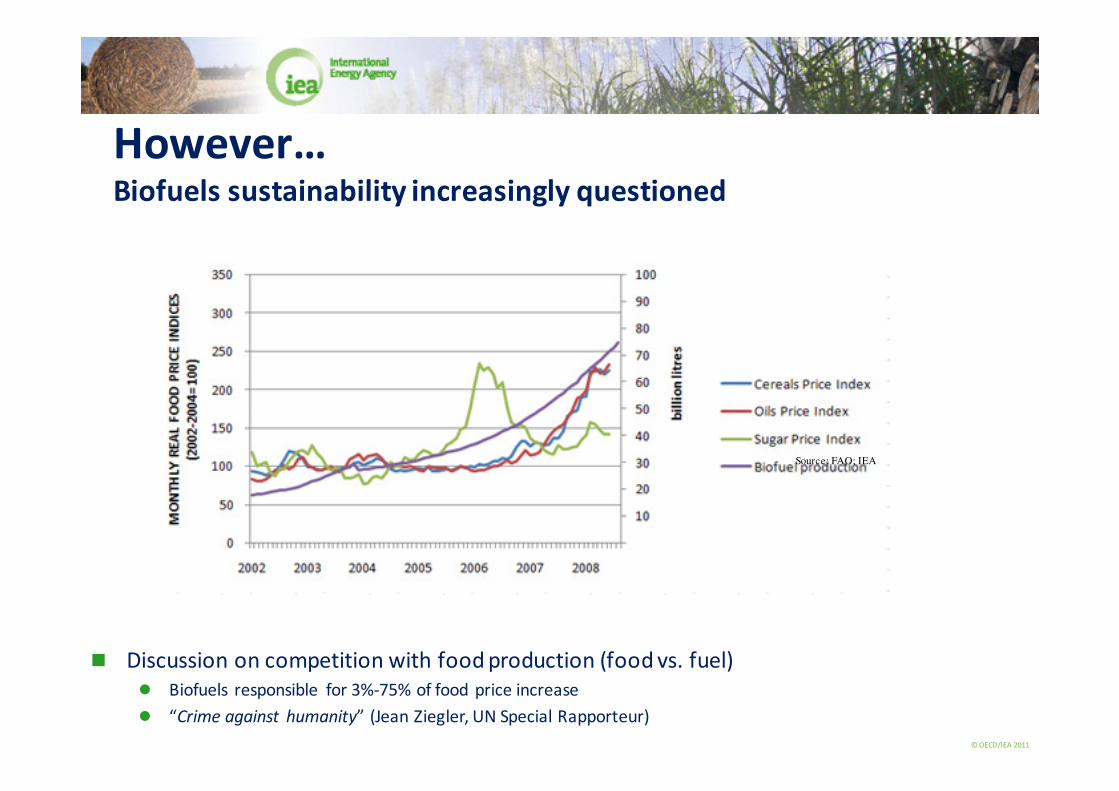
However…Biofuels sustainability increasingly questioned
� Discussion on competition with food production (food vs. fuel)
� Biofuels responsible for 3%-75% of food price increase
� “Crime against humanity” (Jean Ziegler, UN Special Rapporteur)
Source: FAO; IEA
© OECD/IEA 2011
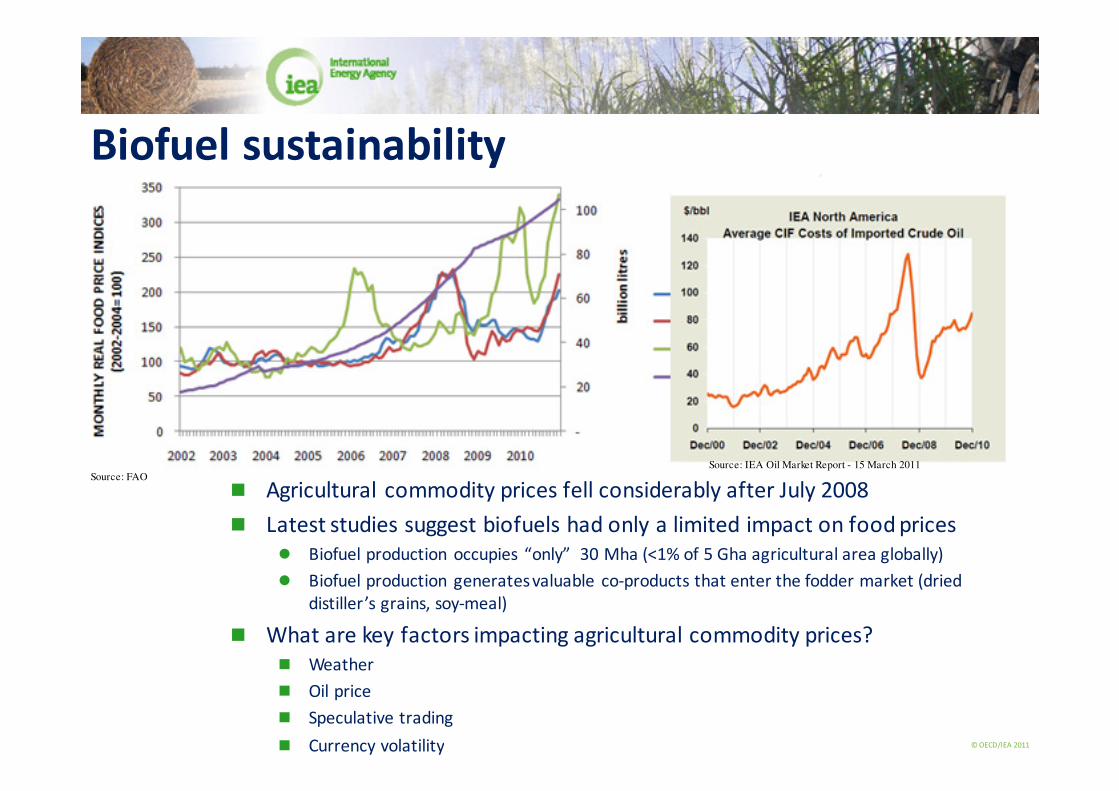
Biofuel sustainabilityFood vs. fuel
� Agricultural commodity prices fell considerably after July 2008
� Latest studies suggest biofuels had only a limited impact on food prices
� Biofuel production occupies “only” 30 Mha (<1% of 5 Gha agricultural area globally)
� Biofuel production generates valuable co-products that enter the fodder market (dried
distiller’s grains, soy-meal)
� What are key factors impacting agricultural commodity prices?
� Weather
� Oil price
� Speculative trading
� Currency volatility
Source: FAOSource: IEA Oil Market Report - 15 March 2011