Embed Size (px)
Citation preview
Biofuel Production Page - bp1
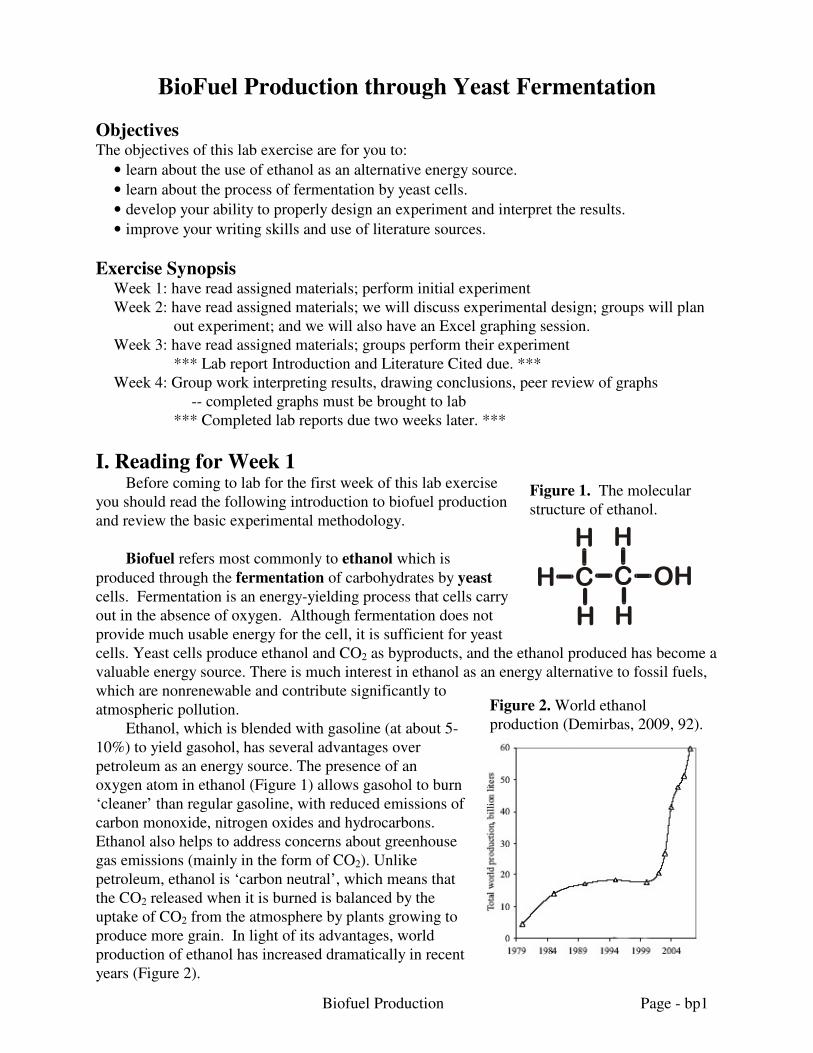
Figure 1. The molecular
structure of ethanol.
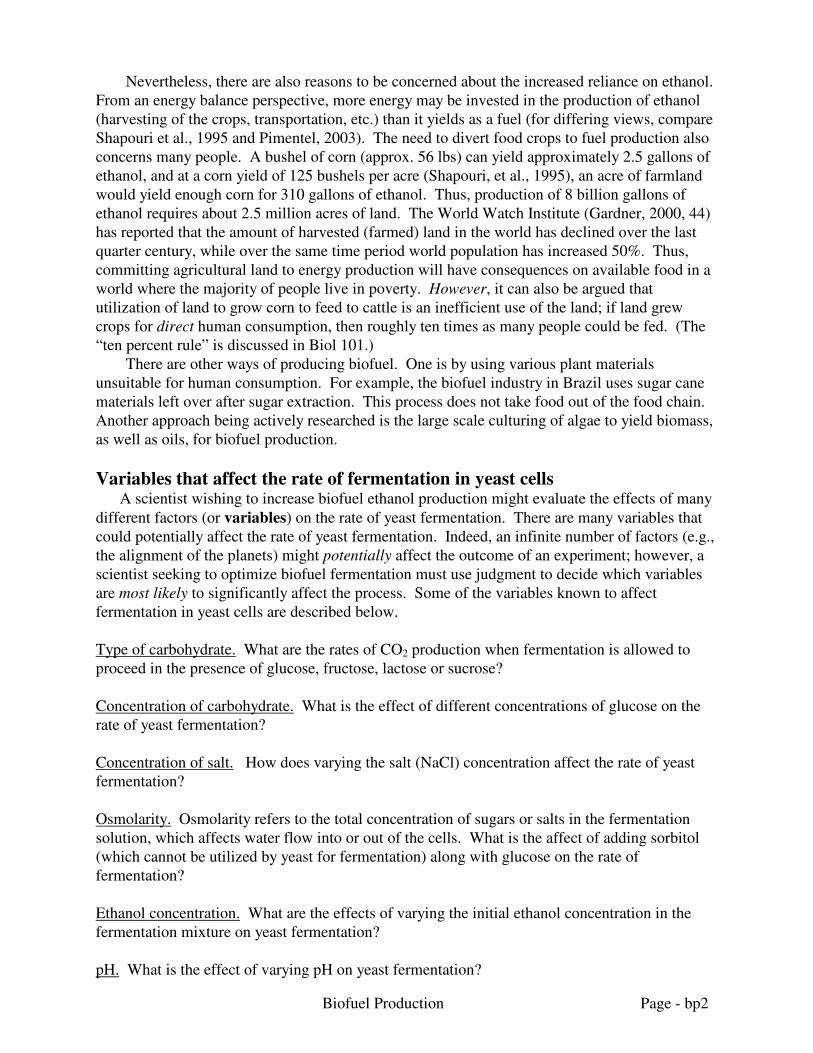
Figure 2. World ethanol
production (Demirbas, 2009, 92).
BioFuel Production through Yeast Fermentation
Objectives The objectives of this lab exercise are for you to:
• learn about the use of ethanol as an alternative energy source.
• learn about the process of fermentation by yeast cells.
• develop your ability to properly design an experiment and interpret the results.
• improve your writing skills and use of literature sources.
Exercise Synopsis
Week 1: have read assigned materials; perform initial experiment
Week 2: have read assigned materials; we will discuss experimental design; groups will plan
out experiment; and we will also have an Excel graphing session.
Week 3: have read assigned materials; groups perform their experiment
*** Lab report Introduction and Literature Cited due. ***
Week 4: Group work interpreting results, drawing conclusions, peer review of graphs
-- completed graphs must be brought to lab
*** Completed lab reports due two weeks later. ***
I. Reading for Week 1 Before coming to lab for the first week of this lab exercise
you should read the following introduction to biofuel production
and review the basic experimental methodology.
Biofuel refers most commonly to ethanol which is
produced through the fermentation of carbohydrates by yeast
cells. Fermentation is an energy-yielding process that cells carry
out in the absence of oxygen. Although fermentation does not
provide much usable energy for the cell, it is sufficient for yeast
cells. Yeast cells produce ethanol and CO2 as byproducts, and the ethanol produced has become a
valuable energy source. There is much interest in ethanol as an energy alternative to fossil fuels,
which are nonrenewable and contribute significantly to
atmospheric pollution.
Ethanol, which is blended with gasoline (at about 5-
10%) to yield gasohol, has several advantages over
petroleum as an energy source. The presence of an
oxygen atom in ethanol (Figure 1) allows gasohol to burn
‘cleaner’ than regular gasoline, with reduced emissions of
carbon monoxide, nitrogen oxides and hydrocarbons.
Ethanol also helps to address concerns about greenhouse
gas emissions (mainly in the form of CO2). Unlike
petroleum, ethanol is ‘carbon neutral’, which means that
the CO2 released when it is burned is balanced by the
uptake of CO2 from the atmosphere by plants growing to
produce more grain. In light of its advantages, world
production of ethanol has increased dramatically in recent
years (Figure 2).
Biofuel Production Page - bp2
Nevertheless, there are also reasons to be concerned about the increased reliance on ethanol.
From an energy balance perspective, more energy may be invested in the production of ethanol
(harvesting of the crops, transportation, etc.) than it yields as a fuel (for differing views, compare
Shapouri et al., 1995 and Pimentel, 2003). The need to divert food crops to fuel production also
concerns many people. A bushel of corn (approx. 56 lbs) can yield approximately 2.5 gallons of
ethanol, and at a corn yield of 125 bushels per acre (Shapouri, et al., 1995), an acre of farmland
would yield enough corn for 310 gallons of ethanol. Thus, production of 8 billion gallons of
ethanol requires about 2.5 million acres of land. The World Watch Institute (Gardner, 2000, 44)
has reported that the amount of harvested (farmed) land in the world has declined over the last
quarter century, while over the same time period world population has increased 50%. Thus,
committing agricultural land to energy production will have consequences on available food in a
world where the majority of people live in poverty. However, it can also be argued that
utilization of land to grow corn to feed to cattle is an inefficient use of the land; if land grew
crops for direct human consumption, then roughly ten times as many people could be fed. (The
“ten percent rule” is discussed in Biol 101.)
There are other ways of producing biofuel. One is by using various plant materials
unsuitable for human consumption. For example, the biofuel industry in Brazil uses sugar cane
materials left over after sugar extraction. This process does not take food out of the food chain.
Another approach being actively researched is the large scale culturing of algae to yield biomass,
as well as oils, for biofuel production.
Variables that affect the rate of fermentation in yeast cells A scientist wishing to increase biofuel ethanol production might evaluate the effects of many
different factors (or variables) on the rate of yeast fermentation. There are many variables that
could potentially affect the rate of yeast fermentation. Indeed, an infinite number of factors (e.g.,
the alignment of the planets) might potentially affect the outcome of an experiment; however, a
scientist seeking to optimize biofuel fermentation must use judgment to decide which variables
are most likely to significantly affect the process. Some of the variables known to affect
fermentation in yeast cells are described below.
Type of carbohydrate. What are the rates of CO2 production when fermentation is allowed to
proceed in the presence of glucose, fructose, lactose or sucrose?
Concentration of carbohydrate. What is the effect of different concentrations of glucose on the
rate of yeast fermentation?
Concentration of salt. How does varying the salt (NaCl) concentration affect the rate of yeast
fermentation?
Osmolarity. Osmolarity refers to the total concentration of sugars or salts in the fermentation
solution, which affects water flow into or out of the cells. What is the affect of adding sorbitol
(which cannot be utilized by yeast for fermentation) along with glucose on the rate of
fermentation?
Ethanol concentration. What are the effects of varying the initial ethanol concentration in the
fermentation mixture on yeast fermentation?
pH. What is the effect of varying pH on yeast fermentation?
Biofuel Production Page - bp3
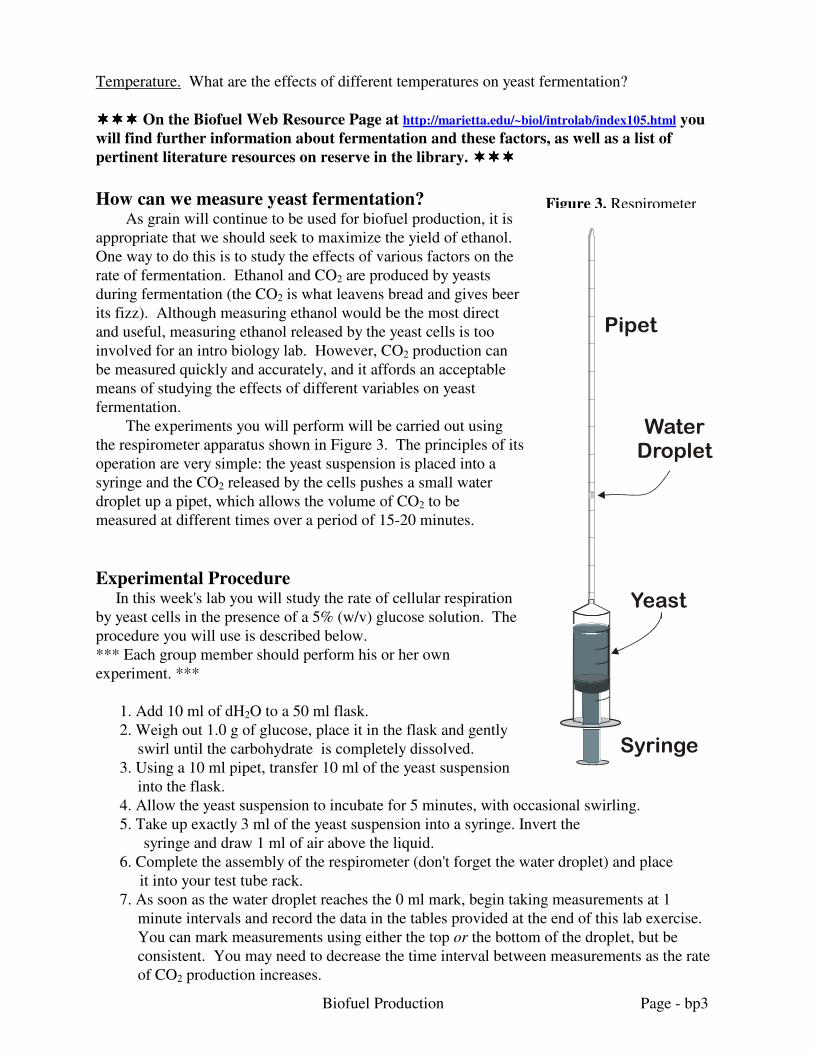
Figure 3. Respirometer
Temperature. What are the effects of different temperatures on yeast fermentation?
������������ On the Biofuel Web Resource Page at http://marietta.edu/~biol/introlab/index105.html you
will find further information about fermentation and these factors, as well as a list of
pertinent literature resources on reserve in the library. ������������
How can we measure yeast fermentation?
As grain will continue to be used for biofuel production, it is
appropriate that we should seek to maximize the yield of ethanol.
One way to do this is to study the effects of various factors on the
rate of fermentation. Ethanol and CO2 are produced by yeasts
during fermentation (the CO2 is what leavens bread and gives beer
its fizz). Although measuring ethanol would be the most direct
and useful, measuring ethanol released by the yeast cells is too
involved for an intro biology lab. However, CO2 production can
be measured quickly and accurately, and it affords an acceptable
means of studying the effects of different variables on yeast
fermentation.
The experiments you will perform will be carried out using
the respirometer apparatus shown in Figure 3. The principles of its
operation are very simple: the yeast suspension is placed into a
syringe and the CO2 released by the cells pushes a small water
droplet up a pipet, which allows the volume of CO2 to be
measured at different times over a period of 15-20 minutes.
Experimental Procedure In this week's lab you will study the rate of cellular respiration
by yeast cells in the presence of a 5% (w/v) glucose solution. The
procedure you will use is described below.
*** Each group member should perform his or her own
experiment. ***
1. Add 10 ml of dH2O to a 50 ml flask.
2. Weigh out 1.0 g of glucose, place it in the flask and gently
swirl until the carbohydrate is completely dissolved.
3. Using a 10 ml pipet, transfer 10 ml of the yeast suspension
into the flask.
4. Allow the yeast suspension to incubate for 5 minutes, with occasional swirling.
5. Take up exactly 3 ml of the yeast suspension into a syringe. Invert the
syringe and draw 1 ml of air above the liquid.
6. Complete the assembly of the respirometer (don't forget the water droplet) and place
it into your test tube rack.
7. As soon as the water droplet reaches the 0 ml mark, begin taking measurements at 1
minute intervals and record the data in the tables provided at the end of this lab exercise.
You can mark measurements using either the top or the bottom of the droplet, but be
consistent. You may need to decrease the time interval between measurements as the rate
of CO2 production increases.
Biofuel Production Page - bp4
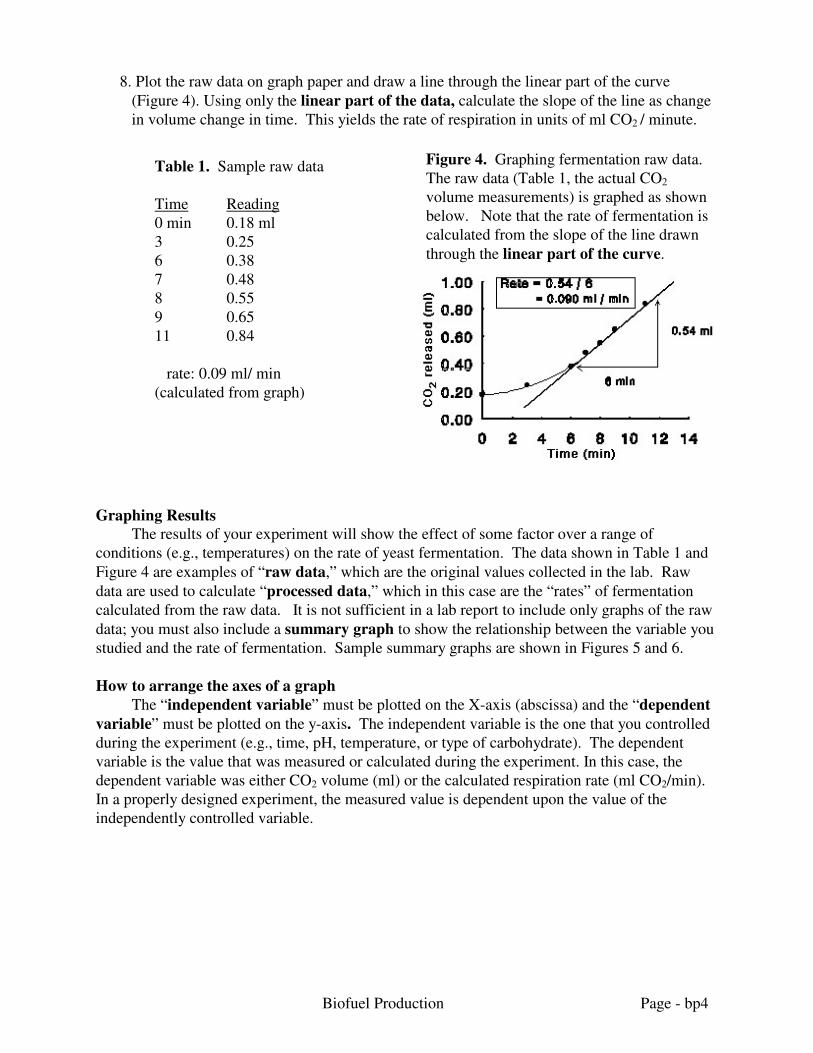
Table 1. Sample raw data
Time Reading
0 min 0.18 ml
3 0.25
6 0.38
7 0.48
8 0.55
9 0.65
11 0.84
rate: 0.09 ml/ min
(calculated from graph)
8. Plot the raw data on graph paper and draw a line through the linear part of the curve
(Figure 4). Using only the linear part of the data, calculate the slope of the line as change
in volume change in time. This yields the rate of respiration in units of ml CO2 / minute.
Graphing Results
The results of your experiment will show the effect of some factor over a range of
conditions (e.g., temperatures) on the rate of yeast fermentation. The data shown in Table 1 and
Figure 4 are examples of “raw data,” which are the original values collected in the lab. Raw
data are used to calculate “processed data,” which in this case are the “rates” of fermentation
calculated from the raw data. It is not sufficient in a lab report to include only graphs of the raw
data; you must also include a summary graph to show the relationship between the variable you
studied and the rate of fermentation. Sample summary graphs are shown in Figures 5 and 6.
How to arrange the axes of a graph
The “independent variable” must be plotted on the X-axis (abscissa) and the “dependent
variable” must be plotted on the y-axis. The independent variable is the one that you controlled
during the experiment (e.g., time, pH, temperature, or type of carbohydrate). The dependent
variable is the value that was measured or calculated during the experiment. In this case, the
dependent variable was either CO2 volume (ml) or the calculated respiration rate (ml CO2/min).
In a properly designed experiment, the measured value is dependent upon the value of the
independently controlled variable.
Figure 4. Graphing fermentation raw data.
The raw data (Table 1, the actual CO2
volume measurements) is graphed as shown
below. Note that the rate of fermentation is
calculated from the slope of the line drawn
through the linear part of the curve.
Biofuel Production Page - bp5
0
0.02
0.04
0.06
0.08
0.1
0.12
Glucose Lactose Fructose Galactose
Type of Carbohydrate
Fe
rmen
tatio
n r
ate
(m
l CO
2 /m
in)
0
0.02
0.04
0.06
0.08
0.1
0.12
0.14
0 1 2 3 4
Sugar concentration (% w/v)
Fe
rmen
tati
on
ra
te (
ml
CO
2 /
min
)
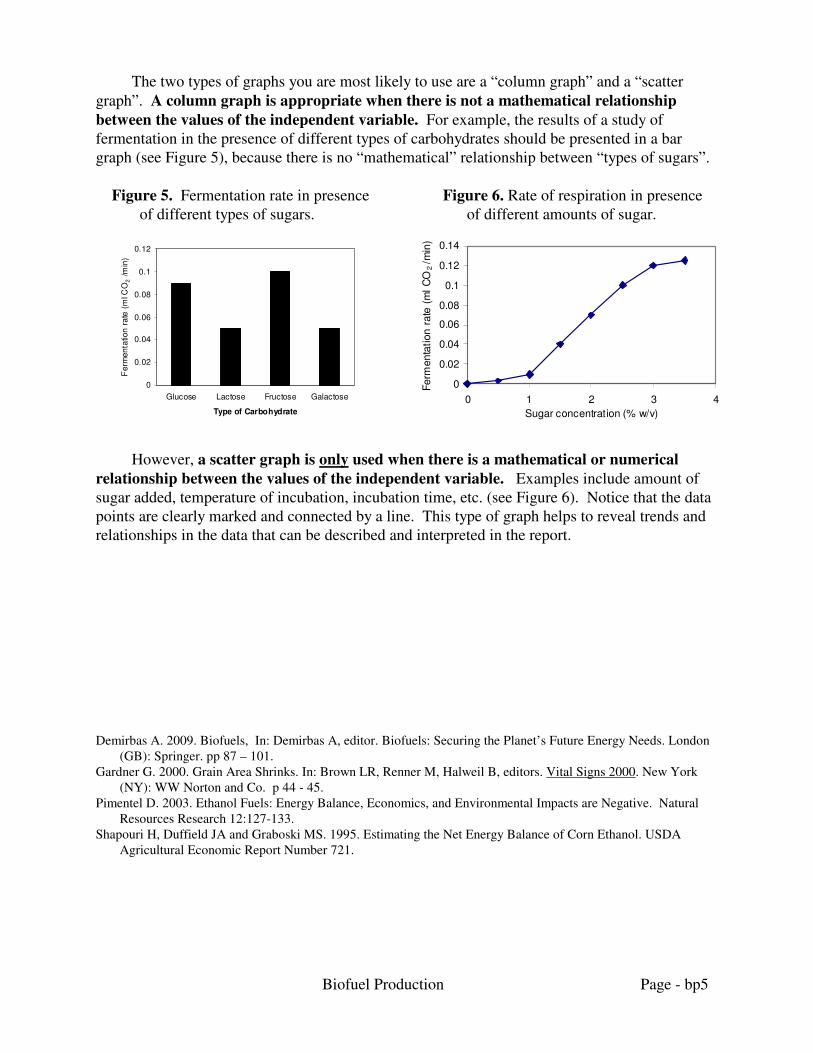
The two types of graphs you are most likely to use are a “column graph” and a “scatter
graph”. A column graph is appropriate when there is not a mathematical relationship
between the values of the independent variable. For example, the results of a study of
fermentation in the presence of different types of carbohydrates should be presented in a bar
graph (see Figure 5), because there is no “mathematical” relationship between “types of sugars”.
Figure 5. Fermentation rate in presence Figure 6. Rate of respiration in presence
of different types of sugars. of different amounts of sugar.
However, a scatter graph is only used when there is a mathematical or numerical
relationship between the values of the independent variable. Examples include amount of
sugar added, temperature of incubation, incubation time, etc. (see Figure 6). Notice that the data
points are clearly marked and connected by a line. This type of graph helps to reveal trends and
relationships in the data that can be described and interpreted in the report.
Demirbas A. 2009. Biofuels, In: Demirbas A, editor. Biofuels: Securing the Planet’s Future Energy Needs. London
(GB): Springer. pp 87 – 101.
Gardner G. 2000. Grain Area Shrinks. In: Brown LR, Renner M, Halweil B, editors. Vital Signs 2000. New York
(NY): WW Norton and Co. p 44 - 45.
Pimentel D. 2003. Ethanol Fuels: Energy Balance, Economics, and Environmental Impacts are Negative. Natural
Resources Research 12:127-133.
Shapouri H, Duffield JA and Graboski MS. 1995. Estimating the Net Energy Balance of Corn Ethanol. USDA
Agricultural Economic Report Number 721.

Biofuel Production Page - bp6
Biofuel Production Page - bp7
Name: __________________
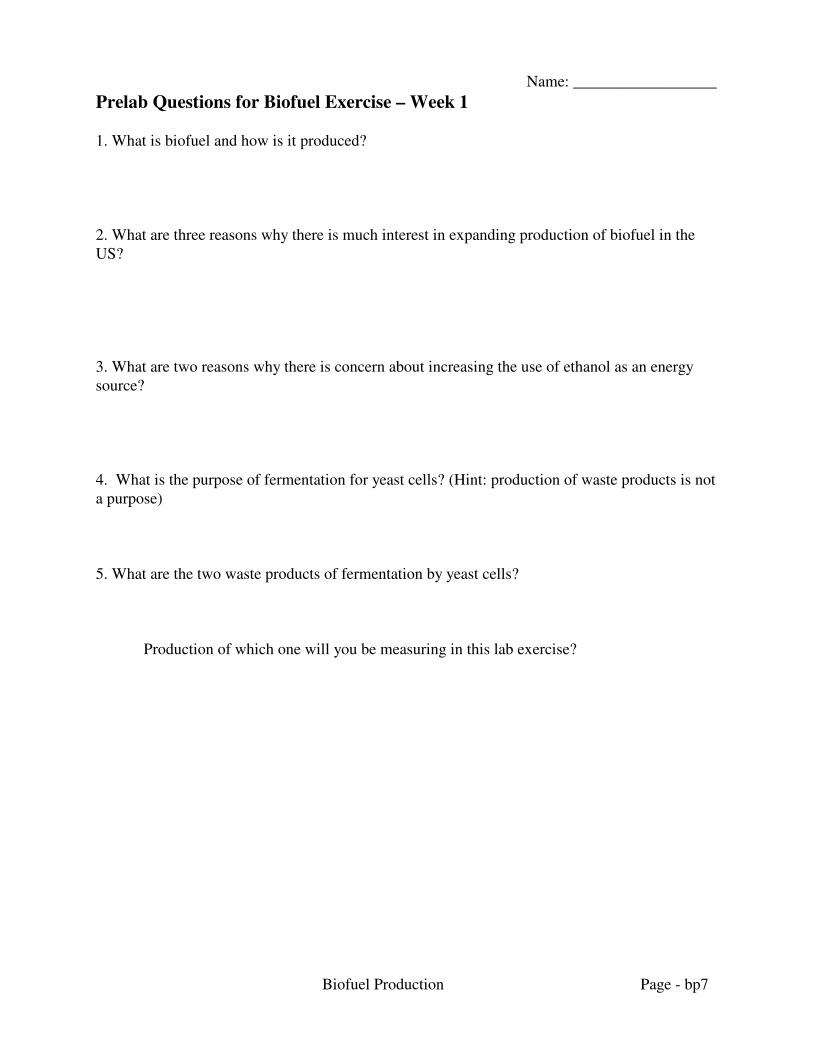
Prelab Questions for Biofuel Exercise – Week 1
1. What is biofuel and how is it produced?
2. What are three reasons why there is much interest in expanding production of biofuel in the
US?
3. What are two reasons why there is concern about increasing the use of ethanol as an energy
source?
4. What is the purpose of fermentation for yeast cells? (Hint: production of waste products is not
a purpose)
5. What are the two waste products of fermentation by yeast cells?
Production of which one will you be measuring in this lab exercise?

Biofuel Production Page - bp8
Biofuel Production Page - bp9
II. Reading for Week 2 This week you will work with your group to design an experiment to test the effect of your
variable on the rate of fermentation. You will also learn how to use Excel to graph to generate
and calculate the slope of trendlines, which represent the rates of fermentation.
Some Considerations in Experimental Design
A well designed experiment tests the effect of only ONE variable at a time, the one described
in the hypothesis. As you have already learned, a hypothesis is an educated guess of the outcome
of the experiment. Often we have little knowledge by which to formulate a hypothesis, but there
is always some knowledge that can be applied. Some examples of hypotheses would include:
• Yeast fermentation is fastest in the presence of glucose.
• Fermentation rates decrease as temperature is increased.
• The presence of calcium will increase the rate of fermentation.
• etc…
Often, a single experiment will test a range of conditions of the variable. For example, a study
of the effect of temperature may test the effects of three or more different temperatures, and an
investigation of sugar concentration may test the effect of a range of different values.
The results of such experimental tests are always compared to a control. You will recall that
control tests are included to rule out other alternative explanations for the results. For example,
someone might argue that the CO2 released during this experiment is the result of chemical
reactions that do not require living yeast cells (as was argued by some organic chemists in the
early 1800s). What control would you suggest to ‘control for’ (rule out) this possible
explanation?
Calculating Concentration
For all of these experiments you must calculate the amount of a material dissolved in the
fermentation mixture. ‘Concentration’ is the most meaningful way to express this quantity.
Concentration indicates the amount of a substance per unit volume of the liquid in which it is
dissolved, and units of ‘% w/v’ (percent weight/volume) or ‘% v/v’ (percent volume/volume) are
acceptable for this lab. When the substance being measured is added as a dry powder, ‘% w/v’
should be used and is calculated by dividing the grams of the substance added by the final
volume of the solution and multiplying by 100:
grams of substance added
% w/v = ------------------------------ X 100
Final total ml of solution
For example, in the first week’s exercise you measured fermentation by yeast cells provided with
1 gram (g) of carbohydrate dissolved in a total volume of 20 milliliters (ml), which represents a
concentration of 5% w/v.
When the substance being measured is added as a liquid, ‘% v/v’ should be used and is
calculated by dividing the volume (ml) of the substance added by the final volume (ml) of the
solution and multiplying by 100:
ml of substance added
% v/v = ------------------------------ X 100
Final total ml of solution
For example, to make a 5% solution of ethanol in a mixture with a final volume of 20 ml, you
would need to combine 1 ml of ethanol + 19 ml of the other components.

Biofuel Production Page - bp10
Biofuel Production Page - bp11
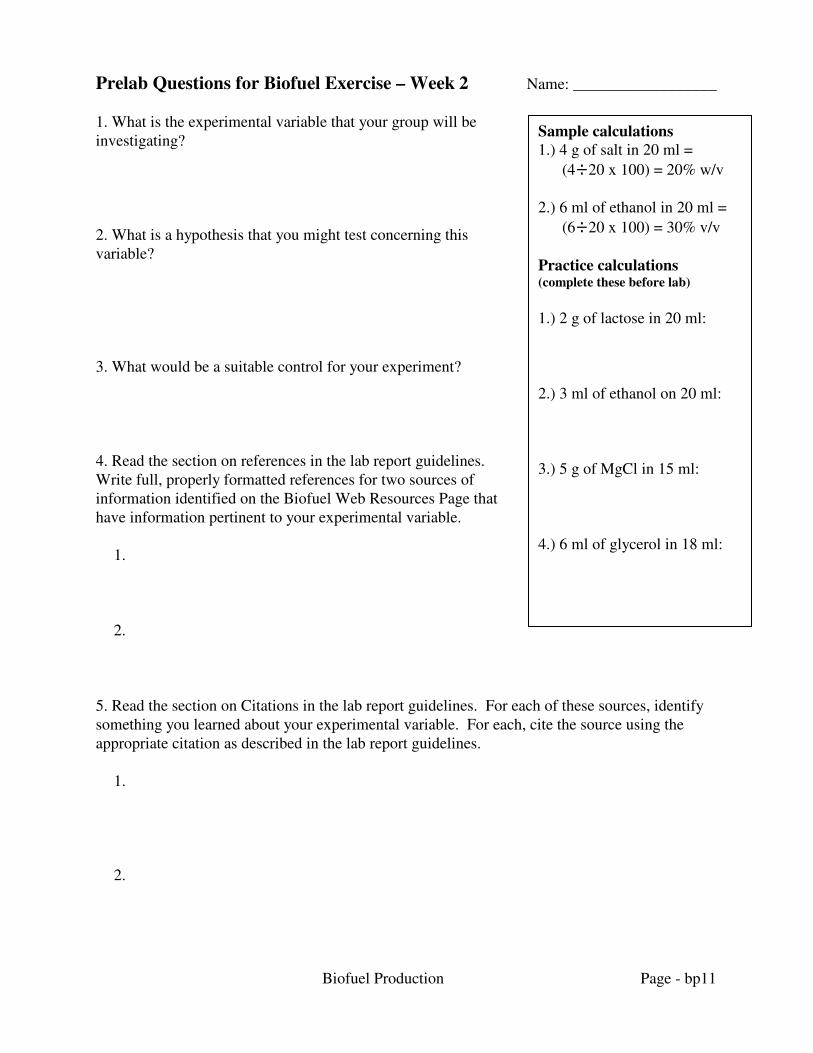
Sample calculations
1.) 4 g of salt in 20 ml =
(4÷20 x 100) = 20% w/v
2.) 6 ml of ethanol in 20 ml =
(6÷20 x 100) = 30% v/v
Practice calculations (complete these before lab)
1.) 2 g of lactose in 20 ml:
2.) 3 ml of ethanol on 20 ml:
3.) 5 g of MgCl in 15 ml:
4.) 6 ml of glycerol in 18 ml:
Prelab Questions for Biofuel Exercise – Week 2 Name: __________________
1. What is the experimental variable that your group will be
investigating?
2. What is a hypothesis that you might test concerning this
variable?
3. What would be a suitable control for your experiment?
4. Read the section on references in the lab report guidelines.
Write full, properly formatted references for two sources of
information identified on the Biofuel Web Resources Page that
have information pertinent to your experimental variable.
1.
2.
5. Read the section on Citations in the lab report guidelines. For each of these sources, identify
something you learned about your experimental variable. For each, cite the source using the
appropriate citation as described in the lab report guidelines.
1.
2.

Biofuel Production Page - bp12
Biofuel Production Page - bp13
III- Reading for Week 4
Looking for patterns and trends in results
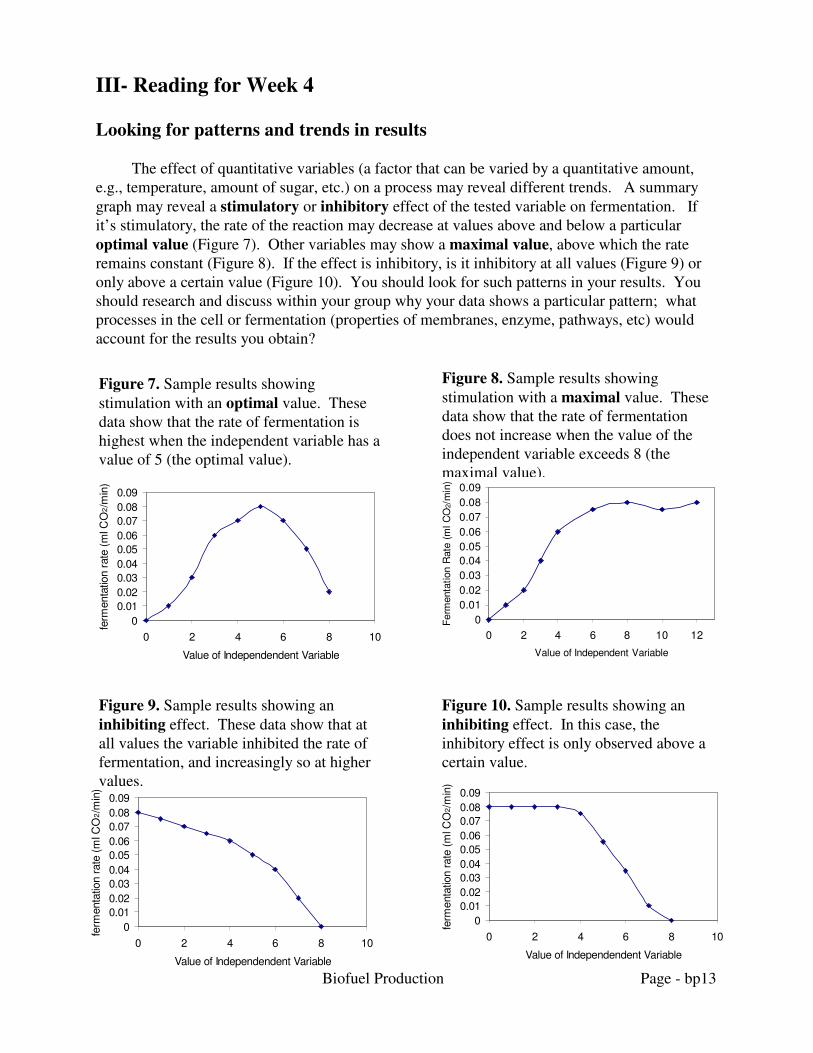
The effect of quantitative variables (a factor that can be varied by a quantitative amount,
e.g., temperature, amount of sugar, etc.) on a process may reveal different trends. A summary
graph may reveal a stimulatory or inhibitory effect of the tested variable on fermentation. If
it’s stimulatory, the rate of the reaction may decrease at values above and below a particular
optimal value (Figure 7). Other variables may show a maximal value, above which the rate
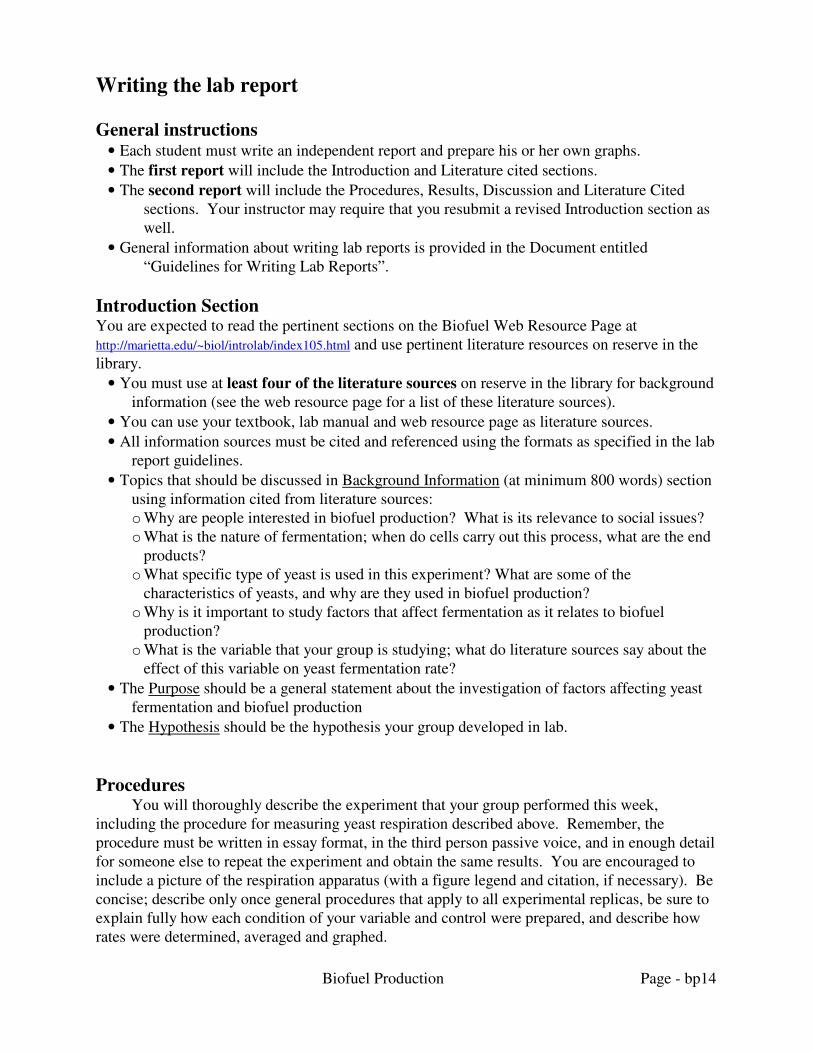
remains constant (Figure 8). If the effect is inhibitory, is it inhibitory at all values (Figure 9) or
only above a certain value (Figure 10). You should look for such patterns in your results. You
should research and discuss within your group why your data shows a particular pattern; what
processes in the cell or fermentation (properties of membranes, enzyme, pathways, etc) would
account for the results you obtain?
0
0.01
0.02
0.03
0.04
0.05
0.06
0.07
0.08
0.09
0 2 4 6 8 10
Value of Independendent Variable
ferm
enta
tion r
ate
(m
l CO
2/m
in)
Figure 7. Sample results showing
stimulation with an optimal value. These
data show that the rate of fermentation is
highest when the independent variable has a
value of 5 (the optimal value).
0
0.01
0.02
0.03
0.04
0.05
0.06
0.07
0.08
0.09
0 2 4 6 8 10 12
Value of Independent Variable
Ferm
enta
tion R
ate
(m
l C
O2/m
in)
Figure 8. Sample results showing
stimulation with a maximal value. These
data show that the rate of fermentation
does not increase when the value of the
independent variable exceeds 8 (the
maximal value).
Figure 9. Sample results showing an
inhibiting effect. These data show that at
all values the variable inhibited the rate of
fermentation, and increasingly so at higher
values.
0
0.01
0.02
0.03
0.04
0.05
0.06
0.07
0.08
0.09
0 2 4 6 8 10
Value of Independendent Variable
ferm
enta
tion r
ate
(m
l CO
2/m
in)
0
0.01
0.02
0.03
0.04
0.05
0.06
0.07
0.08
0.09
0 2 4 6 8 10
Value of Independendent Variable
ferm
enta
tion r
ate
(m
l CO
2/m
in)
Figure 10. Sample results showing an
inhibiting effect. In this case, the
inhibitory effect is only observed above a
certain value.
Biofuel Production Page - bp14
Writing the lab report
General instructions • Each student must write an independent report and prepare his or her own graphs.
• The first report will include the Introduction and Literature cited sections.
• The second report will include the Procedures, Results, Discussion and Literature Cited
sections. Your instructor may require that you resubmit a revised Introduction section as
well.
• General information about writing lab reports is provided in the Document entitled
“Guidelines for Writing Lab Reports”.
Introduction Section You are expected to read the pertinent sections on the Biofuel Web Resource Page at
http://marietta.edu/~biol/introlab/index105.html and use pertinent literature resources on reserve in the
library.
• You must use at least four of the literature sources on reserve in the library for background
information (see the web resource page for a list of these literature sources).
• You can use your textbook, lab manual and web resource page as literature sources.
• All information sources must be cited and referenced using the formats as specified in the lab
report guidelines.
• Topics that should be discussed in Background Information (at minimum 800 words) section
using information cited from literature sources:
o Why are people interested in biofuel production? What is its relevance to social issues?
o What is the nature of fermentation; when do cells carry out this process, what are the end
products?
o What specific type of yeast is used in this experiment? What are some of the
characteristics of yeasts, and why are they used in biofuel production?
o Why is it important to study factors that affect fermentation as it relates to biofuel
production?
o What is the variable that your group is studying; what do literature sources say about the
effect of this variable on yeast fermentation rate?
• The Purpose should be a general statement about the investigation of factors affecting yeast
fermentation and biofuel production
• The Hypothesis should be the hypothesis your group developed in lab.
Procedures
You will thoroughly describe the experiment that your group performed this week,
including the procedure for measuring yeast respiration described above. Remember, the
procedure must be written in essay format, in the third person passive voice, and in enough detail
for someone else to repeat the experiment and obtain the same results. You are encouraged to
include a picture of the respiration apparatus (with a figure legend and citation, if necessary). Be
concise; describe only once general procedures that apply to all experimental replicas, be sure to
explain fully how each condition of your variable and control were prepared, and describe how
rates were determined, averaged and graphed.
Biofuel Production Page - bp15
Results
Tables and Figures
• Graphs of all raw data, prepared on Excel, with trendlines drawn through the linear region of
the data.
• Do not include tables of the raw data.
• A table of calculated respiration rates for each replicate and the averages.
• A summary graph showing average respiration rates vs your independent variable. You
should use the graph format appropriate to your variable.
Note: all tables and graphs must be formatted (Figure numbers, title, axes labels, etc.) as
described in the Lab Report Guidelines.
Description of Data
• Describe the raw data for one typical replicate, but only describe any unusual aspects in the
raw data from other replicates.
• Fully describe the summary graph that presents average fermentation rates, this represents
the most important results of the experiment.
Discussion section Conclusions
• Did the results of your experiment support or contradict your hypothesis? If not, what
conclusions would you draw from your results?
• Do the results support your hypothesis or not?
Explanation of results. Topics that should be discussed include:
• How does the trend in your summary graph compare with the predicted results from your
original experimental plan? Describe any differences that your observe.
• How do your results compare to information about the effect of your variable from literature
sources? You must compare your results to least 2 of the literature sources on reserve in
the library that provide information about the effect of your variable on fermentation. (Be
sure to cite sources correctly.)
• Does your variable have a stimulating or inhibiting effect on fermentation; which type of
pattern (see sample graphs above) does your summary data resemble?
• What is the biological basis for how the variable you tested affected fermentation as shown in
the summary graph? (Be sure to cite source(s) correctly.)
• What are the implications of your results to improving biofuel production; how would you
apply your findings if you were actually attempting to improve the process?
Future experiment
• What is a logical extension of the experiment that you performed involving the same
variable?
• A poor future experiment will merely call for more replicas or a wide range of conditions of
the variable.
Literature References (and Citations)
• Must follow correct formats
Biofuel Production Page - bp16
• Must include at least 5 sources on reserve
• No references of web sites (except Biofuel Web Resource Page)
Citation for Biofuel Web Resource Page:
Spilatro SR. Biol 105 Biofuel Web Resource Page. [Internet] Marietta College Biology
Department. [modified 2009 August 14; cited __________]
(http://marietta.edu/~biol/introlab/bfuelrsc.pdf).
Biofuel Production Page - bp17
Data Tables for Yeast Respiration Experiment
Test # ____ Test # ____ Test # ____
time reading time reading time reading
_0__ min ____ ml _0__ min ____ ml _0__ min ____ ml ____ ____ ____ ____ ____ ____ ____ ____ ____ ____ ____ ____ ____ ____ ____ ____ ____ ____ ____ ____ ____ ____ ____ ____ ____ ____ ____ ____ ____ ____ ____ ____ ____ ____ ____ ____ ____ ____ ____ ____ ____ ____ ____ ____ ____ ____ ____ ____ ____ ____ ____ ____ ____ ____ ____ ____ ____ ____ ____ ____ ____ ____ ____ ____ ____ ____ ____ ____ ____ ____ ____ ____ ____ ____ ____ ____ ____ ____ ____ ____ ____ ____ ____ ____ ____ ____ ____ ____ ____ ____ ____ ____ ____ ____ ____ ____ ____ ____ ____ ____ ____ ____ ____ ____ ____ ____ ____ ____ ____ ____ ____ ____ ____ ____ ____ ____ ____ ____ ____ ____
____ ____ ____ ____ ____ ____
Test # ____ Test # ____ Test # ____
time reading time reading time reading
_0__ min ____ ml _0__ min ____ ml _0__ min ____ ml
____ ____ ____ ____ ____ ____
____ ____ ____ ____ ____ ____
____ ____ ____ ____ ____ ____
____ ____ ____ ____ ____ ____
____ ____ ____ ____ ____ ____
____ ____ ____ ____ ____ ____
____ ____ ____ ____ ____ ____
____ ____ ____ ____ ____ ____
____ ____ ____ ____ ____ ____
____ ____ ____ ____ ____ ____
____ ____ ____ ____ ____ ____
____ ____ ____ ____ ____ ____
____ ____ ____ ____ ____ ____
____ ____ ____ ____ ____ ____
____ ____ ____ ____ ____ ____
____ ____ ____ ____ ____ ____
____ ____ ____ ____ ____ ____
____ ____ ____ ____ ____ ____
____ ____ ____ ____ ____ ____
____ ____ ____ ____ ____ ____
____ ____ ____ ____ ____ ____
Biofuel Production Page - bp18
Data Tables for Yeast Respiration Experiment Test # ____ Test # ____ Test # ____
time reading time reading time reading
_0__ min ____ ml _0__ min ____ ml _0__ min ____ ml ____ ____ ____ ____ ____ ____ ____ ____ ____ ____ ____ ____ ____ ____ ____ ____ ____ ____ ____ ____ ____ ____ ____ ____ ____ ____ ____ ____ ____ ____ ____ ____ ____ ____ ____ ____ ____ ____ ____ ____ ____ ____ ____ ____ ____ ____ ____ ____ ____ ____ ____ ____ ____ ____ ____ ____ ____ ____ ____ ____ ____ ____ ____ ____ ____ ____ ____ ____ ____ ____ ____ ____ ____ ____ ____ ____ ____ ____ ____ ____ ____ ____ ____ ____ ____ ____ ____ ____ ____ ____ ____ ____ ____ ____ ____ ____ ____ ____ ____ ____ ____ ____ ____ ____ ____ ____ ____ ____ ____ ____ ____ ____ ____ ____ ____ ____ ____ ____ ____ ____
____ ____ ____ ____ ____ ____
Test # ____ Test # ____ Test # ____
time reading time reading time reading
_0__ min ____ ml _0__ min ____ ml _0__ min ____ ml
____ ____ ____ ____ ____ ____
____ ____ ____ ____ ____ ____
____ ____ ____ ____ ____ ____
____ ____ ____ ____ ____ ____
____ ____ ____ ____ ____ ____
____ ____ ____ ____ ____ ____
____ ____ ____ ____ ____ ____
____ ____ ____ ____ ____ ____
____ ____ ____ ____ ____ ____
____ ____ ____ ____ ____ ____
____ ____ ____ ____ ____ ____
____ ____ ____ ____ ____ ____
____ ____ ____ ____ ____ ____
____ ____ ____ ____ ____ ____
____ ____ ____ ____ ____ ____
____ ____ ____ ____ ____ ____
____ ____ ____ ____ ____ ____
____ ____ ____ ____ ____ ____
____ ____ ____ ____ ____ ____
____ ____ ____ ____ ____ ____
____ ____ ____ ____ ____ ____
Biofuel Production Page - bp19
Data Tables for Yeast Respiration Experiment
Test # ____ Test # ____ Test # ____
time reading time reading time reading
_0__ min ____ ml _0__ min ____ ml _0__ min ____ ml ____ ____ ____ ____ ____ ____ ____ ____ ____ ____ ____ ____ ____ ____ ____ ____ ____ ____ ____ ____ ____ ____ ____ ____ ____ ____ ____ ____ ____ ____ ____ ____ ____ ____ ____ ____ ____ ____ ____ ____ ____ ____ ____ ____ ____ ____ ____ ____ ____ ____ ____ ____ ____ ____ ____ ____ ____ ____ ____ ____ ____ ____ ____ ____ ____ ____ ____ ____ ____ ____ ____ ____ ____ ____ ____ ____ ____ ____ ____ ____ ____ ____ ____ ____ ____ ____ ____ ____ ____ ____ ____ ____ ____ ____ ____ ____ ____ ____ ____ ____ ____ ____ ____ ____ ____ ____ ____ ____ ____ ____ ____ ____ ____ ____ ____ ____ ____ ____ ____ ____
____ ____ ____ ____ ____ ____
Test # ____ Test # ____ Test # ____
time reading time reading time reading
_0__ min ____ ml _0__ min ____ ml _0__ min ____ ml
____ ____ ____ ____ ____ ____
____ ____ ____ ____ ____ ____
____ ____ ____ ____ ____ ____
____ ____ ____ ____ ____ ____
____ ____ ____ ____ ____ ____
____ ____ ____ ____ ____ ____
____ ____ ____ ____ ____ ____
____ ____ ____ ____ ____ ____
____ ____ ____ ____ ____ ____
____ ____ ____ ____ ____ ____
____ ____ ____ ____ ____ ____
____ ____ ____ ____ ____ ____
____ ____ ____ ____ ____ ____
____ ____ ____ ____ ____ ____
____ ____ ____ ____ ____ ____
____ ____ ____ ____ ____ ____
____ ____ ____ ____ ____ ____
____ ____ ____ ____ ____ ____
____ ____ ____ ____ ____ ____
____ ____ ____ ____ ____ ____
____ ____ ____ ____ ____ ____
Biofuel Production Page - bp20
Data Tables for Yeast Respiration Experiment
Test # ____ Test # ____ Test # ____
time reading time reading time reading
_0__ min ____ ml _0__ min ____ ml _0__ min ____ ml ____ ____ ____ ____ ____ ____ ____ ____ ____ ____ ____ ____ ____ ____ ____ ____ ____ ____ ____ ____ ____ ____ ____ ____ ____ ____ ____ ____ ____ ____ ____ ____ ____ ____ ____ ____ ____ ____ ____ ____ ____ ____ ____ ____ ____ ____ ____ ____ ____ ____ ____ ____ ____ ____ ____ ____ ____ ____ ____ ____ ____ ____ ____ ____ ____ ____ ____ ____ ____ ____ ____ ____ ____ ____ ____ ____ ____ ____ ____ ____ ____ ____ ____ ____ ____ ____ ____ ____ ____ ____ ____ ____ ____ ____ ____ ____ ____ ____ ____ ____ ____ ____ ____ ____ ____ ____ ____ ____ ____ ____ ____ ____ ____ ____ ____ ____ ____ ____ ____ ____
____ ____ ____ ____ ____ ____
Test # ____ Test # ____ Test # ____
time reading time reading time reading
_0__ min ____ ml _0__ min ____ ml _0__ min ____ ml
____ ____ ____ ____ ____ ____
____ ____ ____ ____ ____ ____
____ ____ ____ ____ ____ ____
____ ____ ____ ____ ____ ____
____ ____ ____ ____ ____ ____
____ ____ ____ ____ ____ ____
____ ____ ____ ____ ____ ____
____ ____ ____ ____ ____ ____
____ ____ ____ ____ ____ ____
____ ____ ____ ____ ____ ____
____ ____ ____ ____ ____ ____
____ ____ ____ ____ ____ ____
____ ____ ____ ____ ____ ____
____ ____ ____ ____ ____ ____
____ ____ ____ ____ ____ ____
____ ____ ____ ____ ____ ____
____ ____ ____ ____ ____ ____
____ ____ ____ ____ ____ ____
____ ____ ____ ____ ____ ____
____ ____ ____ ____ ____ ____
____ ____ ____ ____ ____ ____
Biofuel Production Page - bp21
Group member names: _____________________________________________________
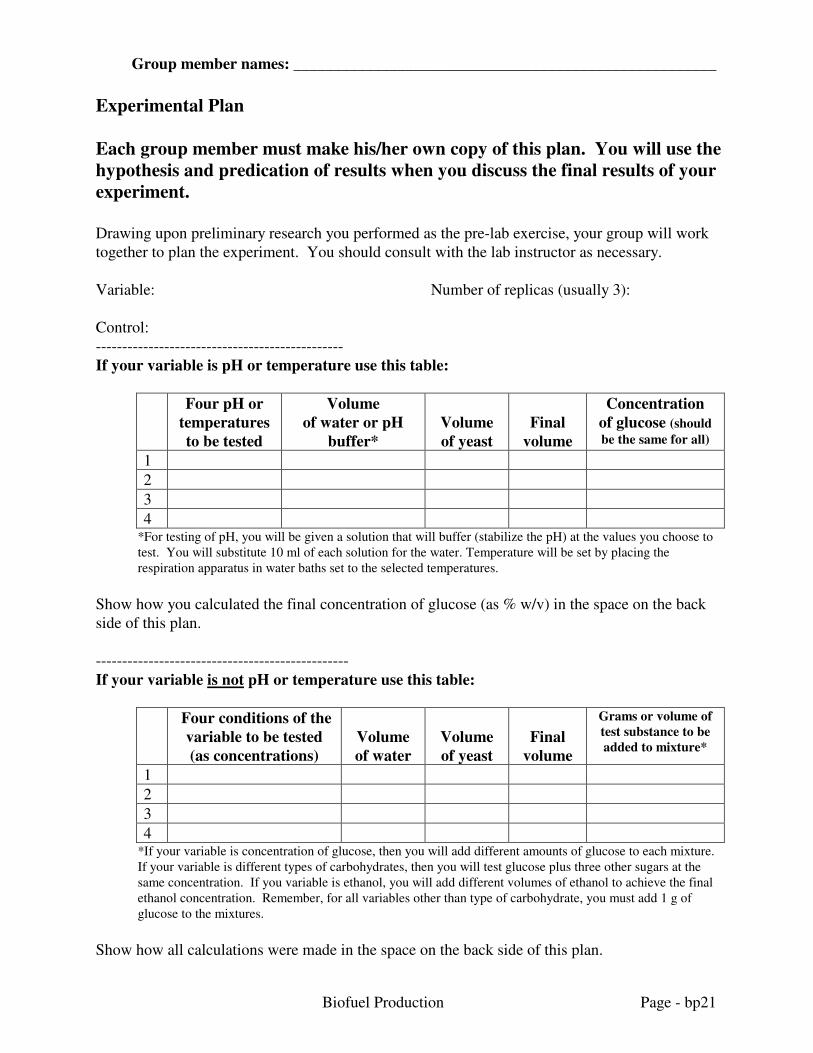
Experimental Plan
Each group member must make his/her own copy of this plan. You will use the
hypothesis and predication of results when you discuss the final results of your
experiment.
Drawing upon preliminary research you performed as the pre-lab exercise, your group will work
together to plan the experiment. You should consult with the lab instructor as necessary.
Variable: Number of replicas (usually 3):
Control:
-----------------------------------------------
If your variable is pH or temperature use this table:
Four pH or
temperatures
to be tested
Volume
of water or pH
buffer*
Volume
of yeast
Final
volume
Concentration
of glucose (should
be the same for all)
1
2
3
4 *For testing of pH, you will be given a solution that will buffer (stabilize the pH) at the values you choose to
test. You will substitute 10 ml of each solution for the water. Temperature will be set by placing the
respiration apparatus in water baths set to the selected temperatures.
Show how you calculated the final concentration of glucose (as % w/v) in the space on the back
side of this plan.
------------------------------------------------
If your variable is not pH or temperature use this table:
Four conditions of the
variable to be tested
(as concentrations)
Volume
of water
Volume
of yeast
Final
volume
Grams or volume of
test substance to be
added to mixture*
1
2
3
4 *If your variable is concentration of glucose, then you will add different amounts of glucose to each mixture.
If your variable is different types of carbohydrates, then you will test glucose plus three other sugars at the
same concentration. If you variable is ethanol, you will add different volumes of ethanol to achieve the final
ethanol concentration. Remember, for all variables other than type of carbohydrate, you must add 1 g of
glucose to the mixtures.
Show how all calculations were made in the space on the back side of this plan.
Biofuel Production Page - bp22
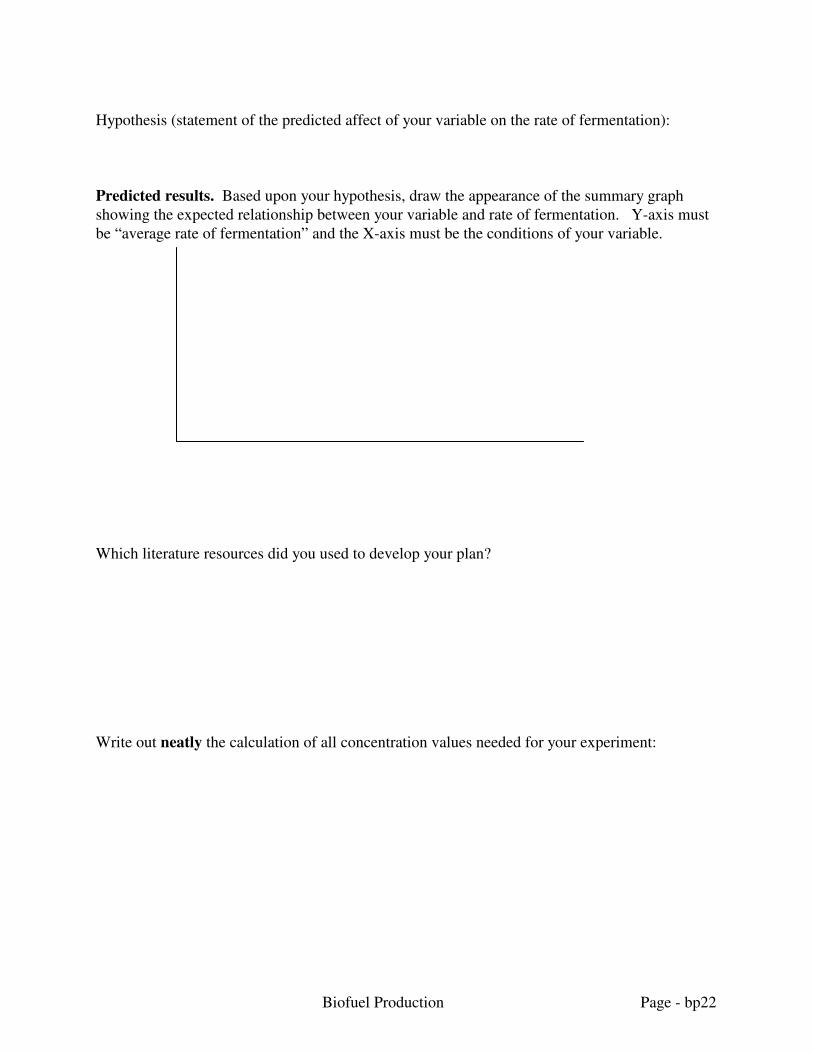
Hypothesis (statement of the predicted affect of your variable on the rate of fermentation):
Predicted results. Based upon your hypothesis, draw the appearance of the summary graph
showing the expected relationship between your variable and rate of fermentation. Y-axis must
be “average rate of fermentation” and the X-axis must be the conditions of your variable.
Which literature resources did you used to develop your plan?
Write out neatly the calculation of all concentration values needed for your experiment: