Embed Size (px)
Citation preview
Biological‐Based RiskBiological Based RiskAssessment for Space Exploration
‐What’s New?‐What s New?
Francis A. Cucinotta
NASA, Lyndon B. Johnson Space Center
I t ti l S i f R di ti R h
1
International Symposium for Radiation Researchand Medical Physics, May 31 2011

Estimating Space Radiation Space to Astronauts
National Aeronautics and Space Administration
• NASA is developing new approaches to radiation risk assessment:– Probabilistic risk assessment framework– Tissue specific estimates
• Research focus is on uncertainty reductionreduction– Smaller tolerances are needed as risk
increases, with <50% uncertainty required for Mars mission
• NASA 2010 Model – Updates to Low LET Risk coefficients– Risks for Never‐Smokers – Track Structure and Fluence based
approach to radiation quality
• Pathway to NASA 2020 Model
2
y– NASA Space Radiation Lab (NSRL)
experimental program– Modular Systems Radiation Biology GCR doses on Mars
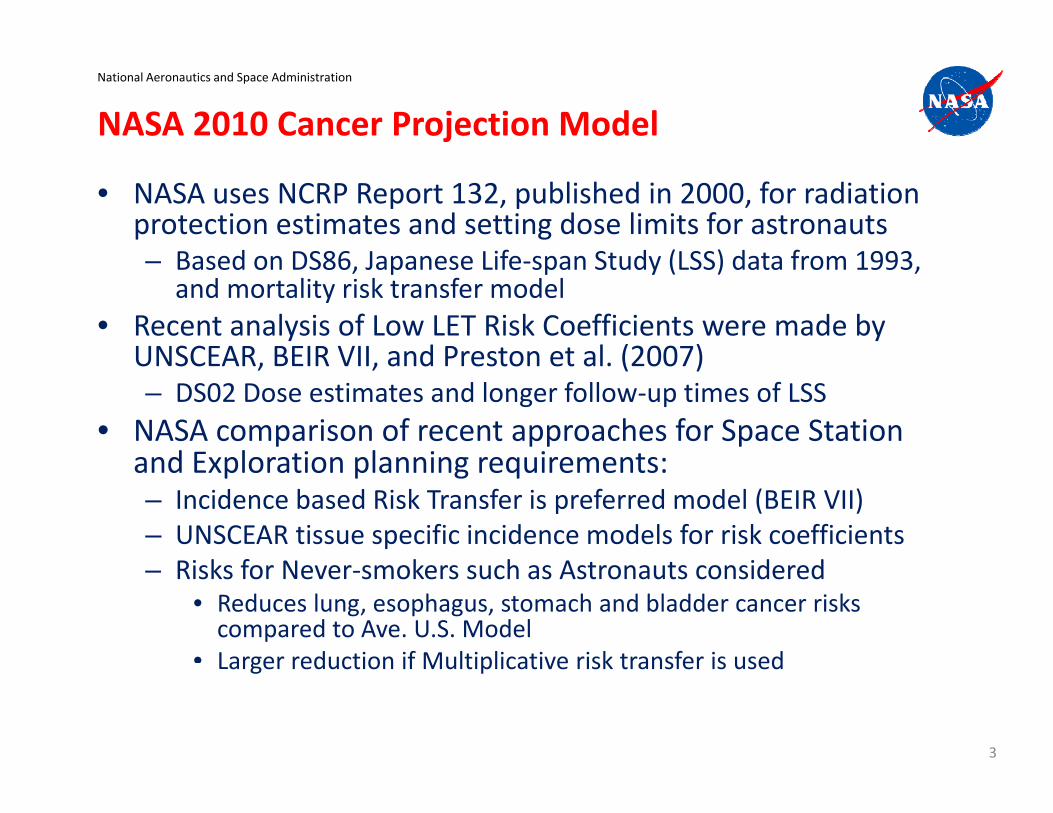
NASA 2010 Cancer Projection Model
National Aeronautics and Space Administration
• NASA uses NCRP Report 132, published in 2000, for radiation protection estimates and setting dose limits for astronauts
B d DS86 J Lif St d (LSS) d t f 1993– Based on DS86, Japanese Life‐span Study (LSS) data from 1993, and mortality risk transfer model
• Recent analysis of Low LET Risk Coefficients were made by UNSCEAR BEIR VII and Preston et al (2007)UNSCEAR, BEIR VII, and Preston et al. (2007)– DS02 Dose estimates and longer follow‐up times of LSS
• NASA comparison of recent approaches for Space Station and Exploration planning requirements:and Exploration planning requirements:– Incidence based Risk Transfer is preferred model (BEIR VII)– UNSCEAR tissue specific incidence models for risk coefficients
Ri k f N k h A id d– Risks for Never‐smokers such as Astronauts considered• Reduces lung, esophagus, stomach and bladder cancer risks compared to Ave. U.S. Model
• Larger reduction if Multiplicative risk transfer is usedLarger reduction if Multiplicative risk transfer is used
3
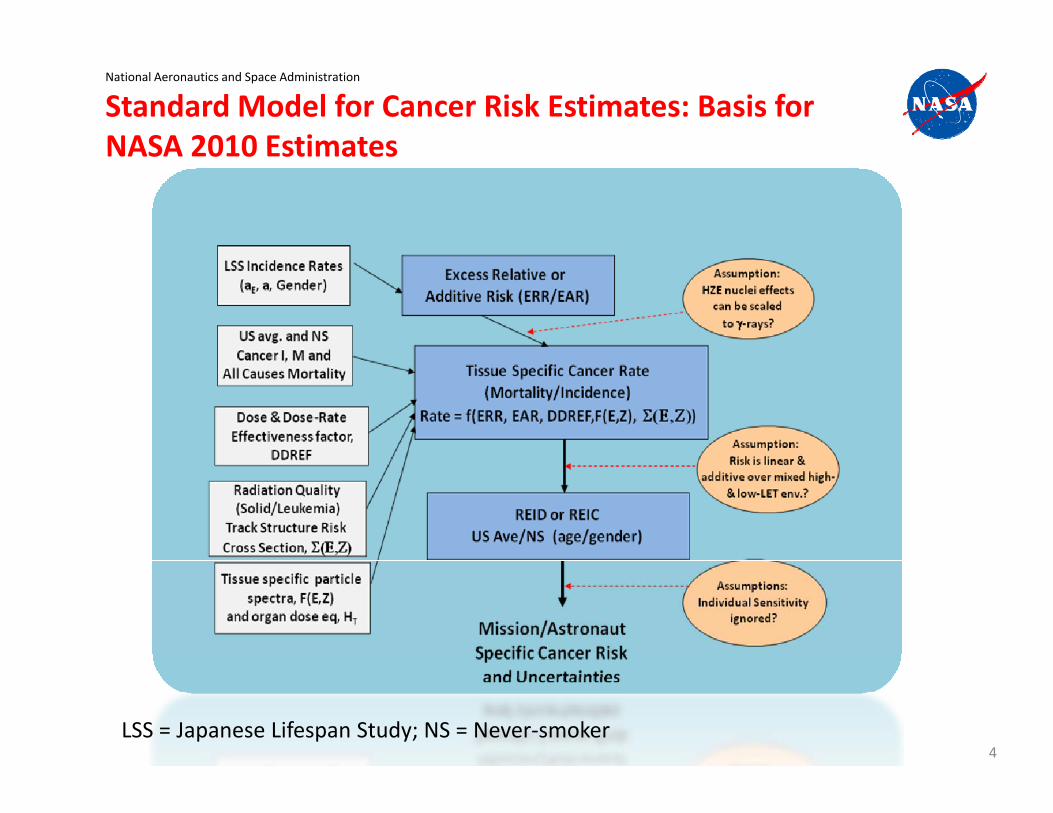
Standard Model for Cancer Risk Estimates: Basis for NASA 2010 Estimates
National Aeronautics and Space Administration
NASA 2010 Estimates
4LSS = Japanese Lifespan Study; NS = Never‐smoker

Radiation Risks for Never‐SmokersNational Aeronautics and Space Administration
• More than 90% of Astronauts are never‐smokers and remainder are former smokers
Lung cancer in Unexposed
• Smoking effects on Risk projections:– Epidemiology data confounded by possible
radiation‐smoking interactions, and errors g ,documenting tobacco use
– Average U.S. Population used by NCRP Reports 98 and 132
• NASA Model projects a 20 to 40‐% risk reduction for never‐smokers compared to U.S. Ave. – Larger decreases are possible if more were
known on Risk Transfer models– Balance between Small Cell and Non‐Small
Cell Lung Cancer a critical question
Thun et al., PLoS Med (2008)
Cell Lung Cancer a critical question including high LET effects
5

CDC Estimates of Smoking Attributable Cancers
National Aeronautics and Space Administration
g
Relative Risk to Never‐smokers (NS) RR for NS to U SRelative Risk to Never‐smokers (NS) RR for NS to U.S. Avg
Males Current smokers Former smokers
Never‐smokers RR(NS/U.S.)
Esophagus 6 76 4 46 1 0 27Esophagus 6.76 4.46 1 0.27
Stomach 1.96 1.47 1 0.71
Bladder 3.27 2.09 1 0.50
Oral Cavity 10.89 3.4 1 0.23
Lung* 23.26 8.7 1 0.11
Females Current smokers Former smokers
Never‐smokers RR(NS/U.S.)
Esophagus 7.75 2.79 1 0.35
Stomach 1.36 1.32 1 0.85
Bladder 2.22 1.89 1 0.65
Oral Cavity 5.08 2.29 1 0.46
L * 12 69 4 53 1 0 23Lung* 12.69 4.53 1 0.23
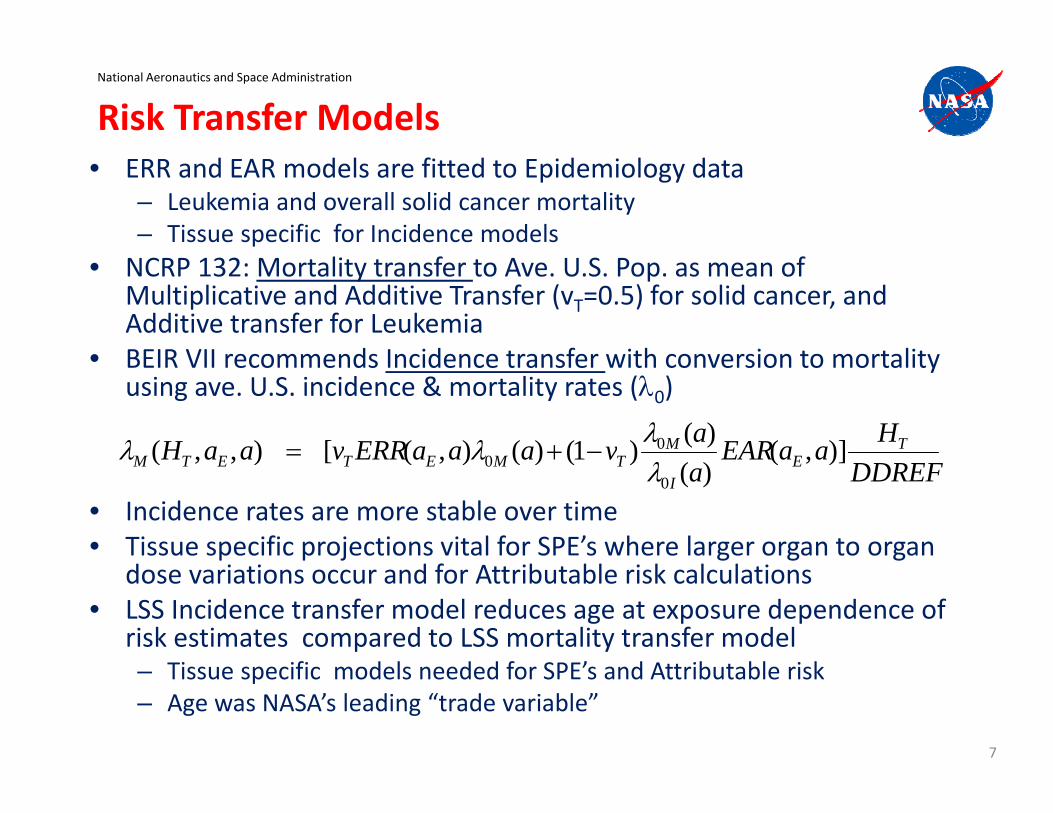
Risk Transfer ModelsNational Aeronautics and Space Administration
• ERR and EAR models are fitted to Epidemiology data– Leukemia and overall solid cancer mortality– Tissue specific for Incidence models
• NCRP 132: Mortality transfer to Ave. U.S. Pop. as mean of Multiplicative and Additive Transfer (vT=0.5) for solid cancer, and Additive transfer for Leukemia
• BEIR VII recommends Incidence transfer with conversion to mortality• BEIR VII recommends Incidence transfer with conversion to mortality using ave. U.S. incidence & mortality rates (0)
HaaEARavaaaERRvaaH TE
MTMETETM )],()()1()(),([),,( 0
0
• Incidence rates are more stable over time• Tissue specific projections vital for SPE’s where larger organ to organ
DDREFaaEAR
avaaaERRvaaH E
ITMETETM )],(
)()1()(),([),,(
00
p p j g g gdose variations occur and for Attributable risk calculations
• LSS Incidence transfer model reduces age at exposure dependence of risk estimates compared to LSS mortality transfer model
Ti ifi d l d d f SPE’ d A ib bl i k– Tissue specific models needed for SPE’s and Attributable risk – Age was NASA’s leading “trade variable”
7

Point Estimates: Risk of Exposure Induced Death (REID)
National Aeronautics and Space Administration
Age at Exposure NASA’s Leading Trade Variable?
vID per Sv
%RE
8
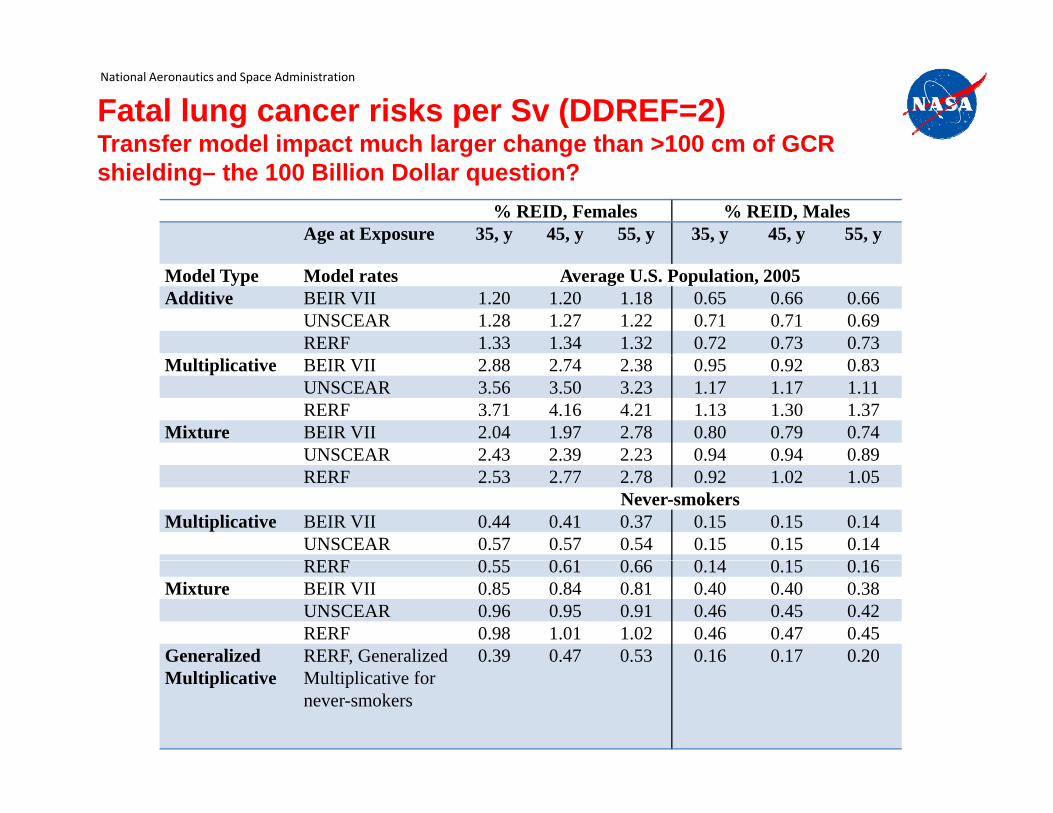
Fatal lung cancer risks per Sv (DDREF=2)Transfer model impact much larger change than >100 cm of GCR
National Aeronautics and Space Administration
Transfer model impact much larger change than 100 cm of GCR shielding– the 100 Billion Dollar question?
% REID, Females % REID, MalesAge at Exposure 35, y 45, y 55, y 35, y 45, y 55, y
Model Type Model rates Average U.S. Population, 2005Additive BEIR VII 1.20 1.20 1.18 0.65 0.66 0.66
UNSCEAR 1.28 1.27 1.22 0.71 0.71 0.69RERF 1.33 1.34 1.32 0.72 0.73 0.73
Multiplicative BEIR VII 2.88 2.74 2.38 0.95 0.92 0.83UNSCEAR 3.56 3.50 3.23 1.17 1.17 1.11RERF 3.71 4.16 4.21 1.13 1.30 1.37
Mixture BEIR VII 2.04 1.97 2.78 0.80 0.79 0.74UNSCEAR 2 43 2 39 2 23 0 94 0 94 0 89UNSCEAR 2.43 2.39 2.23 0.94 0.94 0.89RERF 2.53 2.77 2.78 0.92 1.02 1.05
Never-smokersMultiplicative BEIR VII 0.44 0.41 0.37 0.15 0.15 0.14
UNSCEAR 0.57 0.57 0.54 0.15 0.15 0.14RERF 0 55 0 61 0 66 0 14 0 15 0 16RERF 0.55 0.61 0.66 0.14 0.15 0.16
Mixture BEIR VII 0.85 0.84 0.81 0.40 0.40 0.38UNSCEAR 0.96 0.95 0.91 0.46 0.45 0.42RERF 0.98 1.01 1.02 0.46 0.47 0.45
Generalized RERF, Generalized 0.39 0.47 0.53 0.16 0.17 0.20Multiplicative
,Multiplicative for never-smokers

NASA Radiation Quality DescriptionNational Aeronautics and Space Administration
• ICRP WR or Q(L) inadequate for Space radiation, and is Not i f d b i i di bi l
Thacker et al. 1979
informed by existing radiobiology results:– Leukemia lower RBE than solid
cancerscancers– Energy at peak RBE depends on
Particle charge number not LET– Slope of rise and fall with LET
inaccurate in ICRP Q(L)– RBE depends on charge Z and energy
E, and not LET alone
• ICRP assume ion with higher Z
Total Exchanges in Human Lymphocytes
30
40
SiFe
• ICRP assume ion with higher Z has higher effectiveness than lower Z at fixed LET; not supported by track models or
RBE
max
10
20
supported by track models or Expt.’s
10LET, keV/m
10 100 10000
10

NASA Approach to Radiation QualityNational Aeronautics and Space Administration
• Risk is calculated at tissue sites not using Radiation weighting factors• Track structure and existing radiobiology data should be used to
guide choice on functional formsguide choice on functional forms• Human data for Thorostrast (Boice et al.), AML data in mice, and
human cell culture expt.: Leukemia RBE smaller than solid cancer RBE• Maximum effectiveness per particle can be estimated by p p y
experiments for RBEmax• The maximum occurs at “saturation point” of cross section for any Z• Delta‐ray effects for relativistic particles should be accounted for in Q y p
model• Existing data shows (E,Z) or Z*2/beta2 better descriptors than LET;
track structure models predict ll d f d b b l d b f ( ) f• Well defined Probability distribution functions (PDF) to account for
variation of possible parameter values (0, m, and )
mZ PePZEPcZEPQ )1(;),())(1( //0 22* TDNASA PeP
LETZEPQ )1(;)()),(1( 0
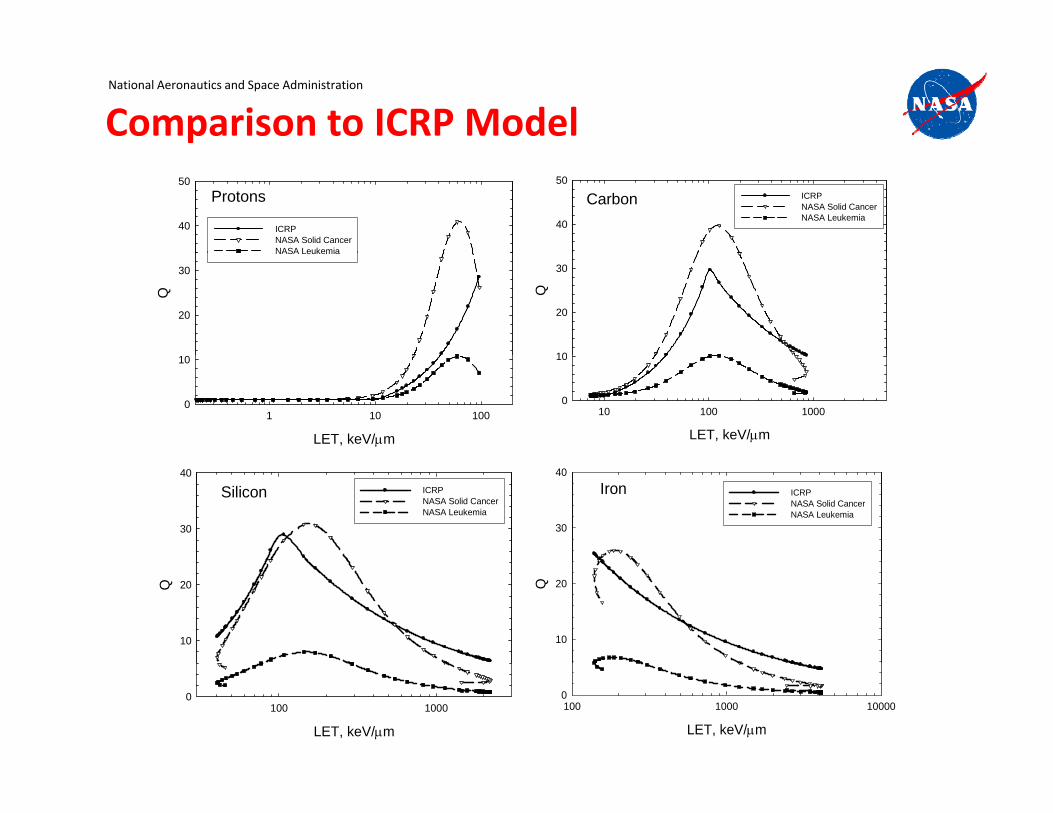
Comparison to ICRP ModelNational Aeronautics and Space Administration
Carbon40
50ICRPNASA Solid CancerNASA Leukemia
Protons
40
50
ICRPNASA Solid CancerNASA Leukemia
Q
10
20
30
Q
20
30
NASA Leukemia
LET, keV/m
10 100 10000
10
LET, keV/m
1 10 1000
10
Iron
30
40
ICRPNASA Solid CancerNASA Leukemia
Silicon
30
40ICRPNASA Solid CancerNASA Leukemia
Q
10
20Q
10
20
LET, keV/m
100 1000 100000
LET, keV/m
100 10000
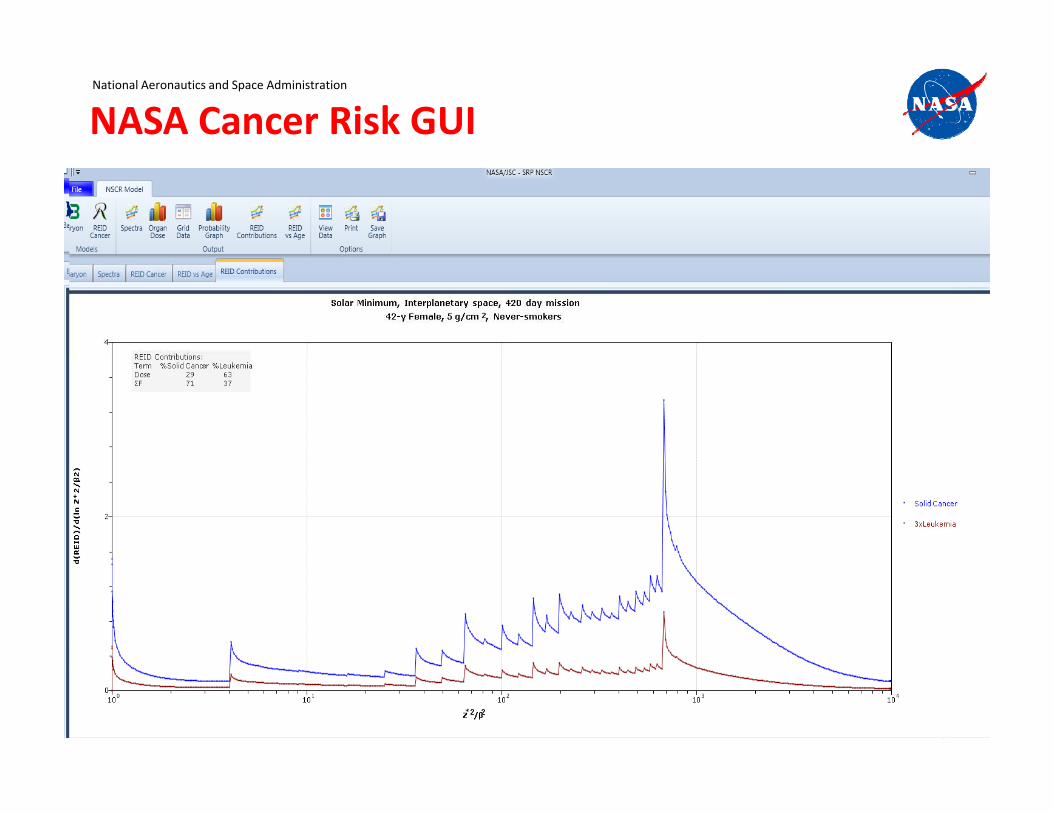
NASA Cancer Risk GUINational Aeronautics and Space Administration
13

Low LET Uncertainties: Problems for Mars missionNational Aeronautics and Space Administration
• Published analysis shows about 2‐fold uncertainty for 95% CL before Q and space physics uncertainties are considered– Statistical, dosimetry, transfer model and DDREF uncertainties
• NASA Goal of +50% error for Mars mission never reached in “Standard Model” due to low LET uncertainties aloneStandard Model due to low LET uncertainties alone
Analysis %Risk for 0.1 Sv Comment
NCRP Report 126 0.37 [0.115, 0.808] Gender avg. with 90% CINCRP Report 126 0.37 [0.115, 0.808] Gender avg. with 90% CI
BEIR VII Males 0.48 [0.24, 0.98] 95% CI
BEIR VII Female 0.74 [0.37, 1.5] 95% CI
UNSCEAR Solid Cancer 0 502 [0 28 0 735] Gender avg with 90% CIUNSCEAR Solid Cancer 0.502 [0.28, 0.735] Gender avg. with 90% CI, DDREF uncert. not considered
UNSCEAR Leukemia 0.061 [0.014, 0.118] Gender avg. with 90% CI
14
NASA 2010 0.38 [0.139, 0.76] 40‐y Female Never‐smokerwith 95% CI
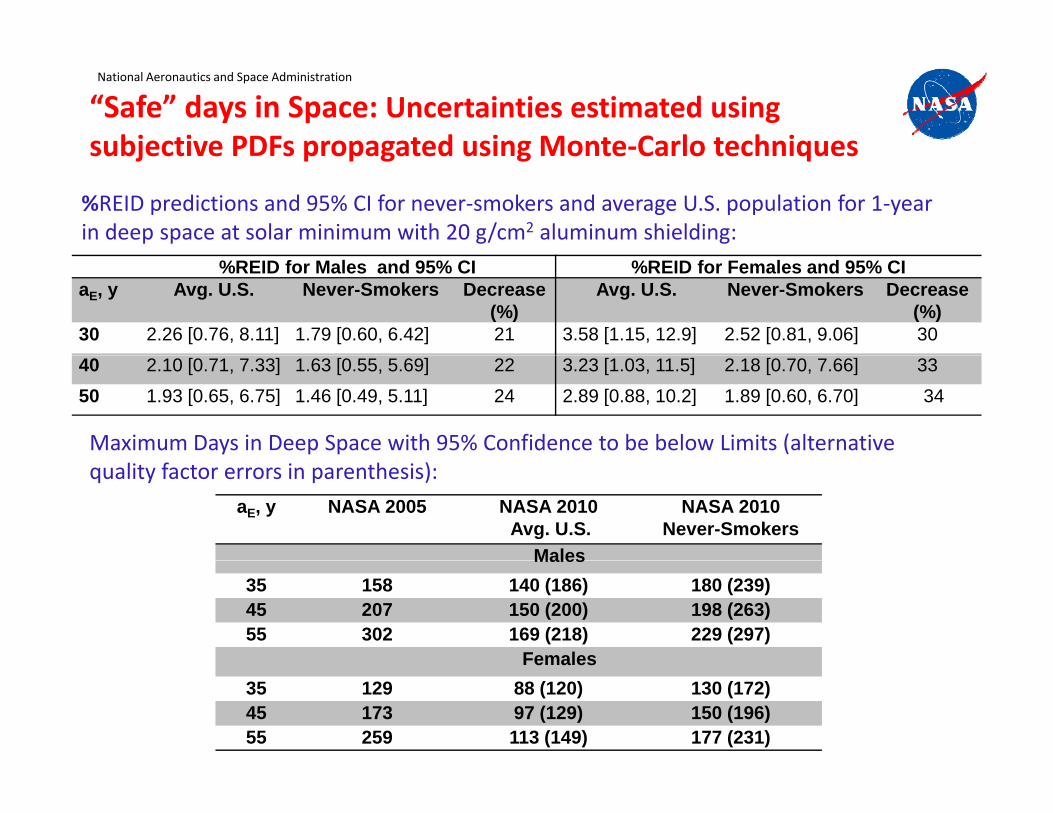
“Safe” days in Space: Uncertainties estimated using subjective PDFs propagated using Monte‐Carlo techniques
National Aeronautics and Space Administration
subjective PDFs propagated using Monte Carlo techniques
%REID predictions and 95% CI for never‐smokers and average U.S. population for 1‐year in deep space at solar minimum with 20 g/cm2 aluminum shielding:
%REID for Males and 95% CI %REID for Females and 95% CIaE, y Avg. U.S. Never-Smokers Decrease
(%)Avg. U.S. Never-Smokers Decrease
(%)30 2.26 [0.76, 8.11] 1.79 [0.60, 6.42] 21 3.58 [1.15, 12.9] 2.52 [0.81, 9.06] 3040 2.10 [0.71, 7.33] 1.63 [0.55, 5.69] 22 3.23 [1.03, 11.5] 2.18 [0.70, 7.66] 3350 1.93 [0.65, 6.75] 1.46 [0.49, 5.11] 24 2.89 [0.88, 10.2] 1.89 [0.60, 6.70] 34
Maximum Days in Deep Space with 95% Confidence to be below Limits (alternative
aE, y NASA 2005 NASA 2010Avg. U.S.
NASA 2010Never-Smokers
Males
quality factor errors in parenthesis):
Males35 158 140 (186) 180 (239)45 207 150 (200) 198 (263)55 302 169 (218) 229 (297)
FemalesFemales35 129 88 (120) 130 (172)45 173 97 (129) 150 (196)55 259 113 (149) 177 (231)
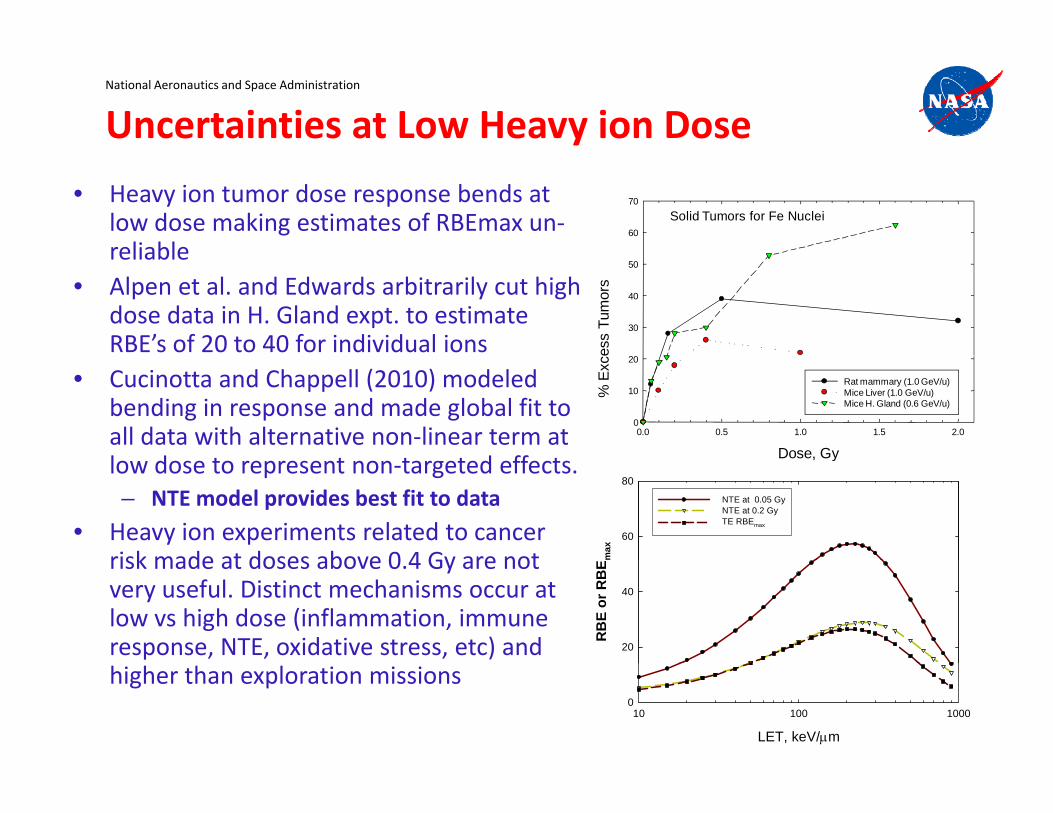
Uncertainties at Low Heavy ion DoseNational Aeronautics and Space Administration
• Heavy ion tumor dose response bends at low dose making estimates of RBEmax un‐reliable
Solid Tumors for Fe Nuclei60
70
reliable• Alpen et al. and Edwards arbitrarily cut high
dose data in H. Gland expt. to estimate RBE’s of 20 to 40 for individual ions es
s Tu
mor
s
30
40
50
• Cucinotta and Chappell (2010) modeled bending in response and made global fit to all data with alternative non‐linear term at l d t t t t d ff t Dose, Gy
0.0 0.5 1.0 1.5 2.0
% E
xce
0
10
20
Rat mammary (1.0 GeV/u)Mice Liver (1.0 GeV/u)Mice H. Gland (0.6 GeV/u)
low dose to represent non‐targeted effects. – NTE model provides best fit to data
• Heavy ion experiments related to cancer risk made at doses above 0 4 Gy are not m
ax
60
80
NTE at 0.05 GyNTE at 0.2 GyTE RBEmax
Dose, Gy
risk made at doses above 0.4 Gy are not very useful. Distinct mechanisms occur at low vs high dose (inflammation, immune response, NTE, oxidative stress, etc) and R
BE
or R
BE
20
40
higher than exploration missions
LET, keV/m
10 100 10000
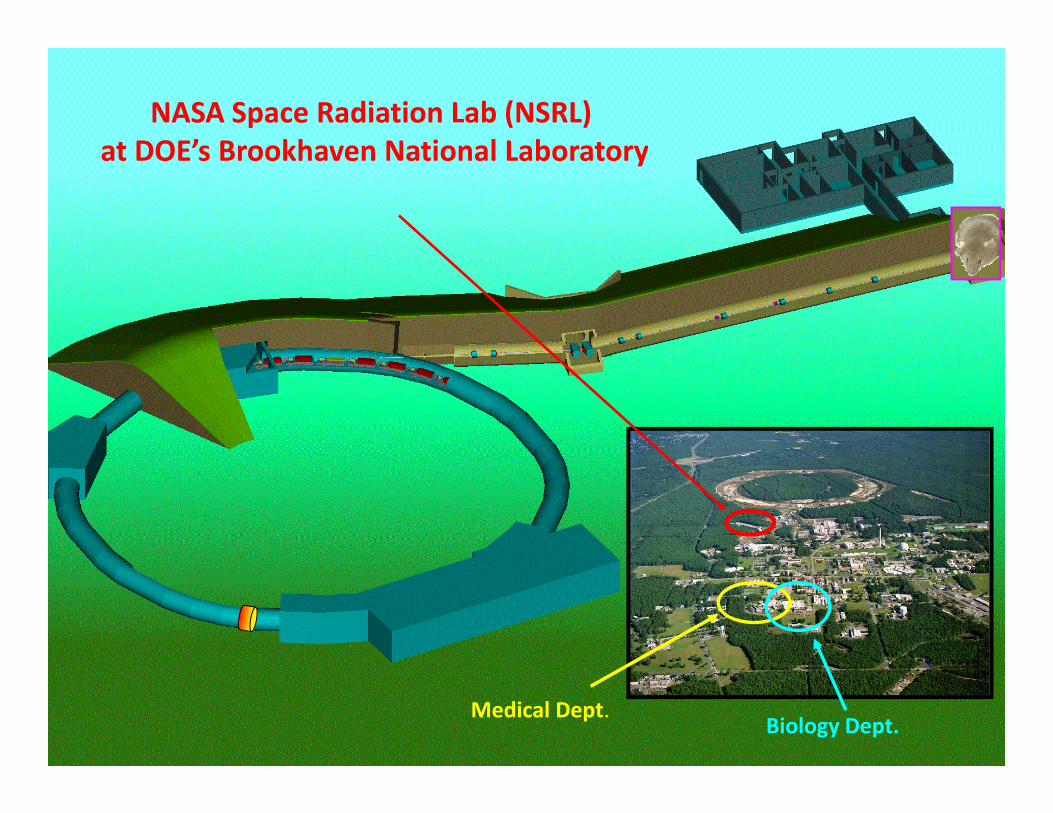
NASA Space Radiation Lab (NSRL)at DOE’s Brookhaven National Laboratoryat DOE s Brookhaven National Laboratory
17Medical Dept.
Biology Dept.

NASA Risk 2020‐ New Approaches are neededNational Aeronautics and Space Administration
• Inherent uncertainties in “Standard’” model points to the need for new approaches
NASA Space Radiation Lung Cancer Consortiumpp
• What would we do if there were no low LET human cancer data?
• Systems biology for disease modeling is most viable approach
Mouse models
Human Cell Culture
NASA Biophysics
BNL Dosimetry
NASA/USRAManagement
External Advisory Panel
most viable approach• NASA has selected 5 NASA Specialized
Centers of Research (NSCORs) and several related Grants using mouse models of colorectal liver leukemia Harderian
Transformation
UTSW
P53 in Cancer
Duke
MicroRNA and Mouse tumors
Emory
Tumor induction
LBNL
colorectal, liver, leukemia, Harderiangland, and lung cancer from space radiation.
• The NASA Lung Consortium is a $28 M effort to focus on risks of non‐small lung
Progression
Bioinformatics
Repair and Instability
Progression
Ind. Sensitivity
Cell of Origin
Stress and Instability
Epigenetics
Repair and microRNA
H. Gland Relevance
effort to focus on risks of non small lung cancer (NSCLC) and small‐cell lung cancer (SCLC) from space radiation.
• CNS and Circulatory disease risks from space radiation are a major concern forspace radiation are a major concern for space exploration with 12 Grants funded by NASA and the CNS NSCOR.
18

Figure 6
The Hallmarks of Cancer (2011):Recent focus of NASA R01 type grants is to study 2 orRecent focus of NASA R01 type grants is to study 2 or more Cancer Hallmarks using NSRL
Source: Cell , Volume 144, Issue 5, Pages 646‐674 (DOI:10.1016/j.cell.2011.02.013)

Modular Systems Biology: The complexity of bi l i l t t M d l f k
National Aeronautics and Space Administration
biological systems suggests a Modular framework
Modules in Cancer Development Modules in Neuronal DeathModules in Cancer Development Modules in Neuronal Death
20
Alberghina & Colangelo, BMC Neuro. (2006)Hanahan & Weinberg, Cell (2011)
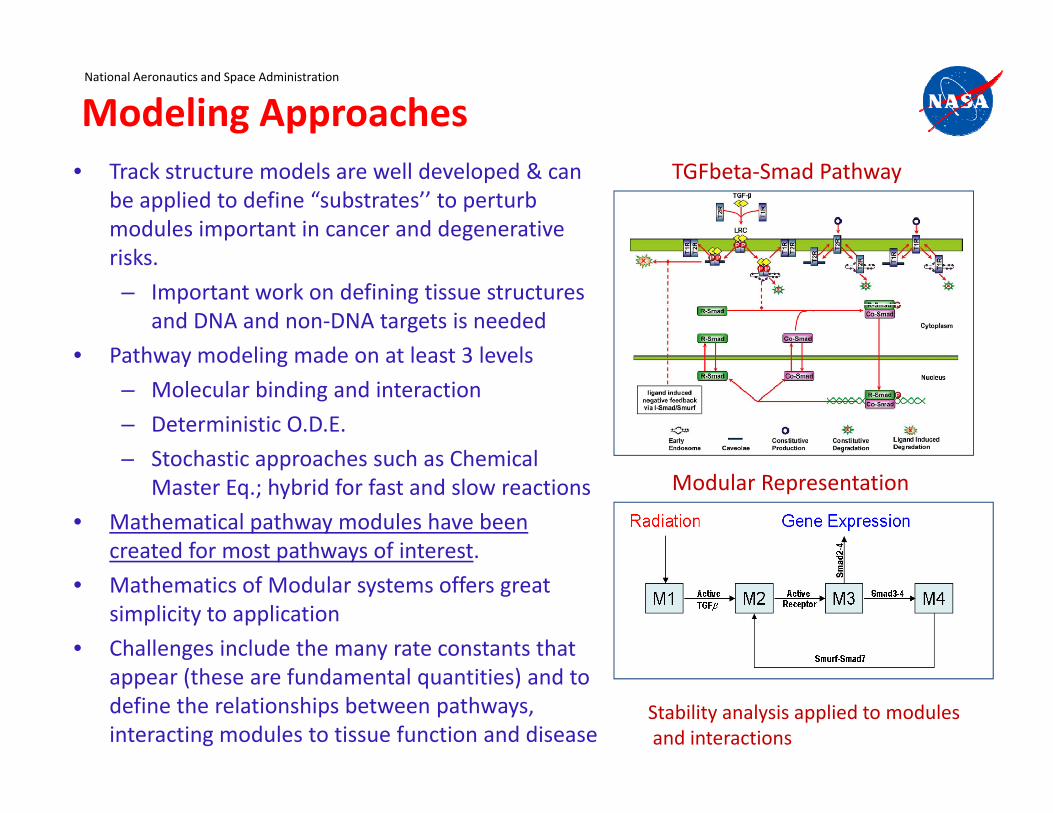
Modeling Approaches National Aeronautics and Space Administration
• Track structure models are well developed & can be applied to define “substrates’’ to perturb modules important in cancer and degenerative i k
TGFbeta‐Smad Pathway
risks.
– Important work on defining tissue structures and DNA and non‐DNA targets is needed
• Pathway modeling made on at least 3 levels• Pathway modeling made on at least 3 levels
– Molecular binding and interaction
– Deterministic O.D.E.
Stochastic approaches such as Chemical– Stochastic approaches such as Chemical Master Eq.; hybrid for fast and slow reactions
• Mathematical pathway modules have been created for most pathways of interest.
Modular Representation
p y
• Mathematics of Modular systems offers great simplicity to application
• Challenges include the many rate constants that appear (these are fundamental quantities) and to define the relationships between pathways, interacting modules to tissue function and disease
Stability analysis applied to modulesand interactions
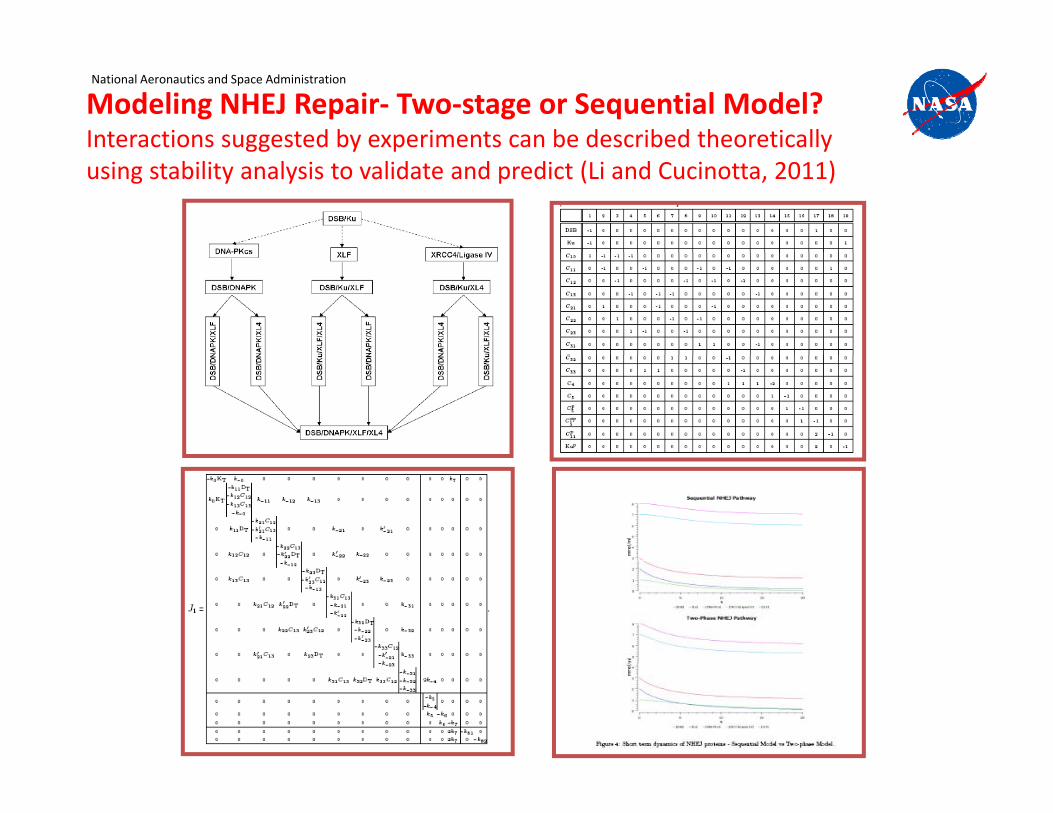
Modeling NHEJ Repair‐ Two‐stage or Sequential Model?Interactions suggested by experiments can be described theoretically
National Aeronautics and Space Administration
gg y p yusing stability analysis to validate and predict (Li and Cucinotta, 2011)
ConclusionsNational Aeronautics and Space Administration
• Never‐smokers estimated at 20 to 40% less overall cancer risk compared to Ave US populationcompared to Ave. US population
• Much Larger (or slightly smaller) reduction possible if more were known on SCLC and NSCLC risks from radiation
• New NASA Radiation quality model frames approach to integrate experimental data with track structure descriptions
I d t i t l i f di ti i k– Improved uncertainty analysis of space radiation risks
– Data on RBEmax at saturation point in established model of human cancer is critical experiment leading to largest uncertainty reduction
• Important question remain with regards to radiation tracks and the role of cell killing and target size.– These factors most influential on “slope” and position of maximum ofThese factors most influential on slope and position of maximum of
“Risk” per particle

Conclusions‐ continuedNational Aeronautics and Space Administration
• Updates to NASA model 2010 are expected as NSCOR and other data sets are published; as related to refined DDREF and RBE values including tissue specific estimatesspecific estimates
• However, the “Standard” model has an inherent uncertainty that likely preclude achieving NASA’s y y p ggoals for radiation safety on Mars mission
• NSRL program and theoretical/experimental h t M d l t bi l t d lapproach to Modular systems biology to develop
disease models is long‐range approach for NASA programp g