Embed Size (px)
Citation preview

University of Massachusetts AmherstScholarWorks@UMass Amherst
Biology Department Faculty Publication Series Biology
2010
Treatment of Batch in the Detection, Calibration,and Quantification of Immunoassays in Large-scaleEpidemiologic StudiesBW Whitcomb
NJ Perkins
PS Alpert
EF Schisterman
Follow this and additional works at: https://scholarworks.umass.edu/biology_faculty_pubs
Part of the Biology Commons
This Article is brought to you for free and open access by the Biology at ScholarWorks@UMass Amherst. It has been accepted for inclusion in BiologyDepartment Faculty Publication Series by an authorized administrator of ScholarWorks@UMass Amherst. For more information, please [email protected].
Recommended CitationWhitcomb, BW; Perkins, NJ; Alpert, PS; and Schisterman, EF, "Treatment of Batch in the Detection, Calibration, and Quantificationof Immunoassays in Large-scale Epidemiologic Studies" (2010). Epidemiology. 1.https://10.1097/EDE.0b013e3181dceac2

Treatment of Batch in the Detection, Calibration, andQuantification of Immunoassays in Large-scale EpidemiologicStudies
Brian W. WHITCOMBa,b, Neil J. PERKINSb, Paul S. ALBERTc, and Enrique F.SCHISTERMANba Division of Biostatistics and Epidemiology, School of Public Health and Health Sciences,University of Massachusetts, Amherst, MAb Epidemiology Branch, Division of Epidemiology, Statistics and Prevention Research, EuniceKennedy Shriver National Institute of Child Health & Human Development, National Institutes ofHealth, Bethesda, MDc Biometric Research Branch, Division of Cancer Treatment and Diagnosis, National CancerInstitute, National Institutes of Health, Bethesda, MD
AbstractBackground—Many laboratory assays measure biomarkers via a 2-stage process. Directmeasurement yields relative measures that are subsequently transformed to the unit of interest byusing a calibration experiment. The calibration experiment is performed within the mainexperiment and uses a validation set for which true values are known and relative values aremeasured by assays to estimate the relation between relative and absolute values. Immunoassays,polymerase chain reaction, and chromatographic approaches are among assays performed in thismanner.
Methods—For studies with multiple batches, data from more than a single calibrationexperiment are available. Conventionally, calibration of assays based on the standard curve isperformed specific to each batch; the calibration experiment from each batch is used to calibrateeach batch independently. This batch-specific approach incorporates batch variability but, due tothe small number of calibration measurements in each batch, may not be best suited for thispurpose.
Results—Mixed-effects models have been described to address interassay variability and toprovide a measure of quality assurance. Conversely, when interbatch variability is negligible, amodel that does not incorporate batch effect may be used to estimate an overall calibration curve.
Conclusion—We explore approaches for use of calibration data in studies with many batches.Using a real data example with biomarker and outcome information, we show that risk estimatesmay vary depending on the calibration approach utilized. We demonstrate the potential for biaswhen using simulations. Under minimal interbatch variability, as seen in our data, conventionalbatch-specific calibration does not best utilize information available in the data and results inattenuated risk estimates.
Correspondence: Brian W. Whitcomb, Division of Biostatistics & Epidemiology, School of Public Health & Health Sciences, 408 Arnold House, 715 North Pleasant Street, University of Massachusetts, Amherst, MA 01003-9304. [email protected].
INTRODUCTIONMany laboratory assays measure biomarkers via a 2-stage process; direct measurement ofthe biomarkers yields a relative measure (eg, optical density [OD]) that subsequently mustbe transformed to the unit of interest through use of a calibration experiment. Regressioncalibration (RC) has been well described in other contexts.1,2 Similarly for biomarkerassays, the calibration experiment uses a validation set for which the true values are known.These known concentration values in combination with the assay measurements may beused to estimate the link function between the assay measurements and the desired unit. Thisrelationship is then used to convert assay measurements to units of concentration. Such anapproach affects quantification of assay results as well as the effective detection limits.3,4
Many assays use calibration techniques for quantification. These includechemiluminescence techniques such as enzyme-linked immunosorbent assay (ELISA) andsimilar antibody–antigen capture systems, chromatographic approaches, and real-timepolymerase chain reaction, among others. In this paper, we focus our discussion onmultiplex immunologic assays for assessment of protein concentrations in a sample.
A large and rapidly growing number of multiplexing assays are available for detection andmeasurement of ligands. These assays allow simultaneous assessment of more than 1 ligandand are performed in multiwell plates, with each well containing 1 of the calibratorstandards or study subject samples to be analyzed. When there are more samples to beanalyzed than available wells, multiple batches must be utilized. When this is the case andmore than 1 batch is processed, data from more than a single calibration experiment areavailable. Conventionally, the calibration of relative assay results into a unit ofconcentration based on the standard curve is performed in a batch-specific fashion; thecalibration experiment and assay quantitation are performed for each batch independently.The results of each calibration experiment are used to estimate the shape and range of 1calibration curve for each separate batch. When using some approaches, quantitation islimited to only those values in the linear range of the calibration curve, such that the assayquantification limits are essentially established during this step.
The availability of larger calibration datasets in large-scale studies raises the question ofhow best to utilize these data. The batch-specific approach for estimating calibration curvesincorporates batch variability but may not be best suited for this purpose. Batch-specificcalibration—using calibrator data from each assay for calibrating unknowns only from thatassay—relies on limited calibration measurements in each batch, resulting in impreciseestimation of the calibration curve and making it difficult to differentiate measurement errorfrom batch variability. A mixed-effects model estimating fixed and random effects has beendescribed for addressing interassay variability that may arise for a variety of reasons—trueassay variation, experimental conditions including weather, laboratory technician variability,among others—and, in measuring deviations from fixed effects within each batch, have thebenefit of providing a measure of quality assurance.5–9 Conversely, when there is negligibleinterbatch variability, a model that does not incorporate batch effect may be used to estimatean overall calibration curve.
In this paper, we explore various approaches for utilization of calibration data in large-scalestudies with many batches and make comparisons with conventional laboratory approaches.We utilize log base 10–transformed observed ODs and known concentration values for thecalibration experiments for the cytokine granulocyte colony–stimulating factor (GCSF) froma large study in which 24 batches were used. We consider linear and curvilinear calibrationmodels in a batch-specific fixed-effects manner, mixed-effects models that incorporate batcheffects as random effects, and linear models that collapse across batches (ie, do not accountfor a batch effect). Each of these approaches is evaluated in calibration models with the
known concentration as the dependent variable as in RC10 and alternatively, with observedODs as the dependent variable—inverse regression calibration (IRC). We apply theseapproaches to a dataset of cytokine levels measured in 943 women in a case-control study ofmiscarriage and 1) compare each approach; 2) evaluate factors that result in disagreementbetween the approaches; and 3) compare estimates from logistic regression models ofmiscarriage by using each of the proposed calibration approaches. Additionally, results of asimulation study are presented. Using a 4-parameter logistic model to generate data, as hasbeen described in the literature,11,12 we evaluate the effect of choice of calibration approachon risk estimates under a range of conditions.
METHODSStudy Population
Participants were selected from the Collaborative Perinatal Project (CPP) cohort. The CPPwas a multisite prospective study of early childhood outcomes, conducted from 1959 to1974, that enrolled participants at presentation for prenatal care and is described in detailelsewhere.13 Serum samples were collected at entry to the CPP and at subsequent bimonthlyvisits and stored at −20°C. Gestation was estimated using self-reported date of lastmenstrual period. Miscarriage was defined as involuntary loss of a clinically recognizedintrauterine pregnancy at less than 140 days of gestation. Participants with serum samplescollected fewer than 10 days prior to miscarriage (n = 355) or for whom serum samples wereunavailable (n = 36) were excluded. After exclusions, 462 serum samples from cases ofmiscarriage and 481 serum samples from nonmiscarriage controls were selected for thisstudy. These samples were used for assessment of GCSF, among other cytokines, toevaluate the relation between levels of inflammatory markers in early pregnancy andadverse pregnancy outcomes, including miscarriage and preterm delivery.
GCSF AssessmentSerum GCSF levels, along with other assayed cytokines, were measured using the multiplexFluorokine MAP Human Cytokine detection system (R&D Systems, Inc., Minneapolis, MN)as previously described.14 Briefly, the assays use 96-well plates with 50 μg of sera induplicates in a sandwich ELISA-based approach. The solid phase consists of fluorescentbeads covalently linked with cytokine-specific monoclonal antibodies, allowing capture ofeach cytokine and corresponding biotinylated antibody. After addition of streptavidin-phycoerythrin, intensity is measured using the Luminex 100 IS system (Luminex Corp.,Austin, TX). Utility of these assays for evaluation of serum cytokine levels in samples fromthe CPP repository has been previously been described.14,15 Cytokine measurement wasobserved with high test–retest reliability, and cytokine levels measured in frozen CPPsamples selected from the repository for these investigations were similar to those observedin freshly collected serum samples. Running 40 samples in duplicate per batch, a total of 24separate assays were performed and analyzed. Each plate included 8 standards run induplicate to generate calibration curves, including a diluent-only blank and 7 serial dilutions.Samples were randomly ordered by case status and batches were organized by gestationalage at sample collection. Case samples and matched controls were analyzed in the samebatch. Because specimens had been collected previously and identifying information hadbeen removed, the Office of Human Subjects Research at the National Institutes of Healthand the institutional review board at the University of Florida determined this study wasexempt from full institutional review board review.
Statistical AnalysisInformation from the calibration series on the evaluated cytokines was used to assemble thecalibration data, which in turn was used to generate the calibration curves that model the
relation between the calculated concentration of each cytokine in picogram-per-milliliterunits and the relative fluorescence units (RFUs) produced by the assays, as quantified by theLuminex system. A total of 6 approaches for creating calibration models were evaluated.Simple linear regression models were run that disregarded the batch information, as:
(1)
where batch is i =1 to 24, y⃗cal is a vector of log10-known concentrations for the jth standard
(j=1 to 7) that are fixed across batches and with corresponding measured optical density ,the log10 -observed light intensities in RFUs for each of the standards. A batch-specificfixed-effects model was fit including a batch–biomarker interaction and can be representedas:
(2)
where the δi are the batch-specific deviations from the overall intercept β0 and the γi are thebatch-specific deviations from the overall slope β1.
Similarly 2 random effect models were evaluated. One incorporated a random intercept termb0i along with a fixed slope term. The other model included a random intercept b0i and slopeb1i; in this model, the random effects characterize the deviations of the batches from theoverall fixed effects, and have mean zero and variance B as:
(3)
Each of these approaches was also explored assuming a higher-order polynomial rather thana simple regression relationship. Quadratic models were fit with square terms to allow for acurvilinear relation between known picograms per milliliter and measured RFUs. All mixedmodels included the same number of fixed and random terms; linear mixed models includedfixed terms for intercept and slope; quadratic mixed models also considered fixed andrandom square terms.
Each of the aforementioned models was run with the known concentrations of thecalibration standards, y⃗cal, as independent (RC) and as dependent (IRC) variables. For eitherapproach, the calibration models were used to relate known concentration to observed assaymeasurements. Subsequently, calibration model estimates were used to calibrate theunknowns, that is, estimate concentration of a sample from its measured OD. For thecurvilinear models with a square term (quadratic models) with the IRC approach, we usedthe larger/positive root from the quadratic formula in calibration.
After generating each calibration model, parameter estimates were used to calibrate data forparticipant samples according to the previously described approaches. Agreement betweenmethods was evaluated graphically, and overall goodness of fit was evaluated using -2 loglikelihood and the Akaike information criterion. A case-control study analysis wasperformed to illustrate the effect of the choice of calibration approach on risk estimation.Concentration data generated by each method were used to model risk of miscarriage bylogistic regression. Odds ratios (OR) and 95% confidence intervals (CIs) were estimated foreach approach and compared.
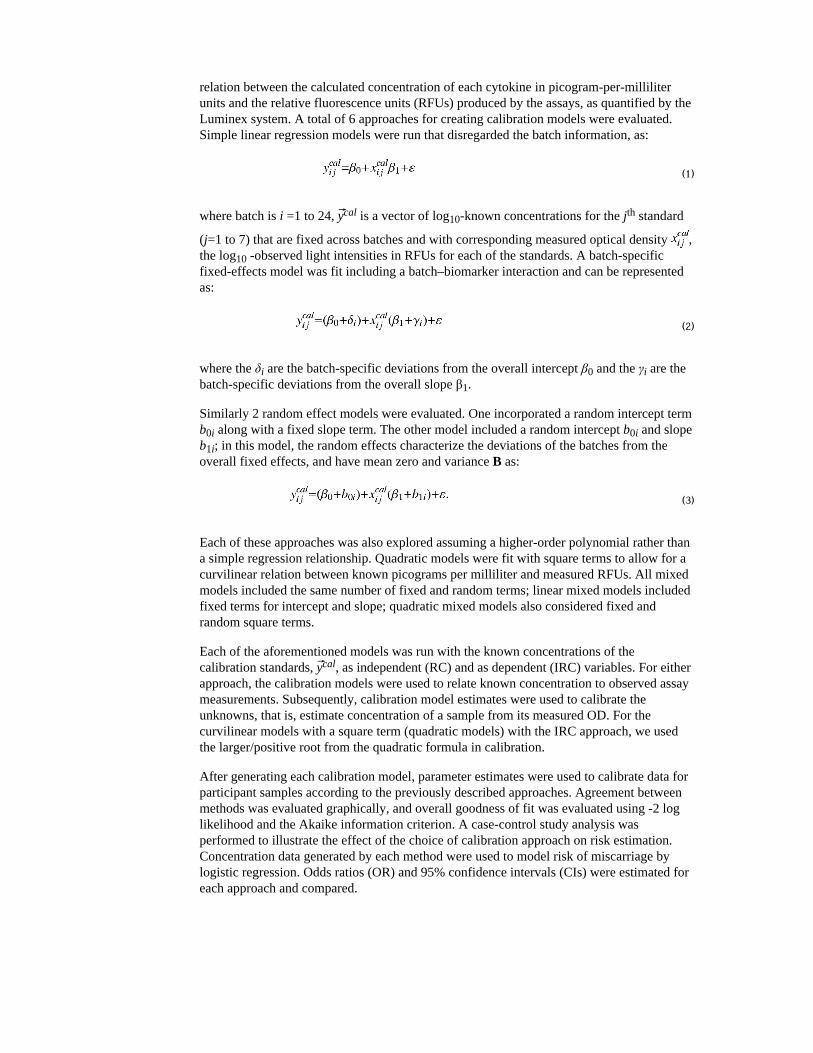
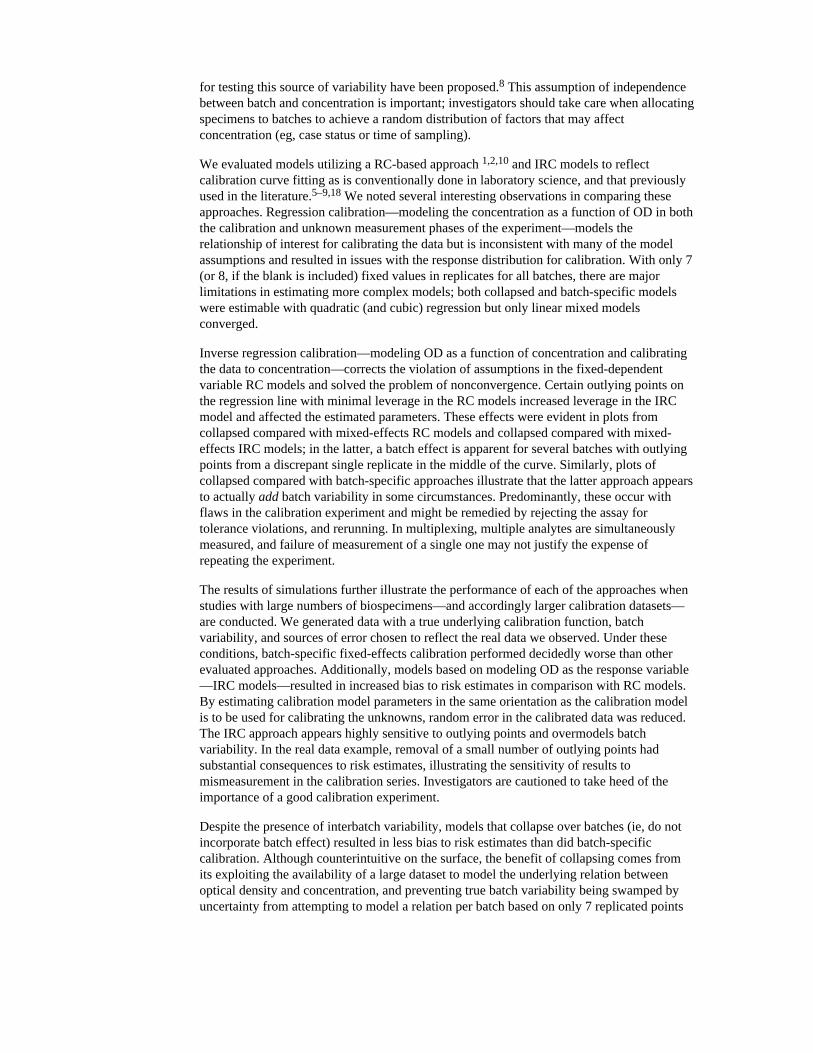
ANALYSIS RESULTSA scatter plot of the data from the calibration experiment for all 24 batches is shown inFigure 1. Log base 10 transformation of both signal and response results in an approximatelylinear relation between the variables. Several clearly visible outliers resulted from a few ofthe experiments. Specifically, 1 replicate of the fourth standard (true concentration = 222.2pg/mL) in batches 21 and 24, and 1 replicate of the most concentrated standard (trueconcentration = 6000 pg/mL) were discrepant from the majority of points within thosebatches; however, concentrations were assigned to those points, which factored into themean across replicates. Analysis was also performed after removal of the 3 outlying points,and the influence of the outliers on analysis is further discussed later.
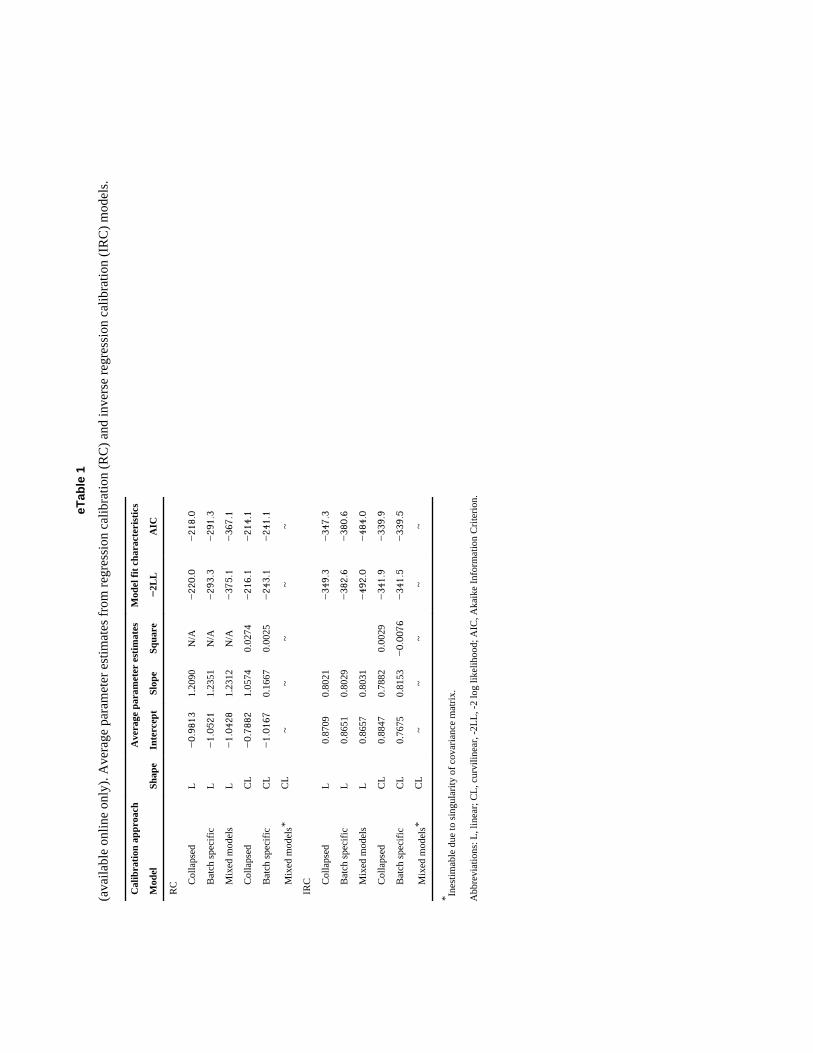
eTable 1 (available in the electronic version of this article) displays the parameter estimatesaveraged across batches for linear and quadratic calibration models, strictly for purposes ofillustration. In linear RC models, the mean of the estimates from the batch-specific (intercept= −1.05; slope = 1.24) and mixed-effects models (intercept = −1.04; slope = 1.23) weresimilar to each other and similar to the estimates from the collapsed model (intercept =−0.98; slope = 1.21). On the other hand, quadratic model parameters were observed to differbetween the collapsed (intercept = 0.79; slope = 1.06; square term = 0.13) and batch-specificmodels (intercept = −1.02; slope = 0.17; square term = 0.002). The curvilinear mixed modelwas inestimable due to a singular variance matrix for the random effects. In part, this mayhave occurred due to the minimal curvature in the calibration curves, which would result ina near-zero variance estimate for the quadratic random effect term.
Among linear IRC models, mean parameter estimates from the batch-specific fixed-effectsmodels and mixed models were approximately equal to those of the collapsed, with anintercept of 0.87 and a slope of 0.80. Differences in parameter estimates were observed forcurvilinear models, although the differences were minimal. The mixed-effects IRC modelwas estimable up to the square term as random effects. Examining different RC and IRCmodels separately, mixed models had the lowest values of the Akaike information criterion,followed by collapsed and then the batch-specific interaction model.
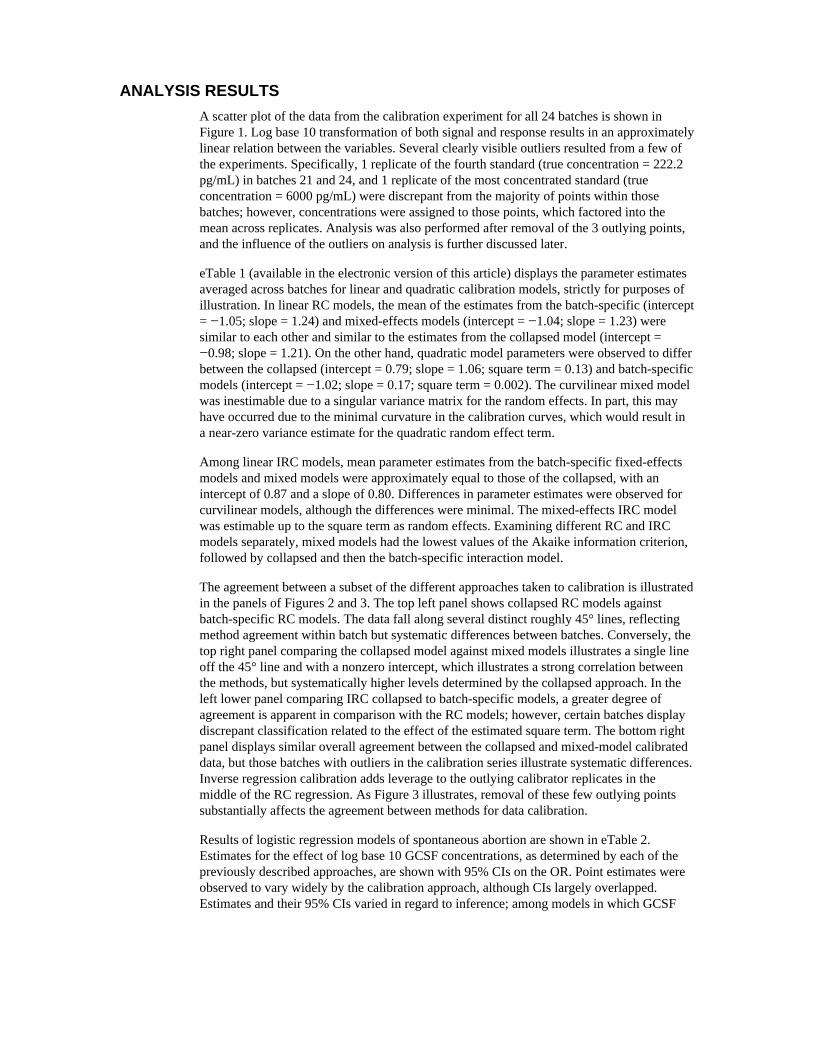
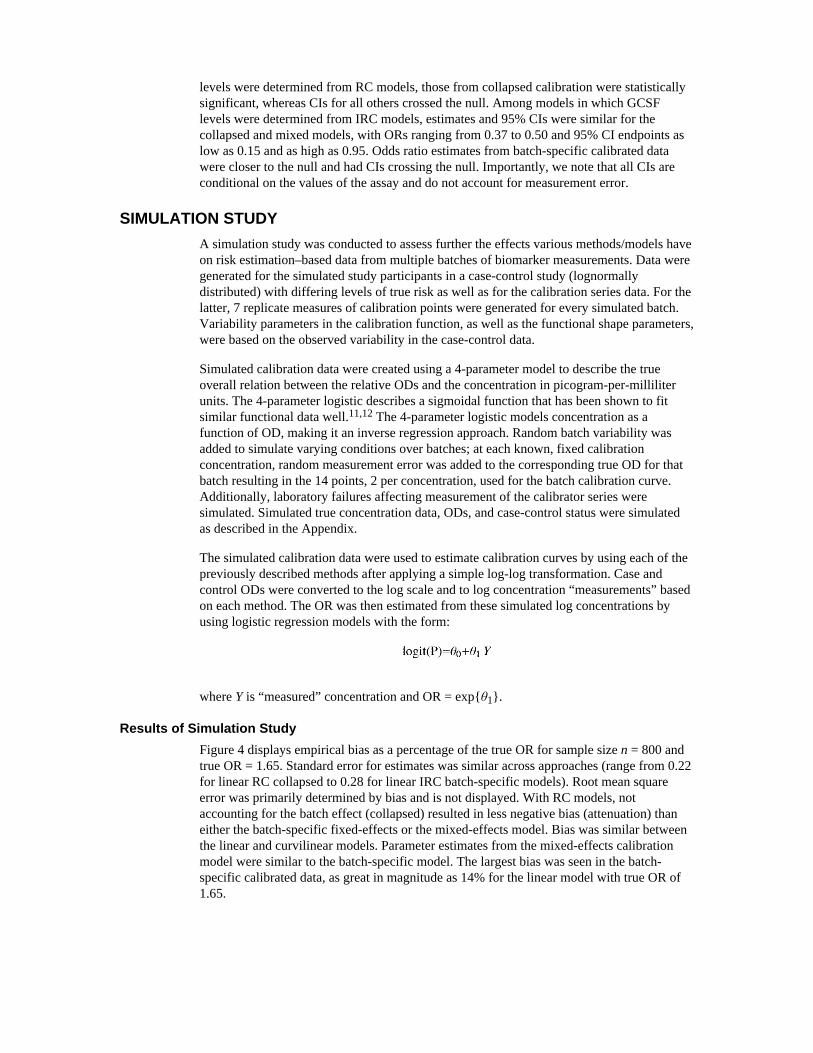
The agreement between a subset of the different approaches taken to calibration is illustratedin the panels of Figures 2 and 3. The top left panel shows collapsed RC models againstbatch-specific RC models. The data fall along several distinct roughly 45° lines, reflectingmethod agreement within batch but systematic differences between batches. Conversely, thetop right panel comparing the collapsed model against mixed models illustrates a single lineoff the 45° line and with a nonzero intercept, which illustrates a strong correlation betweenthe methods, but systematically higher levels determined by the collapsed approach. In theleft lower panel comparing IRC collapsed to batch-specific models, a greater degree ofagreement is apparent in comparison with the RC models; however, certain batches displaydiscrepant classification related to the effect of the estimated square term. The bottom rightpanel displays similar overall agreement between the collapsed and mixed-model calibrateddata, but those batches with outliers in the calibration series illustrate systematic differences.Inverse regression calibration adds leverage to the outlying calibrator replicates in themiddle of the RC regression. As Figure 3 illustrates, removal of these few outlying pointssubstantially affects the agreement between methods for data calibration.
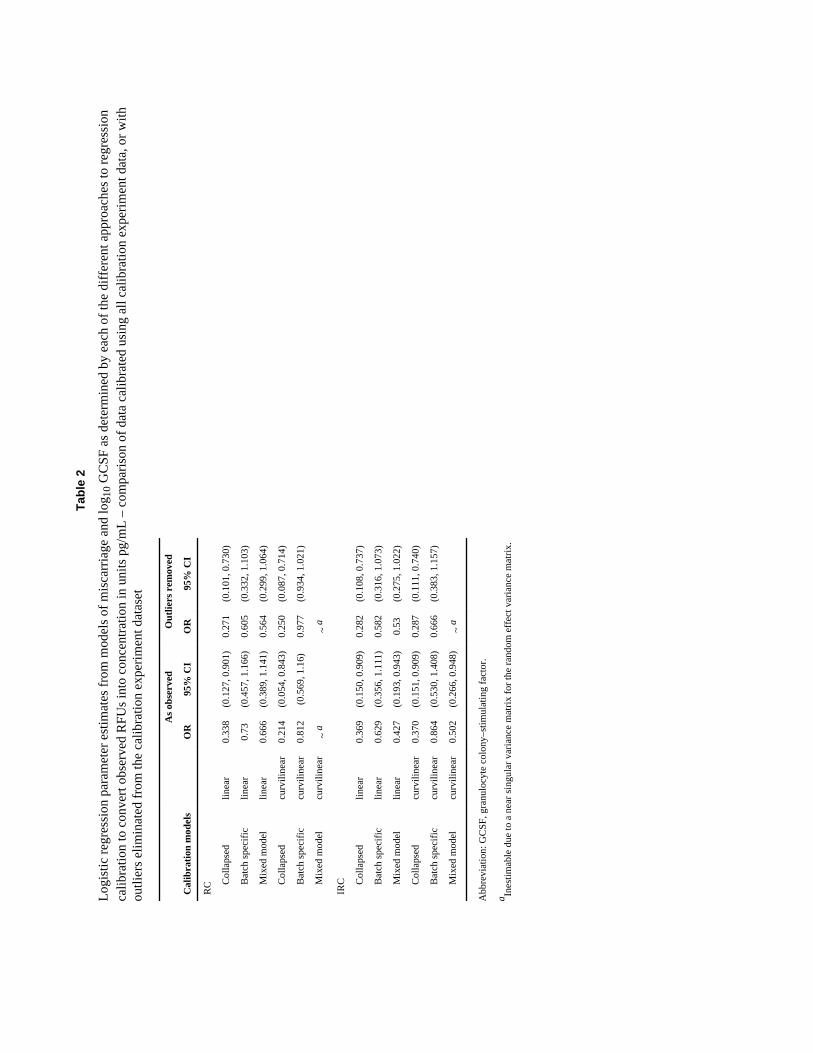
Results of logistic regression models of spontaneous abortion are shown in eTable 2.Estimates for the effect of log base 10 GCSF concentrations, as determined by each of thepreviously described approaches, are shown with 95% CIs on the OR. Point estimates wereobserved to vary widely by the calibration approach, although CIs largely overlapped.Estimates and their 95% CIs varied in regard to inference; among models in which GCSF
levels were determined from RC models, those from collapsed calibration were statisticallysignificant, whereas CIs for all others crossed the null. Among models in which GCSFlevels were determined from IRC models, estimates and 95% CIs were similar for thecollapsed and mixed models, with ORs ranging from 0.37 to 0.50 and 95% CI endpoints aslow as 0.15 and as high as 0.95. Odds ratio estimates from batch-specific calibrated datawere closer to the null and had CIs crossing the null. Importantly, we note that all CIs areconditional on the values of the assay and do not account for measurement error.
SIMULATION STUDYA simulation study was conducted to assess further the effects various methods/models haveon risk estimation–based data from multiple batches of biomarker measurements. Data weregenerated for the simulated study participants in a case-control study (lognormallydistributed) with differing levels of true risk as well as for the calibration series data. For thelatter, 7 replicate measures of calibration points were generated for every simulated batch.Variability parameters in the calibration function, as well as the functional shape parameters,were based on the observed variability in the case-control data.
Simulated calibration data were created using a 4-parameter model to describe the trueoverall relation between the relative ODs and the concentration in picogram-per-milliliterunits. The 4-parameter logistic describes a sigmoidal function that has been shown to fitsimilar functional data well.11,12 The 4-parameter logistic models concentration as afunction of OD, making it an inverse regression approach. Random batch variability wasadded to simulate varying conditions over batches; at each known, fixed calibrationconcentration, random measurement error was added to the corresponding true OD for thatbatch resulting in the 14 points, 2 per concentration, used for the batch calibration curve.Additionally, laboratory failures affecting measurement of the calibrator series weresimulated. Simulated true concentration data, ODs, and case-control status were simulatedas described in the Appendix.
The simulated calibration data were used to estimate calibration curves by using each of thepreviously described methods after applying a simple log-log transformation. Case andcontrol ODs were converted to the log scale and to log concentration “measurements” basedon each method. The OR was then estimated from these simulated log concentrations byusing logistic regression models with the form:
where Y is “measured” concentration and OR = exp{θ1}.
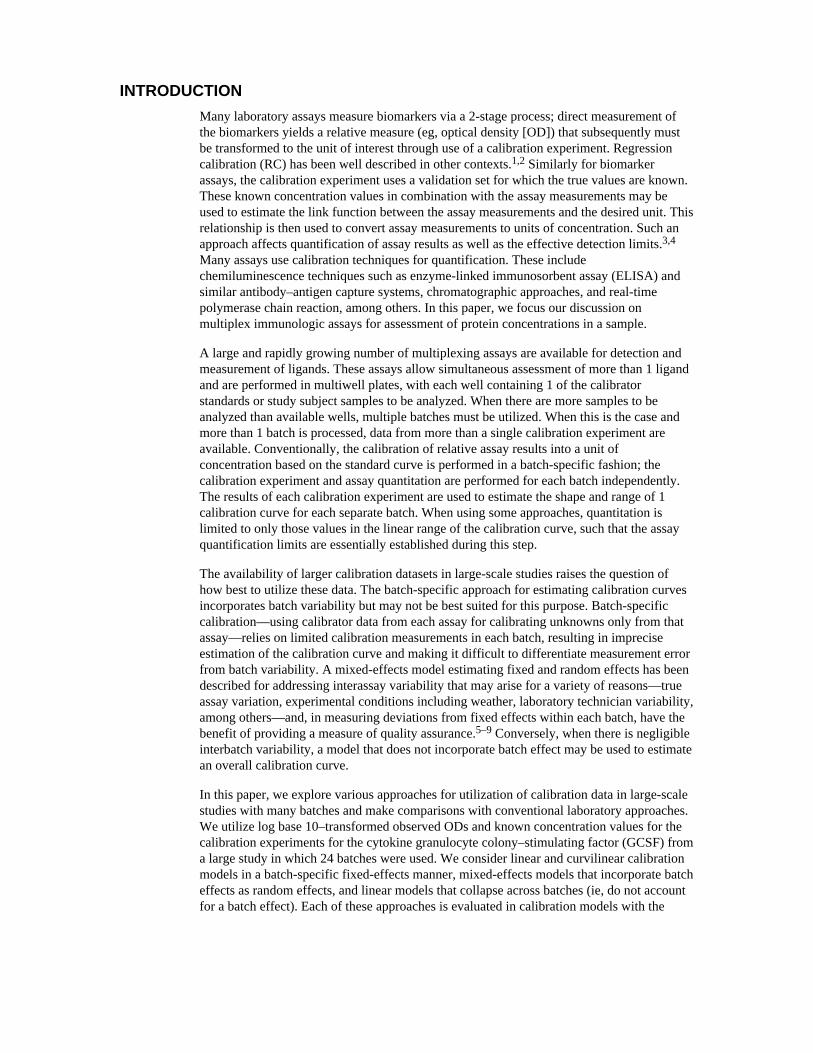
Results of Simulation StudyFigure 4 displays empirical bias as a percentage of the true OR for sample size n = 800 andtrue OR = 1.65. Standard error for estimates was similar across approaches (range from 0.22for linear RC collapsed to 0.28 for linear IRC batch-specific models). Root mean squareerror was primarily determined by bias and is not displayed. With RC models, notaccounting for the batch effect (collapsed) resulted in less negative bias (attenuation) thaneither the batch-specific fixed-effects or the mixed-effects model. Bias was similar betweenthe linear and curvilinear models. Parameter estimates from the mixed-effects calibrationmodel were similar to the batch-specific model. The largest bias was seen in the batch-specific calibrated data, as great in magnitude as 14% for the linear model with true OR of1.65.
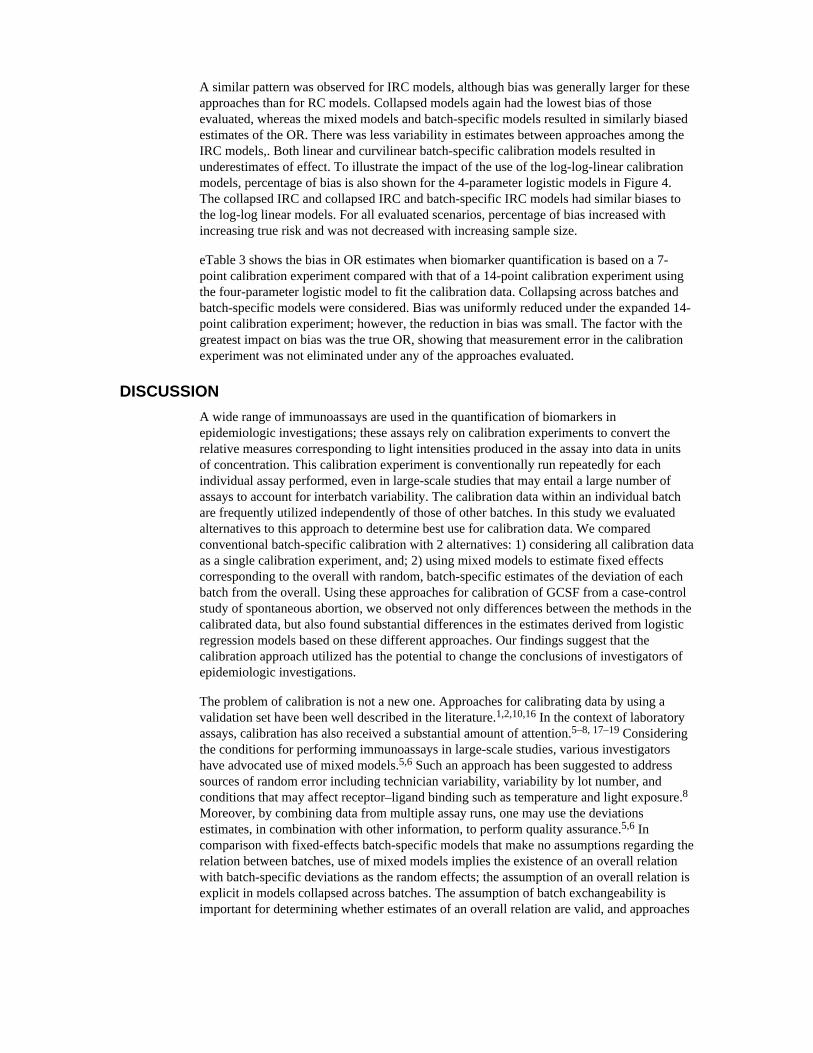
A similar pattern was observed for IRC models, although bias was generally larger for theseapproaches than for RC models. Collapsed models again had the lowest bias of thoseevaluated, whereas the mixed models and batch-specific models resulted in similarly biasedestimates of the OR. There was less variability in estimates between approaches among theIRC models,. Both linear and curvilinear batch-specific calibration models resulted inunderestimates of effect. To illustrate the impact of the use of the log-log-linear calibrationmodels, percentage of bias is also shown for the 4-parameter logistic models in Figure 4.The collapsed IRC and collapsed IRC and batch-specific IRC models had similar biases tothe log-log linear models. For all evaluated scenarios, percentage of bias increased withincreasing true risk and was not decreased with increasing sample size.
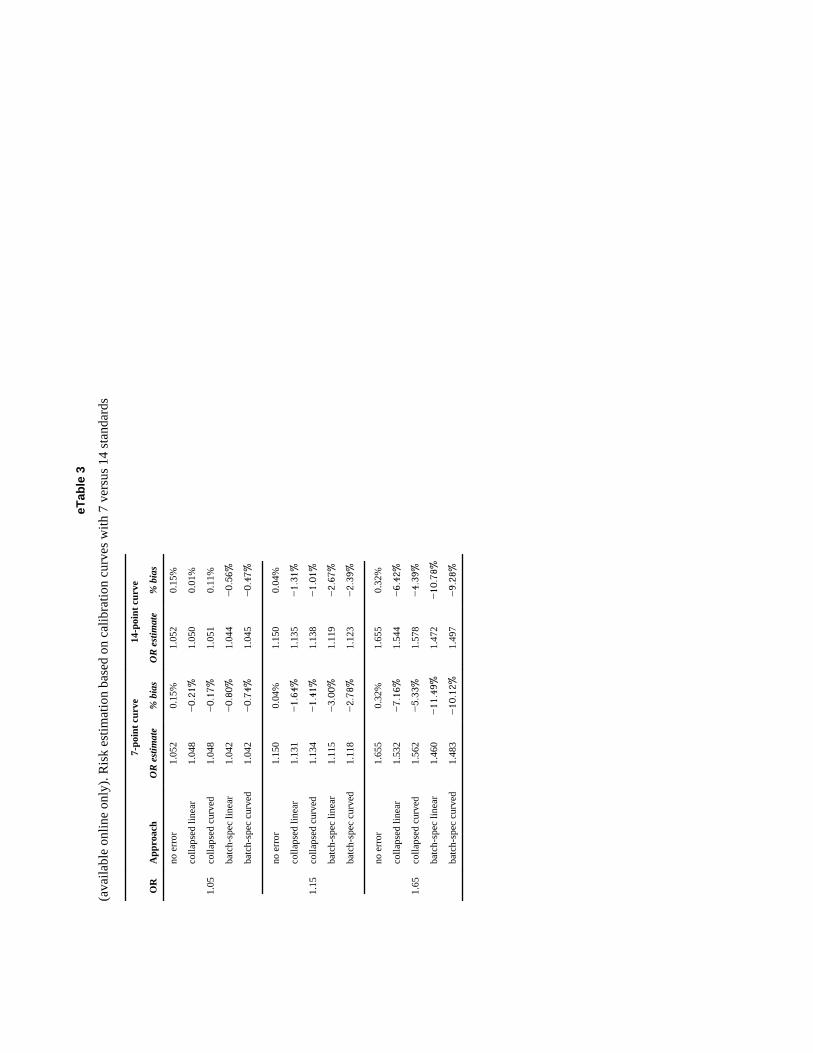
eTable 3 shows the bias in OR estimates when biomarker quantification is based on a 7-point calibration experiment compared with that of a 14-point calibration experiment usingthe four-parameter logistic model to fit the calibration data. Collapsing across batches andbatch-specific models were considered. Bias was uniformly reduced under the expanded 14-point calibration experiment; however, the reduction in bias was small. The factor with thegreatest impact on bias was the true OR, showing that measurement error in the calibrationexperiment was not eliminated under any of the approaches evaluated.
DISCUSSIONA wide range of immunoassays are used in the quantification of biomarkers inepidemiologic investigations; these assays rely on calibration experiments to convert therelative measures corresponding to light intensities produced in the assay into data in unitsof concentration. This calibration experiment is conventionally run repeatedly for eachindividual assay performed, even in large-scale studies that may entail a large number ofassays to account for interbatch variability. The calibration data within an individual batchare frequently utilized independently of those of other batches. In this study we evaluatedalternatives to this approach to determine best use for calibration data. We comparedconventional batch-specific calibration with 2 alternatives: 1) considering all calibration dataas a single calibration experiment, and; 2) using mixed models to estimate fixed effectscorresponding to the overall with random, batch-specific estimates of the deviation of eachbatch from the overall. Using these approaches for calibration of GCSF from a case-controlstudy of spontaneous abortion, we observed not only differences between the methods in thecalibrated data, but also found substantial differences in the estimates derived from logisticregression models based on these different approaches. Our findings suggest that thecalibration approach utilized has the potential to change the conclusions of investigators ofepidemiologic investigations.
The problem of calibration is not a new one. Approaches for calibrating data by using avalidation set have been well described in the literature.1,2,10,16 In the context of laboratoryassays, calibration has also received a substantial amount of attention.5–8, 17–19 Consideringthe conditions for performing immunoassays in large-scale studies, various investigatorshave advocated use of mixed models.5,6 Such an approach has been suggested to addresssources of random error including technician variability, variability by lot number, andconditions that may affect receptor–ligand binding such as temperature and light exposure.8Moreover, by combining data from multiple assay runs, one may use the deviationsestimates, in combination with other information, to perform quality assurance.5,6 Incomparison with fixed-effects batch-specific models that make no assumptions regarding therelation between batches, use of mixed models implies the existence of an overall relationwith batch-specific deviations as the random effects; the assumption of an overall relation isexplicit in models collapsed across batches. The assumption of batch exchangeability isimportant for determining whether estimates of an overall relation are valid, and approaches
for testing this source of variability have been proposed.8 This assumption of independencebetween batch and concentration is important; investigators should take care when allocatingspecimens to batches to achieve a random distribution of factors that may affectconcentration (eg, case status or time of sampling).
We evaluated models utilizing a RC-based approach 1,2,10 and IRC models to reflectcalibration curve fitting as is conventionally done in laboratory science, and that previouslyused in the literature.5–9,18 We noted several interesting observations in comparing theseapproaches. Regression calibration—modeling the concentration as a function of OD in boththe calibration and unknown measurement phases of the experiment—models therelationship of interest for calibrating the data but is inconsistent with many of the modelassumptions and resulted in issues with the response distribution for calibration. With only 7(or 8, if the blank is included) fixed values in replicates for all batches, there are majorlimitations in estimating more complex models; both collapsed and batch-specific modelswere estimable with quadratic (and cubic) regression but only linear mixed modelsconverged.
Inverse regression calibration—modeling OD as a function of concentration and calibratingthe data to concentration—corrects the violation of assumptions in the fixed-dependentvariable RC models and solved the problem of nonconvergence. Certain outlying points onthe regression line with minimal leverage in the RC models increased leverage in the IRCmodel and affected the estimated parameters. These effects were evident in plots fromcollapsed compared with mixed-effects RC models and collapsed compared with mixed-effects IRC models; in the latter, a batch effect is apparent for several batches with outlyingpoints from a discrepant single replicate in the middle of the curve. Similarly, plots ofcollapsed compared with batch-specific approaches illustrate that the latter approach appearsto actually add batch variability in some circumstances. Predominantly, these occur withflaws in the calibration experiment and might be remedied by rejecting the assay fortolerance violations, and rerunning. In multiplexing, multiple analytes are simultaneouslymeasured, and failure of measurement of a single one may not justify the expense ofrepeating the experiment.
The results of simulations further illustrate the performance of each of the approaches whenstudies with large numbers of biospecimens—and accordingly larger calibration datasets—are conducted. We generated data with a true underlying calibration function, batchvariability, and sources of error chosen to reflect the real data we observed. Under theseconditions, batch-specific fixed-effects calibration performed decidedly worse than otherevaluated approaches. Additionally, models based on modeling OD as the response variable—IRC models—resulted in increased bias to risk estimates in comparison with RC models.By estimating calibration model parameters in the same orientation as the calibration modelis to be used for calibrating the unknowns, random error in the calibrated data was reduced.The IRC approach appears highly sensitive to outlying points and overmodels batchvariability. In the real data example, removal of a small number of outlying points hadsubstantial consequences to risk estimates, illustrating the sensitivity of results tomismeasurement in the calibration series. Investigators are cautioned to take heed of theimportance of a good calibration experiment.
Despite the presence of interbatch variability, models that collapse over batches (ie, do notincorporate batch effect) resulted in less bias to risk estimates than did batch-specificcalibration. Although counterintuitive on the surface, the benefit of collapsing comes fromits exploiting the availability of a large dataset to model the underlying relation betweenoptical density and concentration, and preventing true batch variability being swamped byuncertainty from attempting to model a relation per batch based on only 7 replicated points
in each batch. Use of the collapsed model is premised on a relatively small batch-to-batchvariation across batch-specific calibration curves.
In our simulations, the estimates of association (log OR estimates) were attenuated for allcalibration methods; we evaluated the source of this systematic underestimation throughadditional simulations. We initially considered model misspecification. The 4-parametermodel was chosen to maintain the complexity displayed in the real data, whereas the linearRC models were utilized for purposes of illustration, relative simplicity, and thus increasedlikelihood of being practically employed using standard statistical software. Regardless, incomparing use of log-log models and 4-parameter models, we did not observe significantdifferences for any of the models evaluated. Rather than misspecification of the model, thesource of the underestimation appears to be related to the number of data points available forthe calibration experiment. We compared risk estimates based on data calibrated from astandard 7-point curve with those of a curve with additional dilutions and found biasreduced in the latter. The reduction in attenuation with an increased number of points on thecalibration curve may be because we do not explicitly account for the measurement errorassociated with the concentration levels. Future research could focus on incorporating thismeasurement error into the logistic regression modeling. For this paper, we have focused onthe impact of the calibration approach on risk estimation and illustration of the potentialvariability thereof. We have not described other issues that may affect calibration, such asheteroscedasticity in the calibration regressions 9,20,21 and serial dilution error.19 In additionto the issue of minimal variance in the known concentrations of the calibrator data, theproblem of serial dilution error may arise when a laboratory error in dilution is propagated insubsequent dilutions, resulting in a nonindependence among the calibrator series. Althoughthe use of micropipettes for volumetric dispensing is very precise, errors in preparation ofthe calibrator series can adversely affect calibration inference.19
A comparison of multiple approaches to calibrating data from immunoassays illustrates thatthe resulting differences may lead to important differences in conclusions of models of risk.We used a batch-specific approach that is used conventionally for laboratory sciences, alongwith alternatives including a mixed-effects model for generating concentration informationfor GCSF measured in multiplex assays to use in logistic regression models of spontaneousabortion; OR estimates for batch-specific approach ranged from 0.63 to 0.86 with all 95%CIs crossing 1.0, whereas statistically significant protective OR estimates were observed foralternatives. Simulation study results further illustrate the differences between calibrationapproaches. These observations support previous investigators who have advocated for morecomprehensive use of the data from multiple calibration experiments performed withinstudies that entail multiple assays.6,7 Investigators of epidemiologic studies that includesimilarly measured biomarkers should consider use of these data to greater advantage thanconvention. Failure to do so may contribute to failures to detect small effects inepidemiologic studies of complex disease.
AcknowledgmentsFunded by a grant from the American Chemistry Council.
References1. Rosner B, Spiegelman D, Willett WC. Correction of logistic regression relative risk estimates and
confidence intervals for random within-person measurement error. Am J Epidemiol. 1992;136:1400–1413. [PubMed: 1488967]
2. Rosner B, Spiegelman D, Willett WC. Correction of logistic regression relative risk estimates andconfidence intervals for measurement error: the case of multiple covariates measured with error.Am J Epidemiol. 1990; 132:734–745. [PubMed: 2403114]

3. Helsel, D. Nondetects and Data Analysis: Statistics for Censored Environmental Data. Hoboken, NJ:John Wiley & Sons, Inc; 2005.
4. Whitcomb BW, Schisterman EF. Assays with lower detection limits: Implications for epidemiologicinvestigation. Paediatr Perinat Epidemiol. 2008; 22:597–602. [PubMed: 19000298]
5. Liao JJ, Lewis JW. Qualifying ELISA data: combining information. J Biopharm Stat. 2000; 10:545–558. [PubMed: 11104392]
6. Liao JJ. A linear mixed-effects calibration in qualifying experiments. J Biopharm Stat. 2005; 15:3–15. [PubMed: 15702601]
7. Zeng Q, Davidian M. Calibration inference based on multiple runs of an immunoassay. Biometrics.1997; 53:1304–1317. [PubMed: 9423252]
8. Zeng Q, Davidian M. Testing homogeneity of intra-run variance parameters in immunoassay. StatMed. 1997; 16:1765–1776. [PubMed: 9265699]
9. Davidian M, Giltinan DM. Some general estimation methods for nonlinear mixed-effects models. JBiopharm Stat. 1993; 31:23–55. [PubMed: 8485535]
10. Spiegelman D, McDermott A, Rosner B. Regression calibration method for correctingmeasurement-error bias in nutritional epidemiology. Am J Clin Nutr. 1997; 65(4 Suppl):1179S–1186S. [PubMed: 9094918]
11. O’Connell MA, Belanger BA, Haaland PD. Calibration and assay development using the four-parameter logistic model. Chemometr Intell Lab Syst. 1993; 20:97–114.
12. Robinson-Cox JF. Multiple estimation of concentrations in immunoassay using logistic models. JImmunol Methods. 1995; 186:79–88. [PubMed: 7561151]
13. Hardy JB. The Collaborative Perinatal Project: lessons and legacy. Ann Epidemiol. 2003; 13:303–311. [PubMed: 12821268]
14. Whitcomb BW, Schisterman EF, Klebanoff MA, Baumgarten M, Luo X, Chegini N. Circulatinglevels of cytokines during pregnancy: thrombopoietin is elevated in miscarriage. Fertil Steril.2008; 89:1795–1802. [PubMed: 17706203]
15. Whitcomb BW, Schisterman EF, Klebanoff MA, et al. Circulating chemokine levels andmiscarriage. Am J Epidemiol. 2007; 166:323–331. [PubMed: 17504778]
16. Freedman LS, Midthune D, Carroll RJ, Kipnis V. A comparison of regression calibration, momentreconstruction and imputation for adjusting for covariate measurement error in regression. StatMed. 2008; 27:5195–216. [PubMed: 18680172]
17. Lai KK, Cook L, Krantz EM, Corey L, Jerome KR. Calibration curves for real-time PCR. ClinChem. 2005; 51:1132–1136. [PubMed: 15976098]
18. Plikaytis BD, Turner SH, Gheesling LL, Carlone GM. Comparisons of standard curve-fittingmethods to quantitate Neisseria meningitidis group A polysaccharide antibody levels by enzyme-linked immunosorbent assay. J Clin Microbiol. 1991; 29:1439–1446. [PubMed: 1909345]
19. Higgins KM, Davidian M, Chew G, Burge H. The effect of serial dilution error on calibrationinference in immunoassay. Biometrics. 1998; 54:19–32. [PubMed: 9544505]
20. Giltinan DM, Davidian M. Assays for recombinant proteins: a problem in non-linear calibration.Stat Med. 1994; 13:1165–1179. [PubMed: 8091042]
21. Guo Y, Harel O, Little RJ. How well quantified is the limit of quantification? Epidemiology.2010:xxx–xxx. (In this issue).
AppendixSimulations were conducted to assess various techniques for the utilization of calibrationdata to achieve the best estimation. For each method a calibration curve was generated.Then, using each curve, simulated ODs were converted into biomarker levels. We nextestimated ORs (for a 1-unit change in transformed data) by using the biomarker levels fromeach method and calculated bias, standard error, and root mean square error over B = 2000iterations to compare the estimators. Various parameter scenarios were investigated, OR =1.05, 1.15, and 1.65, using several sample sizes of biomarker levels n = 400, 800, and 2000,
where each batch consists of 40 measurements resulting in m =10, 20, and 50 batches,respectively.
Two phases of random data were implemented. First, n lognormally distributed “true”biomarker values, yt, were randomly generated. Next, case and control status were simulatedbased on a logistic regression model where
where Y is the biomarker concentration generated in the first stage and OR = exp{β1}.
The second phase started with a “true” overall 4-parameter logistic model
that models OD as a function of concentration. The parameters β = (0.000, 1.025, 8.841, and9.698) were based on cytokine values in the CPP dataset and used as the true underlyingcalibration curve. From here, batch variability was introduced to create m sets of “true”batch-specific curves by randomly samplingβi, i = 1,…,m, from a multivariate normaldistribution centered at the true β, parameters are drawn to establish “true” batch-specificcalibration curves. From these “true” batch-specific curves, “true” ODs, x→*t, weregenerated batch wise for the “true” biomarker measurements, yt, from step 1.
Next, 7 fixed calibrating concentrations x = (6000, 2000, 666.67, 222.22, 74.07, 24.69, and8.23) and the “true” batch-specific calibration curve were used to get corresponding ODs,
, j = 1,…,7. Random error was then added to) these ODs such that replicatevariability (measurement error) is introduced on the log scale to each of the 2 calibrationmeasurements per fixed concentration, yijk = exp{log(yij)+εijk}, where k = 1,2 and εijk ~N(0,σε = 0.25). The level of replicate error used was based on the cytokine measures in theCPP dataset and introduced through a power function as suggested by Zeng and Davidian.7
Using these replicate measures, , at fixed concentration, , each of the calibrationmodeling techniques described in the paper is applied and those estimated calibration curvesare used to convert the biomarker ODs, xt, into “measured” biomarker concentration levels,ym. Disease status along with the ym biomarker “measurements” are then used to estimateORs based on each technique. These estimators are the unit of comparison for the varioustechniques.
Figure 1.Scatter plot of the log10 calibration data from 24 batches, each with 14 data points withknown concentration and observed OD.
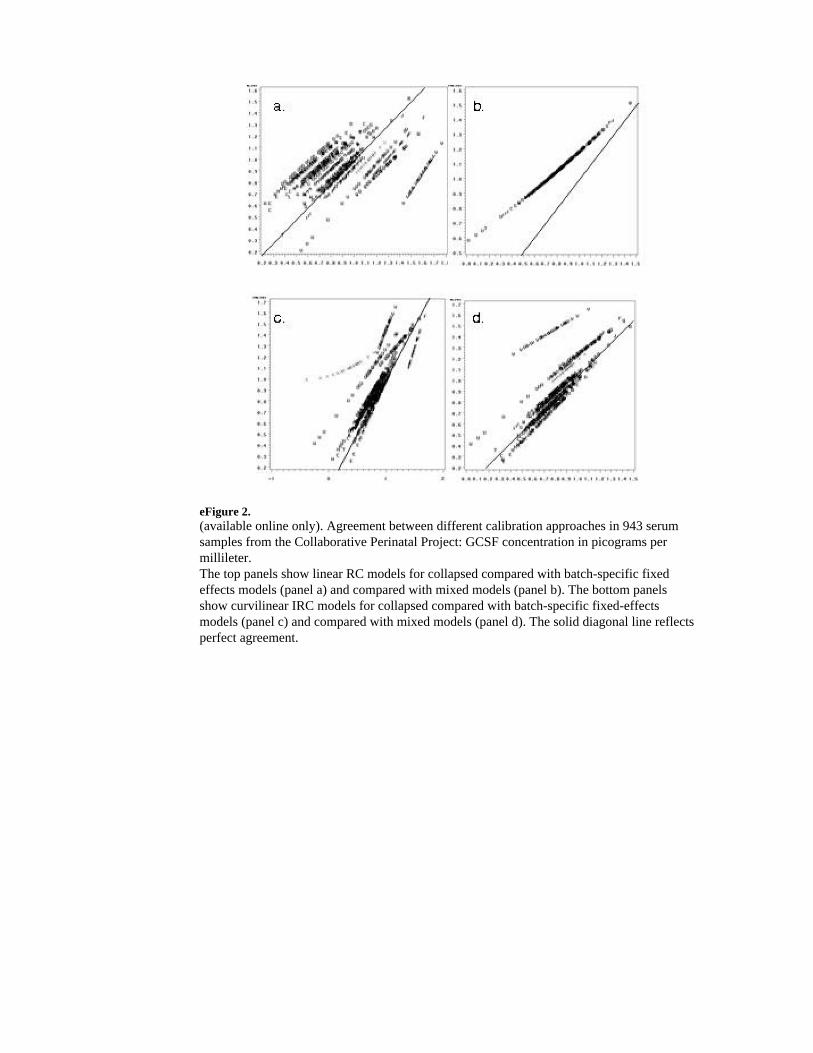
eFigure 2.(available online only). Agreement between different calibration approaches in 943 serumsamples from the Collaborative Perinatal Project: GCSF concentration in picograms permillileter.The top panels show linear RC models for collapsed compared with batch-specific fixedeffects models (panel a) and compared with mixed models (panel b). The bottom panelsshow curvilinear IRC models for collapsed compared with batch-specific fixed-effectsmodels (panel c) and compared with mixed models (panel d). The solid diagonal line reflectsperfect agreement.

eFigure 3.(available online only). Agreement between different calibration approaches in 943 serumsamples from the Collaborative Perinatal Project after elimination of three outliers from thecalibration experiment data: GCSF concentration in picograms per millileter.The top panels show linear RC linear models for collapsed compared with batch-specificfixed-effects models (panel a) and compared with mixed models (panel b). The bottompanels show IRC fit curvilinear models for collapsed compared with batch-specific fixed-effects models (panel c) and compared with mixed models (panel d). The solid diagonal linereflects perfect agreement.

Figure 4.Results of simulation study—percentage of bias by calibration modeling approach for trueOR = 1.65 and n = 800.On the left of the figure, percentages of bias to estimated ORs are shown for biomarker datacalibrated using RC log-log linear approaches—collapsed models in light gray, mixedmodels in dark gray, and batch-specific fixed-effects models in black. On the right,percentages of bias for select 4-parameter logistic (4PL) models are shown.
eTab
le 1
(ava
ilabl
e on
line
only
). A
vera
ge p
aram
eter
est
imat
es fr
om re
gres
sion
cal
ibra
tion
(RC
) and
inve
rse
regr
essi
on c
alib
ratio
n (I
RC
) mod
els.
Cal
ibra
tion
appr
oach
Ave
rage
par
amet
er e
stim
ates
Mod
el fi
t cha
ract
eris
tics
Mod
elSh
ape
Inte
rcep
tSl
ope
Squa
re−
2LL
AIC
RC C
olla
psed
L−0.9813
1.20
90N
/A−220.0
−218.0
Bat
ch sp
ecifi
cL
−1.0521
1.23
51N
/A−293.3
−291.3
Mix
ed m
odel
sL
−1.0428
1.23
12N
/A−375.1
−367.1
Col
laps
edC
L−0.7882
1.05
740.
0274
−216.1
−214.1
Bat
ch sp
ecifi
cC
L−1.0167
0.16
670.
0025
−243.1
−241.1
Mix
ed m
odel
s*C
L~
~~
~~
IRC C
olla
psed
L0.
8709
0.80
21−349.3
−347.3
Bat
ch sp
ecifi
cL
0.86
510.
8029
−382.6
−380.6
Mix
ed m
odel
sL
0.86
570.
8031
−492.0
−484.0
Col
laps
edC
L0.
8847
0.78
820.
0029
−341.9
−339.9
Bat
ch sp
ecifi
cC
L0.
7675
0.81
53−0.0076
−341.5
−339.5
Mix
ed m
odel
s*C
L~
~~
~~
* Ines
timab
le d
ue to
sing
ular
ity o
f cov
aria
nce
mat
rix.
Abb
revi
atio
ns: L
, lin
ear;
CL,
cur
vilin
ear,
-2LL
, -2
log
likel
ihoo
d; A
IC, A
kaik
e In
form
atio
n C
riter
ion.
Tabl
e 2
Logi
stic
regr
essi
on p
aram
eter
est
imat
es fr
om m
odel
s of m
isca
rria
ge a
nd lo
g 10 G
CSF
as d
eter
min
ed b
y ea
ch o
f the
diff
eren
t app
roac
hes t
o re
gres
sion
calib
ratio
n to
con
vert
obse
rved
RFU
s int
o co
ncen
tratio
n in
uni
ts p
g/m
L –
com
paris
on o
f dat
a ca
libra
ted
usin
g al
l cal
ibra
tion
expe
rimen
t dat
a, o
r with
outli
ers e
limin
ated
from
the
calib
ratio
n ex
perim
ent d
atas
et
Cal
ibra
tion
mod
els
As o
bser
ved
Out
liers
rem
oved
OR
95%
CI
OR
95%
CI
RC C
olla
psed
linea
r0.
338
(0.1
27, 0
.901
)0.
271
(0.1
01, 0
.730
)
Bat
ch sp
ecifi
clin
ear
0.73
(0.4
57, 1
.166
)0.
605
(0.3
32, 1
.103
)
Mix
ed m
odel
linea
r0.
666
(0.3
89, 1
.141
)0.
564
(0.2
99, 1
.064
)
Col
laps
edcu
rvili
near
0.21
4(0
.054
, 0.8
43)
0.25
0(0
.087
, 0.7
14)
Bat
ch sp
ecifi
ccu
rvili
near
0.81
2(0
.569
, 1.1
6)0.
977
(0.9
34, 1
.021
)
Mix
ed m
odel
curv
iline
ar~
a~
a
IRC C
olla
psed
linea
r0.
369
(0.1
50, 0
.909
)0.
282
(0.1
08, 0
.737
)
Bat
ch sp
ecifi
clin
ear
0.62
9(0
.356
, 1.1
11)
0.58
2(0
.316
, 1.0
73)
Mix
ed m
odel
linea
r0.
427
(0.1
93, 0
.943
)0.
53(0
.275
, 1.0
22)
Col
laps
edcu
rvili
near
0.37
0(0
.151
, 0.9
09)
0.28
7(0
.111
, 0.7
40)
Bat
ch sp
ecifi
ccu
rvili
near
0.86
4(0
.530
, 1.4
08)
0.66
6(0
.383
, 1.1
57)
Mix
ed m
odel
curv
iline
ar0.
502
(0.2
66, 0
.948
)~
a
Abb
revi
atio
n: G
CSF
, gra
nulo
cyte
col
ony–
stim
ulat
ing
fact
or.
a Ines
timab
le d
ue to
a n
ear s
ingu
lar v
aria
nce
mat
rix fo
r the
rand
om e
ffec
t var
ianc
e m
atrix
.
eTab
le 3
(ava
ilabl
e on
line
only
). R
isk
estim
atio
n ba
sed
on c
alib
ratio
n cu
rves
with
7 v
ersu
s 14
stan
dard
s
OR
App
roac
h
7-po
int c
urve
14-p
oint
cur
ve
OR
estim
ate
% b
ias
OR
estim
ate
% b
ias
1.05
no e
rror
1.05
20.
15%
1.05
20.
15%
colla
psed
line
ar1.
048
−0.21%
1.05
00.
01%
colla
psed
cur
ved
1.04
8−0.17%
1.05
10.
11%
batc
h-sp
ec li
near
1.04
2−0.80%
1.04
4−0.56%
batc
h-sp
ec c
urve
d1.
042
−0.74%
1.04
5−0.47%
1.15
no e
rror
1.15
00.
04%
1.15
00.
04%
colla
psed
line
ar1.
131
−1.64%
1.13
5−1.31%
colla
psed
cur
ved
1.13
4−1.41%
1.13
8−1.01%
batc
h-sp
ec li
near
1.11
5−3.00%
1.11
9−2.67%
batc
h-sp
ec c
urve
d1.
118
−2.78%
1.12
3−2.39%
1.65
no e
rror
1.65
50.
32%
1.65
50.
32%
colla
psed
line
ar1.
532
−7.16%
1.54
4−6.42%
colla
psed
cur
ved
1.56
2−5.33%
1.57
8−4.39%
batc
h-sp
ec li
near
1.46
0−11.49%
1.47
2−10.78%
batc
h-sp
ec c
urve
d1.
483
−10.12%
1.49
7−9.28%