Embed Size (px)
Citation preview
See discussions, stats, and author profiles for this publication at: https://www.researchgate.net/publication/49606674
Biomarker discovery in neurological diseases: A metabolomic approach
Article in Open Access Journal of Clinical Trials · November 2009
Source: DOAJ
CITATIONS
2READS
406
3 authors, including:
Some of the authors of this publication are also working on these related projects:
Screening for mitochondrial abnormality in relation to Autism severity View project
Diagnostic and Severity-Tracking Biomarkers for Autism Spectrum Disorder View project
Afaf El-Ansary
King Saud University
140 PUBLICATIONS 2,977 CITATIONS
SEE PROFILE
Yusra Al-Yafee
King Abdullah International Medical Research Center
22 PUBLICATIONS 207 CITATIONS
SEE PROFILE
All content following this page was uploaded by Afaf El-Ansary on 29 May 2014.
The user has requested enhancement of the downloaded file.
© 2009 El-Ansary et al, publisher and licensee Dove Medical Press Ltd. This is an Open Access article which permits unrestricted noncommercial use, provided the original work is properly cited.
Open Access Journal of Clinical Trials 2009:1 27–41
Open Access Journal of Clinical Trials
27
r E v i E w
Dovepressopen access to scientific and medical research
Open Access Full Text Article
submit your manuscript | www.dovepress.com
Dovepress
Biomarker discovery in neurological diseases: a metabolomic approach
Afaf El-Ansary Nouf Al-Afaleg Yousra Al-Yafaee
Biochemistry Department, Science College, King Saud University, riyadh, Saudi Arabia
Correspondence: A El-Ansary Biochemistry Department, Science College, King Saud University, PO Box 22452, riyadh 11495, Saudi Arabia Email [email protected]
Abstract: Biomarkers are pharmacological and physiological measurements or specific
biochemicals in the body that have a particular molecular feature that makes them useful
for measuring the progress of disease or the effects of treatment. Due to the complexity of
neurological disorders, it is very difficult to have perfect markers. Brain diseases require plenty
of markers to reflect the metabolic impairment of different brain cells. The recent introduc-
tion of the metabolomic approach helps the study of neurological diseases based on profiling
a multitude of biochemical components related to brain metabolism. This review is a trial to
elucidate the possibility to use this approach to identify plasma metabolic markers related to
neurological disorders. Previous trials using different metabolomic analyses including nuclear
magnetic resonance spectroscopy, gas chromatography combined with mass spectrometry,
liquid chromatography combined with mass spectrometry, and capillary electrophoresis will
be traced.
Keywords: metabolic biomarkers, neurological disorders. metabolome, nuclear magnetic
resonance, mass spectrometry, chromatography
IntroductionUltimately, the main goals of research on human diseases are to cure the disorders or
to increase the length and quality of life of those affected. Novel biomarker identifica-
tion in neurological disorders will facilitate the achievement of these goals. First, by
providing sensitive and selective clinical correlates for the evaluation and diagnosis
of those affected by neurological disorders. Second, by providing insights into disease
mechanisms that can be used to identify therapeutic targets and to develop efficacious
compounds to target them.
Biomarkers that will be useful for either disease prediction or treatment should
have one or more of several properties, including: (i) specific and selective association
with illness in a population; (ii) heritability; (iii) state independence and presence,
whether or not the clinical phenotype of the disease is present; (iv) co-segregation
with disease within families; and (v) presence in relatives of affected individuals at a
higher rate than in the general population.1,2
Accordingly, biomarkers have been classified as antecedent biomarkers
(identifying the risk of developing an illness), screening biomarkers (screening for
subclinical disease), diagnostic biomarkers (recognizing overt disease), staging
biomarkers (categorizing disease severity), or prognostic biomarkers (predicting
future disease course, including recurrence and response to therapy, and monitoring
Open Access Journal of Clinical Trials 2009:128
El-Ansary et al Dovepress
submit your manuscript | www.dovepress.com
Dovepress
efficacy of therapy).3–5 A naïve expectation is that single
biomarkers can capture the complex process underlying an
illness. Rather, by looking as perturbations of biochemical
networks (systems view), it becomes clear that a multipa-
rameter analysis (panel of markers or multiple metabolites)
may provide better insight into disease diagnosis, prog-
nosis, and treatment.5 By surveying for global changes in
metabolic pathways, metabolomics-based approaches are
more likely to provide a wealth of information that may be
difficult to capture by looking at only one pathway or one
biomarker.
The metabolome is the collection of small molecules
that are found within a system which basically covers a
broad range of small molecules such as glucose, cholesterol,
adenosine-5´-triphosphate, biogenic amine neurotransmit-
ters, lipid-signaling molecules, among many other classes
of compounds.6 The identities, concentrations, and fluxes
of metabolites are the final product of interactions between
gene expression, protein expression, and the cellular
environment (Figure 1). Thus, metabolomic information
complements data obtained from other fields such as
genomics, transcriptomics, and proteomics and adds a
final piece to a systematic approach to the study of disease
pathophysiology, identification of biomarkers and drug
action7–11 (Figure 1).
Biochemical markers in neurological diseasesBecause of the inherent difficulties in characterizing and
accessing neurological disorders, biomarkers that satisfy
these criteria have been difficult to identify. For the purposes
of developing disease diagnostics, peripheral tissues such
as blood, urine and saliva are easily attainable ante-mortem.
However, for discovering etiologically relevant genes,
proteins, or small molecules, the preferred biological source
is often those pathologically affected tissues that are more
difficult to attain. Many attempts at bypassing the problem
of tissue availability have used in vitro and animal models
of neurological disease. However, given the complexities of
human neurological disorders, which often contain significant
behavioral components, these models are often imperfect.12
In many cases, the complexity of the brain itself presents
a severe roadblock to identification of useful biomarkers.
In most organs (eg, liver, muscle), cells are more homog-
enous in their phenotypes, transcriptomes, proteomes, and
cellular interactions. However, in the brain, transcriptomes,
DNA
RNA
Proteins
Metabolites
Lipids
Lipidomics
Chromatography (TLC, HPLC, GC)Mass spectroscopy (ESI–Tandem MS; MALDI–TOF MS)
NMR (proton, phosphorous)
Extraction, purification,composition, quantitation
Metabolomics
Genomics
Proteomics
Sugars and otherMetabolites/toxins
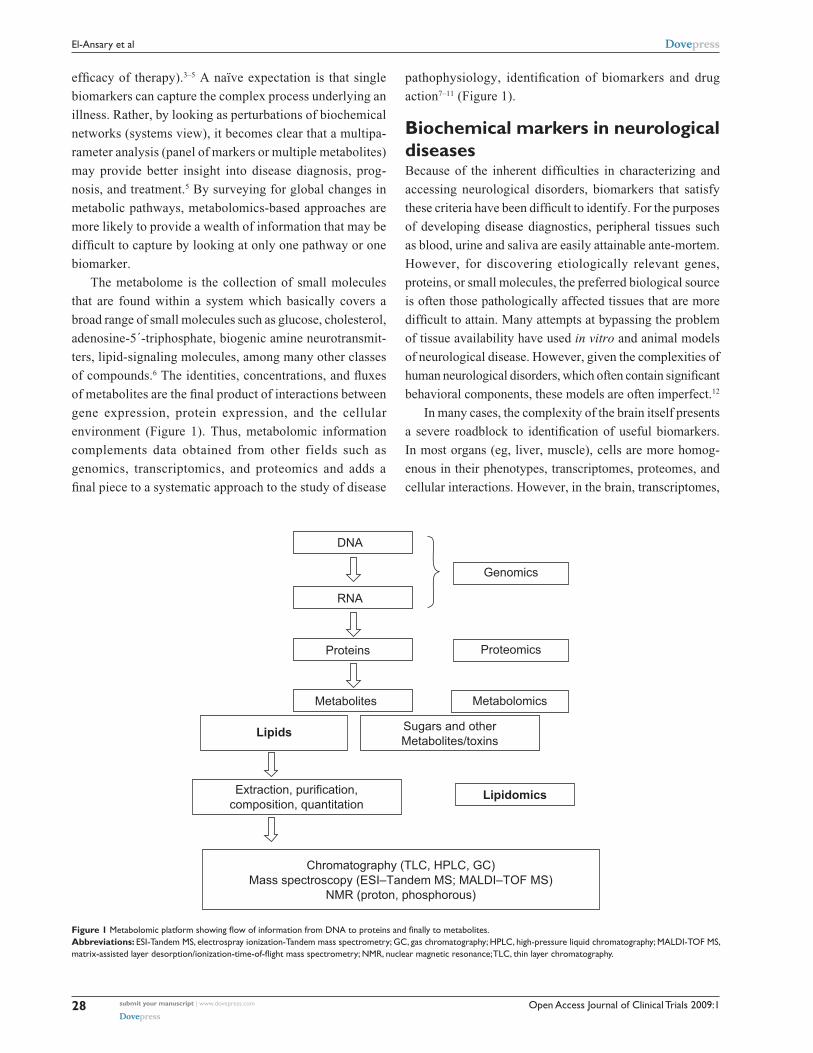
Figure 1 Metabolomic platform showing flow of information from DNA to proteins and finally to metabolites.Abbreviations: ESi-Tandem MS, electrospray ionization-Tandem mass spectrometry; GC, gas chromatography; HPLC, high-pressure liquid chromatography; MALDi-TOF MS, matrix-assisted layer desorption/ionization-time-of-flight mass spectrometry; NMR, nuclear magnetic resonance; TLC, thin layer chromatography.
Open Access Journal of Clinical Trials 2009:1 29
Biomarker discovery in neurological diseasesDovepress
submit your manuscript | www.dovepress.com
Dovepress
proteomes, morphological phenotypes, and interactive
connections vary widely within the neurons and glia.
According to the type of information that they provide,
biomarkers for neurological disorders can also be classified
as genetic, neuroimaging, clinical, or biochemical markers.13
Classical research (pre-metabolomics) on the identification
of biochemical biomarkers in blood and cerebrospinal fluid
(CSF) for neurological disorders has been aimed at assaying
single metabolites. Often this search has been based on
research hypotheses. Unfortunately, none of the single
biomarkers identified to date have the desired sensitivity and
specificity for diagnosis or have sufficient power to identify
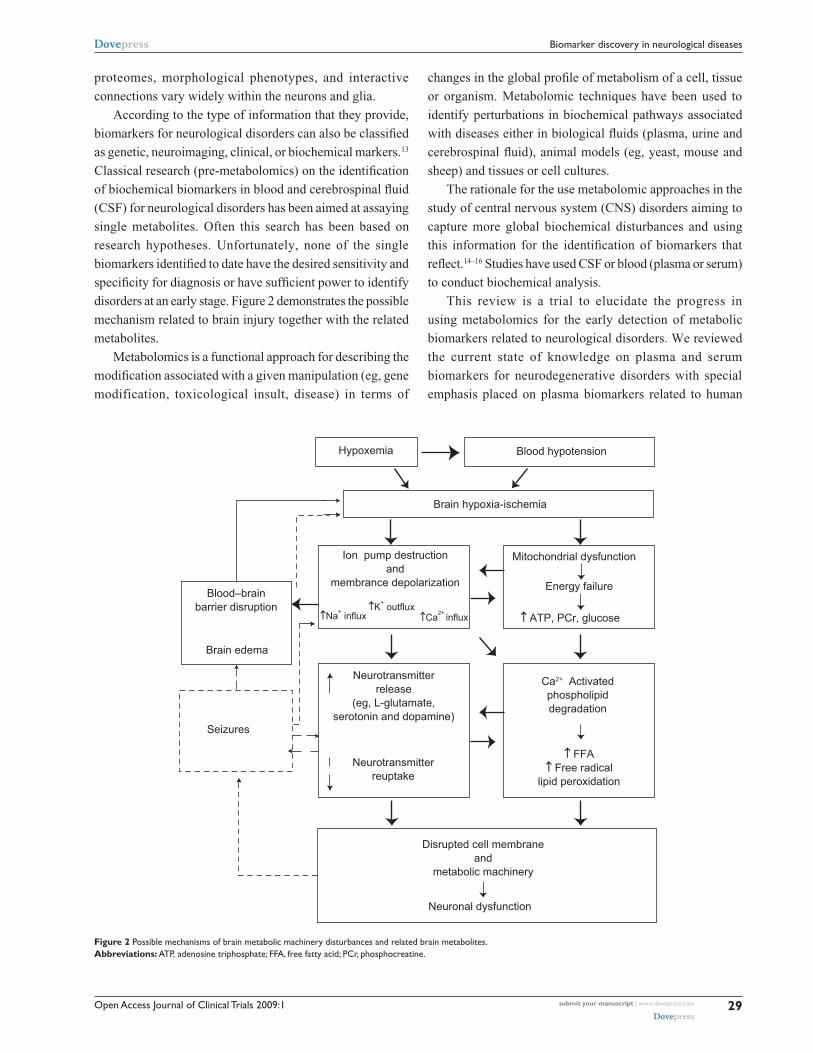
disorders at an early stage. Figure 2 demonstrates the possible
mechanism related to brain injury together with the related
metabolites.
Metabolomics is a functional approach for describing the
modification associated with a given manipulation (eg, gene
modification, toxicological insult, disease) in terms of
changes in the global profile of metabolism of a cell, tissue
or organism. Metabolomic techniques have been used to
identify perturbations in biochemical pathways associated
with diseases either in biological fluids (plasma, urine and
cerebrospinal fluid), animal models (eg, yeast, mouse and
sheep) and tissues or cell cultures.
The rationale for the use metabolomic approaches in the
study of central nervous system (CNS) disorders aiming to
capture more global biochemical disturbances and using
this information for the identification of biomarkers that
reflect.14–16 Studies have used CSF or blood (plasma or serum)
to conduct biochemical analysis.
This review is a trial to elucidate the progress in
using metabolomics for the early detection of metabolic
biomarkers related to neurological disorders. We reviewed
the current state of knowledge on plasma and serum
biomarkers for neurodegenerative disorders with special
emphasis placed on plasma biomarkers related to human
↑ FFA↑ Free radical
lipid peroxidation
↑ ATP, PCr, glucose
Mitochondrial dysfunction
Energy failure
Blood hypotension
Brain hypoxia-ischemia
↑Na+ influx↑K+ outflux
↑Ca2+ influx
Hypoxemia
Ion pump destructionand
membrance depolarizationBlood–brain
barrier disruption
Neurotransmitterreuptake
Neuronal dysfunction
Neurotransmitterrelease
(eg, L-glutamate,serotonin and dopamine)
Brain edema
Seizures
Disrupted cell membraneand
metabolic machinery
Ca2+ Activatedphospholipiddegradation
Figure 2 Possible mechanisms of brain metabolic machinery disturbances and related brain metabolites.Abbreviations: ATP, adenosine triphosphate; FFA, free fatty acid; PCr, phosphocreatine.
Open Access Journal of Clinical Trials 2009:130
El-Ansary et al Dovepress
submit your manuscript | www.dovepress.com
Dovepress
metabolism research. With the keywords, ‘neurodegenerative
diseases’ and ‘plasma’, we searched the following electronic
databases: PubMed, Medline, and PsycINFO. We sorted
articles by different research fields and core biomarkers
using the terms ‘metabolomics’, ‘amyloid beta’, ‘oxidative
stress’, ‘inflammation’, ‘homocysteine’, ‘cholesterol’, and
‘lipoprotein’. Studies were also searched through cross-
references from published reviews and original papers.
Standardization of metabolomicsThe metabolomic profile of a biological sample is affected
by several physiological factors, including age, sex, diet,
and circadian variations (Figure 1), and the related changes
in human metabolic profiles have been investigated.17,18
As an example, a study conducted on healthy subjects
adopting a strict diet and particular lifestyle showed a
relatively small intersubject and intrasubject variability.19
Another study in which no dietary restrictions were applied
found a significant degree of inter-individual variability in
urinary metabolomic profile.20 This variability is reduced if a
standard diet is followed on the day before urine collection.21
In metabolomics, more than in the other “-omic” sciences,
it is therefore crucially important to collect background
data on the individual concerned to help interpret the
results. In addition, for metabolomic experiments, it is
important to develop standard protocols regarding sample
collection and storage, chemical analyses, data processing,
and the exchange of information.22 The Metabolomics
Standard Initiative (MSI) was created, with the support of
the Metabolomic Society (www. metabolomicssociety.org),
to recommend standard protocols for use in all aspects of
metabolomic research.23 Such standardization will facilitate
the future development of applications of the metabolomic
approach.
Brain metabolites, location, and significanceMagnetic resonance spectroscopy (MRS) has been shown to
be an effective noninvasive diagnostic tool that can be used
to monitor serially biochemical and metabolic changes in
serial disease processes that affect the brain. Major brain
metabolites detected with MRS are N-acetyl aspartate (NAA),
choline (Cho), creatine (Cr), lactate, myoinositol, glutamine
and glutamate combinations, and lipids. Other resonances
observed in specific settings have included alanine, cytosolic
and noncytosolic amino acids, scylloinositol, acetoacetate,
acetone, and ethanol.
N-acetyle aspartyl glutamate and N-acetylaspartateN-acetyl aspartyl glutamate (NAAG), a putative neurotrans-
mitter or neuromodulator and NAA are accepted as neuronal
markers.24 As such, their concentrations will decrease with
many insults to the brain.25 A decrease in NAA has been
shown in infants relative to adults; with senescence;26 in
many diseases including neoplasm, hypoxia, ischemia,
epilepsy, and so forth. Glutamate and N-acetylaspartate-
glutamate are colocalized with NAA in neurons. NAA is
synthesized from L-aspartate and acetyl-co-enzyme A by
L-aspartate N-acetyl transferase, an enzyme localized to the
brain, and also through cleavage of NAAG. Breakdown of
NAAG releases both NAA and glutamate, and subsequent
breakdown of NAA leads to aspartate. These compounds are
excitatory amino acids and are increased with ischemia. It is
possible that concentrations of NAAG and glutamate may
serve to monitor treatments assigned to protect brain tissues
by blocking excitatory amino acids. NAA is not present in
tumors outside the central nervous system. A congenital
error in NAA metabolism has been associated with Canavans
disease, giving rise to an increase in NAA levels.27
CholineCholine is not synthesized in the brain, hence, it is absorbed
from the plasma as free choline or as phoshphatidyl choline
produced by the liver. Cellular density, free choline, phos-
phocholine, and glycerophosphocholine are the strongest
determinants of 1H MRS choline peak. Choline is a
constituent of phospholipid metabolism of cell membranes
and reflects membrane turnover.25 Choline is involved in the
synthesis of neurotransmitter acetylcholine and phospho-
lipids. Increased choline probably reflects increased mem-
brane synthesis and/or increased number of cells.
CreatineCr peak at 3.03 ppm using MRS contains contributions
from Cr, Cr phosphate, and, to a lesser degree, from amino
butyric acid, lysine, and glutathione. An additional peak for
Cr may be visible at 3.94 ppm. Therefore, the Cr peak is
sometimes referred to as total Cr. Cr probably plays a role
in maintaining energy-dependent systems in brain cells by
serving as a reserve for high-energy phosphates and as a
buffer in adenosine triphosphate (ATP) and adenosine diphos-
phate (ADP) reservoir.25 Cr also functions as an osmolyte
responding to osmotic (Donnan) forces. Thus, Cr is increased
in hypermetabolic and hyperosmolar states and decreased in
hypometabolic and hypoosmolar states. Total Cr present in Cr
Open Access Journal of Clinical Trials 2009:1 31
Biomarker discovery in neurological diseasesDovepress
submit your manuscript | www.dovepress.com
Dovepress
and phosphocreatine MRS resonance changes to maintain
osmotic equilibrium,28 in normal spectra, Cr is located to
the immediate fight of Cho and is the third-highest peak.
This peak appears to be tightly controlled under physiologic
conditions, suggesting a possible role as a fixed internal
reference for metabolite amplitude or area.
LactateLactate MRS peak consists of two distinct resonant peaks
called a doublet, and is caused by magnetic field interactions
between adjacent protons (J coupling). Lactate doublet occurs
at 1.32 ppm and second peak occurs at 4.1 ppm. Normally,
lactate levels in the brain are low. The presence of lactate
generally indicates that the normal cellular oxidative respira-
tion mechanism is no longer in effect, and that carbohydrate
catabolism is taking place. Lactate can play as a neuromodu-
lator by altering the excitability of local neurons.29
Glutamate and glutamineGlutamate, an excitatory neurotransmitter, is the most
abundant of the amino acids in the brain. It plays a role in
the mitochondrial metabolism.30 Glutamine is a metabolite of
glutamate. These two metabolites resonate closely together
and are represented by their sum as peaks located between
2.1 and 2.5 ppm. Glutamate metabolism is particularly
important in detoxification and excitatory neurotransmission.
A disturbance of the normal glutamate/glutamine regulatory
metabolism (excitotoxicity hypothesis) has been suggested
to be present in various neurologic disorders such as cerebral
stroke, prolonged seizures, neurodegenerative disorders,
hypoglycemia, and mitochondrial encephalopathy.
MyoinositolMyoinositol is a metabolite involved in hormone sensitive
neuroreception and is a possible precursor of glucuronic
acid, which detoxifies xenobiotics by conjugation.30 The
myoinositol peaks occur at 3.56 ppm. Myoinositol has been
suggested as a possible degradation product of myelin and
a marker of glial cells.31 In addition, a triphosphorylated
derivative of myoinositol, myoinositol-l, 4, 5-triphosphate,
is believed to act as a second messenger of intracellular
calcium-mobilizing hormones. Myoinositol has been found
to be increased in patients with Alzheimer’s disease (AD)32
or hepatic encephalopathy.33
LipidsMembrane lipids in the brain have very short relaxation
times and are normally not observed unless very short TEs
are used. The protons associated with lipids produce peaks
at 0.8, 1.2, 1.5, and 6 ppm. These peaks comprise methyl,
methylene, allelic, and the vinyl protons of unsaturated fatty
acids.34 These metabolites may be increased in high-grade
astrocytomas and meningiomas and may reflect necrotic
processes.35
Plasma-circulating metabolites and their clinical significanceBiomarkers in body fluids such as CSF, plasma, and serum
could be utilized to increase the accuracy of diagnosis for
cognitive decline and prediction of mild cognitive impair-
ment (MCI) progression. CSF presents a good resource for
research into neurodegenerative diseases, but its clinical
application is limited by the invasive nature of the procedure,
particularly in elderly populations, and the requirement of
highly trained personnel, making it unsuitable for routine
application.
Plasma is a complex body fluid containing proteins,
peptides, lipids and metabolites that reflect physiological
activity and pathology in various body organs, including the
CNS. In humans about 500 ml of CSF is absorbed into blood
daily,36 making blood a suitable source of neurodegenerative
disease biomarkers. The ease of a venepuncture compared
to a lumbar puncture allows for repeatability, making it
suitable for application in clinical trials to evaluate disease-
modifying treatments. Blood tests for diabetes, cholesterol
levels, and apolipoprotein E genotyping are already available
to clinicians for assessment of AD risk factors.
According to the current consensus criteria proposed by
the National Institute on Aging (NIA),37,38 ideal biomarkers for
AD should: 1) detect the fundamental CNS pathophysiology
of AD and be validated in neuropathologically confirmed
cases, 2) should have a diagnostic sensitivity 85% for
detecting AD and a specificity 75% for distinguishing
between other dementias, 3) should detect any beneficial
effects of disease-modifying therapy, 4) should be reliable,
reproducible, noninvasive, simple, and inexpensive, and 5) be
confirmed by at least two independent studies conducted by
qualified investigators with the results published in peer-
reviewed journals. Key features of a biomarker include its
ability to detect disease processes at early and preferably
preclinical stages of the disease and variation with disease
progression and severity.
Biomarkers of oxidative stressThere are two hypotheses relating peripheral oxidative stress
to neurodegeneration. The first suggests that oxidative stress
Open Access Journal of Clinical Trials 2009:132
El-Ansary et al Dovepress
submit your manuscript | www.dovepress.com
Dovepress
initially develops in the periphery with a variety of possible
causes, and results in reduction of CNS antioxidants, finally
leading to oxidative damage and neurodegeneration.39 The
second is that the CNS is the original place where oxidative
stress begins, and then several different metabolic end-
products are formed and transported into the periphery.39
Lipid peroxidation (malondialdehyde, 4-hydroxynonenal,
F2-idoprostanes), protein carbonyls (protein carbonyls
and nitrotyrosine) and DNA oxidation (8-hydroxy-
2-deoxyguanosine, single-strand breaks) in the AD brain
have been reported as markers of oxidative damage.40
However, oxidative DNA damage is not an effective diag-
nostic biomarker for AD patients.39 Results of proteomics
studies provide evidence that oxidized proteins in plasma
may be useful biomarkers in MCI and AD. Using ELISA
based studies, levels of protein carbonyls in AD patients were
found to be lower in serum but not in CSF and plasma, and
levels of nitrotyrosine did not differ between AD patients
and controls.41
Isoprostane is one of the products of lipid peroxidation,
formed by free radical-mediated peroxidation of polyunsatu-
rated fatty acid.42 Although isoprostane is not neurotoxic,
elevated levels of F2-isoprostane (F2-IsoP) have been
observed in AD CSF and brain.43,44 In a longitudinal study,
levels of CSF F2-IsoPs in AD patients were significantly
increased during the follow-up period, and also significantly
declined in patients accepting antioxidant treatment.45 The
significance of F2-isoprostane in AD and MCI plasma is still
controversial. Pratico and colleagues found high levels of
F2-IsoP in plasma, CSF, and urine of MCI patients,46 and the
same research group showed similar results in AD patients.44
In a recent study, mean plasma F2-IsoP levels were not
increased in AD or MCI, but a high percentage of antioxidant
use in MCI (74%) and AD (88%) in this research may have
influenced the F2-IsoP concentrations in plasma.47
Biomarkers of inflammationIt has been established that molecules representing inflam-
matory processes occur in the AD brain40,48 and the presence
of activated microglia and astrocytes increases the level of
pro-inflammatory cytokines, including interleukin-1 (IL-1),
interleukin-6 (IL-6), tumor necrosis factor α (TNF-α),
as well as acute phase proteins, such as C-reactive protein
(CRP) and α1-antichymotrypsin (ACT).48,49
There is experimental as well as clinical evidence to
support the hypothesis that inflammatory processes might
be involved in the early stages of AD, even before amyloid
deposition or the appearance of clinical symptoms.50–52
However, the results on inflammatory markers in the
peripheral circulations of AD and MCI patients are
controversial. Several longitudinal studies have shown that
inflammatory markers in serum or plasma are related to
cognitive decline. High serum ACT was associated with an
increased risk of cognitive decline.53 High-sensitivity CRP
significantly increased risk of combined dementias, AD, and
vascular dementia.54 Serum IL-6 and CRP were prospectively
related to cognitive decline in well functioning elders.55 High
levels of ACT, IL-6, and CRP in plasma were associated
with an increased risk of AD respectively.50 A recent study
used ELISA to measure 120 known signaling proteins
involved in central and peripheral immune and inflammatory
mechanisms in plasma from AD subjects and nondemented
controls.56
Connecting neurological clinical presentation with plasma changesThe identification of peripheral metabolomic signatures of
neurological illnesses is likely to have more potential for
translation into the clinical realm. Importantly it is critical
in future studies to verify that there are disease related
signatures, that may be subrogates of changes in the brain,
and hence could provide clinical information and clues about
disease pathogenesis.57 On the other hand, there is a limited
amount of research correlating findings seen peripherally
and centrally (brain tissue or CSF). However, an obvious
challenge to conducting metabolomic studies linking
peripheral and central is the limited access to brain tissue.
CSF can be collected following a lumbar puncture, and
despite that this fluid is commonly used as a proxy for brain
changes in CNS disorders,58 the need for special training
for collection and the risk associated to the procedure, have
limited the amount of studies conducted using this resource.
Nevertheless, some evidence seems to suggest that central
CSF changes in potential biomarkers might be correlated
with changes in the periphery (blood; plasma or serum). For
instance measurement of inflammatory markers in paired
plasma/CSF samples of healthy human volunteers revealed
a correlation between central and peripheral levels.59 This
also seems to be the case for some metabolites. Plasma-
free tryptophan is clearly correlated with brain tryptophan
concentration. Indeed, it has been suggested that plasma-
free tryptophan concentration provides an index of CSF
tryptophan and 5-HT turnover in the brain.60 Likewise, CSF
and serum/plasma concentrations of vitamin biomarkers
are significantly correlated. Strikingly, the correlation
between serum and CSF-folate can be as high 0.69.61
Open Access Journal of Clinical Trials 2009:1 33
Biomarker discovery in neurological diseasesDovepress
submit your manuscript | www.dovepress.com
Dovepress
Another example is the levels of the side chain oxidized
oxysterol 24S-hydroxycholesterol, a potential maker of
brain injury, which forms almost exclusively in the brain and
whose levels in plasma and CSF are highly correlated.62
Nonetheless, limited amount of evidence also suggests
that abnormalities in the blood level of certain metabo-
lites (plasma or serum) might not be correlated with
central abnormalities.64 Thus, additional research using
metabolomics-based approaches is needed to define metabo-
lites whose central and peripheral levels are linked and how
these correlations are influence by neurological illnesses.
Comparative studies in CSF (or postmortem brain tissue
itself ) and blood could help map central and peripheral
changes in neurodegenerative disorders, enabling a more
accessible way for biomarker development in blood but
ensuring that these peripheral biomarkers are reflective of
central changes. Indeed, the process of linking the meta-
bolic profiles defined on blood and specimens derived from
invasive sampling (eg, CSF) is critical to identify ‘bridging
biomarkers’ of disease, as well as both efficacy and toxicity
medication.
Metabolomic signatures in neurological disordersQuinones and Daouk were able to identify a distinctive
signature of highly correlated metabolites in a set of four
patients, three of whom had lower motor neuron (LMN)
disease. Furthermore, they defined a metabolic signature
that was independent of the drug riluzole (illness-related)
by profiling patients who were off medication.64 Collectively,
these results suggest that metabolomic studies can be used
to ascertain metabolic signatures of disease using easily
accessible samples like plasma.
A recent study by Bogdanov and colleagues65 conducted
interesting work defining metabolomic signatures in
Parkinson’s disease (PD). They included 25 controls and
66 PD patients and used liquid chromatography followed
by electrochemical detection (LCECA) to create a database
representing 2,000 signals from plasma samples. Multivariate
data analysis revealed separation of the metabolomic profile
of medicated and unmedicated patients and controls. Markers
of oxidative damage and the antioxidant glutathione were
significantly increased in PD patients. Uric acid levels were
significantly decreased. Interestingly, alike glutathione,
uric acid is also an antioxidant and higher uric acid levels
lower risk for PD and slow the progression of the illness.
Another neuropsychiatric disorder in which metabolomic
studies have been performed is Huntington’s disease (HD).
In an interesting cross-species study, serum samples from a
transgenic mouse model of HD and patients with HD were
studied using gas chromatography-time-of-flight-mass
spectrometry.66 The investigators observed clear differences
in metabolic profiles between transgenic mice and wild-type
littermates (healthy mice), with a trend for similar differ-
ences in human patients and controls.66 Potential markers
were related to fatty acid breakdown (including glycerol and
malonate) and also to certain aliphatic amino acids. Taken
together, the findings of this study suggest the interesting
possibility that the metabolites responsible for distinguishing
transgenic mice also comprised a metabolic signature
tentatively associated with the human disease. Results from
another murine model of HD have also highlighted the
usefulness of metabolomics to study disease pathogenesis
and identify potential biomarkers.67
Metabolomic analysis of blood plasma was performed
on nine depressed, 11 remitted, and 10 never-depressed older
adults.68 Hundreds of metabolites were measured using
GC–MS. Metabolites that were altered in currently depressed
patients when compared with controls included several fatty
acids, glycerol and gamma-aminobutyric acid (GABA).
Analyses comparing concentrations in remitted and currently
depressed patients revealed a pattern of metabolite altera-
tions similar to the control vs. currently depressed analyses.
One difference observed in the remitted patients relative to
the depressed patients was elevation of the concentration of
the ketone 3hydroxybutanoic acid.
Moreover, major changes were noted in two phospholipids
classes, phosphotidylethanolamine (PE) and phosphotidyl-
choline (PC), suggesting that phospholipids that play a key
role in proper membrane structure and function seem to
be impaired in patients with schizophrenia.57,69
The metabolic profile of children diagnosed with autistic
disorder with regressive onset was found to be severely
abnormal.70 The autistic children were found to have signifi-
cant decreases in methionine levels and in the ratio of plasma
S-adenosylmethionine (SAM) to S-adenosylhomocysteine
(SAM/SAH ratio), an index of methylation capacity. Total
glutathione (GSH, the major intracellular antioxidant) levels
were decreased and oxidized glutathione disulfide (GSSG)
was increased, resulting in a threefold reduction in the
redox ratio of reduced (active) GSH to oxidized (inactive)
glutathione (GSH/GSSG). Cysteine, the rate-limiting amino
acid for glutathione synthesis, was significantly decreased
relative to the control children suggesting that GSH synthesis
was insufficient to maintain redox homeostasis. This profile
was ascertained recently by Al-Gadani and colleagues,71
Open Access Journal of Clinical Trials 2009:134
El-Ansary et al Dovepress
submit your manuscript | www.dovepress.com
Dovepress
in a study of oxidative stress and antioxidant status of Saudi
autistic children. They recorded a significant decrease in
glutathione concentration in autistic compared to control.
Recorded impaired metabolites related to neurological
diseases are listed in Table 1.
Sensitivity and specificity of biochemical markers of neurological diseasesWith the move toward development of disease-modifying
treatments, there is a need for more specific diagnosis of
neurological diseases. The diagnostic accuracy of a biomarker
is most commonly measured by calculating its sensitivity
and specificity. Sensitivity is the proportion of patients who
are correctly categorized as having disease among those
who truly have the disease. Similarly, specificity is the
proportion of patients who are correctly categorized as not
having the disease among all patients who truly don’t have
the disease. Since most diagnostic biomarkers provide results
in the continuous scale, the sensitivity and specificity of the
metabolite depends on the specific threshold selected.102
Receiver-operating characteristic (ROC) curve analysis
is a useful tool in assessment of biomarker accuracy. Its
advantages include testing accuracy across the entire range
of scores and thereby not requiring a predetermined cut-off
point, in addition to easily examined visual and statistical
comparisons across tests or scores, and, finally, independence
from outcome prevalence. Further, ROC curve analysis is a
useful tool for evaluating the accuracy of a statistical model
that classifies subjects into one of two categories. Diagnostic
models are different from predictive and prognostic models
in that the latter incorporate time-to-event analysis, for
which censored data may pose a weakness of the model, or
the reference standard. However, with the appropriate use of
ROC curves, investigators of biomarkers can improve their
research and presentation of results.103
Plasma and serum biochemical markers proposed
for AD are based on pathophysiologic processes such as
amyloid plaque formation (amyloid β-protein [Aβ], Aβ
autoantibodies, platelet amyloid precursor protein [APP]
isoforms, inflammation [cytokines], oxidative stress
[vitamin E, isoprostanes], lipid metabolism [apolipopro-
tein E, 24S-hydroxycholesterol], and vascular disease
[homocysteine, lipoprotein (a)]).104 Most proteins or
metabolites evaluated in plasma or serum thus far are, at
best, biological correlates of AD: levels are statistically
different in AD versus controls in some cohorts, but they
lack sensitivity or specificity for diagnosis or for tracking
response to therapy. Recently, quantitative analysis revealed
an increased concentration in five plasma proteins in MCI
and AD patients compared to healthy subjects: epidermal
growth factor (EGF), glial cell-derived neurotrophic factor
(GDNF) and MIP1δ (in AD), MIP4 (in MCI), and RANTES
(in MCI and AD). ROC analysis predicted a sensitivity of
65%–75% and a specificity of 52%–63% when comparing
healthy controls versus MCI or AD. Depression without any
significant cognitive deficits did not cause any significant
changes. Depressed patients with significant cognitive
impairment were not different from MCI patients.106
Approaches combining panels of existing biomarkers or
surveying the range of proteins in plasma (proteomics)
show promise for discovering biomarker profiles that are
characteristic of AD, yet distinct from nondemented patients
or patients with other forms of dementia.
Plasma markers for stroke could be useful in diagnosis
and prognosis and in prediction of response of stroke patients
to therapy. PARK7 and nucleoside diphosphate kinase A
(NDKA) are increased in human postmortem CSF, a model
of global brain insult, suggesting that measurement in CSF
and, more importantly, in plasma may be useful as a bio-
marker of stroke. Increases in both biomarkers were highly
significant, with sensitivities of 54%–91% for PARK7 and
70%–90% for NDKA and specificities of 80%–97% for
PARK7 and 90%–97% for NDKA. The concentrations of
both biomarkers increased within three hours of stroke
onset.106
Receiver operating characteristic curves were constructed,
showing test sensitivities at given specificities for PD.
Myocardial 6-[18F]fluorodopamine-derived radioactivity
distinguished PD from multiple system atrophy (MSA;
83% sensitivity at 80% specificity, 100% sensitivity,
respectively).107
Overview of metabolomic methodologyFor metabolomic analyses, the analytical technique must
therefore be really suitable for a diverse range of small endog-
enous metabolites in various concentrations. Furthermore,
it must be able to separate compounds with different physical
and chemical properties, and be very reliable. Currently, most
metabolomic analyses are performed with nuclear magnetic
resonance spectroscopy (NMR), gas chromatography
combined with mass spectrometry (GC-MS), liquid chro-
matography combined with MS (LC-MS), and capillary
electrophoresis.
Open Access Journal of Clinical Trials 2009:1 35
Biomarker discovery in neurological diseasesDovepress
submit your manuscript | www.dovepress.com
Dovepress
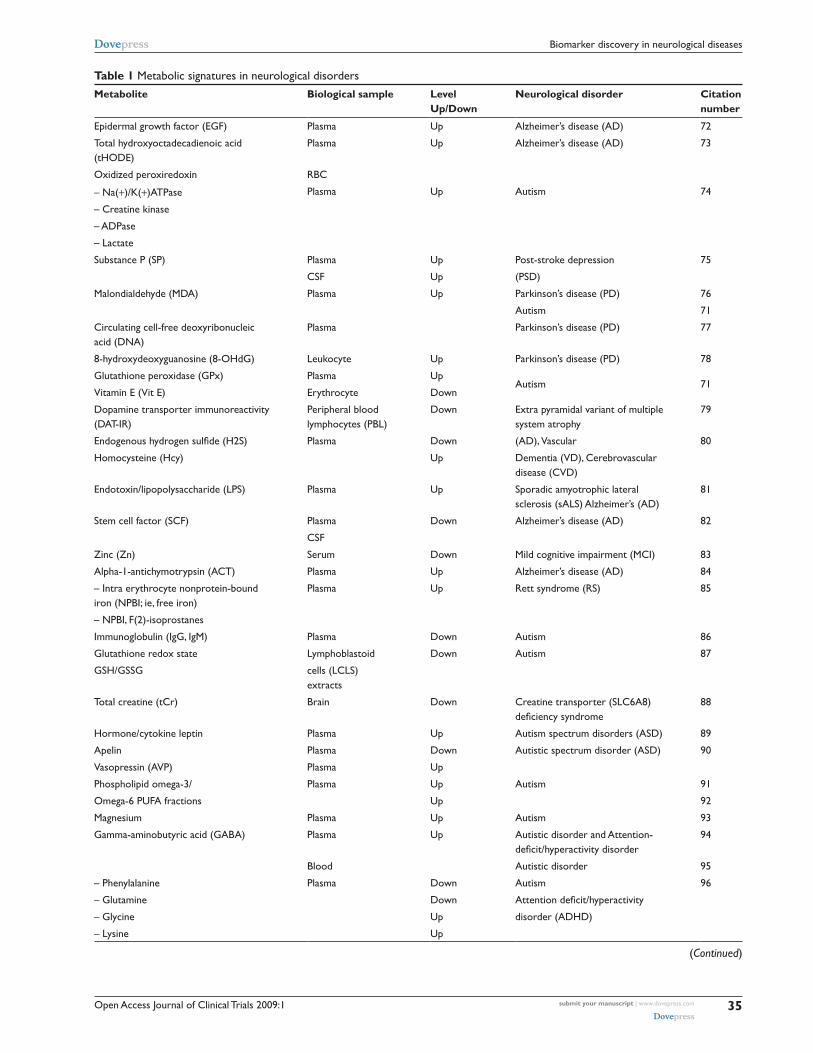
Table 1 Metabolic signatures in neurological disorders
Metabolite Biological sample Level Up/Down
Neurological disorder Citation number
Epidermal growth factor (EGF) Plasma Up Alzheimer’s disease (AD) 72
Total hydroxyoctadecadienoic acid (tHODE)
Plasma Up Alzheimer’s disease (AD) 73
Oxidized peroxiredoxin rBC
– Na(+)/K(+)ATPase Plasma Up Autism 74
– Creatine kinase
– ADPase
– Lactate
Substance P (SP) Plasma Up Post-stroke depression 75
CSF Up (PSD)
Malondialdehyde (MDA) Plasma Up Parkinson’s disease (PD) 76
Autism 71
Circulating cell-free deoxyribonucleic acid (DNA)
Plasma Parkinson’s disease (PD) 77
8-hydroxydeoxyguanosine (8-OHdG) Leukocyte Up Parkinson’s disease (PD) 78
Glutathione peroxidase (GPx) Plasma UpAutism 71
vitamin E (vit E) Erythrocyte Down
Dopamine transporter immunoreactivity (DAT-ir)
Peripheral blood lymphocytes (PBL)
Down Extra pyramidal variant of multiple system atrophy
79
Endogenous hydrogen sulfide (H2S) Plasma Down (AD), vascular 80
Homocysteine (Hcy) Up Dementia (vD), Cerebrovascular disease (CvD)
Endotoxin/lipopolysaccharide (LPS) Plasma Up Sporadic amyotrophic lateral sclerosis (sALS) Alzheimer’s (AD)
81
Stem cell factor (SCF) Plasma Down Alzheimer’s disease (AD) 82
CSF
Zinc (Zn) Serum Down Mild cognitive impairment (MCi) 83
Alpha-1-antichymotrypsin (ACT) Plasma Up Alzheimer’s disease (AD) 84
– intra erythrocyte nonprotein-bound iron (NPBi; ie, free iron)
Plasma Up rett syndrome (rS) 85
– NPBi, F(2)-isoprostanes
immunoglobulin (igG, igM) Plasma Down Autism 86
Glutathione redox state Lymphoblastoid Down Autism 87
GSH/GSSG cells (LCLS) extracts
Total creatine (tCr) Brain Down Creatine transporter (SLC6A8) deficiency syndrome
88
Hormone/cytokine leptin Plasma Up Autism spectrum disorders (ASD) 89
Apelin Plasma Down Autistic spectrum disorder (ASD) 90
vasopressin (AvP) Plasma Up
Phospholipid omega-3/ Plasma Up Autism 91
Omega-6 PUFA fractions Up 92
Magnesium Plasma Up Autism 93
Gamma-aminobutyric acid (GABA) Plasma Up Autistic disorder and Attention-deficit/hyperactivity disorder
94
Blood Autistic disorder 95
– Phenylalanine Plasma Down Autism 96
– Glutamine Down Attention deficit/hyperactivity
– Glycine Up disorder (ADHD)
– Lysine Up
(Continued)
Open Access Journal of Clinical Trials 2009:136
El-Ansary et al Dovepress
submit your manuscript | www.dovepress.com
Dovepress
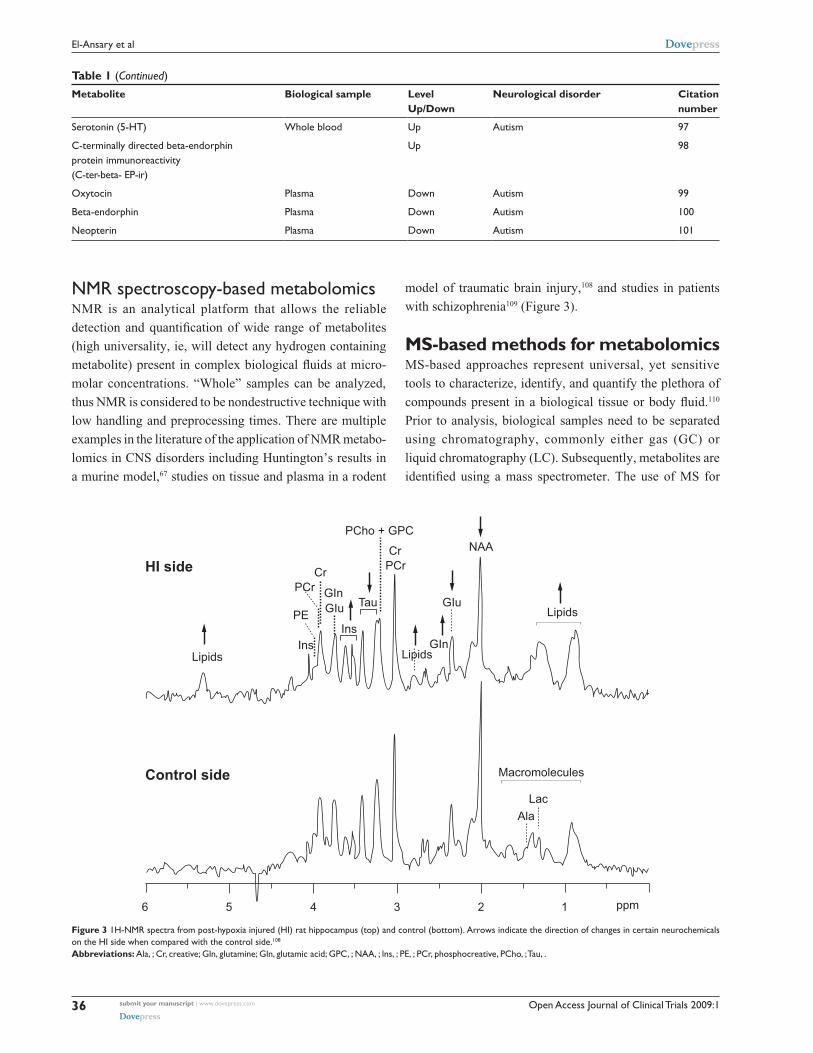
NMr spectroscopy-based metabolomicsNMR is an analytical platform that allows the reliable
detection and quantification of wide range of metabolites
(high universality, ie, will detect any hydrogen containing
metabolite) present in complex biological fluids at micro-
molar concentrations. “Whole” samples can be analyzed,
thus NMR is considered to be nondestructive technique with
low handling and preprocessing times. There are multiple
examples in the literature of the application of NMR metabo-
lomics in CNS disorders including Huntington’s results in
a murine model,67 studies on tissue and plasma in a rodent
model of traumatic brain injury,108 and studies in patients
with schizophrenia109 (Figure 3).
MS-based methods for metabolomicsMS-based approaches represent universal, yet sensitive
tools to characterize, identify, and quantify the plethora of
compounds present in a biological tissue or body fluid.110
Prior to analysis, biological samples need to be separated
using chromatography, commonly either gas (GC) or
liquid chromatography (LC). Subsequently, metabolites are
identified using a mass spectrometer. The use of MS for
Table 1 (Continued)
Metabolite Biological sample Level Up/Down
Neurological disorder Citation number
Serotonin (5-HT) whole blood Up Autism 97
C-terminally directed beta-endorphin protein immunoreactivity (C-ter-beta- EP-ir)
Up 98
Oxytocin Plasma Down Autism 99
Beta-endorphin Plasma Down Autism 100
Neopterin Plasma Down Autism 101
6 5 4 3 2 1 ppm
Control side
HI side
PCho + GPC
GIuGIu Tau
Ala
Macromolecules
Lac
GIn
InsIns
GIn
PCr
PE
PCrCr
Cr
NAA
Lipids
LipidsLipids
Figure 3 1H-NMr spectra from post-hypoxia injured (Hi) rat hippocampus (top) and control (bottom). Arrows indicate the direction of changes in certain neurochemicals on the Hi side when compared with the control side.108
Abbreviations: Ala, ; Cr, creative; Gln, glutamine; Gln, glutamic acid; GPC, ; NAA, ; lns, ; PE, ; PCr, phosphocreative, PCho, ; Tau, .
Open Access Journal of Clinical Trials 2009:1 37
Biomarker discovery in neurological diseasesDovepress
submit your manuscript | www.dovepress.com
Dovepress
metabolomics research in CNS disorders provides a number
of advantages, allowing the detection of many metabolite
classes at physiological concentrations including amino and
organic acids, fatty acids, sugars, sugar phosphates, bile acids,
lipids, and nucleotide bases. MS has the ability to identify
known as well as new metabolites (not currently described
in databases) in a relatively straightforward fashion.
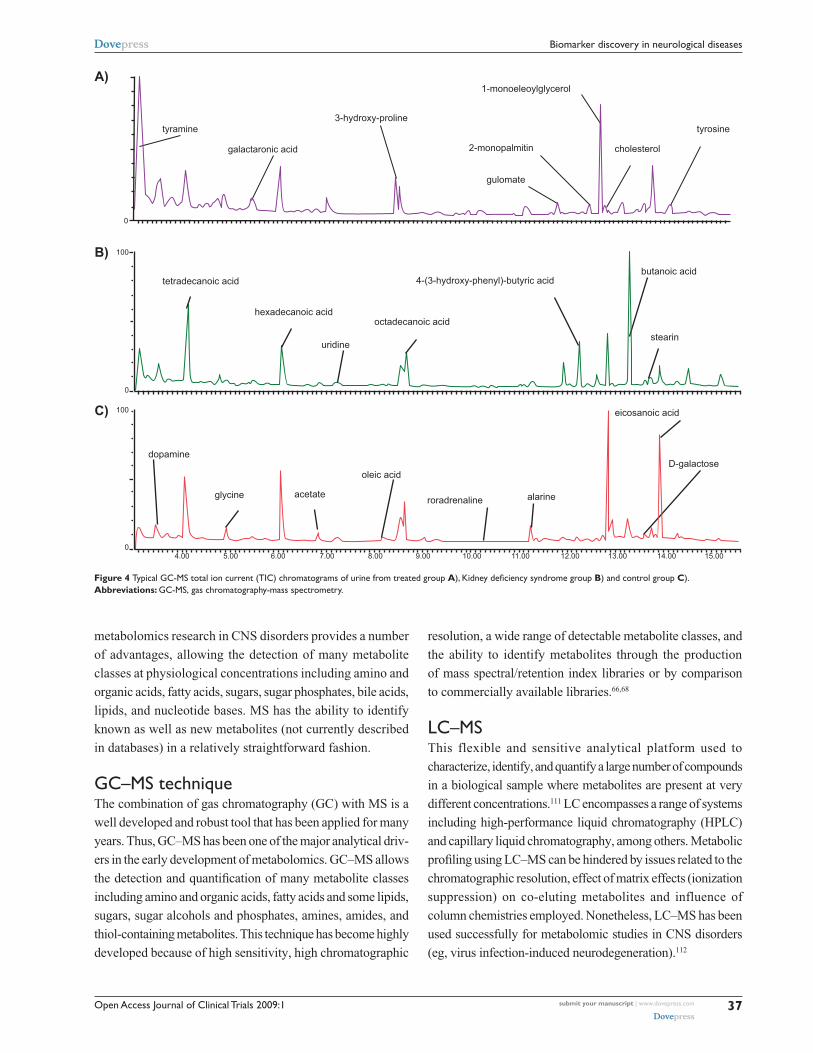
GC–MS techniqueThe combination of gas chromatography (GC) with MS is a
well developed and robust tool that has been applied for many
years. Thus, GC–MS has been one of the major analytical driv-
ers in the early development of metabolomics. GC–MS allows
the detection and quantification of many metabolite classes
including amino and organic acids, fatty acids and some lipids,
sugars, sugar alcohols and phosphates, amines, amides, and
thiol-containing metabolites. This technique has become highly
developed because of high sensitivity, high chromatographic
resolution, a wide range of detectable metabolite classes, and
the ability to identify metabolites through the production
of mass spectral/retention index libraries or by comparison
to commercially available libraries.66,68
LC–MSThis flexible and sensitive analytical platform used to
characterize, identify, and quantify a large number of compounds
in a biological sample where metabolites are present at very
different concentrations.111 LC encompasses a range of systems
including high-performance liquid chromatography (HPLC)
and capillary liquid chromatography, among others. Metabolic
profiling using LC–MS can be hindered by issues related to the
chromatographic resolution, effect of matrix effects (ionization
suppression) on co-eluting metabolites and influence of
column chemistries employed. Nonetheless, LC–MS has been
used successfully for metabolomic studies in CNS disorders
(eg, virus infection-induced neurodegeneration).112
A)
B)
C) 100
100
0
04.00 5.00 6.00 7.00 8.00 9.00 10.00 11.00 12.00 13.00 14.00 15.00
galactaronic acid
gulomate
2-monopalmitin
1-monoeleoylglycerol
3-hydroxy-prolinetyramine tyrosine
cholesterol
dopamine
glycine acetate alarineroradrenaline
octadecanoic acid
oleic acid
eicosanoic acid
D-galactose
4-(3-hydroxy-phenyl)-butyric acidbutanoic acid
stearinuridine
hexadecanoic acid
tetradecanoic acid
0
Figure 4 Typical GC-MS total ion current (TiC) chromatograms of urine from treated group A), Kidney deficiency syndrome group B) and control group C).Abbreviations: GC-MS, gas chromatography-mass spectrometry.
Open Access Journal of Clinical Trials 2009:138
El-Ansary et al Dovepress
submit your manuscript | www.dovepress.com
Dovepress
Capillary electrophoresisCapillary electrophoresis (CE) is an analytical separation
technique capable of high-resolution separation of a diverse
range of chemical compounds.113 It is particularly suitable
for the separation of polar and charged compounds. It is a
more powerful technique than LC with respect to separation
efficiency, and the amount of sample required for analysis is
small. When CE is used for the analysis of serum or cerebro-
spinal fluid, deproteinization is often applied using ultrafiltra-
tion. The main reason for the deproteinization is to prevent
precipitation of the proteins in the capillary or adsorption to the
capillary wall. However, human serum has also been analyzed
directly by CE for the determination of organic acids.113
Concluding remarksThe introduction and concepts of metabolomics enabling the
study of neurological diseases based on profiling a multitude
of biochemical components related to brain metabolism. This
approach is considered to have the potential to revolutionize
medical practice in preventing, predicting, and personalizing
brain health care. Through metabolomic approach, plasma
and serum, could be utilized to increase the accuracy of
diagnosis of neurological disorders. Metabolomic approach
is a promising tool for the investigation of large number of
small samples rapidly which could reduce the manual labor of
technicians and to explore unexpected properties of biological
systems which could help in recording more markers related to
brain diseases. If metabolomic information can be translated
into diagnostic tests, metabolomic approach could provide
earlier, faster, and more accurate diagnoses for many diseases.
Potential biomarkers require evaluation of their sensitivity,
specificity, and there is currently no biomarker candidate
that fulfills all the criteria for validation as a biomarker.
AcknowledgmentsThe authors wish to express their profound thanks to
SABIC Company, Kingdom of Saudi Arabia for the support
of this review and related work. Thanks are also expressed
to Miss Nada El-Ghawaby for her effort in designing and
improving the quality of the art work presented in the
manuscript. The authors report no conflicts of interest in
this work.
References 1. Gershon ES, Goldin LR. Clinical methods in psychiatric genetics. I.
Robustness of genetic marker investigative strategies. Acta Psychiatr Scand. 1986;74:113–118.
2. Leboyer M, Leboyer M, Bellivier F, et al. Psychiatric genetics: search for phenotypes. Trends Neurosci. 1998;21:102–105.
3. Biomarkers Definitions Working Group, 2001. Biomarkers and surrogate endpoints: preferred definitions and conceptual framework. Clin Pharmacol Ther. 2001;69:89–95.
4. Vasan RS. Biomarkers of cardiovascular disease: molecular basis and practical considerations. Circulation. 2006;113:2335–2362.
5. Hood L, Heath JR, Phelps ME, Lin B. Systems biology and new technologies enable predictive and preventative medicine. Science. 2004;306:640–643.
6. Kristal BS, Kaddurah-Daouk R, Beal MF, Matson WR. Metabolomics: concept and potential neuroscience application. In: Handbook of Neurochemistry and Molecular Neurobiology: Brain Energetics. Integration of Molecular and Cellular Processes. New York, NY: Springer; 2007. p. 889–912.
7. Kaddurah-Daouk R, Kristal BS, Weinshilboum RM. Metabolomics: a global biochemical approach to drug response and disease. Annu Rev Pharmacol Toxicol. 2008;48:653–683.
8. Cacabelos R. Pharmacogenomics and therapeutic strategies for dementia. Expert Rev Mol Diagn. 2009;9:567–611.
9. Lindon JC, Holmes E, Nicholson JK. Metabonomics and its role in drug development and disease diagnosis. Expert Rev Mol Diagn. 2004; 4:189–199.
10. Holmes E, Wilson ID, Nicholson JK. Metabolic phenotyping in health and disease. Cell. 2008;134:714–717.
11. Wishart D. Applications of metabolomics in drug discovery and development. Drugs R D. 2008;9:307–322.
12. Dunckley T, Coon K, Stephan A. Discovery and development of biomarkers of neurological disease. Drug Discov Today. 2005;10: 326–334.
13. Dekosky ST, Marek K. Looking backward to move forward: early detection of neurodegenerative disorders. Science. 2003;302: 830–834.
14. Kell DB. Metabolomics and systems biology: making sense of the soup. Curr Opin Microbiol. 2004;7:296–307.
15. Wang M, Lamers RJ, Korthout HA, et al. Metabolomics in the context of systems biology: bridging traditional Chinese medicine and molecular pharmacology. Phytother Res. 2005;19:173–182.
16. Wang QZ, Wu CY, Chen T, Chen X, Zhao XM. Integrating metabolomics into a systems biology framework to exploit metabolic complexity: strategies and applications in microorganisms. Appl Microbiol Biotechnol. 2006;70(2):151–161.
17. Kochhar S, Jacobs DM, Ramadan Z, Berruex F, Fuerholz A, Fay LB. Probing gender-specific metabolism differences in humans by nuclear magnetic resonance-based metabonomics. Anal Biochem. 2006;352:274–281.
18. Slupsky CM, Rankin KN, Wagner J, et al. Investigations of the effects of gender, diurnal variation, and age in human urinary metabolomic profiles. Anal Chem. 2007;79:6995–7004.
19. Lenz EM, Bright J, Wilson ID, Morgan SR, Nash AF. A 1H NMR-based metabonomic study of urine and plasma samples obtained from healthy human subjects. J Pharm Biomed Anal. 2003;33: 1103–1115.
20. Lenz EM, Bright J, Wilson ID, et al. Metabonomics, dietary influences and cultural differences: a 1H NMR-based study of urine samples obtained from healthy British and Swedish subjects. J Pharm Biomed Anal. 2004;36:841–849.
21. Walsh MC, Brennan L, Malthouse JP, Roche HM, Gibney MJ. Effect of acute dietary standardization on the urinary, plasma, and salivary metabolomic profiles of healthy humans. Am J Clin Nutr. 2006;84: 531–539.
22. Beckonert O, Keun H, Ebbels T, et al. Metabolic profiling, metabolomic and metabonomic procedures for NMR spectroscopy of urine, plasma, serum and tissue extracts. Nat Protoc. 2007;11:2692–2703.
23. Fiehn O, Robertson D, Griffin J, et al. The metabolomics standard initiative (MSI). Metabolomics. 2007;3:175–178.
24. Simmons ML, Frondoza CG, Coyle JT. Immunocytochemical localiza-tion of N-acetyl aspartate with monoclonal antibodies. Neuroscience. 1991;45:37–45.
Open Access Journal of Clinical Trials 2009:1 39
Biomarker discovery in neurological diseasesDovepress
submit your manuscript | www.dovepress.com
Dovepress
25. Miller BL. A review of chemical issues in 1H NMR spectroscopy: N-acetyl-L-aspartate, creatine and choline. NMR Biomed. 1991; 4:47–52.
26. Spielman DL, Lim KO. Estimating NAA in cortical gray matter with applications for measuring changes due to aging. Magn Reson Med. 1997;37:372–377.
27. Wittsack HJ, Kugel H, Roth B, et al. Quantitative measurements with localized H-1 MR spectroscopy in children with Canavan’s disease. J Magn Resort Imaging. 1996;6:889–893.
28. Ross B, Michaelis T. Clinical applications of magnetic resonance spectroscopy. Mag Res Q. 1994;10:191–247.
29. Sanders JA. Magnetic resonance spectroscopy. In: Orrison WW, Lewine JD, Sanders JA, et al. (editors). Functional Brain Imaging. St. Louis, MO: Mosby; 1995. p. 419–467.
30. van der Knaap MS, Ross B, Valk J. Use of MR in inborn errors of metabolism. In: Kucharczyk J, Mosely M, Barkovich AJ (editors). Magnetic Resonance Neuroimaging. Boca Raton, FL: CRC Press; 1994. p. 245–318.
31. Badar-Goffer RS, Ben-Yoseph O, Bachelard HS, et al. Neuronal-glial metabolism under depolarizing conditions. Biochem J. 1992;282: 225–230.
32. Lee JH, Arcinue E, Ross BD. Organic osmolytes in the brain of an infant with hypernatremia. N Engl J Med. 1994;331:439–442.
33. Videen JS, Michaelis T, Pinto R, et al. Human cerebral osmolytes during chronic hyponatremia. A proton magnetic resonance spectroscopy study. J Clin Invest. 1995;95:788–793.
34. Castillo M, Kwock L, Scatliff JH, et al. Proton MR spectroscopic characteristics of a presumed giant subcortical heterotopia. AJNR Am J Neuroradiol. 1993;14:426–429.
35. Michaelis T, Merboldt KD, Bmhn H, et al. Absolute concentrations of metabolites in the adult human brain in vivo: Quantification of localized proton MR spectra. Radiology. 1993;187:219–227.
36. Hye A, Lynham S, Thambisetty M, et al. Proteome-based plasma biomarkers for Alzheimer’s disease. Brain. 2006;129:3042–3050.
37. Frank RA, Galasko D, Hampel H, et al. Biological markers for therapeutic trials in Alzheimer’s disease. Proceedings of the biological markers working group; NIA initiative on neuroimaging in Alzheimer’s disease. Neurobiol Aging. 2003;24:521–536.
38. Consensus report of the Working Group on: “Molecular and Biochemical Markers of Alzheimer’s Disease”. The Ronald and Nancy Reagan Research Institute of the Alzheimer’s Association and the National Institute on Aging Working Group. Neurobiol Aging. 1998;19:109–116.
39. Pratico D. Peripheral biomarkers of oxidative damage in Alzheimer’s disease: the road ahead. Neurobiol Aging. 2005;26:581–583.
40. Solfrizzi V, D’Introno A, Colacicco AM, et al. Circulating biomarkers of cognitive decline and dementia. Clin Chim Acta. 2006;364:91–112.
41. Korolainen MA, Pirttila T. Cerebrospinal fluid, serum and plasma protein oxidation in Alzheimer’s disease. Acta Neurol Scand. 2009;119: 32–38.
42. Lovell MA, Markesbery WR. Oxidative damage in mild cognitive impairment and early Alzheimer’s disease. J Neurosci Res. 2007;85: 3036–3040.
43. Montine TJ, Quinn J, Kaye J, Morrow JD. F(2)-isoprostanes as biomarkers of late-onset al.zheimer’s disease. J Mol Neurosci. 2007;33: 114–119.
44. Pratico D, Clark CM, Lee VM, Trojanowski JQ, Rokach J, FitzGerald GA. Increased 8,12-iso-iPF2alpha-VI in Alzheimer’s disease: correlation of a noninvasive index of lipid peroxidation with disease severity. Ann Neurol. 2000;48:809–812.
45. Quinn JF, Montine KS, Moore M, Morrow JD, Kaye JA, Montine TJ. Suppression of longitudinal increase in CSF F2-isoprostanes in Alzheimer’s disease. J Alzheimers Dis. 2004;6:93–97.
46. Pratico D, Clark CM, Liun F, Rokach J, Lee VY, Trojanowski JQ. Increase of brain oxidative stress in mild cognitive impairment: a possible predictor of Alzheimer disease. Arch Neurol. 2002;59: 972–976.
47. Irizarry MC, Yao Y, Hyman BT, Growdon JH, Pratico D. Plasma F2A isoprostane levels in Alzheimer’s and Parkinson’s disease. Neurodegener Dis. 2007;4:403–405.
48. Akiyama H, Barger S, Barnum S, et al. Inflammation and Alzheimer’s disease. Neurobiol Aging. 2000;21:383–421.
49. Yasojima K, Schwab C, McGeer EG, McGeer PL. Human neurons generate C-reactive protein and amyloid P: upregulation in Alzheimer’s disease. Brain Res. 2000;887:80–89.
50. Engelhart MJ, Geerlings MI, Meijer J, et al; Inflammatory proteins in plasma and the risk of dementia: the Rotterdam study. Arch Neurol. 2004;61:668–672.
51. Schuitemaker A, Dik MG, Veerhuis R, et al. Inflammatory markers in AD and MCI patients with different biomarker profiles. Neurobiol Aging. 2009;30:1885–1889.
52. Veerhuis R, Van Breemen MJ, Hoozemans JM, et al. Amyloid beta plaque-associated proteins C1q and SAP enhance the Abeta1–42 peptide-induced cytokine secretion by adult human microglia in vitro. Acta Neuropathol. 2003;105:135–144.
53. Dik MG, Jonker C, Hack CE, Smit JH, Comijs HC, Eikelenboom P. Serum inflammatory proteins and cognitive decline in older persons. Neurology. 2005;64:1371–1377.
54. Schmidt R, Schmidt H, Curb JD, Masaki K, White LR, Launer LJ; Early inflammation and dementia: a 25-year follow-up of the Honolulu-Asia Aging Study. Ann Neurol. 2002;52:168–174.
55. Yaffe K, Lindquist K, Penninx BW, et al. Inflammatory markers and cognition in well-functioning African-American and white elders. Neurology. 2003;61:76–80.
56. Ray S, Britschgi M, Herbert C, et al. Classification and prediction of clinical Alzheimer’s diagnosis based on plasma signaling proteins. Nat Med. 2007;13:1359–1362.
57. Kaddurah-Daouk R, Soares JC, Quinones MP. Metabolomics: A global biochemical approach to the discovery of biomarkers for psychiatric disorders. New York, NY: Springer Science; 2009.
58. Raedler TJ, Wiedemann K. CSF-studies in neuropsychiatric disorders. Neuroendocrinol Lett. 2006;27:297–305.
59. Maier B, Laurer HL, Rose S, Buurman WA, Marzi I. Physiological levels of pro- and anti-inflammatory mediators in cerebrospinal fluid and plasma: a normative study. J Neurotrauma. 2005;22: 822–835.
60. Curzon G. Relationships between plasma, CSF and brain tryptophan. J Neural Transm Suppl. 1979;(15):81–92.
61. Obeid R, Kostopoulos P, Knapp JP, et al. Biomarkers of folate and vitamin B12 are related in blood and cerebrospinal fluid. Clin Chem. 2007;53:326–333.
62. Leoni V, Masterman T, Patel P, Meaney S, Diczfalusy U, Björkhem I. Side chain oxidized oxysterols in cerebrospinal fluid and the integrity of blood–brain and blood–cerebrospinal fluid barriers. J Lipid Res. 2003;44:793–799.
63. Levine J, Sela BA, Osher Y, et al. High homocycteine serum levels in young male schizophrenia and bipolar patients and animal model. Prog Neuropsychopharmacol Biol Psychiatr. 2005;29:1181–1191.
64. Rozen S, Cudkowicz ME, Bogdanov M, et al. Metabolomic analysis and signatures in motor neuron disease. Metabolomics. 2005;1:101–108.
65. Bogdanov M, Matson WR, Wang L, et al. Metabolomic profiling to develop blood biomarkers for Parkinson’s disease. Brain. 2008;131: 389–396.
66. Underwood B, Broadhurst D, Dunn WB, et al. Huntington disease patients and transgenic mice have similar pro-catabolic serum metabo-lite profiles. Brain. 2006;129:877–886.
67. Tsang TM, Woodman B, McLoughlin GA, et al. Metabolic character-ization of the R6/2 transgenic mouse model of Huntington’s disease by high-resolution MAS 1H NMR spectroscopy. J Proteome Res. 2006;5:483–492.
68. Paige LA, Mitchell MW, Krishnan KR, Kaddurah-Daouk R, Steffens DC. A preliminary metabolomic analysis of older adults with and without depression. Int J Geriatr Psychiatry. 2007;22: 418–423.
Open Access Journal of Clinical Trials 2009:140
El-Ansary et al Dovepress
submit your manuscript | www.dovepress.com
Dovepress
69. Kaddurah-Daouk R, McEvoy J, Baillie RA, et al. Metabolomic mapping of atypical antipsychotic effects in schizophrenia. Mol Psychiatry. 2007;12:934–945.
70. James SJ, Melnyk S, Jernigan S, et al. Metabolic endophenotype and related genotypes are associated with oxidative stress in children with autism. Am J Med Genet B Neuropsych Genet. 2006;141B: 947–956.
71. Al-Gadani Y, Al-Ansary A, Al-Attas O, Al-Ayadhi L. Oxidative stress and antioxidant status in Saudi autistic children. Clin Biochem. 2009;42:1032–1040.
72. Marksteiner J, Kemmler G, Weiss EM, et al. Five out of 16 plasma signaling proteins are enhanced in plasma of patients with mild cognitive impairment and Alzheimer’s disease. Neurobiol Aging. 2009;Apr 21 [Epub ahead of print].
73. Yoshidaa Y, Yoshikawab A, Kinumia T, et al. Hydroxyoctadecadienoic acid and oxidatively modified peroxiredoxins in the blood of Alzheimer’s disease patients and their potential as biomarkers. Neurobiol Aging. 2009;30:174–185.
74. Al-Mosalem OA, Al-Ansary A, Attas O, Al-Ayadhi L. Metabolic bio-markers related to energy metabolism in Saudi autistic children. Clin Biochem. 2009;42:949–957.
75. Li L, Gao X, Zhao J, Ji X, Wei H, Luo Y. Plasma and cerebrospinal fluid substance P in post-stroke patients with depression. Psychiatry Clin Neurosci. 2009;63:298–304.
76. Sanyal J, Bandyopadhyay SK, Banerjee TK, et al. Plasma levels of lipid peroxides in patients with Parkinson’s disease. Eur Rev Med Pharmacol Sci. 2009;13:129–132.
77. Scalzo PL, Ikuta N, Cardoso F, Regner A, Teixeira AL. Quantitative plasma DNA analysis in Parkinson’s disease. Neurosci Lett. 2009; 452:5–7.
78. Chen CM, Liu JL, Wu YR, et al. Increased oxidative damage in periph-eral blood correlates with severity of Parkinson’s disease. Neurobiol Dis. 2009;33:429–435.
79. Buttarelli FR, Circella A, Pellicano C, et al. Dopamine transporter immunoreactivity in peripheral blood lymphocytes in multiple system atrophy. J Neural Transm. 2009;116:161–165.
80. Liu XQ, Liu XQ, Jiang P, Huang H, Yan Y. Plasma levels of endogenous hydrogen sulfide and homocysteine in patients with Alzheimer’s disease and vascular dementia and the significance thereof. Zhonghua Yi Xue Za Zhi. 2008;88:2246–2249.
81. Zhang R, Miller RG, Gascon R, et al. Circulating endotoxin and systemic immune activation in sporadic amyotrophic lateral sclerosis (sALS). J Neuroimmunol. 2009;206:121–124.
82. Laske C, Stellos K, Stransky E, et al. Decreased plasma and cerebro-spinal fluid levels of stem cell factor in patients with early Alzheimer’s disease. J Alzheimers Dis. 2008;15:451–460.
83. Dong J, Robertson JD, Markesbery WR, Lovell MA. Serum zinc in the progression of Alzheimer’s disease. J Alzheimers Dis. 2008;15: 443–450.
84. Porcellini E, Davis EJ, Chiappelli M, et al. Elevated plasma levels of alpha-1-anti-chymotrypsin in age-related cognitive decline and Alzheimer’s disease: a potential therapeutic target. Curr Pharm Des. 2008;14:2659–2664.
85. De Felice C, Ciccoli L, Leoncini S, et al. Systemic oxidative stress in classic Rett syndrome. Free Radic Biol Med. 2009;47:440–448.
86. Heuer L, Ashwood P, Schauer J, et al. Reduced levels of immunoglobulin in children with autism correlates with behavioral symptoms. Autism Res. 2008;1:275–283.
87. James SJ, Rose S, Melnyk S, et al. Cellular and mitochondrial gluta-thione redox imbalance in lymphoblastoid cells derived from children with autism. FASEB J. 2009;23:2374–2383.
88. Dezortova M, Jiru F, Petrasek J, et al. 1H MR spectroscopy as a diagnostic tool for cerebral creatine deficiency. MAGMA. 2008;21: 327–332.
89. Ashwood P, Kwong C, Hansen R, et al. Brief report: plasma leptin levels are elevated in autism: association with early onset phenotype? J Autism Dev Disord. 2008;38:169–175.
90. Boso M, Emanuele E, Politi P, et al. Reduced plasma apelin level in patient with autistic spectrum disorder. Arch Med Res. 2007;38: 70–74.
91. Vancassel S, Durand G, Barthélémy C, et al. Plasma fatty acid levels in autistic children. Prostaglandins Leukot Essent Fatty Acids. 2001; 65:1–7.
92. Sliwinski S, Croonenberghs J, Christophe A, Deboutte D, Maes M. Polyunsaturated fatty acids: do they have a role in the pathophysiology of autism? Neuro Endocrinol Lett. 2006;27: 465–471.
93. Strambi M, Longini M, Hayek J, et al. Magnesium profile in autism. Biol Trace Elem Res. 2006;109:97–104.
94. Dhossche D, Applegate H, Abraham A, et al. Elevated plasma gamma-aminobutyric acid (GABA) levels in autistic youngsters: stimulus for a GABA hypothesis of autism. Med Sci Monit. 2002;8: PR1–PR6.
95. Cohen BI. GABA-transaminase, the liver and infantile autism. Med Hypotheses. 2001;57:673–674.
96. Zavala M, Castejón HV, Ortega PA, Castejón OJ, Marcano de Hidalgo A, Montiel N. Imbalance of plasma amino acids in patients with autism and subjects with attention deficit/hyperactivity disorder. Rev Neurol. 2001;33:401–408.
97. Leventhal BL, Cook EH Jr, Morford M, Ravitz A, Freedman DX. Relationships of whole blood serotonin and plasma norepinephrine within families. J Autism Dev Disord. 1990;20:499–511.
98. Leboyer M, Philippe A, Bouvard M, et al. Whole blood serotonin and plasma beta-endorphin in autistic probands and their first-degree relatives. Biol Psychiatry. 1999;45:158–163.
99. Modahl C, Green L, Fein D, et al. Plasma oxytocin levels in autistic children. Biol Psychiatry. 1998;43:270–277.
100. Ernst M, Devi L, Silva RR, et al. Plasma beta-endorphin levels, naltrexone, and haloperidol in autistic children. Psychopharmacol Bull. 1993;29:221–227.
101. Eto I, Bandy MD, Butterworth CE Jr. Plasma and urinary levels of biopterin, neopterin, and related pterins and plasma levels of folate in infantile autism. J Autism Dev Disord. 1992;22: 295–308.
102. Wieand S, Gail MH, James BR, James KL. A family of nonparametric statistics for comparing diagnostic markers with paired or unpaired data. Biometrika. 1989;76:585–592.
103. Søreide K. Receiver-operating characteristic (ROC) curve analysis in diagnostic, prognostic and predictive biomarker research. J Clin Pathol. 2009;62:1–5.
104. Irizarry MC. Biomarkers of Alzheimer disease in plasma. NeuroRx. 2004;1:226–234.
105. Marksteiner J, Kemmler G, Weiss EM, et al. Five out of 16 plasma signaling proteins are enhanced in plasma of patients with mild cognitive impairment and Alzheimer’s disease. Neurobiol Aging. 2009 Apr 21 [Epub ahead of print].
106. Allard L, Burkhard PR, Lescuyer P, et al. PARK7 and nucleoside diphosphate kinase A as plasma markers for the early diagnosis of stroke. Clin Chem. 2005;51:2043–2051.
107. Gerlach M, Hendrich A, Hueber R, et al. Potentielle biomarker der Parkinsonkrankheit. Aktuelle Neurologie Supplement. 2007;34: S28–S30.
108. Viant MR, Lyeth BG, Miller MG, Berman RF. An NMR metabo-lomic investigation of early metabolic disturbances following trau-matic brain injury in a mammalian model. NMR Biomed. 2005;18: 507–516.
109. Holmes E, Tsang TM, Tabrizi SJ. The application of NMR-based metabonomics in neurological disorders. NeuroRx. 2006;3: 358–372.
110. Dettmer K, Aronov PA, Hammock BD. Mass spectrometry-based metabolomics. Mass Spectrom Rev. 2007;26:51–78.
111. Dunn WB. Current trends and future requirements for the mass spectrometric investigation of microbial, mammalian and plant metabolomes. Phys Biol. 2008;5:1–24.
Open Access Journal of Clinical Trials 2009:1
Open Access Journal of Clinical Trials
Publish your work in this journal
Submit your manuscript here: http://www.dovepress.com/open-access-journal-of-clinical-trials-journal
The Open Access Journal of Clinical Trials is an international, peer-reviewed, open access journal publishing original research, reports, editorials, reviews and commentaries on all aspects of clinical trial design, management, legal, ethical and regulatory issues, case record form design, data collection, quality assurance and data auditing
methodologies. The manuscript management system is completely online and includes a very quick and fair peer-review system, which is all easy to use. Visit http://www.dovepress.com/testimonials.php to read real quotes from published authors.
41
Biomarker discovery in neurological diseasesDovepress
submit your manuscript | www.dovepress.com
Dovepress
Dovepress
112. Wikoff WR, Pendyala G, Siuzdak G, Fox HS. Metabolomic analysis of the cerebrospinal fluid reveals changes in phospholipase expres-sion in the CNS of SIV-infected macaques. J Clin Invest. 2008;118: 2661–2669.
113. Soga T, Imaizumi M. Capillary electrophoresis method for the analysis of inorganic anions, organic acids, amino acids, nucleotides, carbo-hydrates and other anionic compounds. Electrophoresis. 2001;22: 3418–3425.
114. Dolník V, Dolníková J. Capillary zone electrophoresis of organic acids in serum of critically ill children. J Chromatogr A. 1995;716: 269–277.
View publication statsView publication stats


![Metabolomic studies of human gastric cancer: Review · 2017-04-25 · biomarker discovery[39,56,57] and natural product drug discovery[18]. However, none of them have focused on a](https://img.pdfslide.net/doc/110x75/5ecff38006783c7a596b3a06/metabolomic-studies-of-human-gastric-cancer-review-2017-04-25-biomarker-discovery395657.jpg)


![Proteomic and Metabolomic Characterization of Human ...diseasebiophysics.seas.harvard.edu/wp-content/... · metabolomic[9,10] analysis of the individual compartments of a microfluidic](https://img.pdfslide.net/doc/110x75/6034f7cd36b07b58d426adf3/proteomic-and-metabolomic-characterization-of-human-metabolomic910-analysis.jpg)


![Systems Metabolomic Lecture[1]](https://img.pdfslide.net/doc/110x75/546af5e0b4af9f486b8b45b1/systems-metabolomic-lecture1.jpg)