Embed Size (px)
Citation preview
Interactive XCMS Online: Simplifying Advanced Metabolomic DataProcessing and Subsequent Statistical AnalysesHarsha Gowda,† Julijana Ivanisevic,† Caroline H. Johnson,† Michael E Kurczy,† H. Paul Benton,†
Duane Rinehart,† Thomas Nguyen,† Jayashree Ray,∥ Jennifer Kuehl,∥ Bernardo Arevalo,†
Peter D. Westenskow,‡ Junhua Wang,† Adam P. Arkin,∥ Adam M. Deutschbauer,∥ Gary J Patti,*,§
and Gary Siuzdak*,†
†Scripps Center for Metabolomics and Mass Spectrometry and ‡Department of Cell Biology, The Scripps Research Institute, 10550North Torrey Pines Road, La Jolla, California 92037, United States∥Physical Biosciences Division, Lawrence Berkeley National Laboratory, Berkeley, California United States§Departments of Chemistry, Genetics, and Medicine, Washington University, One Brookings Drive, St. Louis, Missouri 63130, UnitedStates
ABSTRACT: XCMS Online (xcmsonline.scripps.edu) is a cloud-based informaticplatform designed to process and visualize mass-spectrometry-based, untargetedmetabolomic data. Initially, the platform was developed for two-group comparisons tomatch the independent, “control” versus “disease” experimental design. Here, weintroduce an enhanced XCMS Online interface that enables users to perform dependent(paired) two-group comparisons, meta-analysis, and multigroup comparisons, withcomprehensive statistical output and interactive visualization tools. Newly incorporatedstatistical tests cover a wide array of univariate analyses. Multigroup comparison allowsfor the identification of differentially expressed metabolite features across multiple classesof data while higher order meta-analysis facilitates the identification of shared metabolicpatterns across multiple two-group comparisons. Given the complexity of these data sets,we have developed an interactive platform where users can monitor the statistical outputof univariate (cloud plots) and multivariate (PCA plots) data analysis in real time byadjusting the threshold and range of various parameters. On the interactive cloud plot, metabolite features can be filtered out bytheir significance level (p-value), fold change, mass-to-charge ratio, retention time, and intensity. The variation pattern of eachfeature can be visualized on both extracted-ion chromatograms and box plots. The interactive principal component analysisincludes scores, loadings, and scree plots that can be adjusted depending on scaling criteria. The utility of XCMS functionalities isdemonstrated through the metabolomic analysis of bacterial stress response and the comparison of lymphoblastic leukemia celllines.
XCMS Online1 is a cloud-based, mass spectrometry dataprocessing platform that was developed in response to
the growing need for user-friendly software to process complexuntargeted metabolomic results.2−4 Currently, XCMS Onlinehas more than 4500 registered users from 120 differentcountries. This web-based platform is an extension of theoriginal open-source R package XCMS that was released in2006.5 Several open-source programs including MetAlign,6
MZmine,7 MAVEN,8 MetaboAnalyst,9 and XCMS,5 as well ascommercial programs, such as Mass Profiler Pro (Agilent) andMetabolic Profiler (Bruker) have been successfully developedto facilitate metabolomic data processing. Each of thesesoftware tools has its own unique capabilities in supportingmetabolomic data storage, analysis, and annotation.10 How-ever, these programs do not allow for complete metabolomicdata processing from feature detection and profile alignment tofeature annotation and exploratory statistical analyses. Forexample, the web-based tools MetaboAnalyst and metaP-Server,11 which have been mainly developed for targeted
metabolomic data analysis,12 perform comprehensive statisticalevaluation of preprocessed metabolomic data, yet rely onexternal software to process the raw data.XCMS Online has been designed as a solution for the entire
untargeted metabolomic workflow ranging from the computa-tionally expensive raw data processing to direct metaboliteassignment through integration with the METLIN database.The platform has been recently upgraded with data streamingcapabilities to support high-throughput, cloud-based dataprocessing.13 By continuous improvement of the platform,we aim to facilitate the access and functional interpretation ofmetabolomic data by scientists with limited background inbioinformatics or statistics.Our new interactive XCMS Online platform integrates
univariate and multivariate data processing, metabolite feature
Received: February 24, 2014Accepted: June 16, 2014
Article
pubs.acs.org/ac
© XXXX American Chemical Society A dx.doi.org/10.1021/ac500734c | Anal. Chem. XXXX, XXX, XXX−XXX
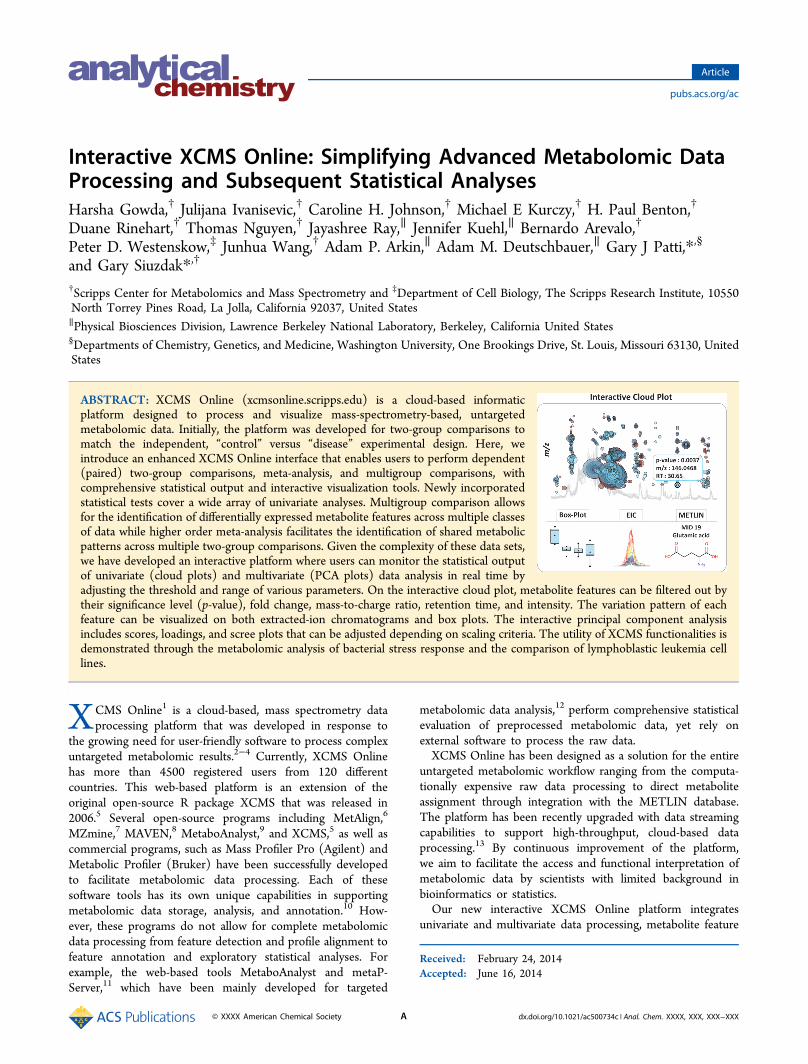
annotation, and metabolite identification. This easy-to-usegraphical interface has been significantly improved to supportthe statistical analysis of more complex experimental designs. Itnow performs two-group, multiple group, and meta-analysis(Figure 1), providing XCMS Online users with a compre-
hensive univariate and multivariate statistical report through aninteractive display. Novel interactive visualization tools,including two-group and multigroup cloud plots, principalcomponent analysis, and Venn and relational diagrams, havebeen developed to deconvolve metabolomic data, simplify dataanalysis, customize data output, and through integration withMETLIN, facilitate metabolite identification. The utility ofthese approaches is demonstrated on several different data setsthat fit the experimental design of two-group comparison, ofmeta-analysis, and of multigroup comparison (Figure 1).
■ EXPERIMENTAL SECTIONBacterial Cultures. Wild-type and five different mutants of
Desulfovibrio alaskensis G20 were cultured in Wall lactate-sulfate medium.14 The culture medium was supplemented with0.1% yeast extract. The bacteria were grown at 30 °C in ananaerobic growth chamber (Coy Laboratory Product, Inc.,Grass Lake, MI). For exposing bacteria to salt stress, thebacterial cells were washed in minimal media and grown inminimal media to mid log phase (OD = 0.4) at 30 °C. At midlog phase, sodium chloride was added to a final concentrationof 800 mM in the culture medium and the cells were culturedfor 1 h. The bacterial cells were collected by centrifugation(4000g for 5 min) and the cell pellets were snap frozen inliquid nitrogen and stored at −80 °C until the extraction.Cell Culture. Cell culture and biological reagents Ramos
(CRL-1596), Raji (CCL-86), and SUP-T1 (CRL-1942) celllines were obtained from American Type Culture Collection(ATCC, Manassas, VA, USA). Cell-culture conditions were asdescribed before.15
Human Blood Sampling. Human blood was sampledfrom 20 normal, healthy subjects (10 males and 10 females)recruited from the Normal Blood Donor Program and fromthe general population of The Scripps Research Instituteemployees. The samples were immediately transferred fromthe heparin syringe into labeled aliquot tubes and centrifugedat 4 °C at 2000 rpm for 20 min. Blood plasma was removedand frozen at −80 °C.
Metabolite Extraction. The metabolites were extractedfrom bacterial cell pellets (Desulfovibrio alaskensis G20) using aMeOH/ACN/H2O (2:2:1, v/v) solvent mixture. One milliliterof chilled solvent mixture was added to each bacterial pellet,vortexed for 30 s, and flash frozen in liquid nitrogen for 1 min.The samples were then allowed to thaw at room temperatureand sonicated in a water bath for 5 min. This cycle of cell lysisin liquid nitrogen combined with sonication was repeatedthree times. To precipitate proteins, the samples wereincubated for 1 h at −20 °C. The vials were centrifuged at4 °C for 15 min at 13 000 rpm. The supernatant was collectedand evaporated to dryness in a vacuum concentrator. The dryextracts were then reconstituted in 100 μL of ACN/H2O (1:1,v/v), sonicated for 1 min and centrifuged at 4 °C for 15 min at13 000 rpm. The supernatants were transferred to HPLC vialsand stored at −80 °C until LC/MS analysis.Cell extractions and analyses were performed as described
before.16 For normalization, the cells were counted using theGuava Viacount assay Millipore, Billerica, MA, USA) andplaced into 5 mL aliquots of 10 million cells per replicatebefore extraction, to ensure uniform cell numbers in eachreplicate.Human plasma samples (200 μL) were extracted using 800
μL of cold MeOH/ACN (1:1, v/v). Protein precipitation anddry extract reconstitution was performed as described abovefor bacteria pellets.
LC/MS Analysis. Metabolite extracts from bacteria andhuman blood plasma were analyzed on a 6538 Ultra HighDefinition QTOF mass spectrometer (Agilent Technologies)interfaced with a 1200 series HPLC system (AgilentTechnologies). Metabolite extracts from bacteria were analyzedby HILIC/MS in ESI negative mode. A Phenomenex LunaAminopropyl column (3 μm, 150 mm × 1.0 mm I.D.) wasused for LC separation of metabolites for HILIC/MS analysis.For HILIC, the mobile phase was composed of A = 10 mMammonium acetate and 10 mM ammonium hydroxide in 95%water and B = 95% acetonitrile (pH-9.7). The samples wereloaded onto the column using 100% B (0−5 min) at a flowrate of 50 μL/min and resolved using a linear gradient of 100%B to 100% A over a period of 50 min (5−55 min). A 10 minpost-run was applied for HILIC, to ensure column re-equilibration and maintain reproducibility.Lymphoma metabolomic profiling was performed by RPLC/
MS in ESI positive mode. Samples were analyzed by using aXBridge C18, 3.5 μm, 150 mm × 1.0 mm I.D. column(Waters) and the standard mobile phase, A = 0.1% formic acidin water and B = 0.1% formic acid in acetonitrile. A lineargradient elution from 100% A (0−5 min) to 100% B (50−55min) was applied.
Data Analysis. Data were analyzed by using interactiveXCMS Online, which is freely available at https://xcmsonline.scripps.edu. The web interface has been developed for two-group, meta-analysis, and multigroup analysis. It allows usersto either upload data sets using a java applet or selectpreuploaded data sets on XCMS Online. Following the upload
Figure 1. Scheme representing the experimental design of two-groupcomparison, meta-analysis, and multigroup analysis. Meta-analysis is ahigher-order analysis that aims to identify shared metabolic patternsamong multiple independent two-group comparisons. Shareddysregulated features are represented by the region at the center ofthe Venn diagram. In contrast, multigroup analysis aims to identifydifferences between groups and reveal the diversity of metabolicpatterns across different groups: wt, bacterial wild type; mut, bacterialmutant.
Analytical Chemistry Article
dx.doi.org/10.1021/ac500734c | Anal. Chem. XXXX, XXX, XXX−XXXB
of raw data files, users can select preset parameters (orcustomize them) depending on the instrument platform inwhich the data were acquired. The parameters are displayed inthe web browser using the jQuery-UI framework, with each taborganized by category. Users can define parameters forstatistical analysis (parametric/nonparametric, paired/un-paired) based on the type of experiment and data. The rawdata files are than processed for peak detection, retention-timecorrection, chromatogram alignment, metabolite featureannotation, statistical evaluation, and putative identificationthrough METLIN standard database matching. Metabolitefeatures are defined as ions with unique m/z and retention-time values.Parameter settings for XCMS processing of our demon-
stration data acquired by HILIC were as follows: centWave forfeature detection (Δ m/z = 15 ppm, minimum peak width =10 s, and maximum peak width = 120 s); obiwarp settings forretention-time correction (profStep = 1); and parameters forchromatogram alignment, including mzwid = 0.015, minfrac =0.5, and bw = 5. The relative quantification of metabolitefeatures was based on EIC (extracted ion chromatogram)areas. For XCMS processing of reversed-phase LC data, weused the same parameters except for chromatographic peakwidth settings, which was set as minimum peak width = 10 sand maximum peak width = 60 s. The results output, includingEICs, boxplots, cloud plots, Venn/Edwards diagrams and PCA,were exported directly from XCMS Online.
■ RESULTS AND DISCUSSIONThe XCMS Online platform was enhanced to implementpaired two-group comparisons, higher-order meta-analysis, andmultiple group comparisons. Additional statistical tests wereintroduced, and the interactive visualization tools (Figures2−7) were improved and developed to help deconvolvecomplex untargeted metabolomic data sets. The statistical testsare carried out systematically following feature detection andprofile alignment, providing users an interface to directlyvisualize differentially expressed or significantly alteredmetabolic features. Here we highlight the appropriate usageof different statistical tests and demonstrate the value ofinteractive, univariate (cloud plot), and multivariate (PCAplots) visualization tools for different experimental designs:two-group comparison, meta-analysis, and multigroup compar-ison.Two-Group Comparisons. The most common exper-
imental design in metabolomics is two-group analysis, where“disease” and “control” or “before” and “af ter” treatment groupsare compared. Even in a simple two-group experiment,choosing the right statistical test may be a challenging taskfor users without a background in the field of biostatistics.Depending on data distribution and experimental design,XCMS Online offers the choice of parametric or non-parametric, independent (unpaired) or dependent (paired)two-group tests (Table 1). Parametric tests are applied whenthe metabolomic data (peak area or intensity measurements)meet the assumption of normal distribution. When theseconditions are not satisfied, the nonparametric alternative testsshould be used as they do not rely on assumptions about theparameters of the data distribution.17 Parametric and non-parametric tests can be used to assess the independent(unpaired) and dependent (paired) sample groups. Theindependent or unpaired group tests are designed to comparemeans between two groups composed of different subjects
who were randomly selected (e.g., metabolic response in“disease” versus “healthy” individuals). In the case of pairedtests, the subjects in both groups are the same (or matchedpairs) and therefore the mean difference between two repeatedobservations (peak measurements) is compared (e.g., meta-bolic response before and after drug treatment). When thechoice of paired test is made, the XCMS Online interfaceprovides a separate dialogue-box where users can align thecorrect pairings by the “drag-n-drop” option.In general, two-group tests allow users to determine the
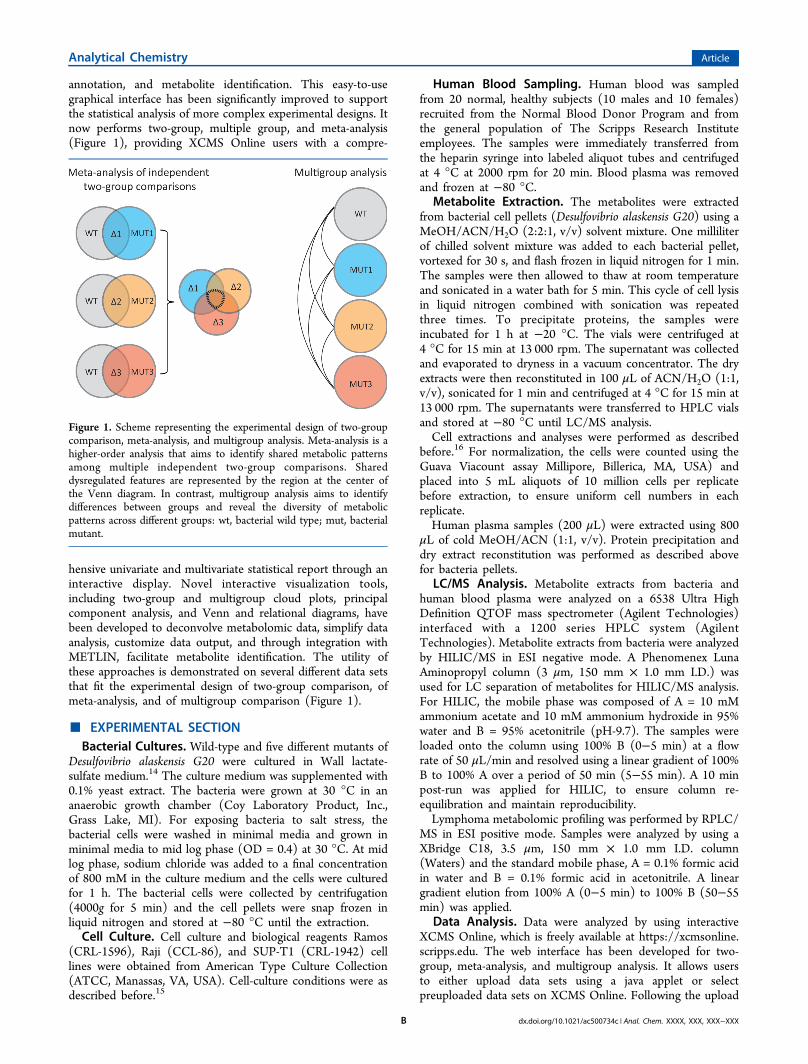
metabolite features whose levels are significantly differentbetween two defined conditions. The examples from tworepresentative metabolomic experiments are shown in Figure2. In the first example, Welch’s t test was used to evaluate themetabolic response in bacteria subjected to nitric oxide stressversus control grown in optimal conditions. Each comparedgroup had 5 independent biological replicates. Among themany identified changes, the metabolic feature with m/z171.005, putatively identified as glycerol-phosphate, was foundsignificantly down-regulated (p < 0.0001) in the stressedbacterial population (Figure 2a). The second exampledemonstrates the appropriate usage of a paired nonparametrictest or a Wilcoxon signed-rank test when comparing metabolicprofiles of arterial versus venous blood plasma from 20 humanindividuals. Each compared group had 20 subjects from whom
Figure 2. Representative examples of independent and dependent(paired) two-group experimental design. Extracted ion chromatogramand box-plot/paired plot are shown for the features of interest. (A) Asignificantly down-regulated (p < 0.001) metabolite feature (m/z171.005; METLIN MS/MS match, glycerol phosphate) in independ-ent group design (control versus stressed bacterial population) wasidentified by using an independent parametric Welch t test. Welch’s ttest is used to compare the means of two independent sample groupswith the assumption that two-group variances may differ. (B) Asignificantly higher level (p < 0.001) of metabolite feature (m/z309.279; METLIN hit, eicosenoic acid) in arterial blood plasma wasdetermined by a paired nonparametric Wilcoxon test. Wilcoxonsigned-rank test is a nonparametric alternative to the paired t testused to compare the related samples.
Analytical Chemistry Article
dx.doi.org/10.1021/ac500734c | Anal. Chem. XXXX, XXX, XXX−XXXC
arterial and venous bloods were sampled simultaneously.Among other subtle differences, the significantly higher (p =0.0002) abundance of the metabolite feature with m/z309.280, putatively identified as eicosenoic acid, has beenobserved in arterial blood, as shown by the paired plot (Figure2b).A typical untargeted metabolomic experiment comparing
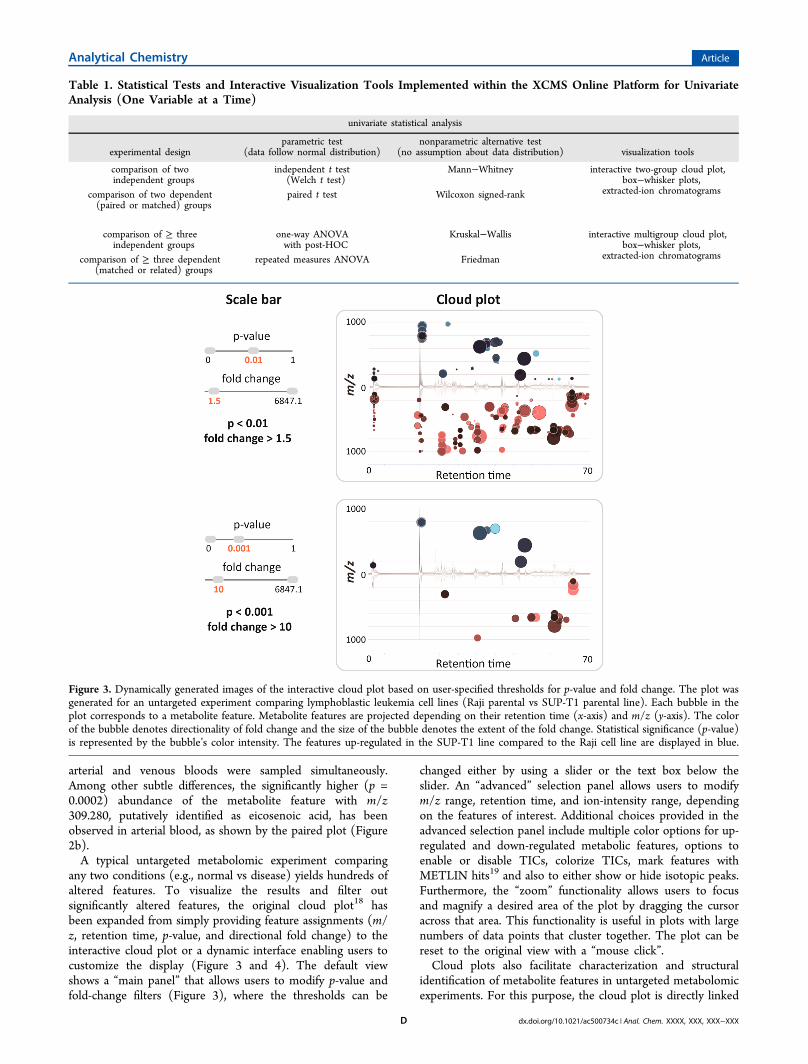
any two conditions (e.g., normal vs disease) yields hundreds ofaltered features. To visualize the results and filter outsignificantly altered features, the original cloud plot18 hasbeen expanded from simply providing feature assignments (m/z, retention time, p-value, and directional fold change) to theinteractive cloud plot or a dynamic interface enabling users tocustomize the display (Figure 3 and 4). The default viewshows a “main panel” that allows users to modify p-value andfold-change filters (Figure 3), where the thresholds can be
changed either by using a slider or the text box below theslider. An “advanced” selection panel allows users to modifym/z range, retention time, and ion-intensity range, dependingon the features of interest. Additional choices provided in theadvanced selection panel include multiple color options for up-regulated and down-regulated metabolic features, options toenable or disable TICs, colorize TICs, mark features withMETLIN hits19 and also to either show or hide isotopic peaks.Furthermore, the “zoom” functionality allows users to focusand magnify a desired area of the plot by dragging the cursoracross that area. This functionality is useful in plots with largenumbers of data points that cluster together. The plot can bereset to the original view with a “mouse click”.Cloud plots also facilitate characterization and structural
identification of metabolite features in untargeted metabolomicexperiments. For this purpose, the cloud plot is directly linked
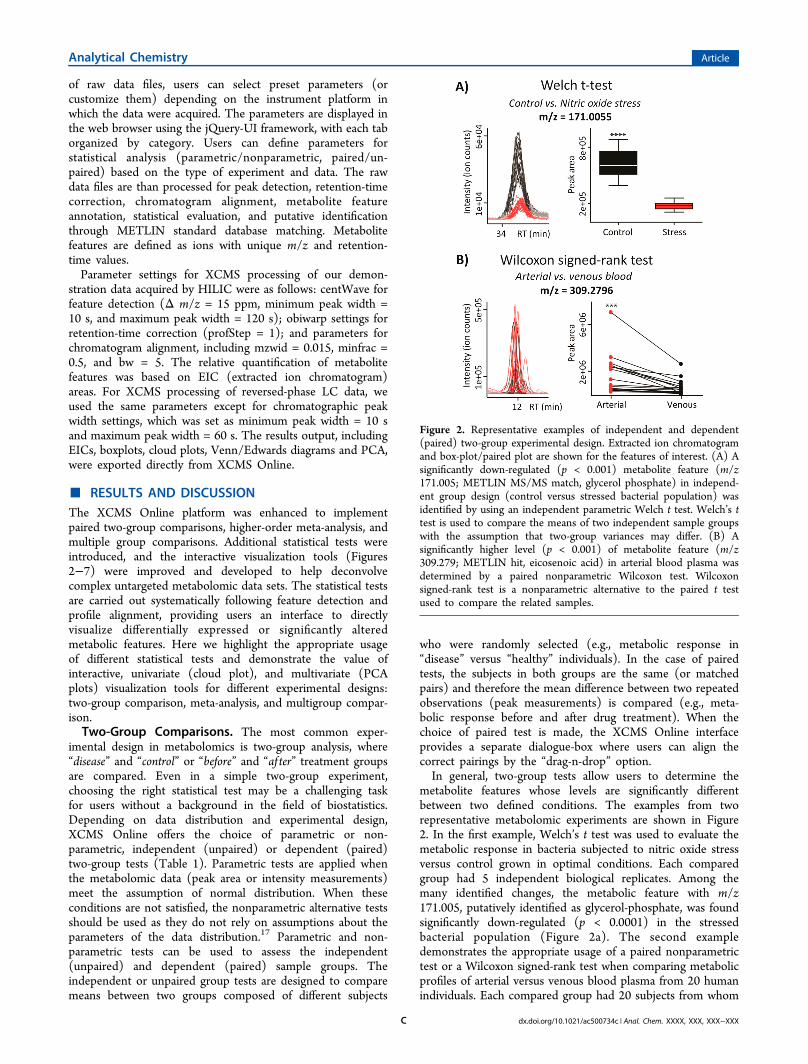
Table 1. Statistical Tests and Interactive Visualization Tools Implemented within the XCMS Online Platform for UnivariateAnalysis (One Variable at a Time)
univariate statistical analysis
experimental designparametric test
(data follow normal distribution)nonparametric alternative test
(no assumption about data distribution) visualization tools
comparison of twoindependent groups
independent t test(Welch t test)
Mann−Whitney interactive two-group cloud plot,box−whisker plots,
extracted-ion chromatogramscomparison of two dependent(paired or matched) groups
paired t test Wilcoxon signed-rank
comparison of ≥ threeindependent groups
one-way ANOVAwith post-HOC
Kruskal−Wallis interactive multigroup cloud plot,box−whisker plots,
extracted-ion chromatogramscomparison of ≥ three dependent(matched or related) groups
repeated measures ANOVA Friedman
Figure 3. Dynamically generated images of the interactive cloud plot based on user-specified thresholds for p-value and fold change. The plot wasgenerated for an untargeted experiment comparing lymphoblastic leukemia cell lines (Raji parental vs SUP-T1 parental line). Each bubble in theplot corresponds to a metabolite feature. Metabolite features are projected depending on their retention time (x-axis) and m/z (y-axis). The colorof the bubble denotes directionality of fold change and the size of the bubble denotes the extent of the fold change. Statistical significance (p-value)is represented by the bubble’s color intensity. The features up-regulated in the SUP-T1 line compared to the Raji cell line are displayed in blue.
Analytical Chemistry Article
dx.doi.org/10.1021/ac500734c | Anal. Chem. XXXX, XXX, XXX−XXXD
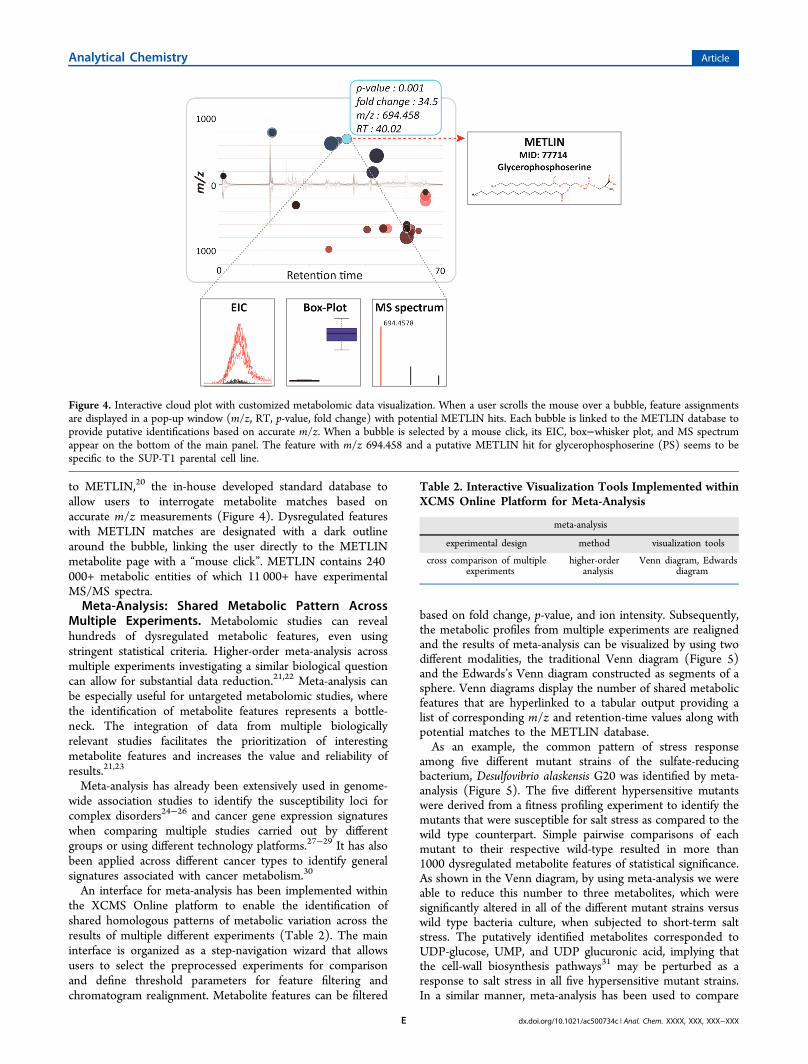
to METLIN,20 the in-house developed standard database toallow users to interrogate metabolite matches based onaccurate m/z measurements (Figure 4). Dysregulated featureswith METLIN matches are designated with a dark outlinearound the bubble, linking the user directly to the METLINmetabolite page with a “mouse click”. METLIN contains 240000+ metabolic entities of which 11 000+ have experimentalMS/MS spectra.Meta-Analysis: Shared Metabolic Pattern Across
Multiple Experiments. Metabolomic studies can revealhundreds of dysregulated metabolic features, even usingstringent statistical criteria. Higher-order meta-analysis acrossmultiple experiments investigating a similar biological questioncan allow for substantial data reduction.21,22 Meta-analysis canbe especially useful for untargeted metabolomic studies, wherethe identification of metabolite features represents a bottle-neck. The integration of data from multiple biologicallyrelevant studies facilitates the prioritization of interestingmetabolite features and increases the value and reliability ofresults.21,23
Meta-analysis has already been extensively used in genome-wide association studies to identify the susceptibility loci forcomplex disorders24−26 and cancer gene expression signatureswhen comparing multiple studies carried out by differentgroups or using different technology platforms.27−29 It has alsobeen applied across different cancer types to identify generalsignatures associated with cancer metabolism.30
An interface for meta-analysis has been implemented withinthe XCMS Online platform to enable the identification ofshared homologous patterns of metabolic variation across theresults of multiple different experiments (Table 2). The maininterface is organized as a step-navigation wizard that allowsusers to select the preprocessed experiments for comparisonand define threshold parameters for feature filtering andchromatogram realignment. Metabolite features can be filtered
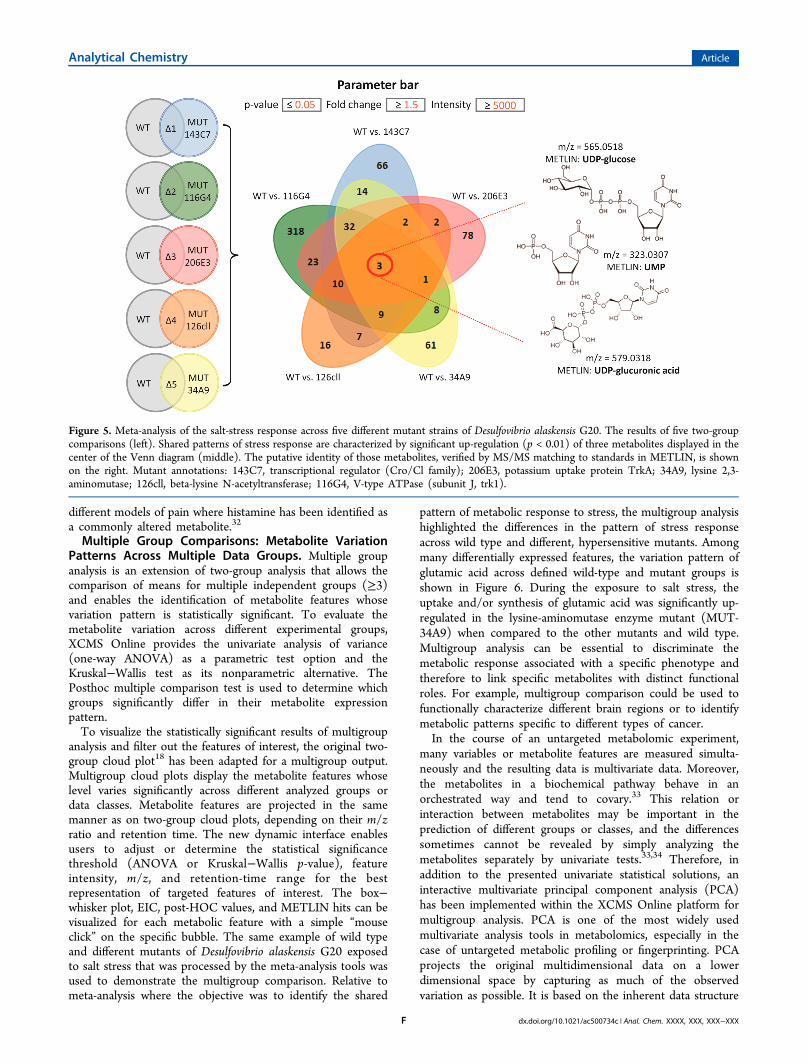
based on fold change, p-value, and ion intensity. Subsequently,the metabolic profiles from multiple experiments are realignedand the results of meta-analysis can be visualized by using twodifferent modalities, the traditional Venn diagram (Figure 5)and the Edwards’s Venn diagram constructed as segments of asphere. Venn diagrams display the number of shared metabolicfeatures that are hyperlinked to a tabular output providing alist of corresponding m/z and retention-time values along withpotential matches to the METLIN database.As an example, the common pattern of stress response
among five different mutant strains of the sulfate-reducingbacterium, Desulfovibrio alaskensis G20 was identified by meta-analysis (Figure 5). The five different hypersensitive mutantswere derived from a fitness profiling experiment to identify themutants that were susceptible for salt stress as compared to thewild type counterpart. Simple pairwise comparisons of eachmutant to their respective wild-type resulted in more than1000 dysregulated metabolite features of statistical significance.As shown in the Venn diagram, by using meta-analysis we wereable to reduce this number to three metabolites, which weresignificantly altered in all of the different mutant strains versuswild type bacteria culture, when subjected to short-term saltstress. The putatively identified metabolites corresponded toUDP-glucose, UMP, and UDP glucuronic acid, implying thatthe cell-wall biosynthesis pathways31 may be perturbed as aresponse to salt stress in all five hypersensitive mutant strains.In a similar manner, meta-analysis has been used to compare
Figure 4. Interactive cloud plot with customized metabolomic data visualization. When a user scrolls the mouse over a bubble, feature assignmentsare displayed in a pop-up window (m/z, RT, p-value, fold change) with potential METLIN hits. Each bubble is linked to the METLIN database toprovide putative identifications based on accurate m/z. When a bubble is selected by a mouse click, its EIC, box−whisker plot, and MS spectrumappear on the bottom of the main panel. The feature with m/z 694.458 and a putative METLIN hit for glycerophosphoserine (PS) seems to bespecific to the SUP-T1 parental cell line.
Table 2. Interactive Visualization Tools Implemented withinXCMS Online Platform for Meta-Analysis
meta-analysis
experimental design method visualization tools
cross comparison of multipleexperiments
higher-orderanalysis
Venn diagram, Edwardsdiagram
Analytical Chemistry Article
dx.doi.org/10.1021/ac500734c | Anal. Chem. XXXX, XXX, XXX−XXXE
different models of pain where histamine has been identified asa commonly altered metabolite.32
Multiple Group Comparisons: Metabolite VariationPatterns Across Multiple Data Groups. Multiple groupanalysis is an extension of two-group analysis that allows thecomparison of means for multiple independent groups (≥3)and enables the identification of metabolite features whosevariation pattern is statistically significant. To evaluate themetabolite variation across different experimental groups,XCMS Online provides the univariate analysis of variance(one-way ANOVA) as a parametric test option and theKruskal−Wallis test as its nonparametric alternative. ThePosthoc multiple comparison test is used to determine whichgroups significantly differ in their metabolite expressionpattern.To visualize the statistically significant results of multigroup
analysis and filter out the features of interest, the original two-group cloud plot18 has been adapted for a multigroup output.Multigroup cloud plots display the metabolite features whoselevel varies significantly across different analyzed groups ordata classes. Metabolite features are projected in the samemanner as on two-group cloud plots, depending on their m/zratio and retention time. The new dynamic interface enablesusers to adjust or determine the statistical significancethreshold (ANOVA or Kruskal−Wallis p-value), featureintensity, m/z, and retention-time range for the bestrepresentation of targeted features of interest. The box−whisker plot, EIC, post-HOC values, and METLIN hits can bevisualized for each metabolic feature with a simple “mouseclick” on the specific bubble. The same example of wild typeand different mutants of Desulfovibrio alaskensis G20 exposedto salt stress that was processed by the meta-analysis tools wasused to demonstrate the multigroup comparison. Relative tometa-analysis where the objective was to identify the shared
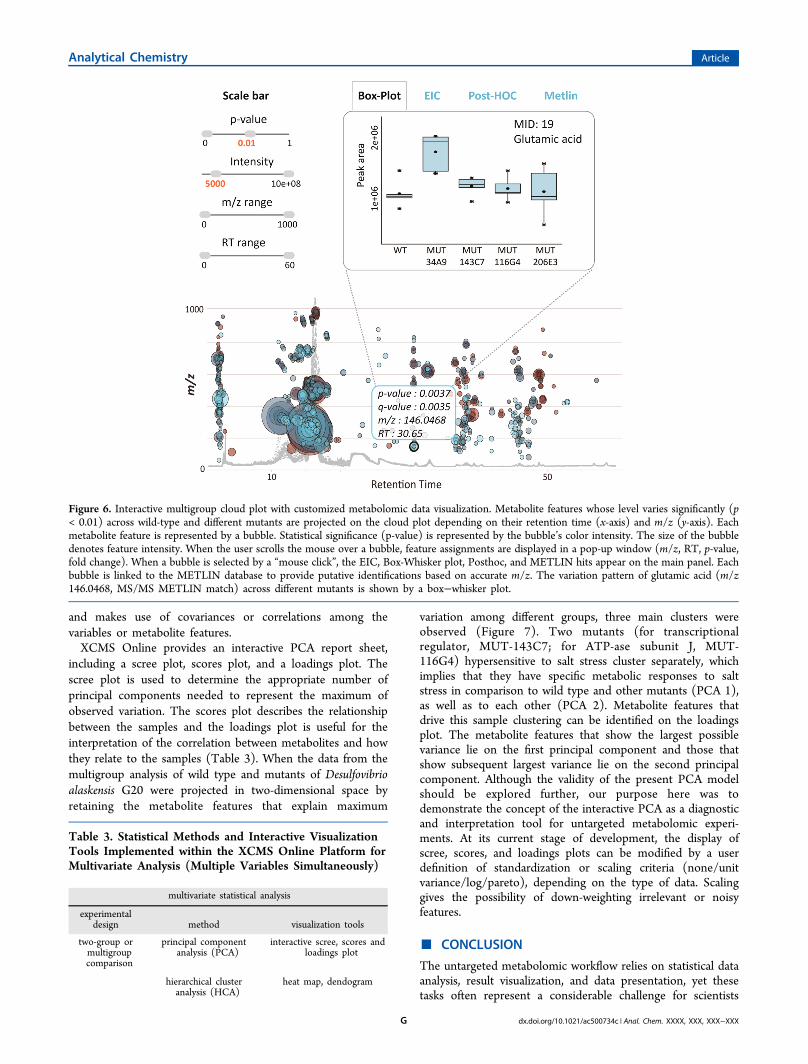
pattern of metabolic response to stress, the multigroup analysishighlighted the differences in the pattern of stress responseacross wild type and different, hypersensitive mutants. Amongmany differentially expressed features, the variation pattern ofglutamic acid across defined wild-type and mutant groups isshown in Figure 6. During the exposure to salt stress, theuptake and/or synthesis of glutamic acid was significantly up-regulated in the lysine-aminomutase enzyme mutant (MUT-34A9) when compared to the other mutants and wild type.Multigroup analysis can be essential to discriminate themetabolic response associated with a specific phenotype andtherefore to link specific metabolites with distinct functionalroles. For example, multigroup comparison could be used tofunctionally characterize different brain regions or to identifymetabolic patterns specific to different types of cancer.In the course of an untargeted metabolomic experiment,
many variables or metabolite features are measured simulta-neously and the resulting data is multivariate data. Moreover,the metabolites in a biochemical pathway behave in anorchestrated way and tend to covary.33 This relation orinteraction between metabolites may be important in theprediction of different groups or classes, and the differencessometimes cannot be revealed by simply analyzing themetabolites separately by univariate tests.33,34 Therefore, inaddition to the presented univariate statistical solutions, aninteractive multivariate principal component analysis (PCA)has been implemented within the XCMS Online platform formultigroup analysis. PCA is one of the most widely usedmultivariate analysis tools in metabolomics, especially in thecase of untargeted metabolic profiling or fingerprinting. PCAprojects the original multidimensional data on a lowerdimensional space by capturing as much of the observedvariation as possible. It is based on the inherent data structure
Figure 5. Meta-analysis of the salt-stress response across five different mutant strains of Desulfovibrio alaskensis G20. The results of five two-groupcomparisons (left). Shared patterns of stress response are characterized by significant up-regulation (p < 0.01) of three metabolites displayed in thecenter of the Venn diagram (middle). The putative identity of those metabolites, verified by MS/MS matching to standards in METLIN, is shownon the right. Mutant annotations: 143C7, transcriptional regulator (Cro/Cl family); 206E3, potassium uptake protein TrkA; 34A9, lysine 2,3-aminomutase; 126cll, beta-lysine N-acetyltransferase; 116G4, V-type ATPase (subunit J, trk1).
Analytical Chemistry Article
dx.doi.org/10.1021/ac500734c | Anal. Chem. XXXX, XXX, XXX−XXXF
and makes use of covariances or correlations among thevariables or metabolite features.XCMS Online provides an interactive PCA report sheet,
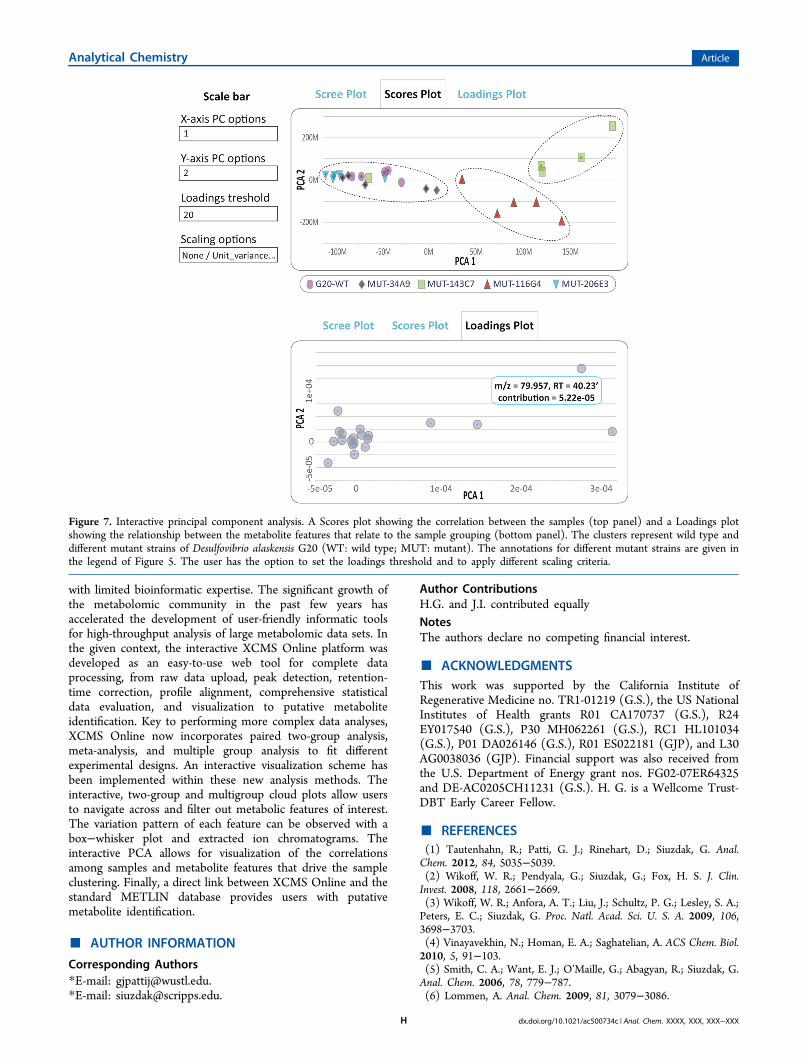
including a scree plot, scores plot, and a loadings plot. Thescree plot is used to determine the appropriate number ofprincipal components needed to represent the maximum ofobserved variation. The scores plot describes the relationshipbetween the samples and the loadings plot is useful for theinterpretation of the correlation between metabolites and howthey relate to the samples (Table 3). When the data from themultigroup analysis of wild type and mutants of Desulfovibrioalaskensis G20 were projected in two-dimensional space byretaining the metabolite features that explain maximum
variation among different groups, three main clusters wereobserved (Figure 7). Two mutants (for transcriptionalregulator, MUT-143C7; for ATP-ase subunit J, MUT-116G4) hypersensitive to salt stress cluster separately, whichimplies that they have specific metabolic responses to saltstress in comparison to wild type and other mutants (PCA 1),as well as to each other (PCA 2). Metabolite features thatdrive this sample clustering can be identified on the loadingsplot. The metabolite features that show the largest possiblevariance lie on the first principal component and those thatshow subsequent largest variance lie on the second principalcomponent. Although the validity of the present PCA modelshould be explored further, our purpose here was todemonstrate the concept of the interactive PCA as a diagnosticand interpretation tool for untargeted metabolomic experi-ments. At its current stage of development, the display ofscree, scores, and loadings plots can be modified by a userdefinition of standardization or scaling criteria (none/unitvariance/log/pareto), depending on the type of data. Scalinggives the possibility of down-weighting irrelevant or noisyfeatures.
■ CONCLUSION
The untargeted metabolomic workflow relies on statistical dataanalysis, result visualization, and data presentation, yet thesetasks often represent a considerable challenge for scientists
Figure 6. Interactive multigroup cloud plot with customized metabolomic data visualization. Metabolite features whose level varies significantly (p< 0.01) across wild-type and different mutants are projected on the cloud plot depending on their retention time (x-axis) and m/z (y-axis). Eachmetabolite feature is represented by a bubble. Statistical significance (p-value) is represented by the bubble’s color intensity. The size of the bubbledenotes feature intensity. When the user scrolls the mouse over a bubble, feature assignments are displayed in a pop-up window (m/z, RT, p-value,fold change). When a bubble is selected by a “mouse click”, the EIC, Box-Whisker plot, Posthoc, and METLIN hits appear on the main panel. Eachbubble is linked to the METLIN database to provide putative identifications based on accurate m/z. The variation pattern of glutamic acid (m/z146.0468, MS/MS METLIN match) across different mutants is shown by a box−whisker plot.
Table 3. Statistical Methods and Interactive VisualizationTools Implemented within the XCMS Online Platform forMultivariate Analysis (Multiple Variables Simultaneously)
multivariate statistical analysis
experimentaldesign method visualization tools
two-group ormultigroupcomparison
principal componentanalysis (PCA)
interactive scree, scores andloadings plot
hierarchical clusteranalysis (HCA)
heat map, dendogram
Analytical Chemistry Article
dx.doi.org/10.1021/ac500734c | Anal. Chem. XXXX, XXX, XXX−XXXG
with limited bioinformatic expertise. The significant growth ofthe metabolomic community in the past few years hasaccelerated the development of user-friendly informatic toolsfor high-throughput analysis of large metabolomic data sets. Inthe given context, the interactive XCMS Online platform wasdeveloped as an easy-to-use web tool for complete dataprocessing, from raw data upload, peak detection, retention-time correction, profile alignment, comprehensive statisticaldata evaluation, and visualization to putative metaboliteidentification. Key to performing more complex data analyses,XCMS Online now incorporates paired two-group analysis,meta-analysis, and multiple group analysis to fit differentexperimental designs. An interactive visualization scheme hasbeen implemented within these new analysis methods. Theinteractive, two-group and multigroup cloud plots allow usersto navigate across and filter out metabolic features of interest.The variation pattern of each feature can be observed with abox−whisker plot and extracted ion chromatograms. Theinteractive PCA allows for visualization of the correlationsamong samples and metabolite features that drive the sampleclustering. Finally, a direct link between XCMS Online and thestandard METLIN database provides users with putativemetabolite identification.
■ AUTHOR INFORMATION
Corresponding Authors*E-mail: [email protected].*E-mail: [email protected].
Author ContributionsH.G. and J.I. contributed equallyNotesThe authors declare no competing financial interest.
■ ACKNOWLEDGMENTSThis work was supported by the California Institute ofRegenerative Medicine no. TR1-01219 (G.S.), the US NationalInstitutes of Health grants R01 CA170737 (G.S.), R24EY017540 (G.S.), P30 MH062261 (G.S.), RC1 HL101034(G.S.), P01 DA026146 (G.S.), R01 ES022181 (GJP), and L30AG0038036 (GJP). Financial support was also received fromthe U.S. Department of Energy grant nos. FG02-07ER64325and DE-AC0205CH11231 (G.S.). H. G. is a Wellcome Trust-DBT Early Career Fellow.
■ REFERENCES(1) Tautenhahn, R.; Patti, G. J.; Rinehart, D.; Siuzdak, G. Anal.Chem. 2012, 84, 5035−5039.(2) Wikoff, W. R.; Pendyala, G.; Siuzdak, G.; Fox, H. S. J. Clin.Invest. 2008, 118, 2661−2669.(3) Wikoff, W. R.; Anfora, A. T.; Liu, J.; Schultz, P. G.; Lesley, S. A.;Peters, E. C.; Siuzdak, G. Proc. Natl. Acad. Sci. U. S. A. 2009, 106,3698−3703.(4) Vinayavekhin, N.; Homan, E. A.; Saghatelian, A. ACS Chem. Biol.2010, 5, 91−103.(5) Smith, C. A.; Want, E. J.; O’Maille, G.; Abagyan, R.; Siuzdak, G.Anal. Chem. 2006, 78, 779−787.(6) Lommen, A. Anal. Chem. 2009, 81, 3079−3086.
Figure 7. Interactive principal component analysis. A Scores plot showing the correlation between the samples (top panel) and a Loadings plotshowing the relationship between the metabolite features that relate to the sample grouping (bottom panel). The clusters represent wild type anddifferent mutant strains of Desulfovibrio alaskensis G20 (WT: wild type; MUT: mutant). The annotations for different mutant strains are given inthe legend of Figure 5. The user has the option to set the loadings threshold and to apply different scaling criteria.
Analytical Chemistry Article
dx.doi.org/10.1021/ac500734c | Anal. Chem. XXXX, XXX, XXX−XXXH
(7) Pluskal, T.; Castillo, S.; Villar-Briones, A.; Oresic, M. BMCBioinf. 2010, 11, 395.(8) Melamud, E.; Vastag, L.; Rabinowitz, J. D. Anal. Chem. 2010, 82,9818−9826.(9) Xia, J.; Mandal, R.; Sinelnikov, I. V.; Broadhurst, D.; Wishart, D.S. Nucleic Acids Res. 2012, 40, W127−133.(10) Niemela, P. S.; Castillo, S.; Sysi-Aho, M.; Oresic, M. J.Chromatogr. B Analyt. Technol. Biomed. Life. Sci. 2009, 877, 2855−2862.(11) Kastenmuller, G.; Romisch-Margl, W.; Wagele, B.; Altmaier, E.;Suhre, K. J. Biomed. Biotechnol. 2011, 2011.(12) Xia, J.; Wishart, D. S. Curr. Protoc Bioinformatics. 2011, Chapter14, Unit 14 10.(13) Rinehart, D.; Johnson, C. H.; Nguyen, T.; Ivanisevic, J.;Benton, H. P.; Lloyd, J.; Deutschbauer, A.; Arkin, A.; Patti, G. J.;Siuzdak, G. Nat. Biotechnol. 2014, In Press.(14) Keller, K. L.; Bender, K. S.; Wall, J. D. Appl. Environ. Microbiol.2009, 75, 7682−7691.(15) Ivanisevic, J.; Zhu, Z. J.; Plate, L.; Tautenhahn, R.; Chen, S.;O’Brien, P. J.; Johnson, C. H.; Marletta, M. A.; Patti, G. J.; Siuzdak, G.Anal. Chem. 2013, 85, 6876−6884.(16) Johnson, C. H.; Fisher, T. S.; Hoang, L. T.; Felding, B. H.;Siuzdak, G.; O’Brien, P. J. Metabolomics 2014, DOI: 10.1007/s11306-014-0622-5.(17) Vinaixa, M.; Samino, S.; Saez, I.; Duran, J.; Guinovart, J. J.;Yanes, O. Metabolites 2012, 2, 775−795.(18) Patti, G. J.; Tautenhahn, R.; Rinehart, D.; Cho, K.; Shriver, L.P.; Manchester, M.; Nikolskiy, I.; Johnson, C. H.; Mahieu, N. G.;Siuzdak, G. Anal. Chem. 2013, 85, 798−804.(19) Tautenhahn, R.; Cho, K.; Uritboonthai, W.; Zhu, Z.; Patti, G.J.; Siuzdak, G. Nat. Biotechnol. 2012, 30, 826−828.(20) Smith, C. A.; O’Maille, G.; Want, E. J.; Qin, C.; Trauger, S. A.;Brandon, T. R.; Custodio, D. E.; Abagyan, R.; Siuzdak, G. Ther. DrugMonit. 2005, 27, 747−751.(21) Patti, G. J.; Tautenhahn, R.; Johannsen, D.; Kalisiak, E.;Ravussin, E.; Bruning, J. C.; Dillin, A.; Siuzdak, G. Metabolomics 2014,DOI: 10.1007/s11306-013-0608-8.(22) Patti, G. J.; Tautenhahn, R.; Siuzdak, G. Nat. Protoc. 2012, 7,508−516.(23) Kaever, A.; Landesfeind, M.; Feussner, K.; Morgenstern, B.;Feussner, I.; Meinicke, P. PLoS One 2014, 9, No. e89297.(24) Chung, C. C.; Kanetsky, P. A.; Wang, Z.; Hildebrandt, M. A.;Koster, R.; Skotheim, R. I.; Kratz, C. P.; Turnbull, C.; Cortessis, V. K.;Bakken, A. C.; Bishop, D. T.; Cook, M. B.; Erickson, R. L.; Fossa, S.D.; Jacobs, K. B.; Korde, L. A.; Kraggerud, S. M.; Lothe, R. A.; Loud,J. T.; Rahman, N.; Skinner, E. C.; Thomas, D. C.; Wu, X.; Yeager, M.;Schumacher, F. R.; Greene, M. H.; Schwartz, S. M.; McGlynn, K. A.;Chanock, S. J.; Nathanson, K. L. Nat. Genet. 2013, 45, 680−685.(25) Hinds, D. A.; McMahon, G.; Kiefer, A. K.; Do, C. B.; Eriksson,N.; Evans, D. M.; Pourcain, B., St; Ring, S. M.; Mountain, J. L.;Francke, U.; Davey-Smith, G.; Timpson, N. J.; Tung, J. Y. Nat. Genet.2013, 45, 907−911.(26) Barrett, J. C.; Clayton, D. G.; Concannon, P.; Akolkar, B.;Cooper, J. D.; Erlich, H. A.; Julier, C.; Morahan, G.; Nerup, J.;Nierras, C.; Plagnol, V.; Pociot, F.; Schuilenburg, H.; Smyth, D. J.;Stevens, H.; Todd, J. A.; Walker, N. M.; Rich, S. S. Nat. Genet. 2009,41, 703−707.(27) Mehra, R.; Varambally, S.; Ding, L.; Shen, R.; Sabel, M. S.;Ghosh, D.; Chinnaiyan, A. M.; Kleer, C. G. Cancer Res. 2005, 65,11259−11264.(28) Chen, X.; Liang, S.; Zheng, W.; Liao, Z.; Shang, T.; Ma, W.BMC Genomics 2008, 9, 322.(29) Griffith, O. L.; Melck, A.; Jones, S. J.; Wiseman, S. M. J. Clin.Oncol. 2006, 24, 5043−5051.(30) Rhodes, D. R.; Yu, J.; Shanker, K.; Deshpande, N.; Varambally,R.; Ghosh, D.; Barrette, T.; Pandey, A.; Chinnaiyan, A. M. Proc. Natl.Acad. Sci. U. S. A. 2004, 101, 9309−9314.(31) Anderson, R. G.; Hussey, H.; Baddiley, J. Biochem. J. 1972, 127,11−25.
(32) Tautenhahn, R.; Patti, G. J.; Kalisiak, E.; Miyamoto, T.;Schmidt, M.; Lo, F. Y.; McBee, J.; Baliga, N. S.; Siuzdak, G. Anal.Chem. 2011, 83, 696−700.(33) Worley, B.; Powers, R. Curr. Metabolomics 2014, 1, 92−107.(34) Saccenti, E.; Hoefsloot, H. C. J.; Smilde, A. K.; Westerhuis, J.A.; Hendriks, M. M. W. B. Metabolomics 2014, 10, 361−374.
Analytical Chemistry Article
dx.doi.org/10.1021/ac500734c | Anal. Chem. XXXX, XXX, XXX−XXXI