Embed Size (px)
Citation preview
Research ArticleBionic Design for Reducing Adhesive Resistance of the RidgerInspired by a Boar’s Head
Jianqiao Li,1 Yunpeng Yan,1 Benard Chirende,2 Xuejiao Wu,1 Zhaoliang Wang,1 andMeng Zou1
1Key Laboratory for Bionics Engineering of Education Ministry, Jilin University, Changchun 130022, China2University of Mpumalanga, Private Bag X11283, Mbombela 1200, South Africa
Correspondence should be addressed to Meng Zou; [email protected]
Received 18 July 2016; Revised 3 April 2017; Accepted 30 April 2017; Published 3 July 2017
Academic Editor: Andrea Cereatti
Copyright © 2017 Jianqiao Li et al. This is an open access article distributed under the Creative Commons Attribution License,which permits unrestricted use, distribution, and reproduction in any medium, provided the original work is properly cited.
The main feature of the boar’s head used to root around for food is the front part, which is similar to the ridger in terms of function,load, and environment. In this paper, the boar’s head was selected as the biological prototype for developing a new ridger. The pointcloud of the head was captured by a 3D scanner, and then, the head surface was reconstructed using 3D coordinates. Thecharacteristic curves of the front part of the boar’s head were extracted, and then, five cross-sectional curves and one verticalsection curve were fitted. Based on the fitted curves, five kinds of bionic ridgers were designed. The penetrating resistances ofthe bionic ridgers and traditional ridger were tested at different speeds in an indoor soil bin. The test results showed that bionicridger B had the best penetrating resistance reduction ratio of 16.67% at 4.2 km/h velocity. In order to further evaluate theperformance of the best bionic ridger (bionic ridger B), both the bionic ridger and traditional ridger were tested in a field underthe same working conditions. The field results indicate that the bionic ridger reduces penetrating resistance by 6.91% comparedto the traditional ridger, and the test results validate that the bionic ridger has an effect on reducing penetrating resistance.
1. Introduction
Tillage is an agricultural land preparation process bymechanical means such as digging, stirring, and overturningthe soil [1]. Tillage examples include ploughing, rototilling,rolling with cultipackers or other rollers, harrowing, ridging,and cultivating with cultivator shanks [2]. It is negativelyaffected by soil adhesion which exists widely in all kinds oftillage machines during wet conditions. Soil adhesionincreases ridging resistance and power consumption by morethan 30% and 30%~50%, respectively, and decreases seedemergence rate of seeding machines by 5%~10% [3, 4]. Soiladhesion is therefore regarded as a significant problem affect-ing field performance of tillage machinery. Scholars aretherefore devoted to the study of the theory and mechanismof reducing soil adhesion effectively and further explore themethods of penetrating resistance [5].
In order to reduce the energy consumption generated bytillage resistance [6], several methods of reducing soil-tool
adhesion have been reported, such as heat treatment, lubrica-tion between the tool and soil, use of different materials andcoatings, vibrations, electromagnetic field applications [7],optimization of the tool geometry and operational conditions[8–10], designing of a reversible plough or ridger [11], anddesign modifications of a bionic surface [12].
Soil animals have a better function of reducing adhesiondue to their long evolution period and can move freelywith very little soil adhesion even under wet soil conditions[12, 13]. By means of bionics, scholars can study all kinds ofbiological prototypes with the function of reducing adhesionand resistance in nature, conduct bionic research, and explorethe excellent functions of reducing adhesion [3]. This pos-sesses important practical significance and broad applicationprospects in reducing adhesion of agricultural machinery.
A ridger is one of the most important soil-engagingcomponents on agricultural implements such as a combinedtillage machine, soil preparation ridging machine, and fertil-izer applicator, applied widespreadly in both primary and
HindawiApplied Bionics and BiomechanicsVolume 2017, Article ID 8315972, 10 pageshttps://doi.org/10.1155/2017/8315972
secondary tillages [14, 15]. This paper takes a ridger as thestudy object leading to the designing of a low-resistanceridger according to principles of bionics. The biological pro-totype (boar’s head) is scanned, and its feature parametersare extracted so that characteristic curves are produced forthe purpose of designing and manufacturing bionic ridgers.These bionic and traditional ridgers are first tested in a soilbin and then further evaluated under actual field conditions.
2. Biological Prototype
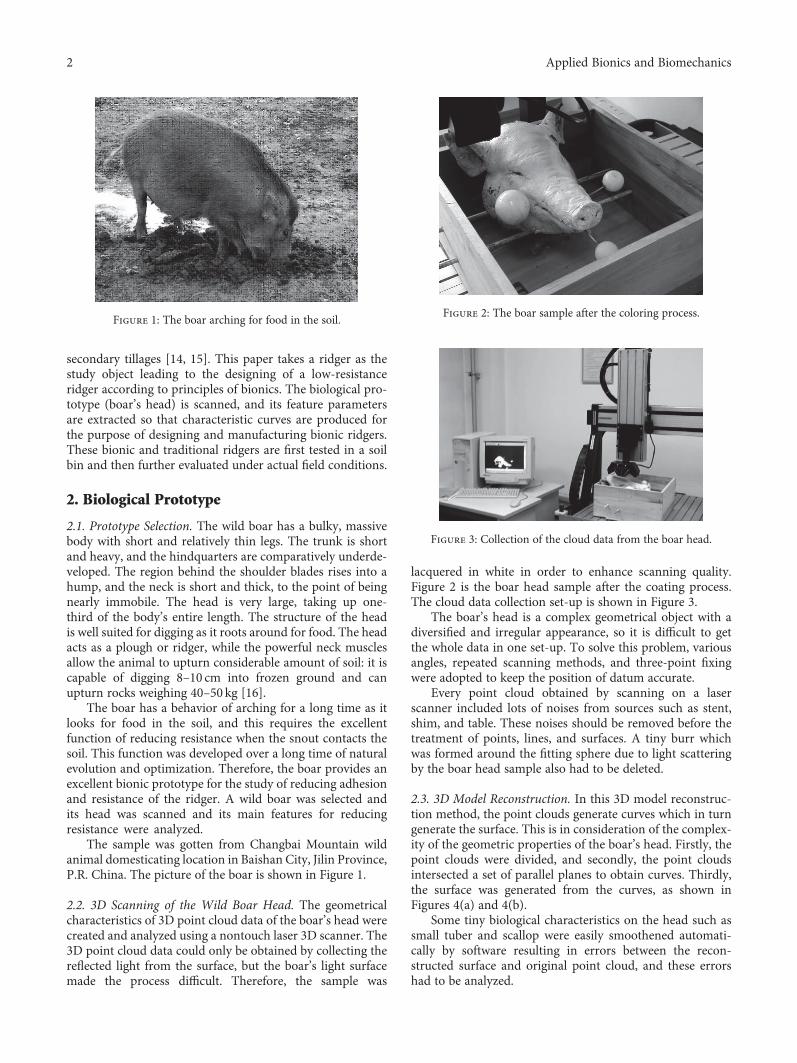
2.1. Prototype Selection. The wild boar has a bulky, massivebody with short and relatively thin legs. The trunk is shortand heavy, and the hindquarters are comparatively underde-veloped. The region behind the shoulder blades rises into ahump, and the neck is short and thick, to the point of beingnearly immobile. The head is very large, taking up one-third of the body’s entire length. The structure of the headis well suited for digging as it roots around for food. The headacts as a plough or ridger, while the powerful neck musclesallow the animal to upturn considerable amount of soil: it iscapable of digging 8–10 cm into frozen ground and canupturn rocks weighing 40–50 kg [16].
The boar has a behavior of arching for a long time as itlooks for food in the soil, and this requires the excellentfunction of reducing resistance when the snout contacts thesoil. This function was developed over a long time of naturalevolution and optimization. Therefore, the boar provides anexcellent bionic prototype for the study of reducing adhesionand resistance of the ridger. A wild boar was selected andits head was scanned and its main features for reducingresistance were analyzed.
The sample was gotten from Changbai Mountain wildanimal domesticating location in Baishan City, Jilin Province,P.R. China. The picture of the boar is shown in Figure 1.
2.2. 3D Scanning of the Wild Boar Head. The geometricalcharacteristics of 3D point cloud data of the boar’s head werecreated and analyzed using a nontouch laser 3D scanner. The3D point cloud data could only be obtained by collecting thereflected light from the surface, but the boar’s light surfacemade the process difficult. Therefore, the sample was
lacquered in white in order to enhance scanning quality.Figure 2 is the boar head sample after the coating process.The cloud data collection set-up is shown in Figure 3.
The boar’s head is a complex geometrical object with adiversified and irregular appearance, so it is difficult to getthe whole data in one set-up. To solve this problem, variousangles, repeated scanning methods, and three-point fixingwere adopted to keep the position of datum accurate.
Every point cloud obtained by scanning on a laserscanner included lots of noises from sources such as stent,shim, and table. These noises should be removed before thetreatment of points, lines, and surfaces. A tiny burr whichwas formed around the fitting sphere due to light scatteringby the boar head sample also had to be deleted.
2.3. 3D Model Reconstruction. In this 3D model reconstruc-tion method, the point clouds generate curves which in turngenerate the surface. This is in consideration of the complex-ity of the geometric properties of the boar’s head. Firstly, thepoint clouds were divided, and secondly, the point cloudsintersected a set of parallel planes to obtain curves. Thirdly,the surface was generated from the curves, as shown inFigures 4(a) and 4(b).
Some tiny biological characteristics on the head such assmall tuber and scallop were easily smoothened automati-cally by software resulting in errors between the recon-structed surface and original point cloud, and these errorshad to be analyzed.
Figure 1: The boar arching for food in the soil.Figure 2: The boar sample after the coloring process.
Figure 3: Collection of the cloud data from the boar head.
2 Applied Bionics and Biomechanics
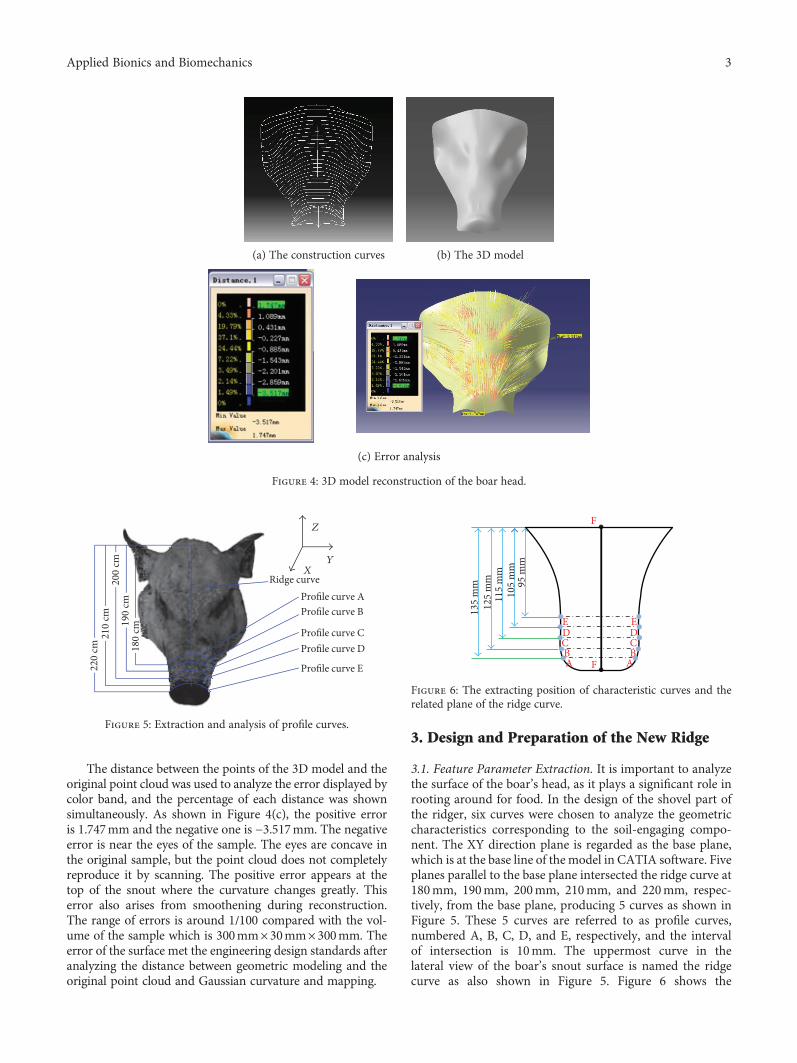
The distance between the points of the 3D model and theoriginal point cloud was used to analyze the error displayed bycolor band, and the percentage of each distance was shownsimultaneously. As shown in Figure 4(c), the positive erroris 1.747mm and the negative one is −3.517mm. The negativeerror is near the eyes of the sample. The eyes are concave inthe original sample, but the point cloud does not completelyreproduce it by scanning. The positive error appears at thetop of the snout where the curvature changes greatly. Thiserror also arises from smoothening during reconstruction.The range of errors is around 1/100 compared with the vol-ume of the sample which is 300mm×30mm×300mm. Theerror of the surface met the engineering design standards afteranalyzing the distance between geometric modeling and theoriginal point cloud and Gaussian curvature and mapping.
3. Design and Preparation of the New Ridge
3.1. Feature Parameter Extraction. It is important to analyzethe surface of the boar’s head, as it plays a significant role inrooting around for food. In the design of the shovel part ofthe ridger, six curves were chosen to analyze the geometriccharacteristics corresponding to the soil-engaging compo-nent. The XY direction plane is regarded as the base plane,which is at the base line of the model in CATIA software. Fiveplanes parallel to the base plane intersected the ridge curve at180mm, 190mm, 200mm, 210mm, and 220mm, respec-tively, from the base plane, producing 5 curves as shown inFigure 5. These 5 curves are referred to as profile curves,numbered A, B, C, D, and E, respectively, and the intervalof intersection is 10mm. The uppermost curve in thelateral view of the boar’s snout surface is named the ridgecurve as also shown in Figure 5. Figure 6 shows the
(a) The construction curves (b) The 3D model
(c) Error analysis
Figure 4: 3D model reconstruction of the boar head.
Ridge curvePro�le curve APro�le curve B
Pro�le curve CPro�le curve D
Pro�le curve E
XY
Z
220
cm 180
cm19
0 cm
200
cm21
0 cm
Figure 5: Extraction and analysis of profile curves.
A A
E E
C CB B
D D
95 m
m10
5 m
m11
5 m
m12
5 m
m13
5 m
m
F
F
Figure 6: The extracting position of characteristic curves and therelated plane of the ridge curve.
3Applied Bionics and Biomechanics
extracting position of 5 profile curves and the ridge curveon the boar’s snout.
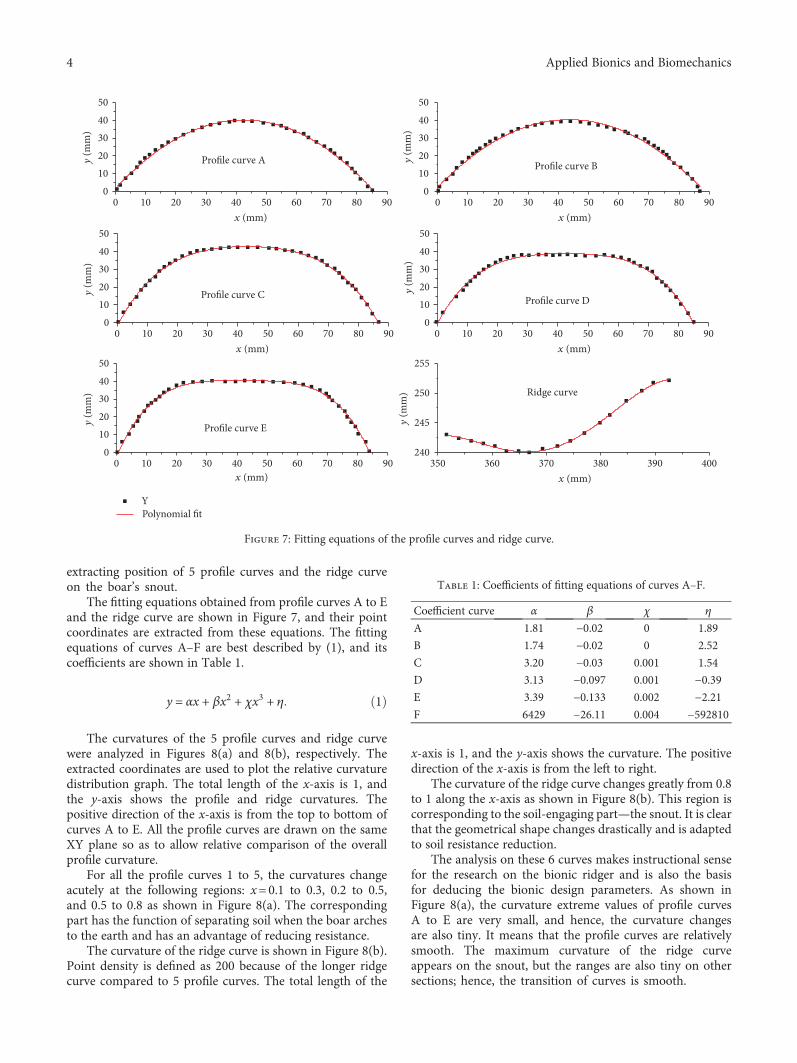
The fitting equations obtained from profile curves A to Eand the ridge curve are shown in Figure 7, and their pointcoordinates are extracted from these equations. The fittingequations of curves A–F are best described by (1), and itscoefficients are shown in Table 1.
y = αx + βx2 + χx3 + η 1
The curvatures of the 5 profile curves and ridge curvewere analyzed in Figures 8(a) and 8(b), respectively. Theextracted coordinates are used to plot the relative curvaturedistribution graph. The total length of the x-axis is 1, andthe y-axis shows the profile and ridge curvatures. Thepositive direction of the x-axis is from the top to bottom ofcurves A to E. All the profile curves are drawn on the sameXY plane so as to allow relative comparison of the overallprofile curvature.
For all the profile curves 1 to 5, the curvatures changeacutely at the following regions: x=0.1 to 0.3, 0.2 to 0.5,and 0.5 to 0.8 as shown in Figure 8(a). The correspondingpart has the function of separating soil when the boar archesto the earth and has an advantage of reducing resistance.
The curvature of the ridge curve is shown in Figure 8(b).Point density is defined as 200 because of the longer ridgecurve compared to 5 profile curves. The total length of the
x-axis is 1, and the y-axis shows the curvature. The positivedirection of the x-axis is from the left to right.
The curvature of the ridge curve changes greatly from 0.8to 1 along the x-axis as shown in Figure 8(b). This region iscorresponding to the soil-engaging part—the snout. It is clearthat the geometrical shape changes drastically and is adaptedto soil resistance reduction.
The analysis on these 6 curves makes instructional sensefor the research on the bionic ridger and is also the basisfor deducing the bionic design parameters. As shown inFigure 8(a), the curvature extreme values of profile curvesA to E are very small, and hence, the curvature changesare also tiny. It means that the profile curves are relativelysmooth. The maximum curvature of the ridge curveappears on the snout, but the ranges are also tiny on othersections; hence, the transition of curves is smooth.
0 10 20 30 40 50 60 70 80 900
1020304050
0 10 20 30 40 50 60 70 80 900
1020304050
0 10 20 30 40 50 60 70 80 900
1020304050
0 10 20 30 40 50 60 70 80 900
1020304050
0 10 20 30 40 50 60 70 80 900
1020304050
350 360 370 380 390 400240
245
250
255
YPolynomial �t
y (m
m)
x (mm)
y (m
m)
x (mm)
y (m
m)
x (mm)
y (m
m)
x (mm)
y (m
m)
x (mm)
y (m
m)
x (mm)
Pro�le curve A Pro�le curve B
Pro�le curve C Pro�le curve D
Pro�le curve E
Ridge curve
Figure 7: Fitting equations of the profile curves and ridge curve.
Table 1: Coefficients of fitting equations of curves A–F.
Coefficient curve α β χ η
A 1.81 −0.02 0 1.89
B 1.74 −0.02 0 2.52
C 3.20 −0.03 0.001 1.54
D 3.13 −0.097 0.001 −0.39E 3.39 −0.133 0.002 −2.21F 6429 −26.11 0.004 −592810
4 Applied Bionics and Biomechanics
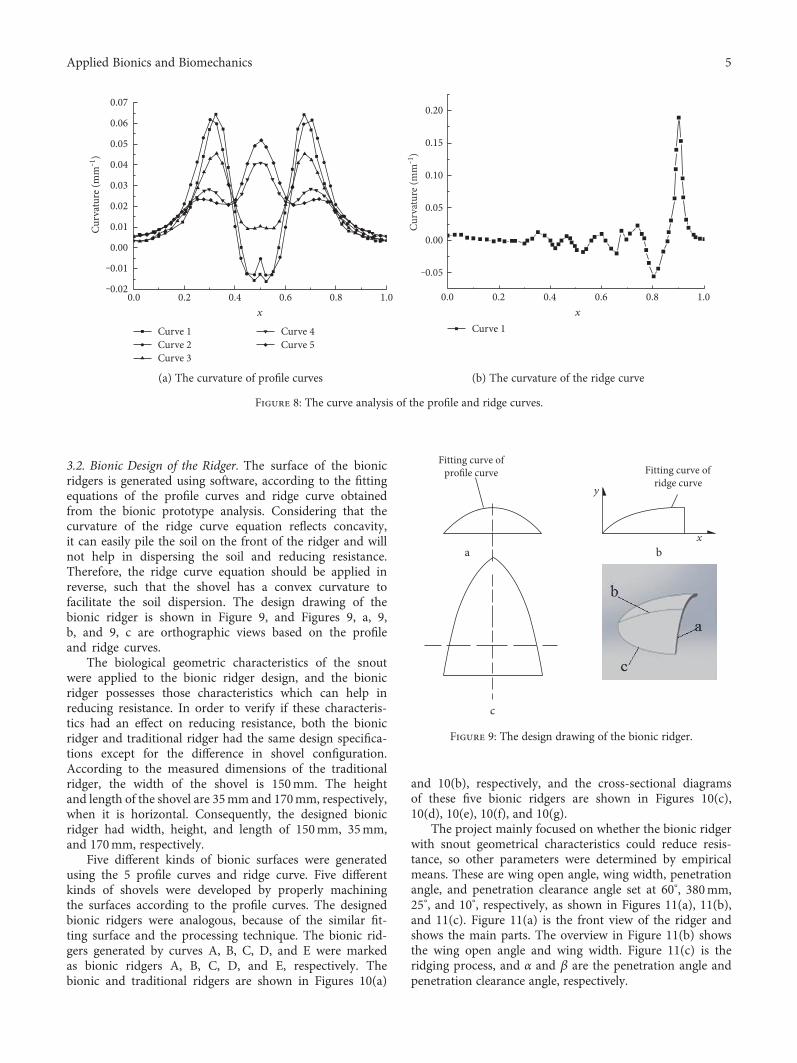
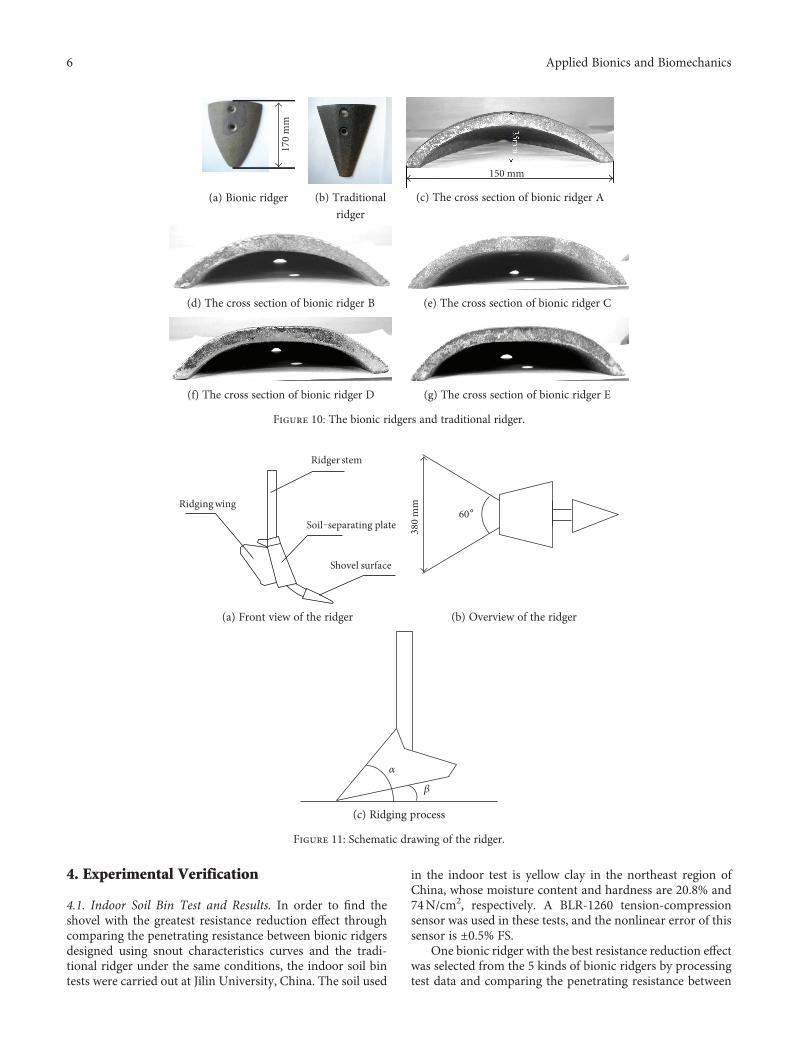
3.2. Bionic Design of the Ridger. The surface of the bionicridgers is generated using software, according to the fittingequations of the profile curves and ridge curve obtainedfrom the bionic prototype analysis. Considering that thecurvature of the ridge curve equation reflects concavity,it can easily pile the soil on the front of the ridger and willnot help in dispersing the soil and reducing resistance.Therefore, the ridge curve equation should be applied inreverse, such that the shovel has a convex curvature tofacilitate the soil dispersion. The design drawing of thebionic ridger is shown in Figure 9, and Figures 9, a, 9,b, and 9, c are orthographic views based on the profileand ridge curves.
The biological geometric characteristics of the snoutwere applied to the bionic ridger design, and the bionicridger possesses those characteristics which can help inreducing resistance. In order to verify if these characteris-tics had an effect on reducing resistance, both the bionicridger and traditional ridger had the same design specifica-tions except for the difference in shovel configuration.According to the measured dimensions of the traditionalridger, the width of the shovel is 150mm. The heightand length of the shovel are 35mm and 170mm, respectively,when it is horizontal. Consequently, the designed bionicridger had width, height, and length of 150mm, 35mm,and 170mm, respectively.
Five different kinds of bionic surfaces were generatedusing the 5 profile curves and ridge curve. Five differentkinds of shovels were developed by properly machiningthe surfaces according to the profile curves. The designedbionic ridgers were analogous, because of the similar fit-ting surface and the processing technique. The bionic rid-gers generated by curves A, B, C, D, and E were markedas bionic ridgers A, B, C, D, and E, respectively. Thebionic and traditional ridgers are shown in Figures 10(a)
and 10(b), respectively, and the cross-sectional diagramsof these five bionic ridgers are shown in Figures 10(c),10(d), 10(e), 10(f), and 10(g).
The project mainly focused on whether the bionic ridgerwith snout geometrical characteristics could reduce resis-tance, so other parameters were determined by empiricalmeans. These are wing open angle, wing width, penetrationangle, and penetration clearance angle set at 60°, 380mm,25°, and 10°, respectively, as shown in Figures 11(a), 11(b),and 11(c). Figure 11(a) is the front view of the ridger andshows the main parts. The overview in Figure 11(b) showsthe wing open angle and wing width. Figure 11(c) is theridging process, and α and β are the penetration angle andpenetration clearance angle, respectively.
0.0 0.2 0.4 0.6 0.8 1.0‒0.02
‒0.01
0.00
0.01
0.02
0.03
0.04
0.05
0.06
0.07
x
Curv
atur
e (m
m‒1
)
Curve 1Curve 2Curve 3
Curve 4Curve 5
(a) The curvature of profile curves
0.0 0.2 0.4 0.6 0.8 1.0
‒0.05
0.00
0.05
0.10
0.15
0.20
Curv
atur
e (m
m‒1
)
x
Curve 1
(b) The curvature of the ridge curve
Figure 8: The curve analysis of the profile and ridge curves.
Fitting curve of pro�le curve Fitting curve of
ridge curve
a b
y
x
c
Figure 9: The design drawing of the bionic ridger.
5Applied Bionics and Biomechanics
4. Experimental Verification
4.1. Indoor Soil Bin Test and Results. In order to find theshovel with the greatest resistance reduction effect throughcomparing the penetrating resistance between bionic ridgersdesigned using snout characteristics curves and the tradi-tional ridger under the same conditions, the indoor soil bintests were carried out at Jilin University, China. The soil used
in the indoor test is yellow clay in the northeast region ofChina, whose moisture content and hardness are 20.8% and74N/cm2, respectively. A BLR-1260 tension-compressionsensor was used in these tests, and the nonlinear error of thissensor is ±0.5% FS.
One bionic ridger with the best resistance reduction effectwas selected from the 5 kinds of bionic ridgers by processingtest data and comparing the penetrating resistance between
170
mm
(a) Bionic ridger (b) Traditional
ridger
150 mm
(c) The cross section of bionic ridger A
(d) The cross section of bionic ridger B (e) The cross section of bionic ridger C
(f) The cross section of bionic ridger D (g) The cross section of bionic ridger E
Figure 10: The bionic ridgers and traditional ridger.
Soil‒separating plate
Ridger stem
Ridging wing
Shovel surface
(a) Front view of the ridger
60°
380
mm
(b) Overview of the ridger
𝛼
𝛽
(c) Ridging process
Figure 11: Schematic drawing of the ridger.
6 Applied Bionics and Biomechanics
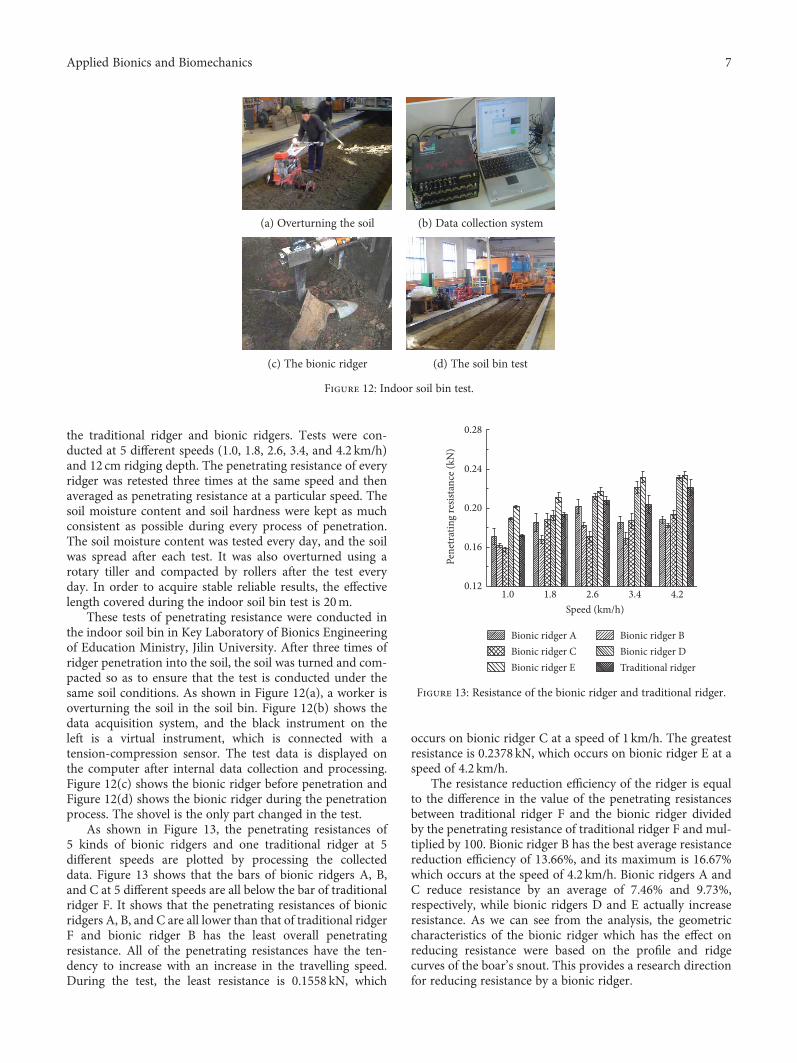
the traditional ridger and bionic ridgers. Tests were con-ducted at 5 different speeds (1.0, 1.8, 2.6, 3.4, and 4.2 km/h)and 12 cm ridging depth. The penetrating resistance of everyridger was retested three times at the same speed and thenaveraged as penetrating resistance at a particular speed. Thesoil moisture content and soil hardness were kept as muchconsistent as possible during every process of penetration.The soil moisture content was tested every day, and the soilwas spread after each test. It was also overturned using arotary tiller and compacted by rollers after the test everyday. In order to acquire stable reliable results, the effectivelength covered during the indoor soil bin test is 20m.
These tests of penetrating resistance were conducted inthe indoor soil bin in Key Laboratory of Bionics Engineeringof Education Ministry, Jilin University. After three times ofridger penetration into the soil, the soil was turned and com-pacted so as to ensure that the test is conducted under thesame soil conditions. As shown in Figure 12(a), a worker isoverturning the soil in the soil bin. Figure 12(b) shows thedata acquisition system, and the black instrument on theleft is a virtual instrument, which is connected with atension-compression sensor. The test data is displayed onthe computer after internal data collection and processing.Figure 12(c) shows the bionic ridger before penetration andFigure 12(d) shows the bionic ridger during the penetrationprocess. The shovel is the only part changed in the test.
As shown in Figure 13, the penetrating resistances of5 kinds of bionic ridgers and one traditional ridger at 5different speeds are plotted by processing the collecteddata. Figure 13 shows that the bars of bionic ridgers A, B,and C at 5 different speeds are all below the bar of traditionalridger F. It shows that the penetrating resistances of bionicridgers A, B, and C are all lower than that of traditional ridgerF and bionic ridger B has the least overall penetratingresistance. All of the penetrating resistances have the ten-dency to increase with an increase in the travelling speed.During the test, the least resistance is 0.1558 kN, which
occurs on bionic ridger C at a speed of 1 km/h. The greatestresistance is 0.2378 kN, which occurs on bionic ridger E at aspeed of 4.2 km/h.
The resistance reduction efficiency of the ridger is equalto the difference in the value of the penetrating resistancesbetween traditional ridger F and the bionic ridger dividedby the penetrating resistance of traditional ridger F and mul-tiplied by 100. Bionic ridger B has the best average resistancereduction efficiency of 13.66%, and its maximum is 16.67%which occurs at the speed of 4.2 km/h. Bionic ridgers A andC reduce resistance by an average of 7.46% and 9.73%,respectively, while bionic ridgers D and E actually increaseresistance. As we can see from the analysis, the geometriccharacteristics of the bionic ridger which has the effect onreducing resistance were based on the profile and ridgecurves of the boar’s snout. This provides a research directionfor reducing resistance by a bionic ridger.
(a) Overturning the soil (b) Data collection system
(c) The bionic ridger (d) The soil bin test
Figure 12: Indoor soil bin test.
0.12
0.16
0.20
0.24
0.28
Pene
trat
ing
resis
tanc
e (kN
)
1.0 1.8 2.6 3.4 4.2Speed (km/h)
Bionic ridger A Bionic ridger BBionic ridger C Bionic ridger DBionic ridger E Traditional ridger
Figure 13: Resistance of the bionic ridger and traditional ridger.
7Applied Bionics and Biomechanics
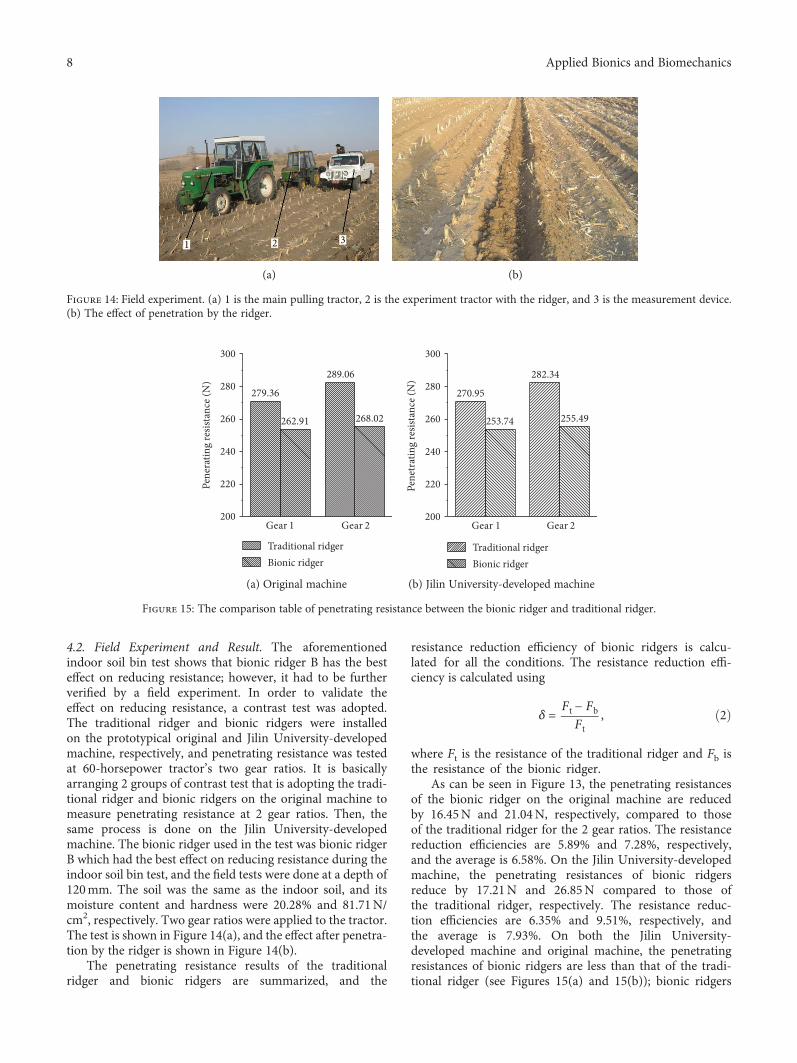
4.2. Field Experiment and Result. The aforementionedindoor soil bin test shows that bionic ridger B has the besteffect on reducing resistance; however, it had to be furtherverified by a field experiment. In order to validate theeffect on reducing resistance, a contrast test was adopted.The traditional ridger and bionic ridgers were installedon the prototypical original and Jilin University-developedmachine, respectively, and penetrating resistance was testedat 60-horsepower tractor’s two gear ratios. It is basicallyarranging 2 groups of contrast test that is adopting the tradi-tional ridger and bionic ridgers on the original machine tomeasure penetrating resistance at 2 gear ratios. Then, thesame process is done on the Jilin University-developedmachine. The bionic ridger used in the test was bionic ridgerB which had the best effect on reducing resistance during theindoor soil bin test, and the field tests were done at a depth of120mm. The soil was the same as the indoor soil, and itsmoisture content and hardness were 20.28% and 81.71N/cm2, respectively. Two gear ratios were applied to the tractor.The test is shown in Figure 14(a), and the effect after penetra-tion by the ridger is shown in Figure 14(b).
The penetrating resistance results of the traditionalridger and bionic ridgers are summarized, and the
resistance reduction efficiency of bionic ridgers is calcu-lated for all the conditions. The resistance reduction effi-ciency is calculated using
δ = Ft − FbFt
, 2
where Ft is the resistance of the traditional ridger and Fb isthe resistance of the bionic ridger.
As can be seen in Figure 13, the penetrating resistancesof the bionic ridger on the original machine are reducedby 16.45N and 21.04N, respectively, compared to thoseof the traditional ridger for the 2 gear ratios. The resistancereduction efficiencies are 5.89% and 7.28%, respectively,and the average is 6.58%. On the Jilin University-developedmachine, the penetrating resistances of bionic ridgersreduce by 17.21N and 26.85N compared to those ofthe traditional ridger, respectively. The resistance reduc-tion efficiencies are 6.35% and 9.51%, respectively, andthe average is 7.93%. On both the Jilin University-developed machine and original machine, the penetratingresistances of bionic ridgers are less than that of the tradi-tional ridger (see Figures 15(a) and 15(b)); bionic ridgers
1 2 3
(a) (b)
Figure 14: Field experiment. (a) 1 is the main pulling tractor, 2 is the experiment tractor with the ridger, and 3 is the measurement device.(b) The effect of penetration by the ridger.
200
220
240
260
280
300
Pene
ratin
g re
sista
nce (
N)
Traditional ridgerBionic ridger
Gear 2Gear 1
279.36
262.91
289.06
268.02
(a) Original machine
Traditional ridgerBionic ridger
200
220
240
260
280
300
Pene
trat
ing
resis
tanc
e (N
)
Gear 1 Gear 2
270.95
253.74
282.34
255.49
(b) Jilin University-developed machine
Figure 15: The comparison table of penetrating resistance between the bionic ridger and traditional ridger.
8 Applied Bionics and Biomechanics
reduced resistance by 6.91% compared to the traditionalridger, and it validates that bionic ridger B had an effect onreducing resistance.
4.3. Discussion. The traditional methods of reducingadhesion and resistance are divided into the followingkinds: aeration or liquid-filled method, thermal desorptionmethod, vibration method, electroosmotic method, mechan-ical method, and surface modification method. Experimentindicates that the average resistance is reduced by 16% byinjecting polymer solution in a concentration of 3% intothe upper surface of the plow board. The resistances arereduced by 8%–12% and 2.5%–3.5% in water culture and indry farming, respectively, through building “comet throughhole” on the plow’s surface. The plow named “bulge 20” isdeveloped by changing the material, the size and dimensionsof bulges, and the body surface of the plow, and resistance isreduced by 15%–18% compared with that of the homoge-nous plow. And the resistance of the bionic ridge used in thisexperiment is reduced by 16.67%.
It is quite difficult to study reducing adhesion and resis-tance because of the variety of soil touching parts of a terrainmachine, variability of sticky soil, complexity of adhesioninterface, and randomness of an adhesion process. A classicaltheory and traditional method are limited by many factors, sowe have to seek solutions in an up-to-date thought. Underthe biological principles named the survival of the fittest,the creatures in nature possess the function of desorptionand drag reduction during a long-drawn evolution. Theadhesion and resistance in a terrain machine are solved bylearning self-adaption of soil animals. In this paper, charac-teristic curves on the wild boar are extracted to design ridgersand ridging resistance is reduced effectively. However, it isdifficult to manufacture bionic ridgers and it cannot loosenthe soil very well.
5. Conclusions
(1) The geometrical characteristics of 3D point clouddata of the boar’s head were created and analyzedby a nontouch laser 3D scanner. After 3D modelreconstruction, the maximum errors on positivedirection and negative direction were 1.747mmand −3.517mm, respectively, and the range oferrors is around 1/100 compared with the volumeof the sample which is 300mm× 30mm× 300mm.
(2) Five profile curves and the ridge curve were chosen ascharacteristic curves corresponding to the soil-engaging section on the boar’s head, and six fittingcurves were obtained. Five kinds of bionic ridgerswere then designed according to the six characteristiccurves at the soil-engaging section of the boar’s head.
(3) The soil bin tests show that bionic ridgers have aneffect on reducing resistance, and bionic ridger Bhas the highest average resistance reduction effi-ciency, which is 13.66%. The bionic ridgers A and Creduce resistances by 7.46% and 9.73%, respectively.
The resistance reduction efficiency of bionic ridgerB is 16.67% when the travelling speed is 4.2 km/h.
(4) The field experiment shows that the penetratingresistance of bionic ridgers is less than that of the tra-ditional ridger. Overall, bionic ridgers reduce resis-tance by 6.91% compared to the traditional ridger.
Disclosure
An earlier version of this work has been presented as anabstract at the 5th International Conference of BionicEngineering.
Conflicts of Interest
The authors declare that they have no conflicts of interest.
Acknowledgments
The present work was supported by the National NaturalScience Foundation of China (Grant no. 51405191 andno. 51305159) and the Science Fund of Key Laboratoryfor Bionics Engineering of Education Ministry (Grantno. K201005).
References
[1] S. Gebregziabher, A. M. Mouazen, H. V. Brussel, H. Ramon,J. Nyssen, and H. Verplancke, “Animal drawn tillage, theEthiopian ard plough, maresha: a review,” Soil and TillageResearch, vol. 89, pp. 129–143, 2006.
[2] J. P. Mitchell, L. M. Carter, D. C. Reicosky, A. Shrestha, andG. S. Pettygrove, “A history of tillage in California’s CentralValley,” Soil and Tillage Research, vol. 157, pp. 52–64, 2016.
[3] L. Q. Ren, J. Tong, and J. Q. Li, “Soil adhesion and biomimeticsof soil-engaging components: a review,” Journal of Agricul-tural Engineering Research, vol. 79, no. 3, pp. 239–263, 2009.
[4] L. Q. Ren, Z. W. Han, J. Q. Li, and J. Tong, “Experimentalinvestigation of bionic rough curved soil cutting blade surfaceto reduce soil adhesion and friction,” Soil and Tillage Research,vol. 85, pp. 1–12, 2006.
[5] L. Q. Ren, “Bionic research on anti-adhesion and anti-resistance of terrain machine,” Journal of Science China:Technological Sciences, vol. 9, pp. 1353–1364, 2008.
[6] P. Soni, V. M. Salokhe, and H. Nakashima, “Modification of amouldboard plough surface using arrays of polyethyleneprotuberances,” Journal of Terramechanics, vol. 44, pp. 411–422, 2007.
[7] V. M. Salokhe and P. Soni, “Physics of soil-tool adhesion: areview of principles involved in reducing adhesive forces,” inBook Review of Current Problems in Agrophysics, G. Jozefaciuk,C. Slawinski and R. T. Walczak, Eds., pp. 83–117, Institute ofAgrophysics PAS, Lublin, Poland, 2005.
[8] A. Ibrahmi, H. Bentaher, E. Hamza, A. Maalej, and A. M.Mouazen, “Study the effect of tool geometry and operationalconditions on mouldboard plough forces and energyrequirement: part 2. Experimental validation with soil bintest,” Computers and Electronics in Agriculture, vol. 117,pp. 268–275, 2015.
9Applied Bionics and Biomechanics
[9] E. Mckyes and J. Maswaure, “Effect of design parameters offlat tillage tools on loosening of a clay soil,” Soil and TillageResearch, vol. 43, pp. 195–204, 1997.
[10] Y. You, D. Wang, and J. Liu, “A device for mechanicalremediation of degraded grasslands,” Soil and Tillage Research,vol. 118, pp. 1–10, 2012.
[11] G. Gebresenbet, E. Zerbini, A. Astatke, and P. Kaumbutho,“Optimization of animal drawn tillage implements systems:part 2, development of a reversible plough and a ridger,”Journal of Agricultural Engineering Research, vol. 67, no. 4,pp. 299–310, 1997.
[12] L. Q. Ren, Y. P. Wang, and J. Q. Li, “Flexible unsmoothedcuticles of soil animals and their characteristics of reducingadhesion and resistance,” Chinese Science Bulletin, vol. 43,no. 2, pp. 166–169, 1998.
[13] Q. Cong, L. Q. Ren, and B. C. Chen, “Using characteristics ofburrowing animals to reduce soil-tool adhesion,” Transac-tions-American Society of Agricultural Engineers, vol. 42,no. 6, pp. 1549–1556, 1999.
[14] L. Xu, M. X. Lin, J. Q. Li, Z. L. Wang, and B. Chirende, “Three-dimensional geometrical modelling of wild boar head byreverse engineering technology,” Journal of Bionic Engineering,vol. 5, no. 1, pp. 85–90, 2008.
[15] A. N. Postolache, M. M. Ciobanu, and P. C. Boișteanu,“Selected biometric characteristics of wild boar (Sus scrofaFerus) in North-East Romania,” Food Science and Technology,vol. 72, no. 1, pp. 137-138, 2015.
[16] S. B. Erika, J. András, and B. Károly, “Measurement on thebody size of the wild boar in game farms,” Scientific Papers-Animal Science Series: Lucrări Ştiinţifice - Seria Zootehnie,vol. 63, pp. 3–8, 2015.
10 Applied Bionics and Biomechanics

RoboticsJournal of
Hindawi Publishing Corporationhttp://www.hindawi.com Volume 2014
Hindawi Publishing Corporationhttp://www.hindawi.com Volume 2014
Active and Passive Electronic Components
Control Scienceand Engineering
Journal of
Hindawi Publishing Corporationhttp://www.hindawi.com Volume 2014
International Journal of
RotatingMachinery
Hindawi Publishing Corporationhttp://www.hindawi.com Volume 2014
Hindawi Publishing Corporation http://www.hindawi.com
Journal of
Volume 201
Submit your manuscripts athttps://www.hindawi.com
VLSI Design
Hindawi Publishing Corporationhttp://www.hindawi.com Volume 201
Hindawi Publishing Corporationhttp://www.hindawi.com Volume 2014
Shock and Vibration
Hindawi Publishing Corporationhttp://www.hindawi.com Volume 2014
Civil EngineeringAdvances in
Acoustics and VibrationAdvances in
Hindawi Publishing Corporationhttp://www.hindawi.com Volume 2014
Hindawi Publishing Corporationhttp://www.hindawi.com Volume 2014
Electrical and Computer Engineering
Journal of
Advances inOptoElectronics
Hindawi Publishing Corporation http://www.hindawi.com
Volume 2014
The Scientific World JournalHindawi Publishing Corporation http://www.hindawi.com Volume 2014
SensorsJournal of
Hindawi Publishing Corporationhttp://www.hindawi.com Volume 2014
Modelling & Simulation in EngineeringHindawi Publishing Corporation http://www.hindawi.com Volume 2014
Hindawi Publishing Corporationhttp://www.hindawi.com Volume 2014
Chemical EngineeringInternational Journal of Antennas and
Propagation
International Journal of
Hindawi Publishing Corporationhttp://www.hindawi.com Volume 2014
Hindawi Publishing Corporationhttp://www.hindawi.com Volume 2014
Navigation and Observation
International Journal of
Hindawi Publishing Corporationhttp://www.hindawi.com Volume 2014
DistributedSensor Networks
International Journal of