Embed Size (px)
Citation preview
Biostatistics_Global CR Summit_Berlin 20 Oct 2016
“Global Clinical Trials Innovation Summit”
Berlin 20-21 October 2016
Berlin, 20 October 2016
Dr. Aamir Shaikh Founder, Assansa
BIOSTATISTICS – A FEW ESSENTIALS:
USE AND APPLICATION IN CLINICAL RESEARCH
Biostatistics_Global CR Summit_Berlin 20 Oct 2016
Here We Are Then, Day 1 – Early Morning Topic – Biostatistics In Clinical Research
Welcome!
Biostatistics
In Clinical Research…

Biostatistics_Global CR Summit_Berlin 20 Oct 2016
Session Outline
A Few Essentials - To Begin With...
Use And Application In Clinical Research
Planning And Design
Analysis And Inference
From Clinical Research To Clinical Practice
Recommended Reading / Resource
Biostatistics_Global CR Summit_Berlin 20 Oct 2016
Session Outline
A Few Essentials - To Begin With...
Use And Application In Clinical Research
Planning And Design
Analysis And Inference
From Clinical Research To Clinical Practice
Recommended Reading / Resource
Biostatistics_Global CR Summit_Berlin 20 Oct 2016
To Begin With… Statistics In Perspective
“There are three kinds of lies: lies, damned lies, and statistics – Benjamin Disraraeli
Statistical thinking will one day be as necessary for efficient citizenship as the ability to read and write – H G Wells
How to Lie with Statistics – Huff 1954/1993
Biostatistics_Global CR Summit_Berlin 20 Oct 2016
What Is Medical / Biostatistics?
Statistics - The art and science of collecting, presenting, analyzing, and interpreting data Medicine - A “science of uncertainty” Medical Research is a quest for truth. In biomedical research, truth is probabilistic
Medical / Biostatistics is largely about handling and quantifying variation and uncertainty in living (medical/biological) systems……in order to make appropriate inferences (decisions) with some level of confidence
Biostatistics_Global CR Summit_Berlin 20 Oct 2016
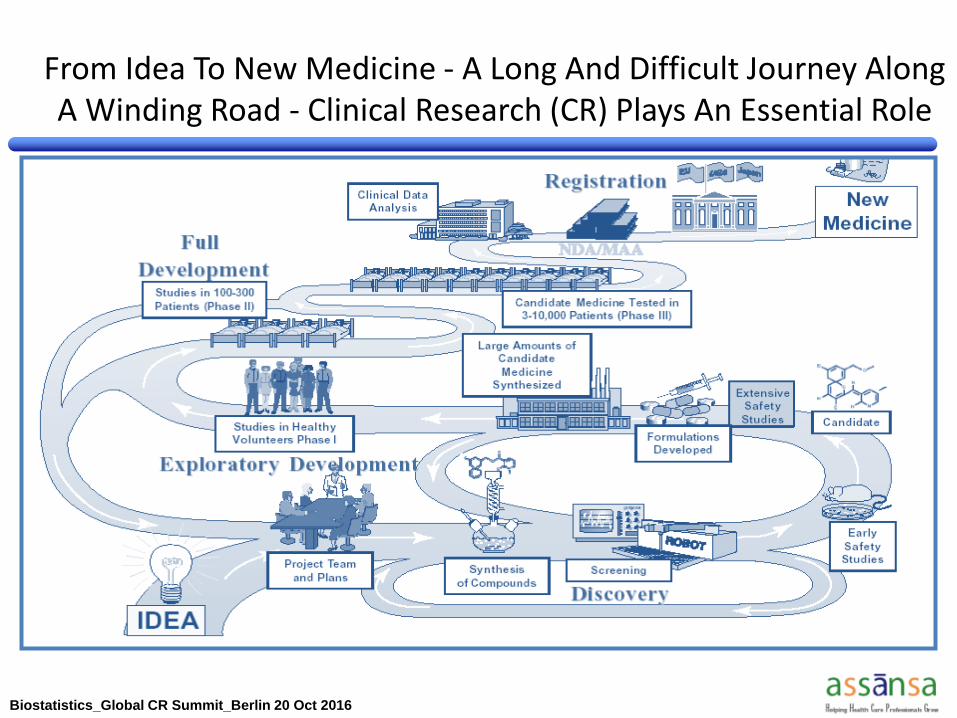
From Idea To New Medicine - A Long And Difficult Journey Along A Winding Road - Clinical Research (CR) Plays An Essential Role
Biostatistics_Global CR Summit_Berlin 20 Oct 2016
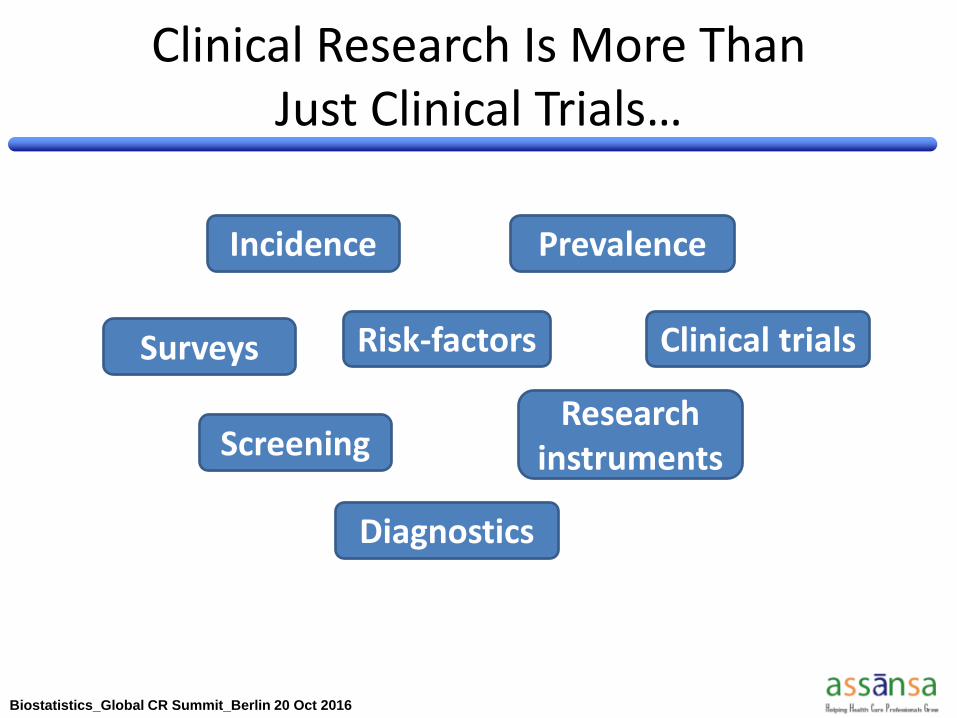
Clinical Research Is More Than
Just Clinical Trials…
Incidence
Research instruments Screening
Risk-factors Surveys Clinical trials
Prevalence
Diagnostics
Biostatistics_Global CR Summit_Berlin 20 Oct 2016
Be able to understand and design scientifically sound “experiments” - clinical research projects
Understand the results, and communicate the scientific inference / clinical relevance
Critically appraise published medical literature
Facilitate translation of clinical research to clinical practice
As CR Professionals, We Need To Be Reasonably Comfortable And Competent With Biostatistics To …
Statistics can be used to prove anything - even the truth.
Anonymous

Biostatistics_Global CR Summit_Berlin 20 Oct 2016
Session Outline
A Few Essentials - To Begin With...
Use And Application In Clinical Research
Planning And Design
Analysis And Inference
From Clinical Research To Clinical Practice
Recommended Reading / Resource
Biostatistics_Global CR Summit_Berlin 20 Oct 2016
Planning And Design
CR – One Proposed Thinking Approach
CR Question vs Study Type / Design ?
Types Of Data - Which Data When?
Sample Size – How Many? Why?
Biostatistics_Global CR Summit_Berlin 20 Oct 2016
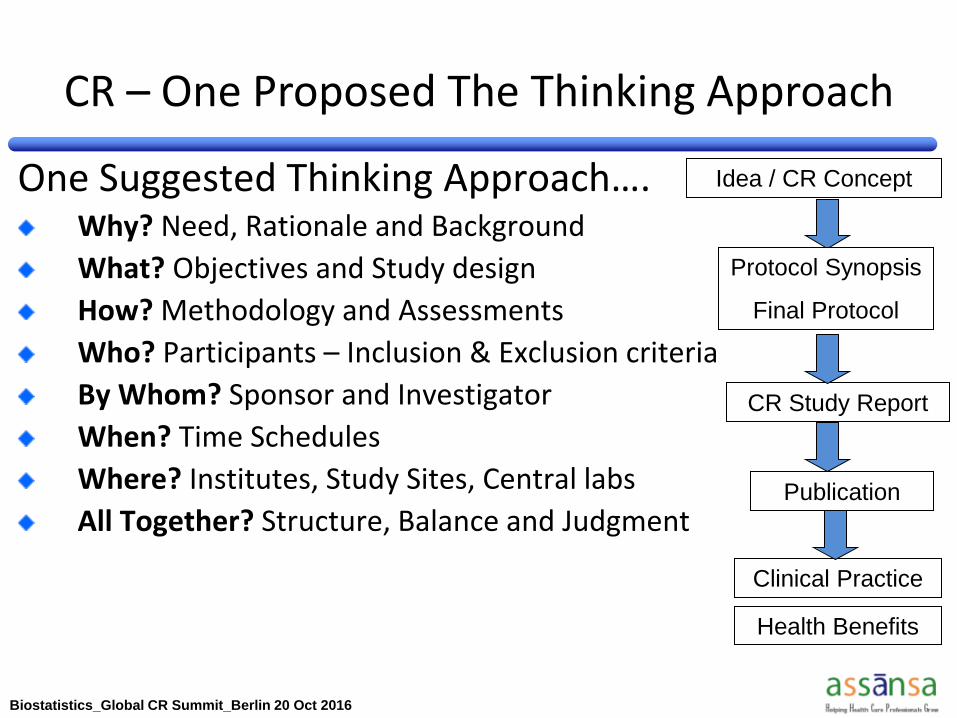
CR – One Proposed The Thinking Approach
One Suggested Thinking Approach…. Why? Need, Rationale and Background
What? Objectives and Study design
How? Methodology and Assessments
Who? Participants – Inclusion & Exclusion criteria
By Whom? Sponsor and Investigator
When? Time Schedules
Where? Institutes, Study Sites, Central labs
All Together? Structure, Balance and Judgment
Idea / CR Concept
Protocol Synopsis
Final Protocol
CR Study Report
Clinical Practice
Publication
Health Benefits
Biostatistics_Global CR Summit_Berlin 20 Oct 2016
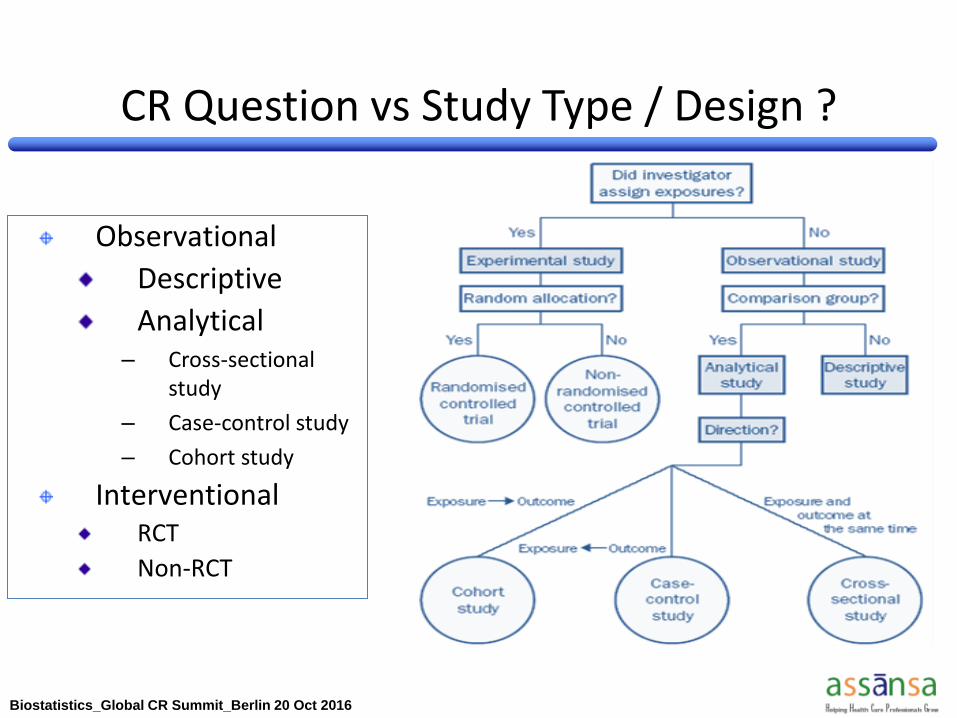
CR Question vs Study Type / Design ?
Observational
Descriptive
Analytical – Cross-sectional
study
– Case-control study
– Cohort study
Interventional RCT
Non-RCT
Biostatistics_Global CR Summit_Berlin 20 Oct 2016
The Type Of Question Will Determine The Research – 1
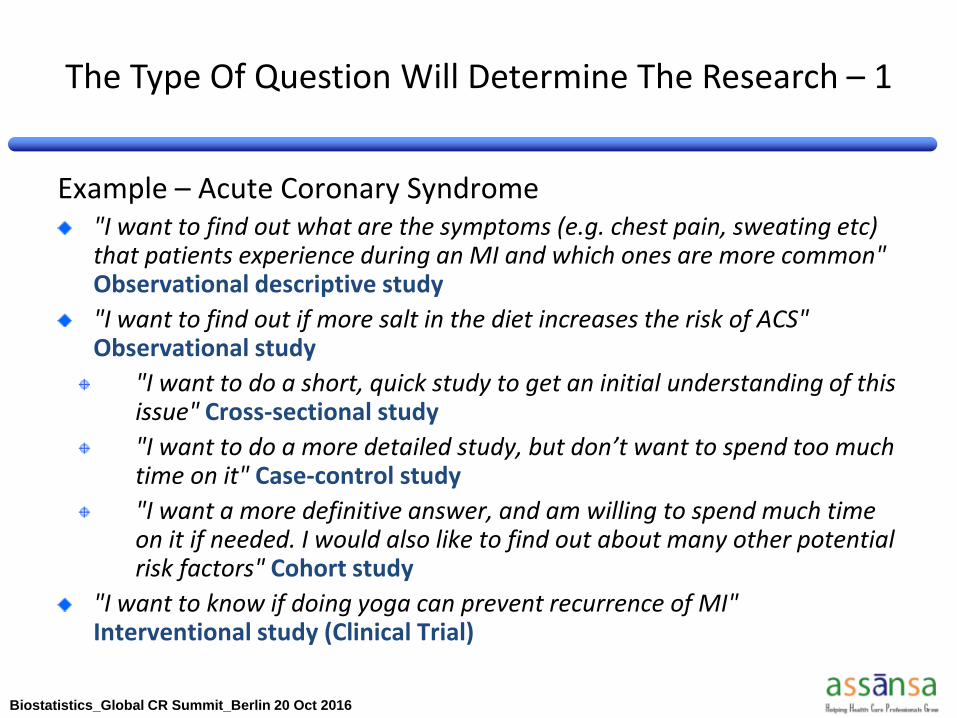
Example – Acute Coronary Syndrome "I want to find out what are the symptoms (e.g. chest pain, sweating etc) that patients experience during an MI and which ones are more common" Observational descriptive study
"I want to find out if more salt in the diet increases the risk of ACS" Observational study
"I want to do a short, quick study to get an initial understanding of this issue" Cross-sectional study
"I want to do a more detailed study, but don’t want to spend too much time on it" Case-control study
"I want a more definitive answer, and am willing to spend much time on it if needed. I would also like to find out about many other potential risk factors" Cohort study
"I want to know if doing yoga can prevent recurrence of MI" Interventional study (Clinical Trial)
Biostatistics_Global CR Summit_Berlin 20 Oct 2016
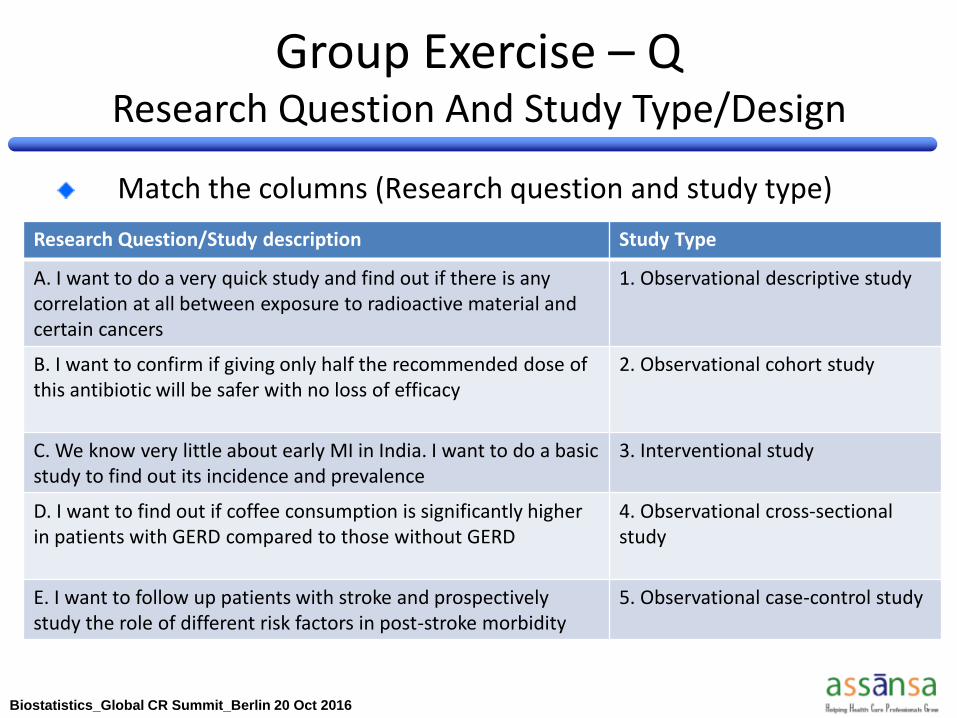
Match the columns (Research question and study type)
Research Question/Study description Study Type
A. I want to do a very quick study and find out if there is any correlation at all between exposure to radioactive material and certain cancers
1. Observational descriptive study
B. I want to confirm if giving only half the recommended dose of this antibiotic will be safer with no loss of efficacy
2. Observational cohort study
C. We know very little about early MI in India. I want to do a basic study to find out its incidence and prevalence
3. Interventional study
D. I want to find out if coffee consumption is significantly higher in patients with GERD compared to those without GERD
4. Observational cross-sectional study
E. I want to follow up patients with stroke and prospectively study the role of different risk factors in post-stroke morbidity
5. Observational case-control study
Group Exercise – Q Research Question And Study Type/Design
Biostatistics_Global CR Summit_Berlin 20 Oct 2016
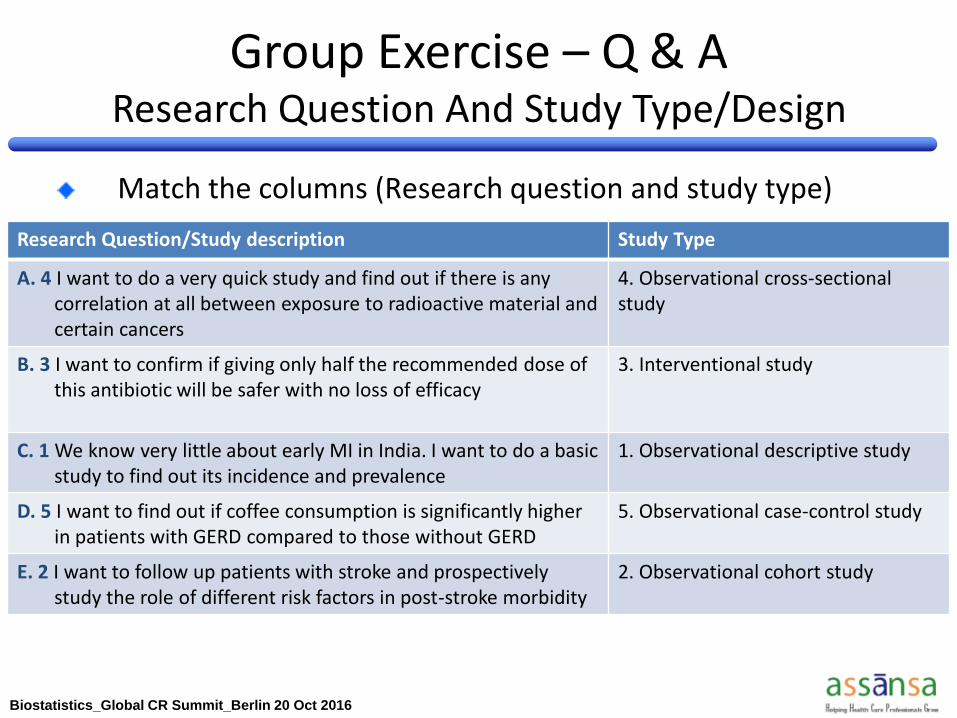
Match the columns (Research question and study type)
Research Question/Study description Study Type
A. 4 I want to do a very quick study and find out if there is any correlation at all between exposure to radioactive material and certain cancers
4. Observational cross-sectional study
B. 3 I want to confirm if giving only half the recommended dose of this antibiotic will be safer with no loss of efficacy
3. Interventional study
C. 1 We know very little about early MI in India. I want to do a basic study to find out its incidence and prevalence
1. Observational descriptive study
D. 5 I want to find out if coffee consumption is significantly higher in patients with GERD compared to those without GERD
5. Observational case-control study
E. 2 I want to follow up patients with stroke and prospectively study the role of different risk factors in post-stroke morbidity
2. Observational cohort study
Group Exercise – Q & A Research Question And Study Type/Design
Biostatistics_Global CR Summit_Berlin 20 Oct 2016
Sample vs Population
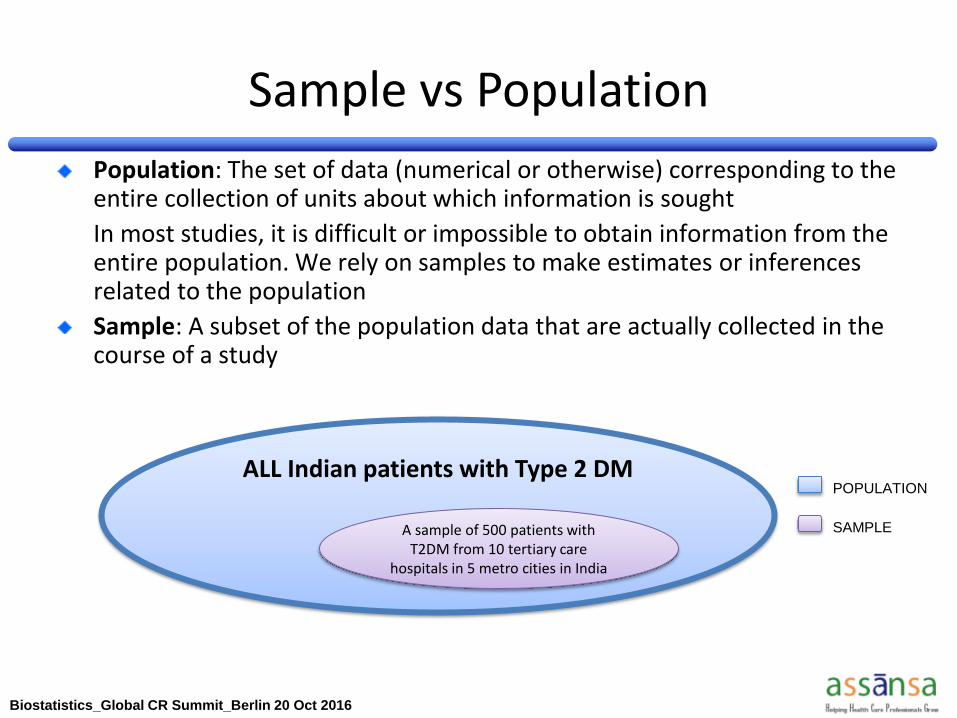
Population: The set of data (numerical or otherwise) corresponding to the entire collection of units about which information is sought
In most studies, it is difficult or impossible to obtain information from the entire population. We rely on samples to make estimates or inferences related to the population
Sample: A subset of the population data that are actually collected in the course of a study
ALL Indian patients with Type 2 DM
A sample of 500 patients with T2DM from 10 tertiary care
hospitals in 5 metro cities in India
POPULATION
SAMPLE
Biostatistics_Global CR Summit_Berlin 20 Oct 2016
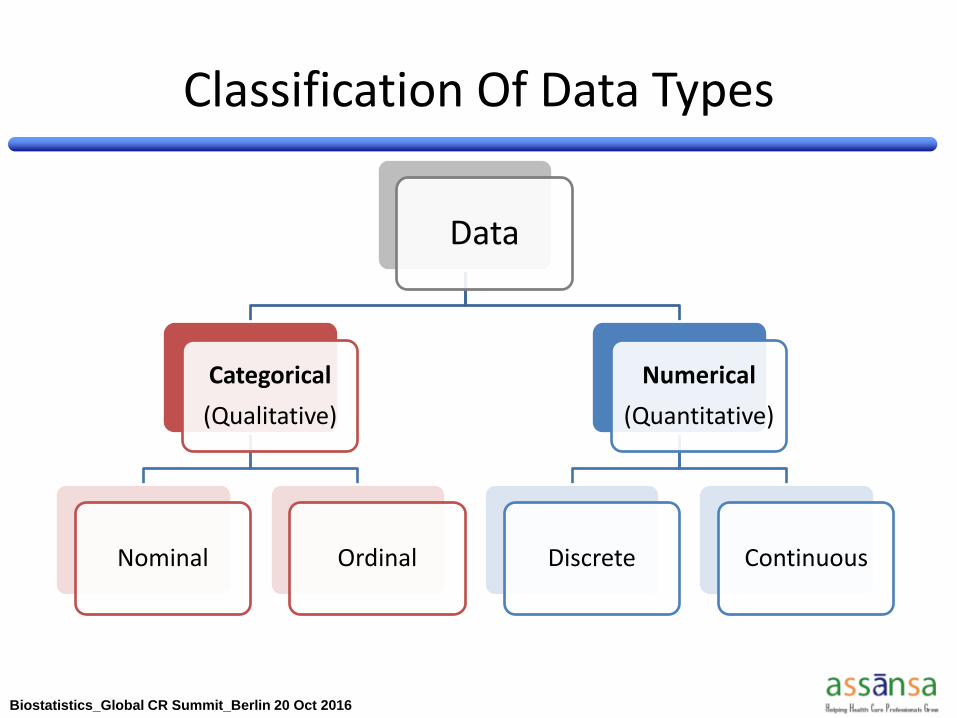
Classification Of Data Types
Data
Categorical
(Qualitative)
Nominal Ordinal
Numerical
(Quantitative)
Discrete Continuous
Biostatistics_Global CR Summit_Berlin 20 Oct 2016
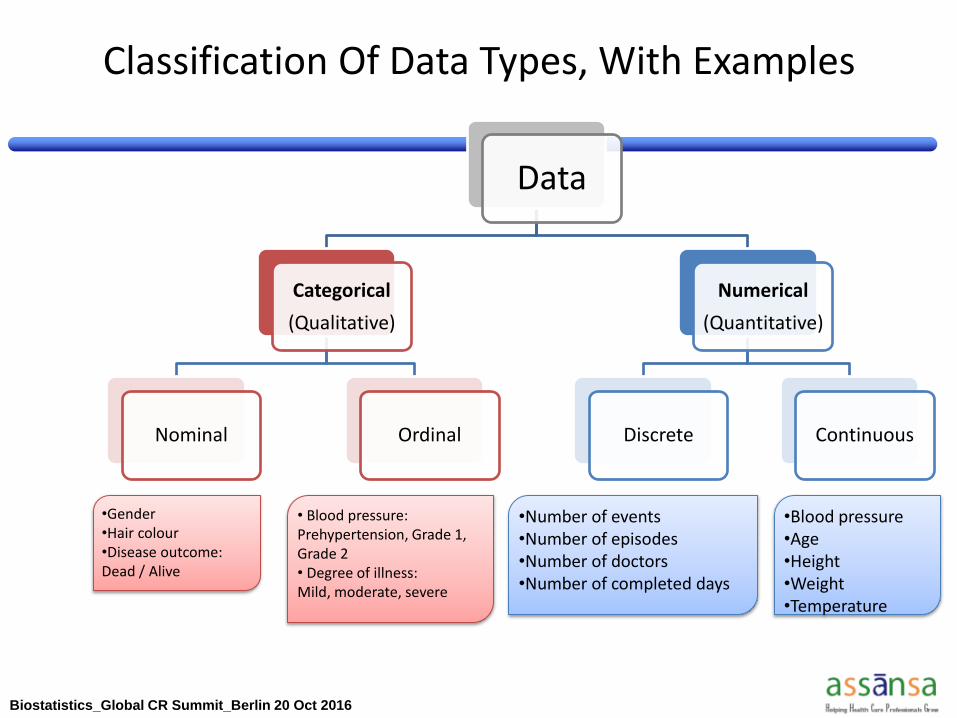
Classification Of Data Types, With Examples
Data
Categorical
(Qualitative)
Nominal Ordinal
Numerical
(Quantitative)
Discrete Continuous
•Blood pressure •Age •Height •Weight •Temperature
• Blood pressure: Prehypertension, Grade 1, Grade 2 • Degree of illness: Mild, moderate, severe
•Number of events •Number of episodes •Number of doctors •Number of completed days
•Gender •Hair colour •Disease outcome: Dead / Alive
Biostatistics_Global CR Summit_Berlin 20 Oct 2016
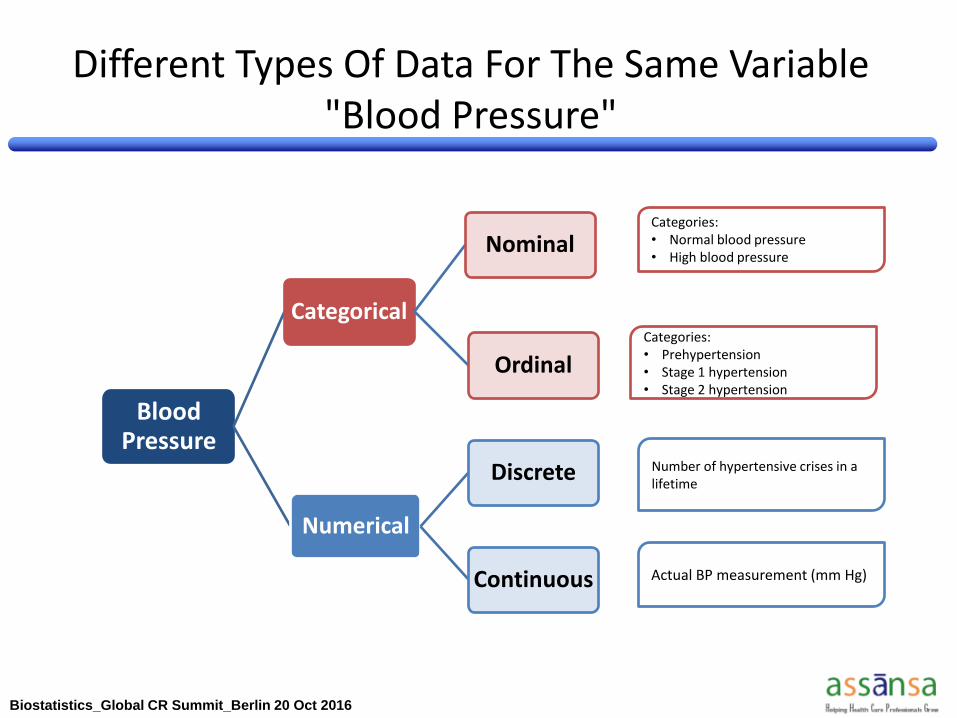
Different Types Of Data For The Same Variable "Blood Pressure"
Blood Pressure
Categorical
Nominal
Ordinal
Numerical
Discrete
Continuous
Categories: • Normal blood pressure • High blood pressure
Categories: • Prehypertension • Stage 1 hypertension • Stage 2 hypertension
Number of hypertensive crises in a lifetime
Actual BP measurement (mm Hg)
Biostatistics_Global CR Summit_Berlin 20 Oct 2016
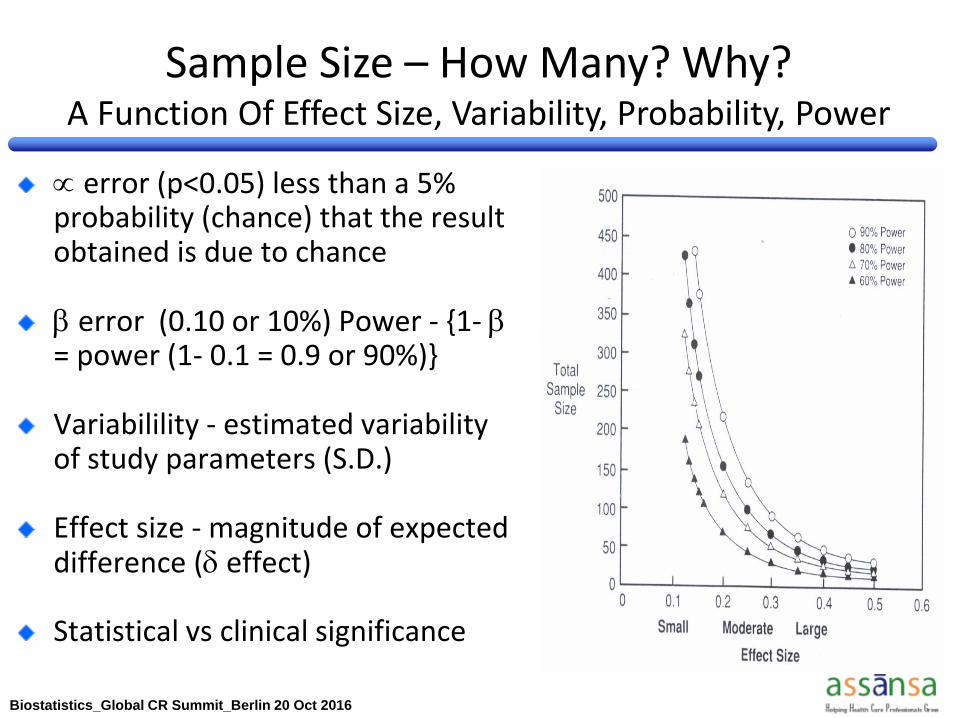
Sample Size – How Many? Why? A Function Of Effect Size, Variability, Probability, Power
error (p<0.05) less than a 5% probability (chance) that the result obtained is due to chance error (0.10 or 10%) Power - {1- = power (1- 0.1 = 0.9 or 90%)} Variabilility - estimated variability of study parameters (S.D.) Effect size - magnitude of expected difference ( effect) Statistical vs clinical significance
Biostatistics_Global CR Summit_Berlin 20 Oct 2016
Session Outline
A Few Essentials - To Begin With...
Use And Application In Clinical Research
Planning And Design
Analysis And Inference
From Clinical Research To Clinical Practice
Recommended Reading / Resource
Biostatistics_Global CR Summit_Berlin 20 Oct 2016
Analysis And Inference
Location And Spread Of Data
Use Of A Right Statistical Test
Probability
Confidence
Statistical Significance vs Clinical Significance (Relevance)
Biostatistics_Global CR Summit_Berlin 20 Oct 2016
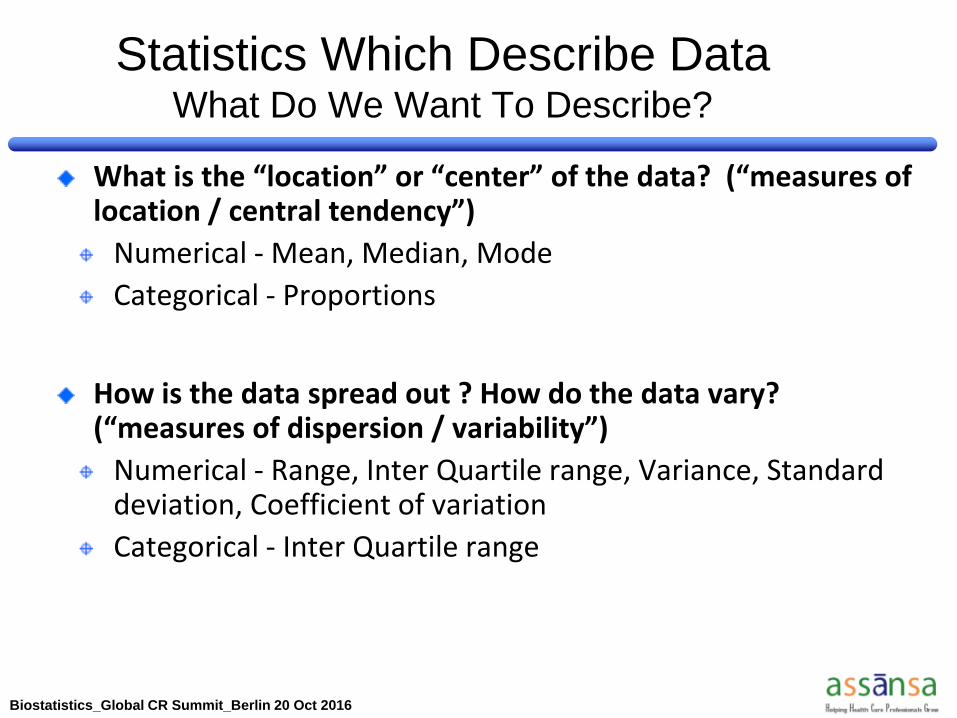
What is the “location” or “center” of the data? (“measures of location / central tendency”)
Numerical - Mean, Median, Mode
Categorical - Proportions
How is the data spread out ? How do the data vary? (“measures of dispersion / variability”)
Numerical - Range, Inter Quartile range, Variance, Standard deviation, Coefficient of variation
Categorical - Inter Quartile range
Statistics Which Describe Data What Do We Want To Describe?
Biostatistics_Global CR Summit_Berlin 20 Oct 2016
Parametric data Normal (Gaussian) Distribution Curve
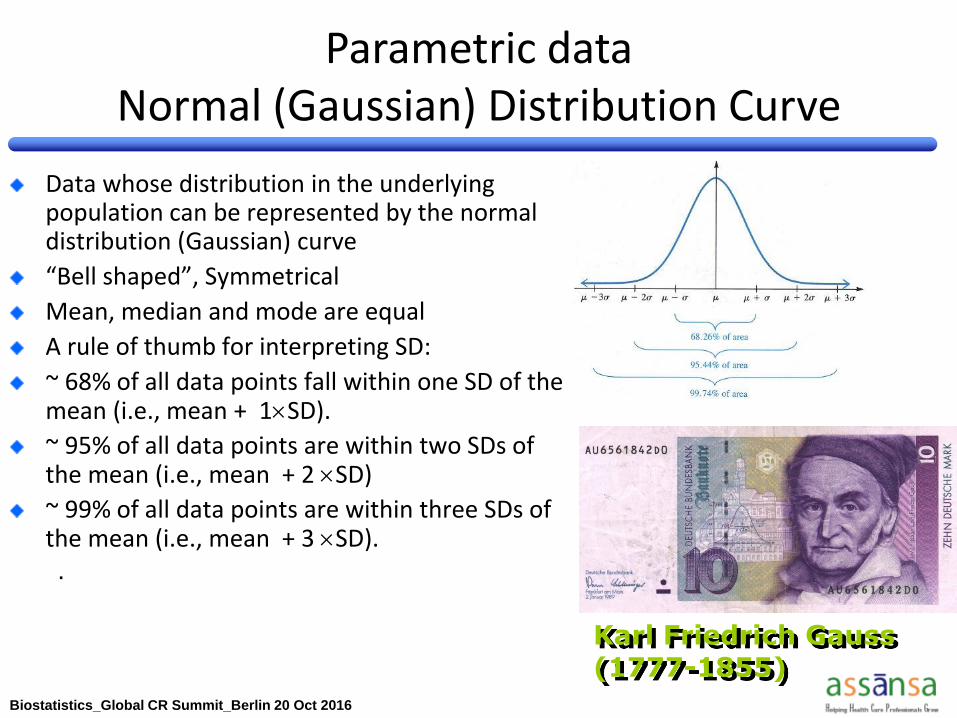
Data whose distribution in the underlying population can be represented by the normal distribution (Gaussian) curve
“Bell shaped”, Symmetrical
Mean, median and mode are equal
A rule of thumb for interpreting SD:
~ 68% of all data points fall within one SD of the mean (i.e., mean + 1SD).
~ 95% of all data points are within two SDs of the mean (i.e., mean + 2 SD)
~ 99% of all data points are within three SDs of the mean (i.e., mean + 3 SD). .
Karl Friedrich Gauss (1777-1855)
Biostatistics_Global CR Summit_Berlin 20 Oct 2016
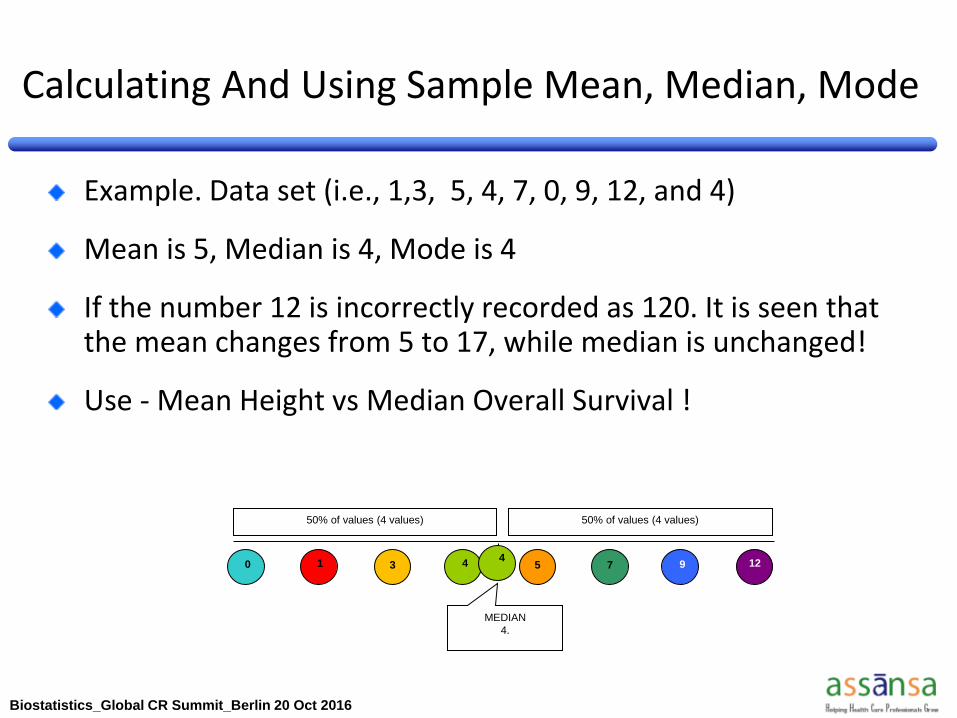
Calculating And Using Sample Mean, Median, Mode
1 5 3 7 0 9 12 4
50% of values (4 values) 50% of values (4 values)
MEDIAN
4.
Example. Data set (i.e., 1,3, 5, 4, 7, 0, 9, 12, and 4)
Mean is 5, Median is 4, Mode is 4
If the number 12 is incorrectly recorded as 120. It is seen that the mean changes from 5 to 17, while median is unchanged!
Use - Mean Height vs Median Overall Survival !
4
Biostatistics_Global CR Summit_Berlin 20 Oct 2016
Most Appropriate Measure Of Location
Data - “symmetric” or “skewed”.
Data - “unimodal” or more“multimodal”
If data are symmetric, report the mean (mean median, and mode will be ~ same)
If data are skewed, report the median.
If data are multimodal, report the mean, median and/or mode for each subgroup.
Biostatistics_Global CR Summit_Berlin 20 Oct 2016
Most Appropriate Measure Of Dispersion
If data are symmetric, with no serious outliers, use range and standard deviation.
If data are skewed, and/or have serious outliers, use IQR.
If comparing variation across two data sets, use coefficient of variation.
Biostatistics_Global CR Summit_Berlin 20 Oct 2016
Use Of A “Right” Statistical Test
A Logical Approach
Biostatistics_Global CR Summit_Berlin 20 Oct 2016
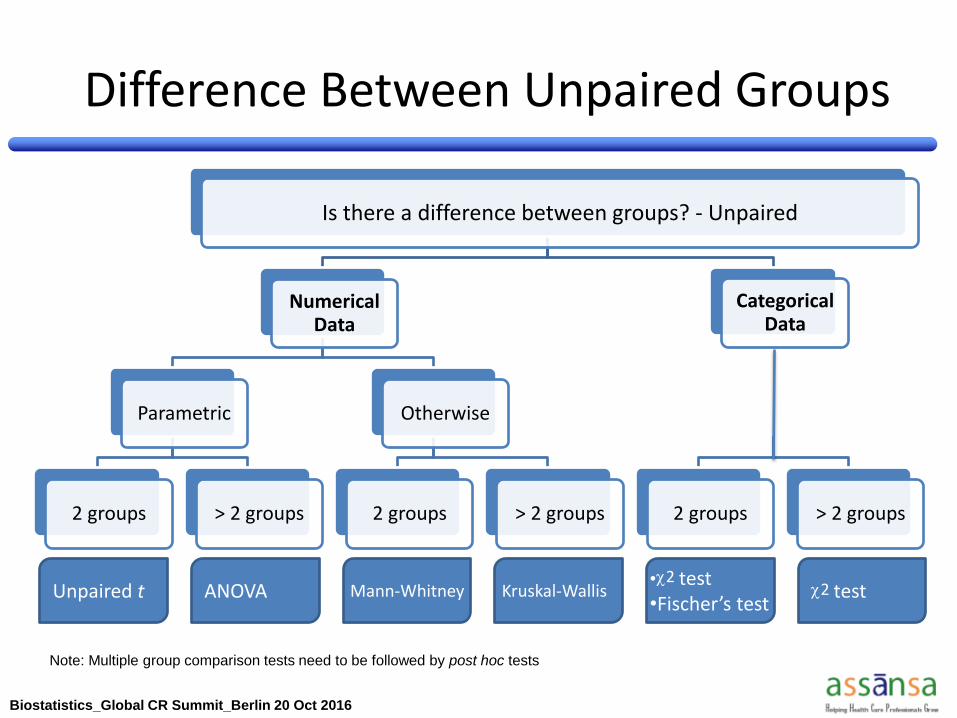
Difference Between Unpaired Groups
Is there a difference between groups? - Unpaired
Numerical Data
Parametric
2 groups > 2 groups
Otherwise
2 groups > 2 groups
Categorical Data
2 groups > 2 groups
Unpaired t ANOVA Mann-Whitney Kruskal-Wallis •2 test •Fischer’s test
2 test
Note: Multiple group comparison tests need to be followed by post hoc tests
Biostatistics_Global CR Summit_Berlin 20 Oct 2016
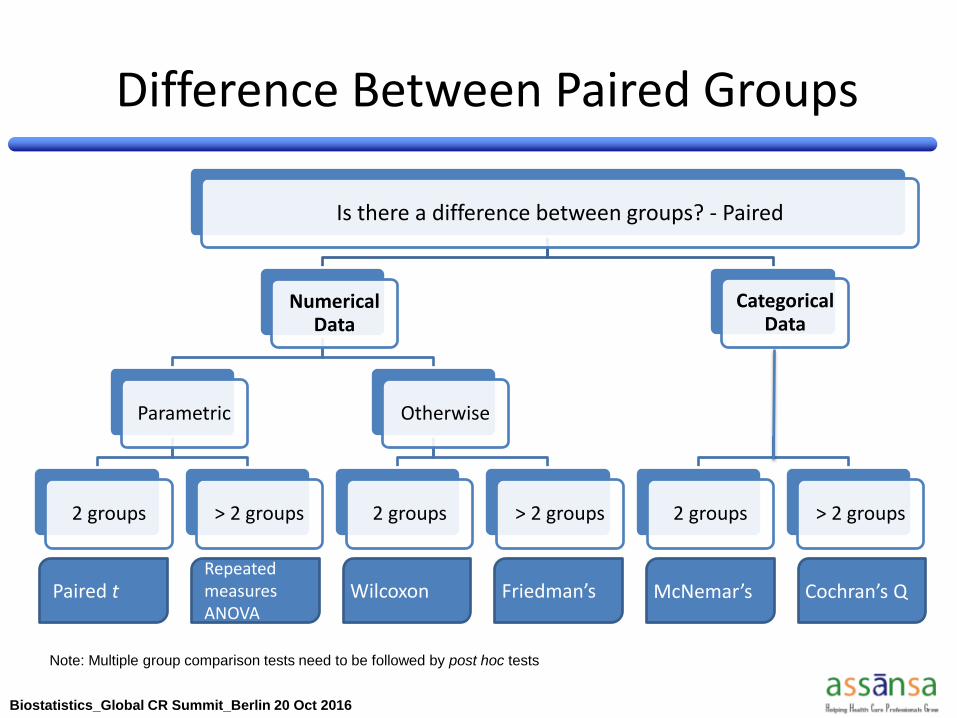
Difference Between Paired Groups
Is there a difference between groups? - Paired
Numerical Data
Parametric
2 groups > 2 groups
Otherwise
2 groups > 2 groups
Categorical Data
2 groups > 2 groups
Paired t Repeated measures ANOVA
Wilcoxon Friedman’s McNemar’s Cochran’s Q
Note: Multiple group comparison tests need to be followed by post hoc tests
Biostatistics_Global CR Summit_Berlin 20 Oct 2016
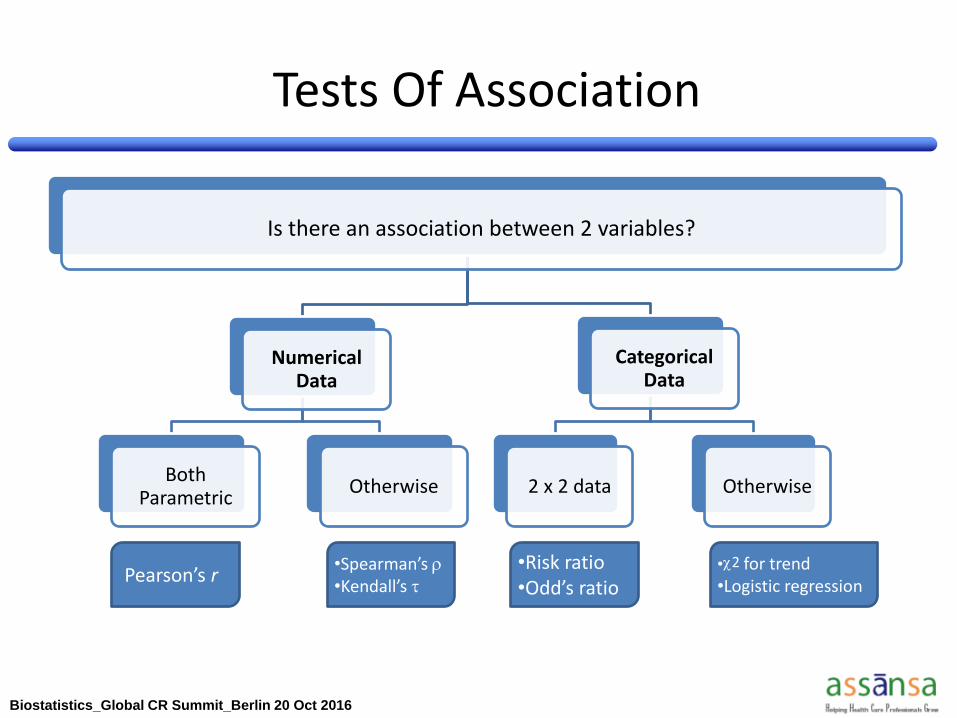
Tests Of Association
Is there an association between 2 variables?
Numerical Data
Both Parametric
Otherwise
Categorical Data
2 x 2 data Otherwise
Pearson’s r •Spearman’s •Kendall’s
•Risk ratio •Odd’s ratio
•2 for trend •Logistic regression
Biostatistics_Global CR Summit_Berlin 20 Oct 2016
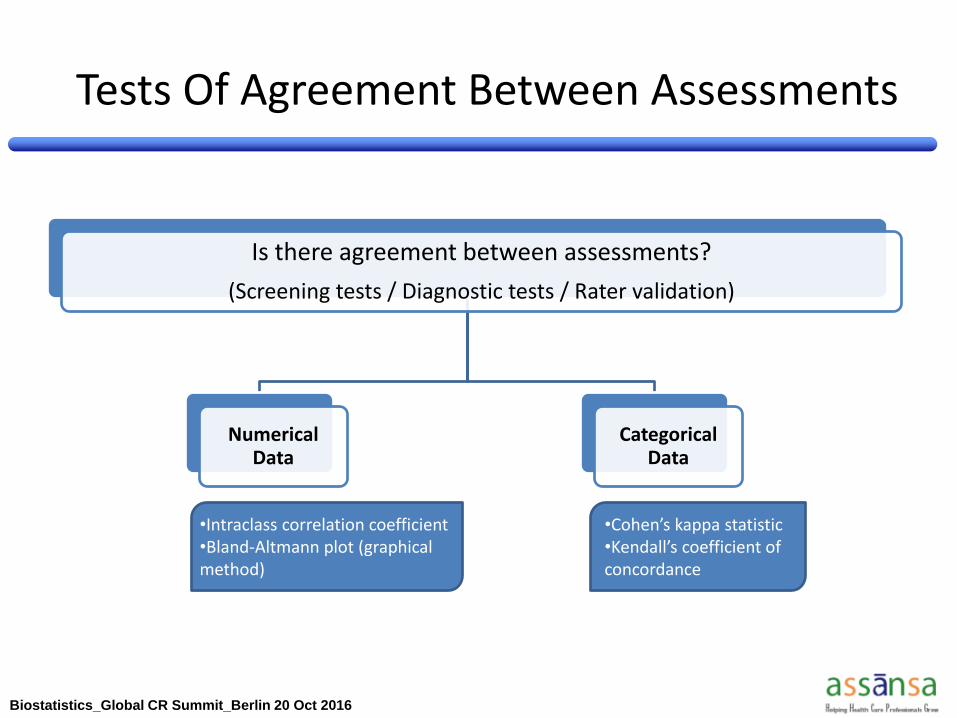
Tests Of Agreement Between Assessments
Is there agreement between assessments?
(Screening tests / Diagnostic tests / Rater validation)
Numerical Data
Categorical Data
•Intraclass correlation coefficient •Bland-Altmann plot (graphical method)
•Cohen’s kappa statistic •Kendall’s coefficient of concordance
Biostatistics_Global CR Summit_Berlin 20 Oct 2016
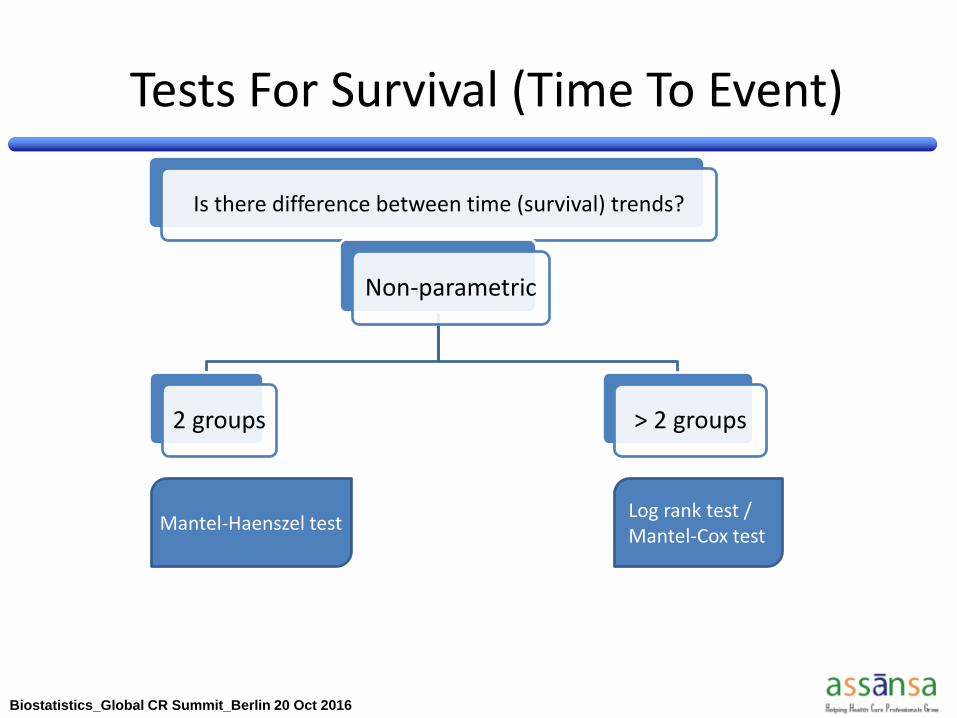
Is there difference between time (survival) trends?
Non-parametric
2 groups > 2 groups
Tests For Survival (Time To Event)
Mantel-Haenszel test Log rank test / Mantel-Cox test
Biostatistics_Global CR Summit_Berlin 20 Oct 2016
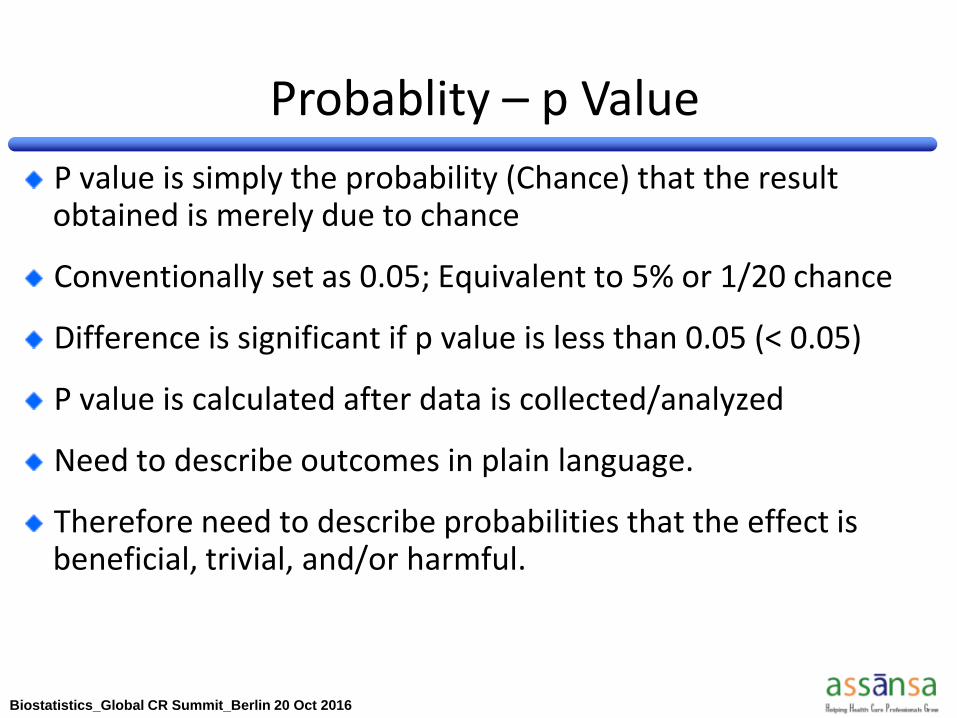
P value is simply the probability (Chance) that the result obtained is merely due to chance
Conventionally set as 0.05; Equivalent to 5% or 1/20 chance
Difference is significant if p value is less than 0.05 (< 0.05)
P value is calculated after data is collected/analyzed
Need to describe outcomes in plain language.
Therefore need to describe probabilities that the effect is beneficial, trivial, and/or harmful.
Probablity – p Value
Biostatistics_Global CR Summit_Berlin 20 Oct 2016
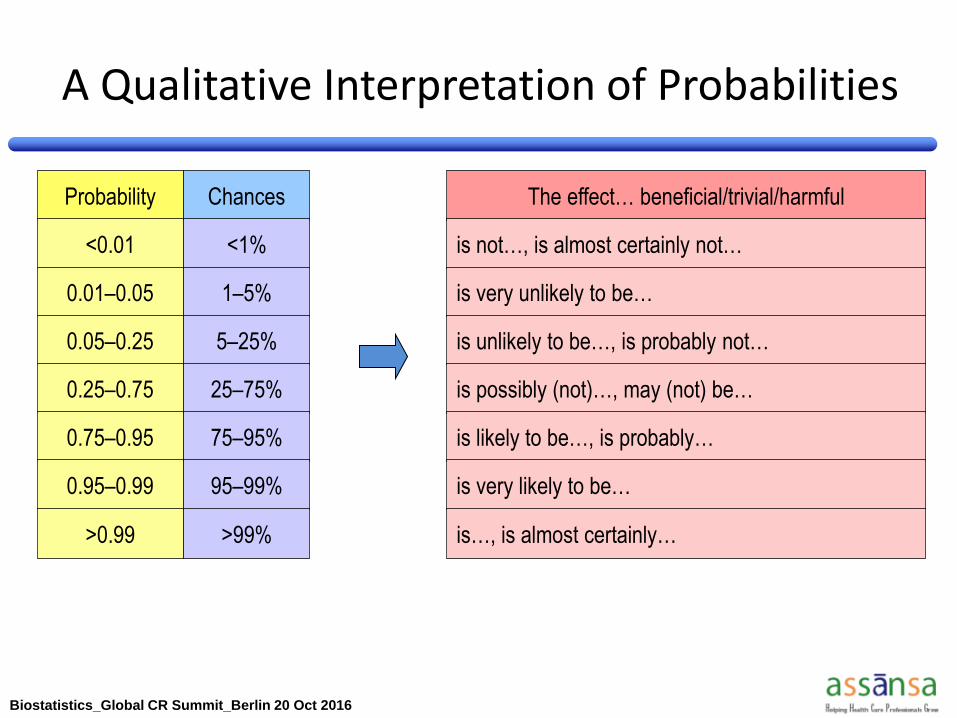
A Qualitative Interpretation of Probabilities
The effect… beneficial/trivial/harmful
is not…, is almost certainly not…
Probability
<0.01
Chances
<1%
is very unlikely to be… 0.01–0.05 1–5%
is unlikely to be…, is probably not… 0.05–0.25 5–25%
is possibly (not)…, may (not) be… 0.25–0.75 25–75%
is likely to be…, is probably…
is very likely to be…
is…, is almost certainly…
0.75–0.95
0.95–0.99
>0.99
75–95%
95–99%
>99%
Biostatistics_Global CR Summit_Berlin 20 Oct 2016
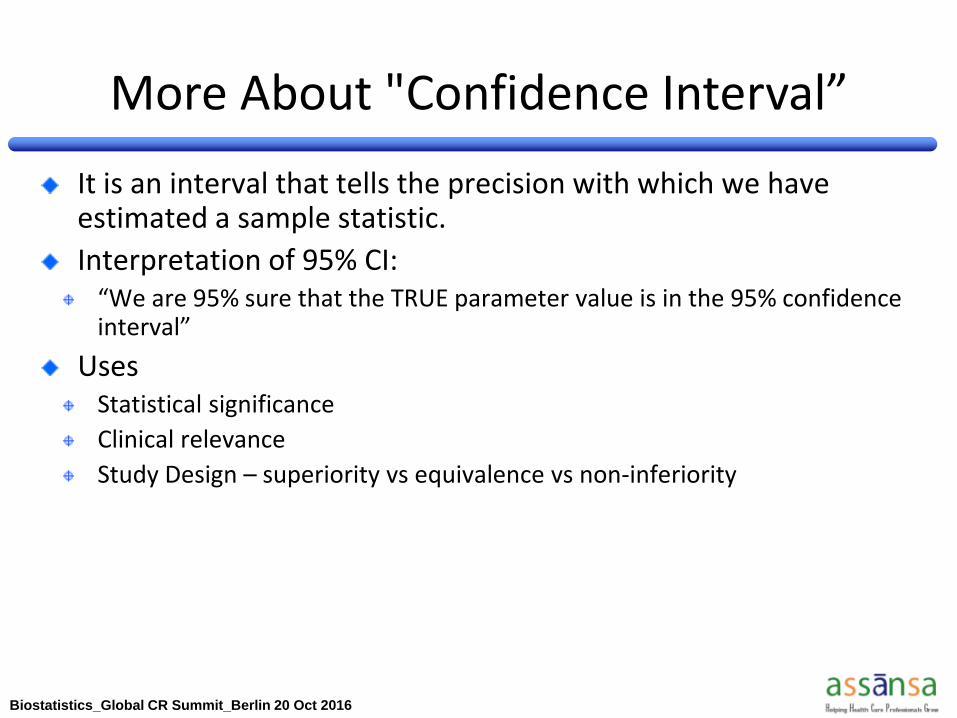
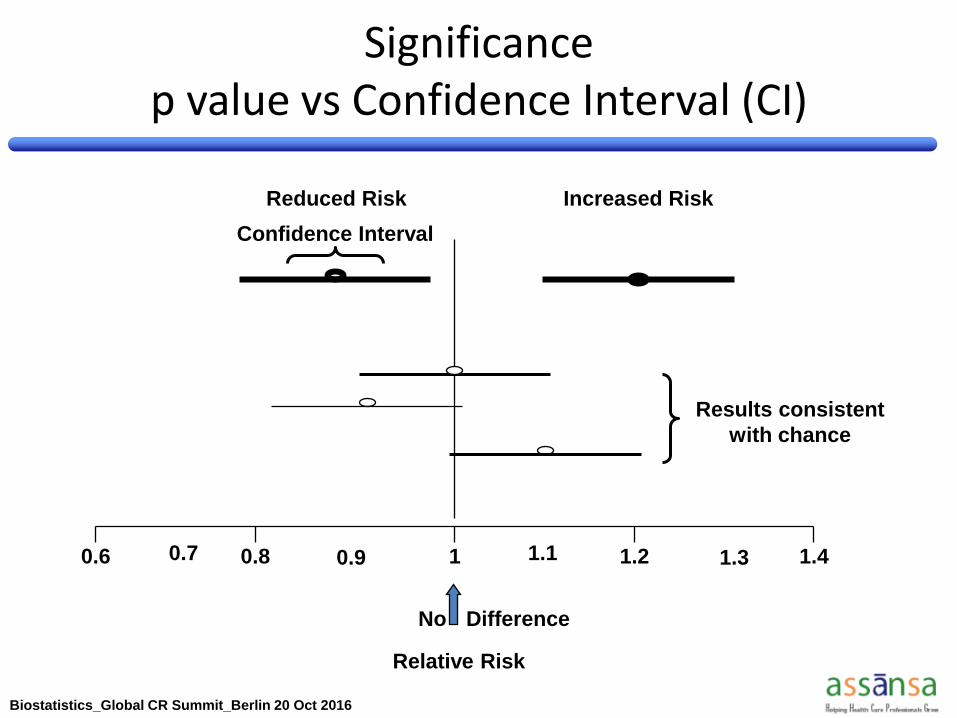
More About "Confidence Interval”
It is an interval that tells the precision with which we have estimated a sample statistic.
Interpretation of 95% CI: “We are 95% sure that the TRUE parameter value is in the 95% confidence interval”
Uses Statistical significance
Clinical relevance
Study Design – superiority vs equivalence vs non-inferiority
Biostatistics_Global CR Summit_Berlin 20 Oct 2016
0.6 0.8 1 1.2 1.4
Relative Risk
No Difference
Confidence Interval
Results consistent
with chance
Reduced Risk Increased Risk
0.7 0.9 1.1 1.3
Significance p value vs Confidence Interval (CI)
Biostatistics_Global CR Summit_Berlin 20 Oct 2016
An Important Consideration….
Old statisticians do not die –
they just lose their significance…..
Statistical vs Clinical Significance (Relevance)
Biostatistics_Global CR Summit_Berlin 20 Oct 2016
Recently a surgeon had a mortality of 60% for a heart operation in children less than one year old.
Would you sack him?
No! Need to know what rate to expect, such
as rate of other surgeons doing
comparable operations.
Statistical Surgeon - 1
Biostatistics_Global CR Summit_Berlin 20 Oct 2016
Nationally the mortality rate for this operation in this age group was 16/123 = 13%.
Would you sack him now?
No!
He may be unlucky.
He may be operating on more severe cases.
He may only have done a few operations.
For example 2/3 is 66%.
Statistical Surgeon - 2
Biostatistics_Global CR Summit_Berlin 20 Oct 2016
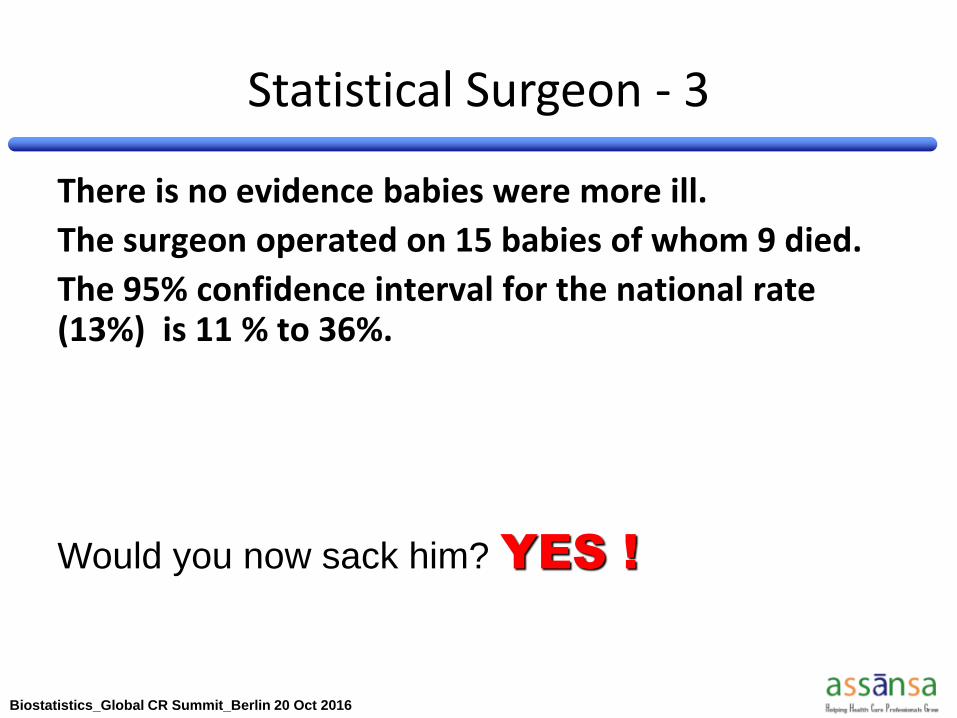
There is no evidence babies were more ill.
The surgeon operated on 15 babies of whom 9 died.
The 95% confidence interval for the national rate (13%) is 11 % to 36%.
Would you now sack him? YES !
Statistical Surgeon - 3
Biostatistics_Global CR Summit_Berlin 20 Oct 2016
Session Outline
A Few Essentials - To Begin With...
Use And Application In Clinical Research
Planning And Design
Analysis And Inference
From Clinical Research To Clinical Practice
Recommended Reading / Resource
Biostatistics_Global CR Summit_Berlin 20 Oct 2016
From Clinical Research To Clinical Practice
Evaluating And Communicating Risk And Benefit
A Case: Lipid Lowering Drugs – What Do The Numbers Mean?
Biostatistics_Global CR Summit_Berlin 20 Oct 2016
Evaluating And Communicating Risk
Relative Risk (RR)
Odds Ratios (OR)
Relative Risk Reduction (RRR)
Absolute Risk Reduction (ARR)
Number Needed to Treat (NNT)
Biostatistics_Global CR Summit_Berlin 20 Oct 2016
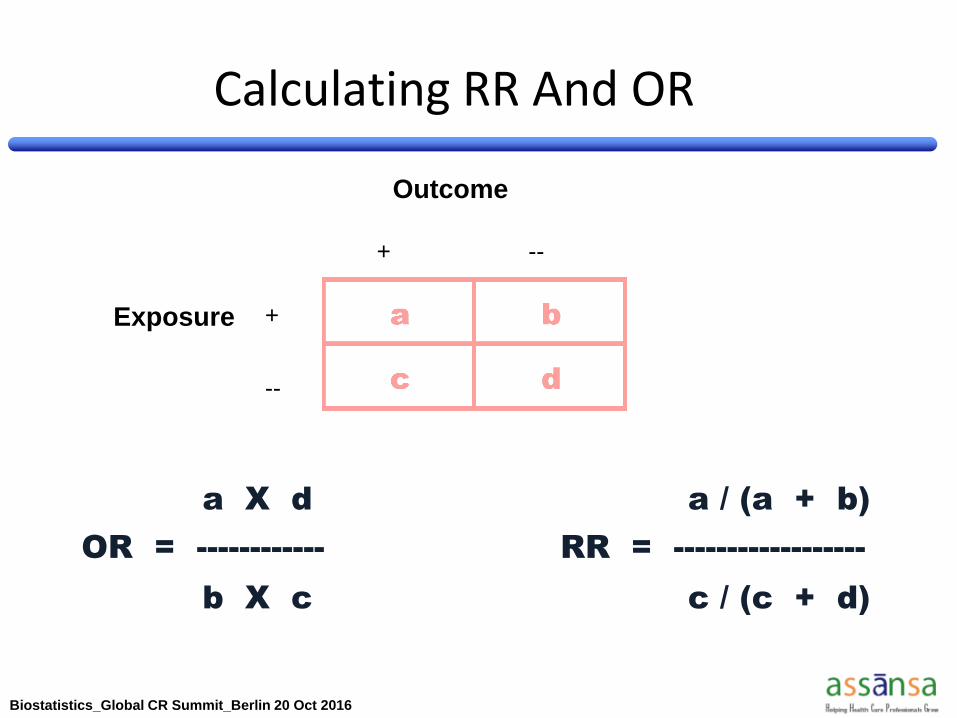
a X d a / (a + b)
OR = ------------ RR = ------------------
b X c c / (c + d)
Calculating RR And OR
Exposure
Outcome
+
--
+ --
Biostatistics_Global CR Summit_Berlin 20 Oct 2016
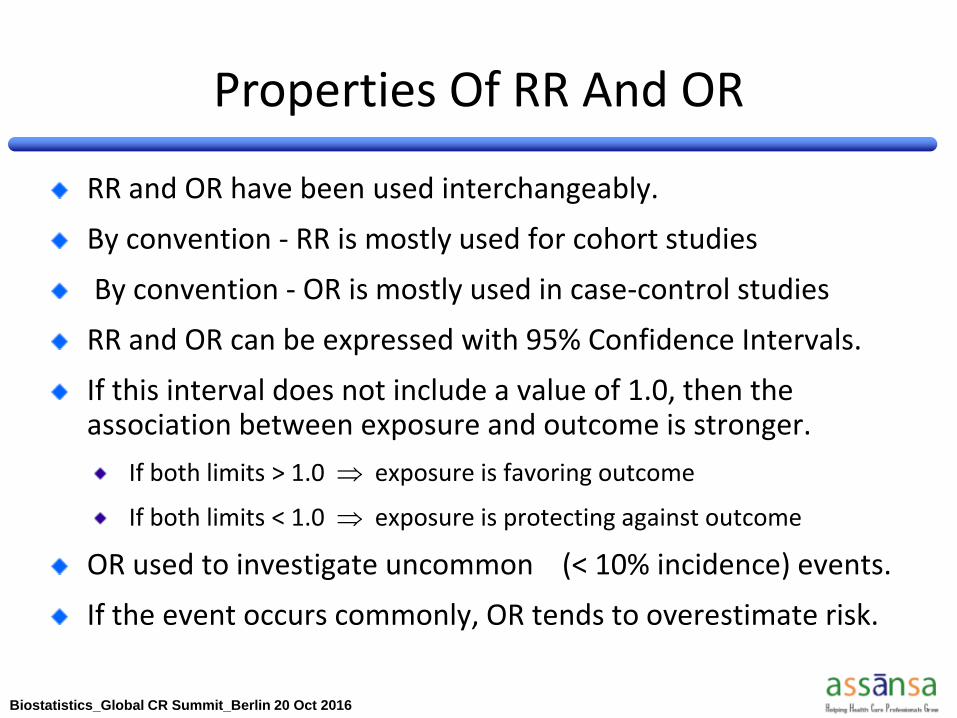
RR and OR have been used interchangeably.
By convention - RR is mostly used for cohort studies
By convention - OR is mostly used in case-control studies
RR and OR can be expressed with 95% Confidence Intervals.
If this interval does not include a value of 1.0, then the association between exposure and outcome is stronger.
If both limits > 1.0 exposure is favoring outcome
If both limits < 1.0 exposure is protecting against outcome
OR used to investigate uncommon (< 10% incidence) events.
If the event occurs commonly, OR tends to overestimate risk.
Properties Of RR And OR
Biostatistics_Global CR Summit_Berlin 20 Oct 2016
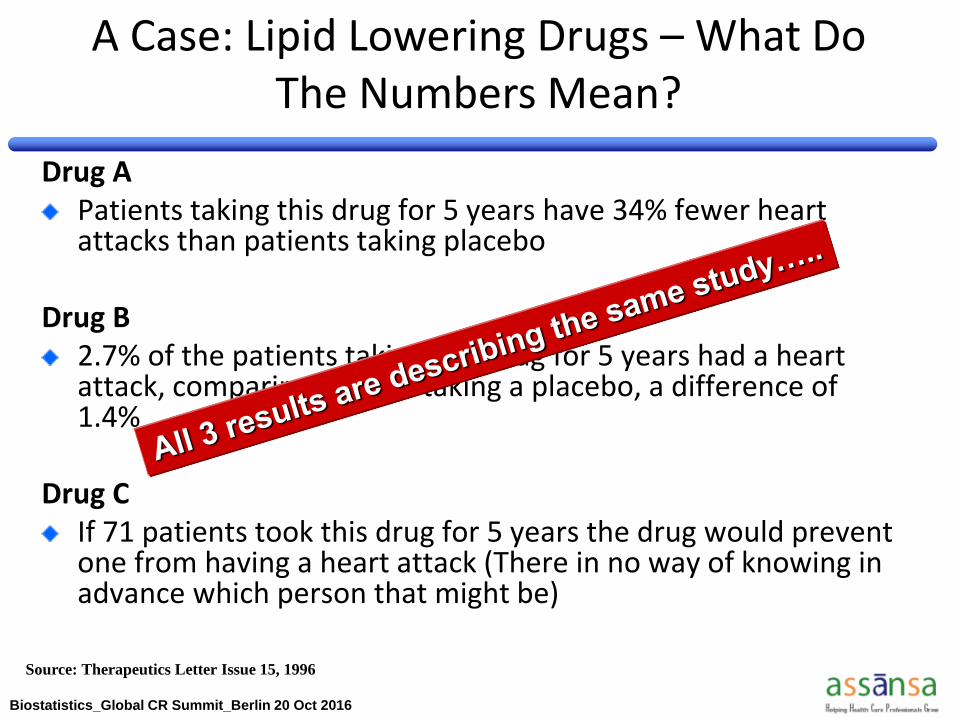
A Case: Lipid Lowering Drugs – What Do The Numbers Mean?
Drug A Patients taking this drug for 5 years have 34% fewer heart attacks than patients taking placebo
Drug B 2.7% of the patients taking this drug for 5 years had a heart attack, comparing to 4.1% taking a placebo, a difference of 1.4%
Drug C If 71 patients took this drug for 5 years the drug would prevent one from having a heart attack (There in no way of knowing in advance which person that might be)
Source: Therapeutics Letter Issue 15, 1996
Biostatistics_Global CR Summit_Berlin 20 Oct 2016
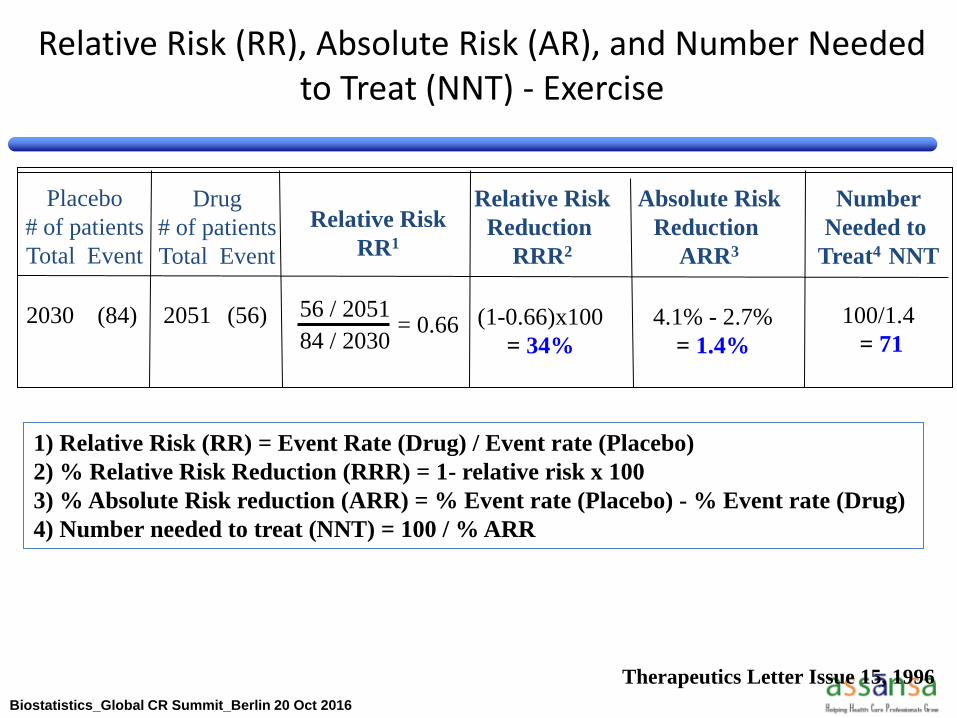
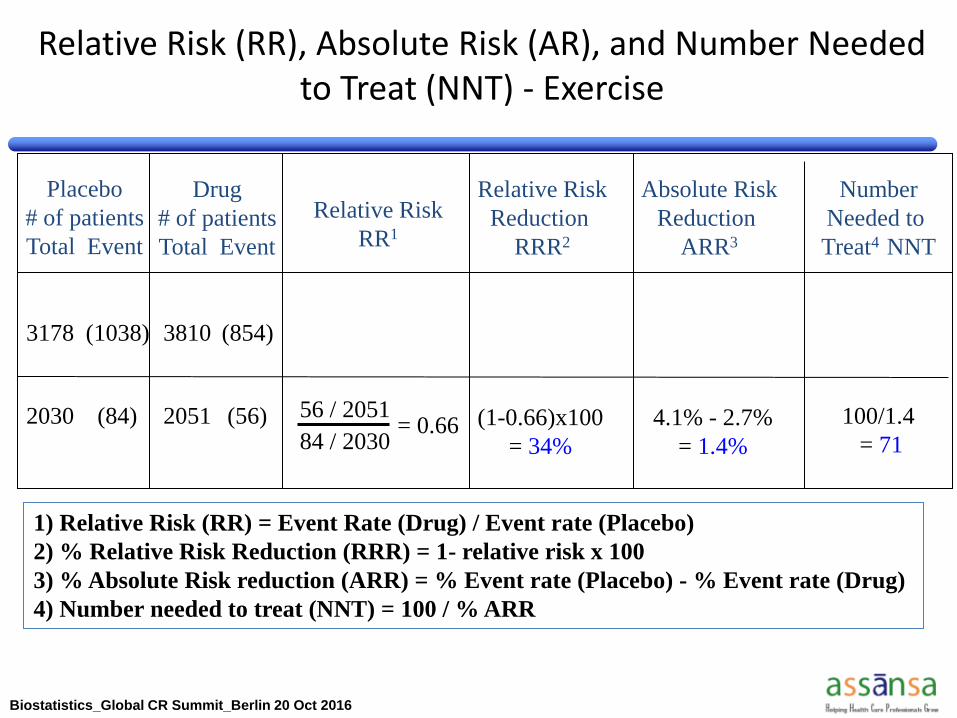
Relative Risk (RR), Absolute Risk (AR), and Number Needed to Treat (NNT) - Exercise
1) Relative Risk (RR) = Event Rate (Drug) / Event rate (Placebo)
2) % Relative Risk Reduction (RRR) = 1- relative risk x 100
3) % Absolute Risk reduction (ARR) = % Event rate (Placebo) - % Event rate (Drug)
4) Number needed to treat (NNT) = 100 / % ARR
Therapeutics Letter Issue 15, 1996
Placebo
# of patients
Total Event
Drug
# of patients
Total Event
Relative Risk
RR1
Relative Risk
Reduction
RRR2
Absolute Risk
Reduction
ARR3
Number
Needed to
Treat4 NNT
2030 (84) 2051 (56) 56 / 2051
84 / 2030 = 0.66 (1-0.66)x100
= 34%
4.1% - 2.7%
= 1.4%
100/1.4
= 71
Biostatistics_Global CR Summit_Berlin 20 Oct 2016
Relative Risk (RR), Absolute Risk (AR), and Number Needed to Treat (NNT) - Exercise
Placebo
# of patients
Total Event
Drug
# of patients
Total Event
Relative Risk
RR1
Relative Risk
Reduction
RRR2
Absolute Risk
Reduction
ARR3
Number
Needed to
Treat4 NNT
3178 (1038) 3810 (854)
2030 (84) 2051 (56) 56 / 2051
84 / 2030 = 0.66 (1-0.66)x100
= 34%
4.1% - 2.7%
= 1.4%
100/1.4
= 71
1) Relative Risk (RR) = Event Rate (Drug) / Event rate (Placebo)
2) % Relative Risk Reduction (RRR) = 1- relative risk x 100
3) % Absolute Risk reduction (ARR) = % Event rate (Placebo) - % Event rate (Drug)
4) Number needed to treat (NNT) = 100 / % ARR
Biostatistics_Global CR Summit_Berlin 20 Oct 2016
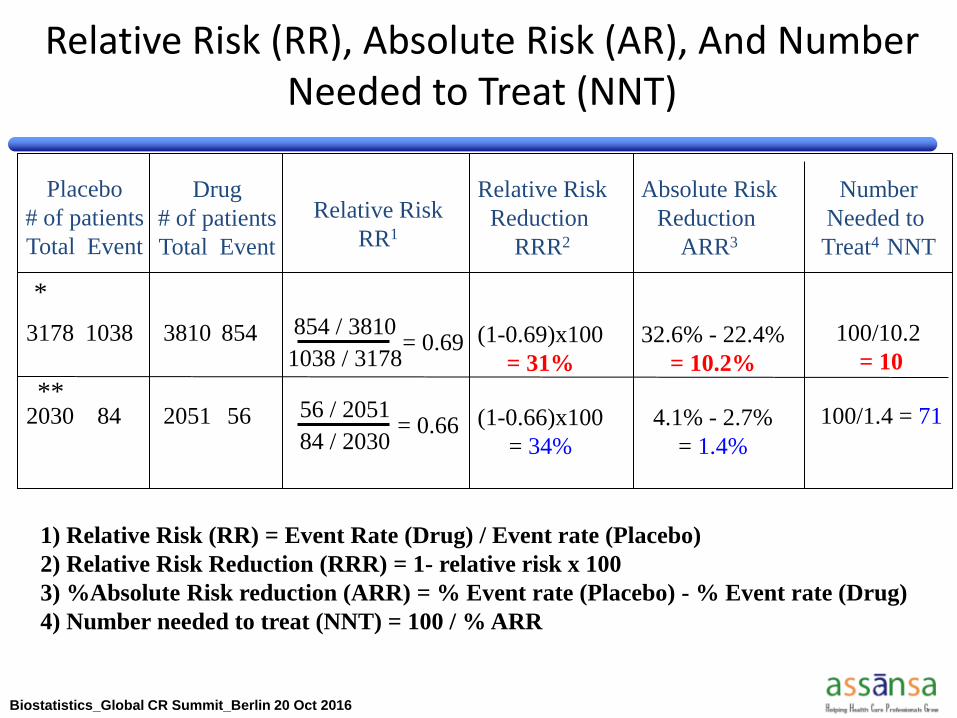
Relative Risk (RR), Absolute Risk (AR), And Number Needed to Treat (NNT)
1) Relative Risk (RR) = Event Rate (Drug) / Event rate (Placebo)
2) Relative Risk Reduction (RRR) = 1- relative risk x 100
3) %Absolute Risk reduction (ARR) = % Event rate (Placebo) - % Event rate (Drug)
4) Number needed to treat (NNT) = 100 / % ARR
Placebo
# of patients
Total Event
Drug
# of patients
Total Event
Relative Risk
RR1
Relative Risk
Reduction
RRR2
Absolute Risk
Reduction
ARR3
Number
Needed to
Treat4 NNT
3178 1038 3810 854 854 / 3810
1038 / 3178 = 0.69 (1-0.69)x100
= 31%
32.6% - 22.4%
= 10.2%
100/10.2
= 10
2030 84 2051 56 56 / 2051
84 / 2030 = 0.66 (1-0.66)x100
= 34%
4.1% - 2.7%
= 1.4%
100/1.4 = 71 **
*
Biostatistics_Global CR Summit_Berlin 20 Oct 2016
Session Outline
A Few Essentials - To Begin With...
Use And Application In Clinical Research
Planning And Design
Analysis And Inference
From Clinical Research To Clinical Practice
Recommended Reading / Resource
Biostatistics_Global CR Summit_Berlin 20 Oct 2016
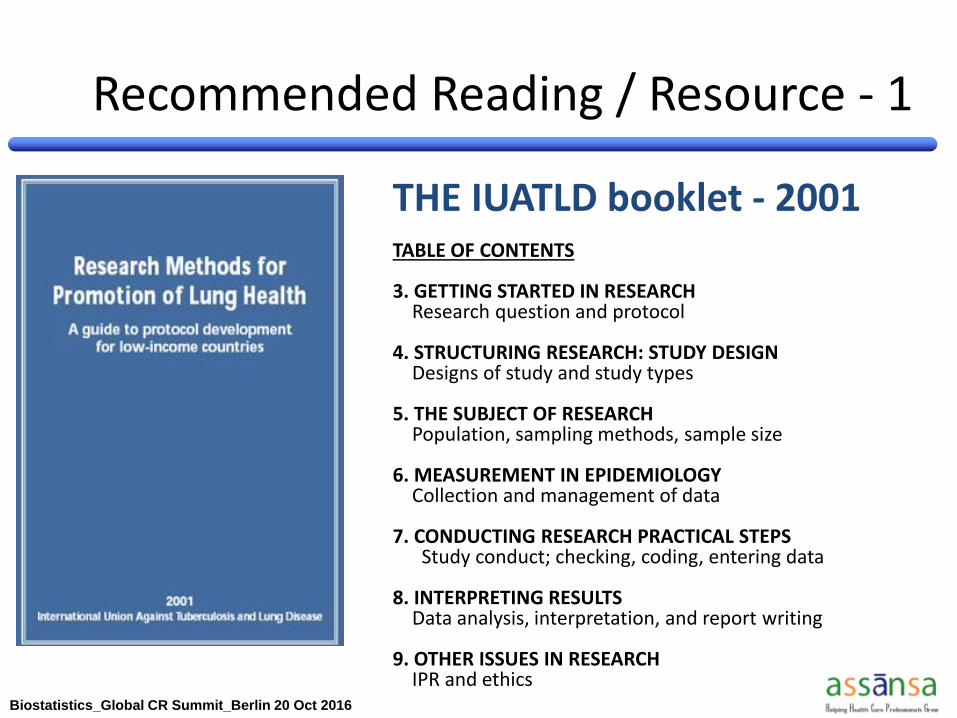
THE IUATLD booklet - 2001 TABLE OF CONTENTS 3. GETTING STARTED IN RESEARCH Research question and protocol 4. STRUCTURING RESEARCH: STUDY DESIGN Designs of study and study types 5. THE SUBJECT OF RESEARCH Population, sampling methods, sample size 6. MEASUREMENT IN EPIDEMIOLOGY Collection and management of data 7. CONDUCTING RESEARCH PRACTICAL STEPS Study conduct; checking, coding, entering data 8. INTERPRETING RESULTS Data analysis, interpretation, and report writing 9. OTHER ISSUES IN RESEARCH IPR and ethics
Recommended Reading / Resource - 1
Biostatistics_Global CR Summit_Berlin 20 Oct 2016
Designing Clinical Research: An
Epidemiologic Approach
3rd Revised edition 2006
Author: Deborah G. Grady, Warren S.
Browner, Thomas B. Newman, Stephen B.
Hulley, Steven R. Cummings
Recommended Reading / Resource - 2
Biostatistics_Global CR Summit_Berlin 20 Oct 2016
Recommended Reading / Resource - 3
Book: How to Read a Paper: The Basics of
Evidence-Based Medicine 4th Edition
Author: Trisha Greenhalgh
Publisher: BMJ Publishing Group (2010)
Series of concise articles by Trisha Greenhalgh on 'How to read a
paper„, published in the British Medical Journal in 1997
http://www.bmj.com/about-bmj/resources-readers/publications/how-
read-paper
Biostatistics_Global CR Summit_Berlin 20 Oct 2016
Recommended Reading / Resource - 4
Book: Medical Statistics Made Easy 2nd Edition
Author: Michael Harris, Gordon Taylor
Publisher: INFORMA UK LIMITED (2008)
Biostatistics_Global CR Summit_Berlin 20 Oct 2016
If you tell me that this interaction was average, you are just being mean.
A Final Thought….

Biostatistics_Global CR Summit_Berlin 20 Oct 2016
Share Knowledge! Support Open Access!