Embed Size (px)
Citation preview

Wednesday, August 13: Seminar on Biosystems Engineering Mar del Plata, Argentina
Biotechnology research for biomass-based products other than bioethanol
Telma Teixeira Franco -
FEQ/ Unicamp, [email protected]
UNICAMP

STATE UNIVERSITY OF CAMPINAS, UNICAMP created October 1966
Unicamp concentrates almost 20% of the post-graduation (Msc +PhD) of the coutry.
14,000 undergraduate students,14,000 post-graduate students (MsC+PhD),2,100 lecturers and professors.10,000 students on continuous education (evening /week-end courses)Chemical Engineering School 570 bachelor and 450 PhD +MsC students

Outline•Sugarcane & Conventional use of sugarcane
•Sugarcane bagasse –
bioethanol
•Potential for biorefinery of sugar cane
•Non-bioethanol research from sugarcane
•Feasibility of acrylic acid production from sugars
•Sugar acrylates by biocatalysis
•Photobioreactors and microalgae
UNICAMP
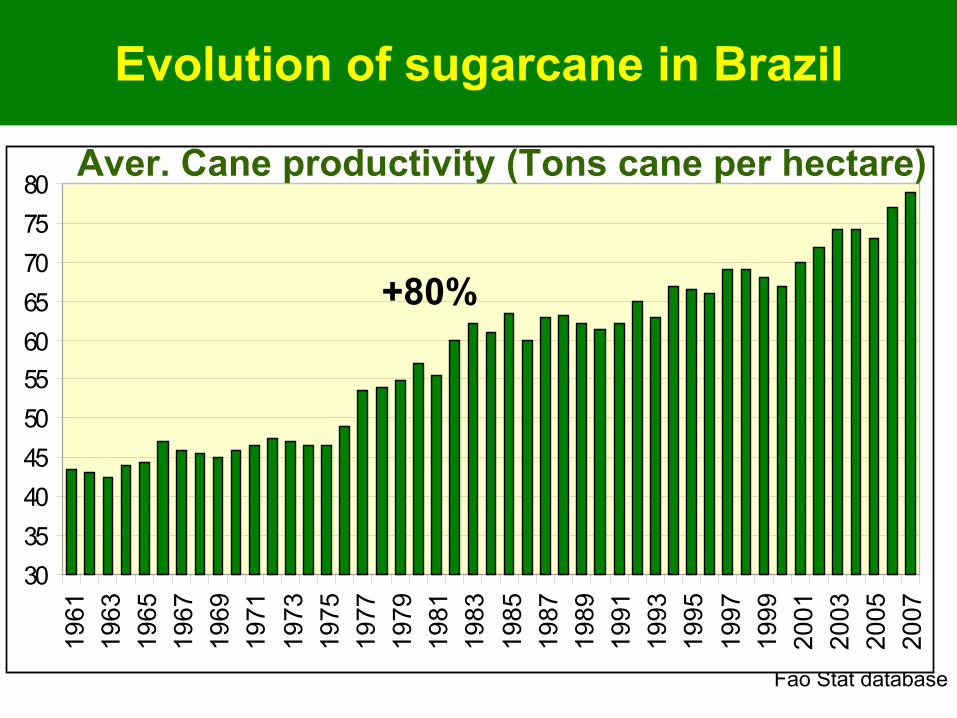
Evolution of sugarcane in Brazil
Fao Stat database
3035404550556065707580
1961
1963
1965
1967
1969
1971
1973
1975
1977
1979
1981
1983
1985
1987
1989
1991
1993
1995
1997
1999
2001
2003
2005
2007
+80%
Aver. Cane productivity (Tons cane per hectare)

4
42.2 million kl (2004)54.0 million kl (2007)
China9%
2.7%
Others11%
Brazil
36%39%
India5%
USA
33%45%
EU6%2.5%
Source: FO Licht
World Bioethanol Production
9.8%

SurfaceSurface[10[1066
ha]ha]PasturePasture
SoyaSoya
150150--200200
21.521.5CornCorn 12.312.3SugarcaneSugarcane 5.65.6Agric. landAgric. land 58.058.0
Brazil: 851 10Brazil: 851 1066
haha
●●●●
●●
ParanParanáá: 20,0 10: 20,0 1066
haha
ParaParaííba: 5,7 10ba: 5,7 1066
haha
CearCearáá: 14,6 10: 14,6 1066
haha
Brazil: main crops 2004
Bioethanol, 2007

7
Present Location of Sugar-Etanol Mills in Brazil
Fingueruti, 2007

RECEPTION,PREPARING,EXTRACTION
STEAM AND POWER
GENERATION ETHANOLPROCESSING
SUGARPROCESSING
SUGAR
ETHANOL
STILLAGE
MOLASSES
CANE
BAGASSE
JUICE
SUGAR AND ETHANOL PRODUCTION
JUICE
Existing Sugar and Ethanol Production Technology

Etanol, Alcoolquímica e BiorrefinariasBNDES Setorial, Rio de Janeiro, n. 25, p. 5-38, mar. 2007
Sugar cane425 million tons
Sugar29 millions tons
Ethanol23 billions cubic meters
50% 50%
Exportation(2/3)
Internal Market(1/3)
Exportation(15%)
Internal Market(85%)
Fuel(50%)
Others uses
(50%)
Fuel(90%)
Others uses
(10%)
Conventional sugar and ethanol chain -
Brazil
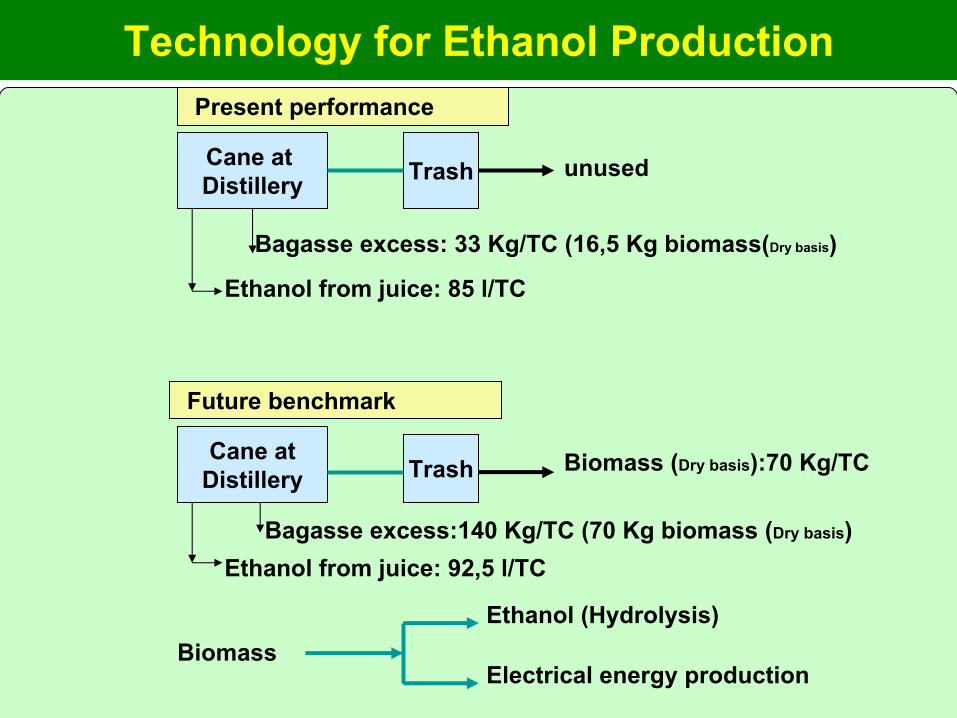
Cane at Distillery Trash
Cane atDistillery Trash
unused
Ethanol from juice: 85 l/TC
Bagasse
excess: 33 Kg/TC (16,5 Kg biomass(Dry
basis
)
Biomass (Dry basis):70 Kg/TC
Ethanol from juice: 92,5 l/TCBagasse
excess:140 Kg/TC (70 Kg biomass (Dry basis)
Present performance
Future benchmark
BiomassEthanol (Hydrolysis)
Electrical energy production
Technology for Ethanol Production
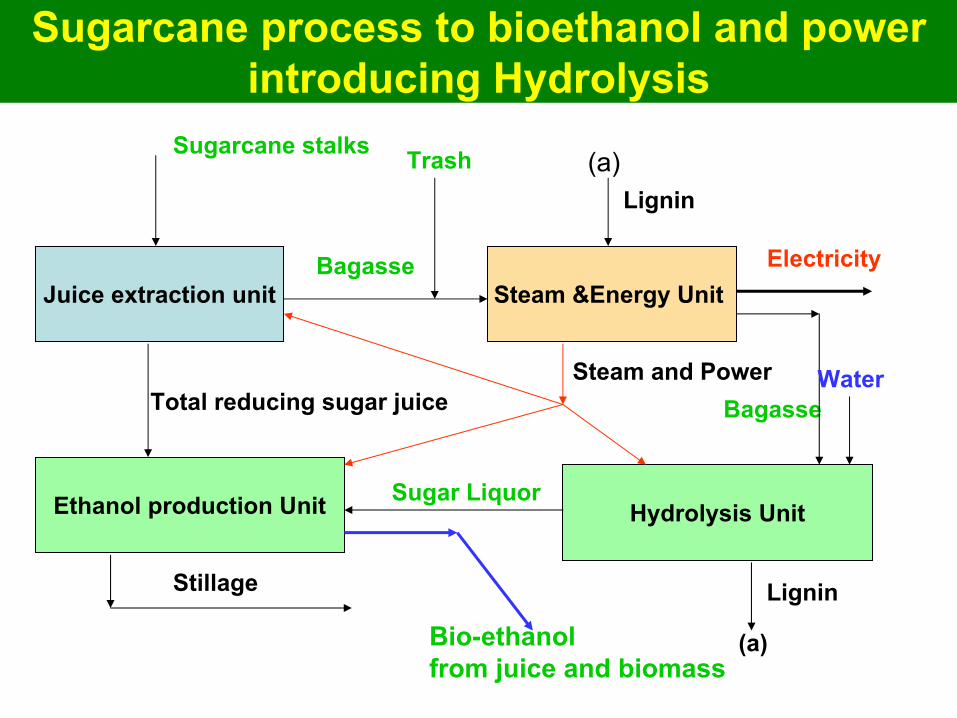
Sugarcane process to bioethanol and power introducing Hydrolysis
Juice extraction unit
Ethanol production Unit
Steam &Energy Unit
Bio-ethanolfrom juice and biomass
Stillage
Total reducing sugar juice Bagasse
Sugarcane stalks
Electricity
Steam and Power
Trash
Hydrolysis UnitSugar Liquor
Bagasse
Water
(a)
(a)
Lignin
Lignin

Bagasse screening and cleaning
Pretreatment andhemicellulose hydrolysis
Cellulose hydrolysis
Purifying and concentration
Liquor separation
Liquor to fermentation
Lignin to power plant
Bagasse
(I)
(II)
(III)
(IV)
(V)
(I)
Rind, pith and sand removed from fiber
(II)
Delignifying and hemicellulose hydrolysis step
(III)
Cellulose conversion by enzyme catalysis
(IV)
Liquor separation from lignin and washing
(V)
Removal of inhibitors and concentration of liquor, recover of condensed water for reuse in process
Pentoses
Water
Water
Hydrolysis Steps
hexoses
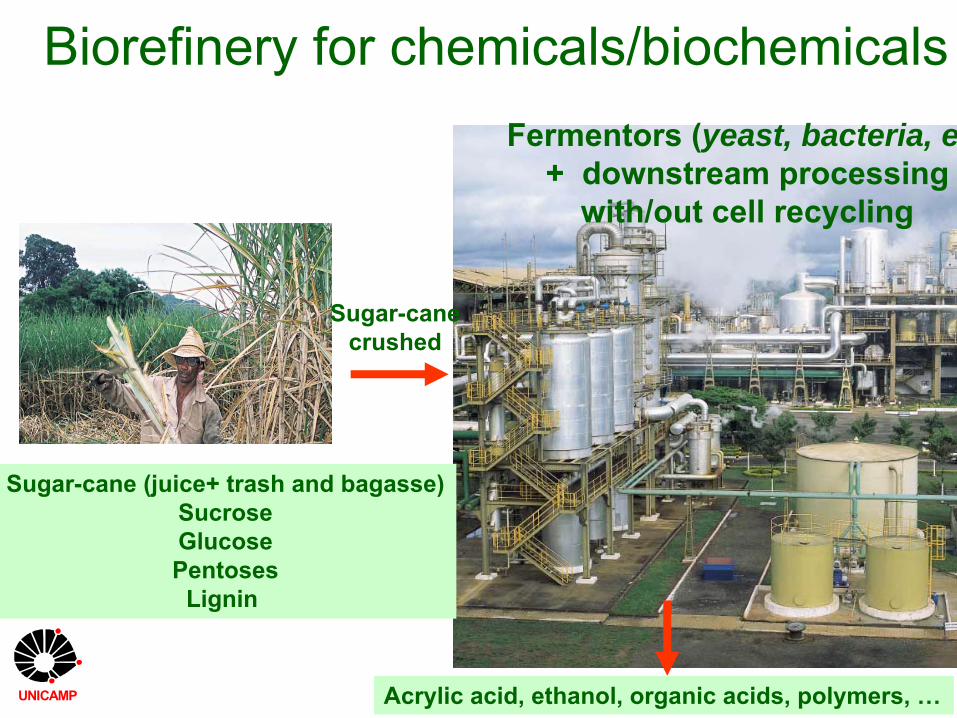
Biorefinery for chemicals/biochemicals
Sugar-cane (juice+ trash and bagasse)SucroseGlucosePentoses
Lignin
Sugar-canecrushed
Acrylic acid, ethanol, organic acids, polymers, …
Fermentors (yeast, bacteria, e+ downstream processing
with/out cell recycling
UNICAMP

Biobased product flow-chain from biomass feedstock
Kamm & Kamm, 2006
Biomass Precurssors Plattaform Building blocks Secondary chemicals
Intermediary chemicals Products
industry
transport
food
environment
comunication
starch
health
leisure
housing

Secondary chemicals and products
•Hemicellulos
e
•Cellulose
SugarsGlucoseFructoseXyloseArabinos
eSucrose
C2
C3
C4
C5
C6
polymer
s
Renewable Biomass feedstock
Intermediate Platform
Fermented chemicals
•Lysine, glutamate•Citric acid •Lactic acid•Fumaric acid•Acetic acid•2,3 butanediol•Acetone/butanol•Bioethanol•Xylitol•Polyhydroxybutyrate•Xanthane
Chemicals & products
•Fuels•Hydrolysed bagasse•Bagasse fibers for paper industry•Acetylated fibers•Furfural•Fructose/glucose•Xylose•Sorbitol•Glycerol•Ethyl acetate•Liquid fertilizers•Yeasts•Polyethylene•Polypropylene (in preparation
+
From: INDUSTRIAL PERSPECTIVES FOR BIOETHANOL. ed. Telma Teixeira
Franco, Editora Uniemp, Sao Paulo, ISBN 85-
98951-06-4, 2006.
Products from sugar-cane -
Brazil
UNICAMP

Present situation -
first generation products
Sugar cane
vinasse
yeast
bioethanol
distillates
sugar
bagasse
fertilizer
•electrical energy • fuel
Product quality
Infrastrutureand
Logistics
Environment
energy
Bonomi, 2006

LEBBPOR -
non bioethanol activities
Chemical Engineering of Unicamp
UNICAMP
Material application
Cellulose & hemicellulose hydrolisate
Succinic acid
L-
and D-lactic acid
Microbial acrylic acid from sugar (2005)Sugar acrylates (sucrose, frutose, etc, from 2003.)
[1] Photobioreactor Light + CO2 Biomass
Biomass Carbohydrates rich /Oil rich (algae)
[2] Conventional fermentation microbial oils from hydrolizates (cells)
Energy application
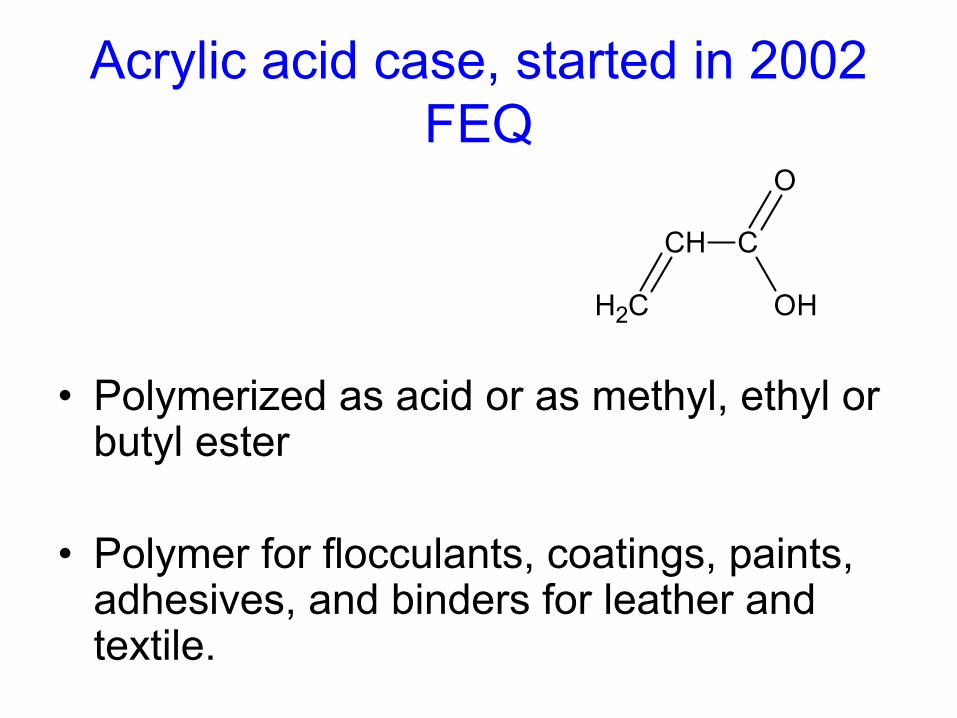
Acrylic acid case, started in 2002 FEQ
•
Polymerized as acid or as methyl, ethyl or butyl ester
•
Polymer for flocculants, coatings, paints, adhesives, and binders for leather and textile.
CH2
CH C
O
OH

Why acrylic acid?
•
Production capacity = 4.2 million tons (2003)
•
Price = 0.85-0.90 $/lb = 1.95 $/kg (Chemical Market
Reporter, 11 April 2005)
•
Market size = $ 8 billion
Straathof, 2005

Alternative routes
Fermentation
Esterification
Fermentation
DehydrationEsterification
Sugar
Lacticacid
Lactic acid ester
Acrylic acid ester
Acrylic acid Dehydration
H2O
H2O
Alcohol
Alcohol

Directly to acrylic acid is attractive
Fermentation
Esterification
Fermentation
DehydrationEsterification
Sugar
Lacticacid
Lactic acid ester
Acrylic acid ester
Acrylic acid Dehydration
H2O
H2O
Alcohol
Alcohol

Direct fermentation of sugars to acrylate
•
Desired stoichiometryC6
H12
O6 ==> 2 CH2
=CH-COOH + 2 H2
O(0.8 kg/kg glucose)
•
ATP formation by this reaction to support growth and maintenance
•
Cell retention/recycling to minimize growth requirements
•
No aeration

Fermentation titers obtained for products related to acrylic acidAcid Final
conc.(g/L)
Ferment- ation pH
Strain Reference
Acetic 180-200 ? Acetobacter (Maselli and Horwarth, 1984)
Propanoic 65 6.5 P. acidipropionici (Huang et al., 2002)
Butanoic 42 6.0 C. tyrobutyricum (Huang et al., 2002)
Lactic 210 6.2 Lactobacillus lactis
(Bai et al., 2003)
Pyruvic 135 5.0 S. cerevisiae (van Maris et al., 2004a)
Fumaric 64 5.5 Rhizopus arrhizus (Riscaldati et al., 2002)
Itaconic 75 2.0 Aspergillus terreus
(Yahiro et al., 1997)

Microbial tolerance to acrylateIn general, a high toxicity is to be expected
BUT:
•
The C=C-COOH sub-structure is present in fumarate and itaconate
•
Some cell types survive 35 g/L acrylate
Using selective pressure, genome shuffling, etc. it is expected that 50 g/L acrylate is a realistic maximum concentration

Hypothetical metabolic pathways to acrylate
sugars
propanoate acrylyl-CoA 3-HP-CoA 3-HP 3-hydroxypropanal
methylcitrate pyruvate oxaloacetate glycerol
propanoyl-CoA lactoyl-CoA β-alanyl-CoA mal. semiald. malonyl-CoA
methionine acetyl-CoA
methylmal.CoA lactate β-alanine
DMSP α-alanine aspartate
acrylate
sugars
propanoate acrylyl-CoA 3-HP-CoA 3-HP 3-hydroxypropanal
methylcitrate pyruvate oxaloacetate glycerol
propanoyl-CoA lactoyl-CoA β-alanyl-CoA mal. semiald. malonyl-CoA
methionine acetyl-CoA
methylmal.CoA lactate β-alanine
DMSP α-alanine aspartate
acrylate
Which might give a high yield?

Lactate pathway
sugars
propanoate acrylyl-CoA 3-HP-CoA 3-HP 3-hydroxypropanal
methylcitrate pyruvate oxaloacetate glycerol
propanoyl-CoA lactoyl-CoA β-alanyl-CoA mal. semiald. malonyl-CoA
methionine acetyl-CoA
methylmal.CoA lactate β-alanine
DMSP α-alanine aspartate
acrylate
sugars
propanoate acrylyl-CoA 3-HP-CoA 3-HP 3-hydroxypropanal
methylcitrate pyruvate oxaloacetate glycerol
propanoyl-CoA lactoyl-CoA β-alanyl-CoA mal. semiald. malonyl-CoA
methionine acetyl-CoA
methylmal.CoA lactate β-alanine
DMSP α-alanine aspartate
acrylate
Keq [acrylylCoA]/[lactoylCoA] = 0.5 % →
low yield

Keq [acrylylCoA]/[3-HPCoA] < 10 % ?Keq [acrylate]/[3-HP] < 10 % ?
3-Hydroxypropanoate (3-HP) pathways
sugars
propanoate acrylyl-CoA 3-HP-CoA 3-HP 3-hydroxypropanal
methylcitrate pyruvate oxaloacetate glycerol
propanoyl-CoA lactoyl-CoA β-alanyl-CoA mal. semiald. malonyl-CoA
methionine acetyl-CoA
methylmal.CoA lactate β-alanine
DMSP α-alanine aspartate
acrylate
sugars
propanoate acrylyl-CoA 3-HP-CoA 3-HP 3-hydroxypropanal
methylcitrate pyruvate oxaloacetate glycerol
propanoyl-CoA lactoyl-CoA β-alanyl-CoA mal. semiald. malonyl-CoA
methionine acetyl-CoA
methylmal.CoA lactate β-alanine
DMSP α-alanine aspartate
acrylate

Export •
Active excretion of acrylic acid is required
•
Export should not consume all ATP
sugars
acrylic acid
sugars
propanoate acrylyl-CoA 3-HP-CoA 3-HP 3-hydroxypropanal
methylcitrate pyruvate oxaloacetate glycerol
propanoyl-CoA lactoyl-CoA β-alanyl-CoA mal. semiald. malonyl-CoA
methionine acetyl-CoA
methylmal.CoA lactate β-alanine
DMSP α-alanine aspartate
acrylate
sugars
propanoate acrylyl-CoA 3-HP-CoA 3-HP 3-hydroxypropanal
methylcitrate pyruvate oxaloacetate glycerol
propanoyl-CoA lactoyl-CoA β-alanyl-CoA mal. semiald. malonyl-CoA
methionine acetyl-CoA
methylmal.CoA lactate β-alanine
DMSP α-alanine aspartate
acrylate

Fermentation process
Microorganism: S. cerevisiaeMode of operation: continuouspH = 7 (controlled by Na2CO3)Some assumptions:
-
Acrylate yield on glucose: 0.72 g.g-1
-
Acrylate concentration: 50 g.l-1
-
Lactate produced: 1 g.l-1

Description of the chosen design
Fermenter
Sucrose
Centrifuge
Organic
Mixingvessel
Extractioncolumn
CO2 (g)
Distillation
Distillation
WaterBack extraction
column
Waste
Acrylicacid
Waste

Conclusions
•
The designed process economically feasible•
Most interesting route:
sugar
acrylic acid•
Preferably at low pH
•
Recombinant biocatalyst might-
survive at 50 g/L
-
produce & excrete acrylic acid -
grow anaerobically
-
show a very high yield on sugars
•
Incentive for checking these speculations

1. If fermentation were at lower pH:
• less sodium carbonate
• less investment in extraction
• less waste
2. Sucrose costs much less, since no refined sugar is required, but probably just sugar-cane juice, as used in ethanol bioproduction.
Improvements to consider

Main gaps in information •
Thermodynamic data of pathway intermediates
•
Existence or accessibility of suitable exporter and pathway enzymes
•
Metabolic consequences of blocking competing pathways
•
Potential tolerance to acrylate•
Equilibrium data for extraction

Building blocks from renewable resources by biocatalysis

Why sugar acrylates?
-
biomedical, chemical and pharmaceutical
applicability ;
•If hydrogels –
water-absorbent materials for applications such as general water absorbents, water-
treatment additives;
• Enzymatic synthesis•Sugar + fatty acid with lipase as biocatalysts –
1980’s.
•Sugar + acrylic / metacrylic acid with lipase (esterification or transesterification) –
1991’s
•BASF patent, indirect esterification of methyl glicosides
Enzymatic direct synthesis of acrylic acid esters of mono and disaccharides, J.Tsukamoto, PhD Thesis. Unicamp, Brazil. 2006

1H-RMN
Acrylic acid
Butyl acrylate
n-butanol
Toluene
CH 3
O H +
O
CH 2
O H
CH 3
O
O C H 2
+ OH 2
C a lB / 5 5 ºC
to lu e n e
n -b u ta n o l a c ry l ic a c id b u ty l a c ry la te
Initially Calb was tested to catalyse n-butanol + acrylic acid esterification.....
Maximize the reacional conditions to increase the conversion to esters of acrylic acid using CalB ;
Evaluate the products by HPLC, MALDI-TOF-MS and KF analysis.

Substrates + media Catalyst (mass) Temp. ºC/time
Conv.(%) Byprod. Ref.:
AA (43.7 mmol) + 1-butanol (43.7 mmol) +toluene(3.5 cm3)
CalB 60 mg
55 / 8 h
61.6 0 Tsukamoto et al, 2006
CalB 200 mg 94.6 0
AA (43.7 mmol) + 1-butanol (43.7 mmol) +toluene(5 cm3)
Cs2.5 H0.5 PW12 O40 (56 mg)
79.85 / 4 h
15.9 3*
Chen et al, 1999.
Cs2.5 H0.5 PW12 O40com. (56 mg) 19.0 2**
Amberlist 15 (14 mg) 33.6 3*
H3 PW12 O40 (25.2 mg) 83.5 3*
H2 SO4 (2.8 mg) 60.2 3*
AA/ButOH (molar ratio: 0.75)
H3 PW12 O40 80 / 4 h25 m. 98.0 ? Dupont et al, 1995.
H2 SO4 80 / 11h17m. 98.0 ?
*
3-butoxypropionic acid; butyl 3-butoxypropanate and butyl 3-acryloxy propanoate**
3-butoxypropionic acid and butyl 3-acryloxy propanoate
Enzymatic conversion of sugars and alchools to acrylate esters

Table 2. Calculated and observed masses (m/z) of sodiated resp. potassiated molecular ions generated in MALDI-TOF MS of hexoses, pentoses, and corresponding acrylates (A: reaction in the presence of molecular sieves; B: in the absence of molecular sieves).
calcd. (m/z) found (m/z) calcd. (m/z) found (m/z) Hexoses D-Fructose D-Glucose Pentose D-Xylose A B A B A B Free sugars [M+Na]+ 203.05 203.20 203.13 203.21 203.24 173.04 173.22 173.24 [M+K]+ 219.02 219.18 219.10 189.01
Monoacrylates [M+Na]+ 257.06 257.24 257.14 257.25 257.28 227.05 227.27 227.29 [M+K]+ 273.03 273.21 273.12 273.23 273.24 243.02
Diacrylates [M+Na]+ 311.07 311.27 311.16 311.28 311.31 281.06 281.32 281.34 [M+K]+ 327.04 327.23 327.13 297.03
Triacrylates [M+Na]+ 365.09 365.51 365.35 365.51 335.08 335.54 [M+K]+ 381.06 351.04
Tetraacrylates [M+Na]+ 419.10 419.60 419.33 419.36 389.09 [M+K]+ 435.07 435.48 405.05
Pentaacrylates [M+Na]+ 473.11 473.65 473.68 [M+K]+ 489.08
MALDI-TOF MS Analysis: monosaccharides

MALDI-TOF MS of the reaction mixtures of the lipase catalyzed esterifications of D-
fructose,
recorded after a reaction time of 48h. Asterisks indicate peaks
from fructose and acrylates.
frutose
Hexose monoacrylate diacrylate

Product
distribution
%
Enzyme reutilization% frutose conversion
assays
daysE.Vagetti, 2008UNICAMP

Photobioreactor for CO2
sequestration and microalgal biomass production
Products
biomass
Fats biodiesel
Polysaccharides& gels
O2
UNICAMP

THE PROBLEMThe industrial processes most contributing to increasing atmospheric CO2
concentrations:
•electrical and petrochemical energy generating plants,
•hydrogen and ammonia producing plants,
•cement factories, and fermentative and chemical oxidation processes.
GHG emissions by sector in 2004 (IPCC, 2007)

Global warming –
possible reasons
PollutionGas emission
Carbon dioxide (CO2
)Methane (CH4
)Nitrous oxide (N2O)Hydrofluorcarbons (HFCs)Perfluorcarbons (PFCs) Sulphur hexafluoride (SF6
)

Global warming consequences
Science, 316, 188-190, 2007.
“Green-house”
effect

PHOTOBIOREACTOR TECHNOLOGY
Initial studies – Japan, decade of 1990’s
Carbon dioxide fixation into microalgal biomass
Current studies show that other products have significance in the process
MICROALGAE
LIGHT ENERGY
WATER
NUTRIENTS PHISICAL CONDITIONS
PHOTOSYNTHETIC PRODUCTS
CO2

THE STRATEGY potentiality for application in stationary sources of carbon dioxide
Biotechnological process for carbon dioxide sequestration

Synechococcus sp. PCC 8806, PCC 8807
Study of CO2 mitigation by calcium carbonate formation.
Lee et al., (2006)
- Development a feasibility model for microalgal CO2 biofixation using photobioreactors equipped with solar collectors.
Ono & Cuello (2006)
Rhodomonas sp. Study of biomass production and carbon fixation in batch culture of the marine microalgae.
Lafarga-De La Cruz et al., (2006)
Chlorella sp. Study of the performance of open photobioreactors on the utilization of CO2 by microalgae. The results indicate that about 70% of supplied CO2 was utilized by the microalgae.
Doucha & Lívanský (2006)
Nannochlopsis oculta
Evaluation of the carbon balance in the bio-fixation of CO2 in photobioreactors.
Hsueh et al., (2007)
Scenedesmus obliquus
Spirulina sp.
CO2 bio-fixation in reactors in series with three stages. The results showed mean fixation rates of 37.9% in cultures carried out with pulses of 15 min/hour at 6% CO2 with a flow rate of 0.3VVM.
Morais & Costa (2007a)
Anabaena variabilis
Study of light transfer in photobioreactors for the production of H2 with the simultaneous removal of COc.
Berberoglu et al., (2007)
Scenedesmus obliquus
Chlorella kessleri
Selection and isolation of species for the biological removal of CO2 from thermoelectric energy generating stations.
Morais & Costa (2007b)
Aphanothece microscopica Nägeli (RSMan92)
Kinetic modelling of carbon dioxide removal in tubular photobioreactors and process optimisation. The kinetic data indicated maximum removal rates of 108.56mgCO2/L.min.
Jacob-Lopes et al., (2007a)
Chlorella sp.
Study of efficiency of CO2 reduction, biomass and lipid productivity in a semicontinuous photobioreactor system. The results obtained estimated maximum elimination capacity of 17.2gCO2/L.day
Chiu et al., (2007)
Chlorella vulgaris Evaluation of the performance of four photobioreactors for CO2 removal. Maximum carbon dioxide conversion rates of 0.275g/L.h were obtained.
Fan et al., (2007)
Chlamydomonas reinhardtii
Chlorella sp.
Evaluation of CO2 uptake and O2 production in a gas-tight photobioreactor.
Eriksen et al., (2007)
Dunaliella parva Study of fluid flow and mass transfer in a counter-current gas–liquid inclined tubes photobioreactor
Merchuk et al., (2007)
Aphanothece microscopica Nägeli (RSMan92)
Evaluation of the growth kinetics of cyanobacteria under different conditions of temperature, light intensity and CO2 concentration. Maximum rates of incorporation of carbon in the biomass of 109.2mgcarbon/L.h were obtained.
Jacob-Lopes et al., (2007b)
Last 2 years literature

Table 3 (continued) KR 2005081766 Continuous photobioreactor for carbon dioxide
removal to inhibit global warming and mass-production of microalgae.
Shin & Chae (2005)
AU 2006100045 Photobioreactor for mitigation of greenhouse gases. Davey (2006)
WO 2006100667 A method for the enhanced production of algal biomass by sequestration of gaseous carbon dioxide.
Eyal & Raz (2006)
WO 20070111343 Photobioreactor for biomass production and mitigation of pollutants in flue gases.
Berzin & Wu (2007)
EP 1801197 Process and photobioreactor for the photosynthetic production of biogas from carbon dioxide.
Klaus et al., (2007)
WO 2007047805 Carbon neutralization system (CNS) for CO2 sequestering.
Sheppard, (2007)
Patents related to carbon sequester processes by microalgae in photobioreactors
WO 2003094598 Photobioreactor and process for biomass production and mitigation of pollutants in flue gas.
Berzin (2003)
US 2005239182 Synthetic and biologically derived products produced using biomass produced by photobioreactors.
Berzin (2005a)
US 2005064577 Hydrogen production with photosynthetic organisms and from biomass derived there from.
Berzin (2005b)

BARRIERS AND LIMITATIONS composition of gases
mixtures, NOx, SOx, CH4, H2, CO
microalgae can assimilate other forms of carbon?
temperature of gases
100 - 300ºC
biological reactions: ~25-35ºC
scale-up

COMERCIAL PROJECTS Solix Biofuels
Greenfuel
Petrosun
HR Biopetroleum/Royal Dutch Shell
HR Biopetroleum, Hawaii, USA (pilot plant, 2 ha)

CASE STUDIES of our laboratory
Fundamental work
Maximization of microalgae growth conditions
Light, CO2
, Temperature, pH variation
Maximization of CO2 conversion and biofixation
Reactor configurations
Integration of refinery wastewater +flue gases

Objective
evaluate the carbon dioxide biofixation and growth kinetics of Aphanothece microscopica Nägeli microalgae under different conditions of temperature, light intensity and CO2 concentration
Conditions tested:
temperature: 21,5, 25, 30, 35 and 38,5ºC
light intensities: 0,96, 3, 6, 9 and 11klux
CO2
concentration: 3, 15, 25, 50 and 62% (v/v)

Experimental apparatus
gas entrance sampler
Polarographic probe
gas exit sampler
Gas inlet
Gas outlet
liquid sampler
Gas mixer
Valve
Gasflow meter
CO2 Air
light
Schematic diagram of the photobioreactor

Results IMPROVING OF CARBON DIOXIDE
BIOFIXATION BY MICROALGAE
30 20 10 0 -2,0 -1,5 -1,0 -0,5 0,0 0,5 1,0 1,5 2,0
Temperature
-2,0
-1,5
-1,0
-0,5
0,0
0,5
1,0
1,5
2,0
Ligh
t int
ensi
ty
40 35 30 25 20 15 10 5
-2,0 -1,5 -1,0 -0,5 0,0 0,5 1,0 1,5 2,0
Light intensity
-2,0
-1,5
-1,0
-0,5
0,0
0,5
1,0
1,5
2,0
CO
2 co
ncen
tratio
n
40 30 20 10 0
-2,0 -1,5 -1,0 -0,5 0,0 0,5 1,0 1,5 2,0
Temperature
-2,0
-1,5
-1,0
-0,5
0,0
0,5
1,0
1,5
2,0
CO
2 co
ncen
tratio
n
Figure 3: Contour curves for carbon fixation rate into biomass by the Aphanothece microscopica Nägeli (cultivations in bubble column reactor). Tested conditions: temperature (21, 25, 30, 35, 38ºC); light intensity (0.96, 3, 6, 9, 11klux) and CO2
concentration (3, 15, 25, 50, 62%).

best values: μmax
: 0.034h-1; Minimal generation time: 17 h
** increase of 58.1% in the carbon fixation rate, no photo inhibition probably due to intracellular carbon concentration mechanism (CO2 HCO3-, CO3
-2
(generation time )duration of logarithmic growth phase
specific
growth rate

Objective
evaluate the carbon dioxide removal rates in the aqueous phase of tubular photobioreactor.
Conditions tested:
temperature: 21,5, 25, 30, 35 and 38,5ºC
light intensities: 0,96, 3, 6, 9 and 11klux
CO2
concentration: 3, 15, 25, 50 and 62% (v/v)

0 1 2 3 4 5
0,0
0,5
1,0
1,5
2,0
2,5
ln [C
O2] 0/[
CO
2]
Time (min)
Removal Loss Model simulation
25ºC, 9klux, 15%
Fit of the experimental data by the integral method for the analysis of first order kinetic data Initial cell conc. 0.1g/l

100 80 60 40 20
-2,0 -1,5 -1,0 -0,5 0,0 0,5 1,0 1,5 2,0
Temperature
-2,0
-1,5
-1,0
-0,5
0,0
0,5
1,0
1,5
2,0
Ligh
t int
ensi
ty
140 100 60 20 -20
-2,0 -1,5 -1,0 -0,5 0,0 0,5 1,0 1,5 2,0
Temperature
-2,0
-1,5
-1,0
-0,5
0,0
0,5
1,0
1,5
2,0
CO
2 co
ncen
tratio
n
120 100 80 60 40 20 0
-2,0 -1,5 -1,0 -0,5 0,0 0,5 1,0 1,5 2,0
Light intensity
-2,0
-1,5
-1,0
-0,5
0,0
0,5
1,0
1,5
2,0
CO
2 co
ncen
tratio
n
IMPROVING OF GLOBAL CARBON DIOXIDE SEQUESTRATION BY MICROALGAE
Contour curves for the variable carbon dioxide removal rate.
*Global sequestration rates indicate the presence of the another
routes of carbon dioxide bioconversion (apart incorporation into biomass):
Precipitation of carbonate and bicarbonate
Exopolymers
Volatile organic compounds (VOC’s)
Carbon fixation rate RCmax
= 109mgCO2
/L.min

Objective
evaluate the effect of the photoperiod on the biomass production and carbon dioxide fixation rates
Conditions tested:
Light cycles: 0:24, 2:22, 4:20, 6:18, 8:16, 10:14, 12:12, 14:10, 16:8, 18:6, 20:4, 22:2 and 24:0 (night:day)

Table 1: Kinetic parameters for Aphanothece microscopica Nägeli in different light cycles

Percent carbon dioxide fixation rates (into biomass) as related to the duration of the light periods (bubble column reactor for optimized conditions).
Final considerations :
Highest CO2
removal very often does not correspond to the highest specific growth rates,
Possibility that photosynthetic reactions also leads to the formation of extracellular products;
CO2
is incorporated to phosphoglycerate (PGA) catalyzed by carbonic
anhydrase
High levels of intracellular CO2
(1000x)

Development of operational strategies to remove carbon dioxide in photobioreactors
Eduardo Jacob-Lopes1, Sergio Revah2, Sergio Hernández3, Keiko Shirai4
and Telma Teixeira Franco1*
1Department of Chemical Processes, Universidade Estadual de Campinas, UNICAMP, Campinas, SP, Brazil. 2Department of Process and Technology, Universidad Autónoma Metropolitana-Cuajimalpa, UAM-C, México DF, México. 3Department of Hydraulic and Process Engineering, Universidad Autónoma Metropolitana-Iztapalapa, UAM-I, Mexico DF, Mexico. 4Department of Biotechnology, Universidad Autónoma Metropolitana-Iztapalapa, UAM-I, Mexico DF, Mexico.
Chemical Engineerind Science, Accepted, 2008.
Objective
evaluate different operational strategies for photobioreactors in order to remove carbon dioxide using microalgae
Conditions tested:reactors: bubble column and airlift
operational mode: simple operation, air recirculation and two stages in series

(5)
(A) BCR reactor with simple operation (B) ALR reactor with simple operation
(C) BCR reactor with air recirculation (D) ALR reactor with air recirculation
(E) BCR reactors in series (F) ALR reactors in series
(5)
(3)
(2)
(7)
(6)
(4)
(1) (5)
(7) (3)
(6)
(4)
(2)
(1)
(5)
(4)
(6)
(3)
(1)
(2)
(4)
(6)
(3)
(2)
(1)
(2)
(4)
(1)
(3)
(4)
(3)
(2)
(1)
[A-B]: (1): reactor; (2): gas entrance sampler; (3): gas exit sampler; (4): liquid sampler.
[C-D] (1): reactor; (2): gas entrance sampler; (3): gas exit sampler; (4): air dehumidifier; (5): storage tank; (6): pump.
[E-F]: (1): reactor 1; (2): gas entrance sampler; (3): gas exit sampler; (4): air dehumidifier, (5): reactor 2; (6): gas entrance sampler; (7): gas exit sampler.

10
15
20
25
30
35
40
45
50
5
10
15
20
25
0 20 40 60 80 100 120 140 160
EC
(g/m
3 .min
)R
E (%
)
Time (h)
Airlift reactors:
Kinetic data for the airlift reactor with simple operation. EC: elimination capacity. RE: removal efficiency.
ECmax
: 46.4g/m3.min
REmax
: 26.9g/m3.min
RV
QoCiCEC
×−=
)(
100)(×
−=
T
oi
CCC
RE
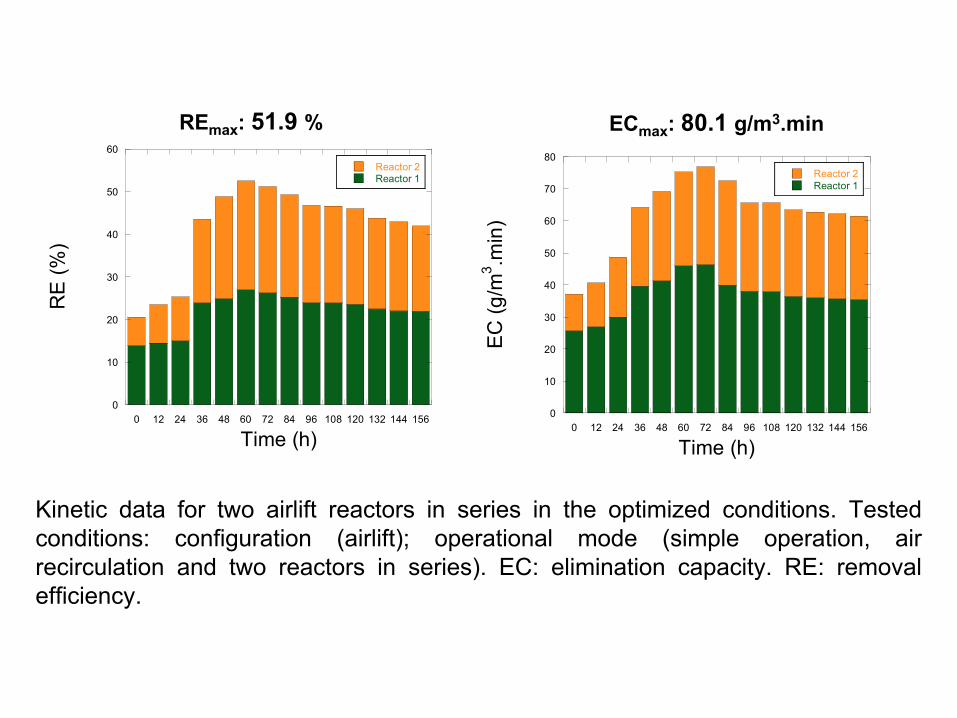
0
10
20
30
40
50
60
0 12 24 36 48 60 72 84 96 108 120 132 144 156
Reactor 2Reactor 1
RE
(%)
Time (h)0
10
20
30
40
50
60
70
80
0 12 24 36 48 60 72 84 96 108 120 132 144 156
Reactor 2Reactor 1
EC
(g/m
3 .min
)
Time (h)
Kinetic data for two airlift reactors in series in the optimized
conditions. Tested conditions: configuration (airlift); operational mode (simple operation, air recirculation and two reactors in series). EC: elimination capacity. RE: removal efficiency.
ECmax
: 80.1
g/m3.min REmax
: 51.9
%

Daily carbon sequestering capacity of the reactors.
System Carbon sequestered(gcarbon
/Lreactor
.day)
BCR (simple operation) 12.90 ± 0.15
BCR (operation with air recirculation) 5.55 ± 0.16
BCR (operation in series) 18.30 ± 0.18
ALR (simple operation) 14.32 ± 0.12
ALR (operation with air recirculation) 8.67 ± 0.10
ALR (operation in series) 24.13 ± 0.09
BCR: bubble column reactor; ALR: airlift reactor
24,13 +0.09

Refinery wastewater improving for microalgal production and CO2 biofixation: predictive modelling
and simulationEduardo Jacob-Lopes1, Carlos Henrique Gimenes Scoparo1, Maria Isabel Queiroz2, Kelerson Modenesi3, Telma
Teixeira Franco1*
1Biochemical Engineering Laboratory, Universidade Estadual de Campinas, UNICAMP, P.O. Box 6066, 13083-970, Campinas-SP, Brazil. 2Biotechnology Laboratory, Chemical Departament, Fundação Universidade Federal do Rio Grande, FURG, 96201-900, Rio Grande-RS, Brazil.3Petróleo Brasileiro S/A –
Replan/Petrobras, 13140-000, Paulínia-SP, Brazil.
Journal of Biotechnology, Submited, 2008.
Industrial approach
refinery flue gases
refinery wastewater
UNICAMP

Petrochemical industry
Generation and consumption of Energy
Refinery Paulínia – Replan/Petrobras (1,04%)
2.954.022 equivalent ton CO2/year (99% CO2)
1.181 ton CH4/year
33 ton N2O
source: Chan, 2007

Parameter Treated effluent*
pH 8.3 ±
0.24Temperature
(ºC)28.1 ±
2.41
BOD (mg/L) 14.0 ±
1.36Nitrite (mg/L) 0.1 ±
0.00Nitrate (mg/L) 15.4 ±
0.32Ammonia
(mg/L)1.2 ±
0.10
Phosphate (mg/L)
0.5 ±
0.00
Phenol (mg/L) 0.02 ±
0.00Cyanide (mg/L) 0.04 ±
0.00Oil and grease
(mg/L)4.6 ±
0.38
TSS (mg/L) 0.13 ±
0.00
Composition of wastewater from refinery industry*Values are means ±
SD of all months considered.
Water collected from the discharge point of the activated sludge treatment for 8 months from May to December of 2007,

0 24 48 72 96 120 144 168
0
1000
2000
3000
4000
5000
6000
Biom
ass
(mg/
L)
Time (h)
Growth curves in the refinery wastewater (closed symbols) and in the synthetic BGN medium (open symbols).
Media Xmax(g/L)
μmax(h-1)
pH (end)
M1 0,16 0,033 8,96
M2 5,06 0,028 9,12
M3 0,71 0,026 8,92
M4 2,28 0,040 8,95
M5 4,92 0,044 9,10
M6 4,34 0,034 8,75
M7 3,80 0,052 9,0
M8 3,43 0,047 9,31
M9 2,05 0,046 8,9
Growth data of Aphanothece microscopica Nägeli in different testsCulture
Medium Composition
M1 refinery wastewater
M2 synthetic BGN medium
M3 75% wastewater and 25% BGN
M4 50% wastewater and 50% BGN
M5 25% wastewater and 75% BGN
M6 wastewater with 100% BGN salts supplementation
M7 wastewater with 75% BGN salts supplementation
M8 wastewater with 50% BGN salts supplementation
M9 wastewater with 25% BGN salts supplementation
To evaluate the use of refinery wastewater in microalgae cultivation for CO2 biofixations

0 20 40 60 80 100 120 140 160 1800
2
4
6
8
10
12
14
16
18
20r (
mg/
L.m
in)
Tempo (h)
CO2 O2
Figure 9: Carbon dioxide sequestration and oxygen release rates; ●
CO2 ○
O2 (measurements in the gaseous phase)
18,71 mgCO2
/L.min 15,97 mgO2
/L.min
CO2
removal rates and O2 release rates (for M9 media)

4 6 8 10 12 14 16 18 200
2
4
6
8
10
12
14
16
18
Y=0,7469XR=0,86
Taxa
de
prod
ução
de
O2 (
mg/
L.m
in)
Taxa de eliminação de CO2 (mg/L.min)
Photosynthetic quotient (PQ)
Ratio between O2
release rate and CO2
sequestration rate
22612622 66126 OOHOHCOHCO ++→+
Elimination rate
O2
produc
.

Liquid phase studies
0 20 40 60 80 100 120 140 160 180
4
6
8
10
12
14
16
18
0 1 2 3 4
0,0
0,5
1,0
1,5
2,0
2,5
ln [C
O2]/
[CO
2] 0
Time (min)
absorption desorption
r CO
2 (mg/
L.m
in)
Time (h)
Carbon dioxide sequestration rates and fit of the experimental data by the integral method (measurements in the liquid phase)
17,07 mgCO2
/L.min
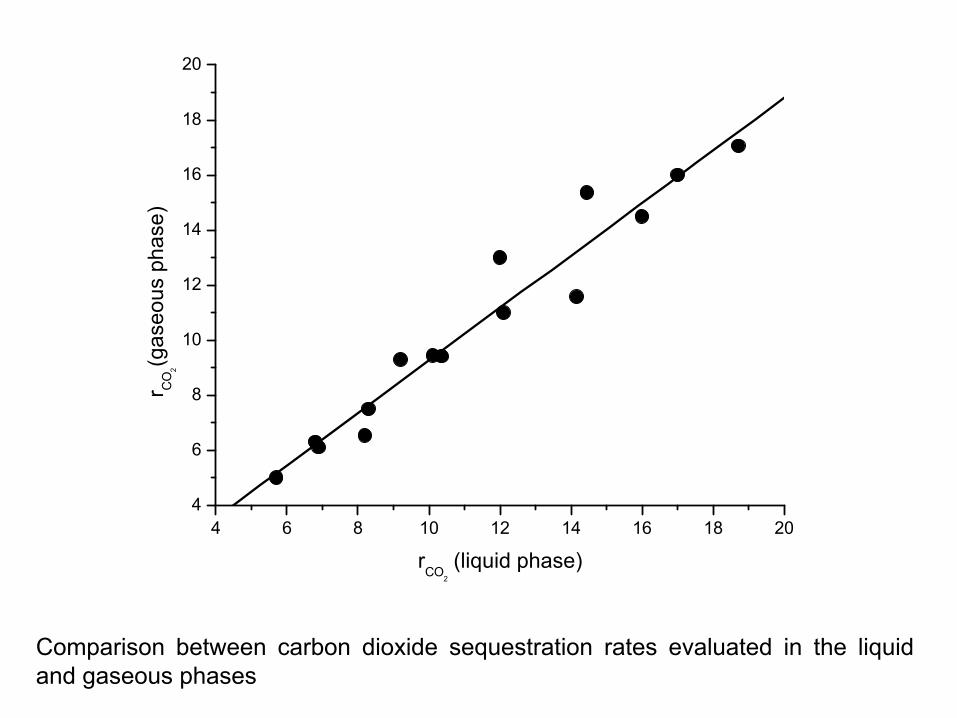
Comparison between carbon dioxide sequestration rates evaluated in the liquid and gaseous phases
4 6 8 10 12 14 16 18 204
6
8
10
12
14
16
18
20
r CO
2
(gas
eous
pha
se)
rCO2
(liquid phase)

Rates of carbon fixation into biomass
Figure 13: Percentage of carbon sequestered effectively fixed into biomass.
Average value : 3,14% Maximum value : 5,25%
0 20 40 60 80 100 120 140 160 1800
1
2
3
4
5
6C
arbo
n fix
ed in
to b
iom
ass
(%)
Time (h)

0.0
0.5
1.0
1.5
2.0
2.5
3.0
0 24 48 72 96 120 144 168
Time (h)ln
(X
/X0)
Experimental
Logis tic
0.0
0.5
1.0
1.5
2.02.5
3.0
0 24 48 72 96 120 144 168Tim e (h)
ln (
X/X 0
)
Experimental
Gompertz
0.0
0.5
1.0
1.5
2.0
2.5
3.0
0 24 48 72 96 120 144 168
Time (h)
ln (
X/X 0
)
Experimental
Modif ied Gompertz
0.0
0.5
1.0
1.5
2.0
2.5
3.0
0 24 48 72 96 120 144 168
Time (h)
ln (X
/X0)
Experimental
Barany i
0.0
0.5
1.0
1.5
2.0
2.5
3.0
0 24 48 72 96 120 144 168
Time (h)
ln (X
/X 0)
Experimental
Morgan
Figure 2: Fit of the models to experimental data.
According to Modifief Gompertz model for the M9 culture medium: μmax=1.22d-1, λ=15h and Xmax=2.05g/L.
Cell concentrations and biofixation were predicted (mass balance to CSTR operation)
58.8kgbiomass.m3.day-1 with a biofixation of 110.0kgCO2.m3.day-1 ;
The amount of produced oil would depend on the strain of the algae;
Moving to continuous operation prediction ...

Ricinus oil sunflower soybean Palm oil cotton
Yields of the crops (year)
% vegetal oil
vegetal oil (kg/ha)

1st
or 3th
generation of biofuels?
Crop
Microbial ×
Soybean1
2700 kg/ha
20% fatty
Cycle 120 days/year
0,46gfatty
/m2.day
Aphanothece2
1,04 g/L.day
7,5% fatty
Cycle 120 days/year
CSTR ≈
few L/m2
1
EMBRAPA, www.embrapa.br, (2008)2
Jacob-Lopes et al. Biochem. Eng. J. (2008)

Thank you
U N IC AM P
Chemical Engineering, FEQUnicamp, Campinas, Brazil


![Plot-based aboveground biomass estimates - TropiSAR sitesPlot-based aboveground biomass estimates - TropiSAR sites RepFOS_15Feb19_TropiSAR.html[13.03.19 11:35:46] ## The reference](https://img.pdfslide.net/doc/110x75/60d4e1a65da05913d232ae0e/plot-based-aboveground-biomass-estimates-tropisar-sites-plot-based-aboveground.jpg)