Embed Size (px)
Citation preview
Available online at www.sciencedirect.com
008) 50–65www.elsevier.com/locate/geoderma
Geoderma 144 (2
Biotic and abiotic factors influencing soil properties across a latitudinalgradient in Victoria Land, Antarctica
N. Cannone a,⁎, D. Wagner b, H.W. Hubberten b, M. Guglielmin c
a Department of Biology and Evolution, University of Ferrara, Corso Ercole I d'Este, 32 – 44100 – Ferrara – Italyb Alfred Wegener Institute for Polar and Marine Research, Potsdam, Germany
c DBSF, University Insubria, Varese, Italy
Abstract
Through the cooperative efforts of the Scientific Committee on Antarctic Research (SCAR) Evolution and Biodiversity in Antarctica (EBA)Project and the Latitudinal Gradient Project (LGP), a monitoring network was established in Victoria Land in 2002 to assess the impacts of climatechange on vegetation, soils, active-layer dynamics, and permafrost across a latitudinal gradient. In this study, we report on the key factorsinfluencing soil development across the gradient, including vegetation, parent material characteristics, and climate. Physical and chemical soilproperties at depths of 2-8 and 10-20 cm were investigated at 7 sites and on 14 permanent plots from Apostrophe Island in Northern Victoria Land(73°30′S, 167°50′E) to Granite Harbour in Southern Victoria Land (77°00′S, 162°26′E) along the Ross Sea coast. The relationships amongvegetation, parent material, and regional climate and soil properties were tested with Principal Component Analyses. There were no significantcorrelations or relationships in soil properties across the climate gradient. In fact, local microclimatic appears to be more effective than the regionalgradient in influencing the properties. Microclimate was also important relative to active-layer depth and vegetation distribution. Lithology wasstrongly related to several chemical parameters, notably extractable Al, Fe, Ca, K, but was unrelated to grain-size distribution. Vegetation wasrelated to the chemistry of the surface-soil layer, including nitrate, organic carbon, C/N ratio and water content, and also the active-layer depth.Penguins had the greatest influence on soil properties in initiating the development of ornithogenic soils. Further analyses on soil properties,including a greater number of sites, will be required to represent more extensively the lithological variability and to extend the latitudinal extremesof the gradient. The results presented here are an important reference for future monitoring activities in Victoria Land.© 2007 Elsevier B.V. All rights reserved.
Keywords: Soil; Vegetation; Active layer; Parent material; Monitoring network; Climate change; Antarctica
1. Introduction
Polar regions are important for assessing and monitoringclimate change impacts on biotic and abiotic components ofAntarctic ecosystems (i.e. Convey, 2001; Doran et al., 2002;Geringhausen et al., 2003; Vaughan et al., 2003; Cook et al.,2005; Turner et al., 2005). Changes in climate may affectvegetation, soil properties, active-layer dynamics, and perma-frost in different ways and these environmental componentsmay interact through complex mechanisms, activating bothpositive and negative feedbacks. These topics have been studiedonly recently in Antarctica (Melick and Seppelt, 1997; Barrett et
⁎ Corresponding author. Tel.: +39 0532 293785; fax: +39 0532 208561.E-mail address: [email protected] (N. Cannone).
0016-7061/$ - see front matter © 2007 Elsevier B.V. All rights reserved.doi:10.1016/j.geoderma.2007.10.008
al., 2006a, 2006b; Beyer et al., 2000; Cannone et al., 2006;Guglielmin et al., 2005, 2008-this issue; Bockheim, 2008-thisissue). Moreover, vegetation and active layer dynamics play animportant role in the carbon cycle (cf., Oechel et al., 2000;Mack et al., 2004; Chapin et al., 2005), although the carboncontent of Antarctic soils is much lower than in the Arctic.
In Antarctica, international panels are addressing the problemof how to detect the effects of climate change on ecosystems. Inparticular, within the framework of the Scientific Committeeon Antarctic Research (SCAR) Evolution and Biodiversity inAntarctica (EBA) program, formerly the Regional Sensitivity toClimate Change in Antarctic terrestrial and limnetic ecosystems(RiSCC) project, specific research protocols have been devel-oped for assessing and monitoring climate change impacts onvegetation, soils, and permafrost. Their main approach is to set
51N. Cannone et al. / Geoderma 144 (2008) 50–65
up networks along latitudinal and environmental gradients(Cannone and Guglielmin, 2003; Cannone, 2004, 2006).
In the frame of the SCAR project EBA and, in cooperationwith the Latitudinal Gradient Project (LGP), a monitoring net-work was established in 2002 and 2003 to assess the impacts ofclimate change on vegetation, soils, and permafrost in VictoriaLand (Continental Antarctica) across a latitudinal gradient(Cannone, 2006). The network includes 7 sites and 14 per-manent plots and is located along a latitudinal gradient fromApostrophe Island (73°30′S, 167°50′E) in Northern VictoriaLand to Finger Point (Granite Harbour) (77°00′S, 162°26′E) inSouthern Victoria Land. Plots are located at key sites along thisgradient so as to include a coastal transect and a coast–inlandsub-transect in the Terra Nova Bay area. The study sites wereselected on the basis of the results of a latitudinal-transectstudy that investigated 25 sites from Cape Hallett (72°76′S,169°56′E) to Lake Fryxell (77°35′S, 163°20′E) (Cannone,2005).
Here we report on work carried out at seven coastal transectsites in Victoria Land to analyze changes in physical andchemical properties of soils in relation to parent material andvegetation conditions along the climatic gradient. The mainaims of the paper are to:
1) describe the main physical and chemical parameters of thesoils within the monitoring network as a reference for futuremonitoring activities;
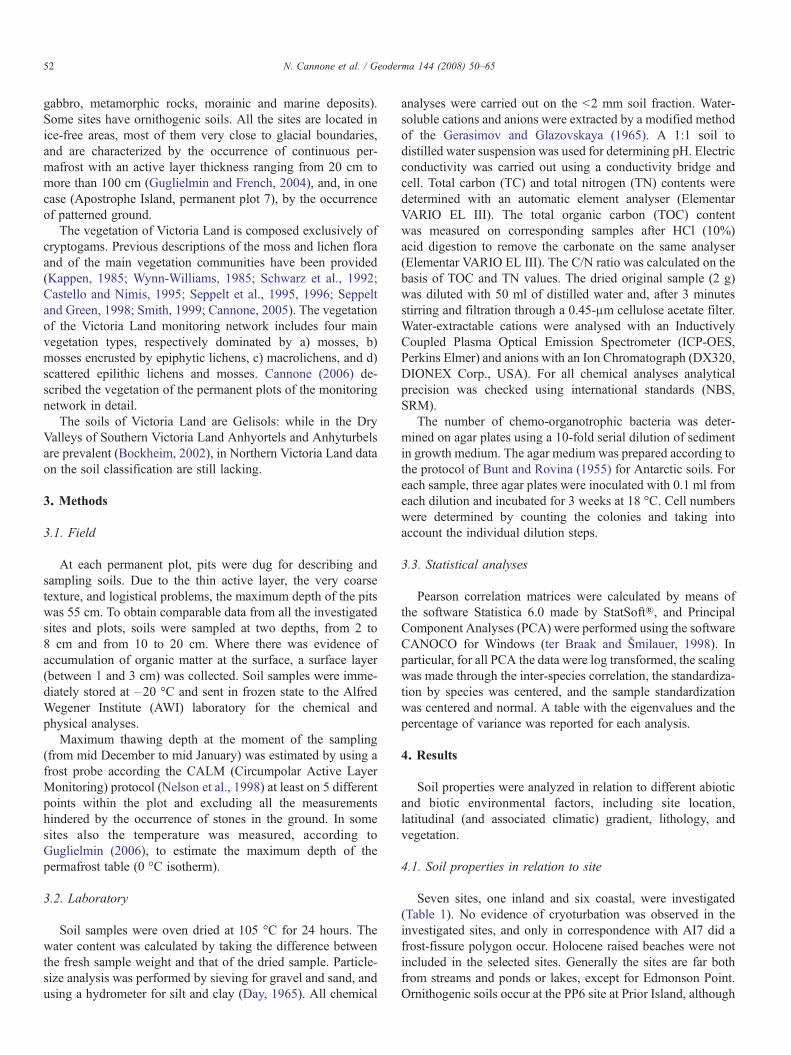
Fig. 1. Location map of the investigated sites in Victoria Land. Legend: AI=ApostropIsland, SN=Starr Nunatak, TF=Tarn Flat.
2) assess the relationships between the soil characteristics anda) the latitudinal gradient, b) the lithology, c) the vegetation.
2. Study Sites
The study area is located in Victoria Land, East Antarcticawhere, within the main latitudinal network, seven sites and 14permanent plots were investigated from Apostrophe Island(73°30′S, 167°50′E) to Finger Point (Granite Harbour) (77°00′S,162°26′E) (Fig. 1). The climate of Victoria Land is a frigidAntarctic one, with a gradient of increasing mean annual airtemperature (MAAT) from (a) Southern Victoria Land, withMAATof –19.9 °C at Scott Base (77° 51′ S; 167°46′E) over theperiod 1957-2005 (Harper, unpublished), to (b) Boulderclay(74°43′ S, 164°05′E), in the vicinity of Mario Zucchelli Station(Terra Nova Bay area), with MATof -16.4 °C to –15.1 °C in theperiod 1997-2003 (Guglielmin, 2006), to (c) Cape Hallett, wheretheMAT is c. –15.3 °C (Duphorn, 1981). Precipitation, always inthe form of snow, is very low and ranges between 100 and200 mm (Grigioni et al., 1992).
All sites are located along the coast, with the exception ofTarn Flat, which is inland on the slope area before the plateau.They have a similar altitudinal range (10 - 250 m a.s.l.) so thatcomparable data, not influenced by elevation, are obtained forassessing relationships along the latitudinal gradient. The sitesrepresent the most common environmental conditions, andalmost all the rock substrates were sampled (i.e. granite, basalts,
he Island, BC=Boulder Clay, ED=Edmonson Point, FP=Finger Point, PI=Prior
52 N. Cannone et al. / Geoderma 144 (2008) 50–65
gabbro, metamorphic rocks, morainic and marine deposits).Some sites have ornithogenic soils. All the sites are located inice-free areas, most of them very close to glacial boundaries,and are characterized by the occurrence of continuous per-mafrost with an active layer thickness ranging from 20 cm tomore than 100 cm (Guglielmin and French, 2004), and, in onecase (Apostrophe Island, permanent plot 7), by the occurrenceof patterned ground.
The vegetation of Victoria Land is composed exclusively ofcryptogams. Previous descriptions of the moss and lichen floraand of the main vegetation communities have been provided(Kappen, 1985; Wynn-Williams, 1985; Schwarz et al., 1992;Castello and Nimis, 1995; Seppelt et al., 1995, 1996; Seppeltand Green, 1998; Smith, 1999; Cannone, 2005). The vegetationof the Victoria Land monitoring network includes four mainvegetation types, respectively dominated by a) mosses, b)mosses encrusted by epiphytic lichens, c) macrolichens, and d)scattered epilithic lichens and mosses. Cannone (2006) de-scribed the vegetation of the permanent plots of the monitoringnetwork in detail.
The soils of Victoria Land are Gelisols: while in the DryValleys of Southern Victoria Land Anhyortels and Anhyturbelsare prevalent (Bockheim, 2002), in Northern Victoria Land dataon the soil classification are still lacking.
3. Methods
3.1. Field
At each permanent plot, pits were dug for describing andsampling soils. Due to the thin active layer, the very coarsetexture, and logistical problems, the maximum depth of the pitswas 55 cm. To obtain comparable data from all the investigatedsites and plots, soils were sampled at two depths, from 2 to8 cm and from 10 to 20 cm. Where there was evidence ofaccumulation of organic matter at the surface, a surface layer(between 1 and 3 cm) was collected. Soil samples were imme-diately stored at –20 °C and sent in frozen state to the AlfredWegener Institute (AWI) laboratory for the chemical andphysical analyses.
Maximum thawing depth at the moment of the sampling(from mid December to mid January) was estimated by using afrost probe according the CALM (Circumpolar Active LayerMonitoring) protocol (Nelson et al., 1998) at least on 5 differentpoints within the plot and excluding all the measurementshindered by the occurrence of stones in the ground. In somesites also the temperature was measured, according toGuglielmin (2006), to estimate the maximum depth of thepermafrost table (0 °C isotherm).
3.2. Laboratory
Soil samples were oven dried at 105 °C for 24 hours. Thewater content was calculated by taking the difference betweenthe fresh sample weight and that of the dried sample. Particle-size analysis was performed by sieving for gravel and sand, andusing a hydrometer for silt and clay (Day, 1965). All chemical
analyses were carried out on the b2 mm soil fraction. Water-soluble cations and anions were extracted by a modified methodof the Gerasimov and Glazovskaya (1965). A 1:1 soil todistilled water suspension was used for determining pH. Electricconductivity was carried out using a conductivity bridge andcell. Total carbon (TC) and total nitrogen (TN) contents weredetermined with an automatic element analyser (ElementarVARIO EL III). The total organic carbon (TOC) contentwas measured on corresponding samples after HCl (10%)acid digestion to remove the carbonate on the same analyser(Elementar VARIO EL III). The C/N ratio was calculated on thebasis of TOC and TN values. The dried original sample (2 g)was diluted with 50 ml of distilled water and, after 3 minutesstirring and filtration through a 0.45-μm cellulose acetate filter.Water-extractable cations were analysed with an InductivelyCoupled Plasma Optical Emission Spectrometer (ICP-OES,Perkins Elmer) and anions with an Ion Chromatograph (DX320,DIONEX Corp., USA). For all chemical analyses analyticalprecision was checked using international standards (NBS,SRM).
The number of chemo-organotrophic bacteria was deter-mined on agar plates using a 10-fold serial dilution of sedimentin growth medium. The agar medium was prepared according tothe protocol of Bunt and Rovina (1955) for Antarctic soils. Foreach sample, three agar plates were inoculated with 0.1 ml fromeach dilution and incubated for 3 weeks at 18 °C. Cell numberswere determined by counting the colonies and taking intoaccount the individual dilution steps.
3.3. Statistical analyses
Pearson correlation matrices were calculated by means ofthe software Statistica 6.0 made by StatSoft®, and PrincipalComponent Analyses (PCA) were performed using the softwareCANOCO for Windows (ter Braak and Šmilauer, 1998). Inparticular, for all PCA the data were log transformed, the scalingwas made through the inter-species correlation, the standardiza-tion by species was centered, and the sample standardizationwas centered and normal. A table with the eigenvalues and thepercentage of variance was reported for each analysis.
4. Results
Soil properties were analyzed in relation to different abioticand biotic environmental factors, including site location,latitudinal (and associated climatic) gradient, lithology, andvegetation.
4.1. Soil properties in relation to site
Seven sites, one inland and six coastal, were investigated(Table 1). No evidence of cryoturbation was observed in theinvestigated sites, and only in correspondence with AI7 did afrost-fissure polygon occur. Holocene raised beaches were notincluded in the selected sites. Generally the sites are far bothfrom streams and ponds or lakes, except for Edmonson Point.Ornithogenic soils occur at the PP6 site at Prior Island, although
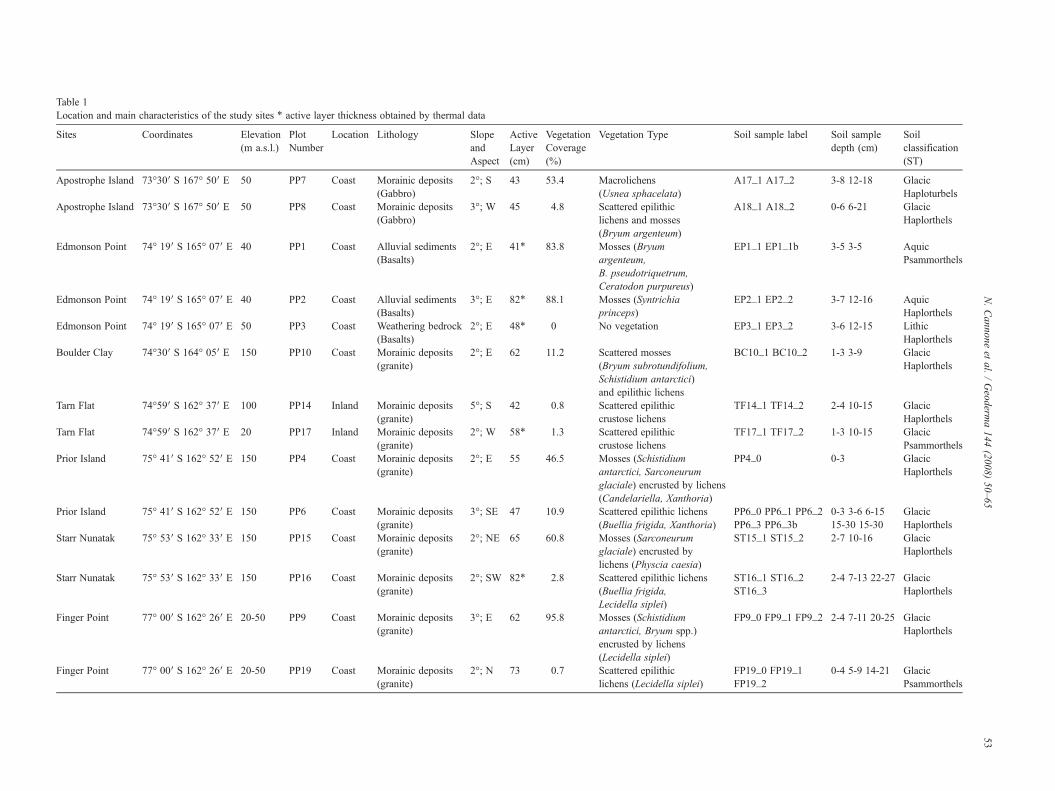
Table 1Location and main characteristics of the study sites ⁎ active layer thickness obtained by thermal data
Sites Coordinates Elevation(m a.s.l.)
PlotNumber
Location Lithology SlopeandAspect
ActiveLayer(cm)
VegetationCoverage(%)
Vegetation Type S sample label Soil sampledepth (cm)
Soilclassification(ST)
Apostrophe Island 73°30′ S 167° 50′ E 50 PP7 Coast Morainic deposits(Gabbro)
2°; S 43 53.4 Macrolichens(Usnea sphacelata)
A _1 A17_2 3-8 12-18 GlacicHaploturbels
Apostrophe Island 73°30′ S 167° 50′ E 50 PP8 Coast Morainic deposits(Gabbro)
3°; W 45 4.8 Scattered epilithiclichens and mosses(Bryum argenteum)
A _1 A18_2 0-6 6-21 GlacicHaplorthels
Edmonson Point 74° 19′ S 165° 07′ E 40 PP1 Coast Alluvial sediments(Basalts)
2°; E 41⁎ 83.8 Mosses (Bryumargenteum,B. pseudotriquetrum,Ceratodon purpureus)
E 1 EP1_1b 3-5 3-5 AquicPsammorthels
Edmonson Point 74° 19′ S 165° 07′ E 40 PP2 Coast Alluvial sediments(Basalts)
3°; E 82⁎ 88.1 Mosses (Syntrichiaprinceps)
E 1 EP2_2 3-7 12-16 AquicHaplorthels
Edmonson Point 74° 19′ S 165° 07′ E 50 PP3 Coast Weathering bedrock(Basalts)
2°; E 48⁎ 0 No vegetation E 1 EP3_2 3-6 12-15 LithicHaplorthels
Boulder Clay 74°30′ S 164° 05′ E 150 PP10 Coast Morainic deposits(granite)
2°; E 62 11.2 Scattered mosses(Bryum subrotundifolium,Schistidium antarctici)and epilithic lichens
B 0_1 BC10_2 1-3 3-9 GlacicHaplorthels
Tarn Flat 74°59′ S 162° 37′ E 100 PP14 Inland Morainic deposits(granite)
5°; S 42 0.8 Scattered epilithiccrustose lichens
T _1 TF14_2 2-4 10-15 GlacicHaplorthels
Tarn Flat 74°59′ S 162° 37′ E 20 PP17 Inland Morainic deposits(granite)
2°; W 58⁎ 1.3 Scattered epilithiccrustose lichens
T _1 TF17_2 1-3 10-15 GlacicPsammorthels
Prior Island 75° 41′ S 162° 52′ E 150 PP4 Coast Morainic deposits(granite)
2°; E 55 46.5 Mosses (Schistidiumantarctici, Sarconeurumglaciale) encrusted by lichens(Candelariella, Xanthoria)
P 0 0-3 GlacicHaplorthels
Prior Island 75° 41′ S 162° 52′ E 150 PP6 Coast Morainic deposits(granite)
3°; SE 47 10.9 Scattered epilithic lichens(Buellia frigida, Xanthoria)
P 0 PP6_1 PP6_2P 3 PP6_3b
0-3 3-6 6-1515-30 15-30
GlacicHaplorthels
Starr Nunatak 75° 53′ S 162° 33′ E 150 PP15 Coast Morainic deposits(granite)
2°; NE 65 60.8 Mosses (Sarconeurumglaciale) encrusted bylichens (Physcia caesia)
S _1 ST15_2 2-7 10-16 GlacicHaplorthels
Starr Nunatak 75° 53′ S 162° 33′ E 150 PP16 Coast Morainic deposits(granite)
2°; SW 82⁎ 2.8 Scattered epilithic lichens(Buellia frigida,Lecidella siplei)
S _1 ST16_2S _3
2-4 7-13 22-27 GlacicHaplorthels
Finger Point 77° 00′ S 162° 26′ E 20-50 PP9 Coast Morainic deposits(granite)
3°; E 62 95.8 Mosses (Schistidiumantarctici, Bryum spp.)encrusted by lichens(Lecidella siplei)
F 0 FP9_1 FP9_2 2-4 7-11 20-25 GlacicHaplorthels
Finger Point 77° 00′ S 162° 26′ E 20-50 PP19 Coast Morainic deposits(granite)
2°; N 73 0.7 Scattered epilithiclichens (Lecidella siplei)
F _0 FP19_1F _2
0-4 5-9 14-21 GlacicPsammorthels
53N.Cannone
etal.
/Geoderm
a144
(2008)50–65
oil
17
18
P1_
P2_
P3_
C1
F14
F17
P4_
P6_P6_T15
T16T16
P9_
P19P19
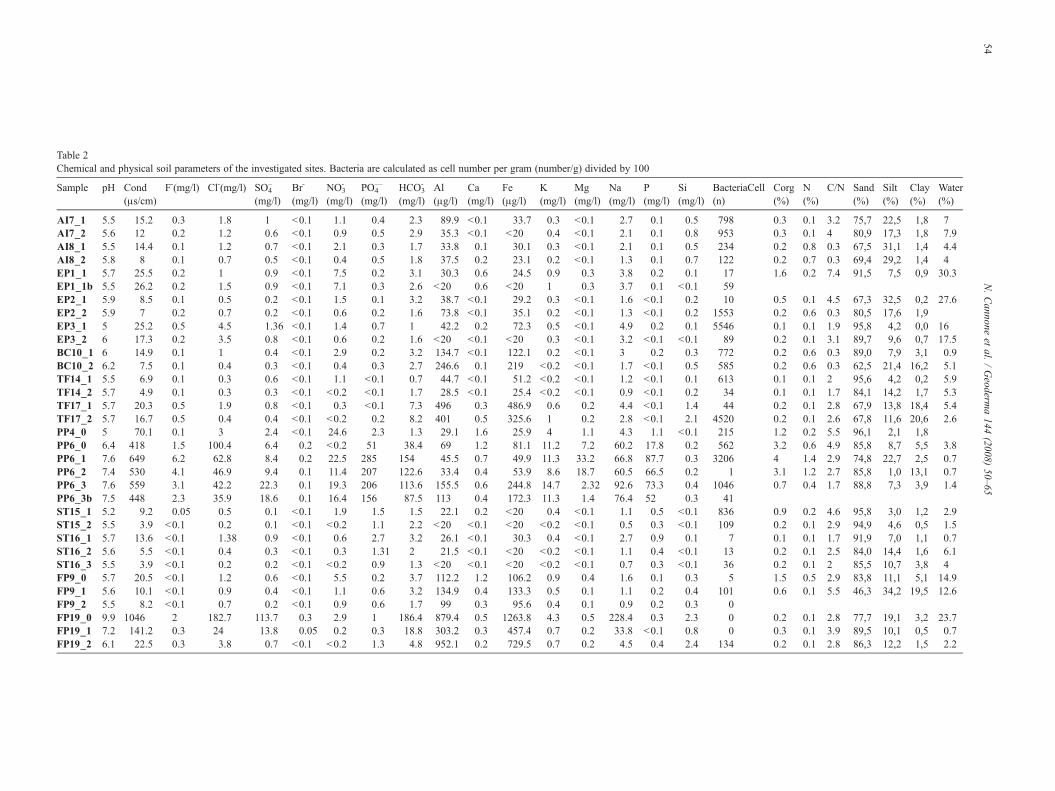
Table 2Chemical and physical soil parameters of the investigated sites. Bacteria are calculated as cell number per gram (number/g) divided by 100
Sample pH Cond(μs/cm)
F-(mg/l) Cl-(mg/l) SO4–
(mg/l)Br-
(mg/l)NO3
-
(mg/l)PO4
—
(mg/l)HCO3
-
(mg/l)Al(μg/l)
Ca(mg/l)
Fe(μg/l)
K(mg/l)
Mg(mg/l)
Na(mg/l)
P(mg/l)
Si(mg/l)
BacteriaCell(n)
Corg(%)
N(%)
C/N Sand(%)
Silt(%)
Clay(%)
Water(%)
AI7_1 5.5 15.2 0.3 1.8 1 b0.1 1.1 0.4 2.3 89.9 b0.1 33.7 0.3 b0.1 2.7 0.1 0.5 798 0.3 0.1 3.2 75,7 22,5 1,8 7AI7_2 5.6 12 0.2 1.2 0.6 b0.1 0.9 0.5 2.9 35.3 b0.1 b20 0.4 b0.1 2.1 0.1 0.8 953 0.3 0.1 4 80,9 17,3 1,8 7.9AI8_1 5.5 14.4 0.1 1.2 0.7 b0.1 2.1 0.3 1.7 33.8 0.1 30.1 0.3 b0.1 2.1 0.1 0.5 234 0.2 0.8 0.3 67,5 31,1 1,4 4.4AI8_2 5.8 8 0.1 0.7 0.5 b0.1 0.4 0.5 1.8 37.5 0.2 23.1 0.2 b0.1 1.3 0.1 0.7 122 0.2 0.7 0.3 69,4 29,2 1,4 4EP1_1 5.7 25.5 0.2 1 0.9 b0.1 7.5 0.2 3.1 30.3 0.6 24.5 0.9 0.3 3.8 0.2 0.1 17 1.6 0.2 7.4 91,5 7,5 0,9 30.3EP1_1b 5.5 26.2 0.2 1.5 0.9 b0.1 7.1 0.3 2.6 b20 0.6 b20 1 0.3 3.7 0.1 b0.1 59EP2_1 5.9 8.5 0.1 0.5 0.2 b0.1 1.5 0.1 3.2 38.7 b0.1 29.2 0.3 b0.1 1.6 b0.1 0.2 10 0.5 0.1 4.5 67,3 32,5 0,2 27.6EP2_2 5.9 7 0.2 0.7 0.2 b0.1 0.6 0.2 1.6 73.8 b0.1 35.1 0.2 b0.1 1.3 b0.1 0.2 1553 0.2 0.6 0.3 80,5 17,6 1,9EP3_1 5 25.2 0.5 4.5 1.36 b0.1 1.4 0.7 1 42.2 0.2 72.3 0.5 b0.1 4.9 0.2 0.1 5546 0.1 0.1 1.9 95,8 4,2 0,0 16EP3_2 6 17.3 0.2 3.5 0.8 b0.1 0.6 0.2 1.6 b20 b0.1 b20 0.3 b0.1 3.2 b0.1 b0.1 89 0.2 0.1 3.1 89,7 9,6 0,7 17.5BC10_1 6 14.9 0.1 1 0.4 b0.1 2.9 0.2 3.2 134.7 b0.1 122.1 0.2 b0.1 3 0.2 0.3 772 0.2 0.6 0.3 89,0 7,9 3,1 0.9BC10_2 6.2 7.5 0.1 0.4 0.3 b0.1 0.4 0.3 2.7 246.6 0.1 219 b0.2 b0.1 1.7 b0.1 0.5 585 0.2 0.6 0.3 62,5 21,4 16,2 5.1TF14_1 5.5 6.9 0.1 0.3 0.6 b0.1 1.1 b0.1 0.7 44.7 b0.1 51.2 b0.2 b0.1 1.2 b0.1 0.1 613 0.1 0.1 2 95,6 4,2 0,2 5.9TF14_2 5.7 4.9 0.1 0.3 0.3 b0.1 b0.2 b0.1 1.7 28.5 b0.1 25.4 b0.2 b0.1 0.9 b0.1 0.2 34 0.1 0.1 1.7 84,1 14,2 1,7 5.3TF17_1 5.7 20.3 0.5 1.9 0.8 b0.1 0.3 b0.1 7.3 496 0.3 486.9 0.6 0.2 4.4 b0.1 1.4 44 0.2 0.1 2.8 67,9 13,8 18,4 5.4TF17_2 5.7 16.7 0.5 0.4 0.4 b0.1 b0.2 0.2 8.2 401 0.5 325.6 1 0.2 2.8 b0.1 2.1 4520 0.2 0.1 2.6 67,8 11,6 20,6 2.6PP4_0 5 70.1 0.1 3 2.4 b0.1 24.6 2.3 1.3 29.1 1.6 25.9 4 1.1 4.3 1.1 b0.1 215 1.2 0.2 5.5 96,1 2,1 1,8PP6_0 6.4 418 1.5 100.4 6.4 0.2 b0.2 51 38.4 69 1.2 81.1 11.2 7.2 60.2 17.8 0.2 562 3.2 0.6 4.9 85,8 8,7 5,5 3.8PP6_1 7.6 649 6.2 62.8 8.4 0.2 22.5 285 154 45.5 0.7 49.9 11.3 33.2 66.8 87.7 0.3 3206 4 1.4 2.9 74,8 22,7 2,5 0.7PP6_2 7.4 530 4.1 46.9 9.4 0.1 11.4 207 122.6 33.4 0.4 53.9 8.6 18.7 60.5 66.5 0.2 1 3.1 1.2 2.7 85,8 1,0 13,1 0.7PP6_3 7.6 559 3.1 42.2 22.3 0.1 19.3 206 113.6 155.5 0.6 244.8 14.7 2.32 92.6 73.3 0.4 1046 0.7 0.4 1.7 88,8 7,3 3,9 1.4PP6_3b 7.5 448 2.3 35.9 18.6 0.1 16.4 156 87.5 113 0.4 172.3 11.3 1.4 76.4 52 0.3 41ST15_1 5.2 9.2 0.05 0.5 0.1 b0.1 1.9 1.5 1.5 22.1 0.2 b20 0.4 b0.1 1.1 0.5 b0.1 836 0.9 0.2 4.6 95,8 3,0 1,2 2.9ST15_2 5.5 3.9 b0.1 0.2 0.1 b0.1 b0.2 1.1 2.2 b20 b0.1 b20 b0.2 b0.1 0.5 0.3 b0.1 109 0.2 0.1 2.9 94,9 4,6 0,5 1.5ST16_1 5.7 13.6 b0.1 1.38 0.9 b0.1 0.6 2.7 3.2 26.1 b0.1 30.3 0.4 b0.1 2.7 0.9 0.1 7 0.1 0.1 1.7 91,9 7,0 1,1 0.7ST16_2 5.6 5.5 b0.1 0.4 0.3 b0.1 0.3 1.31 2 21.5 b0.1 b20 b0.2 b0.1 1.1 0.4 b0.1 13 0.2 0.1 2.5 84,0 14,4 1,6 6.1ST16_3 5.5 3.9 b0.1 0.2 0.2 b0.1 b0.2 0.9 1.3 b20 b0.1 b20 b0.2 b0.1 0.7 0.3 b0.1 36 0.2 0.1 2 85,5 10,7 3,8 4FP9_0 5.7 20.5 b0.1 1.2 0.6 b0.1 5.5 0.2 3.7 112.2 1.2 106.2 0.9 0.4 1.6 0.1 0.3 5 1.5 0.5 2.9 83,8 11,1 5,1 14.9FP9_1 5.6 10.1 b0.1 0.9 0.4 b0.1 1.1 0.6 3.2 134.9 0.4 133.3 0.5 0.1 1.1 0.2 0.4 101 0.6 0.1 5.5 46,3 34,2 19,5 12.6FP9_2 5.5 8.2 b0.1 0.7 0.2 b0.1 0.9 0.6 1.7 99 0.3 95.6 0.4 0.1 0.9 0.2 0.3 0FP19_0 9.9 1046 2 182.7 113.7 0.3 2.9 1 186.4 879.4 0.5 1263.8 4.3 0.5 228.4 0.3 2.3 0 0.2 0.1 2.8 77,7 19,1 3,2 23.7FP19_1 7.2 141.2 0.3 24 13.8 0.05 0.2 0.3 18.8 303.2 0.3 457.4 0.7 0.2 33.8 b0.1 0.8 0 0.3 0.1 3.9 89,5 10,1 0,5 0.7FP19_2 6.1 22.5 0.3 3.8 0.7 b0.1 b0.2 1.3 4.8 952.1 0.2 729.5 0.7 0.2 4.5 0.4 2.4 134 0.2 0.1 2.8 86,3 12,2 1,5 2.2
54N.Cannone
etal.
/Geoderm
a144
(2008)50–65
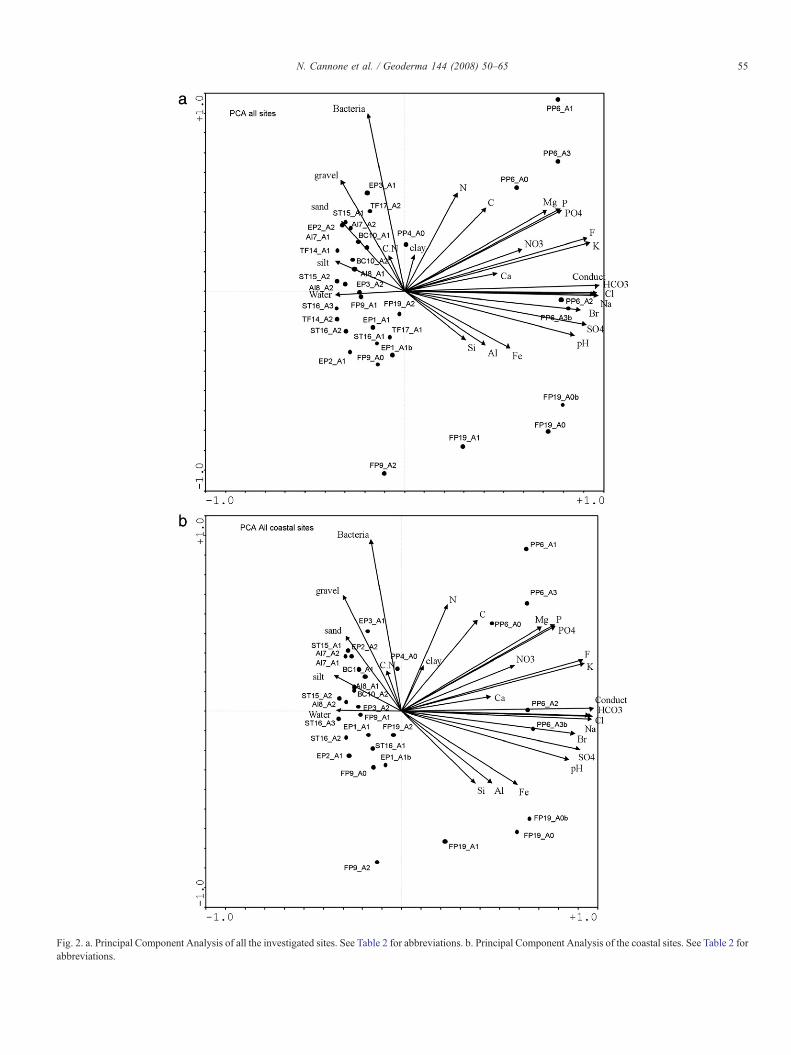
Fig. 2. a. Principal Component Analysis of all the investigated sites. See Table 2 for abbreviations. b. Principal Component Analysis of the coastal sites. See Table 2 forabbreviations.
55N. Cannone et al. / Geoderma 144 (2008) 50–65
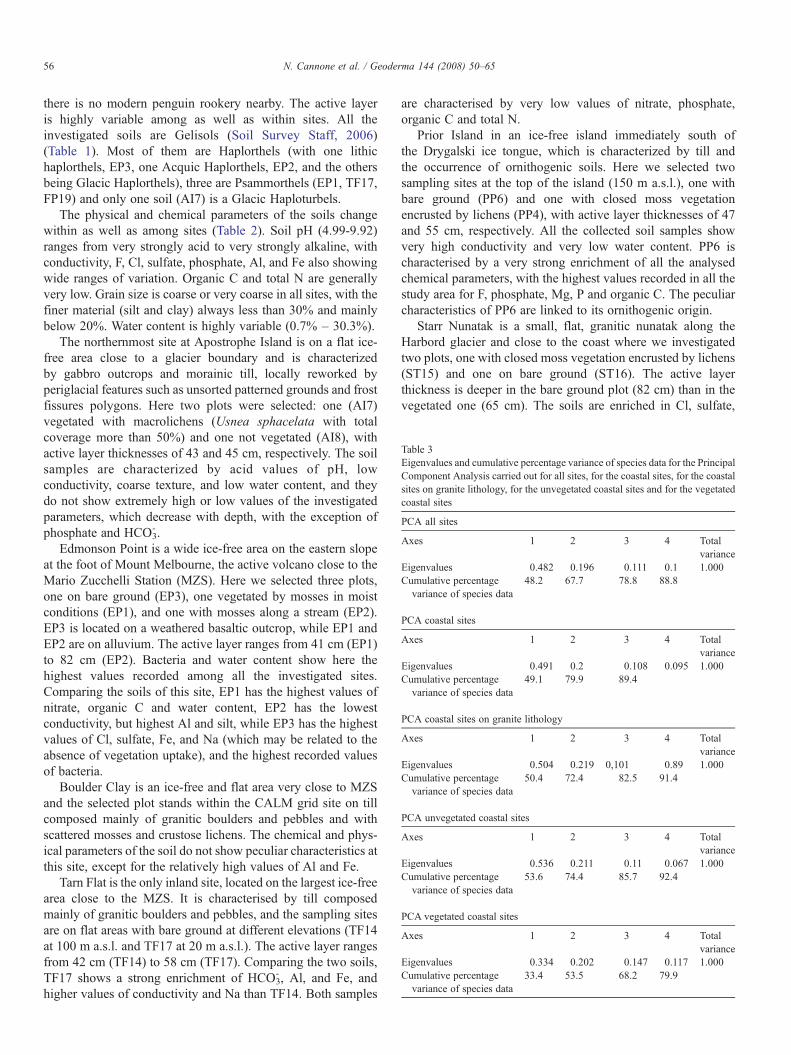
Table 3Eigenvalues and cumulative percentage variance of species data for the PrincipalComponent Analysis carried out for all sites, for the coastal sites, for the coastalsites on granite lithology, for the unvegetated coastal sites and for the vegetatedcoastal sites
PCA all sites
Axes 1 2 3 4 Totalvariance
Eigenvalues 0.482 0.196 0.111 0.1 1.000Cumulative percentagevariance of species data
48.2 67.7 78.8 88.8
PCA coastal sites
Axes 1 2 3 4 Totalvariance
Eigenvalues 0.491 0.2 0.108 0.095 1.000Cumulative percentagevariance of species data
49.1 79.9 89.4
PCA coastal sites on granite lithology
Axes 1 2 3 4 Totalvariance
Eigenvalues 0.504 0.219 0,101 0.89 1.000Cumulative percentagevariance of species data
50.4 72.4 82.5 91.4
PCA unvegetated coastal sites
Axes 1 2 3 4 Totalvariance
Eigenvalues 0.536 0.211 0.11 0.067 1.000Cumulative percentagevariance of species data
53.6 74.4 85.7 92.4
PCA vegetated coastal sites
Axes 1 2 3 4 Totalvariance
Eigenvalues 0.334 0.202 0.147 0.117 1.000Cumulative percentagevariance of species data
33.4 53.5 68.2 79.9
56 N. Cannone et al. / Geoderma 144 (2008) 50–65
there is no modern penguin rookery nearby. The active layeris highly variable among as well as within sites. All theinvestigated soils are Gelisols (Soil Survey Staff, 2006)(Table 1). Most of them are Haplorthels (with one lithichaplorthels, EP3, one Acquic Haplorthels, EP2, and the othersbeing Glacic Haplorthels), three are Psammorthels (EP1, TF17,FP19) and only one soil (AI7) is a Glacic Haploturbels.
The physical and chemical parameters of the soils changewithin as well as among sites (Table 2). Soil pH (4.99-9.92)ranges from very strongly acid to very strongly alkaline, withconductivity, F, Cl, sulfate, phosphate, Al, and Fe also showingwide ranges of variation. Organic C and total N are generallyvery low. Grain size is coarse or very coarse in all sites, with thefiner material (silt and clay) always less than 30% and mainlybelow 20%. Water content is highly variable (0.7% – 30.3%).
The northernmost site at Apostrophe Island is on a flat ice-free area close to a glacier boundary and is characterizedby gabbro outcrops and morainic till, locally reworked byperiglacial features such as unsorted patterned grounds and frostfissures polygons. Here two plots were selected: one (AI7)vegetated with macrolichens (Usnea sphacelata with totalcoverage more than 50%) and one not vegetated (AI8), withactive layer thicknesses of 43 and 45 cm, respectively. The soilsamples are characterized by acid values of pH, lowconductivity, coarse texture, and low water content, and theydo not show extremely high or low values of the investigatedparameters, which decrease with depth, with the exception ofphosphate and HCO3
- .Edmonson Point is a wide ice-free area on the eastern slope
at the foot of Mount Melbourne, the active volcano close to theMario Zucchelli Station (MZS). Here we selected three plots,one on bare ground (EP3), one vegetated by mosses in moistconditions (EP1), and one with mosses along a stream (EP2).EP3 is located on a weathered basaltic outcrop, while EP1 andEP2 are on alluvium. The active layer ranges from 41 cm (EP1)to 82 cm (EP2). Bacteria and water content show here thehighest values recorded among all the investigated sites.Comparing the soils of this site, EP1 has the highest values ofnitrate, organic C and water content, EP2 has the lowestconductivity, but highest Al and silt, while EP3 has the highestvalues of Cl, sulfate, Fe, and Na (which may be related to theabsence of vegetation uptake), and the highest recorded valuesof bacteria.
Boulder Clay is an ice-free and flat area very close to MZSand the selected plot stands within the CALM grid site on tillcomposed mainly of granitic boulders and pebbles and withscattered mosses and crustose lichens. The chemical and phys-ical parameters of the soil do not show peculiar characteristics atthis site, except for the relatively high values of Al and Fe.
Tarn Flat is the only inland site, located on the largest ice-freearea close to the MZS. It is characterised by till composedmainly of granitic boulders and pebbles, and the sampling sitesare on flat areas with bare ground at different elevations (TF14at 100 m a.s.l. and TF17 at 20 m a.s.l.). The active layer rangesfrom 42 cm (TF14) to 58 cm (TF17). Comparing the two soils,TF17 shows a strong enrichment of HCO3
- , Al, and Fe, andhigher values of conductivity and Na than TF14. Both samples
are characterised by very low values of nitrate, phosphate,organic C and total N.
Prior Island in an ice-free island immediately south ofthe Drygalski ice tongue, which is characterized by till andthe occurrence of ornithogenic soils. Here we selected twosampling sites at the top of the island (150 m a.s.l.), one withbare ground (PP6) and one with closed moss vegetationencrusted by lichens (PP4), with active layer thicknesses of 47and 55 cm, respectively. All the collected soil samples showvery high conductivity and very low water content. PP6 ischaracterised by a very strong enrichment of all the analysedchemical parameters, with the highest values recorded in all thestudy area for F, phosphate, Mg, P and organic C. The peculiarcharacteristics of PP6 are linked to its ornithogenic origin.
Starr Nunatak is a small, flat, granitic nunatak along theHarbord glacier and close to the coast where we investigatedtwo plots, one with closed moss vegetation encrusted by lichens(ST15) and one on bare ground (ST16). The active layerthickness is deeper in the bare ground plot (82 cm) than in thevegetated one (65 cm). The soils are enriched in Cl, sulfate,
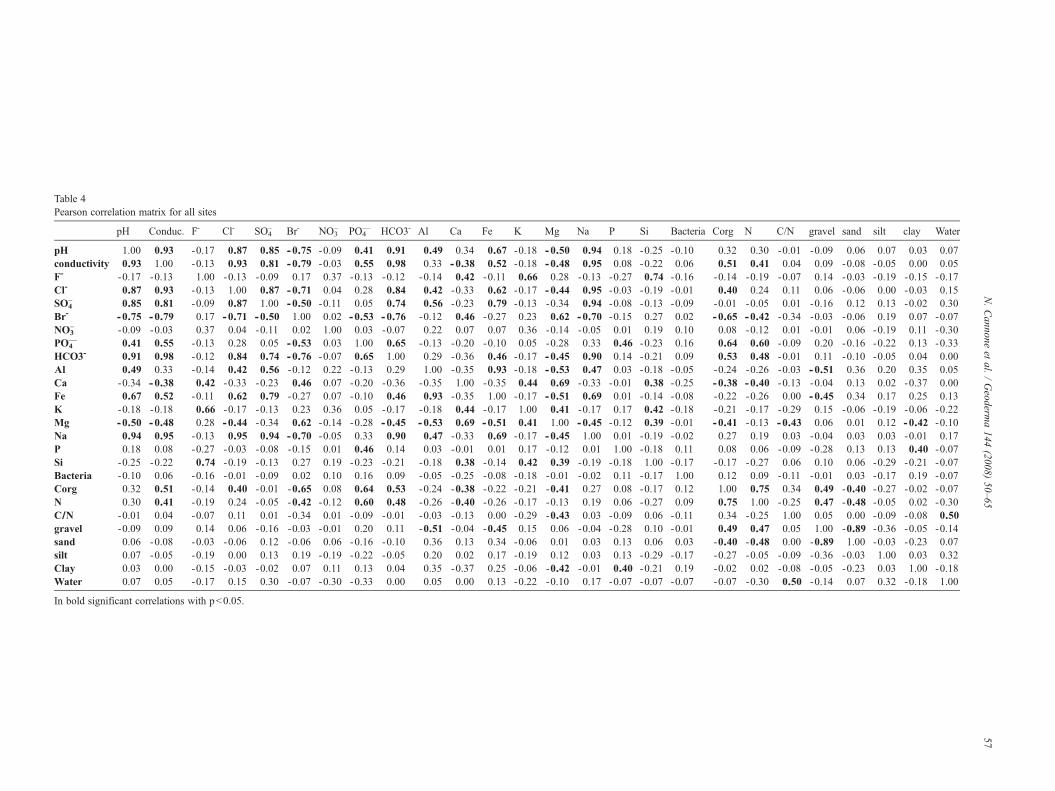
Table 4Pearson correlation matrix for all sites
pH Conduc. F- Cl- SO4– Br- NO3
– PO4— HCO3- Al Ca Fe K Mg Na P Si Bacteria Corg N C/N gravel sand silt clay Water
pH 1.00 0.93 -0.17 0.87 0.85 -0.75 -0.09 0.41 0.91 0.49 0.34 0.67 -0.18 -0.50 0.94 0.18 -0.25 -0.10 0.32 0.30 -0.01 -0.09 0.06 0.07 0.03 0.07conductivity 0.93 1.00 -0.13 0.93 0.81 -0.79 -0.03 0.55 0.98 0.33 -0.38 0.52 -0.18 -0.48 0.95 0.08 -0.22 0.06 0.51 0.41 0.04 0.09 -0.08 -0.05 0.00 0.05F- -0.17 -0.13 1.00 -0.13 -0.09 0.17 0.37 -0.13 -0.12 -0.14 0.42 -0.11 0.66 0.28 -0.13 -0.27 0.74 -0.16 -0.14 -0.19 -0.07 0.14 -0.03 -0.19 -0.15 -0.17Cl- 0.87 0.93 -0.13 1.00 0.87 -0.71 0.04 0.28 0.84 0.42 -0.33 0.62 -0.17 -0.44 0.95 -0.03 -0.19 -0.01 0.40 0.24 0.11 0.06 -0.06 0.00 -0.03 0.15SO4
– 0.85 0.81 -0.09 0.87 1.00 -0.50 -0.11 0.05 0.74 0.56 -0.23 0.79 -0.13 -0.34 0.94 -0.08 -0.13 -0.09 -0.01 -0.05 0.01 -0.16 0.12 0.13 -0.02 0.30Br- -0.75 -0.79 0.17 -0.71 -0.50 1.00 0.02 -0.53 -0.76 -0.12 0.46 -0.27 0.23 0.62 -0.70 -0.15 0.27 0.02 -0.65 -0.42 -0.34 -0.03 -0.06 0.19 0.07 -0.07NO3
– -0.09 -0.03 0.37 0.04 -0.11 0.02 1.00 0.03 -0.07 0.22 0.07 0.07 0.36 -0.14 -0.05 0.01 0.19 0.10 0.08 -0.12 0.01 -0.01 0.06 -0.19 0.11 -0.30PO4
— 0.41 0.55 -0.13 0.28 0.05 -0.53 0.03 1.00 0.65 -0.13 -0.20 -0.10 0.05 -0.28 0.33 0.46 -0.23 0.16 0.64 0.60 -0.09 0.20 -0.16 -0.22 0.13 -0.33HCO3- 0.91 0.98 -0.12 0.84 0.74 -0.76 -0.07 0.65 1.00 0.29 -0.36 0.46 -0.17 -0.45 0.90 0.14 -0.21 0.09 0.53 0.48 -0.01 0.11 -0.10 -0.05 0.04 0.00Al 0.49 0.33 -0.14 0.42 0.56 -0.12 0.22 -0.13 0.29 1.00 -0.35 0.93 -0.18 -0.53 0.47 0.03 -0.18 -0.05 -0.24 -0.26 -0.03 -0.51 0.36 0.20 0.35 0.05Ca -0.34 -0.38 0.42 -0.33 -0.23 0.46 0.07 -0.20 -0.36 -0.35 1.00 -0.35 0.44 0.69 -0.33 -0.01 0.38 -0.25 -0.38 -0.40 -0.13 -0.04 0.13 0.02 -0.37 0.00Fe 0.67 0.52 -0.11 0.62 0.79 -0.27 0.07 -0.10 0.46 0.93 -0.35 1.00 -0.17 -0.51 0.69 0.01 -0.14 -0.08 -0.22 -0.26 0.00 -0.45 0.34 0.17 0.25 0.13K -0.18 -0.18 0.66 -0.17 -0.13 0.23 0.36 0.05 -0.17 -0.18 0.44 -0.17 1.00 0.41 -0.17 0.17 0.42 -0.18 -0.21 -0.17 -0.29 0.15 -0.06 -0.19 -0.06 -0.22Mg -0.50 -0.48 0.28 -0.44 -0.34 0.62 -0.14 -0.28 -0.45 -0.53 0.69 -0.51 0.41 1.00 -0.45 -0.12 0.39 -0.01 -0.41 -0.13 -0.43 0.06 0.01 0.12 -0.42 -0.10Na 0.94 0.95 -0.13 0.95 0.94 -0.70 -0.05 0.33 0.90 0.47 -0.33 0.69 -0.17 -0.45 1.00 0.01 -0.19 -0.02 0.27 0.19 0.03 -0.04 0.03 0.03 -0.01 0.17P 0.18 0.08 -0.27 -0.03 -0.08 -0.15 0.01 0.46 0.14 0.03 -0.01 0.01 0.17 -0.12 0.01 1.00 -0.18 0.11 0.08 0.06 -0.09 -0.28 0.13 0.13 0.40 -0.07Si -0.25 -0.22 0.74 -0.19 -0.13 0.27 0.19 -0.23 -0.21 -0.18 0.38 -0.14 0.42 0.39 -0.19 -0.18 1.00 -0.17 -0.17 -0.27 0.06 0.10 0.06 -0.29 -0.21 -0.07Bacteria -0.10 0.06 -0.16 -0.01 -0.09 0.02 0.10 0.16 0.09 -0.05 -0.25 -0.08 -0.18 -0.01 -0.02 0.11 -0.17 1.00 0.12 0.09 -0.11 -0.01 0.03 -0.17 0.19 -0.07Corg 0.32 0.51 -0.14 0.40 -0.01 -0.65 0.08 0.64 0.53 -0.24 -0.38 -0.22 -0.21 -0.41 0.27 0.08 -0.17 0.12 1.00 0.75 0.34 0.49 -0.40 -0.27 -0.02 -0.07N 0.30 0.41 -0.19 0.24 -0.05 -0.42 -0.12 0.60 0.48 -0.26 -0.40 -0.26 -0.17 -0.13 0.19 0.06 -0.27 0.09 0.75 1.00 -0.25 0.47 -0.48 -0.05 0.02 -0.30C/N -0.01 0.04 -0.07 0.11 0.01 -0.34 0.01 -0.09 -0.01 -0.03 -0.13 0.00 -0.29 -0.43 0.03 -0.09 0.06 -0.11 0.34 -0.25 1.00 0.05 0.00 -0.09 -0.08 0.50gravel -0.09 0.09 0.14 0.06 -0.16 -0.03 -0.01 0.20 0.11 -0.51 -0.04 -0.45 0.15 0.06 -0.04 -0.28 0.10 -0.01 0.49 0.47 0.05 1.00 -0.89 -0.36 -0.05 -0.14sand 0.06 -0.08 -0.03 -0.06 0.12 -0.06 0.06 -0.16 -0.10 0.36 0.13 0.34 -0.06 0.01 0.03 0.13 0.06 0.03 -0.40 -0.48 0.00 -0.89 1.00 -0.03 -0.23 0.07silt 0.07 -0.05 -0.19 0.00 0.13 0.19 -0.19 -0.22 -0.05 0.20 0.02 0.17 -0.19 0.12 0.03 0.13 -0.29 -0.17 -0.27 -0.05 -0.09 -0.36 -0.03 1.00 0.03 0.32Clay 0.03 0.00 -0.15 -0.03 -0.02 0.07 0.11 0.13 0.04 0.35 -0.37 0.25 -0.06 -0.42 -0.01 0.40 -0.21 0.19 -0.02 0.02 -0.08 -0.05 -0.23 0.03 1.00 -0.18Water 0.07 0.05 -0.17 0.15 0.30 -0.07 -0.30 -0.33 0.00 0.05 0.00 0.13 -0.22 -0.10 0.17 -0.07 -0.07 -0.07 -0.07 -0.30 0.50 -0.14 0.07 0.32 -0.18 1.00
In bold significant correlations with pb0.05.
57N.Cannone
etal.
/Geoderm
a144
(2008)50–65
58 N. Cannone et al. / Geoderma 144 (2008) 50–65
phosphate, HCO3- and Na in the bare ground plot (ST16) with
respect to the vegetated one (ST15), which shows higher nitrateand organic C concentrations in the upper soil layers.
Finger Point is the southernmost location along the lati-tudinal gradient and is a flat area along the coast characterizedby till deposits mainly composed of granitic boulders. Also inthis case, we selected two sites close to each other but withdifferent vegetation (FP9 with closed moss cover, and FP19 onbare ground). Also at Finger Point, the bare ground has a thickeractive layer than the moss vegetated ground (73 versus 62 cm).The two soils show very different characteristics; moreover,FP19 is totally different from all the other analysed soils withthe highest values of most of the investigated parameters (pH,conductivity, Cl, sulfate, HCO3
- , Al, Fe, Na, Si).
4.2. Patterns of soil characteristics with latitude
To investigate the potential occurrence of broad patternsinfluencing the soil characteristics, two Principal ComponentAnalyses (PCA) were performed, one considering all the inves-tigated sites (Fig. 2a; Table 3) and the other only the coastal sites(Fig. 2b; Table 3). PCA provides indirect information on therelations between the analysed parameters (represented byvectors/arrows) and the sites (represented by points). The lengthof the vectors/arrows indicates the importance of the analysedparameters, the distribution of the vectors indicates a positive ornegative influence respect to the clusters of sites.
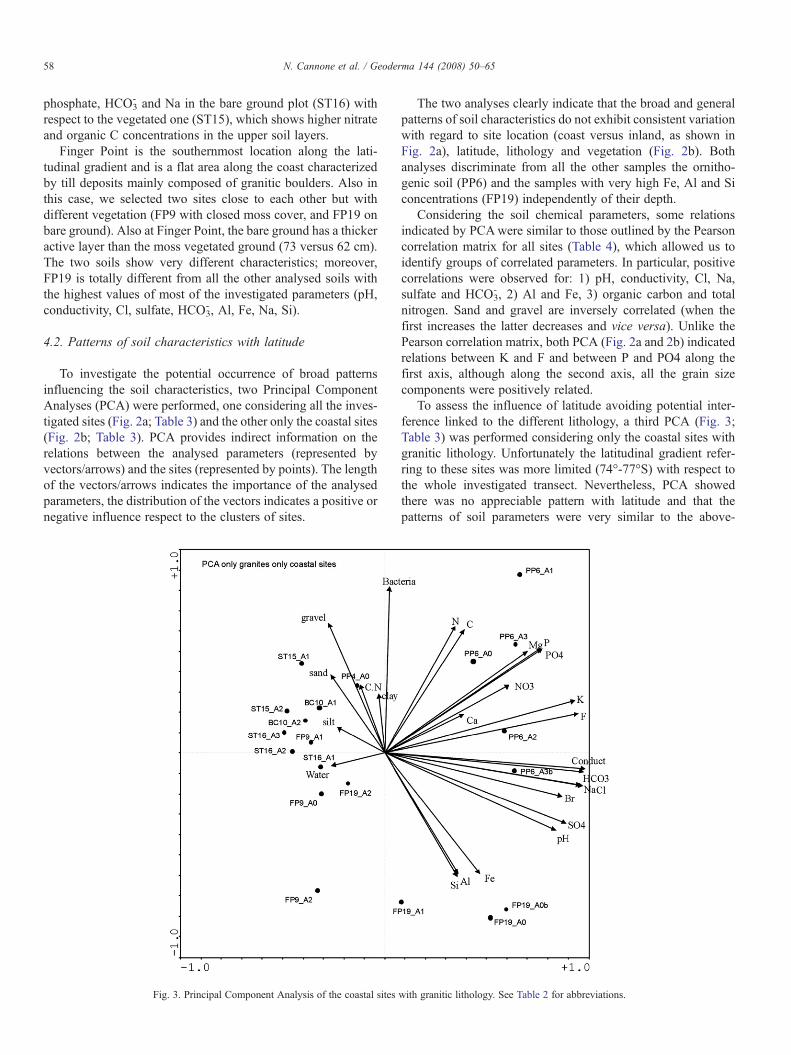
Fig. 3. Principal Component Analysis of the coastal sites
The two analyses clearly indicate that the broad and generalpatterns of soil characteristics do not exhibit consistent variationwith regard to site location (coast versus inland, as shown inFig. 2a), latitude, lithology and vegetation (Fig. 2b). Bothanalyses discriminate from all the other samples the ornitho-genic soil (PP6) and the samples with very high Fe, Al and Siconcentrations (FP19) independently of their depth.
Considering the soil chemical parameters, some relationsindicated by PCAwere similar to those outlined by the Pearsoncorrelation matrix for all sites (Table 4), which allowed us toidentify groups of correlated parameters. In particular, positivecorrelations were observed for: 1) pH, conductivity, Cl, Na,sulfate and HCO3
- , 2) Al and Fe, 3) organic carbon and totalnitrogen. Sand and gravel are inversely correlated (when thefirst increases the latter decreases and vice versa). Unlike thePearson correlation matrix, both PCA (Fig. 2a and 2b) indicatedrelations between K and F and between P and PO4 along thefirst axis, although along the second axis, all the grain sizecomponents were positively related.
To assess the influence of latitude avoiding potential inter-ference linked to the different lithology, a third PCA (Fig. 3;Table 3) was performed considering only the coastal sites withgranitic lithology. Unfortunately the latitudinal gradient refer-ring to these sites was more limited (74°-77°S) with respect tothe whole investigated transect. Nevertheless, PCA showedthere was no appreciable pattern with latitude and that thepatterns of soil parameters were very similar to the above-
with granitic lithology. See Table 2 for abbreviations.
59N. Cannone et al. / Geoderma 144 (2008) 50–65
mentioned results. Also by eliminating the samples with pecu-liar characteristics (PP6 and FP19), the PCA provided similarresults (data not shown).
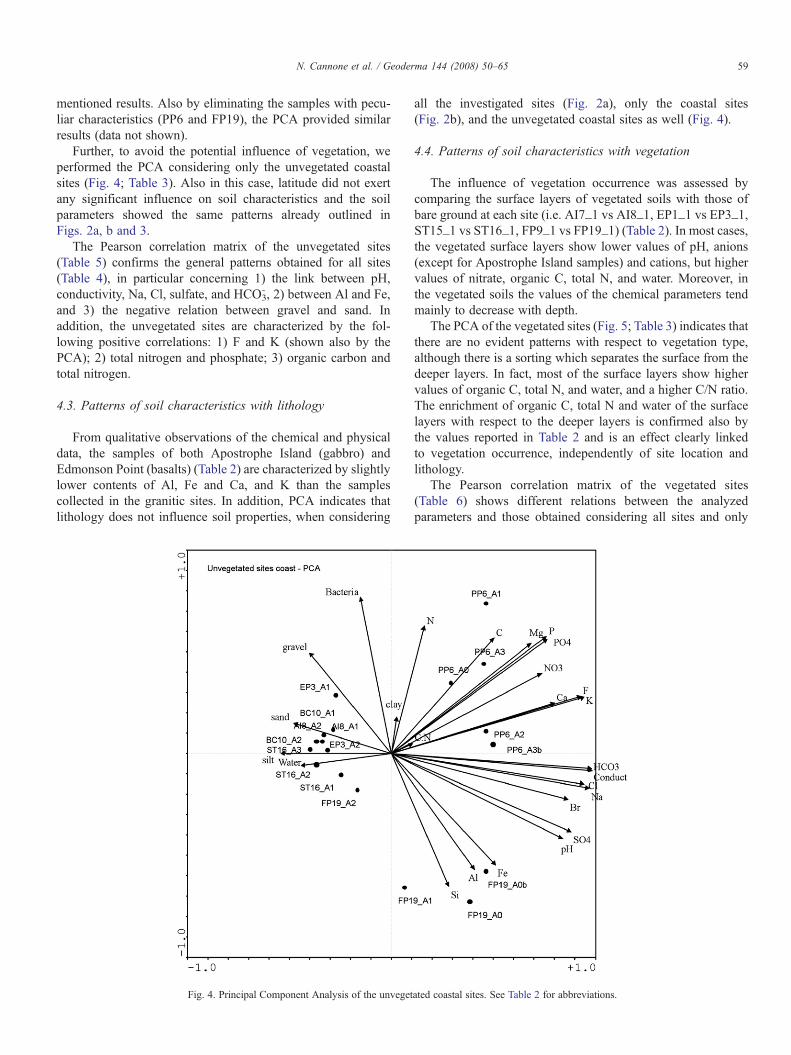
Further, to avoid the potential influence of vegetation, weperformed the PCA considering only the unvegetated coastalsites (Fig. 4; Table 3). Also in this case, latitude did not exertany significant influence on soil characteristics and the soilparameters showed the same patterns already outlined inFigs. 2a, b and 3.
The Pearson correlation matrix of the unvegetated sites(Table 5) confirms the general patterns obtained for all sites(Table 4), in particular concerning 1) the link between pH,conductivity, Na, Cl, sulfate, and HCO3
- , 2) between Al and Fe,and 3) the negative relation between gravel and sand. Inaddition, the unvegetated sites are characterized by the fol-lowing positive correlations: 1) F and K (shown also by thePCA); 2) total nitrogen and phosphate; 3) organic carbon andtotal nitrogen.
4.3. Patterns of soil characteristics with lithology
From qualitative observations of the chemical and physicaldata, the samples of both Apostrophe Island (gabbro) andEdmonson Point (basalts) (Table 2) are characterized by slightlylower contents of Al, Fe and Ca, and K than the samplescollected in the granitic sites. In addition, PCA indicates thatlithology does not influence soil properties, when considering
Fig. 4. Principal Component Analysis of the unveget
all the investigated sites (Fig. 2a), only the coastal sites(Fig. 2b), and the unvegetated coastal sites as well (Fig. 4).
4.4. Patterns of soil characteristics with vegetation
The influence of vegetation occurrence was assessed bycomparing the surface layers of vegetated soils with those ofbare ground at each site (i.e. AI7_1 vs AI8_1, EP1_1 vs EP3_1,ST15_1 vs ST16_1, FP9_1 vs FP19_1) (Table 2). In most cases,the vegetated surface layers show lower values of pH, anions(except for Apostrophe Island samples) and cations, but highervalues of nitrate, organic C, total N, and water. Moreover, inthe vegetated soils the values of the chemical parameters tendmainly to decrease with depth.
The PCA of the vegetated sites (Fig. 5; Table 3) indicates thatthere are no evident patterns with respect to vegetation type,although there is a sorting which separates the surface from thedeeper layers. In fact, most of the surface layers show highervalues of organic C, total N, and water, and a higher C/N ratio.The enrichment of organic C, total N and water of the surfacelayers with respect to the deeper layers is confirmed also bythe values reported in Table 2 and is an effect clearly linkedto vegetation occurrence, independently of site location andlithology.
The Pearson correlation matrix of the vegetated sites(Table 6) shows different relations between the analyzedparameters and those obtained considering all sites and only
ated coastal sites. See Table 2 for abbreviations.
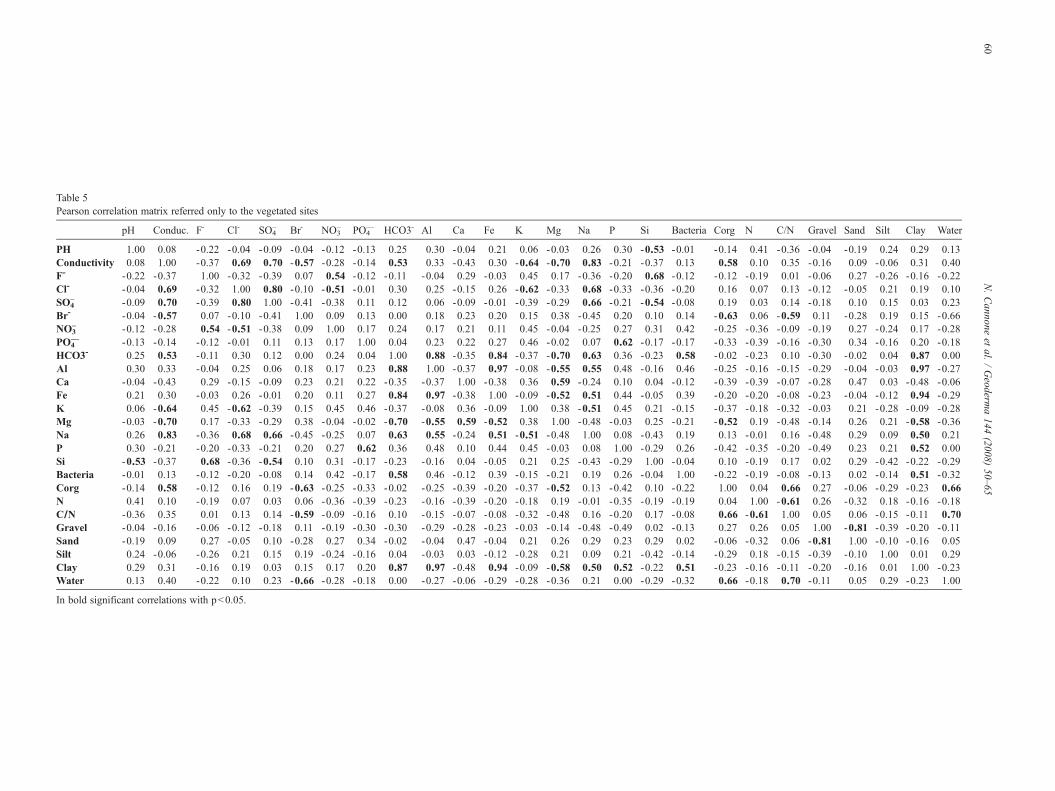
Table 5Pearson correlation matrix referred only to the vegetated sites
pH Conduc. F- Cl- SO4– Br- NO3
– PO4— HCO3- Al Ca Fe K Mg Na P Si Bacteria Corg N C/N Gravel Sand Silt Clay Water
PH 1.00 0.08 -0.22 -0.04 -0.09 -0.04 -0.12 -0.13 0.25 0.30 -0.04 0.21 0.06 -0.03 0.26 0.30 -0.53 -0.01 -0.14 0.41 -0.36 -0.04 -0.19 0.24 0.29 0.13Conductivity 0.08 1.00 -0.37 0.69 0.70 -0.57 -0.28 -0.14 0.53 0.33 -0.43 0.30 -0.64 -0.70 0.83 -0.21 -0.37 0.13 0.58 0.10 0.35 -0.16 0.09 -0.06 0.31 0.40F- -0.22 -0.37 1.00 -0.32 -0.39 0.07 0.54 -0.12 -0.11 -0.04 0.29 -0.03 0.45 0.17 -0.36 -0.20 0.68 -0.12 -0.12 -0.19 0.01 -0.06 0.27 -0.26 -0.16 -0.22Cl- -0.04 0.69 -0.32 1.00 0.80 -0.10 -0.51 -0.01 0.30 0.25 -0.15 0.26 -0.62 -0.33 0.68 -0.33 -0.36 -0.20 0.16 0.07 0.13 -0.12 -0.05 0.21 0.19 0.10SO4
– -0.09 0.70 -0.39 0.80 1.00 -0.41 -0.38 0.11 0.12 0.06 -0.09 -0.01 -0.39 -0.29 0.66 -0.21 -0.54 -0.08 0.19 0.03 0.14 -0.18 0.10 0.15 0.03 0.23Br- -0.04 -0.57 0.07 -0.10 -0.41 1.00 0.09 0.13 0.00 0.18 0.23 0.20 0.15 0.38 -0.45 0.20 0.10 0.14 -0.63 0.06 -0.59 0.11 -0.28 0.19 0.15 -0.66NO3
– -0.12 -0.28 0.54 -0.51 -0.38 0.09 1.00 0.17 0.24 0.17 0.21 0.11 0.45 -0.04 -0.25 0.27 0.31 0.42 -0.25 -0.36 -0.09 -0.19 0.27 -0.24 0.17 -0.28PO4
— -0.13 -0.14 -0.12 -0.01 0.11 0.13 0.17 1.00 0.04 0.23 0.22 0.27 0.46 -0.02 0.07 0.62 -0.17 -0.17 -0.33 -0.39 -0.16 -0.30 0.34 -0.16 0.20 -0.18HCO3- 0.25 0.53 -0.11 0.30 0.12 0.00 0.24 0.04 1.00 0.88 -0.35 0.84 -0.37 -0.70 0.63 0.36 -0.23 0.58 -0.02 -0.23 0.10 -0.30 -0.02 0.04 0.87 0.00Al 0.30 0.33 -0.04 0.25 0.06 0.18 0.17 0.23 0.88 1.00 -0.37 0.97 -0.08 -0.55 0.55 0.48 -0.16 0.46 -0.25 -0.16 -0.15 -0.29 -0.04 -0.03 0.97 -0.27Ca -0.04 -0.43 0.29 -0.15 -0.09 0.23 0.21 0.22 -0.35 -0.37 1.00 -0.38 0.36 0.59 -0.24 0.10 0.04 -0.12 -0.39 -0.39 -0.07 -0.28 0.47 0.03 -0.48 -0.06Fe 0.21 0.30 -0.03 0.26 -0.01 0.20 0.11 0.27 0.84 0.97 -0.38 1.00 -0.09 -0.52 0.51 0.44 -0.05 0.39 -0.20 -0.20 -0.08 -0.23 -0.04 -0.12 0.94 -0.29K 0.06 -0.64 0.45 -0.62 -0.39 0.15 0.45 0.46 -0.37 -0.08 0.36 -0.09 1.00 0.38 -0.51 0.45 0.21 -0.15 -0.37 -0.18 -0.32 -0.03 0.21 -0.28 -0.09 -0.28Mg -0.03 -0.70 0.17 -0.33 -0.29 0.38 -0.04 -0.02 -0.70 -0.55 0.59 -0.52 0.38 1.00 -0.48 -0.03 0.25 -0.21 -0.52 0.19 -0.48 -0.14 0.26 0.21 -0.58 -0.36Na 0.26 0.83 -0.36 0.68 0.66 -0.45 -0.25 0.07 0.63 0.55 -0.24 0.51 -0.51 -0.48 1.00 0.08 -0.43 0.19 0.13 -0.01 0.16 -0.48 0.29 0.09 0.50 0.21P 0.30 -0.21 -0.20 -0.33 -0.21 0.20 0.27 0.62 0.36 0.48 0.10 0.44 0.45 -0.03 0.08 1.00 -0.29 0.26 -0.42 -0.35 -0.20 -0.49 0.23 0.21 0.52 0.00Si -0.53 -0.37 0.68 -0.36 -0.54 0.10 0.31 -0.17 -0.23 -0.16 0.04 -0.05 0.21 0.25 -0.43 -0.29 1.00 -0.04 0.10 -0.19 0.17 0.02 0.29 -0.42 -0.22 -0.29Bacteria -0.01 0.13 -0.12 -0.20 -0.08 0.14 0.42 -0.17 0.58 0.46 -0.12 0.39 -0.15 -0.21 0.19 0.26 -0.04 1.00 -0.22 -0.19 -0.08 -0.13 0.02 -0.14 0.51 -0.32Corg -0.14 0.58 -0.12 0.16 0.19 -0.63 -0.25 -0.33 -0.02 -0.25 -0.39 -0.20 -0.37 -0.52 0.13 -0.42 0.10 -0.22 1.00 0.04 0.66 0.27 -0.06 -0.29 -0.23 0.66N 0.41 0.10 -0.19 0.07 0.03 0.06 -0.36 -0.39 -0.23 -0.16 -0.39 -0.20 -0.18 0.19 -0.01 -0.35 -0.19 -0.19 0.04 1.00 -0.61 0.26 -0.32 0.18 -0.16 -0.18C/N -0.36 0.35 0.01 0.13 0.14 -0.59 -0.09 -0.16 0.10 -0.15 -0.07 -0.08 -0.32 -0.48 0.16 -0.20 0.17 -0.08 0.66 -0.61 1.00 0.05 0.06 -0.15 -0.11 0.70Gravel -0.04 -0.16 -0.06 -0.12 -0.18 0.11 -0.19 -0.30 -0.30 -0.29 -0.28 -0.23 -0.03 -0.14 -0.48 -0.49 0.02 -0.13 0.27 0.26 0.05 1.00 -0.81 -0.39 -0.20 -0.11Sand -0.19 0.09 0.27 -0.05 0.10 -0.28 0.27 0.34 -0.02 -0.04 0.47 -0.04 0.21 0.26 0.29 0.23 0.29 0.02 -0.06 -0.32 0.06 -0.81 1.00 -0.10 -0.16 0.05Silt 0.24 -0.06 -0.26 0.21 0.15 0.19 -0.24 -0.16 0.04 -0.03 0.03 -0.12 -0.28 0.21 0.09 0.21 -0.42 -0.14 -0.29 0.18 -0.15 -0.39 -0.10 1.00 0.01 0.29Clay 0.29 0.31 -0.16 0.19 0.03 0.15 0.17 0.20 0.87 0.97 -0.48 0.94 -0.09 -0.58 0.50 0.52 -0.22 0.51 -0.23 -0.16 -0.11 -0.20 -0.16 0.01 1.00 -0.23Water 0.13 0.40 -0.22 0.10 0.23 -0.66 -0.28 -0.18 0.00 -0.27 -0.06 -0.29 -0.28 -0.36 0.21 0.00 -0.29 -0.32 0.66 -0.18 0.70 -0.11 0.05 0.29 -0.23 1.00
In bold significant correlations with pb0.05.
60N.Cannone
etal.
/Geoderm
a144
(2008)50–65
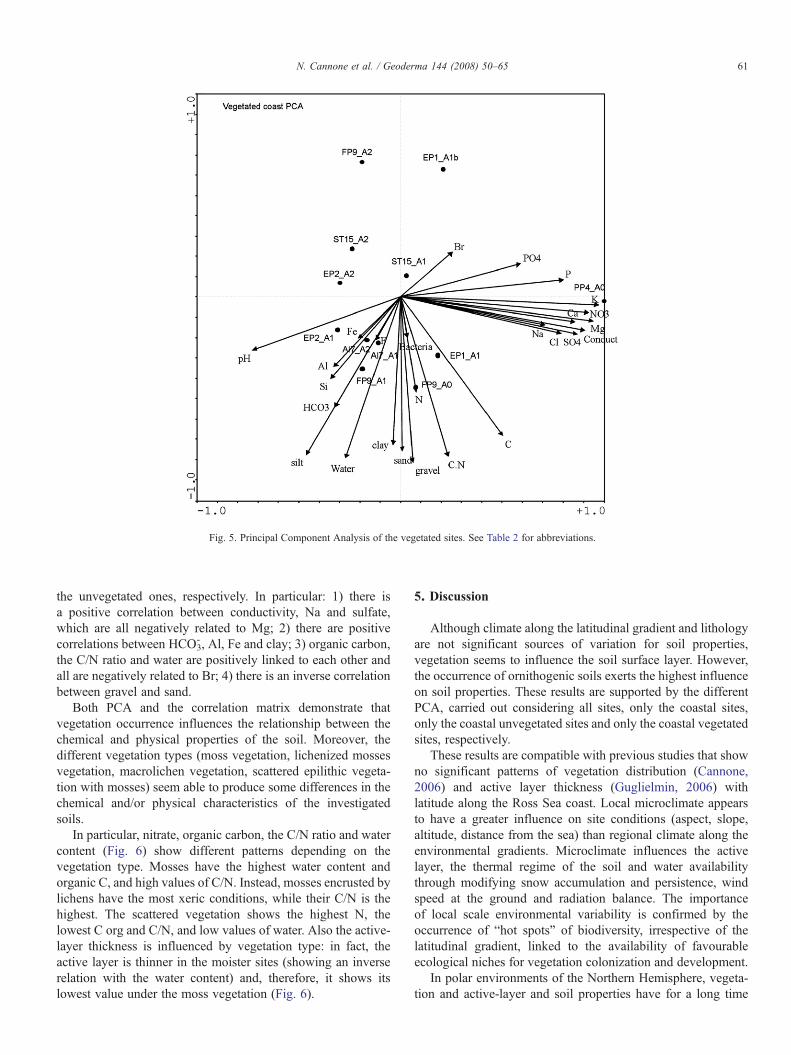
Fig. 5. Principal Component Analysis of the vegetated sites. See Table 2 for abbreviations.
61N. Cannone et al. / Geoderma 144 (2008) 50–65
the unvegetated ones, respectively. In particular: 1) there isa positive correlation between conductivity, Na and sulfate,which are all negatively related to Mg; 2) there are positivecorrelations between HCO3
- , Al, Fe and clay; 3) organic carbon,the C/N ratio and water are positively linked to each other andall are negatively related to Br; 4) there is an inverse correlationbetween gravel and sand.
Both PCA and the correlation matrix demonstrate thatvegetation occurrence influences the relationship between thechemical and physical properties of the soil. Moreover, thedifferent vegetation types (moss vegetation, lichenized mossesvegetation, macrolichen vegetation, scattered epilithic vegeta-tion with mosses) seem able to produce some differences in thechemical and/or physical characteristics of the investigatedsoils.
In particular, nitrate, organic carbon, the C/N ratio and watercontent (Fig. 6) show different patterns depending on thevegetation type. Mosses have the highest water content andorganic C, and high values of C/N. Instead, mosses encrusted bylichens have the most xeric conditions, while their C/N is thehighest. The scattered vegetation shows the highest N, thelowest C org and C/N, and low values of water. Also the active-layer thickness is influenced by vegetation type: in fact, theactive layer is thinner in the moister sites (showing an inverserelation with the water content) and, therefore, it shows itslowest value under the moss vegetation (Fig. 6).
5. Discussion
Although climate along the latitudinal gradient and lithologyare not significant sources of variation for soil properties,vegetation seems to influence the soil surface layer. However,the occurrence of ornithogenic soils exerts the highest influenceon soil properties. These results are supported by the differentPCA, carried out considering all sites, only the coastal sites,only the coastal unvegetated sites and only the coastal vegetatedsites, respectively.
These results are compatible with previous studies that showno significant patterns of vegetation distribution (Cannone,2006) and active layer thickness (Guglielmin, 2006) withlatitude along the Ross Sea coast. Local microclimate appearsto have a greater influence on site conditions (aspect, slope,altitude, distance from the sea) than regional climate along theenvironmental gradients. Microclimate influences the activelayer, the thermal regime of the soil and water availabilitythrough modifying snow accumulation and persistence, windspeed at the ground and radiation balance. The importanceof local scale environmental variability is confirmed by theoccurrence of “hot spots” of biodiversity, irrespective of thelatitudinal gradient, linked to the availability of favourableecological niches for vegetation colonization and development.
In polar environments of the Northern Hemisphere, vegeta-tion and active-layer and soil properties have for a long time
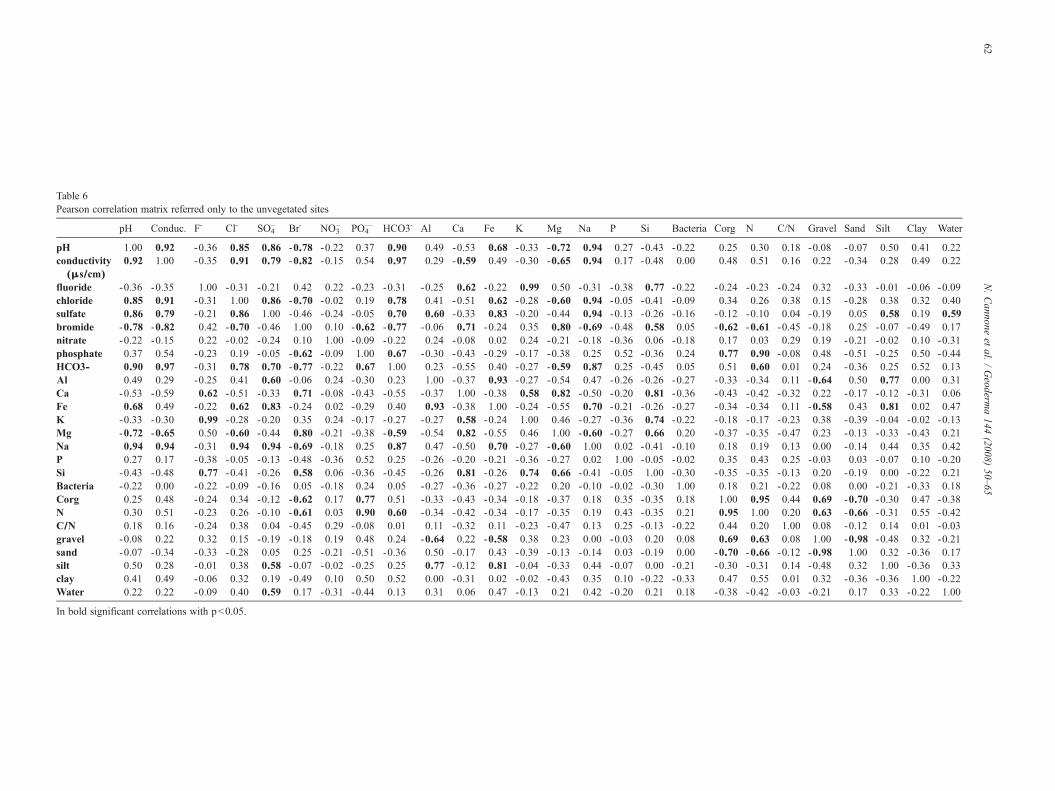
Table 6Pearson correlation matrix referred only to the unvegetated sites
pH Conduc. F- Cl- SO4– Br- NO3
– PO4— HCO3- Al Ca Fe K Mg Na P Si Bacteria Corg N C/N Gravel Sand Silt Clay Water
pH 1.00 0.92 -0.36 0.85 0.86 -0.78 -0.22 0.37 0.90 0.49 -0.53 0.68 -0.33 -0.72 0.94 0.27 -0.43 -0.22 0.25 0.30 0.18 -0.08 -0.07 0.50 0.41 0.22conductivity(μs/cm)
0.92 1.00 -0.35 0.91 0.79 -0.82 -0.15 0.54 0.97 0.29 -0.59 0.49 -0.30 -0.65 0.94 0.17 -0.48 0.00 0.48 0.51 0.16 0.22 -0.34 0.28 0.49 0.22
fluoride -0.36 -0.35 1.00 -0.31 -0.21 0.42 0.22 -0.23 -0.31 -0.25 0.62 -0.22 0.99 0.50 -0.31 -0.38 0.77 -0.22 -0.24 -0.23 -0.24 0.32 -0.33 -0.01 -0.06 -0.09chloride 0.85 0.91 -0.31 1.00 0.86 -0.70 -0.02 0.19 0.78 0.41 -0.51 0.62 -0.28 -0.60 0.94 -0.05 -0.41 -0.09 0.34 0.26 0.38 0.15 -0.28 0.38 0.32 0.40sulfate 0.86 0.79 -0.21 0.86 1.00 -0.46 -0.24 -0.05 0.70 0.60 -0.33 0.83 -0.20 -0.44 0.94 -0.13 -0.26 -0.16 -0.12 -0.10 0.04 -0.19 0.05 0.58 0.19 0.59bromide -0.78 -0.82 0.42 -0.70 -0.46 1.00 0.10 -0.62 -0.77 -0.06 0.71 -0.24 0.35 0.80 -0.69 -0.48 0.58 0.05 -0.62 -0.61 -0.45 -0.18 0.25 -0.07 -0.49 0.17nitrate -0.22 -0.15 0.22 -0.02 -0.24 0.10 1.00 -0.09 -0.22 0.24 -0.08 0.02 0.24 -0.21 -0.18 -0.36 0.06 -0.18 0.17 0.03 0.29 0.19 -0.21 -0.02 0.10 -0.31phosphate 0.37 0.54 -0.23 0.19 -0.05 -0.62 -0.09 1.00 0.67 -0.30 -0.43 -0.29 -0.17 -0.38 0.25 0.52 -0.36 0.24 0.77 0.90 -0.08 0.48 -0.51 -0.25 0.50 -0.44HCO3- 0.90 0.97 -0.31 0.78 0.70 -0.77 -0.22 0.67 1.00 0.23 -0.55 0.40 -0.27 -0.59 0.87 0.25 -0.45 0.05 0.51 0.60 0.01 0.24 -0.36 0.25 0.52 0.13Al 0.49 0.29 -0.25 0.41 0.60 -0.06 0.24 -0.30 0.23 1.00 -0.37 0.93 -0.27 -0.54 0.47 -0.26 -0.26 -0.27 -0.33 -0.34 0.11 -0.64 0.50 0.77 0.00 0.31Ca -0.53 -0.59 0.62 -0.51 -0.33 0.71 -0.08 -0.43 -0.55 -0.37 1.00 -0.38 0.58 0.82 -0.50 -0.20 0.81 -0.36 -0.43 -0.42 -0.32 0.22 -0.17 -0.12 -0.31 0.06Fe 0.68 0.49 -0.22 0.62 0.83 -0.24 0.02 -0.29 0.40 0.93 -0.38 1.00 -0.24 -0.55 0.70 -0.21 -0.26 -0.27 -0.34 -0.34 0.11 -0.58 0.43 0.81 0.02 0.47K -0.33 -0.30 0.99 -0.28 -0.20 0.35 0.24 -0.17 -0.27 -0.27 0.58 -0.24 1.00 0.46 -0.27 -0.36 0.74 -0.22 -0.18 -0.17 -0.23 0.38 -0.39 -0.04 -0.02 -0.13Mg -0.72 -0.65 0.50 -0.60 -0.44 0.80 -0.21 -0.38 -0.59 -0.54 0.82 -0.55 0.46 1.00 -0.60 -0.27 0.66 0.20 -0.37 -0.35 -0.47 0.23 -0.13 -0.33 -0.43 0.21Na 0.94 0.94 -0.31 0.94 0.94 -0.69 -0.18 0.25 0.87 0.47 -0.50 0.70 -0.27 -0.60 1.00 0.02 -0.41 -0.10 0.18 0.19 0.13 0.00 -0.14 0.44 0.35 0.42P 0.27 0.17 -0.38 -0.05 -0.13 -0.48 -0.36 0.52 0.25 -0.26 -0.20 -0.21 -0.36 -0.27 0.02 1.00 -0.05 -0.02 0.35 0.43 0.25 -0.03 0.03 -0.07 0.10 -0.20Si -0.43 -0.48 0.77 -0.41 -0.26 0.58 0.06 -0.36 -0.45 -0.26 0.81 -0.26 0.74 0.66 -0.41 -0.05 1.00 -0.30 -0.35 -0.35 -0.13 0.20 -0.19 0.00 -0.22 0.21Bacteria -0.22 0.00 -0.22 -0.09 -0.16 0.05 -0.18 0.24 0.05 -0.27 -0.36 -0.27 -0.22 0.20 -0.10 -0.02 -0.30 1.00 0.18 0.21 -0.22 0.08 0.00 -0.21 -0.33 0.18Corg 0.25 0.48 -0.24 0.34 -0.12 -0.62 0.17 0.77 0.51 -0.33 -0.43 -0.34 -0.18 -0.37 0.18 0.35 -0.35 0.18 1.00 0.95 0.44 0.69 -0.70 -0.30 0.47 -0.38N 0.30 0.51 -0.23 0.26 -0.10 -0.61 0.03 0.90 0.60 -0.34 -0.42 -0.34 -0.17 -0.35 0.19 0.43 -0.35 0.21 0.95 1.00 0.20 0.63 -0.66 -0.31 0.55 -0.42C/N 0.18 0.16 -0.24 0.38 0.04 -0.45 0.29 -0.08 0.01 0.11 -0.32 0.11 -0.23 -0.47 0.13 0.25 -0.13 -0.22 0.44 0.20 1.00 0.08 -0.12 0.14 0.01 -0.03gravel -0.08 0.22 0.32 0.15 -0.19 -0.18 0.19 0.48 0.24 -0.64 0.22 -0.58 0.38 0.23 0.00 -0.03 0.20 0.08 0.69 0.63 0.08 1.00 -0.98 -0.48 0.32 -0.21sand -0.07 -0.34 -0.33 -0.28 0.05 0.25 -0.21 -0.51 -0.36 0.50 -0.17 0.43 -0.39 -0.13 -0.14 0.03 -0.19 0.00 -0.70 -0.66 -0.12 -0.98 1.00 0.32 -0.36 0.17silt 0.50 0.28 -0.01 0.38 0.58 -0.07 -0.02 -0.25 0.25 0.77 -0.12 0.81 -0.04 -0.33 0.44 -0.07 0.00 -0.21 -0.30 -0.31 0.14 -0.48 0.32 1.00 -0.36 0.33clay 0.41 0.49 -0.06 0.32 0.19 -0.49 0.10 0.50 0.52 0.00 -0.31 0.02 -0.02 -0.43 0.35 0.10 -0.22 -0.33 0.47 0.55 0.01 0.32 -0.36 -0.36 1.00 -0.22Water 0.22 0.22 -0.09 0.40 0.59 0.17 -0.31 -0.44 0.13 0.31 0.06 0.47 -0.13 0.21 0.42 -0.20 0.21 0.18 -0.38 -0.42 -0.03 -0.21 0.17 0.33 -0.22 1.00
In bold significant correlations with pb0.05.
62N.Cannone
etal.
/Geoderm
a144
(2008)50–65
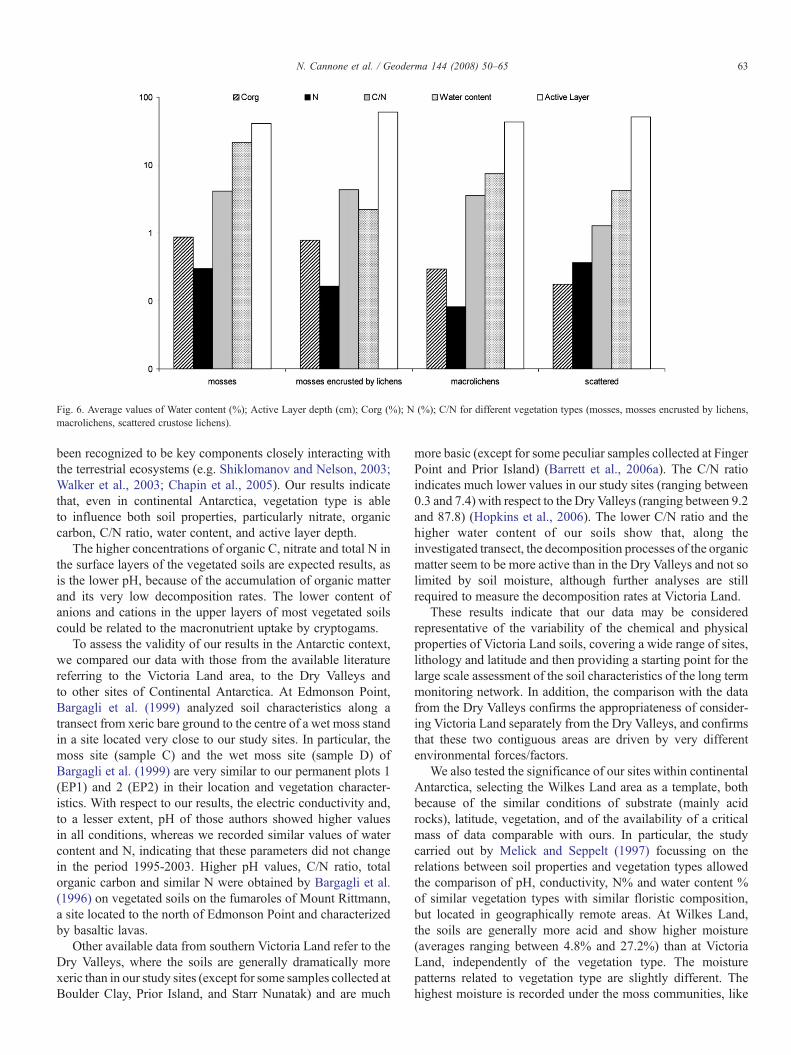
Fig. 6. Average values of Water content (%); Active Layer depth (cm); Corg (%); N (%); C/N for different vegetation types (mosses, mosses encrusted by lichens,macrolichens, scattered crustose lichens).
63N. Cannone et al. / Geoderma 144 (2008) 50–65
been recognized to be key components closely interacting withthe terrestrial ecosystems (e.g. Shiklomanov and Nelson, 2003;Walker et al., 2003; Chapin et al., 2005). Our results indicatethat, even in continental Antarctica, vegetation type is ableto influence both soil properties, particularly nitrate, organiccarbon, C/N ratio, water content, and active layer depth.
The higher concentrations of organic C, nitrate and total N inthe surface layers of the vegetated soils are expected results, asis the lower pH, because of the accumulation of organic matterand its very low decomposition rates. The lower content ofanions and cations in the upper layers of most vegetated soilscould be related to the macronutrient uptake by cryptogams.
To assess the validity of our results in the Antarctic context,we compared our data with those from the available literaturereferring to the Victoria Land area, to the Dry Valleys andto other sites of Continental Antarctica. At Edmonson Point,Bargagli et al. (1999) analyzed soil characteristics along atransect from xeric bare ground to the centre of a wet moss standin a site located very close to our study sites. In particular, themoss site (sample C) and the wet moss site (sample D) ofBargagli et al. (1999) are very similar to our permanent plots 1(EP1) and 2 (EP2) in their location and vegetation character-istics. With respect to our results, the electric conductivity and,to a lesser extent, pH of those authors showed higher valuesin all conditions, whereas we recorded similar values of watercontent and N, indicating that these parameters did not changein the period 1995-2003. Higher pH values, C/N ratio, totalorganic carbon and similar N were obtained by Bargagli et al.(1996) on vegetated soils on the fumaroles of Mount Rittmann,a site located to the north of Edmonson Point and characterizedby basaltic lavas.
Other available data from southern Victoria Land refer to theDry Valleys, where the soils are generally dramatically morexeric than in our study sites (except for some samples collected atBoulder Clay, Prior Island, and Starr Nunatak) and are much
more basic (except for some peculiar samples collected at FingerPoint and Prior Island) (Barrett et al., 2006a). The C/N ratioindicates much lower values in our study sites (ranging between0.3 and 7.4) with respect to the Dry Valleys (ranging between 9.2and 87.8) (Hopkins et al., 2006). The lower C/N ratio and thehigher water content of our soils show that, along theinvestigated transect, the decomposition processes of the organicmatter seem to be more active than in the Dry Valleys and not solimited by soil moisture, although further analyses are stillrequired to measure the decomposition rates at Victoria Land.
These results indicate that our data may be consideredrepresentative of the variability of the chemical and physicalproperties of Victoria Land soils, covering a wide range of sites,lithology and latitude and then providing a starting point for thelarge scale assessment of the soil characteristics of the long termmonitoring network. In addition, the comparison with the datafrom the Dry Valleys confirms the appropriateness of consider-ing Victoria Land separately from the Dry Valleys, and confirmsthat these two contiguous areas are driven by very differentenvironmental forces/factors.
We also tested the significance of our sites within continentalAntarctica, selecting the Wilkes Land area as a template, bothbecause of the similar conditions of substrate (mainly acidrocks), latitude, vegetation, and of the availability of a criticalmass of data comparable with ours. In particular, the studycarried out by Melick and Seppelt (1997) focussing on therelations between soil properties and vegetation types allowedthe comparison of pH, conductivity, N% and water content %of similar vegetation types with similar floristic composition,but located in geographically remote areas. At Wilkes Land,the soils are generally more acid and show higher moisture(averages ranging between 4.8% and 27.2%) than at VictoriaLand, independently of the vegetation type. The moisturepatterns related to vegetation type are slightly different. Thehighest moisture is recorded under the moss communities, like
64 N. Cannone et al. / Geoderma 144 (2008) 50–65
at Victoria Land, but the macrolichen vegetation dominated byUsnea sphacelata shows the lowest values, unlike in VictoriaLand where the lowest water content was measured underthe mosses encrusted by lichens. Despite their more northernlatitude, it is remarkable that the soils of Victoria Land accu-mulate higher contents of N, especially in the moss community(averages 0.05 at Wilkes Land and 0.3 at Victoria Land) andalso in the mosses encrusted by lichens (average range 0.03-0.06 at Wilkes Land and average 0.17 at Victoria Land).
Measurements carried out by Beyer et al. (2000) at WilkesLand confirmed the more acid pH of the soils and indicateda higher C/N ratio (ranging from 5.3 to 35.8) than at VictoriaLand, despite the greater water availability, northern latitudeand milder macroclimatic conditions of Wilkes Land.
6. Conclusions
The description of the main physical and chemical parametersof the soils within the monitoring network here presented maybe a suitable reference for future monitoring activities in VictoriaLand. Our results demonstrated that, at least for the analyzedsamples, the latitudinal gradient does not significantly affect thechemical and physical properties of the soil. In fact, localmicroclimatic conditions seem to be more effective than theregional gradient, as was demonstrated for active layer depth(Guglielmin, 2006) and vegetation distribution (Cannone, 2006).
Lithology is able to influence some selected chemicalparameters (Al, Fe, Ca, K) only to a small extent, while grainsize and active layer depth do not show any recognizableimpact. The occurrence of ornithogenic soils seems to be moreeffective than all the other factors in influencing the soilproperties. On the other hand, the vegetation types are able toinfluence the properties of the surface layers of the soil (nitrate,organic carbon, C/N ratio and water content) and are related toactive layer depth.
Further analyses on soil properties including a greaternumber of sites, which would represent lithological variabilitymore extensively, are still required, as is an extension of thelatitudinal extremes of the gradient.
Acknowledgements
The authors wish to thank PNRA (Progetto Nazionale diRicerca in Antartide), for providing the opportunity to undertakethis research, and the logistical support within the PNRA project“Permafrost and Global Change in Antarctica” (PNRA pro-ject 5.3) led by Prof. Mauro Guglielmin. We also thank AntjeEulenburg and Heiko Baschek (both of the Alfred WegenerInstitute for Polar and Marine Research) for their technicalsupport with analyses of the samples. The English revision ofthe manuscript was carried out by Prof. James Gilbert Burge.
References
Bargagli, R., Broady, P.A., Walton, D.W.H., 1996. Preliminary investigation ofthe thermal biosystem of mount Rittmann fumaroles (northern Victoria Land,Antarctica). Antarctic Science 8 (2), 121–126.
Bargagli, R., Smith, R.I.L., Martella, L., Monaci, F., Sanchez-Hernandez, J.C.,Ugolini, F.C., 1999. Solution geochemistry and behaviour of major and traceelements during summer in a moss community at Edmonson Point, VictoriaLand, Antarctica. Antarctic Science 11 (1), 3–12.
Barrett, J.E., Virginia, R.A., Wall, D.H., Cary, S.C., Adams, B.J., Hacker, A.L.,Aislabie, J.M., 2006. Co-variation in soil biodiversity and biogeochemistryin northern and southern Victoria Land, Antarctica. Antarctic Science 18 (4),535–548.
Barrett, J.E., Virginia, R.A., Parsons, A.N., Wall, D.H., 2006. Soil carbonturnover in the McMurdo Dry Valleys, Antarctica. Soil Biology & Biochem-istry 38, 3065–3082.
Beyer, L., Bolter, M., Seppelt, R., 2000. Nutrient and thermal regime, microbialbiomass and vegetation pattern of Antarctic cryosols in the coastal regionof East Antarctica Wilkes Land. Arctic, Antarctic and Alpine Research 32,30–39.
Bockheim, J.G., 2002. Landform and soil development in the McMurdo DryValleys, Antarctica: a regional synthesis. Arctic, Antarctic and AlpineResearch 34 (3), 308–317.
Bockheim, J.G., 2008. Functional diversity of soils along environmentalgradients in the Ross Sea region, Antarctica. Geoderma 144, 32–42.
Bunt, J.S., Rovina, A.D., 1955. Microbiological studies of some subantarcticsoils. Journal of Soil Science 6, 119–128.
Cannone, N., 2004. Minimum area assessment and different sampling ap-proaches for the study of vegetation communities in Antarctica. AntarcticScience 16, 157–164.
Cannone, N., 2005. Moss and Lichen flora of Victoria Land (ContinentalAntarctica) along a latitudinal transect. Terra Antarctica Report 11, 1–9.
Cannone, N., 2006. A network for monitoring terrestrial ecosystems along alatitudinal gradient in Continental Antarctica. Antarctic Science 18 (4),549–560.
Cannone, N., Guglielmin, M., 2003. Vegetation and permafrost: sensitivesystems for the development of a monitoring program of climate changealong an Antarctic transect. In: Huiskes, A.H.L., Gieskes, W.W.C., Rozema,J., Schorno, R.M.L., Van der Vies, S.M., Wolff, W.J. (Eds.), AntarcticBiology in a Global Context. Backhuys Publishers, Leiden, pp. 31–36.
Cannone, N., Ellis Evans, J.C., Strachan, R., Guglielmin, M., 2006. Interactionsbetween climate, vegetation and active layer in Maritime Antarctica.Antarctic Science 18 (3), 323–333.
Castello, M., Nimis, P.L., 1995. The lichen vegetation of Terra Nova Bay(Victoria Land, Continental Antarctica). Bibliotheca Lichenologica 58,43–55.
Chapin III, F.S., Sturm, M., Serreze, M.C., et al., 2005. Role of land-surfacechanges in Arctic summer warming. Science 310, 657–660.
Convey, P., 2001. Terrestrial ecosystem response to climate changes in theAntarctic. In: Walther, G.-R., Burga, C.A., Edwards, P.J. (Eds.), Finger-prints' of climate change – adapted behaviour and shifting species ranges.Kluwer, New York, pp. 17–42.
Cook, A.J., Fox, A.J., Vaughan, D.G., Ferrigno, J.G., 2005. Retreating glacierfronts on the Antarctic Peninsula over the past half-century. Science 308,541–544.
Day, P.R., 1965. Particle fractionation and particle-size distribution. In: Black,C.A., et al. (Ed.), Methods of soil analysis. Part I. Agronomy, vol. 9.American Society of Agronomy, Madison, Wisc., pp. 545–566.
Doran, P.T., Priscu, J.C., Barry Lyons, W., et al., 2002. Antarctic climate coolingand terrestrial ecosystem response. Nature 415, 517–520.
Duphorn, K., 1981. Physiographical and glaciogeological observations in northVictoria Land, Antarctica. Geolosche Jahrbuch B41, 89–109.
Gerasimov, I.P., Glazovskaya, M.A., 1965. Fundamentals of Soil Science andSoil Geography. Israel Program for Scientific Translation.
Geringhausen, U., Bräutigam, K., Osama, M., Hans-Ulrich, P., 2003. Expansionof vascular plants on an Antarctic island – a consequence of climate change?In: Huiskes, A.H.L., Gieskes, W.W.C., Rozema, J., Schorno, R.M.L., VanDer Vies, S.M., Wolff, W.J. (Eds.), Antarctic biology in a global context.Backhuys, Leiden, pp. 79–84.
Grigioni, P., De Silvestri, L., Pellegrini, A., Sarao, L., 1992. Someclimatological aspects in the Terra Nova Bay Area, Antarctica. In: Colacino,M., Giovanelli, G., Stefanutti, L. (Eds.), Italian Research On AntarcticAtmosphere. Sif, Bologna, pp. 97–121.
65N. Cannone et al. / Geoderma 144 (2008) 50–65
Guglielmin, M., 2006. Ground surface temperature (GST), active layer, andpermafrost monitoring in continental Antarctica. Permafrost and PeriglacialProcesses 17 (2), 133–143.
Guglielmin, M., French, H.M., 2004. Ground ice in the Northern Foothills,Northern Victoria Land, Antarctica. Annals of Glaciology 39, 495–500.
Guglielmin, M., Ellis Evans, J.C., Cannone, N., 2005. Interactions betweenclimate, vegetation and active layer in Maritime and Continental Antarcticafor Climate Change monitoring. Terra Antarctica Report 11, 15–27.
Guglielmin, M., Ellis Evans, C.J., Cannone, N., 2008. Active layer thermalregime under different vegetation conditions in permafrost areas. A casestudy at Signy Island (Maritime Antarctica). Geoderma 144, 73–85.
Harper, A., unpublished. 2006/07 Immediate Science Report: K089 ClimateData Acquisition - Scott Base and Arrival Heights. Antarctica New Zealand(unpublished internal report).
Hopkins, D.W., Sparrow, A.D., Elberling, B., Gregorich, E.G., Novis, P.M.,Greenfield, L.G., Tilston, E.I., 2006. Carbon, nitrogen and temperaturecontrols on microbial activity in soils from an Antarctic Dry Valley. SoilBiology and Biochemistry 38, 3130–3140.
Kappen, L., 1985. Vegetation and ecology of ice-free areas of Northern VictoriaLand, Antarctica. 1. The lichen vegetation of Birthday Ridge and an InlandMountain. Polar Biology 4, 213–225.
Mack, M.C., Schuur, E.A.G., Bret-Harte, M.S., Shaver, G.R., Chapin III, F.S.,2004. Ecosystem carbon storage in arctic tundra reduced by long-termnutrient fertilization. Nature 431, 440–443.
Melick, D.R., Seppelt, R.D., 1997. Vegetation patterns in relation to climaticand endogenous changes in Wilkes Land, Continental Antarctica. Journal ofEcology 85, 43–56.
Nelson, F.E., Outcalt, S.I., Brown, J., Shiklomanov, N.I., Hinkel, K.M., 1998.Spatial temporal attributes of the active layer thickness record, Barrow,Alaska, USA. In: Lewkowicz, A.G., Allard, M. (Eds.), Permafrost, SeventhInternational Conference, June 23–27, 1998, Proceedings, 57. Universite´Laval, Quebec City, Nordicana, pp. 797–802.
Oechel, W.C., Vourlitis, G.L., Hastings, S.J., Zulueta, R.C., Hinzman, L., Kane,D., 2000. Acclimation of ecosystem CO2 exchange in the Alaskan Arctic inresponse to decadal climate warming. Nature 406, 978–981.
Schwarz, A.M.J., Green, T.G.A., Seppelt, R.D., 1992. Terrestrial vegetationat Canada Glacier, Southern Victoria Land, Antarctica. Polar Biology 12,397–404.
Seppelt, R.D., Green, T.G.A., 1998. A bryophyte flora for Southern VictoriaLand, Antarctica. New Zealand Journal of Botany 36, 617–635.
Seppelt, R.D., Green, T.G.A., Schroeter, B., 1995. Lichens and mosses from theKar Plateau, Southern Victoria Land, Antarctica. New Zealand Journal ofBotany 33, 203–220.
Seppelt, R.D., Green, T.G.A., Schroeter, B., 1996. Additions and corrections tothe lichen flora of the Kar Plateau, Southern Victoria Land, Antarctica. NewZealand Journal of Botany 34, 329–331.
Shiklomanov, N.I., Nelson, F.E., 2003. Statistical representation of land-scape-specific active-layer variability. Proceedings of the Eighth Inter-national Conference on Permafrost, 21–25 July 2003. Balkema, Zurich,pp. 1039–1044.
Smith, R.I.L., 1999. Biological and environmental characteristics of threecosmopolitan mosses dominant in continental Antarctica. Journal ofVegetation Science 10, 231–242.
Soil Survey Staff, 2006. Keys to Soil Taxonomy,10th ed. US Department ofAgricolture, Natural Resources Conservation Service, Washington D. C.
ter Braak, C.J.F., Šmilauer, P., 1998. CANOCO. Reference manual and user'sguide to CANOCO for windows. Software for Canonical CommunityOrdination (version 4). Centre for Biometry, Wageningen.
Turner, J., Colwell, S.R., Marshall, G.J., Lachlan-Cope, T.A., Carleton, A.M.,Jones, P.D., Lagun, V., Reid, P.A., Iagovkina, S., 2005. Antarctic climatechange during the last 50 years. International Journal of Climatology 25,279–294.
Vaughan, D.G., Marschall, G.J., Connolley, W.M., et al., 2003. Recent rapidregional climate warming on the Antarctic Peninsula. Climatic Change 60,243–274.
Walker, D.A., Jia, G.J., Epstein, H.E., et al., 2003. Vegetation-soil-thaw-depthrelationships along a low-Arctic bioclimate gradient, Alaska: Synthesis ofinformation from the ATLAS studies. Permafrost and Periglacial Processes14, 103–123.
Wynn-Williams, D.D., 1985. The biota of a lateral moraine and hinterland of theBlue Glacier, South Victoria Land, Antarctica. British Antarctic SurveyBulletin 66, 1–5.