Embed Size (px)
Citation preview
1
Birds of Prey and Wind Farms: Analysis of Problems and Possible Solutions
2
Documentation of an international workshop in Berlin, 21st and 22nd October 2008
Hermann Hötker (compiler)
Michael-Otto-Instiut im NABU, Goosstroot 1, 24861 Bergenhusen, Germany
Introduction
Birds of prey fall victim to collisions with wind turbines relatively more often than other bird
species. In Germany, some species of raptors are among the most frequently reported
collision victims on a national level. In order to understand the reasons underlying this
phenomenon, the Michael-Otto-Institute within NABU, the consultancy BioConsult SH and
the Leibniz Institute for Zoo and Wildlife Research started a research project on birds of prey
and wind farms. The German Ministry of the Environment, Nature Conservation and Nuclear
Safety financed the project in full. An important part of the project was to hold an international
workshop about half way through the project period. International input to the project was
desirable because other countries have also produced evidence for relatively high collision
risk for birds of prey, over a number of years. Research projects have been set up in (for
example) the USA, Canada, the UK and Norway. Colleagues from these countries were
invited to a workshop in Berlin, which had several aims:
• Discussion of the project results in an international audience,
• exchange of information on ongoing research projects,
• learning from experiences in different countries,
• exchange of ideas about mitigation measures.
The workshop took place in the NABU building on October 21st and 22nd. About 50 delegates
from seven countries attended the workshop.
3
The authors of the talks were asked to provide extended abstracts of their presentations for a
documentation of the workshop. These abstracts and a concise summary of the discussion
are presented in this document. The authors are responsible for the contents of their
contributions. We have summarised the discussions to the best of our knowledge and belief,
but we cannot guarantee the completeness of our records.
With great sadness we had to notice the death of Mi ke Madders, one of the speakers at
the workshop, on 23 rd Aug. 2009.
Acknowledgements
I would like to thank the German Ministry for the Environment, Nature Conservation and
Nuclear Safety and the Projektträger Jülich for their support. In particular, Stefanie Hofmann
and Gert Heider contributed to the success of the project and the workshop. I also would like
to thank my colleagues within NABU for their help in organizing the workshop in Berlin. Many
thanks also go to Richard Evans for language editing of this report.
Dieser Veröffentlichung zugrundeliegender Verbundvorhaben wurde mit Mitteln des
Bundesministeriums für Umwelt, Naturschutz und Reaktorsicherheit unter den
Förderkennzeichen 0327684, 0327684A und 0327684B gefördert. Die Verantwortung für den
Inhalt dieser Veröffentlichung liegt bei den Autoren.
4
Workshop Programme
International workshop on Birds of Prey and Wind Fa rms
NABU Federal Office, Charitéstr. 3, Berlin
– programme –
Tuesday, 21st October
13:00 – 13:30 Opening Addresses
Stefanie Hofmann (German Federal Ministry for the E nvironment, Nature
Conservation and Nuclear Safety)
Olaf Tschimpke (President NABU)
13:30 – 18:45 Results of the project “birds of prey and wind turbines: analysis of problems
solutions”
13:30 – 13:45 Hermann Hötker (NABU): Scope of the project „Birds of prey and wind farms:
analysis of problems & solutions
13:45 – 14:30 Ubbo Mammen (Ökotop), Lukas Kratzsch, Kerstin Mamme n, Thomas
Müller, Alexander Resetaritz, Ralf Sinao (NABU und Ökotop): Interactions
of Red Kites and wind farms: results of radio telemetry and field observations
14:30 – 15:00 Leonid Rasran, Hermann Hötker (NABU), Ubbo Mammen ( Monitoring
Greifvögel): Effect of wind farms on population trends and breeding success
of Red Kites and other birds of prey
15:00 – 15:30 Leonid Rasran, Hermann Hötker (NABU), Tobias Dürr ( Staatl.
Vogelschutzwarte Brandenburg): Analysis of collision victims in Germany
15:30 – 15:45 Coffee/Tea
15:45 – 16:30 Bodo Grajetzki, Malte Hoffmann, Georg Nehls (BioCon sult SH): Montagu’s
Harriers and wind farms: results of radio telemetry and observational studies
16:30 – 17:00 Ralf Joest (ABU), Kai-Michael Thomsen (NABU): Are Montagu’s Harriers
displaced by wind farms?
5
17:00 – 17:30 Oliver Krone, Mirjam Gippert (IZW), Thomas Grünkorn (BioConsult SH):
White-tailed Eagles and wind farms.
17:30 – 18:45 General Discussion
19:00 Workshop Dinner ( Café Lina, within the NABU building)
later: informal discussions at the bar
Wednesday, 22nd October
8:30 – 13:30 Results of relevant studies in other countries
8:30 – 10:00 Torgeir Nygård, Roel May, Pernille Lund Hoel (NINA, Norway):
Using GPS satellite telemetry to study movements of young White-tailed Sea
Eagles at Smøla windfarm, Norway.
Radar studies on White-tailed Sea Eagle at an onshore wind farm on the
island of Smøla, Norway.
10:00 – 10:45 Charles Maisonneuve (Ministère des Ressources natur elles et de la
Faune, Quebec, Canada): Studies on threatened species of Birds of Prey and
wind farms in eastern North America.
10:45 – 11:00 Coffee
11:00 –11:45 Mike Madders (Natural Research, United Kingdom): Assessing collision
risks in Hen Harriers in the UK
11:45 – 12:30 Shawn Smallwood (USA): Methods to reduce raptor mortality at wind farms
in the USA
12:30 – 13:30 General discussion on measures to avoid or to mitigation conflicts between
birds of prey and wind farms
13:30 Conference Close
13:30 – 14:30 Lunch (in Café Lina in the same building)
6
Extended abstracts of talks and brief summaries of discussions
Index
Birds of Prey and Wind Farms: Analysis of Problems and Possible Solutions – A brief
introduction to the project and the workshop ............................................................................... 7
Preface: NABU’ position on wind energy ................................................................................... 12
Interactions of Red Kites and wind farms: results of radio telemetry and field observations ....... 22
Analysis of collision victims in Germany .................................................................................... 26
Montagu‘s Harriers and wind farms: Radio telemetry and observational studies ........................ 31
Are breeding Montagu’s Harriers displaced by wind farms? ...................................................... 39
White-tailed Sea Eagles and wind power plants in Germany – preliminary results .................... 44
Summary of the general discussion on Tuesday, 21st October ................................................. 49
Radar studies on White-tailed Sea Eagle at an onshore wind farm on the island of Smøla ....... 50
Do wind power developments affect the behavior of White-tailed Sea Eagles on Smøla? ......... 54
Studies on threatened species of birds of prey and wind farms in eastern North America ......... 61
Mitigation in U.S. wind farms ..................................................................................................... 68
Summary of the general discussion on Wednesday, 22nd October ........................................... 77
7
Birds of Prey and Wind Farms: Analysis of Problems and Possible Solutions – A brief introduction to the project and the workshop
Dr. Hermann Hötker
Michael-Otto-Institut im NABU, Gosstroot 1, 24861 Bergenhusen, Germany
Introduction
Generating electricity from wind is one of the most developed ways of producing renewable
energy. In order to reduce the emission of greenhouse gases, Germany like other countries
has ambitious plans to increase the proportion of national energy production generated from
wind power in the coming years. Wind farms, however, can have adverse effects on birds,
either by disturbance and displacement, or by mortality due to collisions of birds with wind
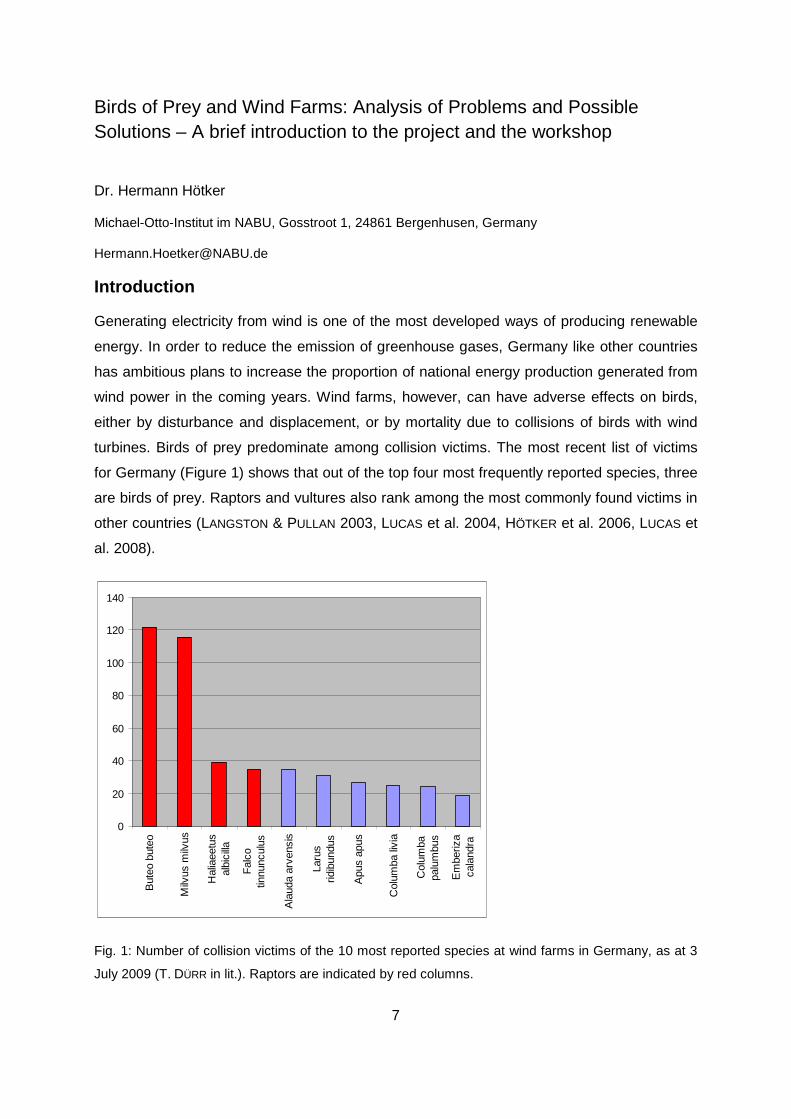
turbines. Birds of prey predominate among collision victims. The most recent list of victims
for Germany (Figure 1) shows that out of the top four most frequently reported species, three
are birds of prey. Raptors and vultures also rank among the most commonly found victims in
other countries (LANGSTON & PULLAN 2003, LUCAS et al. 2004, HÖTKER et al. 2006, LUCAS et
al. 2008).
0
20
40
60
80
100
120
140
But
eo b
uteo
Milv
us m
ilvus
Hal
iaee
tus
albi
cilla
Fal
cotin
nunc
ulus
Ala
uda
arve
nsis
Laru
srid
ibun
dus
Apu
s ap
us
Col
umba
livi
a
Col
umba
palu
mbu
s
Em
beriz
aca
land
ra
Fig. 1: Number of collision victims of the 10 most reported species at wind farms in Germany, as at 3
July 2009 (T. DÜRR in lit.). Raptors are indicated by red columns.
8
The reasons why raptors in particular should fall victim to wind turbines so often are not fully
understood. Raptors are highly manoeuvrable birds, their eyesight is very good and they
generally do not fly during the night. Thus, collisions obviously occur when turbines are fully
visible to raptors. In Germany White-tailed Eagles (Haliaeetus albicilla) and Red Kites (Milvus
milvus) are the most “prominent” victims. White-tailed Eagles have been subject to
successful protection programmes in the past years (HAUFF 1998, SUDFELDT et al. 2007).
Red Kites receive a special attention because more than half of the world population of this
species breeds in Germany (BirdLife International 2004).
The occurrence of birds of prey next to potential sites for wind farms has often led to court
cases about refusals of permissions to erect wind farms. In particular White-tailed Eagles
and Red Kites but also Montagu’s Harriers (Circus pygargus) have been involved.
In order to shed more light on the reasons for the collisions, a new research project has been
set up: Birds of prey and wind farms: analysis of problems and possible solutions. The
project is financed by the German Ministry for the Environment, Nature Conservation and
Nuclear Safety (FKZ 0327684). The work for the project started on 11.4.2007. The project
will end on 31.12.2010.
The main aim of the project is to understand when, where and why birds of prey are at risk of
collision with wind turbines. Better knowledge of the underlying factors causing collisions will
hopefully help to solve the conflict between the occurrence of birds of prey and wind farms. A
further aim of the project is to develop measures to minimize collision frequencies. Practical
guidance for wind farm developers and local and federal authorities will be developed at the
end of the project.
Methods
The scientific work of the project consists of the analysis of available data sets and the
acquisition of new field data. Existing data sets are the register of collision victims compiled
by the Staatliche Vogelschutzwarte Brandenburg, data on monitoring birds of prey in
Germany supplied by the Förderverein Greifvogelmonitoring, detailed data sets on the
breeding distribution of Montagu’s Harriers in two regions. In addition, data on the
geographical distribution of wind farms including time of erection and technical specifications
were collected. Habitat data were taken from the CORINE landcover.
The main activities of the project were behavioural studies of three species of birds of prey in
the vicinity of wind turbines. Red Kites and White-tailed Eagles were in focus because of the
relatively high number of victims. Montagu’s Harrier was taken as a third target species
9
because it is very rare in Germany, it is red listed and listed on Annex 1 of the EU Birds’
Directive, and it often occurs in places where wind farms are planned. Data collection for Red
Kites takes place in two study sites in Sachsen-Anhalt, Montagu’s Harriers are studied in
Schleswig-Holstein, and White-tailed Eagles will be studied at several sites in north and
eastern Germany. The observational protocol was standardized as much as possible across
the species. For all focal species, individuals were equipped with transmitters in order to
study their home ranges in relation to the position of wind farms.
Mitigation measures will be explored for Red Kite. Red Kites often use the vicinity of turbine
tower bases for foraging and thus approach the hazardous zone of the turbine. Tower bases
are attractive to Red Kites because they are frequently surrounded by some open strips of
fallow land. These uncultivated patches often offer the very few areas of open ground where
potential prey (small mammals) is easily visible. In the surrounding arable fields the crops are
two dense and too high to allow successful hunting by Red Kites or other birds of prey. As an
experiment, some tower bases will be made unattractive to Red Kites, by covering their
surroundings with a layer of black polythene sheeting. Activity of Red Kites at covered and
uncovered sites will be compared.
Structure of the project
The project is a co-operative partnership between seven partner bodies. Three partners
receive direct financial support by the Federal Ministry for the Environment, Nature
Conservation and Nuclear Safety. The remaining four partners are included by means of
contracts with the Michael-Otto-Institute of NABU, which is the coordinating body for the
whole project (Fig. 2). The project is split into several subprojects, each of which is carried
out by one or two project partners.
Sub-project Red Kite (ÖKOTOP, Michael-Otto-Inst. NABU)
• Radio telemetry, analysis of use of space
• Identification of risky situations
• Experimental covering of ground around the turbine bases
Sub-project lattice towers (Staatl. Vogelschutzw. Brandenb.)
• Search for victims in a wind park with lattice towers
Sub-project Montagu‘s Harrier telemetry (BioConsult SH)
10
• Radio telemetry, analysis of use of space
• Identification of risky situations
Sub-project Montagu‘s Harrier spacing (Arbeitsgem. Biol. Umweltschutz, Michael-Otto-
Institut im NABU)
• Analysis of population trends and spacing of nests in relation to wind farms in two
regions of Germany (Hellwegbörde and Nordfriesland)
Sub-project White-tailed Eagle (Institut für Zoo-und Wildtierforschung, BioConsult SH)
• Radio telemetry and GPS-loggers, analysis of use of space
• Focal animal sampling for identifying risky situations
Sub-project victim register (Staatl. Vogelschutzwarte Brandenburg, Michael-Otto-Inst. NABU)
• Analysis of all large bird turbine victims in Germany, search for explanatory variables
Sub-project monitoring of birds of prey (Förderverein Greifvogelmonitoring, Michael-Otto-Inst.
NABU)
• Analysis of temporal variation in density and breeding success of birds of prey in
relation to wind farms
The project has a homepage (http://bergenhusen.nabu.de/forschung/greifvoegel/) where
more details of the project are available
Contract
Allowance
Cooperation
German Ministry for the Environment, Nature Conserv ation and Nuclear Safety / Projektträger Jülich
Michael-Otto-Institut im NABU
Project coordinationSub-projects Red Kite, Montagu's
Harrrier in Schl.-Holst., victim register, monitoring data,International Workshop
ABU SoestSub-project Montagu's Harrier in Westphalia
Förderverein Greifvogelmonitoring
Sub-project monitoring data
Staatl. Vogelschutzwarte im Landesumweltamt
BrandenburgSub-project victim registerSub-project lattice pylons
ÖKOTOP GBRSub-project Red Kite
BioConsult SHSub-projects Montagu's Harrier
White-t. Eagle in Schl.-Holst.
Leibniz-Institut für Zoo- und Wildtierforschung
Sub-project White-tailed Eagle
Two ContractorsSub-project lattice pylons
Fig. 2: Project partners and project structure.
11
International workshop
The international workshop is an integral part of the project. The workshop has several aims:
• Discussion of the project results in an international audience
• Exchange of information on ongoing research projects
• Learning from experiences in different countries
• Exchange of ideas about mitigation measures
Acknowledgements
I would like to thank the German Ministry for the Environment, Nature Conservation and
Nuclear Safety and the Projektträger Jülich for providing the necessary funds for the project.
In particular, Gert Heider (PTJ) and Stefanie Hofmann (BMU) helped substantially with
initiating the project. I also would like to thank the members of the Project Steering Group
and all of my colleagues for their support of the project. My particular thanks go to the foreign
colleagues who accepted our workshop invitation.
References
BirdLife International (2004): Birds in Europe: population estimates, trends and conservation status.
BirdLife International, Cambridge.
HAUFF, P. (1998): Bestandsentwicklung des Seeadlers Haliaeetus albicilla in Deutschland seit 1980
mit einem Rückblick auf die vergangenen 100 Jahre. Vogelwelt 119: 47-63.
HÖTKER, H., THOMSEN, K.-M. & JEROMIN, H. (2006): Impacts on biodiversity of exploitation of renewable
energy sources: the example of birds and bats. Michael-Otto-Institut im NABU, Bergenhusen. 1-66 pp.
LANGSTON, R. W. H. & PULLAN, J. D. (2003): Wind farms and birds: an analysis of the effects of wind
farms on birds, and guidance on environmental assessment criteria and site selection issues. Report
written by BirdLife International on behalf of the Bern Convention, Sandy.
LUCAS, M. D., JANSS, G. F. E. & FERRER, M. (2004): The effects of a wind farm on birds in a migration
point: the Strait of Gibraltar. Biodiversity and Conservation 13: 395-407.
LUCAS, M. D., JANSS, G. F. E., WHITFIELD, D. P. & FERRER, M. (2008): Collision fatality of raptors in wind
farms does not depend on raptor abundance. Journal of Applied Ecology 45: 1695-1703.
SUDFELDT, C., DRÖSCHMEISTER, R., GRÜNEBERG, C., MITSCHKE, A., SCHÖPF, H. & WAHL, J. (2007):
Vögel in Deutschland. Dachverband Deutscher Avifaunisten, Bundesamt für Naturschutz,
Länderarbeitsgemeinschaft der Vogelschutzwarten, Münster.

12
Preface: NABU’ position on wind energy Olaf Tschimpke
President of NABU,
NABU, Charitéstraße 3, 10117 Berlin, Germany
Nature conservation and the struggle against the man induced climate change are important
issues in the work of NABU. I, therefore, was very glad to hear that (aided by the German
Ministry for the Environment, Nature Conservation and Nuclear Safety) a workshop tackling
both themes could be organized in our house, and I was very pleased to see that so many
experts from all over the world followed our invitation to this international workshop.
NABU – the Nature and Biodiversity Conservation Union - is the German partner of Birdlife
International. As a NGO, NABU is right in the middle of many discussions around wind
energy. Please let me briefly explain our approach to wind energy. It may be described as
mitigating climate change and reducing impacts on biodiversity.
The key questions we are working upon are:
What are the perspectives for wind energy development now and in the future? Why should
we as NABU advocate not only for avoiding and reducing impacts on biodiversity?
Which role has wind energy to play in an ambitious climate change mitigation policy in
Germany? What is NABU’s position on that?
What are our requirements for strategic planning to regulate the choice for the right location?
Once a location is legally fixed as designated area for wind farm projects, how can you avoid
and reduce possible impacts on birds and bats?
Industrialized countries are responsible for the historic greenhouse gas emissions which
have caused the human induced temperature rise we are facing already today. Thus we
have to take stronger ambitions in climate change mitigation policies. Within the UNFCCC
negotiations reductions of minimum 80% by 2050 compared to 1990 levels for regions like
the EU are reasonable and fair. This is why we support our German government´s goal of
40% reduction by 2020 to path our way into a low carbon economy.
To achieve this you cannot say “safe energy first and later we deal with the switch to
renewables”. We need to follow both strategies at the same time, but of course the share of
renewables will be even greater if we succeed in reducing our energy consumption. In many

13
parts of the developing and economically fast growing countries energy demand will rapidly
be increasing instead of decreasing. But in Germany we have scientific projections that say
energy efficiency has to play an important role as well as advanced deployment of
renewables to achieve our CO2 reduction goal.
Fortunately wind energy is not the only option within a future renewable energy mix. But
today it offers in Germany the lowest cost for avoiding CO2-emissions compared to solar
energy for instance. We are a country with a high population density, so land consumption
for agriculture is quite high. The energy yield from wind energy is much higher than from the
utilization of biomass on fields. This is why NABU believes at least until 2020 wind energy
has to offer the biggest contribution to the exploitation of renewable energy sources in the
electricity sector.
However, we do not accept wind farm developments everywhere in the landscape. Our
spatial planning system applies the system of designated areas for wind energy, excluding
projects outside these areas. We would like to see the same approach legally implemented
for offshore wind farms as soon as possible.
We should therefore engage in defining suitable locations for wind farms with careful
assessments of the possible impacts on birds and bats. Our own research work gave us
indications which sites should be kept free from wind energy development:
• IBA and SPA,
• well known migration routes and flight corridors,
• important roosting areas for waders and water birds,
• wetlands and woods, and
• places with high occurrences of birds of prey.
The last point has been very much in public dispute in Germany over the last years. We are
therefore very grateful to our German Ministry for the Environment, Nature Conservation and
Nuclear Safety for financing a project that should answer at least some of the open
questions.
I hope that the first results presented in this workshop will help to ensure that we reach both,
our aims for the future development of wind energy and a good conservation status for our
birds of prey.
14
Interactions of Red Kites and wind farms: results of radio telemetry and field observations
Ubbo Mammen*, Kerstin Mammen*#, Lukas Kratzsch#, Alexander Resetaritz*#, Ralf Siano#
*Ökotop GbR, Schülershof 12, 06132 Halle, Germany; # Michael-Otto-Institut im NABU, Goosstroot 1, 24861 Bergenhusen, Germany
Red Kites as victims of wind turbines
At the time of writing of this article exactly 100 Red Kites Milvus milvus were registered In the
central database of collision victims at wind turbines in Germany (T. DÜRR, „Staatliche
Vogelschutzwarte in Brandenburg“). The months of death (known for 70 of these birds) were
mainly April and August (Fig. 1). It has to be taken into account that most of the collision
victims were found accidentally. Only few systematic studies took place, and even with a
systematic search approach it would be hard to detect really all of the collision victims,
because a systematically search for collision victims would mean that the vicinity of the wind
turbine (100 m radius around the tower) can be completely checked. But in fact, the visibility
within the field crops changes seasonally. For instance in February the visibility is excellent.
In April, however, only 10 % of the investigated area still has a very good visibility. Searching
for carcasses in the remaining area still is possible but requires more time and care. In June
the visibility of the whole 100 m radius is very bad because only fallow vegetation around the
wind turbine, the roads and other open areas can be checked, but not the arable crops.
Thus, in May, June and July up to harvesting, the probability of finding collision victims is
very low. The seasonal pattern of recorded victims (Fig. 1) obviously is skewed by the limited
visibility in spring and early summer. Additionally it has to be taken into account that a lot of
carcasses disappear soon after collision (carried off by predators). It thus seems clear, that
even with regular and systematic searches only a part of the collision victims can be found
and the number of unreported cases remains very high. On the other hand, only a small part
of accidental findings made by walkers or hunters are reported.
15
Fig. 1: Seasonal pattern of recorded collision victims of Red Kites in wind farms (n = 70 Red Kites with known month of death, data from 1995 to 2008).
Study sites and methods
The four study areas are situated in Saxony-Anhalt, the area with the highest breeding
density of Red Kites within Germany and worldwide. All study sites consist of intensively
used agricultural landscapes with at least of one wind farm in each of them. There are two
main investigation sites and two additional sites. In the years 2007 and 2008 we mapped the
breeding population of raptors within a 3-km-circle around the wind turbines. In order to
collect collision victims we checked the wind turbines every two weeks on average
(altogether 2.671 searches around a turbine). Within the wind farms we used standardized
observation sessions of 45 minutes each. Within the sessions we noticed occurrence and
behaviour of all raptors in the site. Additionally, we recorded flight sequences of Red Kites in
more detail (flight height, distance to wind turbine etc.). Finally, we radio-tracked adult Red
Kites in the main investigation sites.
Summary of first results
Within the observation sessions 540 observations of Red Kites were recorded. With
reference to the total observation time this equals to 1 Kite per 89 minutes. In total 23
percent of all recorded Red Kites approached the wind turbines closer than 50 m. The
variability between the study areas was high (Tab. 1). Nevertheless, the high proportion of
flights near the turbines indicated clearly that Red Kites did not avoide operating turbines. A
few Red Kites even flew through the inner danger zone (that means the rotor sphere and the
rotor disk.). In 0,6 % of the observed flights Red Kites crossed the rotor disk. In a preceding
study in the study site Querfurt STRAßER (2006) had found that 5,2 % of recorded flights
crossed the rotor disk.
0
2
4
6
8
10
12
14
16
18
20
Jan Feb Mar Apr May Jun Jul Aug Sep Oct Nov Dec
16
Table 1: Numbers of Red Kite records within a 50 m-circle around wind turbines in different study sites in both study years. The figures in brackets give the percentages of these observations in relation to all observations.
Study site 2007 2008 Total
Druiberg 66 (41%) 17 (61%) 83 (44%)
Dessau 7 (24%) 6 (32%) 13 (27%)
Querfurt 16 (12%) 7 (18%) 23 (13%)
Speckberg 1 (1%) 3 (6%) 4 (3%)
total 90 (22%) 33 (24%) 123 (23%)
Crossing a wind farm is dangerous for a Red Kite if it flies in reach of the rotor blades. Due to
the presence of different types of wind turbines, rotor blades operate between 50 m and 150
m in our study sites. Consequently we recorded the percentage of time Red Kites spent in
different altitudes. From March to June we recorded flying height all in all in 15.822 seconds
(4,4 hours). In approx. 29 % of the observed time the Red Kites flew in the dangerous height
between 50 and 150 meters (see Fig. 2). From July to October the flying height was recorded
in 14.620 seconds (4 hours), and approx. 22 % of the Red Kites flew in the dangerous height
of 50 and 150 meters.
The preceding results suggest that Red Kites often run into dangerous situations as soon as
they enter a wind farm. An important question, therefore, is why Red Kites fly into wind
farms? For this purpose we investigated which field crops were present in the study area and
how they were used by foraging Red Kites. In order to distinguish between avoidance and
preference of habitats we calculated the Jacobs-Index.
The habitat preference of Red Kites changed through the year. In May and June Red Kites
preferred boundary structures, maize-fields and fields with fodder crops, which had been
harvested early. In July the birds preferred boundary structures, harvested alfalfa fields and
rape stubbles. In August Red kites mostly foraged on fields with harvested crops or alfalfa.
17
March – June July - October
Fig. 2: Flying height of Red Kites in wind farms.
There were distinct seasonal patterns of preference of several crops and habitats. For
instance, sugar beets were avoided during most time of the year. Only during harvesting in
September and October a preference was registered. Fallow land was preferred only after
cutting, while bare fallow and boundary structures were preferred nearly during the whole
year. Rape fields with their dense vegetation cover were avoided during most time of the
year. These fields were preferred only after harvesting in July and in the late September due
to harrowing or ploughing.
In summary, Red Kites had an opportunistic foraging behaviour. They preferred low or open
structures on which they could detect their food. This excluded rape fields and fully grown
maize and sugar beet fields, while boundary structures were very important food resources in
the intensively used agricultural landscape. Structures like the roads to the wind turbines and
the areas directly around the tower bases also were such boundary structures, which
attracted Red Kites into wind farms.
If Red Kites are searching for prey next to tower bases, they may get into risky situations.
Thus, the practical question is: How has the turbine basis to be designed to become
unattractive for Red Kites?
We experimentally covered the basis of three wind turbines with cling film and we compared
the numbers of observations of Red Kites in the vicinity of the modified tower bases with the
numbers of observations at three uncovered tower bases. At the modified turbines fewer
19,7
24,8
23,0
17,9
10,7
4,0
0,0 10,0 20,0 30,0 40,0
1-10 m
11-25 m
26-50 m
51-100 m
101-150 m
>151 m
shar
e of
tim
e [%
]
height level
20,4
36,9
19,3
12,6
9,3
1,5
0,0 10,0 20,0 30,0 40,0
1-10 m
11-25 m
26-50 m
51-100 m
101-150 m
>151 m
shar
e of
tim
e [%
]
height level
18
observations were registered than at the unmodified ones, but the total number of contacts
was too low to apply statistical tools.
Another part of the Red Kite project was the radio telemetry. In 2007 five Red Kites were
captured and equipped with transmitters. Two of them returned in the following year. In 2008
we tracked another Red Kite and two Black Kites.
Fig. 3: Home range of the Red Kite Arthur during the breeding season 2007 (n=56 locations). Distance
of breeding site (red dot) to the next turbine: 440 m; size of 95 % MCP (red line): 4.1 km²; colored
areas: 95%/60%/50%-kernels. Blue stars: wind turbines.
The individual variation in home range size was remarkably. The size of the home ranges of
Red Kites (MCP 95%) ranged between 1.74 km² and 74.42 km² during the breeding season,
and between 2.06 km² and 213.35 km² after the breeding season. Several birds included
parts of neighbouring wind farms into their home ranges (see Fig. 3). In order to measure the
daily use of space and the daily travelling distance of Red Kites, we tracked all individuals
over the whole day (from sun raise to sun set) once a month in 2008. An example is given in
Fig. 4 by the visualized results of a day-tracking of the Red Kite Gishild.
Due to different home range sizes individual Red Kites travelled different distances from their
nests. An example for a bird with a rather small home range is the Red Kite Arthur. The
maximum distance of Arthur from its nest was 3228 m. 50 % of the locations of this bird were
within a distance of 982 m from the nest (Fig. 5).
19
Fig. 4: Flight route of Red Kite Gishild on 2.7.2008. Length of flight route: 39.5 km; time spent flying 1
h 35 min, time spent sitting 13 h 04 min, no contact 1 h 47 min. Blue stars: wind turbines.
Fig. 5: Distances between radio telemetry localizations and nest site of Red Kite Arthur. The blue dots
mark the cumulative percentages of observations at different distances from the nest site.
0
20
40
60
80
100
0 500 1000 1500 2000 2500 3000 3500
distance [m]
shar
e of
loca
lizat
ions
[%]
20
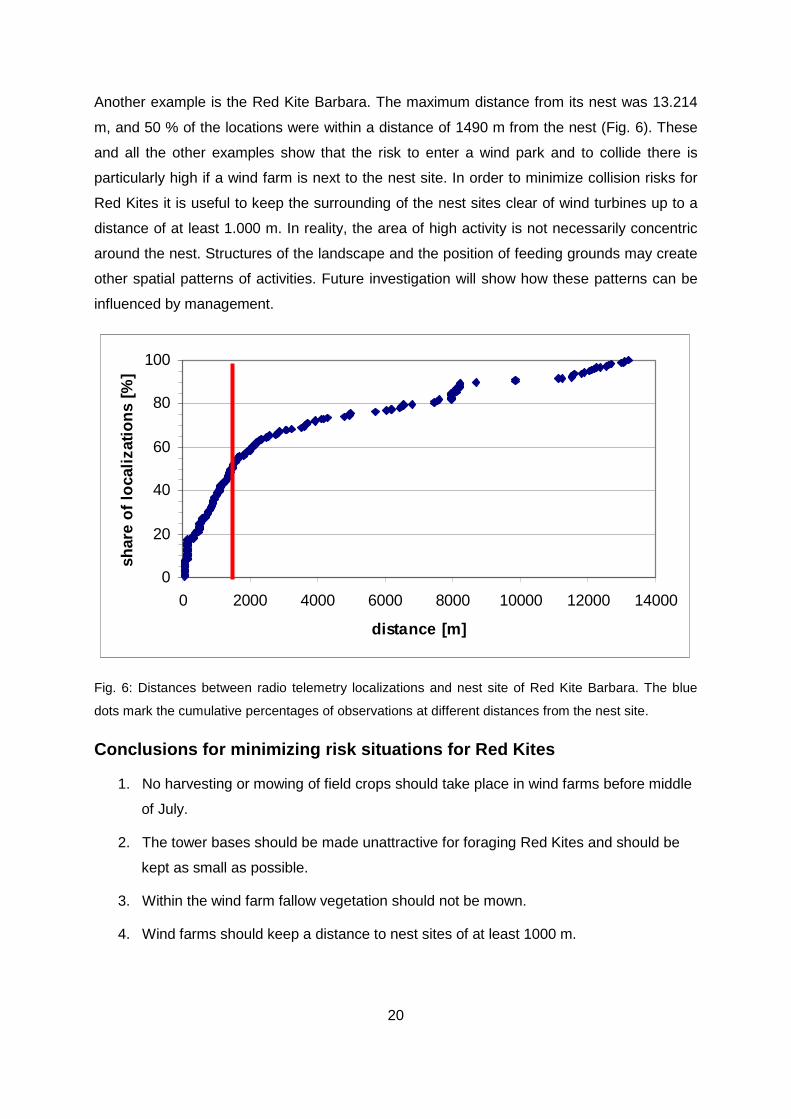
Another example is the Red Kite Barbara. The maximum distance from its nest was 13.214
m, and 50 % of the locations were within a distance of 1490 m from the nest (Fig. 6). These
and all the other examples show that the risk to enter a wind park and to collide there is
particularly high if a wind farm is next to the nest site. In order to minimize collision risks for
Red Kites it is useful to keep the surrounding of the nest sites clear of wind turbines up to a
distance of at least 1.000 m. In reality, the area of high activity is not necessarily concentric
around the nest. Structures of the landscape and the position of feeding grounds may create
other spatial patterns of activities. Future investigation will show how these patterns can be
influenced by management.
Fig. 6: Distances between radio telemetry localizations and nest site of Red Kite Barbara. The blue
dots mark the cumulative percentages of observations at different distances from the nest site.
Conclusions for minimizing risk situations for Red Kites
1. No harvesting or mowing of field crops should take place in wind farms before middle
of July.
2. The tower bases should be made unattractive for foraging Red Kites and should be
kept as small as possible.
3. Within the wind farm fallow vegetation should not be mown.
4. Wind farms should keep a distance to nest sites of at least 1000 m.
0
20
40
60
80
100
0 2000 4000 6000 8000 10000 12000 14000
distance [m]
shar
e of
loca
lizat
ions
[%]

21
Reference
STRAßER, C. (2006): Totfundmonitoring und Untersuchung des artspezifischen Verhaltens von Greifvögeln in einem bestehenden Wildpark in Sachsen-Anhalt. Diploma thesis. University of Trier.
22
Effect of wind farms on population trend and breeding success of Red Kites and other birds of prey
Leonid Rasran1, Ubbo Mammen2 , Hermann Hötker1
1 Michael-Otto-Institut im NABU, Goosstroot 1, 24861 Bergenhusen, Germany
2 Förderverein für Ökologie und Monitoring von Greifvogel- und Eulenarten e.V.,Schülershof 12, 06108 Halle, Germany
Introduction
During the past decades wind farms have been constructed in many parts of Germany.
Breeding and foraging sites of Red Kites, White-tailed Eagles and other endangered birds of
prey have been affected. Although birds of prey have frequently been reported as victims of
collisions with wind turbines, little is known about the effects of wind farms on the population
dynamics of these species. The aim of this study is to compare population densities and
breeding success of raptors in the past 15 years with the development of wind farms in the
same areas. We use monitoring data provided by the initiative of the foundation for ecology
and monitoring of Raptors and Owls in Europe in order to test whether increased numbers of
wind turbines has caused a measurable effect on raptor populations.
Methods
Data on population size (number of breeding pairs) and breeding success (young fledged per
pair) of several raptor species (Red Kite Milvus milvus, Black Kite Milvus migrans, White-
Tailed Eagle Haliaeetus albicilla, Buzzard Buteo buteo, Honey Buzzard Pernis apivorus,
Hobby Falco subbuteo, Kestrel Falco tinnunculus, Goshawk Accipiter gentiles, Sparrow
Hawk Accipiter nisus and Marsh Harrier Circus aeruginosus) were provided by the MEROS-
program (Monitoring of European Raptors and Owls; http://www.greifvogelmonitoring.de).
We selected 225 monitoring areas, ranging between 30 km² and 2000 km² in size, in all parts
of Germany, for which data were available between 1991 and 2006. Data sets for single
species were often smaller, because not all species were recorded at every site in each year.
Data on breeding success were available only until 2002. For each monitoring site the
positions, commissioning time and capacity of relevant wind turbines was compiled using the
wind energy database (Windkraft Betreiber-Datenbasis).
23
Repeated measurements ANOVAs (ANalysis Of VAriance) were used to analyze the effects
of wind power plants on population development of raptors in monitoring areas. We applied
linear mixed-effects models fitted by maximum likelihood, with (1) numbers of breeding pairs
per standard area unit (100 km²), or (2) breeding success (number of fledglings per pair) as
dependent variables and with numbers of wind turbines and/or total capacity of wind turbines
per area unit as predictor variables.
Results
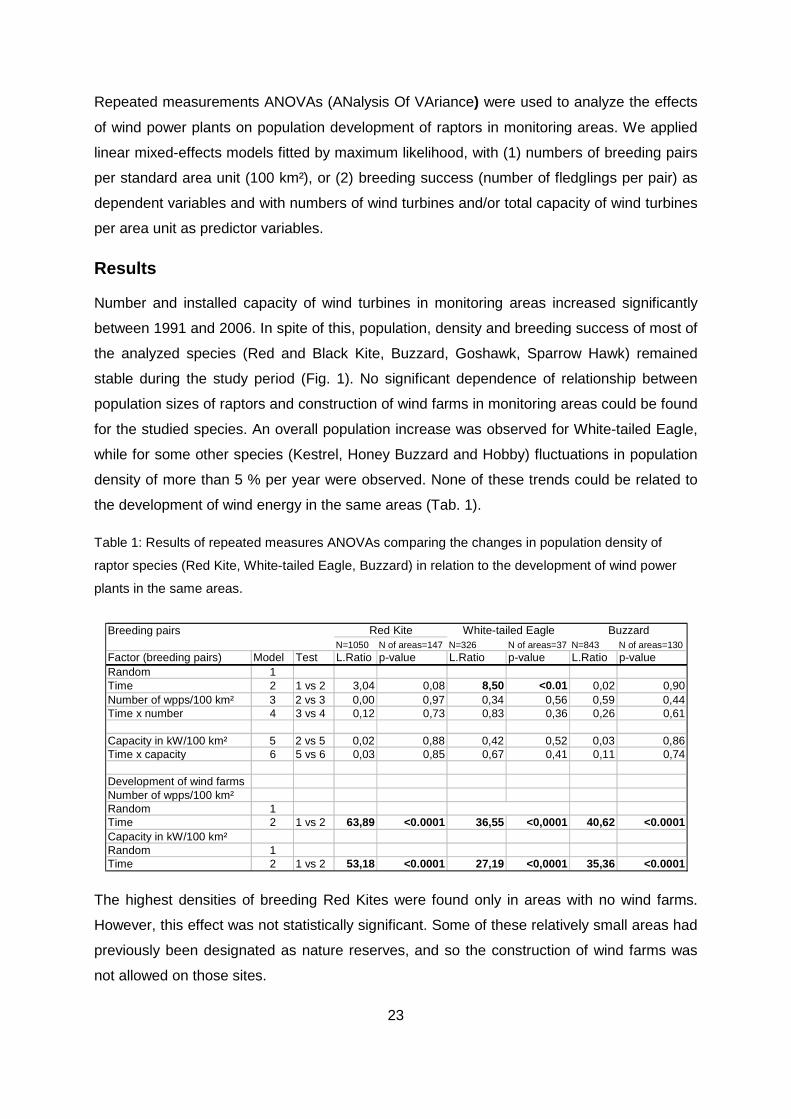
Number and installed capacity of wind turbines in monitoring areas increased significantly
between 1991 and 2006. In spite of this, population, density and breeding success of most of
the analyzed species (Red and Black Kite, Buzzard, Goshawk, Sparrow Hawk) remained
stable during the study period (Fig. 1). No significant dependence of relationship between
population sizes of raptors and construction of wind farms in monitoring areas could be found
for the studied species. An overall population increase was observed for White-tailed Eagle,
while for some other species (Kestrel, Honey Buzzard and Hobby) fluctuations in population
density of more than 5 % per year were observed. None of these trends could be related to
the development of wind energy in the same areas (Tab. 1).
Table 1: Results of repeated measures ANOVAs comparing the changes in population density of
raptor species (Red Kite, White-tailed Eagle, Buzzard) in relation to the development of wind power
plants in the same areas.
Breeding pairsN=1050 N of areas=147 N=326 N of areas=37 N=843 N of areas=130
Factor (breeding pairs) Model Test L.Ratio p-value L.Ratio p-value L.Ratio p-valueRandom 1Time 2 1 vs 2 3,04 0,08 8,50 <0.01 0,02 0,90Number of wpps/100 km² 3 2 vs 3 0,00 0,97 0,34 0,56 0,59 0,44Time x number 4 3 vs 4 0,12 0,73 0,83 0,36 0,26 0,61
Capacity in kW/100 km² 5 2 vs 5 0,02 0,88 0,42 0,52 0,03 0,86Time x capacity 6 5 vs 6 0,03 0,85 0,67 0,41 0,11 0,74
Development of wind farmsNumber of wpps/100 km²Random 1Time 2 1 vs 2 63,89 <0.0001 36,55 <0,0001 40,62 <0.0001Capacity in kW/100 km²Random 1Time 2 1 vs 2 53,18 <0.0001 27,19 <0,0001 35,36 <0.0001
Red Kite White-tailed Eagle Buzzard
The highest densities of breeding Red Kites were found only in areas with no wind farms.
However, this effect was not statistically significant. Some of these relatively small areas had
previously been designated as nature reserves, and so the construction of wind farms was
not allowed on those sites.
24
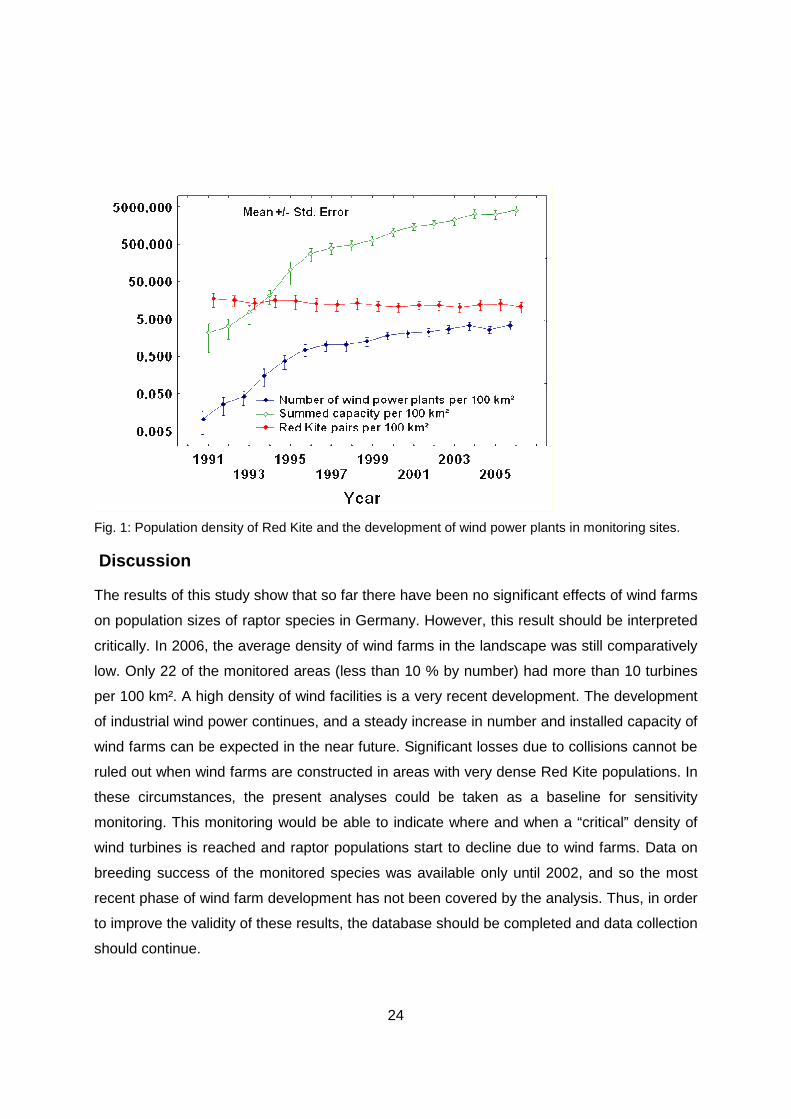
Fig. 1: Population density of Red Kite and the development of wind power plants in monitoring sites.
Discussion
The results of this study show that so far there have been no significant effects of wind farms
on population sizes of raptor species in Germany. However, this result should be interpreted
critically. In 2006, the average density of wind farms in the landscape was still comparatively
low. Only 22 of the monitored areas (less than 10 % by number) had more than 10 turbines
per 100 km². A high density of wind facilities is a very recent development. The development
of industrial wind power continues, and a steady increase in number and installed capacity of
wind farms can be expected in the near future. Significant losses due to collisions cannot be
ruled out when wind farms are constructed in areas with very dense Red Kite populations. In
these circumstances, the present analyses could be taken as a baseline for sensitivity
monitoring. This monitoring would be able to indicate where and when a “critical” density of
wind turbines is reached and raptor populations start to decline due to wind farms. Data on
breeding success of the monitored species was available only until 2002, and so the most
recent phase of wind farm development has not been covered by the analysis. Thus, in order
to improve the validity of these results, the database should be completed and data collection
should continue.
25
Summary of the discussion after the talk
H. SCHLÜTER argued that the talk contains “statement outside the legal framework” because Red Kites are not threatened. The authors disagreed with this statement.
R. MAY considers that numbers of breeding raptors per monitoring plot (as used in the presentation) does not allow any statement about the distribution of birds within the plot. It could be the case that wind turbines and raptors are locally separated at a finer spatial scale.
L. RASRAN agrees with this point of view. The present data, however, do not allow an analysis of the spatial distribution of raptors and wind turbines within study plots.
M. REICHENBACH considers the statements of the presentation to be politically sensitive. If there are no indications of an effect of wind farms on population development, he asks where is the problem?
L. RASRAN replies that the study plots do not represent regions with the highest density of wind turbines.
J. WEBER thinks that the low number of victims means that the effect of wind farms on the population development of raptors can be neglected.
B. DE WOLF asks whether it is possible to conduct more exact analyses including local data on spatial distribution of wind turbines and raptors.
H. HÖTKER replies that such an approach is possible, but requires a much higher research effort.
26
Analysis of collision victims in Germany
Leonid Rasran1, Tobias Dürr2, Hermann Hötker1
1 Michael-Otto-Institut im NABU, Goosstroot 1, 24861 Bergenhusen, Germany
2 Ökotop GbR, Schülershof 12, 06132 Halle, Germany
Introduction
Injury and death of birds due to collisions with wind turbine masts and rotor blades are direct
negative consequences of wind farm development. The share of raptors and large
endangered bird species among the collision victims is comparatively high. Little is known
about the circumstances that led to the collisions. At the Staatliche Vogelschutzwarte
Brandenburg, information on collision victims in Germany has been collected since 1989. In
this study, we analyse information on raptors and other large birds in order to find out which
factors contribute to the risk of collisions at wind power plants.
Methods
Out of about 730 collision victims recorded until the end of 2008, 323 were raptors or other
endangered large birds (including: 101 Red Kites Milvus milvus; 36 White-tailed Eagles
Haliaeetus albicilla; 14 White Storks Ciconia ciconia; and eight Eagle Owls Bubo bubo).
In order to analyse the effects on the collision risk of technical specifications of wind turbines
and habitat characteristics around wind turbines, we compared 151 turbines where fatalities
of target bird species had been reported with 186 randomly selected turbines without
reported fatalities. We treated randomly selected turbines as sites with average collision risk,
and turbines with one or more documented collisions as sites with increased risk.
Reports detailing regular search activities at specific wind farms, and fatalities found by these
controls, were treated as a separate dataset, in order to estimate bird fatality rates per
turbine or per installed unit of power.
The victim register contains data on the date and place of collision, and, in some cases also
on the age of the victim, and injuries caused by the collision. In addition, we collected data on
the characteristics of wind farms (position; number of turbines; rotor diameters; hub heights;
27
installed capacities) and on the habitats surrounding the wind farm (distances to the nearest
wood, water body, road and settlement, and land use within 5 km [CORINE-Database]).
We tested the relationship between of victim numbers and characteristics of wind farms by
linear regression. Comparisons between wind turbines with reported collisions and randomly
selected wind turbines were performed by one-way ANOVAs.
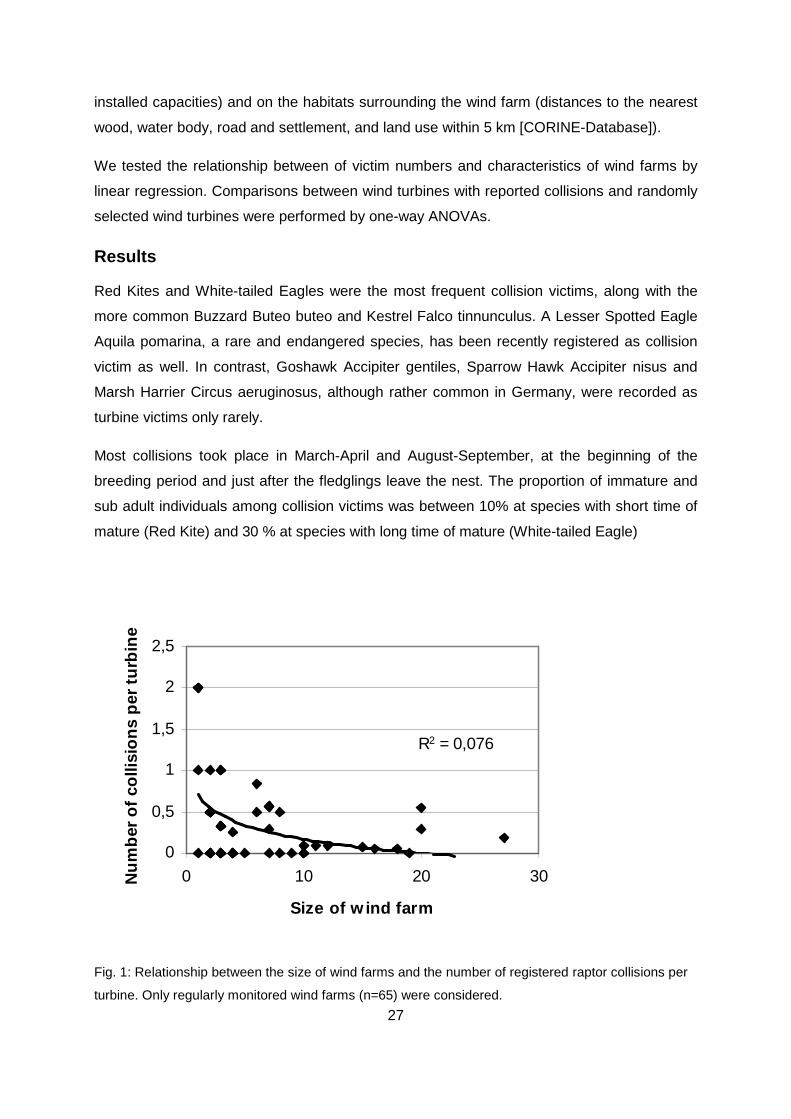
Results
Red Kites and White-tailed Eagles were the most frequent collision victims, along with the
more common Buzzard Buteo buteo and Kestrel Falco tinnunculus. A Lesser Spotted Eagle
Aquila pomarina, a rare and endangered species, has been recently registered as collision
victim as well. In contrast, Goshawk Accipiter gentiles, Sparrow Hawk Accipiter nisus and
Marsh Harrier Circus aeruginosus, although rather common in Germany, were recorded as
turbine victims only rarely.
Most collisions took place in March-April and August-September, at the beginning of the
breeding period and just after the fledglings leave the nest. The proportion of immature and
sub adult individuals among collision victims was between 10% at species with short time of
mature (Red Kite) and 30 % at species with long time of mature (White-tailed Eagle)
R2 = 0,076
0
0,5
1
1,5
2
2,5
0 10 20 30
Size of w ind farm
Num
ber o
f col
lisio
ns p
er tu
rbin
e
Fig. 1: Relationship between the size of wind farms and the number of registered raptor collisions per
turbine. Only regularly monitored wind farms (n=65) were considered.
28
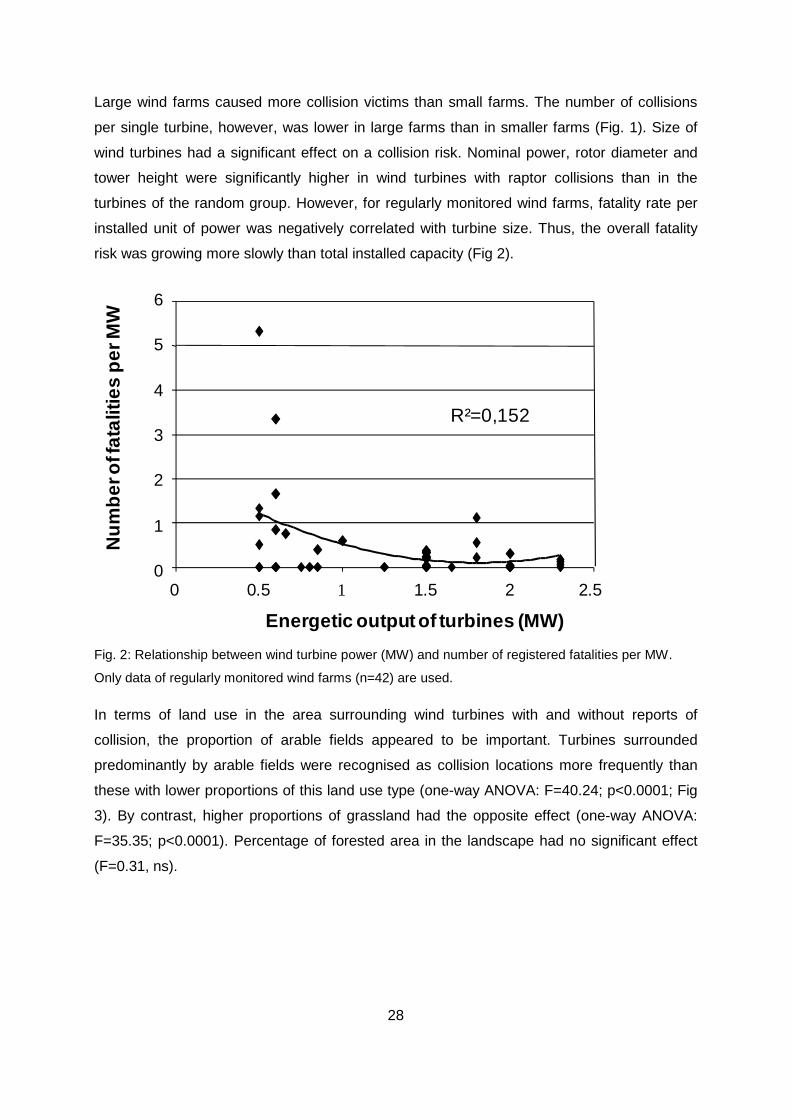
Large wind farms caused more collision victims than small farms. The number of collisions
per single turbine, however, was lower in large farms than in smaller farms (Fig. 1). Size of
wind turbines had a significant effect on a collision risk. Nominal power, rotor diameter and
tower height were significantly higher in wind turbines with raptor collisions than in the
turbines of the random group. However, for regularly monitored wind farms, fatality rate per
installed unit of power was negatively correlated with turbine size. Thus, the overall fatality
risk was growing more slowly than total installed capacity (Fig 2).
Num
ber o
f fat
aliti
es p
er M
W
0
1
2
3
4
5
6
0 0.5 1 1.5 2 2.5
R²=0,152
Energetic output of turbines (MW)
Fig. 2: Relationship between wind turbine power (MW) and number of registered fatalities per MW.
Only data of regularly monitored wind farms (n=42) are used.
In terms of land use in the area surrounding wind turbines with and without reports of
collision, the proportion of arable fields appeared to be important. Turbines surrounded
predominantly by arable fields were recognised as collision locations more frequently than
these with lower proportions of this land use type (one-way ANOVA: F=40.24; p<0.0001; Fig
3). By contrast, higher proportions of grassland had the opposite effect (one-way ANOVA:
F=35.35; p<0.0001). Percentage of forested area in the landscape had no significant effect
(F=0.31, ns).
29
0%10%
20%
30%
40%
50%
60%
70%
80%
90%
100%
fatality random
Open water
Miscelaneous
Meadows, pastures, heathlands
Forests
Arable fields
Mining areas and waste heaps
Roads
Settlements
Fig. 3: Mean percentage of different land use forms in the surrounding (5 km radius) of wind turbines
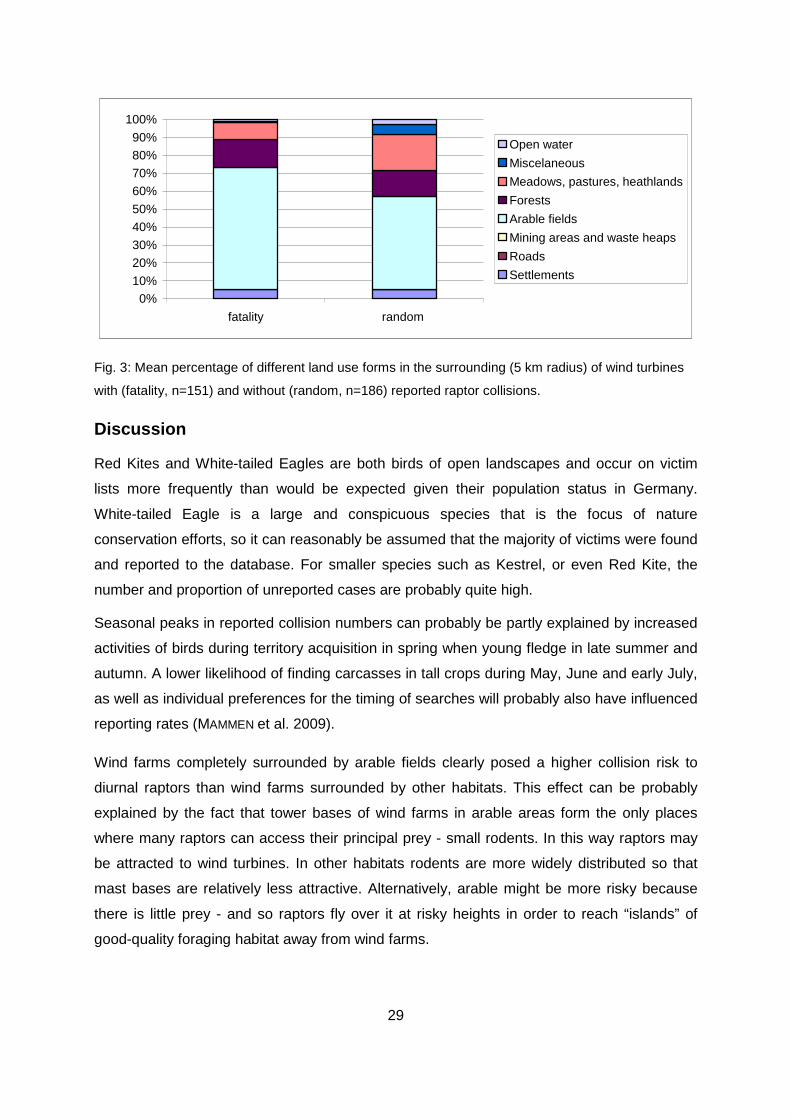
with (fatality, n=151) and without (random, n=186) reported raptor collisions.
Discussion
Red Kites and White-tailed Eagles are both birds of open landscapes and occur on victim
lists more frequently than would be expected given their population status in Germany.
White-tailed Eagle is a large and conspicuous species that is the focus of nature
conservation efforts, so it can reasonably be assumed that the majority of victims were found
and reported to the database. For smaller species such as Kestrel, or even Red Kite, the
number and proportion of unreported cases are probably quite high.
Seasonal peaks in reported collision numbers can probably be partly explained by increased
activities of birds during territory acquisition in spring when young fledge in late summer and
autumn. A lower likelihood of finding carcasses in tall crops during May, June and early July,
as well as individual preferences for the timing of searches will probably also have influenced
reporting rates (MAMMEN et al. 2009).
Wind farms completely surrounded by arable fields clearly posed a higher collision risk to
diurnal raptors than wind farms surrounded by other habitats. This effect can be probably
explained by the fact that tower bases of wind farms in arable areas form the only places
where many raptors can access their principal prey - small rodents. In this way raptors may
be attracted to wind turbines. In other habitats rodents are more widely distributed so that
mast bases are relatively less attractive. Alternatively, arable might be more risky because
there is little prey - and so raptors fly over it at risky heights in order to reach “islands” of
good-quality foraging habitat away from wind farms.
30
Our study shows that the collision rate per installed unit of power decreases with the size of
the wind turbines. The result confirms the outcome of earlier studies and model calculations
(HÖTKER 2006; SMALLWOOD & KARAS 2009). Repowering (replacement of old wind turbines
by bigger and more efficient turbines) thus has less of a negative effect on birds than would
be expected if the ratio of collisions and power is the same in small and big wind turbines.
References
HÖTKER, H. (2006): Auswirkungen des "Repowerings" von Windkraftanlagen auf Vögel und
Fledermäuse. Bericht für das Landesamt für Natur und Umwelt Schleswig-Holstein. Michael-Otto-
Institut im NABU, Bergenhusen.
MAMMEN, U., MAMMEN, K., KRATZSCH, L., RESETARITZ, A. & SIANO, R. (2009): Interactions of Red Kites
and wind farms: results of radio telemetry and field observations. In: Hötker, H. ed.: Birds of Prey and
Wind Farms. Proceedings of an international workshop, Berlin, Oct. 21-22, 2008.
http://www.bergenhusen.nabu.de/forschung/greifvoegel/
SMALLWOOD, S.K. & KARAS, B. (2009): Avian and Bat Fatality Rates at Old-Generation and Repowered
Wind Turbines in California. Journal of Wildlife Management 73: 1062-1071.
Summary of the discussion after the talk
R. MAY considered that the presented data cannot be compared with results of other
international studies.
G. NEHLS stated that there are only a few studies on collision victims. Systematic monitoring
is necessary. The main difficulty for such studies is tall vegetation height in summer, which
makes it difficult to find collision victims.
31
Montagu‘s Harriers and wind farms: Radio telemetry and observational
studies
Bodo Grajetzky, Malte Hoffmann & Georg Nehls BioConsult SH GmbH & Co.KG, Brinckmannstr. 31, 25813 Husum, Germany
The abstract gives a status report of a two years study on radio-tagged Montagu’s Harriers
inhabiting a wind farm area in Northern Germany.
Introduction
The Montagu’s Harrier (Circus pyrgargus) is rather patchily distributed in Central Europe.
Since the 19th century it has suffered dramatic declines, mainly due to loss of natural
breeding sites (raised bogs, fens and reed habitats). The present breeding population in
Germany ranges between 410 and 470 pairs. Schleswig-Holstein, one of the most important
breeding regions, presently holds 50 to 60 breeding pairs.
Due to the loss of natural breeding habitat, a large-scale settlement has taken place in
agricultural areas since the 1970s. At the same time, wind farms have been developed in the
same regions. At present, most Montagu’s Harrier’s territories in Schleswig-Holstein are
concentrated in the areas with the highest density of wind turbines. Given the low population
size of Montagu’s Harrier, it is important to know whether they are affected or threatened by
wind farms.
Study areas
The investigations are focused on two areas on the North Sea coast of Schleswig-Holstein.
The landscapes are characterised by salt marshes next to the sea and reclaimed polders
inland, separated by dykes. The salt marshes hold high densities of breeding waders and
passerines. These areas are important foraging habitats for Montagu’s Harriers and this is
one factor that can explain the concentration of breeding pairs in this coastal region. Harrier
nest sites are located behind the dykes in the polders. Landuse on the polders is mainly
agriculture, dominated by cereals. Nests are found in barley, wheat and occasionally oil seed
rape.
32
Methods
Birds were caught on wooden posts installed in the territories. The trap consisted of a loop,
which is drawn together around the leg, triggered when the bird is landing. We caught 6
adults in 2007 (3 males, 3 females) and 5 in 2008 (4 males, 1 female).
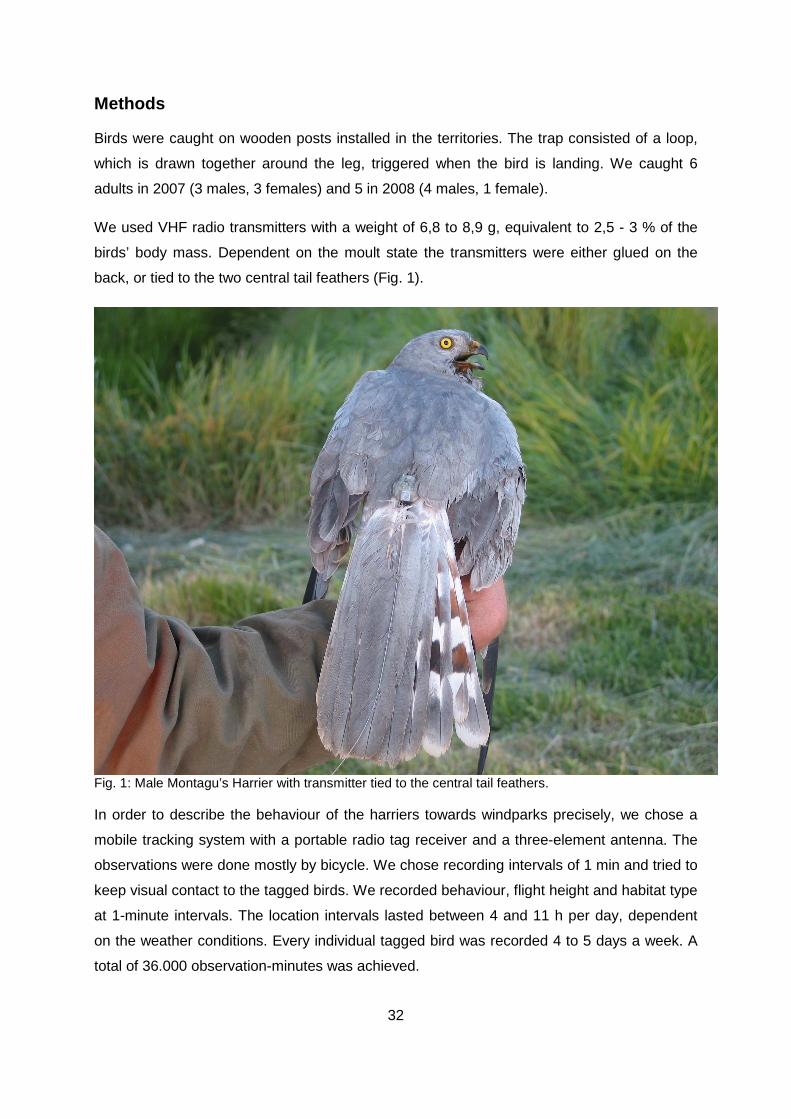
We used VHF radio transmitters with a weight of 6,8 to 8,9 g, equivalent to 2,5 - 3 % of the
birds’ body mass. Dependent on the moult state the transmitters were either glued on the
back, or tied to the two central tail feathers (Fig. 1).
Fig. 1: Male Montagu’s Harrier with transmitter tied to the central tail feathers.
In order to describe the behaviour of the harriers towards windparks precisely, we chose a
mobile tracking system with a portable radio tag receiver and a three-element antenna. The
observations were done mostly by bicycle. We chose recording intervals of 1 min and tried to
keep visual contact to the tagged birds. We recorded behaviour, flight height and habitat type
at 1-minute intervals. The location intervals lasted between 4 and 11 h per day, dependent
on the weather conditions. Every individual tagged bird was recorded 4 to 5 days a week. A
total of 36.000 observation-minutes was achieved.
33
Telemetry fixes were entered as points into a GIS. Home ranges were derived using Kernel
estimators, which calculate an utilisation distribution from the telemetry points. Two
probability levels were specified: 95 %, and 50 %, the latter representing the centre of activity
(core area). For the calculation of utilisation of wind farms areas, we defined the “wind farm
impact area” as a 200 m radius around each wind turbine.
First results
Note that up to now only a small part of the whole dataset could be integrated to the analysis.
The presented results have not been statistically tested and are to be interpreted carefully.
Nest sites and wind farms
The distance between 24 nests and the nearest turbine ranged between 76 and 890 m. The
small sample size precluded statistical analysis, but the distribution of the distances showed
a low tendency of displacement. If displacement did occur, it may have done so in the
immediate vicinity (<100m) of the turbines (Fig. 2). We suggest that nest site selection was
mainly determined by the vegetation structure of cereals. This was obvious in 2007, when
isolated barley fields close to wind turbines were strongly preferred as nesting areas.
Presumably the preference for barley masked any existing displacement effects of the wind
turbines.
nest distance to wea
0
10
20
30
40
50
0-100 101-300 301-500 > 500
%
n = 24
m
Fig. 2: Distances of Montagu’s Harrier’s nests to wind turbines (wea).
34
Home ranges
In Figs. 3 and 4 the locations, the resulting Kernel-home-range and the core areas of
individual birds are shown. Dependent on the breeding status we found home ranges from
40 ha (female, almost exclusively provisioned by male) up to 1.200 ha (polygynous male with
three females). Important foraging areas were located in the salt marshes and in grassland.
The centres of activity (core areas) were located around the nests (due to food delivery and
feeding nestlings).
Wind farms regularly formed a part of the home ranges (see locations inside the buffer zones
of the turbines). The overlap of wind farm areas with home range of five adults ranged from
10 to 12 %. In contrast to this, two males breeding in the vicinity of two high quality foraging
areas (salt marshes and wetlands) obviously showed no need to visit wind farm areas (Fig.
3).
Behaviour within wind farms
Montagu’s Harriers entered wind farms mostly when travelling between nests and foraging
grounds. Harriers also actively foraged within wind farms, regularly passing wind turbines at
distances of less than 10 m. During hunting harriers flew at low heights, mostly less than 5
m, but 5 % of the analysed flights in wind farms occurred at the dangerous rotor swept height
(30 – 100 m). So far, we have found no differences in the flight height distribution inside and
outside wind farms (Fig. 5). This indicates that Montagu’s Harriers do not moderate their
flight behaviour close to wind turbines.
35
<Empty Scalebar>
<Empty Legend>
View1
r
r
r
r
r r
r
r
r
r
r
r
r
r
r
r
r
rr
r
r
r
r
r
r
r
r
r
r
#S
#S
#S
#S
#S
#S
#S
#S
#S
#S#S
#S
#S
#S
#S
#S
#S
#S#S#S
#S
#S
#S
#S
#S
#S
#S
#S
#S #S#S
#S#S#S#S
#S
#S
#S
#S #S
#S#S
#S#S
#S
#S
#S
#S#S
#S
#S#S
#S
#S
#S
#S#S
#S
#S
#S
#S
#S
#S
#S
#S#S
#S
#S
#S
#S
#S
#S#S
#S
#S#S
#S#S
#S
#S
#S
#S
#S
#S
#S
#S
#S
#S#S
#S
#S
#S
#S
#S
#S
#S
#S#S
#S
#S
#S#S
#S#S
#S
#S
#S
#S
#S
#S
#S
#S#S
#S
#S#S
#S
#S
#S
#S
#S
#S#S
#S#S
#S
#S
#S
#S
#S
#S
#S
#S
#S#S
#S
#S
#S
#S
#S
#S
#S
#S
#S
#S
#S
#S
#S
#S #S
#S
#S
#S
#S
#S
#S
#S
#S
#S
#S
#S
#S
#S
#S#S
#S
#S
#S
#S
#S
#S
#S
#S
#S
#S
#S
#S
#S
#S
#S
#S
#S
#S
#S
#S
#S
#S
#S
#S
#S
#S#S
#S#S#S
#S
#S
#S
#S
#S
#S
#S
#S
#S
#S
#S
#S
#S
#S
#S
#S
#S #S
#S
#S#S
#S
#S
#S
#S
#S
#S
#S
#S#S
#S
#S#S
#S
#S
#S
#S#S#S #S
#S
#S
#S
#S#S
#S#S
#S
#S
#S#S#S#S#S
#S
#S
#S
#S#S
#S
#S
#S
#S
#S
#S
#S#S
#S
#S
#S#S
#S
#S#S
#S#S
#S
#S
#S
#S
#S
#S
#S#S
#S
#S
#S#S#S#S
#S
#S
#S#S#S#S
#S
#S
#S#S
#S
#S
#S
#S
#S
#S
#S
#S
#S
#S
#S
#S
#S
#S
#S
#S
#S
#S
#S#S
#S
#S#S
#S#S
#S
#S#S#S
#S
#S
#S#S
#S
#S
#S
#S
#S
#S#S
#S
#S
#S
#S
#S
#S
#S
#S
#S
#S
#S
#S
#S
#S
#S
#S
#S
#S
#S
#S
#S
#S
#S #S
#S
#S
#S
#S
#S
#S
#S
#S
#S
#S
#S
#S#S
#S
#S
#S
#S
#S
#S
#S
#S
#S
#S
#S
#S#S
#S
#S
#S#S
#S
#S
#S
#S#S
#S
#S #S
#S#S
#S
#S
#S
#S
#S
#S
#S
#S
#S#S
#S
#S#S
#S
#S
#S
#S#S
#S
#S
#S
#S
#S #S
#S
#S
#S
#S#S
#S
#S
#S
#S
#S
#S
#S
#S
#S
#S
#S
#S
#S
#S
#S
#S
#S
#S
#S#S
#S
#S
#S
#S#S
#S#S#S
#S#S
#S#S
#S
#S
#S
#S
#S
#S
#S
#S
#S
#S
#S
#S
#S
#S
#S#S #S #S
#S #S #S
#S
#S
#S
#S#S
#S
#S#S
#S
#S
#S#S
#S
#Y
#Y
#Y
N
EW
Shome range (95 %)core area (50 %)
200 m - radius WEAr WEA#S locations L3 m 2008#Y Nest
N
0 500 1000 1500 m
Fig. 3: Locations, resulting home-range and core area (Kernel) of a polygynous male providing three
females. The core areas of activity are located in the vicinity of wind turbines (wea).
36
<Empty Scalebar>
<Empty Legend>
View1
rr
r
r
r
r
r
r
rrr
r
r
r
r
r
r
r
r
r
r
r
r
r
r
r
r
#S
#S
#S
#S#S
#S
#S
#S
#S
#S
#S
#S
#S
#S
#S
#S #S
#S
#S
#S
#S
#S
#S#S
#S#S
#S
#S
#S#S #S
#S
#S
#S
#S
#S
#S#S
#S
#S
#S
#S
#S#S
#S
#S
#S
#S
#S
#S
#S
#S
#S#S
#S#S
#S#S
#S
#S
#S
#S
#S#S
#S
#S
#S
#S
#S
#S
#S#S
#S
#S
#S
#S
#S #S
#S
#S
#S
#S
#S
#S
#S
#S
#S
#S
#S#S
#S
#S
#S
#S
#S
#S
#S
#S#S#S
#S
#S
#S
#S
#S
#S
#S
#S
#S
#S
#S
#S
#S
#S#S#S
#S #S#S#S
#S#S#S
#S#S
#S
#S
#S
#S
#S
#S
#S
#S
#S
#S
#S
#S
#S
#S#S
#S
#S
#S
#S
#S
#S
#S
#S
#S
#S
#S
#S#S#S#S
#S#S#S#S#S#S#S
#S
#S#S
#S#S#S
#S
#S
#S
#S#S#S
#S
#S
#S
#S
#S#S
#S
#S
#S#S
#S
#S
#S
#S#S#S
#S #S
#S
#S
#S#S
#S#S
#S
#S
#S
#S#S#S
#S
#S#S
#S
#S
#S
#S#S
#S
#S#S
#S
#S#S#S
#S
#S
#S
#S
#S
#S
#S #S
#S
#S
#S
#S#S
#S
#S
#S#S
#S
#S#S
#S
#S#S#S
#S
#S
#S
#S
#S
#S
#S#S
#S
#S#S#S
#S#S
#S
#S#S
#S
#S#S #S
#S #S #S#S
#S#S
#S
#S#S#S#S
#S
#S
#S
#S
#S
#S#S
#S#S #S
#S
#S
#S
#S
#S
#S
#S
#S
#S
#S
#S
#S
#S#S#S#S
#S
#S
#S #S#S
#S
#S#S
#S
#S
#S
#S
#S
#S
#S
#S
#S
#S
#S
#S
#S
#S#S
#S#S
#S
#S
#S
#S
#S
#S
#S
#S
#S
#S
#S
#S#S
#S#S
#S
#S
#S#S#S
#S
#S
#S
#S#S
#S
#S#S#S
#S
#S
#S#S#S
#S
#S
#S #S#S
#S#S
#S#S
#S#S
#S
#S
#S
#S#S#S
#S
#S
#S
#S
#S
#S#S#S#S
#S#S#S#S#S#S#S
#S
#S
#S#S
#S#S
#S
#S#S
#S
#S
#S
#S
#S #S#S
#S
#S#S
#S#S#S
#S
#S
#S#S
#S
#S
#S
#S
#S#S
#S#S#S
#S
#S
#S
#S
#S#S
#S
#S
#S
#S#S
#S
#S
#S
#S
#S
#S#S
#S
#S
#S
#S
#S
#S
#S
#S
#S
#S
#S
#S
#S
#S
#S
#S#S
#S
#S
#S#S#S
#S
#S#S
#S
#S
#S
#S#S#S#S#S
#S
#S
#S
#S#S
#S#S
#S
#S
#S
#S#S#S#S
#S
#S
#S
#S
#S
#S#S#S
#S
#S#S
#S
#S
#S
#S
#S
#S
#S#S#S
#S#S
#S #S
#S
#S
#S
#S
#S
#S
#S
#S
#S
#S
#S #S
#S
#S
#S
#S#S
#S
#S#S
#S
#S
#S
#S
#Y#Y
FWL 3
N
EW
S
FWL 2 m:home range (95 %)core area (50 %)
FWL 1 m:home range (95 %)core area (50 %)
200 m - radius WEAr WEA#S locations FWL 1 m#S locations FWL 2 m#Y Nest
N
0 500 1000 1500 m
Fig. 4: Locations, resulting home-range and core area (Kernel) of two males. The core areas of activity
are located at the nest sites and concentrated in the foraging habitats (salt marshes and wetlands).
The high quality of the foraging areas may have prevented the males from using the wind farm area.
37
0 10 20 30 40 50
0-5
6-10
11-20
21-30
31-100
> 100fli
ght h
eigh
t (m
)
% of flights
in WP
outside WP
0 10 20 30 40 50
0-5
6-10
11-20
21-30
31-100
> 100fli
ght h
eigh
t (m
)
% of flights
in WP
outside WP
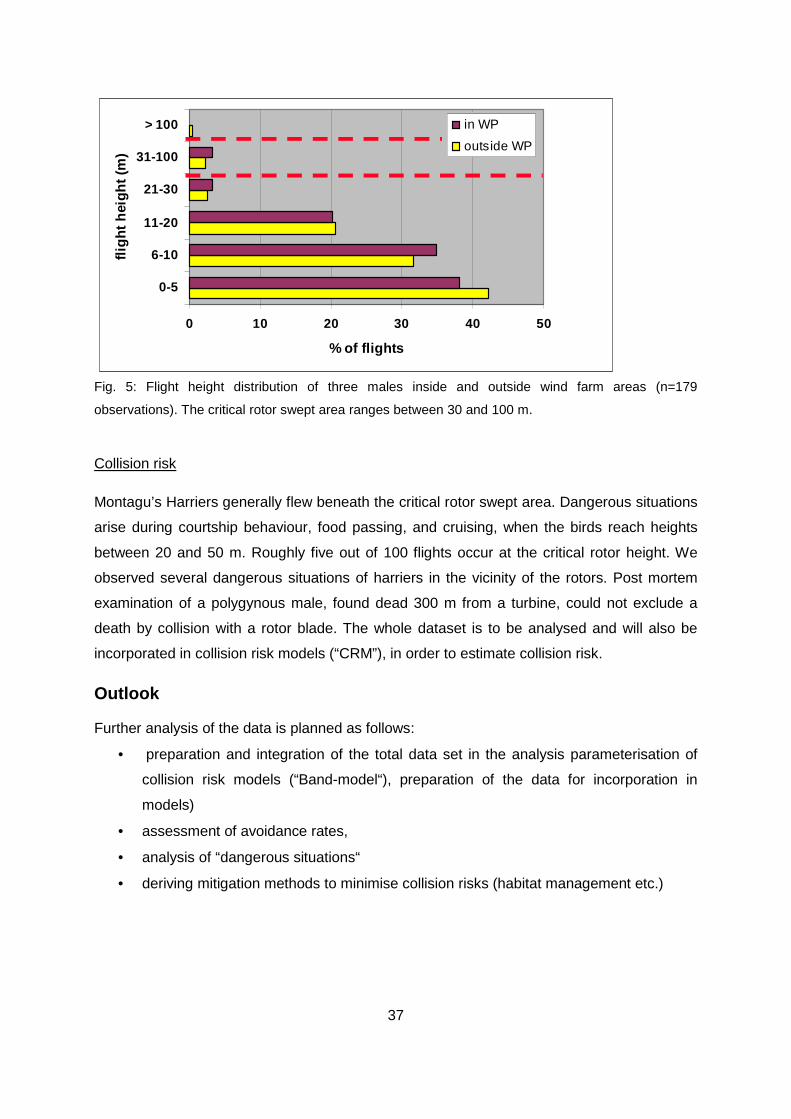
Fig. 5: Flight height distribution of three males inside and outside wind farm areas (n=179
observations). The critical rotor swept area ranges between 30 and 100 m.
Collision risk
Montagu’s Harriers generally flew beneath the critical rotor swept area. Dangerous situations
arise during courtship behaviour, food passing, and cruising, when the birds reach heights
between 20 and 50 m. Roughly five out of 100 flights occur at the critical rotor height. We
observed several dangerous situations of harriers in the vicinity of the rotors. Post mortem
examination of a polygynous male, found dead 300 m from a turbine, could not exclude a
death by collision with a rotor blade. The whole dataset is to be analysed and will also be
incorporated in collision risk models (“CRM”), in order to estimate collision risk.
Outlook
Further analysis of the data is planned as follows:
• preparation and integration of the total data set in the analysis parameterisation of
collision risk models (“Band-model“), preparation of the data for incorporation in
models)
• assessment of avoidance rates,
• analysis of “dangerous situations“
• deriving mitigation methods to minimise collision risks (habitat management etc.)
38
Summary of the discussion after the talk R. MAY asked about the number of researchers involved.
Answer: One person followed the focal bird by bicycle. The second person surveyed the wind
farm and recorded closely passing Montagu’s harriers and their behaviour and flying height.
H. SCHLÜTER asked why Montagu’s Harriers fly so far away from nest and do not forage
close to wind turbines?
Answer: Obviously the feeding grounds at greater distances were more attractive.
G. NEHLS noticed that the preliminary results of the study indicated a low collision risk.
Nevertheless, a collision risk exists. The question whether Montagu’s Harriers avoid wind
turbines at close range has not yet been answered.
D. SKAMBRACKS asked how can collision risk be calculated.
Answer: Different mathematical models are available. The fact that no collision victims have
been found so far does not means that no fatalities took place. Montagu’s Harriers occur only
in late spring and summer in the region when collision victims can easily be overlooked
because vegetation is high.
R. JOEST asked whether there is a difference between operating and non-operating wind
turbines.
Answer: There is not enough data to answer this question.
39
Are breeding Montagu’s Harriers displaced by wind farms?
Ralf Joest1, Leonid Rasran2 & Kai-Michael Thomsen2
1 Arbeitsgemeinschaft Biologischer Umweltschutz, Teichstraße 19, 59505 Bad Sassendorf Lohne,
Germany 2 Michael-Otto-Institut im NABU, Goosstroot 1, 24861 Bergenhusen, Germany
Introduction
The marshes in Nordfriesland and the Hellwegbörde are two of the most important breeding
areas for Montagu’s Harriers in Germany. Both regions have been affected by increasing
development of wind energy since 1990. This study analyses changes in breeding
populations of Montagu‘s Harriers in relation to wind turbine development in both areas. We
also investigate whether wind turbines affect nest site selection of Montagu’s Harriers in the
Hellwegbörde.
Study areas and material
The marshes in Nordfriesland (960 km² of dyked polders along the North Sea coast of
Schleswig-Holstein are flat lowlands with few settlements and forests and maximum
elevation of less than 10 m above sea level. The Hellwegbörde Special Protection Area
(SPA) in Nordrhein-Westfalen (1013 km²) consists of lowlands and hilly uplands (70-410 m
above sea level) with comparatively more settlements and forests. In both areas cereal
farming is the predominant land-use. Montagu’s Harriers breed mainly in winter-sown
cereals.
In order to investigate relations the effects of wind turbines on nest site selection in
Nordfriesland we compared numbers and installed capacity of wind turbines within 1 km radii
around randomly set control points and around nest sites. We used linear mixed models to
describe the temporal development of wind farms in the surrounding of nest and random
points and compared them with ANOVAs.
In order to investigate a long-term effect of wind turbines and nest site selection of Montagu’s
Harrier in Hellwegbörde, we collated the locations of nest sites of Montagu’s Harriers and of
wind turbines up to 2007. Study area was covered with 2x2 km raster grids. In each raster
cell for each year, we recorded the number and installed capacity of wind turbines, as well as
40
the number of breeding pairs of Montagu’s Harrier. Raster cells with at least one nest or one
wind turbine in any year were selected for further analyses. A linear mixed effects model was
developed to describe the distribution of nest sites in the study areas. In order to investigate
the effect of wind farms on the distribution of nests, we used an ANOVA to test a time-
dependent model against a model including the nominal installed capacity of wind turbines.
The factor “capacity” was chosen because it is highly correlated to the number, tower height
and rotor diameter of wind turbines and thus gives a good impression of the intensity of use
of wind energy.
In order to study the relative effects of wind turbines and other structures and landscape
elements on nest site selection in the Hellwegbörde, we generated random points within
potentially suitable areas for Montagu’s Harrier. We recorded the following variables for nest
sites and for random points: elevation above sea level; slope; plane vertical object
(settlements, forests); nearest pylon; nearest wind turbine (single or within a wind farm),
distance to the nearest vertical point structure object (pylons and wind turbines combined). .
We tested for differences between the surroundings of nest sites and of random points for
each parameter using a non-parametric rank test (Wilcoxon’s rank test). As these effects of
landscape features on nest site selection may not be independent, a multivariate binary
logistic regression was used to identify the parameters most likely to influence nest site
selection.
Results
Nordfriesland
In Nordfriesland study area, the number of wind turbines increased rapidly from 44 in 1990 to
386 in 1995. Since then, numbers have continued to increase, but more slowly. Installed
capacity has increased since 2002 due to re-powering (replacement of old small turbines
with larger modern ones). Average nominal power of wind turbines increased from 300 kW in
1995 to more than 1000 kW in 2007.The breeding population of Montagu’s Harrier increased
slightly from 15 pairs in 1995 with a maximum of 39 pairs in 2003. Linear mixed models and
the ANOVA revealed no significant differences in installed wind power capacity between the
nest sites of Montagu’s Harrier and randomly chosen points at the marshes of Nordfriesland
(Tab.1).
41
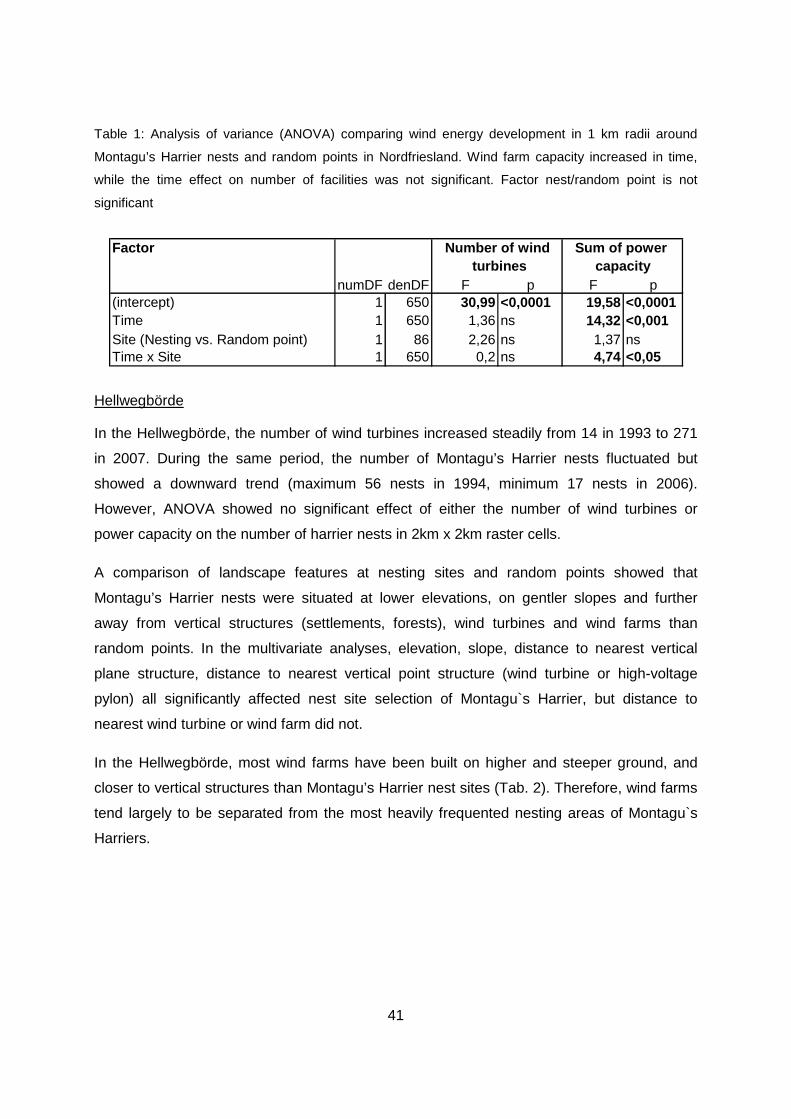
Table 1: Analysis of variance (ANOVA) comparing wind energy development in 1 km radii around
Montagu’s Harrier nests and random points in Nordfriesland. Wind farm capacity increased in time,
while the time effect on number of facilities was not significant. Factor nest/random point is not
significant
Factor
numDF denDF F p F p(intercept) 1 650 30,99 <0,0001 19,58 <0,0001Time 1 650 1,36 ns 14,32 <0,001Site (Nesting vs. Random point) 1 86 2,26 ns 1,37 nsTime x Site 1 650 0,2 ns 4,74 <0,05
turbines capacityNumber of wind Sum of power
Hellwegbörde
In the Hellwegbörde, the number of wind turbines increased steadily from 14 in 1993 to 271
in 2007. During the same period, the number of Montagu’s Harrier nests fluctuated but
showed a downward trend (maximum 56 nests in 1994, minimum 17 nests in 2006).
However, ANOVA showed no significant effect of either the number of wind turbines or
power capacity on the number of harrier nests in 2km x 2km raster cells.
A comparison of landscape features at nesting sites and random points showed that
Montagu’s Harrier nests were situated at lower elevations, on gentler slopes and further
away from vertical structures (settlements, forests), wind turbines and wind farms than
random points. In the multivariate analyses, elevation, slope, distance to nearest vertical
plane structure, distance to nearest vertical point structure (wind turbine or high-voltage
pylon) all significantly affected nest site selection of Montagu`s Harrier, but distance to
nearest wind turbine or wind farm did not.
In the Hellwegbörde, most wind farms have been built on higher and steeper ground, and
closer to vertical structures than Montagu’s Harrier nest sites (Tab. 2). Therefore, wind farms
tend largely to be separated from the most heavily frequented nesting areas of Montagu`s
Harriers.
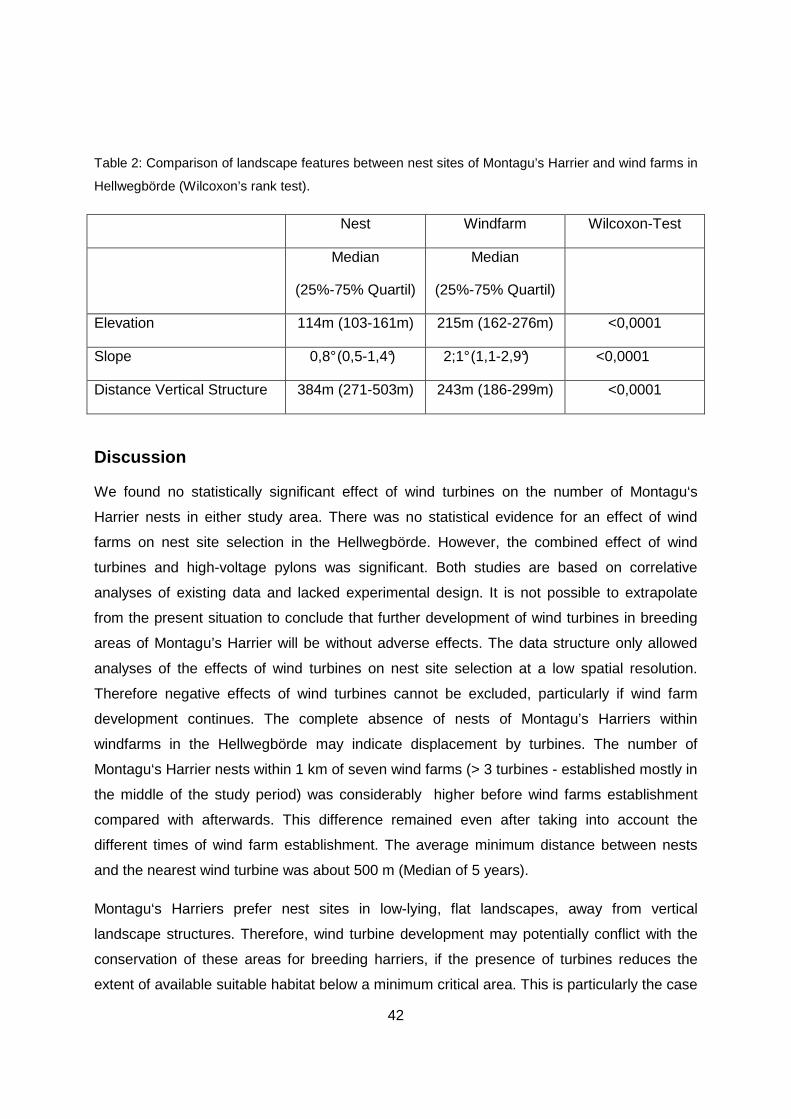
42
Table 2: Comparison of landscape features between nest sites of Montagu’s Harrier and wind farms in
Hellwegbörde (Wilcoxon’s rank test).
Nest Windfarm Wilcoxon-Test
Median
(25%-75% Quartil)
Median
(25%-75% Quartil)
Elevation 114m (103-161m) 215m (162-276m) <0,0001
Slope 0,8° (0,5-1,4°) 2;1° (1,1-2,9°) <0,0001
Distance Vertical Structure 384m (271-503m) 243m (186-299m) <0,0001
Discussion
We found no statistically significant effect of wind turbines on the number of Montagu‘s
Harrier nests in either study area. There was no statistical evidence for an effect of wind
farms on nest site selection in the Hellwegbörde. However, the combined effect of wind
turbines and high-voltage pylons was significant. Both studies are based on correlative
analyses of existing data and lacked experimental design. It is not possible to extrapolate
from the present situation to conclude that further development of wind turbines in breeding
areas of Montagu’s Harrier will be without adverse effects. The data structure only allowed
analyses of the effects of wind turbines on nest site selection at a low spatial resolution.
Therefore negative effects of wind turbines cannot be excluded, particularly if wind farm
development continues. The complete absence of nests of Montagu’s Harriers within
windfarms in the Hellwegbörde may indicate displacement by turbines. The number of
Montagu‘s Harrier nests within 1 km of seven wind farms (> 3 turbines - established mostly in
the middle of the study period) was considerably higher before wind farms establishment
compared with afterwards. This difference remained even after taking into account the
different times of wind farm establishment. The average minimum distance between nests
and the nearest wind turbine was about 500 m (Median of 5 years).
Montagu‘s Harriers prefer nest sites in low-lying, flat landscapes, away from vertical
landscape structures. Therefore, wind turbine development may potentially conflict with the
conservation of these areas for breeding harriers, if the presence of turbines reduces the
extent of available suitable habitat below a minimum critical area. This is particularly the case

43
for fragmented landscapes such as the Hellwegbörde, where fragmentation of Montagu’s
harrier habitat is exacerbated by new buildings for housing, industry and farming, as well as
by the expansion of transport infrastructure. So far, most wind turbines are concentrated in
the upper part of the area while most nests are situated in the lower part. Minor influence of
wind farms on Montagu’s Harrier can also be explained by this spatial separation. This was
in part due to having taken Montagu`s Harrier conservation into consideration, in accordance
with the precautionary principle, when planning wind farm locations.
If Montagu`s Harriers are not displaced by wind turbines, they might suffer from an increased
risk of collision with rotating turbine blades.
44
White-tailed Sea Eagles and wind power plants in Germany – preliminary results Oliver Krone1, Thomas Grünkorn2, Mirjam Gippert1, Tobias Dürr3
1 Leibniz Institute for Zoo and Wildlife Research, Alfred-Kowalke-Straße 17, 10315 Berlin, Germany, 2 Bioconsult SH, Brinckmannstr. 31, 25813 Husum, Germany, 3 Staatliche Vogelschutzwarte Brandenburg, Buckower Dorfstraße 34, 14715 Nennhausen OT Buckow, Germany
Collisions of White-tailed Sea Eagles with wind tur bines
Wind power provides up to 7.2% of power consumption in Germany (MOLLY 2008). The
development of wind power plants has resulted in an increase in the number of birds that
collided with wind turbines. The first two White-tailed Sea Eagles (Haliaeetus albicilla)
became victims of wind power plants in 2002 (KRONE & SCHARNWEBER 2003). Since then, at
least 36 White-tailed Sea Eagles (WTSEs) have been killed by collisions with the blades of
wind turbines. More than 50% of the eagles were adult (n = 19) and the remaining birds
juvenile to subadult (n = 17). The north-eastern federal states (Schleswig-Holstein and
Mecklenburg-Vorpommern) with high numbers of White-tailed Sea Eagle breeding pairs and
high numbers of wind parks especially affected. Adult WTSEs were mainly found during the
winter months and in the spring, when courtship and territory demarcation were performed
and flight activity was high. Young WTSEs have been found dead mainly in autumn and
towards the end of winter, very likely during dispersal. To investigate whether juvenile
WTSEs are affected by wind power plants (WPPs) during dispersal and whether WPPs have
an influence on habitat selection and use of space by territorial eagles, we equipped WTSEs
with satellite transmitters and performed visual observations.
Data generated by transmitters
One adult WTSE was caught with a bow net in January 2008. It was equipped with a data
logger. Despite extensive search for VHF signals, the bird could not be located. Three
nestling WTSEs from two nests were equipped with GPS-GSM transmitters at an age of six
to eight weeks at the same time as being ringed in June 2008. One nest with two nestlings
(eagle #5841, eagle #5901) was located 5 km inland from the Baltic Sea, between the cities
of Wismar and Rostock. The other nest (with a single eagle chick -eagle #5902) was located
within the Mecklenburg Lake District east of Schwerin, capital of the federal state
45
Mecklenburg-Vorpommern. The satellite transmitter of eagle #5841 was programmed to
receive three positions per day. The device generated 527 positions in 178 days. Using all
positions the calculated dispersal area was 13.885 km² (100% minimum convex polygon -
MCP). Within this area 53 wind farms and thirteen single wind turbines were found. The
transmitter of eagle #5901, which received four positions per day, generated 696 positions in
174 days resulting in an area of 9.144 km² (100% MCP) including an extensive excursion to
the coast of the North Sea west of Bremerhaven. Without this excursion, the reduced MCP
covers 2.894 km² including 11 wind parks and seven single turbines. Neither eagle was
recorded near wind turbines or flying through wind farms. Even wind power plants close to
the natal nests were not crossed or approached. The satellite transmitter of eagle #5902
receiving four positions per day sent 647 locations over 173 days giving a dispersal area of
43.082 km² (100% MCP), also including one large single excursion to the Netherlands, west
of Arnhem. Removing this long excursion from the MCP resulted in a dispersal area of 2.020
km² including 11 wind farms. The closest distance of a single satellite fix to a wind turbine
was 150 m. Assuming that direct connections between two single positions representing
more or less direct flight routes, 15 flights went directly through or very close to the wind park
closest to the natal nest. One subadult WTSE (#2356) was captured in the Mecklenburg
Lake District by using the noosed fish method and fitted with a GPS-GSM device in August
2008. This still active satellite transmitter was programmed for only one position per day to
save battery power. It has sent 99 positions since capture. The position data from 99 days
were used to calculate a dispersal area of 2.298 km² (100% MCP). Nine wind parks and
three single wind turbines were located within the dispersal area. The closest distance of a
single position of this eagle to a wind turbine was 150 m. The core area of activity (5%
Kernel) lies only 10 km southwest from the place where the eagle was captured.
Visual observations
Visual observations of the juvenile eagle #5902 confirmed that the eagle flew through the
wind park as suggested by the automatically received GPS positions. However, 97% of the
time of observation (~ 110 hours), the eagle did not move or was out of sight (Fig. 1). During
the 185 min. when the eagle was flying or circling in the area of the wind park, (only 3% of
total observation time, Fig. 1), the bird often flew above the blades of the generators (39% of
observed flight time, Fig 2). In two out of three cases when the eagle flew within the area
swept by rotor blades there was no wind and no movement of the propellers. During time
spent observing the young eagle, the parent birds were also observed passing through the
wind park. An adult White-tailed Sea Eagle visited the wind park on two consecutive days in
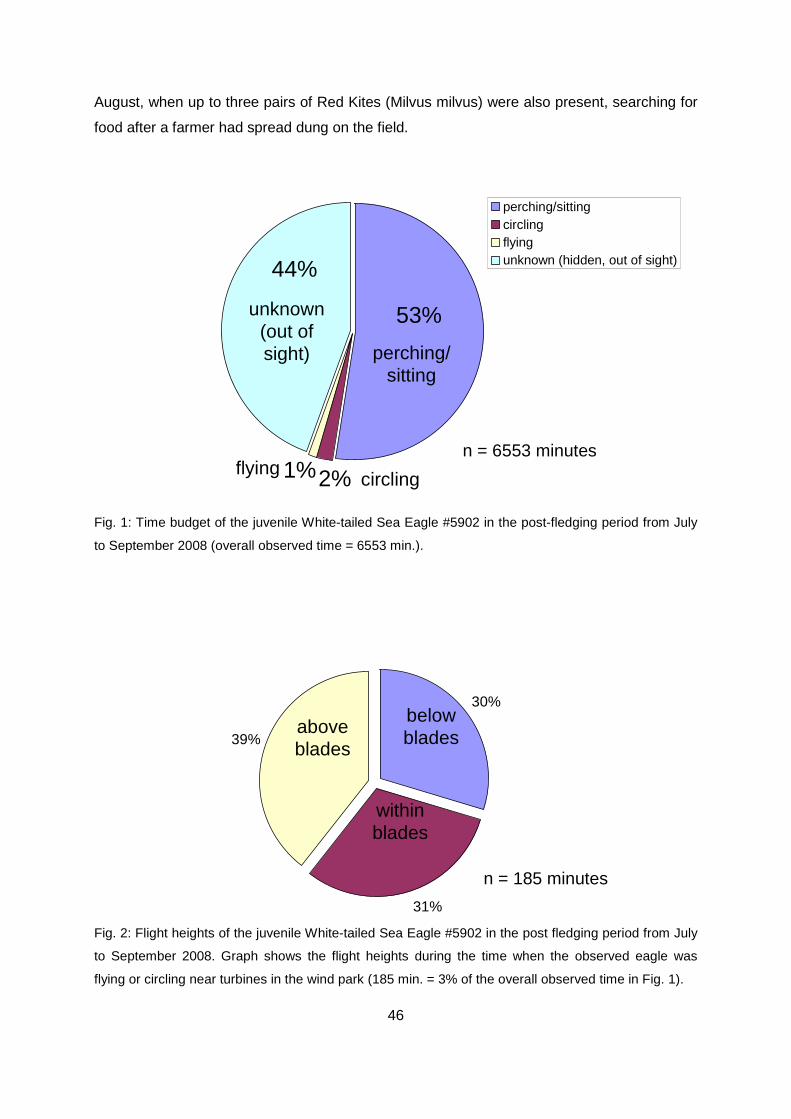
46
August, when up to three pairs of Red Kites (Milvus milvus) were also present, searching for
food after a farmer had spread dung on the field.
44%
53%
1%2%
perching/sittingcirclingflyingunknown (hidden, out of sight)
n = 6553 minutes
perching/sitting
circlingflying
unknown (out of sight)
Fig. 1: Time budget of the juvenile White-tailed Sea Eagle #5902 in the post-fledging period from July
to September 2008 (overall observed time = 6553 min.).
30%
31%
39%
below blades
above blades
within blades
n = 185 minutes
Fig. 2: Flight heights of the juvenile White-tailed Sea Eagle #5902 in the post fledging period from July
to September 2008. Graph shows the flight heights during the time when the observed eagle was
flying or circling near turbines in the wind park (185 min. = 3% of the overall observed time in Fig. 1).
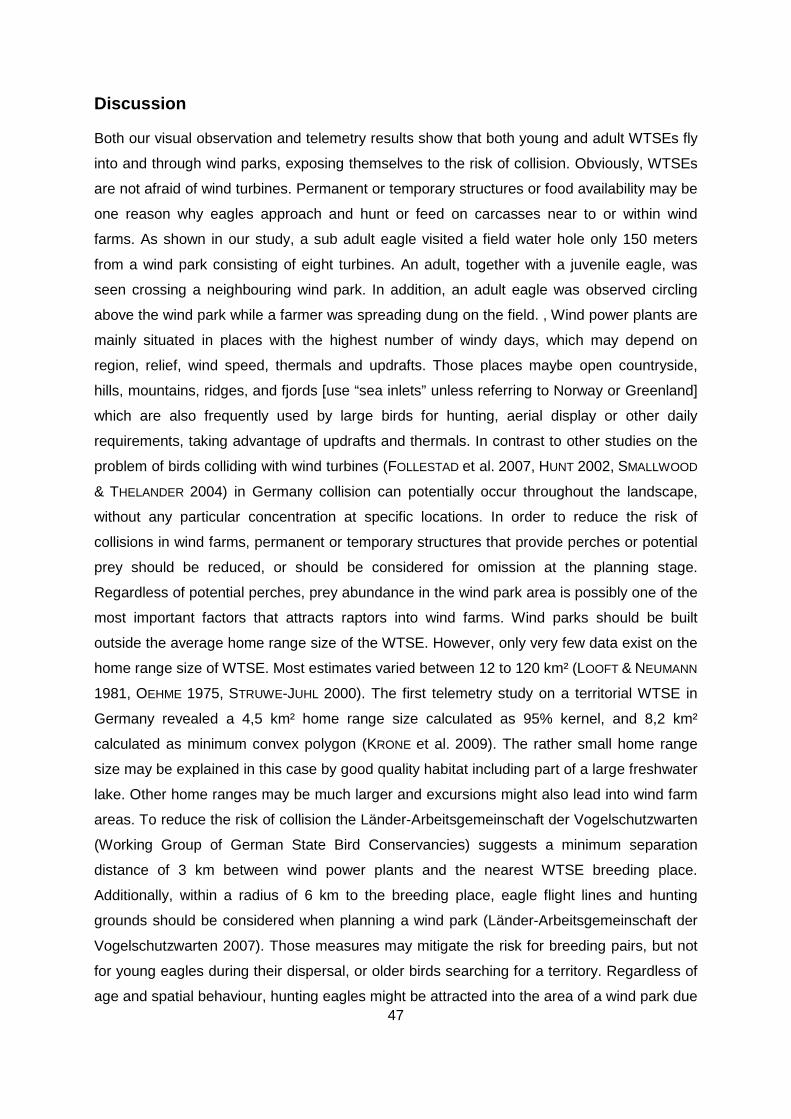
47
Discussion
Both our visual observation and telemetry results show that both young and adult WTSEs fly
into and through wind parks, exposing themselves to the risk of collision. Obviously, WTSEs
are not afraid of wind turbines. Permanent or temporary structures or food availability may be
one reason why eagles approach and hunt or feed on carcasses near to or within wind
farms. As shown in our study, a sub adult eagle visited a field water hole only 150 meters
from a wind park consisting of eight turbines. An adult, together with a juvenile eagle, was
seen crossing a neighbouring wind park. In addition, an adult eagle was observed circling
above the wind park while a farmer was spreading dung on the field. , Wind power plants are
mainly situated in places with the highest number of windy days, which may depend on
region, relief, wind speed, thermals and updrafts. Those places maybe open countryside,
hills, mountains, ridges, and fjords [use “sea inlets” unless referring to Norway or Greenland]
which are also frequently used by large birds for hunting, aerial display or other daily
requirements, taking advantage of updrafts and thermals. In contrast to other studies on the
problem of birds colliding with wind turbines (FOLLESTAD et al. 2007, HUNT 2002, SMALLWOOD
& THELANDER 2004) in Germany collision can potentially occur throughout the landscape,
without any particular concentration at specific locations. In order to reduce the risk of
collisions in wind farms, permanent or temporary structures that provide perches or potential
prey should be reduced, or should be considered for omission at the planning stage.
Regardless of potential perches, prey abundance in the wind park area is possibly one of the
most important factors that attracts raptors into wind farms. Wind parks should be built
outside the average home range size of the WTSE. However, only very few data exist on the
home range size of WTSE. Most estimates varied between 12 to 120 km² (LOOFT & NEUMANN
1981, OEHME 1975, STRUWE-JUHL 2000). The first telemetry study on a territorial WTSE in
Germany revealed a 4,5 km² home range size calculated as 95% kernel, and 8,2 km²
calculated as minimum convex polygon (KRONE et al. 2009). The rather small home range
size may be explained in this case by good quality habitat including part of a large freshwater
lake. Other home ranges may be much larger and excursions might also lead into wind farm
areas. To reduce the risk of collision the Länder-Arbeitsgemeinschaft der Vogelschutzwarten
(Working Group of German State Bird Conservancies) suggests a minimum separation
distance of 3 km between wind power plants and the nearest WTSE breeding place.
Additionally, within a radius of 6 km to the breeding place, eagle flight lines and hunting
grounds should be considered when planning a wind park (Länder-Arbeitsgemeinschaft der
Vogelschutzwarten 2007). Those measures may mitigate the risk for breeding pairs, but not
for young eagles during their dispersal, or older birds searching for a territory. Regardless of
age and spatial behaviour, hunting eagles might be attracted into the area of a wind park due
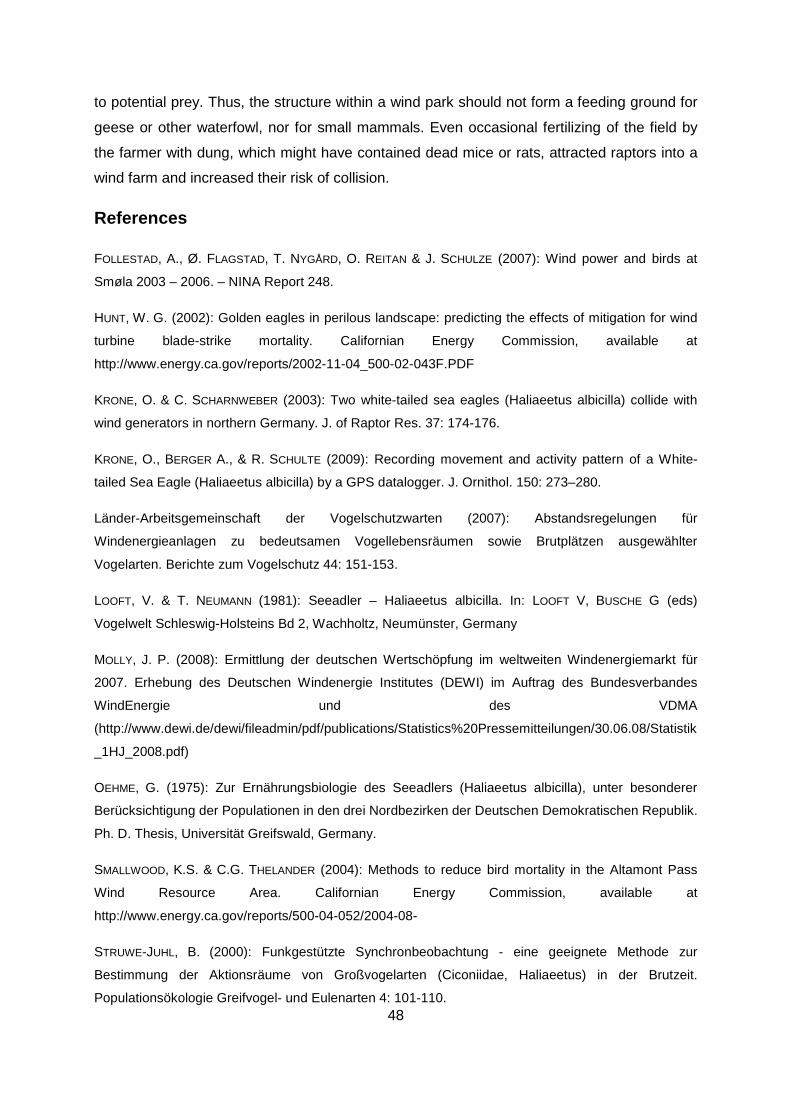
48
to potential prey. Thus, the structure within a wind park should not form a feeding ground for
geese or other waterfowl, nor for small mammals. Even occasional fertilizing of the field by
the farmer with dung, which might have contained dead mice or rats, attracted raptors into a
wind farm and increased their risk of collision.
References
FOLLESTAD, A., Ø. FLAGSTAD, T. NYGÅRD, O. REITAN & J. SCHULZE (2007): Wind power and birds at
Smøla 2003 – 2006. – NINA Report 248.
HUNT, W. G. (2002): Golden eagles in perilous landscape: predicting the effects of mitigation for wind
turbine blade-strike mortality. Californian Energy Commission, available at
http://www.energy.ca.gov/reports/2002-11-04_500-02-043F.PDF
KRONE, O. & C. SCHARNWEBER (2003): Two white-tailed sea eagles (Haliaeetus albicilla) collide with
wind generators in northern Germany. J. of Raptor Res. 37: 174-176.
KRONE, O., BERGER A., & R. SCHULTE (2009): Recording movement and activity pattern of a White-
tailed Sea Eagle (Haliaeetus albicilla) by a GPS datalogger. J. Ornithol. 150: 273–280.
Länder-Arbeitsgemeinschaft der Vogelschutzwarten (2007): Abstandsregelungen für
Windenergieanlagen zu bedeutsamen Vogellebensräumen sowie Brutplätzen ausgewählter
Vogelarten. Berichte zum Vogelschutz 44: 151-153.
LOOFT, V. & T. NEUMANN (1981): Seeadler – Haliaeetus albicilla. In: LOOFT V, BUSCHE G (eds)
Vogelwelt Schleswig-Holsteins Bd 2, Wachholtz, Neumünster, Germany
MOLLY, J. P. (2008): Ermittlung der deutschen Wertschöpfung im weltweiten Windenergiemarkt für
2007. Erhebung des Deutschen Windenergie Institutes (DEWI) im Auftrag des Bundesverbandes
WindEnergie und des VDMA
(http://www.dewi.de/dewi/fileadmin/pdf/publications/Statistics%20Pressemitteilungen/30.06.08/Statistik
_1HJ_2008.pdf)
OEHME, G. (1975): Zur Ernährungsbiologie des Seeadlers (Haliaeetus albicilla), unter besonderer
Berücksichtigung der Populationen in den drei Nordbezirken der Deutschen Demokratischen Republik.
Ph. D. Thesis, Universität Greifswald, Germany.
SMALLWOOD, K.S. & C.G. THELANDER (2004): Methods to reduce bird mortality in the Altamont Pass
Wind Resource Area. Californian Energy Commission, available at
http://www.energy.ca.gov/reports/500-04-052/2004-08-
STRUWE-JUHL, B. (2000): Funkgestützte Synchronbeobachtung - eine geeignete Methode zur
Bestimmung der Aktionsräume von Großvogelarten (Ciconiidae, Haliaeetus) in der Brutzeit.
Populationsökologie Greifvogel- und Eulenarten 4: 101-110.
49
Summary of the general discussion on Tuesday, 21st October
R. MAY asked about the general purpose of the project.
Answer: The project aims to achieve better understanding of the reasons for collisions of
raptors at wind farms. With better knowledge about the reasons for collisions, management
measures to avoid or reduce collision risk for Red Kites and other raptors at wind farms can
be developed. Some proposals for this purpose already exist, e.g. the management of
habitat at tower bases.
R. MAY explained that there are plans in Norway to shut down wind turbines in the spring, in
order to protect White-tailed Eagles. This measure would be very expensive.
T. NYGARD asked whether removal of corpses by predators and scavengers had been
accounted for adequately when analysing the results of searches for collision victims.
G. NEHLS replied that more detailed studies at monitoring sites are necessary on this topic.
Several representatives of wind energy planning agencies stressed that concrete proposals
for the reduction of raptor collisions at wind farms are necessary. They asked whether the
project can fulfil this demand.
It is expected that such proposals can be developed based on the results of the project. A
very careful analysis of data is necessary, as public authorities and politicians will use the
results for their decisions. Further studies are necessary and will be carried out when the
project is extended until 2010.
50
Radar studies on White-tailed Sea Eagle at an onshore wind farm on the island of Smøla
Roel May, Yngve Steinheim, Frank Hansen, Roald Vang, Kjetil Bevanger, Espen Lie Dahl,
Stig Clausen, Torgeir Nygård & Andreas Smith
Norwegian Institute for Nature Research (NINA), 7485 Trondheim, Norway and SINTEF & DeTect, Inc.
Wind energy provides renewable non-polluting energy. Norway has a large potential to utilize
the wind along its long coast line by establishing offshore, near-shore or onshore wind farms.
However, wind farms may also have unfavourable effects on the environment, in particular
on birds. Since autumn 2005, twenty White-tailed Sea Eagles (Haliaeetus albicilla) have
been found killed by collisions at a single wind farm on the island of Smøla, Central Norway.
The Smøla wind farm is with its 68 turbines Norway’s largest, and was built in two stages
between 2001 and 2005. Smøla has one of the world’s densest populations of White-tailed
Sea Eagle.
In 2003 the Norwegian Institute for Nature Research (NINA) started an extensive research
project at the wind farm on Smøla to study the impact of wind turbines on avian wildlife; with
a special focus on the White-tailed Sea Eagle. The objective of the project is to obtain an
improved information base and tools for the energy industry and environmental and energy
authorities to use in determining siting and conflict-reduction of new wind turbine projects.
The project further aims to identify the biological, species-specific, ecological and external
factors which make birds vulnerable to wind turbines, and assess the population
consequences of wind turbine induced bird mortality.
To assess the spatial responses and consequent collision risk of White-tailed Sea Eagles to
wind turbines we employ avian radar technology, in addition to GPS satellite telemetry. The
first part aims to investigate the spatial responses of White-tailed Sea Eagles to wind
turbines at different spatial scales (i.e. loss of habitat due to displacement effects, and
movement patterns and avoidance effects). The second part aims at constructing statistical
collision models for estimating the risk of collisions between White-tailed Sea Eagle and wind
turbines, given their resource utilisation and flight behaviour.
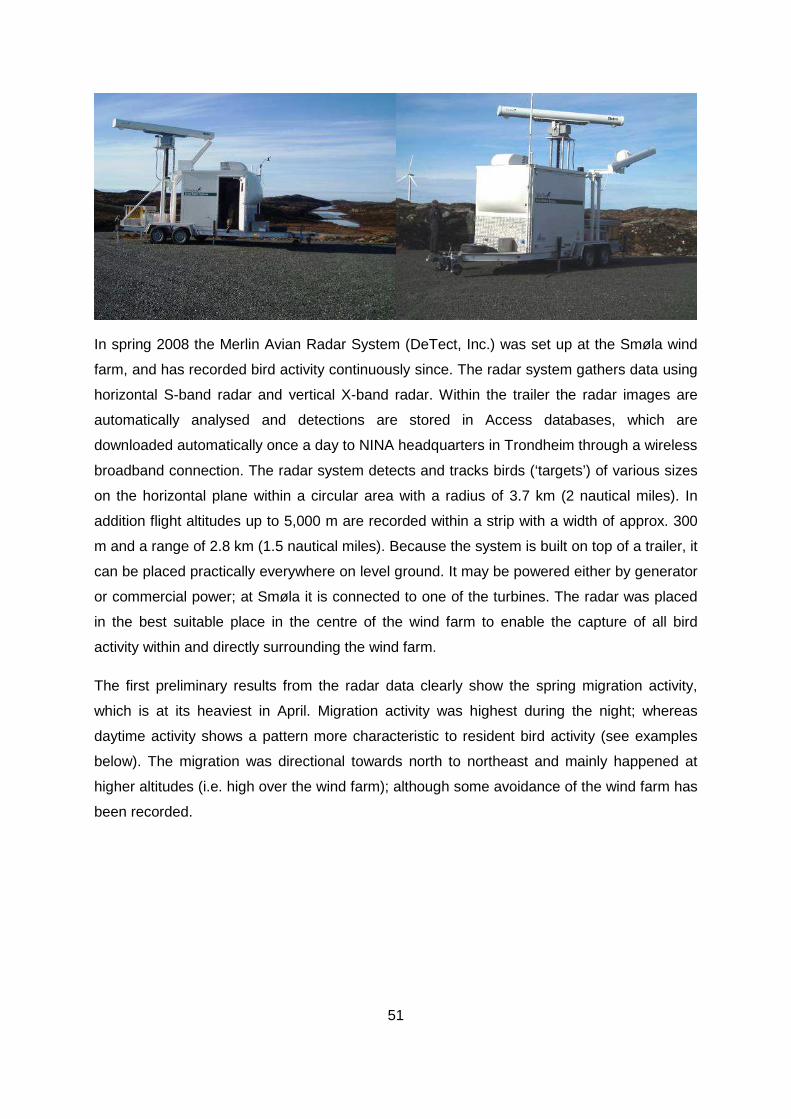
51
In spring 2008 the Merlin Avian Radar System (DeTect, Inc.) was set up at the Smøla wind
farm, and has recorded bird activity continuously since. The radar system gathers data using
horizontal S-band radar and vertical X-band radar. Within the trailer the radar images are
automatically analysed and detections are stored in Access databases, which are
downloaded automatically once a day to NINA headquarters in Trondheim through a wireless
broadband connection. The radar system detects and tracks birds (‘targets’) of various sizes
on the horizontal plane within a circular area with a radius of 3.7 km (2 nautical miles). In
addition flight altitudes up to 5,000 m are recorded within a strip with a width of approx. 300
m and a range of 2.8 km (1.5 nautical miles). Because the system is built on top of a trailer, it
can be placed practically everywhere on level ground. It may be powered either by generator
or commercial power; at Smøla it is connected to one of the turbines. The radar was placed
in the best suitable place in the centre of the wind farm to enable the capture of all bird
activity within and directly surrounding the wind farm.
The first preliminary results from the radar data clearly show the spring migration activity,
which is at its heaviest in April. Migration activity was highest during the night; whereas
daytime activity shows a pattern more characteristic to resident bird activity (see examples
below). The migration was directional towards north to northeast and mainly happened at
higher altitudes (i.e. high over the wind farm); although some avoidance of the wind farm has
been recorded.
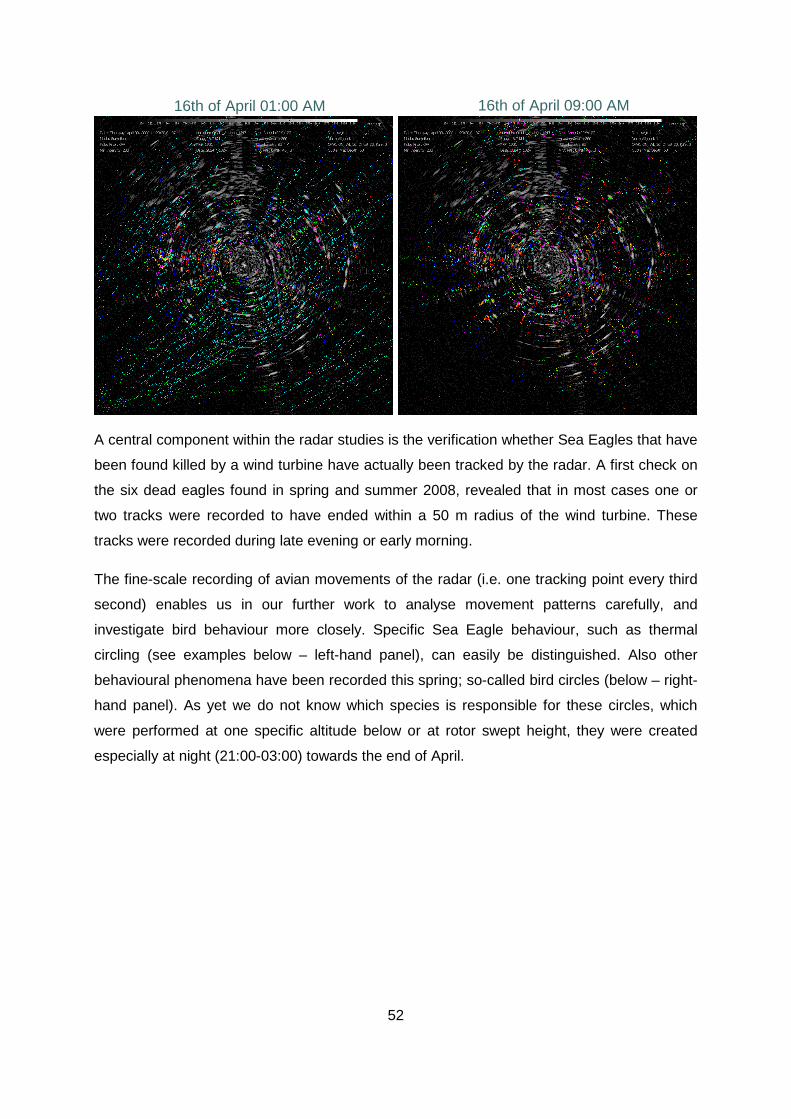
52
A central component within the radar studies is the verification whether Sea Eagles that have
been found killed by a wind turbine have actually been tracked by the radar. A first check on
the six dead eagles found in spring and summer 2008, revealed that in most cases one or
two tracks were recorded to have ended within a 50 m radius of the wind turbine. These
tracks were recorded during late evening or early morning.
The fine-scale recording of avian movements of the radar (i.e. one tracking point every third
second) enables us in our further work to analyse movement patterns carefully, and
investigate bird behaviour more closely. Specific Sea Eagle behaviour, such as thermal
circling (see examples below – left-hand panel), can easily be distinguished. Also other
behavioural phenomena have been recorded this spring; so-called bird circles (below – right-
hand panel). As yet we do not know which species is responsible for these circles, which
were performed at one specific altitude below or at rotor swept height, they were created
especially at night (21:00-03:00) towards the end of April.
16th of April 01:00 AM 16th of April 09:00 AM
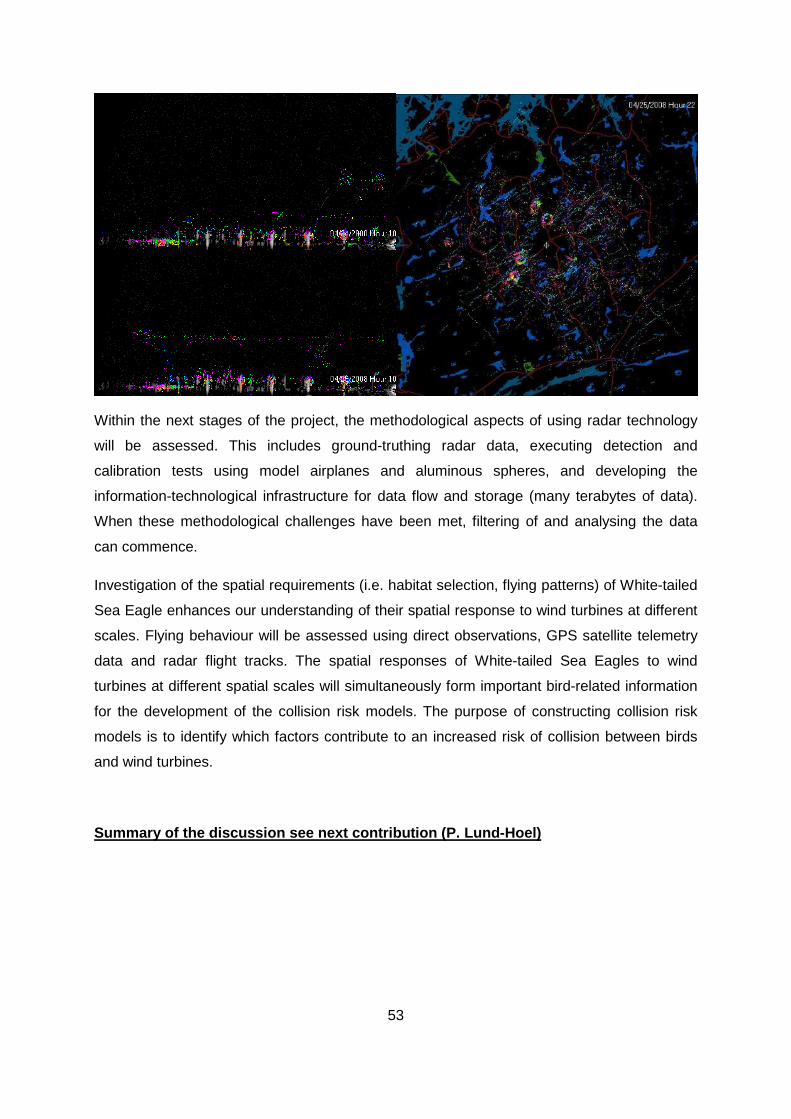
53
Within the next stages of the project, the methodological aspects of using radar technology
will be assessed. This includes ground-truthing radar data, executing detection and
calibration tests using model airplanes and aluminous spheres, and developing the
information-technological infrastructure for data flow and storage (many terabytes of data).
When these methodological challenges have been met, filtering of and analysing the data
can commence.
Investigation of the spatial requirements (i.e. habitat selection, flying patterns) of White-tailed
Sea Eagle enhances our understanding of their spatial response to wind turbines at different
scales. Flying behaviour will be assessed using direct observations, GPS satellite telemetry
data and radar flight tracks. The spatial responses of White-tailed Sea Eagles to wind
turbines at different spatial scales will simultaneously form important bird-related information
for the development of the collision risk models. The purpose of constructing collision risk
models is to identify which factors contribute to an increased risk of collision between birds
and wind turbines.
Summary of the discussion see next contribution (P. Lund-Hoel)
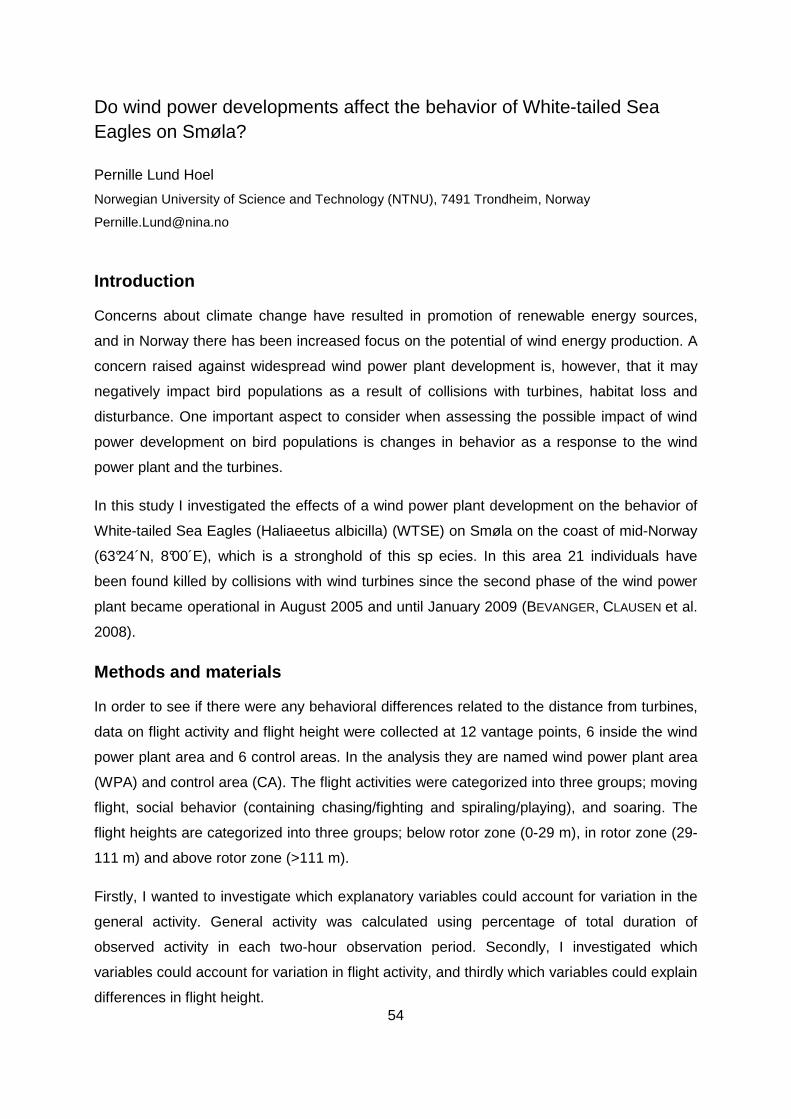
54
Do wind power developments affect the behavior of White-tailed Sea Eagles on Smøla? Pernille Lund Hoel
Norwegian University of Science and Technology (NTNU), 7491 Trondheim, Norway
Introduction
Concerns about climate change have resulted in promotion of renewable energy sources,
and in Norway there has been increased focus on the potential of wind energy production. A
concern raised against widespread wind power plant development is, however, that it may
negatively impact bird populations as a result of collisions with turbines, habitat loss and
disturbance. One important aspect to consider when assessing the possible impact of wind
power development on bird populations is changes in behavior as a response to the wind
power plant and the turbines.
In this study I investigated the effects of a wind power plant development on the behavior of
White-tailed Sea Eagles (Haliaeetus albicilla) (WTSE) on Smøla on the coast of mid-Norway
(63°24´N, 8°00´E), which is a stronghold of this sp ecies. In this area 21 individuals have
been found killed by collisions with wind turbines since the second phase of the wind power
plant became operational in August 2005 and until January 2009 (BEVANGER, CLAUSEN et al.
2008).
Methods and materials
In order to see if there were any behavioral differences related to the distance from turbines,
data on flight activity and flight height were collected at 12 vantage points, 6 inside the wind
power plant area and 6 control areas. In the analysis they are named wind power plant area
(WPA) and control area (CA). The flight activities were categorized into three groups; moving
flight, social behavior (containing chasing/fighting and spiraling/playing), and soaring. The
flight heights are categorized into three groups; below rotor zone (0-29 m), in rotor zone (29-
111 m) and above rotor zone (>111 m).
Firstly, I wanted to investigate which explanatory variables could account for variation in the
general activity. General activity was calculated using percentage of total duration of
observed activity in each two-hour observation period. Secondly, I investigated which
variables could account for variation in flight activity, and thirdly which variables could explain
differences in flight height.
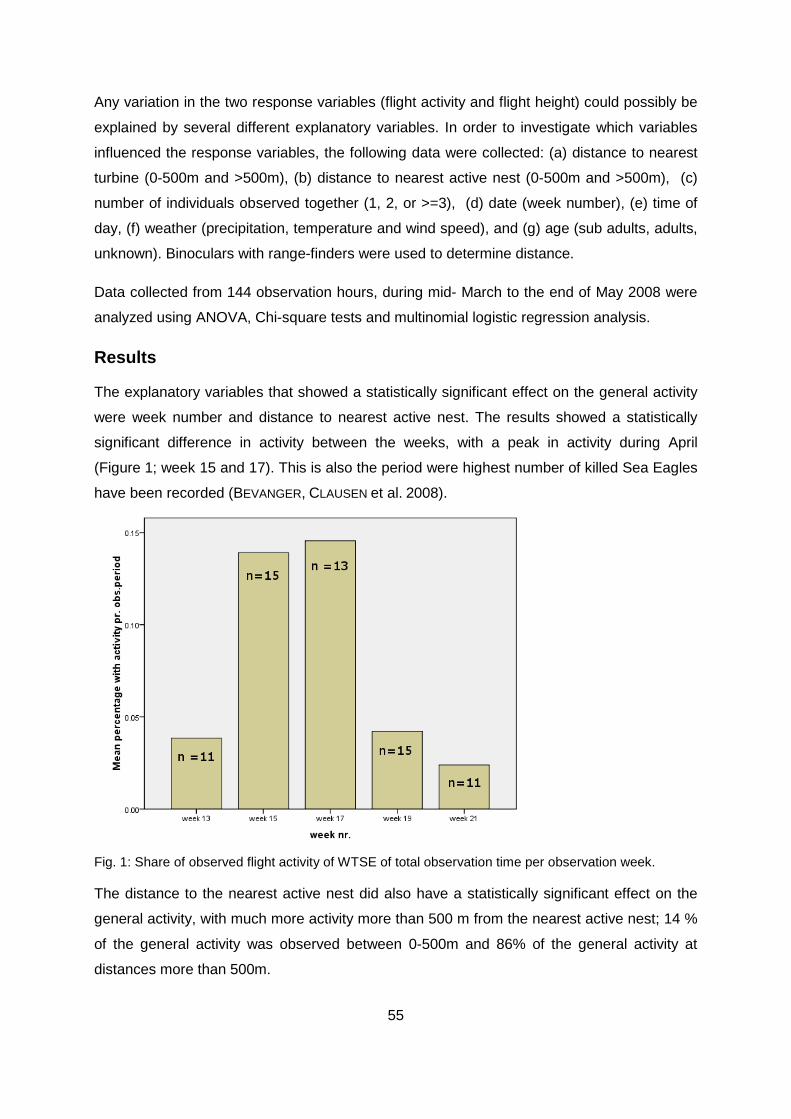
55
Any variation in the two response variables (flight activity and flight height) could possibly be
explained by several different explanatory variables. In order to investigate which variables
influenced the response variables, the following data were collected: (a) distance to nearest
turbine (0-500m and >500m), (b) distance to nearest active nest (0-500m and >500m), (c)
number of individuals observed together (1, 2, or >=3), (d) date (week number), (e) time of
day, (f) weather (precipitation, temperature and wind speed), and (g) age (sub adults, adults,
unknown). Binoculars with range-finders were used to determine distance.
Data collected from 144 observation hours, during mid- March to the end of May 2008 were
analyzed using ANOVA, Chi-square tests and multinomial logistic regression analysis.
Results
The explanatory variables that showed a statistically significant effect on the general activity
were week number and distance to nearest active nest. The results showed a statistically
significant difference in activity between the weeks, with a peak in activity during April
(Figure.1; week 15 and 17). This is also the period were highest number of killed Sea Eagles
have been recorded (BEVANGER, CLAUSEN et al. 2008).
Fig. 1: Share of observed flight activity of WTSE of total observation time per observation week.
The distance to the nearest active nest did also have a statistically significant effect on the
general activity, with much more activity more than 500 m from the nearest active nest; 14 %
of the general activity was observed between 0-500m and 86% of the general activity at
distances more than 500m.
56
Neither distance to nearest turbine, nor the locations seem to have any effect on the general
activity. Although neither of the three weather variables did have any statistically significant
effect on the general activity, there seems to be a decrease in activity with increasing wind
strength and increase in activity with higher temperatures. This could be due rising air
currents and thermals that can provide lift that enables a bird to maintain height or gain a
greater altitude at less cost.
Furthermore, there was a statistically significant difference in age distribution between the
two locations, with a higher percentage of adults in CA and a higher percentage of sub adults
in WPPA. Of the 21 killed sea eagles found on Smøla, there are 14 adults and 7 sub-adults.
Fig. 2: Age distribution (%) of WTSE in the control area and the wind power plant area (NCAadult=182,
NCASubadult=79, NWPPAadult=135, NWPPAsubadult=106).
Regarding flight activity, Table 1 shows which variables had significant effect on the
differences between the flight activities. There were, as expected, more individuals observed
flying together during social behavior than the other two activity categories. There was also a
significant difference between social behavior and the other two activities related to age, with
more adults than sub adults in social behavior than in moving flight and soaring. Comparing
this result with the age distribution found among the collision victims, this could indicate that
social behavior could expose the individuals to a higher risk than the other activities. The
analysis did not, however, show any statistically significant differences between the flight
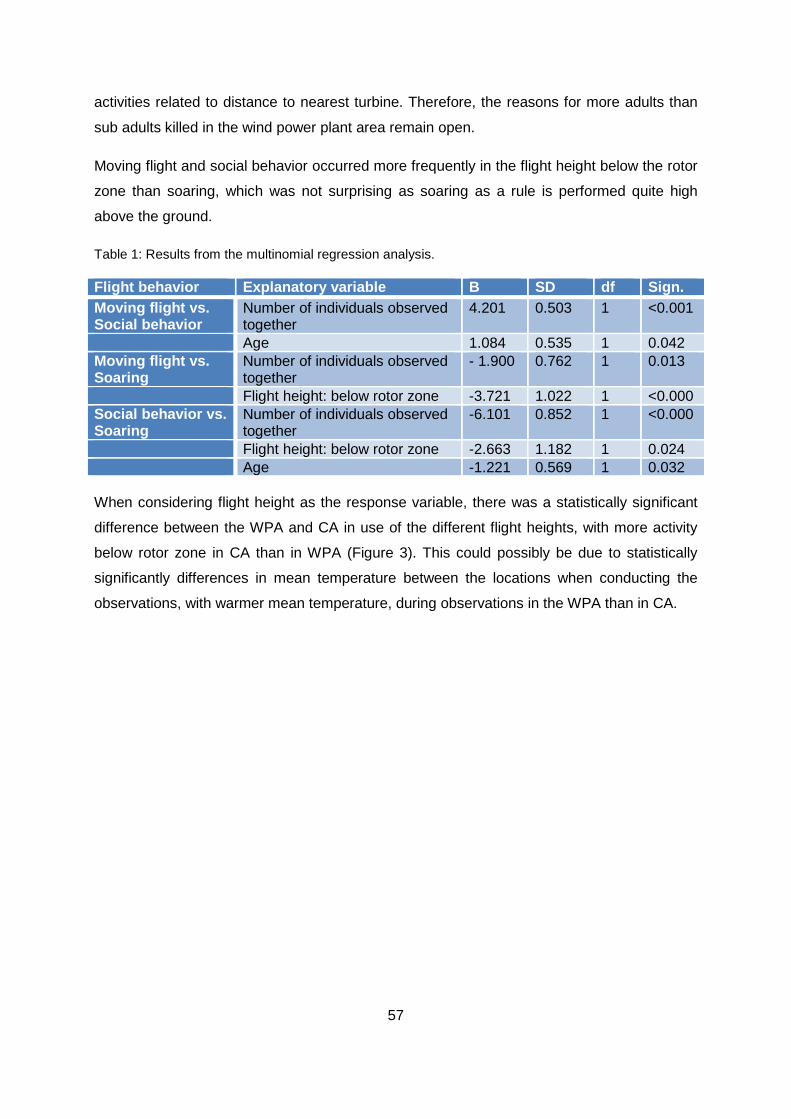
57
activities related to distance to nearest turbine. Therefore, the reasons for more adults than
sub adults killed in the wind power plant area remain open.
Moving flight and social behavior occurred more frequently in the flight height below the rotor
zone than soaring, which was not surprising as soaring as a rule is performed quite high
above the ground.
Table 1: Results from the multinomial regression analysis.
Flight behavior Explanatory variable B SD df Sign. Moving flight vs. Social behavior
Number of individuals observed together
4.201 0.503 1 <0.001
Age 1.084 0.535 1 0.042 Moving flight vs. Soaring
Number of individuals observed together
- 1.900 0.762 1 0.013
Flight height: below rotor zone -3.721 1.022 1 <0.000 Social behavior vs. Soaring
Number of individuals observed together
-6.101 0.852 1 <0.000
Flight height: below rotor zone -2.663 1.182 1 0.024 Age -1.221 0.569 1 0.032 When considering flight height as the response variable, there was a statistically significant
difference between the WPA and CA in use of the different flight heights, with more activity
below rotor zone in CA than in WPA (Figure 3). This could possibly be due to statistically
significantly differences in mean temperature between the locations when conducting the
observations, with warmer mean temperature, during observations in the WPA than in CA.
58
Fig. 3: The distribution (%) of the different flight activities of WTSE in the different flight height
categories.
Table 2 show which variables that had significant effect on the differences between the flight
heights. There was a statistically significant difference between the flight height in the rotor
zone and above the rotor zone related to number of individuals observed together, with more
individuals observed together above the rotor zone than in the rotor zone. This is consistent
with the results from multinomial logistic regression with flight activities as response variable,
showing that there are more individuals involved in social activities than in the other
activities, and that social activities mostly occur above the rotor zone.
59
Table 2: Statistically significantly results from the multinomial regression analysis, with the flight height
categories as response variable.
Flight height Explanat ory variable B SD df Sign. Below rotor zone vs. in rotor zone
Temperature (ºC) 0.195 0.070 1 0.006
Between moving flight and the other activities
-3.300 1.030 1 0.001
Between social behavior and the other activities
-2.706 1.216 1 0.026
Below rotor zone vs. above rotor zone
Temperature (ºC) 0.218 0.068 1 0.001
Between moving flight and the other activities
-3.560 1.025 1 0.001
Between social behavior and the other activities
-2.672 1.182 1 0.024
In rotor zone vs. above rotor zone
Number of individuals observed together
0.605 0.320 1 0.059
Precipitation 0.912 0.478 1 0.056 Discussion
These results indicate that the White-tailed Sea Eagles on Smøla do not have any behavioral
responses to the wind power plant construction, as none of the response variables differed
significantly within the wind power plant area versus the control areas. It may, however,
contribute to explain why the WTSE is vulnerable to collisions with the turbines and the high
number of killed individuals recorded within the power plant area. The WTSE has a peak
activity during the breeding period, which can be fatal to both adult individuals and thus also
the nestlings. This should be carefully considered when looking at the possible long-term
effects of the wind power plant on the White-Tailed Sea Eagle population on Smøla, and for
further developments of wind power plants along the Norwegian coast. When considering
mitigation measures and management actions it should be noted that the activity also
changes with weather conditions, and that the collision risk probably will increase during
periods with high temperatures and low wind speed– especially combined with increased
activity during the breeding season.
Acknowledgements
This study was part of a research project performed by Norwegian Institute for Nature
Research (NINA) in Trondheim, Norway, and my Master thesis work. Kjetil Bevanger (NINA)
was the project leader and supervisor. Bård Gunnar Stokke and Eivin Røskaft were my
supervisors at NTNU, and Hans Christian Pedersen co-supervisor at NINA. Espen Lie Dahl
60
assisted during field-work. Funds were provided by NINA, Statkraft and the Norwegian
Research Council.
Reference
BEVANGER, K., S. CLAUSEN, et al. (2008). “Pre- and post-construction studies of conflicts between birds
and wind turbines in coastal Norway” Progress Report 2008. Trondheim, NINA. Report 409.
Summary of the discussion after all talks of the Wh ite-tailed Sea Eagle project on Smøla D. SKAMBRACKS asks why the breeding success of White-tailed Sea Eagles originally had
been higher within wind farm than in the surroundings?
Answer: Probably the lower human settlement density had been the cause for high breeding
success in this area.
Some additional remarks by the authors: Wind turbines had no signal lights. One turbine was
monitored with the help of infra-red camera. In comparison to humans dogs appeared to be
very effective in search for collision victims.
It is asked what the consequences of the results were for other wind farms in Norway.
Answer: The realisation of new wind farm projects is stopped until the final results of the
studies at Smøla are available.
The opportunities to avoid collisions were discussed. The question was raised whether radar
and cameras could be used to stop the rotor when a bird approaches.
B. DE WOLF states, that although wind turbines can be stopped within a short time, this would
not be quick enough to react to a flying bird. Stopping time is also dependent on current wind
velocity. In general, the turbines could be temporarily cut off at special conditions (migration
weather).
61
Studies on threatened species of birds of prey and wind farms in eastern North America
Charles Maisonneuve1, Tricia Miller2, Michael Lanzone2, Todd Katzner3 1Ministère des Ressources naturelles et de la Faune du Québec, Direction de l'expertise Faune-Forêts-Territoire du Bas-Saint-Laurent, 92, 2e Rue Ouest, bureau 207, Rimouski (Québec) G5L 8B3, Canada, 2Carnegie Museum of Natural History, 3National Aviary
Introduction
With the world wide development of the wind industry, there are a growing number of wind
facilities that have been built in sensitive areas where birds of prey may collide with wind
turbines, increasing mortality rates in populations of species that are often at risk. Wind
energy is rapidly growing in North America. In Canada, the total production has grown from
only 137 MW in 2000 to 1876 MW in 2008 (Canadian Wind Energy Association 2008). This
rapid wind energy development is occurring in almost all Canadian provinces. In the province
of Quebec, where there are presently 450 turbines in operation, there are plans to attain a
total of about 1900 turbines by the year 2015 (Ministère des Ressources naturelles et de la
Faune 2008). Two-thirds of these are planned in the Gaspe Peninsula, in the eastern part of
the province. There are three species of raptors designated as vulnerable in the province, the
Golden Eagle (Aquila chrysaetos), the Bald Eagle (Haliaeetus leucocephalus) and a
subspecies of the Peregrine Falcon (Falco peregrinus anatum). All three of these species
breed on the Gaspe Peninsula. A research project has been initiated in Quebec in order to
reduce collision risk during the breeding season for these species.
Many raptor species nesting in eastern Canada also migrate through the Appalachians in
their movements to and from their wintering grounds in the eastern United States where they
are also facing wind energy development. A collaborative work has been initiated to track
Golden Eagles during these migratory movements. This paper has thus two sections, each
presenting the studies carried out on the breeding grounds and during migration, in a
coordinated effort to protect raptors during their whole life cycle.
Breeding grounds in Quebec, Canada
Nests of the three vulnerable raptor species located within 20 km of planned wind facilities
are targeted for the capture of birds that are equipped with Argos/GPS satellite transmitters.
The objective is to delineate the home ranges of these birds and to determine if there will be
62
an overlap with the projected limits of the wind facility. In 2007-2008, 17 birds have been
marked: 5 adult and 2 juvenile Golden Eagles, 6 adult and 2 juvenile Bald Eagles, and 2
adult Peregrine Falcons.
The general idea is to provide protection within the home range of the birds, the dimensions
and configuration of which may vary considerably from site to site according to habitat
availability and other environmental conditions, instead of having a fixed buffer area around
the nest which may not provide adequate protection. Should overlap occur between the
home range of one of the marked birds and the wind facility, detailed data obtained from the
transmitters (altitude, seasonal use, etc) will help determine collision risk and identify
possible mitigation measures to reduce this.
For Bald Eagles, preliminary results indicate relatively small home ranges (30-50 km2).
Moreover, Bald Eagles usually nest alongside big lakes where they mostly hunt and eat fish
during the breeding season. Thus, their home ranges are mostly concentrated along the
shores of these lakes. There are cases where Bald Eagle home ranges are split in more than
one core activity area. But altitudinal data clearly indicate that the birds fly considerably
higher than turbine height during their movements between these areas. And finally, in many
areas, planned buffers already exist around large lakes for landscape protection. Because of
all these factors, wind facilities may not represent a major threat for Bald Eagles.
Golden Eagle home ranges are not concentrated around lakes and cover areas (580-750
km2) that are more than ten times that of Bald Eagle home ranges. With such large home
ranges, there is a much greater probability of overlap with future wind facilities. The Golden
Eagle nest that was the closest to a planned wind facility was not occupied in 2008, so the
birds could not be captured and equipped with a transmitter. Construction of this wind facility
is planned for 2009, so it will not be possible to delineate pre-construction home ranges.
Efforts will be made in early spring of 2009 to mark one of the adults. Tracking the
movements of this bird will help compare the behavior before and after construction and, if
the bird does use the wind facility area, possibly lead to mitigation measures to reduce
collision risk.
Preliminary results also indicate relatively large home ranges (245 km2) for Peregrine
Falcons. For one of the two marked falcons, we have obtained the first case of confirmed
overlap between the home range and a projected wind facility. Since this overlap covers
most of the wind facility, considerable discussions are expected during the next few months
to identify possible mitigation measures.
63
In the near future, research effort will target the cases of overlap between home ranges of
vulnerable species and future wind facilities. Mitigation measures adapted to each case may
be identified from the data obtained. The altitude of flight of birds within overlap zones will be
examined to determine collision risk. There will be fewer concerns in situations where data
indicate that birds fly over turbine height. But adaptive approaches will have to be developed
when flight altitude will be mostly within turbine height. In these cases, data will also be
examined to determine if part or the whole of the overlap zone may be used only seasonally,
indicating that the birds may be attracted to these areas by food sources that become
available at particular times of the year. In such situations, partial shut down of wind turbines
within the overlap zone could be proposed during the period of collision risk. Ultimately, if
there is absolutely no way of identifying adequate mitigation measures, the process could
lead to the complete exclusion of wind turbines within the overlap zone.
Habitat modeling to predict home range limits
Since it would be presumptuous and costly to continue marking all individual birds whose
nests will be located close to wind facilities in the future, there is another objective to our
project. GIS habitat analyses will be carried out within the home ranges of the birds that will
be tracked, in order to develop habitat models (MCGRADY et al. 2002, MCLEOD et al. 2002) for
each of the three vulnerable species that we monitor. Based on habitats available around the
nests of birds that will be located near future wind farms, these habitat models will be used to
determine the potential home range limits of these birds. The same approach of
determination of overlap zone and subsequent development of mitigation measures could
then be adopted.
Migration of Golden Eagles in the eastern United St ates
In addition to delineating home ranges in the Gaspe Peninsula, we are also focusing on
identifying potential conflicts that may arise during Golden Eagle migration. Here we explore
indicators that may be used to identify and quantify potential conflicts and the effects of those
potential conflicts at a population level.
Raptors use two strategies in order to minimize energetic costs of migration. They often use
thermal lift which is generated when the sun warms the ground and the ground warms the
air. This warm air rises and creates lift which birds utilize to gain altitude. Often times,
especially during the warmer months, birds circle, rise and then glide off to catch another
thermal.
However, thermal activity decreases during the colder months of the year and birds migrating
through Pennsylvania at that time, including Golden Eagles, rely much more on topographic
64
lift or updrafts. Updrafts are created when wind blows and hits a ridge or other high relief
topographic feature. These updrafts are very important for birds utilizing the Appalachians.
And this is where the potential for conflict occurs, because birds and wind facilities both
utilize the same resource.
During fall migration, Golden Eagles are spatially and temporally segregated by age class.
Adults are more abundant along the western ridges of the mid-Appalachian region, juveniles
along eastern ridges. Spring migration is less segregated; Golden Eagles concentrate along
the central and western ridges. Because these ridges are also being targeted for wind power
facilities, there is a potential for negative wind-wildlife interactions. Among the raptor species
migrating along these ridges, eagles may be the most at risk. FARMER (2006) conducted a
pilot study at Hawk Mountain, located in the ridge area, and found that 88% of eagles, both
Bald and Golden Eagles, passed within the strike zone altitude of turbine blades.
Sinuosity index
To determine if there is a difference in migratory behavior among age classes, we calculated
a sinuosity index of full length migratory tracks. The sinuosity index is a measure of how
directly birds travel from wintering grounds to breeding grounds. The higher the sinuosity
index, the less direct the flight path and greater the distance a bird is actually flying to get
from point A to point B. Not unexpectedly, we found that young birds have a significantly
higher sinuosity index than adults, indicating that their potential for negative interactions with
turbines may be greater. Eventually, this index will be one of the many variables incorporated
into a population level model of the potential impacts of wind power.
Roost site habitability model
Negative effects of wind power development in the mid-Appalachians include not only
collision, but also indirect effects such as habitat loss. To examine the potential loss of
migratory stopover habitat, we generated a roost site habitat suitability model, following
HIRZEL et al. 2002, and compared turbine sites with optimal, suitable, marginal and
unsuitable roost habitat. Thus, a map was created indicating turbine sites more and less
likely to impact roosting habitat, based on the habitat predicted by the model.
We then compared 36 turbine sites within the study area to predicted habitat within 100 m
and 500 m. Eighty-six percent of proposed or existing turbine facilities are within 100 m of
suitable habitat and 59% are within 100 m of optimal roosting habitat.
Direct habitat loss was measured within these same two buffers. Within a 500 m buffer of a
turbine facility, the mean area of suitable habitat is 254 ± 55 ha. The mean area of suitable
65
habitat within 100 m of a turbine facility is 22.9 ± 5.4 ha. These results suggest that most
wind power facilities have the potential to negatively impact migratory roost sites. With a
limited number of wind power facilities, this may not be an issue, but cumulative effects of a
large number of wind facilities in a concentrated migratory corridor could have a significant
impact on the population and this must be considered and investigated further.
Temporal migratory patterns of Golden Eagles in eastern North America
Most wind facility projects in North America require some kind of environmental assessment
prior to construction and some require post-construction monitoring. In order for pre- and
post-construction monitoring to be useful, knowledge of temporal migratory patterns is
imperative. Although rare, site environmental assessments need to be adjusted accordingly
to incorporate these patterns. Furthermore, many turbine facilities already exist or are
currently under construction. If, through post-construction monitoring, a facility is deemed to
be a hazard to migratory birds, then knowledge of daily and seasonal movements can be
used for mitigation by guiding daily and seasonal shutdown.
Using GPS satellite telemetry, we determined the timing of daily and seasonal migratory
movements. Birds depart wintering grounds on March 15 ± 18 days and arrive at breeding
grounds on April 9 ± 23 days. Fall departure and arrivals are more tightly concentrated, with
birds departing breeding grounds October 21 ± 15 days and arriving at wintering grounds on
November 22 ±12 days. Peak daily migratory activity occurs between 9:00 am and 3:00 pm.
Conclusions
A few cases of overlap have been obtained in Quebec between home ranges of threatened
species of birds of prey and wind facilities planned in the vicinity of their nests. In the near
future, data from these overlap zones will be examined closely to help identify mitigation
measures. Eventually, a habitat model will be developed as a mechanism to predict home
range limits around nests where birds cannot be tracked with telemetry units.
We need to learn more about the habits and habitats used by Golden Eagles in Eastern
North America to improve and quantify our understanding of their behavior throughout the
annual cycle. Preliminary results suggest that, in the East, remote forest is an important
component of Golden Eagle habitat. And forested habitat in certain portions of the eastern
range is being developed for wind power. This could have a negative impact on the
population, but the potential impacts need to be quantified.
Our first steps at quantifying habitat loss indicate that nearly all proposed or existing wind
facilities in Pennsylvania may impact potential migratory roost habitat of Golden Eagles.
66
However, the current model needs to be improved. BRANDES & OMBALSKI (2004) identified
coarse-scale migratory routes through Pennsylvania by tracking Southeast winds through the
south-central part of the state. Using this theoretical model to further refine the study area
may improve prediction of roost sites.
We can use daily and seasonal peak movement timing data, for example, to guide sampling
design for pre- and post-construction surveys. Furthermore, these data can be used to guide
seasonal/daily shutdown of hazardous facilities.
One of the most important efforts necessary to assessing, minimizing and mitigating risk
during migration, is to relate flight characteristics to topography and weather. Migration
routes through Pennsylvania are relatively direct and seem to bottleneck on in the
southwestern part of the state. However, it is not enough just to map one state; we have to
look at migration routes through other states in the eastern United States and Canada.
Satellite data are useful for modeling habitat and home ranges, and coarse migratory
corridors, but are too coarse for our scale of interest, i.e., 30 m resolution. Those data
cannot, at a fine scale, show how weather and topography effect fine scale flight altitude and
position relative to topographic features where wind turbines are being constructed. We
intend to work with high frequency data to show more precisely where problems might exist,
and also help us understand behavior in relation to weather and topography, e.g., ridge life,
thermaling, and how birds respond to existing wind turbines. Our eventual goal is to create a
3-D model to identify strike probability and push industry to respond with micro-siting
changes.
Further research will also focus on conflicts on the winter grounds, where arguably some of
the greatest conflict may occur. Thus, combining telemetry studies initiated on both sides of
the Canada-US border provides an ideal coordinated effort to protect raptors during their
whole life cycle.
References
BRANDES, D. & OMBALSKI, D. W. (2004): Modeling Raptor Migration Pathways Using A Fluid-Flow
Analogy. Raptor Res. 38(3):195–207.
Canadian Wind Energy Association. (2008): Canadian wind farms.
http://canwea.ca/farms/index_e.php
FARMER, C. (2006): Counts and flight altitudes of migratory raptors at Hawk Mountain Sanctuary,
Pennsylvania. Wildlife & Wind Energy Conference. Kutztown, PA.
67
HIRZEL, A. H., J. HAUSSER, D. CHESSEL, & N. PERRIN (2002): Ecological-niche factor analysis: How to
compute habitat-suitability maps without absence data? Ecology 83:2027-2036.
MCGRADY, M.J., J.R. GRANT, I.P. BAINBRIDGE & D.R.A. MCLEOD (2002): A model of Golden Eagle
(Aquila chrysaetos) ranging behavior. J. Raptor Res. 36 (1 Supplement): 62-69.
MCLEOD, D.R.A., D.P. WHITFIELD, A.H. FIELDING, P.F. HAWORTH & M.J. MCGRADY (2002): Predicting
home range use by Golden Eagles Aquila chrysaetos in western Scotland. Avian Science 2:183-
198.
Ministère des Ressources naturelles et de la Faune (2008): Projets éoliens au Québec.
http://www.mrnf.gouv.qc.ca/energie/eolien/eolien-potentiel-projets.jsp.
Summary of the discussion after the talk
C. MAISONNEUVE replies to a remark concerning buffer circles that are kept free of wind
turbines around nest sites. No circular buffer zones around the nest location have been used
in the study presented in the talk. Instead a habitat model was developed based on the home
ranges of the individuals studied. Buffer zones resulted out of this model.
68
Mitigation in U.S. wind farms
K. Shawn Smallwood
3108 Finch Street, Davis, CA 95616, USA
Introduction
Wind power generation has been proliferating across the U.S.A., so there has been
considerable discussion about mitigation of wind turbine impacts on birds and bats. This
discussion has been complex and contentious for a number of reasons. First, the need for
mitigation has been effectively challenged by the wind industry since the National Wind
Coordinating Committee’s (NWCC) report claimed that buildings, autos, house cats and
other anthropogenic factors cause more bird fatalities than wind turbines (ERICKSON et al.
2001). Second, wind power development outpaced the implementation of scientifically
sound fatality monitoring, so scientists have lacked defensible impact estimates or
predictions. Third, needed investments are expensive and have yet to be implemented
sufficiently, such as pre-construction surveys for estimating both background mortality and
utilization of project sites. Conclusions based on speculation and anecdotes preceded those
based on scientific evidence, and mitigation plans for wind power projects too often give
more weight to the unsubstantiated conclusions.
No mitigation measures were provided with the earliest wind turbine installations in the U.S.
because nobody knew the nature of the impending impacts. Only after the first installations
did somebody notice dead birds under wind turbines, and only afterwards did discussion of
mitigation measures begin. Adverse impacts now known to be caused by wind turbines
include direct, indirect, and cumulative impacts. Direct impacts include fatalities caused by
collisions of volant animals with wind turbines, guy wires, anemometer towers, electric
distribution lines, and transmission lines, as well as electrocutions on electric distribution
poles and entrapment within wind turbine motors. Other direct impacts include habitat loss
due to grading for tower pads and access roads. Indirect impacts include displacement of
certain species that cannot tolerate the presence of wind turbines, or alterations of migratory
flight paths and foraging patterns. Both direct and indirect impacts combine with other
anthropogenic impacts, such as those described by ERICKSON et al.’s (2001) report, to qualify
as cumulative impacts. Whereas all of these impacts I just listed are known to occur,
69
quantitative impact estimates remain relatively rare and associated with large error terms,
and their rarity and associated uncertainty have been effectively used by wind project
advocates to minimize mitigation requirements.
Contributing to scientific uncertainty around impact estimates, too many people in the U.S.
have mistakenly regarded fatality monitoring performed by wind company consultants as
scientific monitoring. In fact, the majority of monitoring reports at U.S. wind farms have not
involved scientific hypothesis testing, and most did not lead to publications in peer-reviewed
scientific journals. Survey methodology at U.S. wind farms has varied greatly, including field
techniques, monitoring duration, and estimators of fatality rates and utilization rates that have
yet to be generally accepted by the scientific community. As a result, many impact estimates
are not comparable, though they are often compared anyway. Also, predictions of impacts
have been consistently lower than realized impacts, sometimes astonishingly lower.
However, most wind power projects went forward without impact predictions, and most of the
predictions that were made have yet to be compared to post-construction estimates of
impacts. In short, the wind industry’s consultant reports have not been subjected to
anywhere near the same level of scientific scrutiny that publicly funded research reports have
been subjected, yet these reports have often been attributed equal weight.
Publicly funded research of wind farm impacts has been directed toward accurately
quantifying impacts and understanding collision mechanisms, and much of this work was
done in the Altamont Pass Wind Resource Area (APWRA) dating from 1989 to 2007. This is
one reason why the APWRA is the logical first place to look for reviewing mitigation efforts in
U.S. wind farms. Another reason is the notoriety the APWRA has earned as a source of high
raptor mortality, and another is the APWRA’s composition of old-generation wind turbines
which ought to be considered easier to move or manipulate to test the effectiveness of
mitigation measures.
Types of Mitigation
The California Environmental Quality Act Guidelines § 15370 categorized mitigation
measures as generally discussed across the U.S.:
1. Avoid the impact altogether by not taking a certain action;
2. Minimize impacts by limiting the degree or magnitude of the action;
3. Rectify the impact by repairing, rehabilitating or restoring the impacted environment;
70
4. Reduce or eliminate the impact over time by preservation and maintenance
operations during the life of the project; and,
5. Compensate for the impact by replacing or providing substitute resources or
environments.
Wind farm impacts could be avoided by not building the wind farm, not building it where
impacts to particular species are of concern, or using alternative designs that do not kill birds
or bats. I am not aware of any wind power mitigation in the U.S. that involved avoidance.
To minimize impacts, potential wind farm and wind turbine sites could be screened for
environmental impacts, and the least harmful sites selected (SMALLWOOD et al. in press).
Wind turbines could be placed where birds or bats fly less often or where they are least
vulnerable to collision (SMALLWOOD & NEHER in press). The blades could be placed at
heights above ground where species of concern fly less often. Turbine operations could be
scheduled to avoid seasons, weather events or times of day more hazardous to birds or bats,
especially when power generation would be low anyway. Perhaps turbines could be
designed to lock blades in place while not operating, or during peak bird or bat activity. Wind
turbine operations could be synchronized throughout the row to prevent birds from
attempting crossing of the row during operations. Turbines could be concentrated as much
as possible, leaving open areas for traveling and foraging flights. Almost all of these
measures would require extensive pre-construction utilization and behavior surveys, and
most would need to be implemented before the wind turbines are operational.
The only wind turbine impacts that could be rectified would be the extremely rare case of
injured birds being found, rehabilitated, and successfully returned to the wild. In my
experience, almost all injured birds taken to rehabilitation centers are euthanized and a few
are donated to zoos or public outreach programs.
After the wind farm is developed, there are few options for effectively reducing the impacts,
even though these types of mitigation measures have been debated a great deal for two
decades in the APWRA. Highly dangerous wind turbines can be identified through fatality
monitoring and relocated or shut down during time periods recognized to be most dangerous
(Alameda County SRC 2008). Other recommended measures in the APWRA were to install
flight diverters or hazing devices, remove broken and non-operating wind turbines, remove
derelict towers, and paint blades using the HODOS (2003) scheme, effectively achieving one
blade black and two white. All of these measures were recommended by the Alameda
County Scientific Review Committee (SRC), of which I am a member. However, the
71
effectiveness of none of them was tested over the last three years of Alameda County’s
Avian Protection Program because none were implemented adequately. Fatality rates in the
APWRA did not change from earlier rates (Alameda County Avian Monitoring Team 2008,
SMALLWOOD 2008a).
One APWRA company painted one blade black on 42 wind turbines, but measuring
effectiveness was impossible because the company refused to cooperate with the SRC in
implementing an experimental design. The treatment was applied to all the turbines in the
lower of two closely aligned rows of turbines which differed in tower height, referred to as
wind walls, so it was impossible to determine whether bird carcasses were deposited by
treated or untreated turbines. I am also dubious that the HODOS painting scheme would be
effective on large, modern wind turbines, because a bird close enough to the rotor plane for
the hazard to be critical would also be unable to see enough of the rotor plane within its field
of view for the HODOS scheme to have any effect on the bird.
Most of the APWRA companies agreed to shut down their wind turbines over the winter
months, but not in the manner recommended by the SRC. The shutdowns were too brief
relative to the fatality search interval, and without synchronization of fatality searches and
turbine shutdown and reactivation dates. Also, the first two years involved a crossover design
that the SRC felt might have killed more of the birds that were prone to habituation of non-
operating turbines, so when the shut-down turbines were reactivated during the peak of the
winter-time raptor congregation in the APWRA, many more birds were killed.
Reduction measures were also tried in the APWRA before the SRC was established. For
example, the blade tips of some turbines were painted green or red, and some blades were
striped with black. These treatments did not affect fatality rates (SMALLWOOD & THELANDER
2004, 2005). Also, the companies funded a rodent eradication program between 1997 and
2002, and they recruited land owners to cooperate with the program. The objective was to
eliminate the main raptor prey species from the APWRA so that raptors would no longer visit.
However, I discovered the program in 2002, learned where the poison had been broadcast,
and tested whether the treatments affected raptor utilization and fatality rates. In most cases,
I found no effects, and in some I found higher fatality rates where rodents had been
poisoned. The program was halted by state and federal regulatory agencies after they
learned about it, because it jeopardized the continued existence of burrowing owls and
multiple threatened and endangered species that occur in the APWRA.
Outside the APWRA, the turbines in one wind farm were experimentally treated with a UV
reflective paint, but no effect was found (YOUNG et al. 2003). Rodent control was promised as
72
a mitigation measure for the High Winds Power Project in Solano County, California (ESA
2002), again based on the unproven notion that elimination of prey base will keep raptors
from visiting the areas around wind turbines.
Compensating for impacts has been the most popular mitigation measure implemented
among US wind farms. The ideal compensation for impacts achieves no net loss or a net
gain of the resource that was adversely affected by the project. However, compensation
ratios have been arbitrary and their effectiveness unknown because no nexus has been
established between wind power project impacts and mitigation benefits.
Compensation ratios offered by wind farm developers have included a 1:1 habitat area for
rotor swept area among the wind turbines (Ecology and Environment, Inc. 2005, 2006),
$500-$1000 for each MW of rated capacity for use in conserving property bearing raptor
habitat (ERICKSON et al. 2003), and $55 / acre for twice the acreage permanently disturbed
by wind turbines (LAMPHIER-GREGORY et al. 2005). Also, The Cape Wind DEIS promised
$780,000 toward Roseate Tern habitat restoration on the 1.5-acre Bird Island (Minerals
Management Service 2008).
Trends in Mitigation Planning Among U.S. Wind Farms
Environmental planning documents for U.S. wind farms usually portray the following wind
turbine design elements as mitigation measures: Tubular versus lattice towers, slower
moving blades, wider turbine spacing, and aircraft hazard lighting reduced to minimum FAA
standards. However, none of these design elements were included specifically to minimize
bird and bat impacts, and none have been demonstrated to do so. Research evidence in the
APWRA indicates birds do not perch on lattice towers while the turbines are operating, and
fatality rates were the same between turbines with lattice versus tubular towers. As for slower
moving blades, the truth is that the tip speed is essentially equal across turbine sizes,
whereas it is the RPM that lessens with increasing turbine size. The evidence from the
APWRA was that birds were more likely to fly through the rotor zones of turbines with lower
RPM, so it remains unclear whether modern turbines with lower RPM are actually safer.
Likewise, birds in the APWRA were more likely to fly through rotor zones of turbines at the
edges of gaps, so wider turbine spacing might not reduce fatality rates. Finally, the presence
of FAA hazard lighting has repeatedly been found to not affect fatality rates of birds or bats
(ERICKSON et al. 2004, KERNS & KERLINGER 2004, JAIN et al. 2007). These often seen design
elements are misleading and serve to perpetuate myths about the mechanisms affecting bird
and bat collisions.
73
Another approach to mitigation in U.S. wind farms has been to postpone formulation of
specific measures by promising the appointment of a Technical Advisory Committee (TAC),
which will later implement adaptive management. For example, in three sentences the Cape
Wind DEIS promised to minimize impacts by claiming that post-construction monitoring data
will be collected and applied to adaptive management by a TAC. The DEIS did not explain
how post-construction data would be collected at sea, or how the TAC would identify
mitigation measures that have not been identified anywhere else. No candidate measures
were listed, nor did the DEIS explain what was meant by adaptive management or whether it
had any resemblance to the approach as conceived by HOLLING (1978) and WALTERS (1986).
Similarly, Audubon Society agreed with Alameda County and the APWRA wind companies
that adaptive management developed by the SRC would be used to reduce avian fatality
rates in the APWRA beginning in 2009. However, adaptive management cannot work in the
absence of candidate impact reduction measures, which are very few in wind farms and so
far non-existent due to the unwillingness of wind companies to implement effective reduction
measures.
Mitigation plans also promise substantial measures that are contingent on population-level
impacts. For example, the Hatchet Ridge Wind Project Environmental Impact Report (Jones
& Stokes Associates 2007) promised that wind turbines would be subject to permanent
shutdown, relocation, or time-of-day or seasonal restrictions on operations, but only if fatality
rates exceed population-level effects. However, no population-level monitoring will be
performed, so no data will be available to determine whether such as impact will be realized.
Furthermore, the consultants who prepared the EIR were probably aware of the debate that
has raged amongst wind companies and biologists over what qualifies as biologically
significant impacts, so even if data were available to support a conclusion of population-level
effects, the wind companies would likely successfully argue over the standard of biological
significance and the uncertainties surrounding the significance finding. I predict the reduction
measures listed in the EIR will never be implemented. No other measures were proposed for
avoiding, minimizing, rectifying, reducing, or compensating the impacts of this wind farm.
Conclusions
Mitigation measures would be more effective if based on scientifically founded conclusions of
factors affecting bird and bat collisions with wind turbines. It is essential to perform
scientifically rigorous pre- and post-construction monitoring of bird and bat fatalities and flight
behaviors in wind farms, as well as ecological investigations. These types of investigations
have not been performed at most wind farms in the U.S., so the scientific basis for mitigation
measures remains weak.
74
Following wind turbine installations little has been done to reduce impacts to birds and bats,
and little can be done. Avoidance and minimization measures will be the most effective
mitigation at wind farms, but these have yet to be implemented at U.S. wind farms. Adaptive
management is often promised in environmental review documents, but largely unviable in
wind farms. Offsite compensation may be the only substantial means of mitigating impacts
following wind farm development. A scientifically defensible nexus between project impacts
and mitigation benefits still needs to be established for compensation ratios directed toward
wind farms.
The shortfalls in mitigating avian and bat impacts caused by U.S. wind turbines indicate the
need for clearly written mitigation measures along with thresholds of success, the
establishment of a soundly structured TAC, a substantial performance bond, and permitting
by an agency that has no vested interest in the project. There is also the need for a
mitigation monitoring fund and a dedicated monitor. Finally, and most importantly, the
enforcement of laws and permits is essential because the APWRA companies have amply
demonstrated an unwillingness to comply with their operating permits (SMALLWOOD 2008b).
References
Alameda County Avian Monitoring Team (Jones & Stokes, Inc., BioResource Consultants, Inc.,
University of Santa Cruz Predatory Bird Research Group) (2008): Bird fatality study at Altamont Pass
Wind Resource Area: October 2005 to September 2007. Alameda County Scientific Review
Committee Document M21, Alameda County Community Development Agency Planning Department,
Hayward, California. http://www.altamontsrc.org/alt_-doc/m21_2008_altamont_bird_fatality_report.pdf
Alameda County SRC (SMALLWOOD, K. S., S. ORLOFF, J. ESTEP, J. BURGER, & J. YEE) (2008):
Guidelines for siting wind turbines recommended for relocation to minimize potential collision-related
mortality of four focal raptor species in the Altamont Pass Wind Resource Area. Alameda County
SRC document P-70. P70 SRC Hazardous Turbine Relocation Guidelines
Ecology and Environment, Inc. (2005): Draft Environmental Impact Report, Shiloh I Wind Plant
Project. Solano County Department of Resource Management, Fairfield, California.
Ecology and Environment, Inc. (2006): Draft Environmental Impact Report, Shiloh II wind Plant
Project. Solano County Department of Resource Management, Fairfield, California.
ESA (Environmental Science Associates) (2002): Solano County High Winds Power Project. Draft
EIR. Prepared for Solano County Department of Environmental Management. Appendices C and D.
Fairfield, California.
75
ERICKSON, W. P., G. D. JOHNSON, M. D. STRICKLAND, D. P. YOUNG, JR., K. J. SERNKA, & R. E. GOOD
(2001): Avian collisions with wind turbines: A summary of existing studies and comparisons to other
sources of avian collision mortality in the United States. National Wind Coordinating Committee, c/o
RESOLVE, Washington, D.C. 62 pp.
ERICKSON, W. P., K. KRONNER, & B. GRITSKI (2003): Nine Canyon Wind Power Project avian and bat
monitoring report. Unpubl. report to Nine Canyon Technical Advisory Committee, Energy Northwest,
Unreported location. 32 pp.
ERICKSON, W. P., J. JEFFREY, K. KRONNER, & K. BAY (2004): Stateline wind project wildlife monitoring
final report, July 2001–December 2003. Technical Report submitted to FPL Energy, the Oregon
Energy Facility Siting Council and the Stateline Technical Advisory Committee. 98 pp.
HODOS, W. (2003): Minimization of motion smear: Reducing avian collisions with wind turbines.
Period of Performance July 12, 1999 – August 31, 2002. NREL/SR-500-33249, National Renewable
Energy Laboratory, Golden, CO. 43 pp.
HOLLING, C.S. (ed.) (1978): Adaptive environmental assessment and management. John Wiley &
Sons, New York.
JAIN, A., P. KERLINGER, R. CURRY, & L. SLOBODNIK (2007): Annual report for the Maple Ridge Wind
Power Project postconstruction bird and bat fatality study – 2006. Prepared for PPM Energy and
Horizon Energy.
Jones & Stokes Associates (2007): Draft Environmental Impact Report for the Hatchet Ridge Wind
Project. Shasta County Department of Resource Management. Redding, California.
KERNS, J. & P. KERLINGER (2004): A study of bird and bat collision fatalities at the Mountaineer Wind
Energy Center, Tucker County, West Virginia: Annual Report for 2003. Prepared for FPL Energy and
Mountaineer Wind Energy Center Technical Review Committee.
Lamphier-Gregory, West Inc., Shawn Smallwood, Jones & Stokes Associates, Illingworth & Rodkin
Inc. and Environmental Vision (2005): Environmental Impact Report for the Buena Vista Wind Energy
Project, LP# 022005. County of Contra Costa Community Development Department, Martinez,
California.
Minerals Management Service (2008): Cape Wind Energy Project Draft Environmental Impact Study.
Minerals Management Service, U.S. Department of the Interior. OCS Publication No. 2007-024,
Herndon, Virginia.
SMALLWOOD, K. S. (2008a): Comparison of mortality estimates in the Altamont Pass Wind Resource
Area. Alameda County SRC document P-76. http://www.altamontsrc.org/alt_-
doc/p76_mortality_estimates_apwra_2005_07.pdf
76
SMALLWOOD, K. S. (2008b): Wind power company compliance with mitigation plans in the Altamont
Pass Wind Resource Area. Environmental & Energy Law Policy Journal 2(2):229-285.
SMALLWOOD, K. S., & L. NEHER. In press. Map-Based Repowering of the Altamont Pass Wind
Resource Area Based on Burrowing Owl Burrows, Raptor Flights, and Collisions with Wind Turbines.
Final Report to the California Energy Commission, Public Interest Energy Research – Environmental
Area, Contract No. Pending. Sacramento, California.
SMALLWOOD, K. S. & C. THELANDER (2005): Bird mortality in the Altamont Pass Wind Resource Area,
March 1998 – September 2001 Final Report. National Renewable Energy Laboratory, NREL/SR-500-
36973. Golden, Colorado. 410 pp.
SMALLWOOD, K. S. & C. THELANDER (2004): Developing methods to reduce bird mortality in the
Altamont Pass Wind Resource Area. Final Report to the California Energy Commission, Public
Interest Energy Research – Environmental Area, Contract No. 500-01-019. Sacramento, California.
531 pp.
SMALLWOOD, K. S., K. HUNTING, L. NEHER, L. SPIEGEL & M. YEE. In press. Indicating Threats to Birds
Posed by New Wind Power Projects in California. Final Report to the California Energy Commission,
Public Interest Energy Research – Environmental Area, Contract No. Pending. Sacramento,
California.
WALTERS, C.J. (1986): Adaptive management of renewable resources. McGraw-Hill, New York.
YOUNG, D. P., JR., W. P. ERICKSON, M. D. STRICKLAND, R. E. GOOD, & K. J. SERNKA (2003): Comparison
of avian responses to UV-light-reflective paint on wind turbines. Subcontract report July 1999 –
December 2000. NREL/SR-500-32840, National Renewable Energy Laboratory, Golden, CO. 67 pp.
Summary of the discussion after the talk
G. NEHLS asks whether there are any effects of wind parks on population dynamics of
raptors?
S. SMALLWOOD answers that at present, no significant effects are detectable.

77
Summary of the general discussion on Wednesday, 22nd October
R. LANGSTON stated that the selection of appropriate sites is the most important way to
resolve conflicts between birds and wind energy. As the distribution and density of bird
species is well known, these data should be used to select the appropriate areas for wind
energy.
H. HÖTKER replied that this may be the case for Great Britain, where comprehensive datasets
for birds are available, but not for Germany.
It was asked whether there is proof that painting one of the rotor blades black helps to
reduce the number of bird collisions.
S. SMALLWOOD answered that such tests were only performed in the laboratory, and no field
experiments have taken place so far. He himself is pessimistic about the effectiveness of
such a measure.
A suggestion for compensation measures was made. Improved management for protecting
raptors away from wind farms could compensate for bird losses at wind farms, with the result
that negative effects of wind farms have a smaller net effect on the population as a whole.
Financial support for monitoring at wind farms was considered to be important, as data about
the exact mortality rates are required.
A follow up project to provide a list of management measures for the reduction of wind farm
impacts on birds of prey was proposed.